User login
Fragmentation of Care
There is a potential for discontinuity of care in the management of inpatients by hospitalists since many patients are cared for by more than one physician during their hospitalization. Previous studies have explored the impact of this type of discontinuity of care in residency programs. With the restrictions put in place by the Accreditation Council on Graduate Medical Education (ACGME) in 2003, there has been an increase in the fragmentation of care (FOC) that patients receive in the hospital. Studies have explored the impact of these changes on length of stay (LOS) and quality of care. The results have been mixed, with some studies showing that the increased FOC was associated with prolonged LOS,1, 2 as well as having a negative influence on quality.2, 3 Other studies have shown no change or a reduction in LOS,4 and an improvement in quality measures.46
There have been no prior studies on the impact of hospitalist care as the source of FOC on LOS. We therefore undertook a study to explore the impact of fragmented hospitalist care on LOS. Additionally, there has been some discussion on the impact of admission day of week on both FOC and LOS. Prior studies have mainly looked at day of the week in intensive care unit patients. One study found a modest increase in ICU LOS in patients admitted during the weekend.7 We therefore also looked at the impact of day of the week of admission on FOC in order to determine if fragmentation was just a proxy for admission day as the true indicator for increased LOS.
Methods
Design Overview
Data for this study consisted of clinical and billing information from IPC.
Setting and Participants
Data on LOS and FOC were drawn from the clinical and billing database of IPC The Hospitalist Company, which is a national group practice of hospitalists that at the time of the study had practices in over 230 acute health care facilities in 24 healthcare markets across the United States. Physicians enter clinical and billing data into IPC‐Link, a proprietary web based program.
Patients included in this study were discharged between December 1, 2006 and November 30, 2007 with a diagnosis‐related group (DRG) of 89 Pneumonia with complications or comorbidities (PNA) or a DRG of 127 Heart failure and shock (HF). A total of 10,977 patients with DRG 89 (n = 1951) or DRG 127 (n = 9026) were identified. These patients were admitted to 223 hospitals in 16 states.
Outcome
The outcome measure of interest was LOS.
FOC Measure
The independent variable of interest was the measure of fragmentation of physician care during the hospital stay. The intuitive meaning of fragmentation in physician hospital services is the delivery of care by multiple hospitalist physicians within a single stay. We converted the idea of fragmentation into a quantitative measure, an FOC Index, by calculating the percentage of hospitalist care delivered by physicians other than the primary hospitalist. The primary hospitalist was defined as the physician responsible for the largest number of visits during the hospital stay. Fragmentation was calculated by summing the number of daily billable encounters by IPC hospitalists other than the primary hospitalist and dividing by the total number of billable encounters by all IPC hospitalists. Thus, if three days out of a five‐day stay, the patient was seen by one hospitalist, then 60% of the care would be by the primary hospitalist. The patient was seen by other physicians than the primary hospitalist 2 out of the 5 days, for a FOC Index of 40%. IPC billing data was used to identify each hospitalist visit during the hospital stay by physician, date, and type of visit.
Covariates
The clinical database contained potential covariates: age, gender, day of admission, the number of ICD‐9 diagnosis codes on the discharge summary, and severity of illness (SOI) and risk of mortality (ROM) measures. The 3M DRG Grouper (St. Paul, Minnesota), using clinical data from the IPC‐Link discharge summary, assigned each patient an SOI score, and an ROM score based on age, primary diagnosis, and non‐operating room procedures.8 Both SOI and ROM are scored from 1 to 4, ranging from 1 for minor to 4 for extreme. We created dummy variables for the SOI and ROM categories, that is, variables for each score with a value of 1 if the SOI or ROM is that score and 0, otherwise. In each case, a score of 1 was the referent category. Dummy variables were created for each admission day of the week with Monday as the referent. Demographic variables and variables related to the patient condition were included to reduce any potential confounding arising from differences in patient populations across hospitals and hospitalist practice patterns. Admission day of the week has been shown to influence LOS and may influence FOC due to weekend scheduling within hospitalist practices.
Statistical Analysis
All analyses were performed using SAS (version 9.1). To reduce the influence of outliers on the model, observations with extreme values for LOS (defined as greater than 3 standard deviation [STD] from the mean) were truncated to 30 days. For pneumonia, the mean LOS was 7.85 days (STD 7.44) and all patients with LOS greater than 30 days were truncated to 30 days. For heart failure, the mean LOS was 5.88 days (STD 9.77) and all patients with LOS greater than 35 days were truncated to 35 days. Multivariable regression was performed using the negative binomial distribution. Negative binomial regression used as LOS is not normally distributed, but instead has a positive skew. Forward stepwise selection was performed separately for patients with each DRG using variables from the clinical database described in the Methods section. Categorical dummy variables were entered as a group. The final model contained all variables that were significant (P < 0.05).
Results
Table 1 reviews the demographics of patients with DRG 89 (PNA) and DRG 127 (HF). A large proportion of patients with both DRGs experienced no fragmentation in their physician care during hospitalization; 4152 patients with HF (46.3%) and 685 patients with PNA (35.8%) had visits from only 1 hospitalist throughout their hospital stay, for a FOC Index of 0%. The mean fragmentation level was 21.9% for pneumonia patients, with the mean number of hospitalists seen during the stay at 2.05. For heart failure patients, the mean fragmentation level was 18.3 % and a mean of 1.78 hospitalists seen (Table 1).
| DRG 89 (n = 1950), Mean (STD) | DRG 127 (n = 9026), Mean (STD) | |
|---|---|---|
| ||
| Age, years | 65.8 (18.6) | 71.4 (15.2)* |
| % Female | 49.7 | 51.7 |
| Number of secondary diagnoses | 5.6 (2.5) | 5.0 (2.3)* |
| Severity of Illness | 2.80 (0.57) | 1.943 (0.72)* |
| Risk of Mortality | 2.49 (0.84) | 1.81 (0.75)* |
| Fragmentation: percent of care by non‐primary hospitalist(s) | 21.9% (20.3) | 18.3% (19.9)* |
| Number of physicians seen during hospital stay | 2.05 (1.12) | 1.78 (0.94)* |
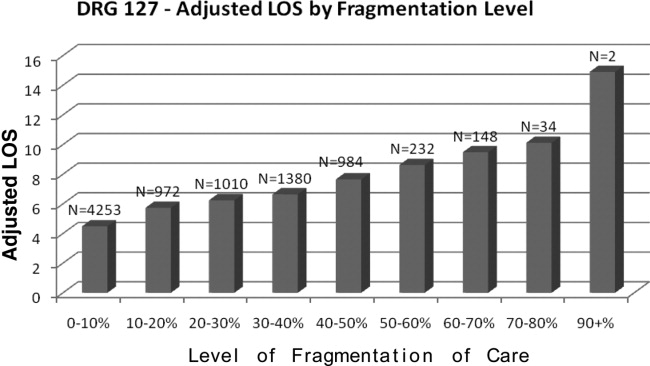
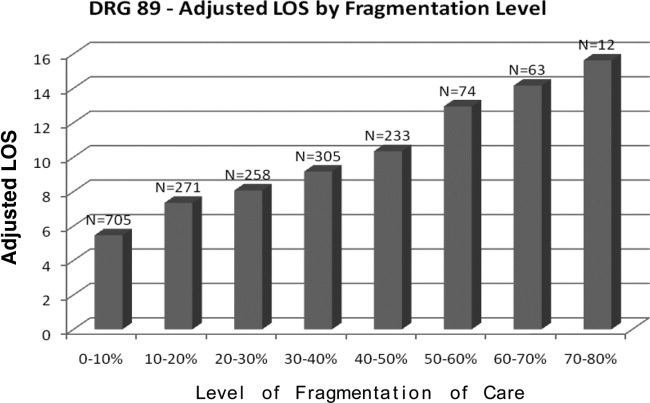
Table 2 presents the results of the regression analysis on LOS. The association between fragmentation and LOS, adjusted for demographics, case mix and day of admission, was similar for PNA and HF patients. We found an increase in LOS of 0.39 days for each 10% increase in fragmentation level for pneumonia. Other variables that significantly increased LOS for PNA were larger ROM score, Sunday admission and more discharge diagnoses. Similarly, for heart failure patients, there was an increase in LOS of 0.30 days for each 10% increase in fragmentation level. Other variables associated with a significantly increase in LOS for PNA were larger ROM score, larger SOI category, more discharge diagnoses, and age. Figures 1 and 2 demonstrate the results graphically for LOS in each condition. They show the mean adjusted LOS by fragmentation level. Adjusted LOS was calculated for each patient based on the final model. For example, the average adjusted LOS for PNA patients with a fragmentation level of 20% to 30% is 8.06 days and 9.16 days for patients with a fragmentation level of 30% to 40%.
| Pneumonia (DRG = 89), n = 1950 | Heart Failure (DRG = 127), n = 9026 | |
|---|---|---|
| ||
| Fragmentation | Additional 0.39 day for each 10% increase in fragmentation | Additional 0.30 day for each 10% increase in fragmentation |
| Adjustment variables in the model | Age, number of secondary diagnoses, severity of illness variables, risk of mortality variables | Age, gender, number of secondary diagnoses. severity of illness variables, risk of mortality variables |

Discussion
This study demonstrated that there was a statistically significant association between FOC by hospitalist physicians and LOS for patients with DRG 89 (PNA) and DRG 127 (HF). As the percentage of fragmentation increased, the LOS increased significantly.
There are many ways in which to define FOC in the context of hospitalist care of inpatients. We chose to use an index similar to the Usual Provider of Care Index (UPC) which is a standard way to measure continuity of care in the primary care setting.9 The UPC measures the proportion of time spent with the primary provider. In the inpatient setting, we defined continuity of care as the proportion of visits by the primary hospitalist (the physician assuming the greatest number of days of the patient's care). The FOC Index is simply 1 minus the continuity of care. There are other potential measures of FOC, such as the number of handoffs or the number of physicians. We selected our measure based on its following strengths: (1) it does not have the simultaneity problem of measures such as the number of doctors or the number of handoffs that leads to endogeneitya correlation between the error term and the independent variable that biases the coefficient. Endogeneity can occur when the outcome variable and the independent variable are jointly determined, in this case, that an additional day in the hospital increases the likelihood of having an additional handoff as well as an additional handoff increasing the likelihood of an additional day; (2) fragmentation patterns that lead to handoffs on the weekend that then return to the primary hospitalist may be very different from fragmentation patterns that lead to new physicians at each transfer; (3) It provides a good comparison to other models of care where community physicians provide care to their own patients and have an effective FOC index of 0. Further research should be performed looking at different measures that may capture other aspects of care fragmentation.
This is one of the first studies to directly explore the relationship between FOC and LOS. Previous studies in the hospitalist literature have explored the impact of variables on LOS in which FOC may have been an indirect influence. For example, one study found a 13% shorter LOS among academic hospitalists at a teaching hospital who worked on a block rotation compared to a group of community hospitalists with a schedule involving more patient handoffs.10 Although there is little literature on FOC among hospitalists, the literature on medical residency programs is informative. The amount of discontinuity and the number of housestaff‐to‐housestaff transfers of responsibility has increased dramatically since the institution of more stringent work‐hour restrictions by the Accreditation Council for Graduate Medical Education (ACGME) in 2003.11 Horwitz et al.12 found that after the institution of work‐hour regulations, there was an 11% increase in number of transfers of care for a hypothetical patient admitted from Monday until Friday. They noted that programs with a night‐float system had a statistically significant increase in transitions of care compared to residencies without night float. Studies on the impact of the ACGME regulations on LOS have been mixed. One study found that LOS was reduced, and that there was improved adherence to quality indicators.4 A recent study found that there was a 44% increase in the median LOS when Short Call admitting teams were involved.2
There are several limitations to the findings of this study. The largest potential limitation is interpreting the direction of causality between FOC and LOS. This was a concurrent control study. Because the study was not randomized, there is a risk of confounding variables. Admission day of the week was 1 variable of concern for confounding due to the existence of a significant relationship between admission day LOS and between admission day and FOC. We included admission day in our modeling process. The coefficient estimates on FOC were stable, changing less than 1% when day of admission was added to the model. The risk of temporal trends was minimized by studying 1‐year's worth of data. Although we looked at variables that were potentially relevant in all hospitalized patients, every hospital and hospitalist practice has its own unique features that may impact both LOS and FOC. For example, for some hospitals, bed capacity may impact these measures. In many hospitals, hospitalist work force shortages may impact these measures by affecting the extent to which patients are cared for by full‐time hospitalists vs. locums tenens physicians. The large number of facilities in the study mitigates the influence of any individual hospital's LOS and FOC tendencies.
If increased FOC does result in prolonged LOS, the question arises as to how this fragmentation can be decreased. Although no physician can guarantee presence continually throughout a patient's inpatient stay, there are scheduling methods that reduce fragmentation and maximize the odds of a patient being followed by a single clinician. For example, the longer the block of days that a hospitalist is scheduled, the fewer hospitalists will need to care for a patient. Many of the top DRGs for patients cared for by hospitalists have lengths of stay between 4 and 5 days.13 Therefore, any schedule that has a hospitalist on for at least four days at a time will increase the likelihood that the same hospitalist will care for many of the patients throughout their stay. In making schedules, the goals of clinical efficiency and physician satisfaction must be weighed against the potential risks to the quality of patient care. For instance, the use of one hospitalist as the admitting physician for all patients may increase efficiency, but will also increase fragmentation.
A factor that may influence the impact of FOC on LOS is the quality of patient handoffs. The Joint Commission instituted this as a national patient safety goal in 2006.14 This goal was based on a Joint Commission analysis that 70% of sentinel events were caused by communication breakdowns, half of these occurring during handoffs.15
In conclusion, this study explored the relationship between FOC in patients cared for by hospitalists and LOS, using an FOC index. For every 10% increase in fragmentation, the LOS went up by 0.39 days for pneumonia and 0.30 days for heart failure. By adjusting for many variables that may impact LOS due to higher severity or complexity of illness, there is an increased likelihood that the FOC may have a causative relationship with the prolonged LOS.
There is a potential for discontinuity of care in the management of inpatients by hospitalists since many patients are cared for by more than one physician during their hospitalization. Previous studies have explored the impact of this type of discontinuity of care in residency programs. With the restrictions put in place by the Accreditation Council on Graduate Medical Education (ACGME) in 2003, there has been an increase in the fragmentation of care (FOC) that patients receive in the hospital. Studies have explored the impact of these changes on length of stay (LOS) and quality of care. The results have been mixed, with some studies showing that the increased FOC was associated with prolonged LOS,1, 2 as well as having a negative influence on quality.2, 3 Other studies have shown no change or a reduction in LOS,4 and an improvement in quality measures.46
There have been no prior studies on the impact of hospitalist care as the source of FOC on LOS. We therefore undertook a study to explore the impact of fragmented hospitalist care on LOS. Additionally, there has been some discussion on the impact of admission day of week on both FOC and LOS. Prior studies have mainly looked at day of the week in intensive care unit patients. One study found a modest increase in ICU LOS in patients admitted during the weekend.7 We therefore also looked at the impact of day of the week of admission on FOC in order to determine if fragmentation was just a proxy for admission day as the true indicator for increased LOS.
Methods
Design Overview
Data for this study consisted of clinical and billing information from IPC.
Setting and Participants
Data on LOS and FOC were drawn from the clinical and billing database of IPC The Hospitalist Company, which is a national group practice of hospitalists that at the time of the study had practices in over 230 acute health care facilities in 24 healthcare markets across the United States. Physicians enter clinical and billing data into IPC‐Link, a proprietary web based program.
Patients included in this study were discharged between December 1, 2006 and November 30, 2007 with a diagnosis‐related group (DRG) of 89 Pneumonia with complications or comorbidities (PNA) or a DRG of 127 Heart failure and shock (HF). A total of 10,977 patients with DRG 89 (n = 1951) or DRG 127 (n = 9026) were identified. These patients were admitted to 223 hospitals in 16 states.
Outcome
The outcome measure of interest was LOS.
FOC Measure
The independent variable of interest was the measure of fragmentation of physician care during the hospital stay. The intuitive meaning of fragmentation in physician hospital services is the delivery of care by multiple hospitalist physicians within a single stay. We converted the idea of fragmentation into a quantitative measure, an FOC Index, by calculating the percentage of hospitalist care delivered by physicians other than the primary hospitalist. The primary hospitalist was defined as the physician responsible for the largest number of visits during the hospital stay. Fragmentation was calculated by summing the number of daily billable encounters by IPC hospitalists other than the primary hospitalist and dividing by the total number of billable encounters by all IPC hospitalists. Thus, if three days out of a five‐day stay, the patient was seen by one hospitalist, then 60% of the care would be by the primary hospitalist. The patient was seen by other physicians than the primary hospitalist 2 out of the 5 days, for a FOC Index of 40%. IPC billing data was used to identify each hospitalist visit during the hospital stay by physician, date, and type of visit.
Covariates
The clinical database contained potential covariates: age, gender, day of admission, the number of ICD‐9 diagnosis codes on the discharge summary, and severity of illness (SOI) and risk of mortality (ROM) measures. The 3M DRG Grouper (St. Paul, Minnesota), using clinical data from the IPC‐Link discharge summary, assigned each patient an SOI score, and an ROM score based on age, primary diagnosis, and non‐operating room procedures.8 Both SOI and ROM are scored from 1 to 4, ranging from 1 for minor to 4 for extreme. We created dummy variables for the SOI and ROM categories, that is, variables for each score with a value of 1 if the SOI or ROM is that score and 0, otherwise. In each case, a score of 1 was the referent category. Dummy variables were created for each admission day of the week with Monday as the referent. Demographic variables and variables related to the patient condition were included to reduce any potential confounding arising from differences in patient populations across hospitals and hospitalist practice patterns. Admission day of the week has been shown to influence LOS and may influence FOC due to weekend scheduling within hospitalist practices.
Statistical Analysis
All analyses were performed using SAS (version 9.1). To reduce the influence of outliers on the model, observations with extreme values for LOS (defined as greater than 3 standard deviation [STD] from the mean) were truncated to 30 days. For pneumonia, the mean LOS was 7.85 days (STD 7.44) and all patients with LOS greater than 30 days were truncated to 30 days. For heart failure, the mean LOS was 5.88 days (STD 9.77) and all patients with LOS greater than 35 days were truncated to 35 days. Multivariable regression was performed using the negative binomial distribution. Negative binomial regression used as LOS is not normally distributed, but instead has a positive skew. Forward stepwise selection was performed separately for patients with each DRG using variables from the clinical database described in the Methods section. Categorical dummy variables were entered as a group. The final model contained all variables that were significant (P < 0.05).
Results
Table 1 reviews the demographics of patients with DRG 89 (PNA) and DRG 127 (HF). A large proportion of patients with both DRGs experienced no fragmentation in their physician care during hospitalization; 4152 patients with HF (46.3%) and 685 patients with PNA (35.8%) had visits from only 1 hospitalist throughout their hospital stay, for a FOC Index of 0%. The mean fragmentation level was 21.9% for pneumonia patients, with the mean number of hospitalists seen during the stay at 2.05. For heart failure patients, the mean fragmentation level was 18.3 % and a mean of 1.78 hospitalists seen (Table 1).
| DRG 89 (n = 1950), Mean (STD) | DRG 127 (n = 9026), Mean (STD) | |
|---|---|---|
| ||
| Age, years | 65.8 (18.6) | 71.4 (15.2)* |
| % Female | 49.7 | 51.7 |
| Number of secondary diagnoses | 5.6 (2.5) | 5.0 (2.3)* |
| Severity of Illness | 2.80 (0.57) | 1.943 (0.72)* |
| Risk of Mortality | 2.49 (0.84) | 1.81 (0.75)* |
| Fragmentation: percent of care by non‐primary hospitalist(s) | 21.9% (20.3) | 18.3% (19.9)* |
| Number of physicians seen during hospital stay | 2.05 (1.12) | 1.78 (0.94)* |
Table 2 presents the results of the regression analysis on LOS. The association between fragmentation and LOS, adjusted for demographics, case mix and day of admission, was similar for PNA and HF patients. We found an increase in LOS of 0.39 days for each 10% increase in fragmentation level for pneumonia. Other variables that significantly increased LOS for PNA were larger ROM score, Sunday admission and more discharge diagnoses. Similarly, for heart failure patients, there was an increase in LOS of 0.30 days for each 10% increase in fragmentation level. Other variables associated with a significantly increase in LOS for PNA were larger ROM score, larger SOI category, more discharge diagnoses, and age. Figures 1 and 2 demonstrate the results graphically for LOS in each condition. They show the mean adjusted LOS by fragmentation level. Adjusted LOS was calculated for each patient based on the final model. For example, the average adjusted LOS for PNA patients with a fragmentation level of 20% to 30% is 8.06 days and 9.16 days for patients with a fragmentation level of 30% to 40%.
| Pneumonia (DRG = 89), n = 1950 | Heart Failure (DRG = 127), n = 9026 | |
|---|---|---|
| ||
| Fragmentation | Additional 0.39 day for each 10% increase in fragmentation | Additional 0.30 day for each 10% increase in fragmentation |
| Adjustment variables in the model | Age, number of secondary diagnoses, severity of illness variables, risk of mortality variables | Age, gender, number of secondary diagnoses. severity of illness variables, risk of mortality variables |
Discussion
This study demonstrated that there was a statistically significant association between FOC by hospitalist physicians and LOS for patients with DRG 89 (PNA) and DRG 127 (HF). As the percentage of fragmentation increased, the LOS increased significantly.
There are many ways in which to define FOC in the context of hospitalist care of inpatients. We chose to use an index similar to the Usual Provider of Care Index (UPC) which is a standard way to measure continuity of care in the primary care setting.9 The UPC measures the proportion of time spent with the primary provider. In the inpatient setting, we defined continuity of care as the proportion of visits by the primary hospitalist (the physician assuming the greatest number of days of the patient's care). The FOC Index is simply 1 minus the continuity of care. There are other potential measures of FOC, such as the number of handoffs or the number of physicians. We selected our measure based on its following strengths: (1) it does not have the simultaneity problem of measures such as the number of doctors or the number of handoffs that leads to endogeneitya correlation between the error term and the independent variable that biases the coefficient. Endogeneity can occur when the outcome variable and the independent variable are jointly determined, in this case, that an additional day in the hospital increases the likelihood of having an additional handoff as well as an additional handoff increasing the likelihood of an additional day; (2) fragmentation patterns that lead to handoffs on the weekend that then return to the primary hospitalist may be very different from fragmentation patterns that lead to new physicians at each transfer; (3) It provides a good comparison to other models of care where community physicians provide care to their own patients and have an effective FOC index of 0. Further research should be performed looking at different measures that may capture other aspects of care fragmentation.
This is one of the first studies to directly explore the relationship between FOC and LOS. Previous studies in the hospitalist literature have explored the impact of variables on LOS in which FOC may have been an indirect influence. For example, one study found a 13% shorter LOS among academic hospitalists at a teaching hospital who worked on a block rotation compared to a group of community hospitalists with a schedule involving more patient handoffs.10 Although there is little literature on FOC among hospitalists, the literature on medical residency programs is informative. The amount of discontinuity and the number of housestaff‐to‐housestaff transfers of responsibility has increased dramatically since the institution of more stringent work‐hour restrictions by the Accreditation Council for Graduate Medical Education (ACGME) in 2003.11 Horwitz et al.12 found that after the institution of work‐hour regulations, there was an 11% increase in number of transfers of care for a hypothetical patient admitted from Monday until Friday. They noted that programs with a night‐float system had a statistically significant increase in transitions of care compared to residencies without night float. Studies on the impact of the ACGME regulations on LOS have been mixed. One study found that LOS was reduced, and that there was improved adherence to quality indicators.4 A recent study found that there was a 44% increase in the median LOS when Short Call admitting teams were involved.2
There are several limitations to the findings of this study. The largest potential limitation is interpreting the direction of causality between FOC and LOS. This was a concurrent control study. Because the study was not randomized, there is a risk of confounding variables. Admission day of the week was 1 variable of concern for confounding due to the existence of a significant relationship between admission day LOS and between admission day and FOC. We included admission day in our modeling process. The coefficient estimates on FOC were stable, changing less than 1% when day of admission was added to the model. The risk of temporal trends was minimized by studying 1‐year's worth of data. Although we looked at variables that were potentially relevant in all hospitalized patients, every hospital and hospitalist practice has its own unique features that may impact both LOS and FOC. For example, for some hospitals, bed capacity may impact these measures. In many hospitals, hospitalist work force shortages may impact these measures by affecting the extent to which patients are cared for by full‐time hospitalists vs. locums tenens physicians. The large number of facilities in the study mitigates the influence of any individual hospital's LOS and FOC tendencies.
If increased FOC does result in prolonged LOS, the question arises as to how this fragmentation can be decreased. Although no physician can guarantee presence continually throughout a patient's inpatient stay, there are scheduling methods that reduce fragmentation and maximize the odds of a patient being followed by a single clinician. For example, the longer the block of days that a hospitalist is scheduled, the fewer hospitalists will need to care for a patient. Many of the top DRGs for patients cared for by hospitalists have lengths of stay between 4 and 5 days.13 Therefore, any schedule that has a hospitalist on for at least four days at a time will increase the likelihood that the same hospitalist will care for many of the patients throughout their stay. In making schedules, the goals of clinical efficiency and physician satisfaction must be weighed against the potential risks to the quality of patient care. For instance, the use of one hospitalist as the admitting physician for all patients may increase efficiency, but will also increase fragmentation.
A factor that may influence the impact of FOC on LOS is the quality of patient handoffs. The Joint Commission instituted this as a national patient safety goal in 2006.14 This goal was based on a Joint Commission analysis that 70% of sentinel events were caused by communication breakdowns, half of these occurring during handoffs.15
In conclusion, this study explored the relationship between FOC in patients cared for by hospitalists and LOS, using an FOC index. For every 10% increase in fragmentation, the LOS went up by 0.39 days for pneumonia and 0.30 days for heart failure. By adjusting for many variables that may impact LOS due to higher severity or complexity of illness, there is an increased likelihood that the FOC may have a causative relationship with the prolonged LOS.
Copyright © 2010 Society of Hospital Medicine
Symptoms Postdischarge
The Institute of Medicine reports To Err is Human and Crossing the Quality Chasm have drawn great attention to quality improvement and patient safety in the hospital setting.13 With the growth of the hospitalist field over the past several years,4 there has been increasing discussion about the importance of assuring quality of care, and some have argued that improving health care quality and reducing avoidable errors may be among the hospitalist's most important functions.5 Most discussions about the quality of hospital care have concerned the inpatient stay itself. However, the growth of hospital medicine, with its inherent discontinuity between inpatient and outpatient physicians, has intensified interest in the transition period from hospital discharge until first outpatient appointment.
At discharge, physicians may prescribe medications, order home health services, and arrange follow‐up appointments. It is often assumed a patient will remain stable after discharge and will follow up at the outpatient physician's office. Previous research has shown there may be problems with these assumptions. A patient may not understand the postdischarge treatment plan as well as the physician thinks.6 A recent study found that adverse events after discharge were common and often preventable.7 A follow‐up study confirmed that approximately 25% of patients had an adverse event after hospital discharge and that most adverse events caused symptoms but did not result in an emergency department visit, hospitalization, or death.8 Another study also found the prevalence of medical errors following hospitalization was high because of the discontinuity of care from the inpatient to the outpatient setting.9 These errors resulted in an increased rate of rehospitalization.
Telephone follow‐up may be a useful method of bridging the gap in care between discharge and the first outpatient appointment.10, 11 In most previous studies it was 2 or 3 weeks after discharge before patients were contacted or their records studied. By this point, patients who had done poorly may already have been readmitted or sought care at alternative locations. In one small study, pharmacists found that 12 of 79 patients (15%) contacted by telephone within 2 days of discharge12 had symptoms there were new or had worsened since discharge. The purpose of the present investigation was to extend these previous findings through a large multicenter study of how frequently patients had new or worsened symptoms within several days of discharge.
METHODS
Settings and Participants
IPCThe Hospitalist Company has hospitalist practices at more than 150 health care facilities in 10 health care markets. At the time of the study, IPC employed more than 300 internal medicine and family practice physicians and discharged approximately 11,000 adult patients per month. The study is a retrospective analysis of data collected from May 1, 2003, to October 31, 2003.
Data Acquisition
Physicians entered clinical and financial information on all hospitalized patients into a handheld personal digital assistant (PDA) utilizing functions of IPC‐LINK software. At the time of discharge, a physician completed a discharge summary on the PDA that was transmitted electronically to a centralized data center. Copies of the discharge summary were also faxed to the outpatient physician's office. Patients were first interviewed by call‐center patient representatives, unlicensed staff with medical backgrounds. Call‐center representatives made several attempts by telephone to reach all patients discharged home within several days of discharge. Using a scripted survey instrument (Appendix A), they asked patients or family members a series of questions about clinical status, new or worsening symptoms, problems with medications or prescribed home health care services, follow‐up appointments with their outpatient physician, and satisfaction with the care received. Call‐center nurses, licensed personnel with extensive medical/surgical and case management experience, contacted patients whose answers to questions on the scripted survey instrument (see last section of Appendix A) indicated a high risk of postdischarge problems, intervening as necessary to resolve the health care issues.
Health status was self rated on a 5‐point Likert scale from excellent to poor in response to the health status question on the SF‐12.13, 14 Patient age was calculated using birth date and admit date from the IPC‐Link discharge summary. With clinical data from the IPC‐Link discharge summary, the 3M DRG Grouper was used to assign each patient a DRG and severity of illness (SOI) score.15 Reported symptoms were grouped in clinically meaningful categories by the lead author.
Statistical Analysis
Logistic regression analysis was performed to analyze the effects of sex, health insurance, inpatient severity of illness, and self‐reported health status on the proportion of patients with symptoms. Sex, health status, and severity of illness were treated as ordered variables. Because insurance type is a nominal variable, HMO was used as the reference category, and the other categories were converted to indicator variables. Pearson chi‐square testing was used for all other analyses. The large number of planned analyses necessitated adjustment of the P values computed for the tests to maintain the type I error rate at 0.05. Therefore, a step‐down Bonferroni procedure was used.16
Role of the Funding Source
Data collection, analysis, and interpretation were funded by IPC and performed by employees of IPC.
RESULTS
During the study period, 48,236 patients were discharged to their homes from an acute care hospital. The IPC call center successfully contacted 16,135 patients after discharge, of whom 368 patients (2.3%) were excluded because of incomplete answers, leaving 15,767 as the valid study population (effective response rate = 32.4%). Of these, 98.9% were contacted within the first 5 days. The primary reasons for nonresponse or noninclusion in the present analysis were no answer after 2 attempts (52%) and missing or incorrect phone numbers (16%). If there was an answering machine, a message was left for the patient to call back. Those who called back accounted for fewer than 1% of all the patients.
A comparison of participants versus nonparticipants is shown in Table 1. The mean age of surveyed patients was 60.1 years, and 57% were female. The most common categories of insurance coverage were Medicare and HMO. The inpatient severity of illness of most patients was minor to moderate. Self‐reported health status was normally distributed, with the greatest percentage of patients rating their health as fair or good. On average, nonparticipants were younger than participants, more likely to be male, had a different pattern of health insurance, and a slightly lower severity of illness. The top 10 DRGs were the same for the respondents and nonrespondents, and the order of these 10 diagnoses was very similar.
| Characteristic | Patients in Study | Patients Not in Study | P Value* | ||
|---|---|---|---|---|---|
| Number of Patients | Percentage of All Patients | Number of Patients | Percentage of All Patients | ||
| |||||
| All patients | 15,767 | 32,101 | |||
| Mean age (years) | 60.1 | 54.1 | <.0001 | ||
| Sex | |||||
| Female | 8985 | 57.0% | 17220 | 53.7% | <.0001 |
| Male | 6515 | 41.3% | 14337 | 44.7% | <.0001 |
| Unknown | 267 | 1.7% | 544 | 1.7% | .897 |
| Insurance type | |||||
| HMO | 6391 | 40.5% | 12540 | 39.1% | <.001 |
| Medicaid | 1066 | 6.8% | 2815 | 8.8% | <.0001 |
| Medicare | 6055 | 38.4% | 9777 | 30.4% | <.0001 |
| Commercial and other | 1370 | 8.7% | 3490 | 10.9% | <.0001 |
| Self‐pay | 885 | 5.6% | 3479 | 10.9% | <.0001 |
| Severity of illness | |||||
| Minor | 6740 | 42.7% | 14679 | 45.7% | <.0001 |
| Moderate | 6854 | 43.5% | 13197 | 41.1% | |
| Major | 1688 | 10.7% | 3091 | 9.6% | <.0001 |
| Extreme | 118 | 0.7% | 219 | 0.7% | .571 |
| Unknown | 367 | 2.3% | 915 | 2.9% | .001 |
| Health status | |||||
| Excellent | 343 | 2.2% | N/A | ||
| Very good | 1392 | 8.8% | N/A | ||
| Good | 5505 | 34.9% | N/A | ||
| Fair | 5901 | 37.4% | N/A | ||
| Poor | 1468 | 9.3% | N/A | ||
| Unknown | 1158 | 7.3% | N/A | ||
Of the 15,767 patients contacted, 11.9% (N = 1876) reported symptoms that were new or had worsened since leaving the hospital. Sixty‐four percent of these patients had new symptoms, and 36% had worsening symptoms. These two groups were combined for analysis in this study because for both groups, identification and action are important. Of the patients with new or worse symptoms, 37% required no assistance from the nurse because they had already notified a doctor and/or were doing something about it. The other 63% either had not notified their doctor or had concerns about their signs and symptoms. The most common action taken by the nurse was patient education regarding the symptoms. Of those requiring nurse intervention in addition to education, the most common intervention was to contact the patient's primary care provider or specialist about the patient's symptoms, followed by contacting the hospitalist. In 72% of nurse interventions, the patient's primary care physician or a specialist was contacted about the new or worsened symptoms. Other interventions included contacting the physician's office to obtain a prescription for a medication for the symptom, to get an appointment for the patient, or to reschedule an appointment to be earlier. A referral to an emergency room or urgent care center was given to 4% of patients.
Mean age of the patients with new or worsened symptoms was 60.5 years. The age distribution of symptomatic and asymptomatic patients was not significantly different, whether comparing by mean, median, or decades. Table 2 illustrates factors associated with the increased rate of new or worsened symptoms. Women were more likely than men to report symptoms (13.0% vs. 10.3%, P < .0001). As health status worsened, the percentage of patients with new or worsened symptoms increased (P < .0001), as it did with increased inpatient SOI (P < .0001). There was no correlation between self‐rated health status and SOI score based on DRG score, suggesting they measured different parameters. Table 3 lists the percentages of patients reporting new or worsened symptoms for the most common DRGs. The only significant distinction was that patients discharged with a DRG of chest pain were less likely to report symptoms than were all patients.
| Characteristic | Number of Patients with New or Worsening Symptoms | Percentage of All Patients with New or Worsening Symptoms | P Value for Difference or Trend* |
|---|---|---|---|
| |||
| All Patients | 1876 | 11.9% | |
| Sex | <.0001 | ||
| Female | 1170 | 13.0% | |
| Male | 672 | 10.3% | |
| Insurance Type | |||
| HMO | 722 | 11.3% | .89 |
| Medicare | 748 | 12.4% | .21 |
| Commercial and other | 165 | 12.0% | .53 |
| Medicaid | 128 | 12.0% | .27 |
| Self‐pay | 113 | 12.8% | |
| Severity of illness | .17 | ||
| Minor | 748 | 11.1% | |
| Moderate | 814 | 11.9% | |
| Major | 247 | 14.6% | |
| Extreme | 19 | 16.1% | |
| Health Status | <.0001 | ||
| Excellent | 22 | 6.4% | |
| Very good | 85 | 6.1% | |
| Good | 429 | 7.8% | |
| Fair | 725 | 12.3% | |
| Poor | 384 | 26.2% | |
| DRG | Description | Number of Patients | Percentage of Patients | Patients with New or Worsening Symptoms | Rate of New or Worsening Symptoms | P value |
|---|---|---|---|---|---|---|
| ||||||
| Total patients in Study | 15,767 | 1876 | 11.9% | |||
| 143 | Chest pain | 1306 | 8.3% | 128 | 9.8% | 0.027 |
| 182 | Digest disorders with complications | 801 | 5.1% | 92 | 11.5% | 0.767 |
| 183 | Digest disorders without complications | 632 | 4.0% | 78 | 12.3% | 0.783 |
| 127 | Heart failure and shock | 544 | 3.5% | 55 | 10.1% | 0.230 |
| 89 | Pneumonia with complications | 426 | 2.7% | 39 | 9.2% | 0.098 |
| 88 | COPD | 380 | 2.4% | 44 | 11.6% | 0.913 |
| 278 | Cellulitis | 323 | 2.0% | 32 | 9.9% | 0.313 |
| 174 | GI hemorrhage with complications | 320 | 2.0% | 40 | 12.5% | 0.809 |
| 15 | CVA | 302 | 1.9% | 25 | 8.3% | 0.066 |
| 175 | GI hemorrhage without complications | 287 | 1.8% | 34 | 11.8% | 0.948 |
The symptoms the patients reported are categorized in Table 4 without distinction as to whether they are primary or secondary. Gastrointestinal symptoms were the most common category of symptoms, followed by general symptoms, cardiovascular symptoms, and pain. The most common symptoms reported were fatigue/weakness, nausea/vomiting, and edema.
| Category | Specific Symptom | Number | % 0f Total |
|---|---|---|---|
| |||
| Gastrointestinal | 771 | 24.1% | |
| Nausea/vomiting | 245 | 7.7% | |
| Abdominal pain | 162 | 5.1% | |
| Diarrhea | 146 | 4.6% | |
| Eating problems | 107 | 3.3% | |
| Constipation | 71 | 2.2% | |
| General | 527 | 16.5% | |
| Fatigue or weakness | 360 | 11.3% | |
| Dizziness | 167 | 5.2% | |
| Cardiovascular | 388 | 12.1% | |
| Edema | 219 | 6.8% | |
| Chest pain | 101 | 3.2% | |
| Pain | 382 | 11.9% | |
| Back and neck | 118 | 3.7% | |
| Lower exttremity (including hip) | 115 | 3.6% | |
| Generalized | 76 | 2.4% | |
| Psychological | 209 | 6.5% | |
| Sleeping problems | 125 | 3.9% | |
| Change in mental status/psychiatric symptoms | 84 | 2.6% | |
| Pulmonary | 382 | 11.9% | |
| Dyspnea | 134 | 4.2% | |
| Neurological | 199 | 6.2% | |
| Headache | 118 | 3.7% | |
| Infectious | 192 | 6.0% | |
| Fever | 82 | 2.6% | |
| Dermatological | 65 | 2.0% | |
| Urological | 62 | 1.9% | |
| ENT | 50 | 1.6% | |
| Diabetic (problems with blood sugar) | 45 | 1.4% | |
| Postoperative wound problems | 39 | 1.2% | |
| Problems with intravenous sites | 17 | 0.5% | |
| Medication Reaction | 14 | 0.4% | |
| Bleeding (other than above locations) | 14 | 0.4% | |
| Gynecological | 9 | 0.3% | |
| Others | 89 | 2.8% | |
The call center assessed whether the patient had difficulty making a follow‐up appointment and whether an appointment was scheduled within 2 weeks of discharge. Patients with new or worsening symptoms were only minimally more likely to have scheduled follow‐up (61.0% vs. 58.4% for patients not reporting new or worsening symptoms, P < .05). Symptomatic patients had a higher prevalence of medication issues, defined as not picking up their prescriptions or not understanding how to take their medication (22.2% vs. 6.8% for asymptomatic patients; P < .0001). Likewise, the prevalence of symptomatic patients having problems receiving scheduled home health care services was 5.8%, compared with a prevalence of 3.6% for asymptomatic patients (P < .0001).
DISCUSSION
Enhancing the quality of care provided by hospitalists means not only improving care during hospitalization but also assuring patient stability between discharge and outpatient follow‐up. As part of efforts to improve transition management, the call center at IPC attempted to contact all patients discharged home within several days of discharge. Of 15,767 patients surveyed between May 1, 2003, and October 31, 2003, 11.9% (N = 1876) had new or worsening symptoms since leaving the hospital only 2 or 3 days earlier. We had hypothesized that older patients might be more symptomatic than younger ones, but found no difference in the prevalence of new or worsening symptoms based on age. Women were more likely to be symptomatic than men.
We defined appropriate postdischarge follow‐up as having an appointment with an outpatient physician within 2 weeks. A previous study of psychiatric patients documented that keeping a follow‐up appointment significantly reduces the risk of rehospitalization.17 Similar data do not exist for medical patients. Our data demonstrated that symptomatic patients were only minimally more likely to have made a follow‐up appointment with their outpatient physician within the first 2 weeks than were those patients who were not symptomatic. As part of patient education at discharge, clinicians routinely counsel patients to call their outpatient physician should they experience new or worsening symptoms once at home. Inpatient physicians may assume this recommendation provides a safety net for the patients should they develop problems after discharge. However, our finding that almost 40% of patients with new or worsening symptoms within 2‐3 days of discharge had not made a follow‐up appointment with their physician suggests many patients fall through this safety net. Although there was a slight statistically significant difference between the groups, this difference was not clinically significant. One potential limitation of our data is that we did not examine whether there was a correlation between the day of the week that a patient was discharged and inability to make a follow‐up appointment.
As part of the survey script (see Appendix), we inquired whether patients were able to pick up their prescriptions and whether they understood how to take their medication. A high percentage of patients in our study reported having one of these medication issues in the first several days following hospital discharge, providing an opportunity for early intervention and prevention of medical error. Forster and others have demonstrated that adverse events and medical errors are common in the postdischarge period, affecting 23%‐49% of patients.79 Errors in the transition from inpatient to outpatient care increased the 3‐month rate of rehospitalization.9 New or worsening symptoms represented the most common adverse event.8 Noting that many of these postdischarge complications could be preventable if detected early, Forster suggested system changes such as earlier follow‐up with the outpatient physician or a postdischarge telephone call to check on the patient's status.7, 18 Future studies are planned to further analyze our data on medication issues and to determine if these problems are more prevalent for certain medications or diagnoses.
Comprehensive discharge planning remains an essential step in the discharge process. This may involve prescribing medications, arranging home health care services, and arranging outpatient follow‐up. The traditional hospital discharge process does not adequately ensure that patients understand their discharge plan and are able to comply with it. Calkins et al. compared physicians' perceptions of patients' understanding of medication side effects and activity restrictions with patients' actual understanding.6 They found that, compared with what was reported by patients, physicians overestimated the time spent discussing discharge plans and how well patients understood medication side effects and activity restrictions.
An important method for reducing patient problems is to contact patients by telephone after discharge in order to identify any health care issues. Previous research has confirmed that follow‐up telephone calls improve health outcomes and decrease resource utilization of patients, mainly those discharged from the emergency department.10, 11, 1923 A study of telephone follow‐up after ambulatory care visits did not find significant benefits of this procedure.24 In one of the few studies of telephone calls after hospitalization, pharmacists contacted patients 2 days after discharge and were able to detect and resolve medication‐related problems in 19% of patients and learned of new or worsening symptoms in 15%. Patient satisfaction was improved, and the intervention resulted in a lower rate of repeat visits to the emergency room within 30 days of discharge.12 Another study of telephone follow‐up following hospital discharge compared proactively calling all patients with providing a phone number that patients can call if they have questions. The study demonstrated that very few patients called the number provided, but of those patients called by the nursing service, more than 90% had questions about self‐care and recovery.25 These findings demonstrate the value of proactively contacting patients in the first several days after discharge, when problems can be detected and interventions initiated earlier.
One potential concern with this study was the low response rate. This was a retrospective analysis of an existing discharge management call‐center system, not a prospective study. We were not able to reach 52% of the patients discharged after 2 attempts by telephone. To have our call center make additional attempts to reach each patient by telephone would require a significant increase in the size of the call center, because at the time of the study, the staff was handling more than 370 patients discharged home a day. The telephone number of 16% of patients was missing or incorrect. We have since developed internal quality improvement mechanisms to decrease this percentage. After subtracting the patients we were unable to reach and those whose phone number was missing or incorrect, we were able to contact 32.4% of all the patients discharged home.
Several reasons explain the response rate found by many prospective research studies. In most studies of telephone follow‐up, patients must be able to consent to participate in order to be considered eligible inclusion. This raises the response rate because patients who do not consent to participate, have language barriers, or have no telephone are excluded from the study. In our study none of these types of patients were excluded. There are 2 additional differences between our study and many published studies that involve telephone surveys. Ours was not a prospective research study, and we contacted many more patients than did other studies. For example, a study by Forster et al. involved only 581 patients, and the research staff was diligent in its efforts to reach the patients,7 making up to 20 attempts for each patient. They reported a response rate of 69%. If they had included patients who were non‐English speakers or had no phone in their study, the response rate would have been 59%. Shesser et al. were able to reach 144 of 297 patients in their study of emergency room follow‐up, for a 48.4% response rate.25 The response rate in a study of telephone consultation with asthma patients was quite similar to ours. They enrolled 932 eligible patients, of whom they were able to reach 278, for a response rate of 30%.
It is possible that the rate of symptoms and the other variables we measured relative to this would have been different if we had been able to reach 100% of patients. There were some demographic differences between the patients we were able to reach and those we were not (Table 1). The nonresponders were slightly younger and slightly more likely to be female. Nonresponders were more likely to have Medicaid or commercial insurance or be self‐pay and were less likely to have Medicare. In addition, nonresponders had less severe illness. Although this scenario is highly unlikely, if none of the nonresponders had new or worsening symptoms, the rate of symptoms would only have been 3.86%. Conversely, it is possible but also very unlikely that a greater percentage of the nonresponders had new or worsening symptoms. Given the demographics of our study participants, we would expect a potentially slightly lower rate of signs and symptoms.
The present study had several other limitations. First, all patients surveyed were cared for by IPC‐employed physicians. It is possible that reported rates of symptoms and other postdischarge issues are not generalizable to other hospitalist practices. However, the present data were collected at more than 100 health care facilities in 10 health care markets, and the patients were cared for by more than 200 physicians. Therefore, it is unlikely these results would have been significantly influenced by a particular physician's or institution's practice patterns.
Second, because of the large number of facilities involved and that we could only track readmissions to facilities where our own hospitalists practice, we were not able to report 30‐ or 90‐day readmission rates or emergency room visit rates. In a prospective study, these would be important variables to track in order to assess the clinical relevance of the symptoms. We could track this data for some institutions, but for most of them, the quality of data was not sufficient to be meaningful or to make conclusions.
An additional limitation is that the call center did not differentiate between clinically minor and major symptoms. The inclusion of symptoms perhaps considered minor might have elevated the reported symptom frequency. However, the definitions of minor and major symptoms are very subjective, and a clinician's definitions might differ from those of a patient who is at home and uncomfortable. For example, nausea or loss of appetite related to new medications may be considered minor clinically but could be devastating to the patient experiencing them, leading the patient to stop taking the medication. Conversely, symptoms that may be considered nonsignificant by the patient may be interpreted as indicating clinically significant disease by a physician. Therefore, we would argue that, regardless of the severity of the symptom, follow‐up with a clinician is important.
Another limitation is based on our definition of an adequate follow‐up appointment as one scheduled within 2 weeks of discharge. It might be argued that if a patient's new symptoms were considered minor clinically, then a follow‐up interval greater than 2 weeks might be considered adequate. However, as already noted, a patient's criteria for considering a symptom minor and not requiring follow‐up may differ from a clinician's criteria. Also, the standardized discharge process requires that the hospitalist identify a physician for outpatient follow‐up and specify the period when the patient is to see the physician. Because of the inherent variability in having a many hospitalists practicing in many hospitals, not all patients had a scheduled appointment at discharge. We were not able to determine whether patients had an appointment date and time for follow‐up before discharge or had only received instructions to call the office for an appointment.
The Institute of Medicine, in its report Crossing the Quality Chasm, identified the coordination of care across services and sites of care as one of the health care system's redesign imperatives.2 Hospitalists are in a unique position to address transition care issues. Managing the transition from inpatient to outpatient care is vitally important, and hospitalists should play an essential role in designing a transition management system for discharged patients. Although individual efforts by hospitalists are essential to assuring postdischarge contact with patients, there is increasing agreement that system solutions are needed to improve the quality of care in the transition period following hospitalization. Improving a health care process involves more than working harder; it involves working differently.3 It is therefore imperative that hospitalist programs develop effective systems to manage the transition period until safe arrival by the patient in the outpatient physician's office.
In summary, 11.9% of patients contacted by a telephone call center within several days of discharge had new or worsening symptoms since discharge. There was no difference by age in the prevalence of symptoms. Patients who rated their health status as fair to poor were more likely to be symptomatic. Symptomatic patients were also more likely to have difficulty obtaining or understanding how to take their medications and receiving home health services. Patients who felt poorly were only minimally more likely to have made an appointment for follow‐up with their outpatient physician. It is hoped that by identifying patients who are doing poorly after discharge and intervening as necessary, we can improve the health outcome of our patients, as well as reduce the number of emergency room visits and readmission rates. Although actions by individual physicians are important, a system to manage the postdischarge transition period is essential for improving posthospitalization outcomes.
Acknowledgements
The authors thank Rahul M. Dodhia for his assistance in the statistical analysis of the data and Sunil Kripalani for his thoughtful review of the manuscript.
APPENDIX
- Kohn LT,Corrigan J,Donaldson M, editors. To Err Is Human: Building a Safer Health System.Washington, DC:National Academy Press;2000:xxi,287.
- Institute of Medicine (U.S.).Committee on Quality of Health Care in America. Crossing the Quality Chasm: a New Health System for the 21st Century.Washington, DC:National Academy Press;2001:xx,337.
- ,,.An approach to hospital quality improvement.Med Clin North Am.2002;86:825–845.
- ,.The hospitalist movement 5 years later.JAMA.2002;287:487–494.
- .Making health care safe. Supplement on hospital medicine and patient safety.The Hospitalist.2004:3–4.
- ,,, et al.Patient‐physician communication at hospital discharge and patients' understanding of the postdischarge treatment plan.Arch Intern Med.1997;157:1026–1030.
- ,,,,.The incidence and severity of adverse events affecting patients after discharge from the hospital.Ann Intern Med.2003;138:161–167.
- ,,, et al.Adverse events among medical patients after discharge from the hospital.CMAJ.2004;170:345–349.
- ,,,.Medical errors related to discontinuity of care from an inpatient to an outpatient setting.J Gen Intern Med.2003;18:646–651.
- ,,,,,.Telephone care as a substitute for routine clinic follow‐up.JAMA.1992;267:1788–1793.
- ,,,,,.Effect of a standardized nurse case‐management telephone intervention on resource use in patients with chronic heart failure.Arch Intern Med.2002;162:705–712.
- ,,,.The impact of follow‐up telephone calls to patients after hospitalization.Am J Med.2001;111(9B):26S–30S.
- Medical Outcomes Trust.How to Score the SF‐12 Short Form Health Survey.Boston:The Medical Outcomes Trust;1992.
- ,,.Examining emotional, physical, social, and spiritual health as determinants of self‐rated health status.Am J Health Promot.1998;12:275–282.
- 3M Health Information Systems, 3M All Patient Refined DRG Software. Available at: http://3m.com/market/healthcare/his/us/products/apr_drg/brochure.html.
- .A simple sequentially rejective Bonferroni test procedure.Scand J Stat.1979;6:65–70.
- ,,.Effects of discharge planning and compliance with outpatient appointments on readmission rates.Psychiatr Serv.2000;51:885–889.
- .J. Can you prevent adverse drug events after hospital discharge?CMAJ.2006;174:921–922.
- ,.Follow‐up phone calls after an emergency department visit.Pediatrics.1994;93:513–514.
- ,,,.Efficacy of a telephone follow‐up system in the emergency department.J Emerg Med.1988;6:249–254.
- ,,.A randomized trial to improve compliance in urinary tract infection patients in the emergency department.Ann Emerg Med.1990;19:16–20.
- ,,,,.The effectiveness of an organized emergency department follow‐up system.Ann Emerg Med.1986;15:911–915.
- .The importance of postdischarge telephone follow‐up for hospitalists: a view from the trenches.Am J Med.2001;111(9B):43S–44S.
- ,,.Telephone care as an adjunct to routine medical follow‐up. A negative randomized trial.Eff Clin Pract.2000;3:123–130.
- ,,.Telephone follow‐up after discharge from the hospital: does it make a difference?Appl Nurs Res.1996;9:47–52.
The Institute of Medicine reports To Err is Human and Crossing the Quality Chasm have drawn great attention to quality improvement and patient safety in the hospital setting.13 With the growth of the hospitalist field over the past several years,4 there has been increasing discussion about the importance of assuring quality of care, and some have argued that improving health care quality and reducing avoidable errors may be among the hospitalist's most important functions.5 Most discussions about the quality of hospital care have concerned the inpatient stay itself. However, the growth of hospital medicine, with its inherent discontinuity between inpatient and outpatient physicians, has intensified interest in the transition period from hospital discharge until first outpatient appointment.
At discharge, physicians may prescribe medications, order home health services, and arrange follow‐up appointments. It is often assumed a patient will remain stable after discharge and will follow up at the outpatient physician's office. Previous research has shown there may be problems with these assumptions. A patient may not understand the postdischarge treatment plan as well as the physician thinks.6 A recent study found that adverse events after discharge were common and often preventable.7 A follow‐up study confirmed that approximately 25% of patients had an adverse event after hospital discharge and that most adverse events caused symptoms but did not result in an emergency department visit, hospitalization, or death.8 Another study also found the prevalence of medical errors following hospitalization was high because of the discontinuity of care from the inpatient to the outpatient setting.9 These errors resulted in an increased rate of rehospitalization.
Telephone follow‐up may be a useful method of bridging the gap in care between discharge and the first outpatient appointment.10, 11 In most previous studies it was 2 or 3 weeks after discharge before patients were contacted or their records studied. By this point, patients who had done poorly may already have been readmitted or sought care at alternative locations. In one small study, pharmacists found that 12 of 79 patients (15%) contacted by telephone within 2 days of discharge12 had symptoms there were new or had worsened since discharge. The purpose of the present investigation was to extend these previous findings through a large multicenter study of how frequently patients had new or worsened symptoms within several days of discharge.
METHODS
Settings and Participants
IPCThe Hospitalist Company has hospitalist practices at more than 150 health care facilities in 10 health care markets. At the time of the study, IPC employed more than 300 internal medicine and family practice physicians and discharged approximately 11,000 adult patients per month. The study is a retrospective analysis of data collected from May 1, 2003, to October 31, 2003.
Data Acquisition
Physicians entered clinical and financial information on all hospitalized patients into a handheld personal digital assistant (PDA) utilizing functions of IPC‐LINK software. At the time of discharge, a physician completed a discharge summary on the PDA that was transmitted electronically to a centralized data center. Copies of the discharge summary were also faxed to the outpatient physician's office. Patients were first interviewed by call‐center patient representatives, unlicensed staff with medical backgrounds. Call‐center representatives made several attempts by telephone to reach all patients discharged home within several days of discharge. Using a scripted survey instrument (Appendix A), they asked patients or family members a series of questions about clinical status, new or worsening symptoms, problems with medications or prescribed home health care services, follow‐up appointments with their outpatient physician, and satisfaction with the care received. Call‐center nurses, licensed personnel with extensive medical/surgical and case management experience, contacted patients whose answers to questions on the scripted survey instrument (see last section of Appendix A) indicated a high risk of postdischarge problems, intervening as necessary to resolve the health care issues.
Health status was self rated on a 5‐point Likert scale from excellent to poor in response to the health status question on the SF‐12.13, 14 Patient age was calculated using birth date and admit date from the IPC‐Link discharge summary. With clinical data from the IPC‐Link discharge summary, the 3M DRG Grouper was used to assign each patient a DRG and severity of illness (SOI) score.15 Reported symptoms were grouped in clinically meaningful categories by the lead author.
Statistical Analysis
Logistic regression analysis was performed to analyze the effects of sex, health insurance, inpatient severity of illness, and self‐reported health status on the proportion of patients with symptoms. Sex, health status, and severity of illness were treated as ordered variables. Because insurance type is a nominal variable, HMO was used as the reference category, and the other categories were converted to indicator variables. Pearson chi‐square testing was used for all other analyses. The large number of planned analyses necessitated adjustment of the P values computed for the tests to maintain the type I error rate at 0.05. Therefore, a step‐down Bonferroni procedure was used.16
Role of the Funding Source
Data collection, analysis, and interpretation were funded by IPC and performed by employees of IPC.
RESULTS
During the study period, 48,236 patients were discharged to their homes from an acute care hospital. The IPC call center successfully contacted 16,135 patients after discharge, of whom 368 patients (2.3%) were excluded because of incomplete answers, leaving 15,767 as the valid study population (effective response rate = 32.4%). Of these, 98.9% were contacted within the first 5 days. The primary reasons for nonresponse or noninclusion in the present analysis were no answer after 2 attempts (52%) and missing or incorrect phone numbers (16%). If there was an answering machine, a message was left for the patient to call back. Those who called back accounted for fewer than 1% of all the patients.
A comparison of participants versus nonparticipants is shown in Table 1. The mean age of surveyed patients was 60.1 years, and 57% were female. The most common categories of insurance coverage were Medicare and HMO. The inpatient severity of illness of most patients was minor to moderate. Self‐reported health status was normally distributed, with the greatest percentage of patients rating their health as fair or good. On average, nonparticipants were younger than participants, more likely to be male, had a different pattern of health insurance, and a slightly lower severity of illness. The top 10 DRGs were the same for the respondents and nonrespondents, and the order of these 10 diagnoses was very similar.
| Characteristic | Patients in Study | Patients Not in Study | P Value* | ||
|---|---|---|---|---|---|
| Number of Patients | Percentage of All Patients | Number of Patients | Percentage of All Patients | ||
| |||||
| All patients | 15,767 | 32,101 | |||
| Mean age (years) | 60.1 | 54.1 | <.0001 | ||
| Sex | |||||
| Female | 8985 | 57.0% | 17220 | 53.7% | <.0001 |
| Male | 6515 | 41.3% | 14337 | 44.7% | <.0001 |
| Unknown | 267 | 1.7% | 544 | 1.7% | .897 |
| Insurance type | |||||
| HMO | 6391 | 40.5% | 12540 | 39.1% | <.001 |
| Medicaid | 1066 | 6.8% | 2815 | 8.8% | <.0001 |
| Medicare | 6055 | 38.4% | 9777 | 30.4% | <.0001 |
| Commercial and other | 1370 | 8.7% | 3490 | 10.9% | <.0001 |
| Self‐pay | 885 | 5.6% | 3479 | 10.9% | <.0001 |
| Severity of illness | |||||
| Minor | 6740 | 42.7% | 14679 | 45.7% | <.0001 |
| Moderate | 6854 | 43.5% | 13197 | 41.1% | |
| Major | 1688 | 10.7% | 3091 | 9.6% | <.0001 |
| Extreme | 118 | 0.7% | 219 | 0.7% | .571 |
| Unknown | 367 | 2.3% | 915 | 2.9% | .001 |
| Health status | |||||
| Excellent | 343 | 2.2% | N/A | ||
| Very good | 1392 | 8.8% | N/A | ||
| Good | 5505 | 34.9% | N/A | ||
| Fair | 5901 | 37.4% | N/A | ||
| Poor | 1468 | 9.3% | N/A | ||
| Unknown | 1158 | 7.3% | N/A | ||
Of the 15,767 patients contacted, 11.9% (N = 1876) reported symptoms that were new or had worsened since leaving the hospital. Sixty‐four percent of these patients had new symptoms, and 36% had worsening symptoms. These two groups were combined for analysis in this study because for both groups, identification and action are important. Of the patients with new or worse symptoms, 37% required no assistance from the nurse because they had already notified a doctor and/or were doing something about it. The other 63% either had not notified their doctor or had concerns about their signs and symptoms. The most common action taken by the nurse was patient education regarding the symptoms. Of those requiring nurse intervention in addition to education, the most common intervention was to contact the patient's primary care provider or specialist about the patient's symptoms, followed by contacting the hospitalist. In 72% of nurse interventions, the patient's primary care physician or a specialist was contacted about the new or worsened symptoms. Other interventions included contacting the physician's office to obtain a prescription for a medication for the symptom, to get an appointment for the patient, or to reschedule an appointment to be earlier. A referral to an emergency room or urgent care center was given to 4% of patients.
Mean age of the patients with new or worsened symptoms was 60.5 years. The age distribution of symptomatic and asymptomatic patients was not significantly different, whether comparing by mean, median, or decades. Table 2 illustrates factors associated with the increased rate of new or worsened symptoms. Women were more likely than men to report symptoms (13.0% vs. 10.3%, P < .0001). As health status worsened, the percentage of patients with new or worsened symptoms increased (P < .0001), as it did with increased inpatient SOI (P < .0001). There was no correlation between self‐rated health status and SOI score based on DRG score, suggesting they measured different parameters. Table 3 lists the percentages of patients reporting new or worsened symptoms for the most common DRGs. The only significant distinction was that patients discharged with a DRG of chest pain were less likely to report symptoms than were all patients.
| Characteristic | Number of Patients with New or Worsening Symptoms | Percentage of All Patients with New or Worsening Symptoms | P Value for Difference or Trend* |
|---|---|---|---|
| |||
| All Patients | 1876 | 11.9% | |
| Sex | <.0001 | ||
| Female | 1170 | 13.0% | |
| Male | 672 | 10.3% | |
| Insurance Type | |||
| HMO | 722 | 11.3% | .89 |
| Medicare | 748 | 12.4% | .21 |
| Commercial and other | 165 | 12.0% | .53 |
| Medicaid | 128 | 12.0% | .27 |
| Self‐pay | 113 | 12.8% | |
| Severity of illness | .17 | ||
| Minor | 748 | 11.1% | |
| Moderate | 814 | 11.9% | |
| Major | 247 | 14.6% | |
| Extreme | 19 | 16.1% | |
| Health Status | <.0001 | ||
| Excellent | 22 | 6.4% | |
| Very good | 85 | 6.1% | |
| Good | 429 | 7.8% | |
| Fair | 725 | 12.3% | |
| Poor | 384 | 26.2% | |
| DRG | Description | Number of Patients | Percentage of Patients | Patients with New or Worsening Symptoms | Rate of New or Worsening Symptoms | P value |
|---|---|---|---|---|---|---|
| ||||||
| Total patients in Study | 15,767 | 1876 | 11.9% | |||
| 143 | Chest pain | 1306 | 8.3% | 128 | 9.8% | 0.027 |
| 182 | Digest disorders with complications | 801 | 5.1% | 92 | 11.5% | 0.767 |
| 183 | Digest disorders without complications | 632 | 4.0% | 78 | 12.3% | 0.783 |
| 127 | Heart failure and shock | 544 | 3.5% | 55 | 10.1% | 0.230 |
| 89 | Pneumonia with complications | 426 | 2.7% | 39 | 9.2% | 0.098 |
| 88 | COPD | 380 | 2.4% | 44 | 11.6% | 0.913 |
| 278 | Cellulitis | 323 | 2.0% | 32 | 9.9% | 0.313 |
| 174 | GI hemorrhage with complications | 320 | 2.0% | 40 | 12.5% | 0.809 |
| 15 | CVA | 302 | 1.9% | 25 | 8.3% | 0.066 |
| 175 | GI hemorrhage without complications | 287 | 1.8% | 34 | 11.8% | 0.948 |
The symptoms the patients reported are categorized in Table 4 without distinction as to whether they are primary or secondary. Gastrointestinal symptoms were the most common category of symptoms, followed by general symptoms, cardiovascular symptoms, and pain. The most common symptoms reported were fatigue/weakness, nausea/vomiting, and edema.
| Category | Specific Symptom | Number | % 0f Total |
|---|---|---|---|
| |||
| Gastrointestinal | 771 | 24.1% | |
| Nausea/vomiting | 245 | 7.7% | |
| Abdominal pain | 162 | 5.1% | |
| Diarrhea | 146 | 4.6% | |
| Eating problems | 107 | 3.3% | |
| Constipation | 71 | 2.2% | |
| General | 527 | 16.5% | |
| Fatigue or weakness | 360 | 11.3% | |
| Dizziness | 167 | 5.2% | |
| Cardiovascular | 388 | 12.1% | |
| Edema | 219 | 6.8% | |
| Chest pain | 101 | 3.2% | |
| Pain | 382 | 11.9% | |
| Back and neck | 118 | 3.7% | |
| Lower exttremity (including hip) | 115 | 3.6% | |
| Generalized | 76 | 2.4% | |
| Psychological | 209 | 6.5% | |
| Sleeping problems | 125 | 3.9% | |
| Change in mental status/psychiatric symptoms | 84 | 2.6% | |
| Pulmonary | 382 | 11.9% | |
| Dyspnea | 134 | 4.2% | |
| Neurological | 199 | 6.2% | |
| Headache | 118 | 3.7% | |
| Infectious | 192 | 6.0% | |
| Fever | 82 | 2.6% | |
| Dermatological | 65 | 2.0% | |
| Urological | 62 | 1.9% | |
| ENT | 50 | 1.6% | |
| Diabetic (problems with blood sugar) | 45 | 1.4% | |
| Postoperative wound problems | 39 | 1.2% | |
| Problems with intravenous sites | 17 | 0.5% | |
| Medication Reaction | 14 | 0.4% | |
| Bleeding (other than above locations) | 14 | 0.4% | |
| Gynecological | 9 | 0.3% | |
| Others | 89 | 2.8% | |
The call center assessed whether the patient had difficulty making a follow‐up appointment and whether an appointment was scheduled within 2 weeks of discharge. Patients with new or worsening symptoms were only minimally more likely to have scheduled follow‐up (61.0% vs. 58.4% for patients not reporting new or worsening symptoms, P < .05). Symptomatic patients had a higher prevalence of medication issues, defined as not picking up their prescriptions or not understanding how to take their medication (22.2% vs. 6.8% for asymptomatic patients; P < .0001). Likewise, the prevalence of symptomatic patients having problems receiving scheduled home health care services was 5.8%, compared with a prevalence of 3.6% for asymptomatic patients (P < .0001).
DISCUSSION
Enhancing the quality of care provided by hospitalists means not only improving care during hospitalization but also assuring patient stability between discharge and outpatient follow‐up. As part of efforts to improve transition management, the call center at IPC attempted to contact all patients discharged home within several days of discharge. Of 15,767 patients surveyed between May 1, 2003, and October 31, 2003, 11.9% (N = 1876) had new or worsening symptoms since leaving the hospital only 2 or 3 days earlier. We had hypothesized that older patients might be more symptomatic than younger ones, but found no difference in the prevalence of new or worsening symptoms based on age. Women were more likely to be symptomatic than men.
We defined appropriate postdischarge follow‐up as having an appointment with an outpatient physician within 2 weeks. A previous study of psychiatric patients documented that keeping a follow‐up appointment significantly reduces the risk of rehospitalization.17 Similar data do not exist for medical patients. Our data demonstrated that symptomatic patients were only minimally more likely to have made a follow‐up appointment with their outpatient physician within the first 2 weeks than were those patients who were not symptomatic. As part of patient education at discharge, clinicians routinely counsel patients to call their outpatient physician should they experience new or worsening symptoms once at home. Inpatient physicians may assume this recommendation provides a safety net for the patients should they develop problems after discharge. However, our finding that almost 40% of patients with new or worsening symptoms within 2‐3 days of discharge had not made a follow‐up appointment with their physician suggests many patients fall through this safety net. Although there was a slight statistically significant difference between the groups, this difference was not clinically significant. One potential limitation of our data is that we did not examine whether there was a correlation between the day of the week that a patient was discharged and inability to make a follow‐up appointment.
As part of the survey script (see Appendix), we inquired whether patients were able to pick up their prescriptions and whether they understood how to take their medication. A high percentage of patients in our study reported having one of these medication issues in the first several days following hospital discharge, providing an opportunity for early intervention and prevention of medical error. Forster and others have demonstrated that adverse events and medical errors are common in the postdischarge period, affecting 23%‐49% of patients.79 Errors in the transition from inpatient to outpatient care increased the 3‐month rate of rehospitalization.9 New or worsening symptoms represented the most common adverse event.8 Noting that many of these postdischarge complications could be preventable if detected early, Forster suggested system changes such as earlier follow‐up with the outpatient physician or a postdischarge telephone call to check on the patient's status.7, 18 Future studies are planned to further analyze our data on medication issues and to determine if these problems are more prevalent for certain medications or diagnoses.
Comprehensive discharge planning remains an essential step in the discharge process. This may involve prescribing medications, arranging home health care services, and arranging outpatient follow‐up. The traditional hospital discharge process does not adequately ensure that patients understand their discharge plan and are able to comply with it. Calkins et al. compared physicians' perceptions of patients' understanding of medication side effects and activity restrictions with patients' actual understanding.6 They found that, compared with what was reported by patients, physicians overestimated the time spent discussing discharge plans and how well patients understood medication side effects and activity restrictions.
An important method for reducing patient problems is to contact patients by telephone after discharge in order to identify any health care issues. Previous research has confirmed that follow‐up telephone calls improve health outcomes and decrease resource utilization of patients, mainly those discharged from the emergency department.10, 11, 1923 A study of telephone follow‐up after ambulatory care visits did not find significant benefits of this procedure.24 In one of the few studies of telephone calls after hospitalization, pharmacists contacted patients 2 days after discharge and were able to detect and resolve medication‐related problems in 19% of patients and learned of new or worsening symptoms in 15%. Patient satisfaction was improved, and the intervention resulted in a lower rate of repeat visits to the emergency room within 30 days of discharge.12 Another study of telephone follow‐up following hospital discharge compared proactively calling all patients with providing a phone number that patients can call if they have questions. The study demonstrated that very few patients called the number provided, but of those patients called by the nursing service, more than 90% had questions about self‐care and recovery.25 These findings demonstrate the value of proactively contacting patients in the first several days after discharge, when problems can be detected and interventions initiated earlier.
One potential concern with this study was the low response rate. This was a retrospective analysis of an existing discharge management call‐center system, not a prospective study. We were not able to reach 52% of the patients discharged after 2 attempts by telephone. To have our call center make additional attempts to reach each patient by telephone would require a significant increase in the size of the call center, because at the time of the study, the staff was handling more than 370 patients discharged home a day. The telephone number of 16% of patients was missing or incorrect. We have since developed internal quality improvement mechanisms to decrease this percentage. After subtracting the patients we were unable to reach and those whose phone number was missing or incorrect, we were able to contact 32.4% of all the patients discharged home.
Several reasons explain the response rate found by many prospective research studies. In most studies of telephone follow‐up, patients must be able to consent to participate in order to be considered eligible inclusion. This raises the response rate because patients who do not consent to participate, have language barriers, or have no telephone are excluded from the study. In our study none of these types of patients were excluded. There are 2 additional differences between our study and many published studies that involve telephone surveys. Ours was not a prospective research study, and we contacted many more patients than did other studies. For example, a study by Forster et al. involved only 581 patients, and the research staff was diligent in its efforts to reach the patients,7 making up to 20 attempts for each patient. They reported a response rate of 69%. If they had included patients who were non‐English speakers or had no phone in their study, the response rate would have been 59%. Shesser et al. were able to reach 144 of 297 patients in their study of emergency room follow‐up, for a 48.4% response rate.25 The response rate in a study of telephone consultation with asthma patients was quite similar to ours. They enrolled 932 eligible patients, of whom they were able to reach 278, for a response rate of 30%.
It is possible that the rate of symptoms and the other variables we measured relative to this would have been different if we had been able to reach 100% of patients. There were some demographic differences between the patients we were able to reach and those we were not (Table 1). The nonresponders were slightly younger and slightly more likely to be female. Nonresponders were more likely to have Medicaid or commercial insurance or be self‐pay and were less likely to have Medicare. In addition, nonresponders had less severe illness. Although this scenario is highly unlikely, if none of the nonresponders had new or worsening symptoms, the rate of symptoms would only have been 3.86%. Conversely, it is possible but also very unlikely that a greater percentage of the nonresponders had new or worsening symptoms. Given the demographics of our study participants, we would expect a potentially slightly lower rate of signs and symptoms.
The present study had several other limitations. First, all patients surveyed were cared for by IPC‐employed physicians. It is possible that reported rates of symptoms and other postdischarge issues are not generalizable to other hospitalist practices. However, the present data were collected at more than 100 health care facilities in 10 health care markets, and the patients were cared for by more than 200 physicians. Therefore, it is unlikely these results would have been significantly influenced by a particular physician's or institution's practice patterns.
Second, because of the large number of facilities involved and that we could only track readmissions to facilities where our own hospitalists practice, we were not able to report 30‐ or 90‐day readmission rates or emergency room visit rates. In a prospective study, these would be important variables to track in order to assess the clinical relevance of the symptoms. We could track this data for some institutions, but for most of them, the quality of data was not sufficient to be meaningful or to make conclusions.
An additional limitation is that the call center did not differentiate between clinically minor and major symptoms. The inclusion of symptoms perhaps considered minor might have elevated the reported symptom frequency. However, the definitions of minor and major symptoms are very subjective, and a clinician's definitions might differ from those of a patient who is at home and uncomfortable. For example, nausea or loss of appetite related to new medications may be considered minor clinically but could be devastating to the patient experiencing them, leading the patient to stop taking the medication. Conversely, symptoms that may be considered nonsignificant by the patient may be interpreted as indicating clinically significant disease by a physician. Therefore, we would argue that, regardless of the severity of the symptom, follow‐up with a clinician is important.
Another limitation is based on our definition of an adequate follow‐up appointment as one scheduled within 2 weeks of discharge. It might be argued that if a patient's new symptoms were considered minor clinically, then a follow‐up interval greater than 2 weeks might be considered adequate. However, as already noted, a patient's criteria for considering a symptom minor and not requiring follow‐up may differ from a clinician's criteria. Also, the standardized discharge process requires that the hospitalist identify a physician for outpatient follow‐up and specify the period when the patient is to see the physician. Because of the inherent variability in having a many hospitalists practicing in many hospitals, not all patients had a scheduled appointment at discharge. We were not able to determine whether patients had an appointment date and time for follow‐up before discharge or had only received instructions to call the office for an appointment.
The Institute of Medicine, in its report Crossing the Quality Chasm, identified the coordination of care across services and sites of care as one of the health care system's redesign imperatives.2 Hospitalists are in a unique position to address transition care issues. Managing the transition from inpatient to outpatient care is vitally important, and hospitalists should play an essential role in designing a transition management system for discharged patients. Although individual efforts by hospitalists are essential to assuring postdischarge contact with patients, there is increasing agreement that system solutions are needed to improve the quality of care in the transition period following hospitalization. Improving a health care process involves more than working harder; it involves working differently.3 It is therefore imperative that hospitalist programs develop effective systems to manage the transition period until safe arrival by the patient in the outpatient physician's office.
In summary, 11.9% of patients contacted by a telephone call center within several days of discharge had new or worsening symptoms since discharge. There was no difference by age in the prevalence of symptoms. Patients who rated their health status as fair to poor were more likely to be symptomatic. Symptomatic patients were also more likely to have difficulty obtaining or understanding how to take their medications and receiving home health services. Patients who felt poorly were only minimally more likely to have made an appointment for follow‐up with their outpatient physician. It is hoped that by identifying patients who are doing poorly after discharge and intervening as necessary, we can improve the health outcome of our patients, as well as reduce the number of emergency room visits and readmission rates. Although actions by individual physicians are important, a system to manage the postdischarge transition period is essential for improving posthospitalization outcomes.
Acknowledgements
The authors thank Rahul M. Dodhia for his assistance in the statistical analysis of the data and Sunil Kripalani for his thoughtful review of the manuscript.
APPENDIX
- Kohn LT,Corrigan J,Donaldson M, editors. To Err Is Human: Building a Safer Health System.Washington, DC:National Academy Press;2000:xxi,287.
- Institute of Medicine (U.S.).Committee on Quality of Health Care in America. Crossing the Quality Chasm: a New Health System for the 21st Century.Washington, DC:National Academy Press;2001:xx,337.
- ,,.An approach to hospital quality improvement.Med Clin North Am.2002;86:825–845.
- ,.The hospitalist movement 5 years later.JAMA.2002;287:487–494.
- .Making health care safe. Supplement on hospital medicine and patient safety.The Hospitalist.2004:3–4.
- ,,, et al.Patient‐physician communication at hospital discharge and patients' understanding of the postdischarge treatment plan.Arch Intern Med.1997;157:1026–1030.
- ,,,,.The incidence and severity of adverse events affecting patients after discharge from the hospital.Ann Intern Med.2003;138:161–167.
- ,,, et al.Adverse events among medical patients after discharge from the hospital.CMAJ.2004;170:345–349.
- ,,,.Medical errors related to discontinuity of care from an inpatient to an outpatient setting.J Gen Intern Med.2003;18:646–651.
- ,,,,,.Telephone care as a substitute for routine clinic follow‐up.JAMA.1992;267:1788–1793.
- ,,,,,.Effect of a standardized nurse case‐management telephone intervention on resource use in patients with chronic heart failure.Arch Intern Med.2002;162:705–712.
- ,,,.The impact of follow‐up telephone calls to patients after hospitalization.Am J Med.2001;111(9B):26S–30S.
- Medical Outcomes Trust.How to Score the SF‐12 Short Form Health Survey.Boston:The Medical Outcomes Trust;1992.
- ,,.Examining emotional, physical, social, and spiritual health as determinants of self‐rated health status.Am J Health Promot.1998;12:275–282.
- 3M Health Information Systems, 3M All Patient Refined DRG Software. Available at: http://3m.com/market/healthcare/his/us/products/apr_drg/brochure.html.
- .A simple sequentially rejective Bonferroni test procedure.Scand J Stat.1979;6:65–70.
- ,,.Effects of discharge planning and compliance with outpatient appointments on readmission rates.Psychiatr Serv.2000;51:885–889.
- .J. Can you prevent adverse drug events after hospital discharge?CMAJ.2006;174:921–922.
- ,.Follow‐up phone calls after an emergency department visit.Pediatrics.1994;93:513–514.
- ,,,.Efficacy of a telephone follow‐up system in the emergency department.J Emerg Med.1988;6:249–254.
- ,,.A randomized trial to improve compliance in urinary tract infection patients in the emergency department.Ann Emerg Med.1990;19:16–20.
- ,,,,.The effectiveness of an organized emergency department follow‐up system.Ann Emerg Med.1986;15:911–915.
- .The importance of postdischarge telephone follow‐up for hospitalists: a view from the trenches.Am J Med.2001;111(9B):43S–44S.
- ,,.Telephone care as an adjunct to routine medical follow‐up. A negative randomized trial.Eff Clin Pract.2000;3:123–130.
- ,,.Telephone follow‐up after discharge from the hospital: does it make a difference?Appl Nurs Res.1996;9:47–52.
Copyright © 2007 Society of Hospital Medicine