User login
Fragmentation of Care
There is a potential for discontinuity of care in the management of inpatients by hospitalists since many patients are cared for by more than one physician during their hospitalization. Previous studies have explored the impact of this type of discontinuity of care in residency programs. With the restrictions put in place by the Accreditation Council on Graduate Medical Education (ACGME) in 2003, there has been an increase in the fragmentation of care (FOC) that patients receive in the hospital. Studies have explored the impact of these changes on length of stay (LOS) and quality of care. The results have been mixed, with some studies showing that the increased FOC was associated with prolonged LOS,1, 2 as well as having a negative influence on quality.2, 3 Other studies have shown no change or a reduction in LOS,4 and an improvement in quality measures.46
There have been no prior studies on the impact of hospitalist care as the source of FOC on LOS. We therefore undertook a study to explore the impact of fragmented hospitalist care on LOS. Additionally, there has been some discussion on the impact of admission day of week on both FOC and LOS. Prior studies have mainly looked at day of the week in intensive care unit patients. One study found a modest increase in ICU LOS in patients admitted during the weekend.7 We therefore also looked at the impact of day of the week of admission on FOC in order to determine if fragmentation was just a proxy for admission day as the true indicator for increased LOS.
Methods
Design Overview
Data for this study consisted of clinical and billing information from IPC.
Setting and Participants
Data on LOS and FOC were drawn from the clinical and billing database of IPC The Hospitalist Company, which is a national group practice of hospitalists that at the time of the study had practices in over 230 acute health care facilities in 24 healthcare markets across the United States. Physicians enter clinical and billing data into IPC‐Link, a proprietary web based program.
Patients included in this study were discharged between December 1, 2006 and November 30, 2007 with a diagnosis‐related group (DRG) of 89 Pneumonia with complications or comorbidities (PNA) or a DRG of 127 Heart failure and shock (HF). A total of 10,977 patients with DRG 89 (n = 1951) or DRG 127 (n = 9026) were identified. These patients were admitted to 223 hospitals in 16 states.
Outcome
The outcome measure of interest was LOS.
FOC Measure
The independent variable of interest was the measure of fragmentation of physician care during the hospital stay. The intuitive meaning of fragmentation in physician hospital services is the delivery of care by multiple hospitalist physicians within a single stay. We converted the idea of fragmentation into a quantitative measure, an FOC Index, by calculating the percentage of hospitalist care delivered by physicians other than the primary hospitalist. The primary hospitalist was defined as the physician responsible for the largest number of visits during the hospital stay. Fragmentation was calculated by summing the number of daily billable encounters by IPC hospitalists other than the primary hospitalist and dividing by the total number of billable encounters by all IPC hospitalists. Thus, if three days out of a five‐day stay, the patient was seen by one hospitalist, then 60% of the care would be by the primary hospitalist. The patient was seen by other physicians than the primary hospitalist 2 out of the 5 days, for a FOC Index of 40%. IPC billing data was used to identify each hospitalist visit during the hospital stay by physician, date, and type of visit.
Covariates
The clinical database contained potential covariates: age, gender, day of admission, the number of ICD‐9 diagnosis codes on the discharge summary, and severity of illness (SOI) and risk of mortality (ROM) measures. The 3M DRG Grouper (St. Paul, Minnesota), using clinical data from the IPC‐Link discharge summary, assigned each patient an SOI score, and an ROM score based on age, primary diagnosis, and non‐operating room procedures.8 Both SOI and ROM are scored from 1 to 4, ranging from 1 for minor to 4 for extreme. We created dummy variables for the SOI and ROM categories, that is, variables for each score with a value of 1 if the SOI or ROM is that score and 0, otherwise. In each case, a score of 1 was the referent category. Dummy variables were created for each admission day of the week with Monday as the referent. Demographic variables and variables related to the patient condition were included to reduce any potential confounding arising from differences in patient populations across hospitals and hospitalist practice patterns. Admission day of the week has been shown to influence LOS and may influence FOC due to weekend scheduling within hospitalist practices.
Statistical Analysis
All analyses were performed using SAS (version 9.1). To reduce the influence of outliers on the model, observations with extreme values for LOS (defined as greater than 3 standard deviation [STD] from the mean) were truncated to 30 days. For pneumonia, the mean LOS was 7.85 days (STD 7.44) and all patients with LOS greater than 30 days were truncated to 30 days. For heart failure, the mean LOS was 5.88 days (STD 9.77) and all patients with LOS greater than 35 days were truncated to 35 days. Multivariable regression was performed using the negative binomial distribution. Negative binomial regression used as LOS is not normally distributed, but instead has a positive skew. Forward stepwise selection was performed separately for patients with each DRG using variables from the clinical database described in the Methods section. Categorical dummy variables were entered as a group. The final model contained all variables that were significant (P < 0.05).
Results
Table 1 reviews the demographics of patients with DRG 89 (PNA) and DRG 127 (HF). A large proportion of patients with both DRGs experienced no fragmentation in their physician care during hospitalization; 4152 patients with HF (46.3%) and 685 patients with PNA (35.8%) had visits from only 1 hospitalist throughout their hospital stay, for a FOC Index of 0%. The mean fragmentation level was 21.9% for pneumonia patients, with the mean number of hospitalists seen during the stay at 2.05. For heart failure patients, the mean fragmentation level was 18.3 % and a mean of 1.78 hospitalists seen (Table 1).
| DRG 89 (n = 1950), Mean (STD) | DRG 127 (n = 9026), Mean (STD) | |
|---|---|---|
| ||
| Age, years | 65.8 (18.6) | 71.4 (15.2)* |
| % Female | 49.7 | 51.7 |
| Number of secondary diagnoses | 5.6 (2.5) | 5.0 (2.3)* |
| Severity of Illness | 2.80 (0.57) | 1.943 (0.72)* |
| Risk of Mortality | 2.49 (0.84) | 1.81 (0.75)* |
| Fragmentation: percent of care by non‐primary hospitalist(s) | 21.9% (20.3) | 18.3% (19.9)* |
| Number of physicians seen during hospital stay | 2.05 (1.12) | 1.78 (0.94)* |
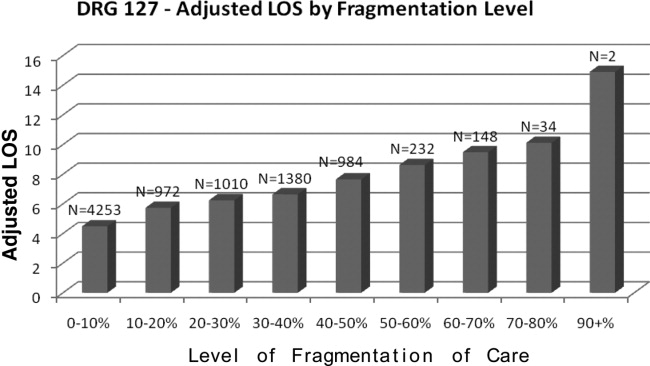
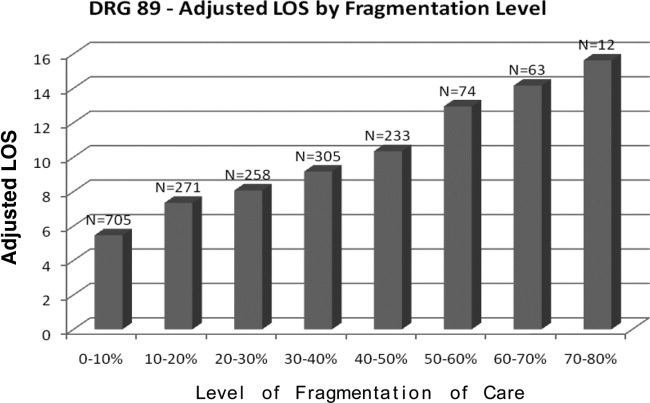
Table 2 presents the results of the regression analysis on LOS. The association between fragmentation and LOS, adjusted for demographics, case mix and day of admission, was similar for PNA and HF patients. We found an increase in LOS of 0.39 days for each 10% increase in fragmentation level for pneumonia. Other variables that significantly increased LOS for PNA were larger ROM score, Sunday admission and more discharge diagnoses. Similarly, for heart failure patients, there was an increase in LOS of 0.30 days for each 10% increase in fragmentation level. Other variables associated with a significantly increase in LOS for PNA were larger ROM score, larger SOI category, more discharge diagnoses, and age. Figures 1 and 2 demonstrate the results graphically for LOS in each condition. They show the mean adjusted LOS by fragmentation level. Adjusted LOS was calculated for each patient based on the final model. For example, the average adjusted LOS for PNA patients with a fragmentation level of 20% to 30% is 8.06 days and 9.16 days for patients with a fragmentation level of 30% to 40%.
| Pneumonia (DRG = 89), n = 1950 | Heart Failure (DRG = 127), n = 9026 | |
|---|---|---|
| ||
| Fragmentation | Additional 0.39 day for each 10% increase in fragmentation | Additional 0.30 day for each 10% increase in fragmentation |
| Adjustment variables in the model | Age, number of secondary diagnoses, severity of illness variables, risk of mortality variables | Age, gender, number of secondary diagnoses. severity of illness variables, risk of mortality variables |

Discussion
This study demonstrated that there was a statistically significant association between FOC by hospitalist physicians and LOS for patients with DRG 89 (PNA) and DRG 127 (HF). As the percentage of fragmentation increased, the LOS increased significantly.
There are many ways in which to define FOC in the context of hospitalist care of inpatients. We chose to use an index similar to the Usual Provider of Care Index (UPC) which is a standard way to measure continuity of care in the primary care setting.9 The UPC measures the proportion of time spent with the primary provider. In the inpatient setting, we defined continuity of care as the proportion of visits by the primary hospitalist (the physician assuming the greatest number of days of the patient's care). The FOC Index is simply 1 minus the continuity of care. There are other potential measures of FOC, such as the number of handoffs or the number of physicians. We selected our measure based on its following strengths: (1) it does not have the simultaneity problem of measures such as the number of doctors or the number of handoffs that leads to endogeneitya correlation between the error term and the independent variable that biases the coefficient. Endogeneity can occur when the outcome variable and the independent variable are jointly determined, in this case, that an additional day in the hospital increases the likelihood of having an additional handoff as well as an additional handoff increasing the likelihood of an additional day; (2) fragmentation patterns that lead to handoffs on the weekend that then return to the primary hospitalist may be very different from fragmentation patterns that lead to new physicians at each transfer; (3) It provides a good comparison to other models of care where community physicians provide care to their own patients and have an effective FOC index of 0. Further research should be performed looking at different measures that may capture other aspects of care fragmentation.
This is one of the first studies to directly explore the relationship between FOC and LOS. Previous studies in the hospitalist literature have explored the impact of variables on LOS in which FOC may have been an indirect influence. For example, one study found a 13% shorter LOS among academic hospitalists at a teaching hospital who worked on a block rotation compared to a group of community hospitalists with a schedule involving more patient handoffs.10 Although there is little literature on FOC among hospitalists, the literature on medical residency programs is informative. The amount of discontinuity and the number of housestaff‐to‐housestaff transfers of responsibility has increased dramatically since the institution of more stringent work‐hour restrictions by the Accreditation Council for Graduate Medical Education (ACGME) in 2003.11 Horwitz et al.12 found that after the institution of work‐hour regulations, there was an 11% increase in number of transfers of care for a hypothetical patient admitted from Monday until Friday. They noted that programs with a night‐float system had a statistically significant increase in transitions of care compared to residencies without night float. Studies on the impact of the ACGME regulations on LOS have been mixed. One study found that LOS was reduced, and that there was improved adherence to quality indicators.4 A recent study found that there was a 44% increase in the median LOS when Short Call admitting teams were involved.2
There are several limitations to the findings of this study. The largest potential limitation is interpreting the direction of causality between FOC and LOS. This was a concurrent control study. Because the study was not randomized, there is a risk of confounding variables. Admission day of the week was 1 variable of concern for confounding due to the existence of a significant relationship between admission day LOS and between admission day and FOC. We included admission day in our modeling process. The coefficient estimates on FOC were stable, changing less than 1% when day of admission was added to the model. The risk of temporal trends was minimized by studying 1‐year's worth of data. Although we looked at variables that were potentially relevant in all hospitalized patients, every hospital and hospitalist practice has its own unique features that may impact both LOS and FOC. For example, for some hospitals, bed capacity may impact these measures. In many hospitals, hospitalist work force shortages may impact these measures by affecting the extent to which patients are cared for by full‐time hospitalists vs. locums tenens physicians. The large number of facilities in the study mitigates the influence of any individual hospital's LOS and FOC tendencies.
If increased FOC does result in prolonged LOS, the question arises as to how this fragmentation can be decreased. Although no physician can guarantee presence continually throughout a patient's inpatient stay, there are scheduling methods that reduce fragmentation and maximize the odds of a patient being followed by a single clinician. For example, the longer the block of days that a hospitalist is scheduled, the fewer hospitalists will need to care for a patient. Many of the top DRGs for patients cared for by hospitalists have lengths of stay between 4 and 5 days.13 Therefore, any schedule that has a hospitalist on for at least four days at a time will increase the likelihood that the same hospitalist will care for many of the patients throughout their stay. In making schedules, the goals of clinical efficiency and physician satisfaction must be weighed against the potential risks to the quality of patient care. For instance, the use of one hospitalist as the admitting physician for all patients may increase efficiency, but will also increase fragmentation.
A factor that may influence the impact of FOC on LOS is the quality of patient handoffs. The Joint Commission instituted this as a national patient safety goal in 2006.14 This goal was based on a Joint Commission analysis that 70% of sentinel events were caused by communication breakdowns, half of these occurring during handoffs.15
In conclusion, this study explored the relationship between FOC in patients cared for by hospitalists and LOS, using an FOC index. For every 10% increase in fragmentation, the LOS went up by 0.39 days for pneumonia and 0.30 days for heart failure. By adjusting for many variables that may impact LOS due to higher severity or complexity of illness, there is an increased likelihood that the FOC may have a causative relationship with the prolonged LOS.
There is a potential for discontinuity of care in the management of inpatients by hospitalists since many patients are cared for by more than one physician during their hospitalization. Previous studies have explored the impact of this type of discontinuity of care in residency programs. With the restrictions put in place by the Accreditation Council on Graduate Medical Education (ACGME) in 2003, there has been an increase in the fragmentation of care (FOC) that patients receive in the hospital. Studies have explored the impact of these changes on length of stay (LOS) and quality of care. The results have been mixed, with some studies showing that the increased FOC was associated with prolonged LOS,1, 2 as well as having a negative influence on quality.2, 3 Other studies have shown no change or a reduction in LOS,4 and an improvement in quality measures.46
There have been no prior studies on the impact of hospitalist care as the source of FOC on LOS. We therefore undertook a study to explore the impact of fragmented hospitalist care on LOS. Additionally, there has been some discussion on the impact of admission day of week on both FOC and LOS. Prior studies have mainly looked at day of the week in intensive care unit patients. One study found a modest increase in ICU LOS in patients admitted during the weekend.7 We therefore also looked at the impact of day of the week of admission on FOC in order to determine if fragmentation was just a proxy for admission day as the true indicator for increased LOS.
Methods
Design Overview
Data for this study consisted of clinical and billing information from IPC.
Setting and Participants
Data on LOS and FOC were drawn from the clinical and billing database of IPC The Hospitalist Company, which is a national group practice of hospitalists that at the time of the study had practices in over 230 acute health care facilities in 24 healthcare markets across the United States. Physicians enter clinical and billing data into IPC‐Link, a proprietary web based program.
Patients included in this study were discharged between December 1, 2006 and November 30, 2007 with a diagnosis‐related group (DRG) of 89 Pneumonia with complications or comorbidities (PNA) or a DRG of 127 Heart failure and shock (HF). A total of 10,977 patients with DRG 89 (n = 1951) or DRG 127 (n = 9026) were identified. These patients were admitted to 223 hospitals in 16 states.
Outcome
The outcome measure of interest was LOS.
FOC Measure
The independent variable of interest was the measure of fragmentation of physician care during the hospital stay. The intuitive meaning of fragmentation in physician hospital services is the delivery of care by multiple hospitalist physicians within a single stay. We converted the idea of fragmentation into a quantitative measure, an FOC Index, by calculating the percentage of hospitalist care delivered by physicians other than the primary hospitalist. The primary hospitalist was defined as the physician responsible for the largest number of visits during the hospital stay. Fragmentation was calculated by summing the number of daily billable encounters by IPC hospitalists other than the primary hospitalist and dividing by the total number of billable encounters by all IPC hospitalists. Thus, if three days out of a five‐day stay, the patient was seen by one hospitalist, then 60% of the care would be by the primary hospitalist. The patient was seen by other physicians than the primary hospitalist 2 out of the 5 days, for a FOC Index of 40%. IPC billing data was used to identify each hospitalist visit during the hospital stay by physician, date, and type of visit.
Covariates
The clinical database contained potential covariates: age, gender, day of admission, the number of ICD‐9 diagnosis codes on the discharge summary, and severity of illness (SOI) and risk of mortality (ROM) measures. The 3M DRG Grouper (St. Paul, Minnesota), using clinical data from the IPC‐Link discharge summary, assigned each patient an SOI score, and an ROM score based on age, primary diagnosis, and non‐operating room procedures.8 Both SOI and ROM are scored from 1 to 4, ranging from 1 for minor to 4 for extreme. We created dummy variables for the SOI and ROM categories, that is, variables for each score with a value of 1 if the SOI or ROM is that score and 0, otherwise. In each case, a score of 1 was the referent category. Dummy variables were created for each admission day of the week with Monday as the referent. Demographic variables and variables related to the patient condition were included to reduce any potential confounding arising from differences in patient populations across hospitals and hospitalist practice patterns. Admission day of the week has been shown to influence LOS and may influence FOC due to weekend scheduling within hospitalist practices.
Statistical Analysis
All analyses were performed using SAS (version 9.1). To reduce the influence of outliers on the model, observations with extreme values for LOS (defined as greater than 3 standard deviation [STD] from the mean) were truncated to 30 days. For pneumonia, the mean LOS was 7.85 days (STD 7.44) and all patients with LOS greater than 30 days were truncated to 30 days. For heart failure, the mean LOS was 5.88 days (STD 9.77) and all patients with LOS greater than 35 days were truncated to 35 days. Multivariable regression was performed using the negative binomial distribution. Negative binomial regression used as LOS is not normally distributed, but instead has a positive skew. Forward stepwise selection was performed separately for patients with each DRG using variables from the clinical database described in the Methods section. Categorical dummy variables were entered as a group. The final model contained all variables that were significant (P < 0.05).
Results
Table 1 reviews the demographics of patients with DRG 89 (PNA) and DRG 127 (HF). A large proportion of patients with both DRGs experienced no fragmentation in their physician care during hospitalization; 4152 patients with HF (46.3%) and 685 patients with PNA (35.8%) had visits from only 1 hospitalist throughout their hospital stay, for a FOC Index of 0%. The mean fragmentation level was 21.9% for pneumonia patients, with the mean number of hospitalists seen during the stay at 2.05. For heart failure patients, the mean fragmentation level was 18.3 % and a mean of 1.78 hospitalists seen (Table 1).
| DRG 89 (n = 1950), Mean (STD) | DRG 127 (n = 9026), Mean (STD) | |
|---|---|---|
| ||
| Age, years | 65.8 (18.6) | 71.4 (15.2)* |
| % Female | 49.7 | 51.7 |
| Number of secondary diagnoses | 5.6 (2.5) | 5.0 (2.3)* |
| Severity of Illness | 2.80 (0.57) | 1.943 (0.72)* |
| Risk of Mortality | 2.49 (0.84) | 1.81 (0.75)* |
| Fragmentation: percent of care by non‐primary hospitalist(s) | 21.9% (20.3) | 18.3% (19.9)* |
| Number of physicians seen during hospital stay | 2.05 (1.12) | 1.78 (0.94)* |
Table 2 presents the results of the regression analysis on LOS. The association between fragmentation and LOS, adjusted for demographics, case mix and day of admission, was similar for PNA and HF patients. We found an increase in LOS of 0.39 days for each 10% increase in fragmentation level for pneumonia. Other variables that significantly increased LOS for PNA were larger ROM score, Sunday admission and more discharge diagnoses. Similarly, for heart failure patients, there was an increase in LOS of 0.30 days for each 10% increase in fragmentation level. Other variables associated with a significantly increase in LOS for PNA were larger ROM score, larger SOI category, more discharge diagnoses, and age. Figures 1 and 2 demonstrate the results graphically for LOS in each condition. They show the mean adjusted LOS by fragmentation level. Adjusted LOS was calculated for each patient based on the final model. For example, the average adjusted LOS for PNA patients with a fragmentation level of 20% to 30% is 8.06 days and 9.16 days for patients with a fragmentation level of 30% to 40%.
| Pneumonia (DRG = 89), n = 1950 | Heart Failure (DRG = 127), n = 9026 | |
|---|---|---|
| ||
| Fragmentation | Additional 0.39 day for each 10% increase in fragmentation | Additional 0.30 day for each 10% increase in fragmentation |
| Adjustment variables in the model | Age, number of secondary diagnoses, severity of illness variables, risk of mortality variables | Age, gender, number of secondary diagnoses. severity of illness variables, risk of mortality variables |
Discussion
This study demonstrated that there was a statistically significant association between FOC by hospitalist physicians and LOS for patients with DRG 89 (PNA) and DRG 127 (HF). As the percentage of fragmentation increased, the LOS increased significantly.
There are many ways in which to define FOC in the context of hospitalist care of inpatients. We chose to use an index similar to the Usual Provider of Care Index (UPC) which is a standard way to measure continuity of care in the primary care setting.9 The UPC measures the proportion of time spent with the primary provider. In the inpatient setting, we defined continuity of care as the proportion of visits by the primary hospitalist (the physician assuming the greatest number of days of the patient's care). The FOC Index is simply 1 minus the continuity of care. There are other potential measures of FOC, such as the number of handoffs or the number of physicians. We selected our measure based on its following strengths: (1) it does not have the simultaneity problem of measures such as the number of doctors or the number of handoffs that leads to endogeneitya correlation between the error term and the independent variable that biases the coefficient. Endogeneity can occur when the outcome variable and the independent variable are jointly determined, in this case, that an additional day in the hospital increases the likelihood of having an additional handoff as well as an additional handoff increasing the likelihood of an additional day; (2) fragmentation patterns that lead to handoffs on the weekend that then return to the primary hospitalist may be very different from fragmentation patterns that lead to new physicians at each transfer; (3) It provides a good comparison to other models of care where community physicians provide care to their own patients and have an effective FOC index of 0. Further research should be performed looking at different measures that may capture other aspects of care fragmentation.
This is one of the first studies to directly explore the relationship between FOC and LOS. Previous studies in the hospitalist literature have explored the impact of variables on LOS in which FOC may have been an indirect influence. For example, one study found a 13% shorter LOS among academic hospitalists at a teaching hospital who worked on a block rotation compared to a group of community hospitalists with a schedule involving more patient handoffs.10 Although there is little literature on FOC among hospitalists, the literature on medical residency programs is informative. The amount of discontinuity and the number of housestaff‐to‐housestaff transfers of responsibility has increased dramatically since the institution of more stringent work‐hour restrictions by the Accreditation Council for Graduate Medical Education (ACGME) in 2003.11 Horwitz et al.12 found that after the institution of work‐hour regulations, there was an 11% increase in number of transfers of care for a hypothetical patient admitted from Monday until Friday. They noted that programs with a night‐float system had a statistically significant increase in transitions of care compared to residencies without night float. Studies on the impact of the ACGME regulations on LOS have been mixed. One study found that LOS was reduced, and that there was improved adherence to quality indicators.4 A recent study found that there was a 44% increase in the median LOS when Short Call admitting teams were involved.2
There are several limitations to the findings of this study. The largest potential limitation is interpreting the direction of causality between FOC and LOS. This was a concurrent control study. Because the study was not randomized, there is a risk of confounding variables. Admission day of the week was 1 variable of concern for confounding due to the existence of a significant relationship between admission day LOS and between admission day and FOC. We included admission day in our modeling process. The coefficient estimates on FOC were stable, changing less than 1% when day of admission was added to the model. The risk of temporal trends was minimized by studying 1‐year's worth of data. Although we looked at variables that were potentially relevant in all hospitalized patients, every hospital and hospitalist practice has its own unique features that may impact both LOS and FOC. For example, for some hospitals, bed capacity may impact these measures. In many hospitals, hospitalist work force shortages may impact these measures by affecting the extent to which patients are cared for by full‐time hospitalists vs. locums tenens physicians. The large number of facilities in the study mitigates the influence of any individual hospital's LOS and FOC tendencies.
If increased FOC does result in prolonged LOS, the question arises as to how this fragmentation can be decreased. Although no physician can guarantee presence continually throughout a patient's inpatient stay, there are scheduling methods that reduce fragmentation and maximize the odds of a patient being followed by a single clinician. For example, the longer the block of days that a hospitalist is scheduled, the fewer hospitalists will need to care for a patient. Many of the top DRGs for patients cared for by hospitalists have lengths of stay between 4 and 5 days.13 Therefore, any schedule that has a hospitalist on for at least four days at a time will increase the likelihood that the same hospitalist will care for many of the patients throughout their stay. In making schedules, the goals of clinical efficiency and physician satisfaction must be weighed against the potential risks to the quality of patient care. For instance, the use of one hospitalist as the admitting physician for all patients may increase efficiency, but will also increase fragmentation.
A factor that may influence the impact of FOC on LOS is the quality of patient handoffs. The Joint Commission instituted this as a national patient safety goal in 2006.14 This goal was based on a Joint Commission analysis that 70% of sentinel events were caused by communication breakdowns, half of these occurring during handoffs.15
In conclusion, this study explored the relationship between FOC in patients cared for by hospitalists and LOS, using an FOC index. For every 10% increase in fragmentation, the LOS went up by 0.39 days for pneumonia and 0.30 days for heart failure. By adjusting for many variables that may impact LOS due to higher severity or complexity of illness, there is an increased likelihood that the FOC may have a causative relationship with the prolonged LOS.
Copyright © 2010 Society of Hospital Medicine
Do post-discharge telephone calls to patients reduce the rate of complications?
Case
A 75-year-old male with history of diabetes and heart disease is discharged from the hospital after treatment for pneumonia. He has eight medications on his discharge list and is given two new prescriptions at discharge. He has a primary care provider but will not be able to see her until three weeks after discharge. Will a follow-up call decrease potential complications?
Overview
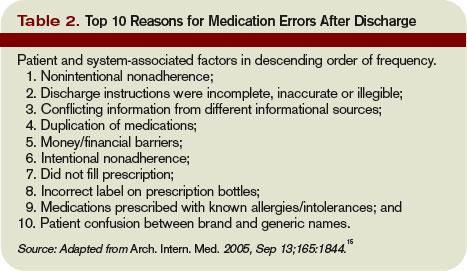
Medication errors are prevalent, especially during the transition period from discharge to follow-up with primary care physicians. There are more than 700,000 emergency department (ED) visits each year for adverse drug events with nearly 120,000 of these episodes resulting in hospitalization.1
The likelihood of an adverse drug event increases in patients using more than five medications and when there is a lack of understanding of how and why they are taking certain medications, scenarios common on hospital discharge.2 Studies evaluating effective means to reduce medication errors during transitions out of the hospital offer few solutions. One effective method, however, appears to be follow-up telephone calls.
Telephone calls have been looked at in multiple studies and usually are performed in the studies by nurses, nurse practitioners, or pharmacists and occur within days of discharge from the hospital. These calls offer a mechanism to provide answers to questions about their medical condition or medications.
Review of the Data
There is a wide range of studies evaluating the benefit of a post-discharge telephone call. Unfortunately, most of the data are of low methodological quality with low patient numbers and high risk of bias.3
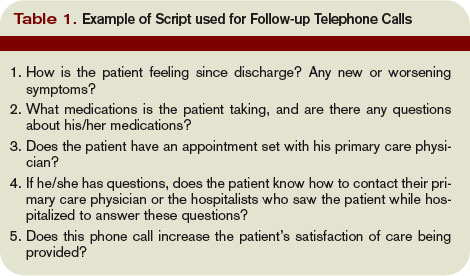
Much of the data are divided into subgroups of patients, including ED patients, cardiac patients, surgical patients, medicine patients, and other small groups. The end points also vary and examine areas such as patient satisfaction, reduction in medication errors, and effect on readmissions or repeat ED visits. The bulk of studies used a standardized script. These calls lasted only minutes, which could make it user-friendly, especially for a busy hospitalist’s schedule. Unfortunately, the effect of these interventions is mixed.
With ED patients, phone calls have been shown to be an effective means of communication between patients and physicians. In a study of 297 patients, the authors were only able to reach half the patients but still were able to identify medical problems needing referral or further intervention in 37% of the patients contacted.4 Another two studies revealed similar results with approximately 40% of the contacted patients requiring further clarification on their discharge instructions.5,6
Importantly, 95% of these patients felt the call was beneficial. Thus, more than one-third of patients discharged from an ED are likely to have problems and a follow-up telephone call offers an opportunity to intervene on these potential problems. Another ED study evaluated patients older than 75 and found a nurse liaison could effectively assess the complexity of a patient’s questions and appropriately advise them over the phone or triage them to the correct care provider for further care.7
Post-discharge follow-up telephone calls also can benefit patients discharged from the hospital. A recent paper reported that approximately 12% of patients develop new or worsening symptoms within a few days post-discharge and adverse drug events can occur in between 23% to 49% of people during this transition period.8-10
Another study evaluating resource use in heart failure patients found follow-up telephone calls significantly decreased the average number of hospital days over six months time and readmission rate at six months in the call group, as well as increased patient satisfaction.11
A randomized placebo-controlled trial evaluating follow-up calls from pharmacists to discharged medical patients found the call group patients were more satisfied with their post-discharge care. Additionally, there were less ED visits within 30 days of discharge in the call group compared to placebo or standard care.12
On the other hand, several studies have questioned the utility of follow-up telephone calls for improving transitions of care. A Stanford University group divided medical and surgical patients into three groups with one receiving routine follow-up calls, another requiring a patient-initiated call and a final group without any intervention and found there was no difference between these groups in regards to patient satisfaction or 30-day readmission rates.13
An outpatient trial completed at a South Dakota Veterans Affairs clinic also determined telephone calls had little effect on decreasing resources or hospital admissions.14
Although this study did not include inpatients, it demonstrates the fact that follow-up telephone calls may not be as helpful as shown in other trials and that more thorough and well-designed trials are needed to more definitively answer this question.
Back to the Case
The hospitalist makes a call to the patient to follow-up after he is discharged, and he says he is glad she called. He had questions about one of his medications that was discontinued while he was hospitalized and wants to know if he should restart it. He also says he is having low-grade fevers again and is not sure if he should come back in for evaluation.
The hospitalist is able to answer his questions about his medication list and instructs him to restart the metformin they had stopped while he was an inpatient. The hospitalist also is able to better explain what symptoms to be aware of and when the patient should come in for re-evaluation. The patient appreciates the five-minute call, and the hospitalist is glad she cleared up the patient’s confusion regarding his medications before a serious error or unnecessary readmission to the hospital occurred. TH
Dr. Moulds is a third-year internal medicine resident at the University of Colorado Denver. Dr. Epstein is director of medical affairs and clinical research at IPC-The Hospitalist Company.
References
- www.cdc.gov.
- Epstein K, Juarez E, Loya K, Gorman MJ, Singer A. Frequency of new or worsening symptoms in the post-hospitalization period. J Hosp Med. 2007 Mar;2(2):58-68.
- Mistiaen P, Poot E. Telephone follow-up, initiated by a hospital-based health professional, for post-discharge problems in patients discharged from hospital to home. Cochrane Database Syst Rev. 2006, Issue 4. Art. No.: CD004510. DOI:10.1002/14651858.CD004510.pub3.
- Shesser R, Smith M, Adams S, Walls R, Paxton M. The effectiveness of an organized follow-up system. Ann Emerg Med. 1986 Aug;15(8):911-915.
- Jones J, Clark W, Bradford J, Dougherty J. Efficacy of a telephone follow-up system in the emergency department. J Emerg Med. 1988 May-June;6(3):249-254.
- Jones JS, Young MS, LaFleur RA, Brown MD. Effectiveness of an organized follow-up system for elder patients released from the emergency department. Acad Emerg Med. 1997 Dec;4(12):1147-1152.
- Poncia HD, Ryan J, Carver M. Next day telephone follow up of the elderly: a needs assessment and critical incident monitoring tool for the accident and emergency department. J Accid Emerg Med. 2000 Sep;17(5):337-340.
- Kripalani S, Price M, Vigil V, Epstein K. Frequency and predictors of prescription-related issues after hospital discharge. J Hosp Med. 2008 Jan/Feb;3(1):12-19.
- Forster A, Murff H, Peterson J, Gandhi T, Bates D. Adverse drug events occurring following hospital discharge. J Gen Intern Med. 2005;20:317-323.
- Forster A, Murff H, Peterson J, Gandhi T, Bates D. The incidence and severity of adverse events affecting patients after discharge from the hospital. Ann Intern Med. 2003;138:161-167.
- Riegel B, Carlson B, Kopp Z, LePetri B, Glaser D, Unger A. Effect of a standardized nurse case-management telephone intervention on resource use in patients with chronic heart failure. Arch Intern Med. 2002 Mar 25;162(6):705-712.
- Dudas V, Bookwalter T, Kerr KM, Pantilat SZ. The impact of follow-up telephone calls to patients after hospitalization. Am J Med. 2001 Dec 21;111(9B):26S-30S.
- Bostrom J, Caldwell J, McGuire K, Everson D. Telephone follow-up after discharge from the hospital: does it make a difference? Appl Nurs Res. 1996 May;9(2):47-52.
- Welch HG, Johnson DJ, Edson R. Telephone care as an adjunct to routine medical follow-up. A negative randomized trial. Eff Clin Pract. 2000 May-June;3(3):123-130.
- Coleman E, Smith J, Raha D, Min S. Posthospital medication discrepancies. Arch Intern Med. 2005;165:1842-1847.
Case
A 75-year-old male with history of diabetes and heart disease is discharged from the hospital after treatment for pneumonia. He has eight medications on his discharge list and is given two new prescriptions at discharge. He has a primary care provider but will not be able to see her until three weeks after discharge. Will a follow-up call decrease potential complications?
Overview
Medication errors are prevalent, especially during the transition period from discharge to follow-up with primary care physicians. There are more than 700,000 emergency department (ED) visits each year for adverse drug events with nearly 120,000 of these episodes resulting in hospitalization.1
The likelihood of an adverse drug event increases in patients using more than five medications and when there is a lack of understanding of how and why they are taking certain medications, scenarios common on hospital discharge.2 Studies evaluating effective means to reduce medication errors during transitions out of the hospital offer few solutions. One effective method, however, appears to be follow-up telephone calls.
Telephone calls have been looked at in multiple studies and usually are performed in the studies by nurses, nurse practitioners, or pharmacists and occur within days of discharge from the hospital. These calls offer a mechanism to provide answers to questions about their medical condition or medications.
Review of the Data
There is a wide range of studies evaluating the benefit of a post-discharge telephone call. Unfortunately, most of the data are of low methodological quality with low patient numbers and high risk of bias.3
Much of the data are divided into subgroups of patients, including ED patients, cardiac patients, surgical patients, medicine patients, and other small groups. The end points also vary and examine areas such as patient satisfaction, reduction in medication errors, and effect on readmissions or repeat ED visits. The bulk of studies used a standardized script. These calls lasted only minutes, which could make it user-friendly, especially for a busy hospitalist’s schedule. Unfortunately, the effect of these interventions is mixed.
With ED patients, phone calls have been shown to be an effective means of communication between patients and physicians. In a study of 297 patients, the authors were only able to reach half the patients but still were able to identify medical problems needing referral or further intervention in 37% of the patients contacted.4 Another two studies revealed similar results with approximately 40% of the contacted patients requiring further clarification on their discharge instructions.5,6
Importantly, 95% of these patients felt the call was beneficial. Thus, more than one-third of patients discharged from an ED are likely to have problems and a follow-up telephone call offers an opportunity to intervene on these potential problems. Another ED study evaluated patients older than 75 and found a nurse liaison could effectively assess the complexity of a patient’s questions and appropriately advise them over the phone or triage them to the correct care provider for further care.7
Post-discharge follow-up telephone calls also can benefit patients discharged from the hospital. A recent paper reported that approximately 12% of patients develop new or worsening symptoms within a few days post-discharge and adverse drug events can occur in between 23% to 49% of people during this transition period.8-10
Another study evaluating resource use in heart failure patients found follow-up telephone calls significantly decreased the average number of hospital days over six months time and readmission rate at six months in the call group, as well as increased patient satisfaction.11
A randomized placebo-controlled trial evaluating follow-up calls from pharmacists to discharged medical patients found the call group patients were more satisfied with their post-discharge care. Additionally, there were less ED visits within 30 days of discharge in the call group compared to placebo or standard care.12
On the other hand, several studies have questioned the utility of follow-up telephone calls for improving transitions of care. A Stanford University group divided medical and surgical patients into three groups with one receiving routine follow-up calls, another requiring a patient-initiated call and a final group without any intervention and found there was no difference between these groups in regards to patient satisfaction or 30-day readmission rates.13
An outpatient trial completed at a South Dakota Veterans Affairs clinic also determined telephone calls had little effect on decreasing resources or hospital admissions.14
Although this study did not include inpatients, it demonstrates the fact that follow-up telephone calls may not be as helpful as shown in other trials and that more thorough and well-designed trials are needed to more definitively answer this question.
Back to the Case
The hospitalist makes a call to the patient to follow-up after he is discharged, and he says he is glad she called. He had questions about one of his medications that was discontinued while he was hospitalized and wants to know if he should restart it. He also says he is having low-grade fevers again and is not sure if he should come back in for evaluation.
The hospitalist is able to answer his questions about his medication list and instructs him to restart the metformin they had stopped while he was an inpatient. The hospitalist also is able to better explain what symptoms to be aware of and when the patient should come in for re-evaluation. The patient appreciates the five-minute call, and the hospitalist is glad she cleared up the patient’s confusion regarding his medications before a serious error or unnecessary readmission to the hospital occurred. TH
Dr. Moulds is a third-year internal medicine resident at the University of Colorado Denver. Dr. Epstein is director of medical affairs and clinical research at IPC-The Hospitalist Company.
References
- www.cdc.gov.
- Epstein K, Juarez E, Loya K, Gorman MJ, Singer A. Frequency of new or worsening symptoms in the post-hospitalization period. J Hosp Med. 2007 Mar;2(2):58-68.
- Mistiaen P, Poot E. Telephone follow-up, initiated by a hospital-based health professional, for post-discharge problems in patients discharged from hospital to home. Cochrane Database Syst Rev. 2006, Issue 4. Art. No.: CD004510. DOI:10.1002/14651858.CD004510.pub3.
- Shesser R, Smith M, Adams S, Walls R, Paxton M. The effectiveness of an organized follow-up system. Ann Emerg Med. 1986 Aug;15(8):911-915.
- Jones J, Clark W, Bradford J, Dougherty J. Efficacy of a telephone follow-up system in the emergency department. J Emerg Med. 1988 May-June;6(3):249-254.
- Jones JS, Young MS, LaFleur RA, Brown MD. Effectiveness of an organized follow-up system for elder patients released from the emergency department. Acad Emerg Med. 1997 Dec;4(12):1147-1152.
- Poncia HD, Ryan J, Carver M. Next day telephone follow up of the elderly: a needs assessment and critical incident monitoring tool for the accident and emergency department. J Accid Emerg Med. 2000 Sep;17(5):337-340.
- Kripalani S, Price M, Vigil V, Epstein K. Frequency and predictors of prescription-related issues after hospital discharge. J Hosp Med. 2008 Jan/Feb;3(1):12-19.
- Forster A, Murff H, Peterson J, Gandhi T, Bates D. Adverse drug events occurring following hospital discharge. J Gen Intern Med. 2005;20:317-323.
- Forster A, Murff H, Peterson J, Gandhi T, Bates D. The incidence and severity of adverse events affecting patients after discharge from the hospital. Ann Intern Med. 2003;138:161-167.
- Riegel B, Carlson B, Kopp Z, LePetri B, Glaser D, Unger A. Effect of a standardized nurse case-management telephone intervention on resource use in patients with chronic heart failure. Arch Intern Med. 2002 Mar 25;162(6):705-712.
- Dudas V, Bookwalter T, Kerr KM, Pantilat SZ. The impact of follow-up telephone calls to patients after hospitalization. Am J Med. 2001 Dec 21;111(9B):26S-30S.
- Bostrom J, Caldwell J, McGuire K, Everson D. Telephone follow-up after discharge from the hospital: does it make a difference? Appl Nurs Res. 1996 May;9(2):47-52.
- Welch HG, Johnson DJ, Edson R. Telephone care as an adjunct to routine medical follow-up. A negative randomized trial. Eff Clin Pract. 2000 May-June;3(3):123-130.
- Coleman E, Smith J, Raha D, Min S. Posthospital medication discrepancies. Arch Intern Med. 2005;165:1842-1847.