User login
Outcomes of Delayed ICU Transfer
Hospitalized patients who require transfer from medical wards to the intensive care unit (ICU) have high in‐hospital mortality, in some reports exceeding 55%.14 In a previous report in this journal, we found that while these unplanned ICU transfers occurred in only 4% of hospitalizations, they were present in nearly one‐quarter of fatal hospitalizations and were associated with substantial increases in resource utilization.4 For these reasons, interventions aimed at identifying and treating this high‐risk group have received considerable attention and have been proposed as measures of inpatient safety.2, 49
Notably, mortality among patients with unplanned ICU transfers exceeds mortality among patients admitted to the ICU directly from the emergency department (ED)a group traditionally considered to have the highest risk of death.13, 10 Previous single‐center studies suggest that increased mortality rates are present even among patients transferred within 24 hours of hospital admission, and reinforce the notion that earlier recognition of critical illness may result in improved outcomes.1113 However, these studies have been performed primarily in small cohorts of heterogeneous patients, and may obscure the independent effect of unplanned transfers on mortality and hamper efforts to use unplanned transfer rates as a metric of healthcare quality.1, 2, 4, 9
In this study, we evaluated early unplanned ICU transfers drawn from a cohort of 499,995 hospitalizations in an integrated healthcare delivery system. Using patient data, extracted from the automated electronic medical record, we matched unplanned transfer cases to patients directly admitted to the ICU and described the association between delayed ICU transfers and adverse outcomes.
METHODS
Setting and Participants
We performed a retrospective analysis of adult patient (age 18 years) hospitalizations at 21 Northern California Kaiser Permanente (KP) Medical Care Program hospitals between January 2007 and December 2009. This work expanded on our previous report of hospital stays from November 2006 to January 2008.4 The 21 study hospitals used the same electronic health information systems; databases captured admission, discharge, and bed history data. The use of these databases for research has been described in our previous study and other reports; hospital characteristics, unit staffing, and resource levels have also been detailed previously.4, 1417 This study was approved by the KP Institutional Review Board.
Identifying Unplanned Transfers
We evaluated patients with medical hospitalizationsdefined as those whose first hospital location was not in a surgical setting such as the operating room or post‐anesthesia recovery areawhose admission originated in the ED; patients admitted for surgery were removed because of significant differences in observed mortality (see Supporting Information Appendix Figure 1 and Appendix Table 1 in the online version of this article). Patients whose admission did not originate in the ED were excluded to eliminate confounding resulting from differences in preadmission care. We also excluded patients admitted for gynecological and pregnancy‐related care because of low hospital mortality.
Initial patient locations included the medical wards (wards); the transitional care unit (TCU); and the intensive care unit (ICU). Bed history data, based on time stamps and available for all patients, were used to track patient locations from the time of admission, defined as the first non‐ED hospital location, until discharge. Patient length of stay (LOS) was calculated at each location and for the entire hospitalization.
Transfers to the ICU after a patient's initial admission to the ward or TCU were termed unplanned (or delayed) ICU transfers; patients admitted from the ED to the ICU were termed direct ICU admit patients. Direct ICU admit patients were excluded from the unplanned transfer group even if they required a readmission to the ICU later in their hospital course. We focused on patients with unplanned ICU transfers early after hospitalization to identify those in whom prompt recognition and intervention could be effective; thus, our primary analyses were on patients with transfers within 24 hours of admission. In secondary analysis, we also evaluated patients with unplanned ICU transfers occurring within 48 hours after hospital admission.
Admission Severity of Illness
To account for severity of illness at admission, we used a predicted mortality measure developed at KP.14 This method strictly utilizes information available prior to hospital admissionincluding that from the ED; variables included age, gender, admitting diagnosis, and measures of laboratory test and comorbid disease burden. The method, derived using 259,669 KP hospitalizations, produced a c‐statistic of 0.88 for inpatient mortality; external validation, based on 188,724 hospitalizations in Ottawa, produced a c‐statistic of 0.92.14, 18
Admitting diagnoses were based on admission International Classification of Diseases, 9th revision (ICD‐9) codes, and grouped into 44 broad Primary Conditions based on pathophysiologic plausibility and mortality rates.14 The method also quantified each patient's physiologic derangement and preexisting disease burden based on automated laboratory and comorbidity measuresthe Laboratory Acute Physiology Score (LAPS) and the Comorbidity Point Score (COPS).14
In brief, the LAPS was derived from 14 possible test results obtained in the 24‐hour time period preceding hospitalization, including: anion gap; arterial pH, PaCO2, and PaO2; bicarbonate; serum levels of albumin, total bilirubin, creatinine, glucose, sodium, and troponin I; blood urea nitrogen; creatinine; hematocrit; and total white blood cell count.14 The COPS was calculated from each subject's inpatient and outpatient diagnoses, based on Diagnostic Cost Groups software,19 during the 12‐month period preceding hospitalization.14 Increasing LAPS and COPS values were associated with increases in hospital mortality; detailed information about the development, application, and validation are available in previous work.14, 18
Statistical Analysis
Evaluating excess adverse outcomes associated with unplanned transfers requires adequate control of confounding variables. Our approach to reduce confounding was multivariable case matchinga technique used for assessing treatment effects in observational data.20, 21 Patients with unplanned transfersidentified as caseswere matched with similar controls based on observed variables at the time of hospital admission.
We first matched patients with unplanned ICU transfers within 24 hours of hospital admission to direct ICU admit controls based on predicted in‐hospital mortality (to within 1%); age (by decade); gender; and admitting diagnosis. If a case was matched to multiple controls, we selected 1 control with the most similar admission characteristics (weekday or weekend admission and nursing shift). The risk of death associated with unplanned transfers was estimated using multivariable conditional logistic regression. In secondary analysis, we repeated this analysis only among case‐control pairs within the same hospital facilities.
To cross‐validate the results from multivariable matching techniques, we also performed mixed‐effects multivariable logistic regression including all early unplanned transfer patients and direct ICU admit patients, while adjusting for predicted hospital mortality, age, gender, admitting diagnosis, LAPS, COPS, weekend versus weekday admission, nursing shift, and hospital facility random effects. We repeated these same analyses where cases were defined as patients transferred to the ICU within 48 hours of hospitalization.
Unplanned Transfer Timing
Using bed history data, we identified the elapsed time from admission to unplanned transfer, and categorized patients in increments of elapsed time from admission to unplanned transfer. Time‐to‐unplanned transfer was summarized using Kaplan‐Meier curve.
All analyses were performed in Stata/IC 11.0 for Mac (StataCorp LP, College Station, TX). Continuous variables were reported as mean standard deviation (SD). Cohort comparisons were performed with analysis of variance (ANOVA). Categorical variables were summarized using frequencies and compared with chi‐squared testing. A P value <0.05 was considered statistically significant.
RESULTS
During the study period, 313,797 medical hospitalizations originated in the ED (Table 1). Overall, patients' mean age was 67 18 years; 53.7% were female. Patient characteristics differed significantly based on the need for ICU admission. For example, average LAPS was highest among patients admitted directly to the ICU and lowest among patients who never required ICU care (P < 0.01). Patients with unplanned ICU transfers during hospitalization had longer length of stay and higher hospital mortality than direct ICU admit patients (P < 0.01). Overall, more than 1 in 15 patients experienced an unplanned transfer to the ICU.
| Early Delayed ICU Transfer (by Elapsed Time Since Hospital Admission) | ||||
|---|---|---|---|---|
| Variable | Overall | Within 24 hr | Within 48 hr | Direct ICU Admit |
| ||||
| No. (%) | 313,797 | 6,369 (2.0) | 9,816 (3.1) | 29,929 (9.5) |
| Age* | 67 18 | 67 16 | 68 16 | 64 17 |
| Female* | 169,358 (53.7) | 3,125 (49.1) | 4,882 (49.7) | 14,488 (48.4) |
| Weekend admission* | 83,327 (26.6) | 1,783 (28.0) | 2,733 (27.8) | 8,152 (27.2) |
| Nursing shift at admission* | ||||
| Day (7 AM‐3 PM) | 65,303 (20.8) | 1,335 (21.0) | 2,112 (21.5) | 7,065 (23.6) |
| Evening (3 PM‐11 PM) | 155,037 (49.4) | 2,990 (47.0) | 4,691 (47.8) | 13,158 (44.0) |
| Night (11 PM‐7 AM) | 93,457 (29.8) | 2,044 (32.1) | 3,013 (30.7) | 9,706 (32.4) |
| Initial hospital location* | ||||
| Ward | 234,915 (82.8) | 5,177 (81.3) | 7,987 (81.4) | |
| Transitional care unit | 48,953 (17.2) | 1,192 (18.7) | 1,829 (18.6) | |
| LAPS* | 24 19 | 28 20 | 28 20 | 35 25 |
| COPS* | 98 67 | 105 70 | 106 70 | 99 71 |
| Length of stay (days) | 4.6 7.5 | 8.4 12.2 | 9.1 13.4 | 6.4 9.5 |
| In‐hospital mortality | 12,686 (4.0) | 800 (12.6) | 1,388 (14.1) | 3,602 (12.0) |
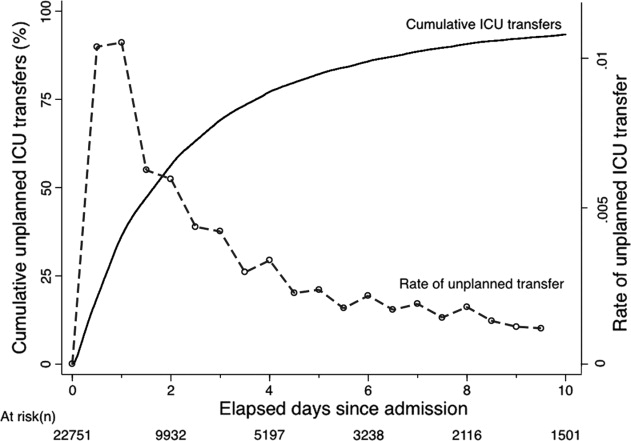
The majority of unplanned transfers occurred within the first 48 hours of hospitalization (57.6%, Figure 1); nearly 80% occurred within the first 4 days. The rate of unplanned transfer peaked within 24 hours of hospital admission and decreased gradually as elapsed hospital LOS increased (Figure 1). While most patients experienced a single unplanned ICU transfer, 12.7% required multiple transfers to the ICU throughout their hospitalization.
Multivariable case matching between unplanned transfer cases within 24 hours of admission and direct ICU admit controls resulted in 5839 (92%) case‐control pairs (Table 2). Matched pairs were most frequently admitted with diagnoses in Primary Condition groups that included respiratory infections and pneumonia (15.6%); angina, acute myocardial infarction (AMI), and heart failure (15.6%); or gastrointestinal bleeding (13.8%).
| ICU Cohorts (by Elapsed Time to Transfer Since Hospital Admission) | ||||
|---|---|---|---|---|
| Within 24 hr (n = 5,839) | Within 48 hr (n = 8,976) | |||
| Delayed ICU Transfer (Case) | Direct ICU Admit (Control) | Delayed ICU Transfer (Case) | Direct ICU Admit (Control) | |
| ||||
| Age | 67 16 | 66 16 | 67 16 | 67 16 |
| Female | 2,868 (49.1) | 2,868 (49.1) | 4,477 (49.9) | 4,477 (49.9) |
| Admitting diagnosis | ||||
| Pneumonia | 911 (15.6) | 911 (15.6) | 1,526 (17.0) | 1,526 (17.0) |
| Heart failure or MI | 909 (15.6) | 909 (15.6) | 1,331 (14.8) | 1,331 (14.8) |
| Gastrointestinal bleeding | 806 (13.8) | 806 (13.8) | 1,191 (13.3) | 1,191 (13.3) |
| Infections (including sepsis) | 295 (5.1) | 295 (5.1) | 474 (5.3) | 474 (5.3) |
| Outcomes | ||||
| Length of stay (days)* | 8 12 | 6 9 | 9 13 | 6 9 |
| In‐hospital mortality* | 678 (11.6) | 498 (8.5) | 1,181 (13.2) | 814 (9.1) |
In‐hospital mortality was significantly higher among cases (11.6%) than among ICU controls (8.5%, P < 0.001); mean LOS was also longer among cases (8 12 days) than among controls (6 9 days, P < 0.001). Unplanned transfer cases were at an increased odds of death when compared with ICU controls (adjusted odds ratio [OR], 1.44; 95% confidence interval [CI], 1.26‐1.64; P < 0.001); they also had a significantly higher observed‐to‐expected mortality ratio. When cases and controls were matched by hospital facility, the number of case‐control pairs decreased (2949 pairs; 42% matching frequency) but the odds of death was of similar magnitude (OR, 1.43; 95% CI, 1.21‐1.68; P < 0.001). Multivariable mixed‐effects logistic regression including all early unplanned transfer and direct ICU admit patients produced an effect size of similar magnitude (OR, 1.37; 95% CI, 1.24‐1.50; P < 0.001).
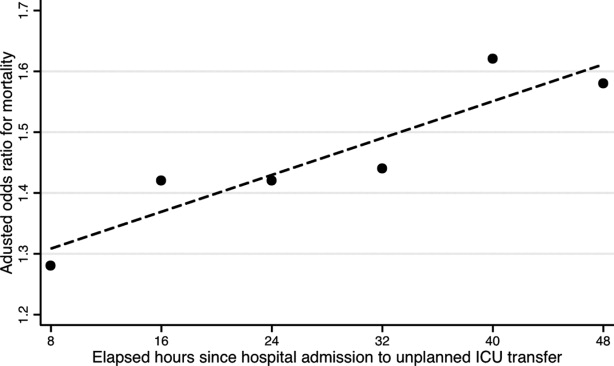
Results were similar when cases were limited to patients with transfers within 12 hours of admission; mortality was 10.9% among cases and 9.1% among controls (P = 0.02). When including patients with unplanned transfers within 48 hours of hospital admission, the difference in mortality between cases and controls increased (13.2% vs 9.1%, P < 0.001). The odds of death among patients with unplanned transfers increased as the elapsed time between admission and ICU transfer lengthened (Figure 2); the adjusted OR was statistically significant at each point between 8 and 48 hours.
When stratified by admitting diagnosis groups, cases with unplanned transfers within the first 48 hours had increased mortality compared with matched controls in some categories (Table 3). For example, for patients in the respiratory infection and pneumonia group, mortality was 16.8% among unplanned transfer cases and 13.0% among early matched ICU controls (P < 0.01). A similar pattern was present in groups including: gastrointestinal bleeding, chronic obstructive pulmonary disease (COPD) exacerbation, and seizure groups (Table 3). However, for patients with AMI alone, mortality was 5.0% among cases and 3.7% among matched controls (P = 0.12). Patients with sepsis had a mortality rate of 15.2% among cases and 20.8% among matched controls (P = 0.07). Similarly, patients with stroke had a mortality rate of 12.4% among unplanned transfer cases and 11.4% in the matched controls (P = 0.54).
| Primary Condition Group | Mortality in ICU Case‐Control Cohorts, No. (%) | |||
|---|---|---|---|---|
| Within 24 hr | Within 48 hr | |||
| Delayed ICU Transfer (Case) | Direct ICU Admit (Control) | Delayed ICU Transfer (Case) | Direct ICU Admit (Control) | |
| ||||
| Respiratory infections | 143 (15.7) | 126 (13.8) | 493 (16.8) | 380 (13.0) |
| Angina, heart failure, or MI | 60 (6.6) | 41 (4.5) | 324 (7.7) | 152 (3.6) |
| Acute MI alone | 16 (5.7) | 17 (6.1) | 82 (5.0) | 61 (3.7) |
| Gastrointestinal bleeding | 96 (11.9) | 55 (6.8) | 549 (19.3) | 188 (6.6) |
| Infections including sepsis | 20 (9.8) | 52 (11.2) | 228 (14.8) | 220 (14.2) |
| Sepsis alone | 32 (18.9) | 31 (18.3) | 123 (15.2) | 168 (20.8) |
| COPD exacerbation | 20 (9.8) | 12 (5.9) | 74 (10.8) | 43 (6.3) |
| Stroke | 18 (10.2) | 19 (10.8) | 77 (12.4) | 71 (11.4) |
| Seizure | 21 (8.6) | 9 (3.7) | 68 (7.1) | 34 (3.6) |
DISCUSSION
This study found that unplanned ICU transfers were common among medical patients, occurring in 5% of all hospitalizations originating in the ED. The majority of unplanned transfers occurred within 48 hours of admission; the rate of ICU transfers peaked within 24 hours after hospitalization. Compared with patients admitted directly from the ED to the ICU, those transferred early after admission had significantly increased mortality; for example, patients transferred within 24 hours were at a 44% increased odds of hospital death. The adverse outcomes associated with unplanned transfers varied considerably by admission diagnosis subgroups.
Our findings confirm previous reports of increased mortality among patients with unplanned ICU transfers. Escarce and Kelley reported that patients admitted to the ICU from non‐ED locationsincluding wards, intermediate care units, and other hospitalswere at an increased risk of hospital death.1 Multiple subsequent studies have confirmed the increased mortality among patients with unplanned transfers.24, 10, 13, 22, 23 We previously evaluated patients who required a transfer to any higher level of care and reported an observed‐to‐expected mortality ratio of 2.93.4
Fewer studies, however, have evaluated the association between the timing of unplanned transfers and inpatient outcomes; previous small reports suggest that delays in ICU transfer adversely affect mortality and length of stay.12, 13, 24 Parkhe et al. compared 99 direct ICU admit patients with 23 who experienced early unplanned transfers; mortality at 30 days was significantly higher among patients with unplanned transfers.13 The current multifacility study included considerably more patients and confirmed an in‐hospital mortality gapalbeit a smaller onebetween patients with early transfers and those directly admitted to the ICU.
We focused on unplanned transfers during the earliest phase of hospitalization to identify patients who might benefit from improved recognition of, and intervention for, impending critical illness. We found that even patients requiring transfers within 8 hours of hospital admission were at an increased risk of death. Bapoje et al. recently reported that as many as 80% of early unplanned transfers were preventable and that most resulted from inappropriate admission triage.11 Together, these findings suggest that heightened attention to identifying such patients at admission or within the first day of hospitalizationwhen the rates of unplanned transfers peakis critical.
Several important limitations should be recognized in interpreting these results. First, this study was not designed to specifically identify the reasons for unplanned transfers, limiting our ability to characterize episodes in which timely care could have prevented excess mortality. Notably, while previous work suggests that many early unplanned transfers might be prevented with appropriate triage, it is likely that some excess deaths are not preventable even if every patient could be admitted to the ICU directly.
We were able to characterize patient outcomes by admitting diagnoses. Patients admitted for pneumonia and respiratory infection, gastrointestinal bleeding, COPD exacerbation, or seizures demonstrated excess mortality compared with matched ICU controls, while those with AMI, sepsis, and stroke did not. It is possible that differences in diagnosis‐specific excess mortality resulted from increasing adherence to well‐defined practice guidelines for specific high‐risk conditions.2527 For example, international awareness campaigns for the treatment of sepsis, AMI, and strokeSurviving Sepsis, Door‐to‐Balloon, and F.A.S.T.emphasize early interventions to minimize morbidity and mortality.
Second, the data utilized in this study were based on automated variables extracted from the electronic medical record. Mortality prediction models based on automated variables have demonstrated excellent performance among ICU and non‐ICU populations14, 18, 28; however, the inclusion of additional data (eg, vital signs or neurological status) would likely improve baseline risk adjustment.5, 10, 2931 Multiple studies have demonstrated that vital signs and clinician judgment can predict patients at an increased risk of deterioration.5, 10, 2931 Such data might also provide insight into residual factors that influenced clinicians' decisions to triage patients to an ICU versus non‐ICU admissiona focus area of our ongoing research efforts. Utilizing electronically available data, however, facilitated the identification of a cohort of patients far larger than that in prior studies. Where previous work has also been limited by substantial variability in baseline characteristics among study subjects,1, 2, 12, 13 our large sample produced a high percentage of multivariable case matches.
Third, we chose to match patients with a severity of illness index based on variables available at the time of hospital admission. While this mortality prediction model has demonstrated excellent performance in internal and external populations,14, 18 it is calibrated for general inpatient, rather than critically ill, populations. It remains possible that case matching with ICU‐specific severity of illness scores might alter matching characteristics, however, previous studies suggest that severity of illness, as measured by these scores, is comparable between direct ICU admits and early ICU transfers.13 Importantly, our matching procedure avoided the potential confounding known to exist with the use of prediction models based on discharge or intra‐hospitalization data.32, 33
Finally, while we were able to evaluate unplanned transfer timing in a multifacility sample, all patient care occurred within a large integrated healthcare delivery system. The overall observed mortality in our study was lower than that reported in prior studies which considered more limited patient cohorts.1, 2, 12, 13, 22 Thus, differences in patient case‐mix or ICU structure must be considered when applying our results to other healthcare delivery systems.
This hypothesis‐generating study, based on a large, multifacility sample of hospitalizations, suggests several areas of future investigation. Future work should detail specific aspects of care among patients with unplanned transfer, including: evaluating the structures and processes involved in triage decisions, measuring the effects on mortality through implementation of interventions (eg, rapid response teams or diagnosis‐specific treatment protocols), and defining the causes and risk factors for unplanned transfers by elapsed time.
In conclusion, the risk of an unplanned ICU transfera common event among hospitalized patientsis highest within 24 hours of hospitalization. Patients with early unplanned transfers have increased mortality and length of stay compared to those admitted directly to the ICU. Even patients transferred to the ICU within 8 hours of hospital admission are at an increased risk of death when compared with those admitted directly. Substantial variability in unplanned transfer outcomes exists based on admitting diagnoses. Future research should characterize unplanned transfers in greater detail with the goal of identifying patients that would benefit from improved triage and early ICU transfer.
- ,.Admission source to the medical intensive care unit predicts hospital death independent of APACHE II score.JAMA.1990;264(18):2389–2394.
- ,,,,,.Unplanned admission to intensive care after emergency hospitalisation: risk factors and development of a nomogram for individualising risk.Resuscitation.2009;80(2):224–230.
- ,.Outcome of intensive care patients in a group of British intensive care units.Crit Care Med.1998;26(8):1337–1345.
- ,,,,,.Intra‐hospital transfers to a higher level of care: contribution to total hospital and intensive care unit (ICU) mortality and length of stay (LOS).J Hosp Med.2010;6(2):74–80.
- ,.Medical patients at high risk for catastrophic deterioration.Crit Care Med.1987;15(5):510–515.
- ,,, et al.Introduction of the medical emergency team (MET) system: a cluster‐randomised controlled trial.Lancet.2005;365(9477):2091–2097.
- ,,, et al.Effect of a rapid response team on hospital‐wide mortality and code rates outside the ICU in a children's hospital.JAMA.2007;298(19):2267–2274.
- ,,,,,.Validity of unplanned admission to an intensive care unit as a measure of patient safety in surgical patients.Anesthesiology.2005;103(6):1121–1129.
- ,,,.The 100,000 lives campaign: setting a goal and a deadline for improving health care quality.JAMA.2006;295(3):324–327.
- ,,, et al.Duration of life‐threatening antecedents prior to intensive care admission.Intensive Care Med.2002;28(11):1629–1634.
- ,,,.Unplanned transfers to a medical intensive care unit: causes and relationship to preventable errors in care.J Hosp Med.2011;6(2):68–72.
- ,,,,.Inpatient transfers to the intensive care unit: delays are associated with increased mortality and morbidity.J Gen Intern Med.2003;18(2):77–83.
- ,,,.Outcome of emergency department patients with delayed admission to an intensive care unit.Emerg Med (Fremantle).2002;14(1):50–57.
- ,,,,,.Risk‐adjusting hospital inpatient mortality using automated inpatient, outpatient, and laboratory databases.Med Care.2008;46(3):232–239.
- ,,, et al.Risk adjusting community‐acquired pneumonia hospital outcomes using automated databases.Am J Manag Care.2008;14(3):158–166.
- .Linking automated databases for research in managed care settings.Ann Intern Med.1997;127(8 pt 2):719–724.
- ,,, et al.Anticoagulation therapy for stroke prevention in atrial fibrillation: how well do randomized trials translate into clinical practice?JAMA.2003;290(20):2685–2692.
- ,,,.The Kaiser Permanente inpatient risk adjustment methodology was valid in an external patient population.J Clin Epidemiol.2009;63(7):798–803.
- ,.Refinements to the diagnostic cost group (DCG) model.Inquiry.1995;32(4):418–429.
- ,.Excess length of stay, charges, and mortality attributable to medical injuries during hospitalization.JAMA.2003;290(14):1868–1874.
- .Optimal matching in observational studies.J Am Stat Assoc.1989;84:1024–1032.
- ,,,.Admissions to intensive care units from emergency departments: a descriptive study.Emerg Med J.2005;22(6):423–428.
- ,,,.Using administrative data to develop a nomogram for individualising risk of unplanned admission to intensive care.Resuscitation.2008;79(2):241–248.
- ,,,.Unplanned intensive care unit transfers: a useful tool to improve quality of care [abstract]. In: Hospital Medicine 2010 abstract booklet. Society of Hospital Medicine 2010 Annual Meeting, April 9–11, 2010, Washington, DC;2010:10–11.
- ,,, et al.Surviving Sepsis Campaign: international guidelines for management of severe sepsis and septic shock: 2008.Crit Care Med.2008;36(1):296–327.
- ,,, et al.2009 Focused Updates: ACC/AHA Guidelines for the Management of Patients With ST‐Elevation Myocardial Infarction (updating the 2004 Guideline and 2007 Focused Update) and ACC/AHA/SCAI Guidelines on Percutaneous Coronary Intervention (updating the 2005 Guideline and 2007 Focused Update): a report of the American College of Cardiology Foundation/American Heart Association Task Force on Practice Guidelines.Circulation.2009;120(22):2271–2306.
- ,,, et al.Translating evidence into practice: a decade of efforts by the American Heart Association/American Stroke Association to reduce death and disability due to stroke: a presidential advisory from the American Heart Association/American Stroke Association.Stroke.2010;41(5):1051–1065.
- ,,, et al.Veterans Affairs intensive care unit risk adjustment model: validation, updating, recalibration.Crit Care Med.2008;36(4):1031–1042.
- ,,, et al.Recommended guidelines for monitoring, reporting, and conducting research on medical emergency team, outreach, and rapid response systems: an Utstein‐style scientific statement: a scientific statement from the International Liaison Committee on Resuscitation (American Heart Association, Australian Resuscitation Council, European Resuscitation Council, Heart and Stroke Foundation of Canada, InterAmerican Heart Foundation, Resuscitation Council of Southern Africa, and the New Zealand Resuscitation Council); the American Heart Association Emergency Cardiovascular Care Committee; the Council on Cardiopulmonary, Perioperative, and Critical Care; and the Interdisciplinary Working Group on Quality of Care and Outcomes Research.Circulation.2007;116(21):2481–2500.
- ,,,,,.Realizing the potential of clinical judgment: a real‐time strategy for predicting outcomes and cost for medical inpatients.Am J Med.2000;109(3):189–195.
- ,,.Physiological values and procedures in the 24 h before ICU admission from the ward.Anaesthesia.1999;54(6):529–534.
- ,,,,,.Predicting who dies depends on how severity is measured: implications for evaluating patient outcomes.Ann Intern Med.1995;123(10):763–770.
- ,,, et al.Enhancement of claims data to improve risk adjustment of hospital mortality.JAMA.2007;297(1):71–76.
Hospitalized patients who require transfer from medical wards to the intensive care unit (ICU) have high in‐hospital mortality, in some reports exceeding 55%.14 In a previous report in this journal, we found that while these unplanned ICU transfers occurred in only 4% of hospitalizations, they were present in nearly one‐quarter of fatal hospitalizations and were associated with substantial increases in resource utilization.4 For these reasons, interventions aimed at identifying and treating this high‐risk group have received considerable attention and have been proposed as measures of inpatient safety.2, 49
Notably, mortality among patients with unplanned ICU transfers exceeds mortality among patients admitted to the ICU directly from the emergency department (ED)a group traditionally considered to have the highest risk of death.13, 10 Previous single‐center studies suggest that increased mortality rates are present even among patients transferred within 24 hours of hospital admission, and reinforce the notion that earlier recognition of critical illness may result in improved outcomes.1113 However, these studies have been performed primarily in small cohorts of heterogeneous patients, and may obscure the independent effect of unplanned transfers on mortality and hamper efforts to use unplanned transfer rates as a metric of healthcare quality.1, 2, 4, 9
In this study, we evaluated early unplanned ICU transfers drawn from a cohort of 499,995 hospitalizations in an integrated healthcare delivery system. Using patient data, extracted from the automated electronic medical record, we matched unplanned transfer cases to patients directly admitted to the ICU and described the association between delayed ICU transfers and adverse outcomes.
METHODS
Setting and Participants
We performed a retrospective analysis of adult patient (age 18 years) hospitalizations at 21 Northern California Kaiser Permanente (KP) Medical Care Program hospitals between January 2007 and December 2009. This work expanded on our previous report of hospital stays from November 2006 to January 2008.4 The 21 study hospitals used the same electronic health information systems; databases captured admission, discharge, and bed history data. The use of these databases for research has been described in our previous study and other reports; hospital characteristics, unit staffing, and resource levels have also been detailed previously.4, 1417 This study was approved by the KP Institutional Review Board.
Identifying Unplanned Transfers
We evaluated patients with medical hospitalizationsdefined as those whose first hospital location was not in a surgical setting such as the operating room or post‐anesthesia recovery areawhose admission originated in the ED; patients admitted for surgery were removed because of significant differences in observed mortality (see Supporting Information Appendix Figure 1 and Appendix Table 1 in the online version of this article). Patients whose admission did not originate in the ED were excluded to eliminate confounding resulting from differences in preadmission care. We also excluded patients admitted for gynecological and pregnancy‐related care because of low hospital mortality.
Initial patient locations included the medical wards (wards); the transitional care unit (TCU); and the intensive care unit (ICU). Bed history data, based on time stamps and available for all patients, were used to track patient locations from the time of admission, defined as the first non‐ED hospital location, until discharge. Patient length of stay (LOS) was calculated at each location and for the entire hospitalization.
Transfers to the ICU after a patient's initial admission to the ward or TCU were termed unplanned (or delayed) ICU transfers; patients admitted from the ED to the ICU were termed direct ICU admit patients. Direct ICU admit patients were excluded from the unplanned transfer group even if they required a readmission to the ICU later in their hospital course. We focused on patients with unplanned ICU transfers early after hospitalization to identify those in whom prompt recognition and intervention could be effective; thus, our primary analyses were on patients with transfers within 24 hours of admission. In secondary analysis, we also evaluated patients with unplanned ICU transfers occurring within 48 hours after hospital admission.
Admission Severity of Illness
To account for severity of illness at admission, we used a predicted mortality measure developed at KP.14 This method strictly utilizes information available prior to hospital admissionincluding that from the ED; variables included age, gender, admitting diagnosis, and measures of laboratory test and comorbid disease burden. The method, derived using 259,669 KP hospitalizations, produced a c‐statistic of 0.88 for inpatient mortality; external validation, based on 188,724 hospitalizations in Ottawa, produced a c‐statistic of 0.92.14, 18
Admitting diagnoses were based on admission International Classification of Diseases, 9th revision (ICD‐9) codes, and grouped into 44 broad Primary Conditions based on pathophysiologic plausibility and mortality rates.14 The method also quantified each patient's physiologic derangement and preexisting disease burden based on automated laboratory and comorbidity measuresthe Laboratory Acute Physiology Score (LAPS) and the Comorbidity Point Score (COPS).14
In brief, the LAPS was derived from 14 possible test results obtained in the 24‐hour time period preceding hospitalization, including: anion gap; arterial pH, PaCO2, and PaO2; bicarbonate; serum levels of albumin, total bilirubin, creatinine, glucose, sodium, and troponin I; blood urea nitrogen; creatinine; hematocrit; and total white blood cell count.14 The COPS was calculated from each subject's inpatient and outpatient diagnoses, based on Diagnostic Cost Groups software,19 during the 12‐month period preceding hospitalization.14 Increasing LAPS and COPS values were associated with increases in hospital mortality; detailed information about the development, application, and validation are available in previous work.14, 18
Statistical Analysis
Evaluating excess adverse outcomes associated with unplanned transfers requires adequate control of confounding variables. Our approach to reduce confounding was multivariable case matchinga technique used for assessing treatment effects in observational data.20, 21 Patients with unplanned transfersidentified as caseswere matched with similar controls based on observed variables at the time of hospital admission.
We first matched patients with unplanned ICU transfers within 24 hours of hospital admission to direct ICU admit controls based on predicted in‐hospital mortality (to within 1%); age (by decade); gender; and admitting diagnosis. If a case was matched to multiple controls, we selected 1 control with the most similar admission characteristics (weekday or weekend admission and nursing shift). The risk of death associated with unplanned transfers was estimated using multivariable conditional logistic regression. In secondary analysis, we repeated this analysis only among case‐control pairs within the same hospital facilities.
To cross‐validate the results from multivariable matching techniques, we also performed mixed‐effects multivariable logistic regression including all early unplanned transfer patients and direct ICU admit patients, while adjusting for predicted hospital mortality, age, gender, admitting diagnosis, LAPS, COPS, weekend versus weekday admission, nursing shift, and hospital facility random effects. We repeated these same analyses where cases were defined as patients transferred to the ICU within 48 hours of hospitalization.
Unplanned Transfer Timing
Using bed history data, we identified the elapsed time from admission to unplanned transfer, and categorized patients in increments of elapsed time from admission to unplanned transfer. Time‐to‐unplanned transfer was summarized using Kaplan‐Meier curve.
All analyses were performed in Stata/IC 11.0 for Mac (StataCorp LP, College Station, TX). Continuous variables were reported as mean standard deviation (SD). Cohort comparisons were performed with analysis of variance (ANOVA). Categorical variables were summarized using frequencies and compared with chi‐squared testing. A P value <0.05 was considered statistically significant.
RESULTS
During the study period, 313,797 medical hospitalizations originated in the ED (Table 1). Overall, patients' mean age was 67 18 years; 53.7% were female. Patient characteristics differed significantly based on the need for ICU admission. For example, average LAPS was highest among patients admitted directly to the ICU and lowest among patients who never required ICU care (P < 0.01). Patients with unplanned ICU transfers during hospitalization had longer length of stay and higher hospital mortality than direct ICU admit patients (P < 0.01). Overall, more than 1 in 15 patients experienced an unplanned transfer to the ICU.
| Early Delayed ICU Transfer (by Elapsed Time Since Hospital Admission) | ||||
|---|---|---|---|---|
| Variable | Overall | Within 24 hr | Within 48 hr | Direct ICU Admit |
| ||||
| No. (%) | 313,797 | 6,369 (2.0) | 9,816 (3.1) | 29,929 (9.5) |
| Age* | 67 18 | 67 16 | 68 16 | 64 17 |
| Female* | 169,358 (53.7) | 3,125 (49.1) | 4,882 (49.7) | 14,488 (48.4) |
| Weekend admission* | 83,327 (26.6) | 1,783 (28.0) | 2,733 (27.8) | 8,152 (27.2) |
| Nursing shift at admission* | ||||
| Day (7 AM‐3 PM) | 65,303 (20.8) | 1,335 (21.0) | 2,112 (21.5) | 7,065 (23.6) |
| Evening (3 PM‐11 PM) | 155,037 (49.4) | 2,990 (47.0) | 4,691 (47.8) | 13,158 (44.0) |
| Night (11 PM‐7 AM) | 93,457 (29.8) | 2,044 (32.1) | 3,013 (30.7) | 9,706 (32.4) |
| Initial hospital location* | ||||
| Ward | 234,915 (82.8) | 5,177 (81.3) | 7,987 (81.4) | |
| Transitional care unit | 48,953 (17.2) | 1,192 (18.7) | 1,829 (18.6) | |
| LAPS* | 24 19 | 28 20 | 28 20 | 35 25 |
| COPS* | 98 67 | 105 70 | 106 70 | 99 71 |
| Length of stay (days) | 4.6 7.5 | 8.4 12.2 | 9.1 13.4 | 6.4 9.5 |
| In‐hospital mortality | 12,686 (4.0) | 800 (12.6) | 1,388 (14.1) | 3,602 (12.0) |
The majority of unplanned transfers occurred within the first 48 hours of hospitalization (57.6%, Figure 1); nearly 80% occurred within the first 4 days. The rate of unplanned transfer peaked within 24 hours of hospital admission and decreased gradually as elapsed hospital LOS increased (Figure 1). While most patients experienced a single unplanned ICU transfer, 12.7% required multiple transfers to the ICU throughout their hospitalization.
Multivariable case matching between unplanned transfer cases within 24 hours of admission and direct ICU admit controls resulted in 5839 (92%) case‐control pairs (Table 2). Matched pairs were most frequently admitted with diagnoses in Primary Condition groups that included respiratory infections and pneumonia (15.6%); angina, acute myocardial infarction (AMI), and heart failure (15.6%); or gastrointestinal bleeding (13.8%).
| ICU Cohorts (by Elapsed Time to Transfer Since Hospital Admission) | ||||
|---|---|---|---|---|
| Within 24 hr (n = 5,839) | Within 48 hr (n = 8,976) | |||
| Delayed ICU Transfer (Case) | Direct ICU Admit (Control) | Delayed ICU Transfer (Case) | Direct ICU Admit (Control) | |
| ||||
| Age | 67 16 | 66 16 | 67 16 | 67 16 |
| Female | 2,868 (49.1) | 2,868 (49.1) | 4,477 (49.9) | 4,477 (49.9) |
| Admitting diagnosis | ||||
| Pneumonia | 911 (15.6) | 911 (15.6) | 1,526 (17.0) | 1,526 (17.0) |
| Heart failure or MI | 909 (15.6) | 909 (15.6) | 1,331 (14.8) | 1,331 (14.8) |
| Gastrointestinal bleeding | 806 (13.8) | 806 (13.8) | 1,191 (13.3) | 1,191 (13.3) |
| Infections (including sepsis) | 295 (5.1) | 295 (5.1) | 474 (5.3) | 474 (5.3) |
| Outcomes | ||||
| Length of stay (days)* | 8 12 | 6 9 | 9 13 | 6 9 |
| In‐hospital mortality* | 678 (11.6) | 498 (8.5) | 1,181 (13.2) | 814 (9.1) |
In‐hospital mortality was significantly higher among cases (11.6%) than among ICU controls (8.5%, P < 0.001); mean LOS was also longer among cases (8 12 days) than among controls (6 9 days, P < 0.001). Unplanned transfer cases were at an increased odds of death when compared with ICU controls (adjusted odds ratio [OR], 1.44; 95% confidence interval [CI], 1.26‐1.64; P < 0.001); they also had a significantly higher observed‐to‐expected mortality ratio. When cases and controls were matched by hospital facility, the number of case‐control pairs decreased (2949 pairs; 42% matching frequency) but the odds of death was of similar magnitude (OR, 1.43; 95% CI, 1.21‐1.68; P < 0.001). Multivariable mixed‐effects logistic regression including all early unplanned transfer and direct ICU admit patients produced an effect size of similar magnitude (OR, 1.37; 95% CI, 1.24‐1.50; P < 0.001).
Results were similar when cases were limited to patients with transfers within 12 hours of admission; mortality was 10.9% among cases and 9.1% among controls (P = 0.02). When including patients with unplanned transfers within 48 hours of hospital admission, the difference in mortality between cases and controls increased (13.2% vs 9.1%, P < 0.001). The odds of death among patients with unplanned transfers increased as the elapsed time between admission and ICU transfer lengthened (Figure 2); the adjusted OR was statistically significant at each point between 8 and 48 hours.
When stratified by admitting diagnosis groups, cases with unplanned transfers within the first 48 hours had increased mortality compared with matched controls in some categories (Table 3). For example, for patients in the respiratory infection and pneumonia group, mortality was 16.8% among unplanned transfer cases and 13.0% among early matched ICU controls (P < 0.01). A similar pattern was present in groups including: gastrointestinal bleeding, chronic obstructive pulmonary disease (COPD) exacerbation, and seizure groups (Table 3). However, for patients with AMI alone, mortality was 5.0% among cases and 3.7% among matched controls (P = 0.12). Patients with sepsis had a mortality rate of 15.2% among cases and 20.8% among matched controls (P = 0.07). Similarly, patients with stroke had a mortality rate of 12.4% among unplanned transfer cases and 11.4% in the matched controls (P = 0.54).
| Primary Condition Group | Mortality in ICU Case‐Control Cohorts, No. (%) | |||
|---|---|---|---|---|
| Within 24 hr | Within 48 hr | |||
| Delayed ICU Transfer (Case) | Direct ICU Admit (Control) | Delayed ICU Transfer (Case) | Direct ICU Admit (Control) | |
| ||||
| Respiratory infections | 143 (15.7) | 126 (13.8) | 493 (16.8) | 380 (13.0) |
| Angina, heart failure, or MI | 60 (6.6) | 41 (4.5) | 324 (7.7) | 152 (3.6) |
| Acute MI alone | 16 (5.7) | 17 (6.1) | 82 (5.0) | 61 (3.7) |
| Gastrointestinal bleeding | 96 (11.9) | 55 (6.8) | 549 (19.3) | 188 (6.6) |
| Infections including sepsis | 20 (9.8) | 52 (11.2) | 228 (14.8) | 220 (14.2) |
| Sepsis alone | 32 (18.9) | 31 (18.3) | 123 (15.2) | 168 (20.8) |
| COPD exacerbation | 20 (9.8) | 12 (5.9) | 74 (10.8) | 43 (6.3) |
| Stroke | 18 (10.2) | 19 (10.8) | 77 (12.4) | 71 (11.4) |
| Seizure | 21 (8.6) | 9 (3.7) | 68 (7.1) | 34 (3.6) |
DISCUSSION
This study found that unplanned ICU transfers were common among medical patients, occurring in 5% of all hospitalizations originating in the ED. The majority of unplanned transfers occurred within 48 hours of admission; the rate of ICU transfers peaked within 24 hours after hospitalization. Compared with patients admitted directly from the ED to the ICU, those transferred early after admission had significantly increased mortality; for example, patients transferred within 24 hours were at a 44% increased odds of hospital death. The adverse outcomes associated with unplanned transfers varied considerably by admission diagnosis subgroups.
Our findings confirm previous reports of increased mortality among patients with unplanned ICU transfers. Escarce and Kelley reported that patients admitted to the ICU from non‐ED locationsincluding wards, intermediate care units, and other hospitalswere at an increased risk of hospital death.1 Multiple subsequent studies have confirmed the increased mortality among patients with unplanned transfers.24, 10, 13, 22, 23 We previously evaluated patients who required a transfer to any higher level of care and reported an observed‐to‐expected mortality ratio of 2.93.4
Fewer studies, however, have evaluated the association between the timing of unplanned transfers and inpatient outcomes; previous small reports suggest that delays in ICU transfer adversely affect mortality and length of stay.12, 13, 24 Parkhe et al. compared 99 direct ICU admit patients with 23 who experienced early unplanned transfers; mortality at 30 days was significantly higher among patients with unplanned transfers.13 The current multifacility study included considerably more patients and confirmed an in‐hospital mortality gapalbeit a smaller onebetween patients with early transfers and those directly admitted to the ICU.
We focused on unplanned transfers during the earliest phase of hospitalization to identify patients who might benefit from improved recognition of, and intervention for, impending critical illness. We found that even patients requiring transfers within 8 hours of hospital admission were at an increased risk of death. Bapoje et al. recently reported that as many as 80% of early unplanned transfers were preventable and that most resulted from inappropriate admission triage.11 Together, these findings suggest that heightened attention to identifying such patients at admission or within the first day of hospitalizationwhen the rates of unplanned transfers peakis critical.
Several important limitations should be recognized in interpreting these results. First, this study was not designed to specifically identify the reasons for unplanned transfers, limiting our ability to characterize episodes in which timely care could have prevented excess mortality. Notably, while previous work suggests that many early unplanned transfers might be prevented with appropriate triage, it is likely that some excess deaths are not preventable even if every patient could be admitted to the ICU directly.
We were able to characterize patient outcomes by admitting diagnoses. Patients admitted for pneumonia and respiratory infection, gastrointestinal bleeding, COPD exacerbation, or seizures demonstrated excess mortality compared with matched ICU controls, while those with AMI, sepsis, and stroke did not. It is possible that differences in diagnosis‐specific excess mortality resulted from increasing adherence to well‐defined practice guidelines for specific high‐risk conditions.2527 For example, international awareness campaigns for the treatment of sepsis, AMI, and strokeSurviving Sepsis, Door‐to‐Balloon, and F.A.S.T.emphasize early interventions to minimize morbidity and mortality.
Second, the data utilized in this study were based on automated variables extracted from the electronic medical record. Mortality prediction models based on automated variables have demonstrated excellent performance among ICU and non‐ICU populations14, 18, 28; however, the inclusion of additional data (eg, vital signs or neurological status) would likely improve baseline risk adjustment.5, 10, 2931 Multiple studies have demonstrated that vital signs and clinician judgment can predict patients at an increased risk of deterioration.5, 10, 2931 Such data might also provide insight into residual factors that influenced clinicians' decisions to triage patients to an ICU versus non‐ICU admissiona focus area of our ongoing research efforts. Utilizing electronically available data, however, facilitated the identification of a cohort of patients far larger than that in prior studies. Where previous work has also been limited by substantial variability in baseline characteristics among study subjects,1, 2, 12, 13 our large sample produced a high percentage of multivariable case matches.
Third, we chose to match patients with a severity of illness index based on variables available at the time of hospital admission. While this mortality prediction model has demonstrated excellent performance in internal and external populations,14, 18 it is calibrated for general inpatient, rather than critically ill, populations. It remains possible that case matching with ICU‐specific severity of illness scores might alter matching characteristics, however, previous studies suggest that severity of illness, as measured by these scores, is comparable between direct ICU admits and early ICU transfers.13 Importantly, our matching procedure avoided the potential confounding known to exist with the use of prediction models based on discharge or intra‐hospitalization data.32, 33
Finally, while we were able to evaluate unplanned transfer timing in a multifacility sample, all patient care occurred within a large integrated healthcare delivery system. The overall observed mortality in our study was lower than that reported in prior studies which considered more limited patient cohorts.1, 2, 12, 13, 22 Thus, differences in patient case‐mix or ICU structure must be considered when applying our results to other healthcare delivery systems.
This hypothesis‐generating study, based on a large, multifacility sample of hospitalizations, suggests several areas of future investigation. Future work should detail specific aspects of care among patients with unplanned transfer, including: evaluating the structures and processes involved in triage decisions, measuring the effects on mortality through implementation of interventions (eg, rapid response teams or diagnosis‐specific treatment protocols), and defining the causes and risk factors for unplanned transfers by elapsed time.
In conclusion, the risk of an unplanned ICU transfera common event among hospitalized patientsis highest within 24 hours of hospitalization. Patients with early unplanned transfers have increased mortality and length of stay compared to those admitted directly to the ICU. Even patients transferred to the ICU within 8 hours of hospital admission are at an increased risk of death when compared with those admitted directly. Substantial variability in unplanned transfer outcomes exists based on admitting diagnoses. Future research should characterize unplanned transfers in greater detail with the goal of identifying patients that would benefit from improved triage and early ICU transfer.
- ,.Admission source to the medical intensive care unit predicts hospital death independent of APACHE II score.JAMA.1990;264(18):2389–2394.
- ,,,,,.Unplanned admission to intensive care after emergency hospitalisation: risk factors and development of a nomogram for individualising risk.Resuscitation.2009;80(2):224–230.
- ,.Outcome of intensive care patients in a group of British intensive care units.Crit Care Med.1998;26(8):1337–1345.
- ,,,,,.Intra‐hospital transfers to a higher level of care: contribution to total hospital and intensive care unit (ICU) mortality and length of stay (LOS).J Hosp Med.2010;6(2):74–80.
- ,.Medical patients at high risk for catastrophic deterioration.Crit Care Med.1987;15(5):510–515.
- ,,, et al.Introduction of the medical emergency team (MET) system: a cluster‐randomised controlled trial.Lancet.2005;365(9477):2091–2097.
- ,,, et al.Effect of a rapid response team on hospital‐wide mortality and code rates outside the ICU in a children's hospital.JAMA.2007;298(19):2267–2274.
- ,,,,,.Validity of unplanned admission to an intensive care unit as a measure of patient safety in surgical patients.Anesthesiology.2005;103(6):1121–1129.
- ,,,.The 100,000 lives campaign: setting a goal and a deadline for improving health care quality.JAMA.2006;295(3):324–327.
- ,,, et al.Duration of life‐threatening antecedents prior to intensive care admission.Intensive Care Med.2002;28(11):1629–1634.
- ,,,.Unplanned transfers to a medical intensive care unit: causes and relationship to preventable errors in care.J Hosp Med.2011;6(2):68–72.
- ,,,,.Inpatient transfers to the intensive care unit: delays are associated with increased mortality and morbidity.J Gen Intern Med.2003;18(2):77–83.
- ,,,.Outcome of emergency department patients with delayed admission to an intensive care unit.Emerg Med (Fremantle).2002;14(1):50–57.
- ,,,,,.Risk‐adjusting hospital inpatient mortality using automated inpatient, outpatient, and laboratory databases.Med Care.2008;46(3):232–239.
- ,,, et al.Risk adjusting community‐acquired pneumonia hospital outcomes using automated databases.Am J Manag Care.2008;14(3):158–166.
- .Linking automated databases for research in managed care settings.Ann Intern Med.1997;127(8 pt 2):719–724.
- ,,, et al.Anticoagulation therapy for stroke prevention in atrial fibrillation: how well do randomized trials translate into clinical practice?JAMA.2003;290(20):2685–2692.
- ,,,.The Kaiser Permanente inpatient risk adjustment methodology was valid in an external patient population.J Clin Epidemiol.2009;63(7):798–803.
- ,.Refinements to the diagnostic cost group (DCG) model.Inquiry.1995;32(4):418–429.
- ,.Excess length of stay, charges, and mortality attributable to medical injuries during hospitalization.JAMA.2003;290(14):1868–1874.
- .Optimal matching in observational studies.J Am Stat Assoc.1989;84:1024–1032.
- ,,,.Admissions to intensive care units from emergency departments: a descriptive study.Emerg Med J.2005;22(6):423–428.
- ,,,.Using administrative data to develop a nomogram for individualising risk of unplanned admission to intensive care.Resuscitation.2008;79(2):241–248.
- ,,,.Unplanned intensive care unit transfers: a useful tool to improve quality of care [abstract]. In: Hospital Medicine 2010 abstract booklet. Society of Hospital Medicine 2010 Annual Meeting, April 9–11, 2010, Washington, DC;2010:10–11.
- ,,, et al.Surviving Sepsis Campaign: international guidelines for management of severe sepsis and septic shock: 2008.Crit Care Med.2008;36(1):296–327.
- ,,, et al.2009 Focused Updates: ACC/AHA Guidelines for the Management of Patients With ST‐Elevation Myocardial Infarction (updating the 2004 Guideline and 2007 Focused Update) and ACC/AHA/SCAI Guidelines on Percutaneous Coronary Intervention (updating the 2005 Guideline and 2007 Focused Update): a report of the American College of Cardiology Foundation/American Heart Association Task Force on Practice Guidelines.Circulation.2009;120(22):2271–2306.
- ,,, et al.Translating evidence into practice: a decade of efforts by the American Heart Association/American Stroke Association to reduce death and disability due to stroke: a presidential advisory from the American Heart Association/American Stroke Association.Stroke.2010;41(5):1051–1065.
- ,,, et al.Veterans Affairs intensive care unit risk adjustment model: validation, updating, recalibration.Crit Care Med.2008;36(4):1031–1042.
- ,,, et al.Recommended guidelines for monitoring, reporting, and conducting research on medical emergency team, outreach, and rapid response systems: an Utstein‐style scientific statement: a scientific statement from the International Liaison Committee on Resuscitation (American Heart Association, Australian Resuscitation Council, European Resuscitation Council, Heart and Stroke Foundation of Canada, InterAmerican Heart Foundation, Resuscitation Council of Southern Africa, and the New Zealand Resuscitation Council); the American Heart Association Emergency Cardiovascular Care Committee; the Council on Cardiopulmonary, Perioperative, and Critical Care; and the Interdisciplinary Working Group on Quality of Care and Outcomes Research.Circulation.2007;116(21):2481–2500.
- ,,,,,.Realizing the potential of clinical judgment: a real‐time strategy for predicting outcomes and cost for medical inpatients.Am J Med.2000;109(3):189–195.
- ,,.Physiological values and procedures in the 24 h before ICU admission from the ward.Anaesthesia.1999;54(6):529–534.
- ,,,,,.Predicting who dies depends on how severity is measured: implications for evaluating patient outcomes.Ann Intern Med.1995;123(10):763–770.
- ,,, et al.Enhancement of claims data to improve risk adjustment of hospital mortality.JAMA.2007;297(1):71–76.
Copyright © 2011 Society of Hospital Medicine

Continuing Medical Education Program in
If you wish to receive credit for this activity, which begins on the next page, please refer to the website:
Accreditation and Designation Statement
Blackwell Futura Media Services designates this educational activity for a 1 AMA PRA Category 1 Credit. Physicians should only claim credit commensurate with the extent of their participation in the activity.
Blackwell Futura Media Services is accredited by the Accreditation Council for Continuing Medical Education to provide continuing medical education for physicians.
Educational Objectives
Upon completion of this educational activity, participants will be better able to employ automated bed history data to examine outcomes of intra‐hospital transfers using all hospital admissions as the denominator.
Continuous participation in the Journal of Hospital Medicine CME program will enable learners to be better able to:
-
Interpret clinical guidelines and their applications for higher quality and more efficient care for all hospitalized patients.
-
Describe the standard of care for common illnesses and conditions treated in the hospital; such as pneumonia, COPD exacerbation, acute coronary syndrome, HF exacerbation, glycemic control, venous thromboembolic disease, stroke, etc.
-
Discuss evidence‐based recommendations involving transitions of care, including the hospital discharge process.
-
Gain insights into the roles of hospitalists as medical educators, researchers, medical ethicists, palliative care providers, and hospital‐based geriatricians.
-
Incorporate best practices for hospitalist administration, including quality improvement, patient safety, practice management, leadership, and demonstrating hospitalist value.
-
Identify evidence‐based best practices and trends for both adult and pediatric hospital medicine.
Instructions on Receiving Credit
For information on applicability and acceptance of continuing medical education credit for this activity, please consult your professional licensing board.
This activity is designed to be completed within the time designated on the title page; physicians should claim only those credits that reflect the time actually spent in the activity. To successfully earn credit, participants must complete the activity during the valid credit period that is noted on the title page.
Follow these steps to earn credit:
-
Log on to
www.blackwellpublishing.com/cme . -
Read the target audience, learning objectives, and author disclosures.
-
Read the article in print or online format.
-
Reflect on the article.
-
Access the CME Exam, and choose the best answer to each question.
-
Complete the required evaluation component of the activity.
Intra‐Hospital Transfer to a Higher Level of Care
Considerable research and public attention is being paid to the quantification, risk adjustment, and reporting of inpatient mortality.15 Inpatient mortality is reported as aggregate mortality (for all hospitalized patients or those with a specific diagnosis3, 6) or intensive care unit (ICU) mortality.7, 8 While reporting aggregate hospital or aggregate ICU mortality rates is useful, it is also important to develop reporting strategies that go beyond simply using data elements found in administrative databases (eg, diagnosis and procedure codes) to quantify practice variation. Ideally, such strategies would permit delineating processes of careparticularly those potentially under the control of hospitalists, not only intensiviststo identify improvement opportunities. One such process, which can be tracked using the bed history component of a patient's electronic medical record, is the transfer of patients between different units within the same hospital.
Several studies have documented that risk of ICU death is highest among patients transferred from general medical‐surgical wards, intermediate among direct admissions from the emergency department, and lowest among surgical admissions.911 Opportunities to reduce subsequent ICU mortality have been studied among ward patients who develop sepsis and are then transferred to the ICU,12 among patients who experience cardiac arrest,13, 14 as well as among patients with any physiological deterioration (eg, through the use of rapid response teams).1517 Most of these studies have been single‐center studies and/or studies reporting only an ICU denominator. While useful in some respects, such studies are less helpful to hospitalists, who would benefit from better understanding of the types of patients transferred and the total impact that transfers to a higher level of care make on general medical‐surgical wards. In addition, entities such as the Institute for Healthcare Improvement recommend the manual review of records of patients who were transferred from the ward to the ICU18 to identify performance improvement opportunities. While laudable, such approaches do not lend themselves to automated reporting strategies.
We recently described a new risk adjustment methodology for inpatient mortality based entirely on automated data preceding hospital admission and not restricted to ICU patients. This methodology, which has been externally validated in Ottawa, Canada, after development in the Kaiser Permanente Medical Care Program (KPMCP), permits quantification of a patient's pre‐existing comorbidity burden, physiologic derangement at the time of admission, and overall inpatient mortality risk.19, 20 The primary purpose of this study was to combine this methodology with bed history analysis to quantify the in‐hospital mortality and length of stay (LOS) of patients who experienced intra‐hospital transfers in a large, multihospital system. As a secondary goal, we also wanted to assess the degree to which these transfers could be predicted based on information available prior to a patient's admission.
ABBREVIATIONS AND TERMS USED IN TEXT
COPS: COmorbidity Point Score. Point score based on a patient's health care utilization diagnoses (during the year preceding admission to the hospital. Analogous to POA (present on admission) coding. Scores can range from 0 to a theoretical maximum of 701 but scores >200 are rare. With respect to a patient's pre‐existing comorbidity burden, the unadjusted relationship of COPS and inpatient mortality is as follows: a COPS <50 is associated with a mortality risk of <1%, <100 with a mortality risk of <5%, 100 to 145 with a mortality risk of 5% to 10%, and >145 with a mortality risk of 10% or more.
ICU: Intensive Care Unit. In this study, all ICUs have a minimum registered nurse to patient ratio of 1:2.
LAPS: Laboratory Acute Physiology Score. Point score based on 14 laboratory test results obtained in the 72 hours preceding hospitalization. With respect to a patient's physiologic derangement, the unadjusted relationship of LAPS and inpatient mortality is as follows: a LAPS <7 is associated with a mortality risk of <1%, <7 to 30 with a mortality risk of <5%, 30 to 60 with a mortality risk of 5% to 9%, and >60 with a mortality risk of 10% or more.
LOS: Exact hospital Length Of Stay. LOS is calculated from admission until first discharge home (i.e., it may span more than one hospital stay if a patient experienced inter‐hospital transport).
Predicted (expected) mortality risk: the % risk of death for a given patient based on his/her age, sex, admission diagnosis, COPS, and LAPS.
OEMR: Observed to Expected Mortality Ratio. For a given patient subset, the ratio of the actual mortality experienced by the subset to the expected (predicted) mortality for the subset. Predicted mortality is based on patients' age, sex, admission diagnosis, COPS, and LAPS.
OMELOS: Observed Minus Expected LOS. For a given patient subset, the difference between the actual number of hospital days experienced by the subset and the expected (predicted) number of hospital days for the subset. Predicted LOS is based on patients' age, sex, admission diagnosis, COPS, and LAPS.
TCU: Transitional Care Unit (also called intermediate care unit or stepdown unit). In this study, TCUs have variable nurse to patient ratios ranging from 1:2.5 to 1:3 and did not provide assisted ventilation, continuous pressor infusions, or invasive monitoring.
Materials and Methods
This project was approved by the Northern California KPMCP Institutional Review Board for the Protection of Human Subjects.
The Northern California KPMCP serves a total population of approximately 3.3 million members. Under a mutual exclusivity arrangement, physicians of The Permanente Medical Group, Inc., care for Kaiser Foundation Health Plan, Inc. members at facilities owned by Kaiser Foundation Hospitals, Inc. All Northern California KPMCP hospitals and clinics employ the same information systems with a common medical record number and can track care covered by the plan but delivered elsewhere. Databases maintained by the KPMCP capture admission and discharge times, admission and discharge diagnoses and procedures (assigned by professional coders), bed histories, inter‐hospital transfers, as well as the results of all inpatient and outpatient laboratory tests. The use of these databases for research has been described in multiple reports.2124
Our setting consisted of all 19 hospitals owned and operated by the KPMCP, whose characteristics are summarized in the Supporting Information Appendix available to interested readers. These include the 17 described in our previous report19 as well as 2 new hospitals (Antioch and Manteca) which are similar in size and type of population served. Our study population consisted of all patients admitted to these 19 hospitals who met these criteria: 1) hospitalization began from November 1st, 2006 through January 31st, 2008; 2) initial hospitalization occurred at a Northern California KPMCP hospital (ie, for inter‐hospital transfers, the first hospital stay occurred within the KPMCP); 3) age 15 years; and 4) hospitalization was not for childbirth.
We defined a linked hospitalization as the time period that began with a patient's admission to the hospital and ended with the patient's discharge (home, to a nursing home, or death). Linked hospitalizations can thus involve more than 1 hospital stay and could include a patient transfer from one hospital to another prior to definitive discharge. For linked hospitalizations, mortality was attributed to the admitting KPMCP hospital (ie, if a patient was admitted to hospital A, transferred to B, and died at hospital B, mortality was attributed to hospital A). We defined total LOS as the exact time in hours from when a patient was first admitted to the hospital until death or final discharge home or to a nursing home, while total ICU or transitional care unit (TCU, referred to as stepdown unit in some hospitals) LOS was calculated for all individual ICU or TCU stays during the hospital stay.
Intra‐Hospital Transfers
We grouped all possible hospital units into four types: general medical‐surgical ward (henceforth, ward); operating room (OR)/post‐anesthesia recovery (PAR); TCU; and ICU. In 2003, the KPMCP implemented a mandatory minimum staffing ratio of one registered nurse for every four patients in all its hospital units; in addition, staffing levels for designated ICUs adhered to the previously mandated minimum of one nurse for every 2 patients. So long as they adhere to these minimum ratios, individual hospitals have considerable autonomy with respect to how they staff or designate individual hospital units. Registered nurse‐to‐patient ratios during the time of this study were as follows: ward patients, 1:3.5 to 1:4; TCU patients, 1:2.5 to 1:3; and ICU patients, 1:1 to 1:2. Staffing ratios for the OR and PAR are more variable, depending on the surgical procedures involved. Current KPMCP databases do not permit accurate quantification of physician staffing. All 19 study hospitals had designated ICUs, 6 were teaching hospitals, and 11 had designated TCUs. None of the study hospitals had closed ICUs (units where only intensivists admit patients) and none had continuous coverage of the ICU by intensivists. While we were not able to employ electronic data to determine who made the decision to transfer, we did find considerable variation with respect to how intensivists covered the ICUs and how they interfaced with hospitalists. Staffing levels for specialized coronary care units and non‐ICU monitored beds were not standardized. All study hospitals had rapid response teams as well as code blue teams during the time period covered by this report. Respiratory care practitioners were available to patients in all hospital units, but considerable variation existed with respect to other services available (eg, cardiac catheterization units, provision of noninvasive positive pressure ventilation outside the ICU, etc.).
This report focuses on intra‐hospital transfers to the ICU and TCU, with special emphasis on nonsurgical transfers (due to space limitations, we are not reporting on the outcomes of patients whose first hospital unit was the OR; additional details on these patients are provided in the Supporting Information Appendix). For the purposes of this report, we defined the following admission types: direct admits (patients admitted to the ICU or TCU whose first hospital unit on admission was the ICU or TCU); and nonsurgical transfers to a higher level of care. These latter transfers could be of 3 types: ward to ICU, ward to TCU, and TCU to ICU. We also quantified the effect of inter‐hospital transfers.
Independent Variables
In addition to patients' age and sex, we employed the following independent variables to predict transfer to a higher level of care. These variables are part of the risk adjustment model described in greater detail in our previous report19 and were available electronically for all patients in the cohort. We grouped admission diagnoses into 44 broad diagnostic categories (Primary Conditions), and admission types into 4 groups (emergency medical, emergency surgical, elective medical, and elective surgical). We quantified patients' degree of physiologic derangement using a Laboratory‐based Acute Physiology Score (LAPS) using laboratory test results prior to hospitalization. We quantified patients' comorbid illness burden using a Comorbidity Point Score (COPS) based on patients' pre‐existing diagnoses over the 12‐month period preceding hospitalization. Lastly, we assigned each patient a predicted mortality risk (%) and LOS based on the above predictors,19 permitting calculation of observed to expected mortality ratios (OEMRs) and observed minus expected LOS (OMELOS).
Statistical Methods
All analyses were performed in SAS.25 We calculated standard descriptive statistics (medians, means, standard deviations) and compared different patient groupings using t and chi‐square tests. We employed a similar approach to that reported by Render et al.7 to calculate OEMR and OMELOS.
To determine the degree to which transfers to a higher level of care from the ward or TCU would be predictable using information available at the time of admission, we performed 4 sets of logistic regression analyses using the above‐mentioned predictors in which the outcome variables were as follows: 1) transfer occurring in the first 48 hours after admission (time frame by which point approximately half of the transferred patients experienced a transfer) among ward or TCU patients and 2) transfer occurring after 48 hours among ward or TCU patients. We evaluated the discrimination and calibration of these models using the same methods described in our original report (measuring the area under the receiver operator characteristic curve, or c statistic, and visually examining observed and expected mortality rates among predicted risk bands as well as risk deciles) as well as additional statistical tests recommended by Cook.19, 26
Results
During the study period, a total of 249,129 individual hospital stays involving 170,151 patients occurred at these 19 hospitals. After concatenation of inter‐hospital transfers, we were left with 237,208 linked hospitalizations. We excluded 26,738 linked hospitalizations that began at a non‐KPMCP hospital (ie, they were transported in), leaving a total of 210,470 linked hospitalizations involving 150,495 patients. The overall linked hospitalization mortality rate was 3.30%.
Table 1 summarizes cohort characteristics based on initial hospital location. On admission, ICU patients had the highest degree of physiologic derangement as well as the highest predicted mortality. Considerable inter‐hospital variation was present in both predictors and outcomes; details on these variations are provided in the Supporting Information Appendix.
| Ward | TCU | ICU | All* | |
|---|---|---|---|---|
| ||||
| n | 121,237 | 20,556 | 16,001 | 210,470 |
| Admitted via emergency department, n (%) | 99,909 (82.4) | 18,612 (90.5) | 13,847 (86.5) | 139,036 (66.1) |
| % range across hospitals | 55.0‐94.2 | 64.7‐97.6 | 49.5‐97.4 | 53.6‐76.9 |
| Male, n (%) | 53,744 (44.3) | 10,362 (50.4) | 8,378 (52.4) | 94,451 (44.9) |
| Age in years (mean SD) | 64.5 19.2 | 69.0 15.6 | 63.7 17.8 | 63.2 18.6 |
| LAPS (mean SD) | 19.2 18.0 | 23.3 19.5 | 31.7 25.7 | 16.7 19.0 |
| COPS (mean SD) | 90.4 64.0 | 99.2 65.9 | 94.5 67.5 | 84.7 61.8 |
| % predicted mortality (mean SD) | 4.0 7.1 | 4.6 7.3 | 8.7 12.8 | 3.6 7.3 |
| Observed in‐hospital deaths (n, %) | 3,793 (3.1) | 907 (4.4) | 1,995 (12.5) | 6,952 (3.3) |
| Observed to expected mortality ratio | 0.79 (0.77‐0.82) | 0.95 (0.89‐1.02) | 1.43 (1.36‐1.49) | 0.92 (0.89‐0.94) |
| Total hospital LOS, days (mean SD) | 4.6 7.5 | 5.3 10.0 | 7.8 14.0 | 4.6 8.1 |
Table 2 summarizes data from 3 groups of patients: patients initially admitted to the ward, or TCU, who did not experience a transfer to a higher level of care and patients admitted to these 2 units who did experience such a transfer. Patients who experienced a transfer constituted 5.3% (6,484/121,237) of ward patients and 6.7% (1,384/20,556) of TCU patients. Transferred patients tended to be older, have more acute physiologic derangement (higher LAPS), a greater pre‐existing illness burden (higher COPS), and a higher predicted mortality risk. Among ward patients, those with the following admission diagnoses were most likely to experience a transfer to a higher level of care: gastrointestinal bleeding (10.8% of all transfers), pneumonia (8.7%), and other infections (8.2%). The diagnoses most likely to be associated with death following transfer were cancer (death rate among transferred patients, 48%), renal disease (death rate, 36%), and liver disease (33%). Similar distributions were observed for TCU patients.
| Patients Initially Admitted to Ward, Remained There | Patients Initially Admitted to TCU, Remained There | Patients Transferred to Higher Level of Care | All | |
|---|---|---|---|---|
| ||||
| n | 114,753 | 19,172 | 7,868 | 141,793 |
| Male, n (%) | 50,586 (44.1) | 9,626 (50.2) | 3,894 (49.5) | 64,106 (45.2) |
| Age (mean SD) | 64.3 19.4 | 69.0 15.7 | 68.1 16.1 | 65.2 18.8 |
| LAPS (mean SD) | 18.9 17.8 | 22.7 19.1 | 26.7 21.0 | 19.8 18.3 |
| COPS (mean SD) | 89.4 63.7 | 98.3 65.5 | 107.9 67.6 | 91.7 64.4 |
| % predicted mortality risk (mean SD) | 3.8 7.0 | 4.4 7.0 | 6.5 8.8 | 4.1 7.1 |
| Admission diagnosis of pneumonia, n (%) | 5,624 (4.9) | 865 (4.5) | 684 (8.7) | 7,173 (5.1) |
| Admission diagnosis of sepsis, n (%) | 1,181 (1.0) | 227 (1.2) | 168 (2.1) | 1,576 (1.1) |
| Admission diagnosis of GI bleed, n (%) | 13,615 (11.9) | 1,448 (7.6) | 851 (10.8) | 15,914 (11.2) |
| Admission diagnosis of cancer, n (%) | 2,406 (2.1) | 80 (0.4) | 186 (2.4) | 2,672 (1.9) |
Table 3 compares outcomes among ward and TCU patients who did and did not experience a transfer to a higher level of care. The table shows that transferred patients were almost 3 times as likely to die, even after controlling for severity of illness, and that their hospital LOS was 9 days higher than expected. This increased risk was seen in all hospitals and among all transfer types (ward to ICU, ward to TCU, and TCU to ICU).
| Patients Initially Admitted to Ward, Remained There | Patients Initially Admitted to TCU, Remained There | Patients Transferred to Higher Level of Care | |
|---|---|---|---|
| |||
| n | 114,753 | 19,172 | 7,868 |
| Admitted to ICU, n (%) | 0 (0.0) | 0 (0.0) | 5,245 (66.7) |
| Ventilated, n (%) | 0 (0.0) | 0 (0.0) | 1,346 (17.1) |
| Died in the hospital, n (%) | 2,619 (2.3) | 572 (3.0) | 1,509 (19.2) |
| Length of stay, in days, at time of death (mean SD) | 7.0 11.9 | 8.3 12.4 | 16.2 23.7 |
| Observed to expected mortality ratio (95% CI) | 0.60 (0.57‐0.62) | 0.68 (0.63‐0.74) | 2.93 (2.79‐3.09) |
| Total hospital length of stay, days (mean SD) | 4.0 5.7 | 4.4 6.9 | 14.3 21.3 |
| Observed minus expected length of stay (95% CI) | 0.4 (0.3‐0.4) | 0.8 (0.7‐0.9) | 9.1 (8.6‐9.5) |
| Length of stay, in hours, at time of transfer (mean SD) | 80.8 167.2 | ||
Table 3 also shows that, among decedent patients, those who never left the ward or TCU died much sooner than those who died following transfer. Among direct admits to the ICU, the median LOS at time of death was 3.9 days, with a mean of 9.4 standard deviation of 19.9 days, while the corresponding times for TCU direct admits were a median and mean LOS of 6.5 and 11.7 19.5 days.
Table 4 summarizes outcomes among different patient subgroups that did and did not experience a transfer to a higher level of care. Based on location, patients who experienced a transfer from the TCU to the ICU had the highest crude death rate, but patients transferred from the ward to the ICU had the highest OEMR. On the other hand, if one divides patients by the degree of physiologic derangement, patients with low LAPS who experienced a transfer had the highest OEMR. With respect to LOS, patients transferred from the TCU to the ICU had the highest OMELOS (13.4 extra days).
| n (%)* | Death Rate (%) | OEMR | LOS (mean SD) | OMELOS | |
|---|---|---|---|---|---|
| |||||
| Never admitted to TCU or ICU | 157,632 (74.9) | 1.6 | 0.55 (0.53‐0.57) | 3.6 4.6 | 0.04 (0.02‐0.07) |
| Direct admit to TCU | 18,464 (8.8) | 2.9 | 0.66 (0.61‐0.72) | 4.2 5.8 | 0.60 (0.52‐0.68) |
| Direct admit to ICU | 14,655 (7.0) | 11.9 | 1.38 (1.32‐1.45) | 6.4 9.4 | 2.28 (2.14‐2.43) |
| Transferred from ward to ICU | 5,145 (2.4) | 21.5 | 3.23 (3.04‐3.42) | 15.7 21.6 | 10.33 (9.70‐10.96) |
| Transferred from ward to TCU | 3,144 (1.5) | 11.9 | 1.99 (1.79‐2.20) | 13.6 23.2 | 8.02 (7.23‐8.82) |
| Transferred from TCU to ICU | 1,107 (0.5) | 25.7 | 2.94 (2.61‐3.31) | 18.0 28.2 | 13.35 (11.49‐15.21) |
| Admitted to ward, COPS 80, no transfer to ICU or TCU | 55,405 (26.3) | 3.4 | 0.59 (0.56‐0.62) | 4.5 5.9 | 0.29 (0.24‐0.34) |
| Admitted to ward, COPS 80, did experience transfer to ICU or TCU | 4,851 (2.3) | 19.3 | 2.72 (2.55‐2.90) | 14.2 20.0 | 8.14 (7.56‐8.71) |
| Admitted to ward, COPS <80, no transfer to ICU or TCU | 57,421 (27.3) | 1.1 | 0.55 (0.51‐0.59) | 3.4 4.2 | 0.23 (0.19‐0.26) |
| Admitted to ward, COPS <80, did experience transfer to ICU or TCU | 3,560 (1.7) | 9.8 | 2.93 (2.63‐3.26) | 12.0 19.0 | 7.52 (6.89‐8.15) |
| Admitted to ward, LAPS 20, no transfer to ICU or TCU | 46,492 (22.1) | 4.2 | 0.59 (0.56‐0.61) | 4.6 5.4 | 0.16 (0.12‐0.21) |
| Admitted to ward, LAPS 20, did experience transfer to ICU or TCU | 4,070 (1.9) | 21.4 | 2.37 (2.22‐2.54) | 14.8 21.0 | 8.76 (8.06‐9.47) |
| Admitted to ward, LAPS <20, no transfer to ICU or TCU | 66,334 (31.5) | 0.9 | 0.55 (0.51‐0.60) | 3.5 4.9 | 0.32 (0.28‐0.36) |
| Admitted to ward, LAPS <20, did experience transfer to ICU or TCU | 4,341 (2.1) | 9.5 | 4.31 (3.90‐4.74) | 11.8 18.1 | 7.12 (6.61‐7.64) |
Transfers to a higher level of care at a different hospital, which in the KPMCP are usually planned, experienced lower mortality than transfers within the same hospital. For ward to TCU transfers, intra‐hospital transfers had a mortality of 12.1% while inter‐hospital transfers had a mortality of 5.7%. Corresponding rates for ward to ICU transfers were 21.7% and 11.2%, and for TCU to ICU transfers the rates were 25.9% and 12.5%, respectively.
Among patients initially admitted to the ward, a model to predict the occurrence of a transfer to a higher level of care (within 48 hours after admission) that included age, sex, admission type, primary condition, LAPS, COPS, and interaction terms had poor discrimination, with an area under the receiver operator characteristic (c statistic) of only 0.64. The c statistic for a model to predict transfer after 48 hours was 0.66. The corresponding models for TCU admits had c statistics of 0.67 and 0.68. All four models had poor calibration.
Discussion
Using automated bed history data permits characterizing a patient population with disproportionate mortality and LOS: intra‐hospital transfers to special care units (ICUs or TCUs). Indeed, the largest subset of these patients (those initially admitted to the ward or TCU) constituted only 3.7% of all admissions, but accounted for 24.2% of all ICU admissions, 21.7% of all hospital deaths, and 13.2% of all hospital days. These patients also had very elevated OEMRs and OMELOS. Models based on age, sex, preadmission laboratory test results, and comorbidities did not predict the occurrence of these transfers.
We performed multivariate analyses to explore the degree to which electronically assigned preadmission severity scores could predict these transfers. These analyses found that, compared to our ability to predict inpatient or 30‐day mortality at the time of admission, which is excellent, our ability to predict the occurrence of transfer after admission is much more limited. These results highlight the limitations of severity scores that rely on automated data, which may not have adequate discrimination when it comes to determining the risk of an adverse outcome within a narrow time frame. For example, among the 121,237 patients initially admitted to the ward who did not experience an intra‐hospital transfer, the mean LAPS was 18.9, while the mean LAPS among the 6,484 ward patients who did experience a transfer was 25.5. Differences between the mean and median LAPS, COPS, and predicted mortality risk among transferred and non‐transferred patients were significant (P < 0.0001 for all comparisons). However, examination of the distribution of LAPS, COPS, and predicted mortality risk between these two groups of patients showed considerable overlap.
Our methodology resembles Silber et al.'s27, 28 concept of failure to rescue in that it focuses on events occurring after hospitalization. Silber et al. argue that a hospital's quality can be measured by quantifying the degree to which patients who experience new problems are successfully rescued. Furthermore, quantification of those situations where rescue attempts are unsuccessful is felt to be superior to simply comparing raw or adjusted mortality rates because these are primarily determined by underlying case mix. The primary difference between Silber et al.'s approach and ours is at the level of detailthey specified a specific set of complications, whereas our measure is more generic and would include patients with many of the complications specified by Silber et al.27, 28
Most of the patients transferred to a higher level of care in our cohort survived (ie, were rescued), indicating that intensive care is beneficial. However, the fact that these patients had elevated OEMRs and OMELOS indicates that the real challenge facing hospitalists involves the timing of provision of a beneficial intervention. In theory, improved timing could result from earlier detection of problems, which is the underlying rationale for employing rapid response teams. However, the fact that our electronic tools (LAPS, COPS) cannot predict patient deteriorations within a narrow time frame suggests that early detection will remain a major challenge. Manually assigned vital signs scores designed for this purpose do not have good discrimination either.29, 30 This raises the possibility that, though patient groups may differ in terms of overall illness severity and mortality risk, differences at the individual patient level may be too subtle for clinicians to detect. Future research may thus need to focus on scores that combine laboratory data, vital signs, trends in data,31, 32 and newer proteomic markers (eg, procalcitonin).33 We also found that most transfers occurred early (within <72 hours), raising the possibility that at least some of these transfers may involve issues around triage rather than sudden deterioration.
Our study has important limitations. Due to resource constraints and limited data availability, we could not characterize the patients as well as might be desirable; in particular, we could not make full determinations of the actual reasons for patients' transfer for all patients. Broadly speaking, transfer to a higher level of care could be due to inappropriate triage, appropriate (preventive) transfer (which could include transfer to a more richly staffed unit for a specific procedure), relentless progression of disease despite maximal therapy, the occurrence of management errors, patient and family uncertainty about goals of care or inadequate understanding of treatment options and prognoses, or a combination of these factors. We could not make these distinctions with currently available electronic data. This is also true of postsurgical patients, in whom it is difficult to determine which transfers to intensive care might be planned (eg, in the case of surgical procedures where ICU care is anticipated) as opposed to the occurrence of a deterioration during or following surgery. Another major limitation of this study is our inability to identify code or no code status electronically. The elapsed LOS at time of death among patients who experienced a transfer to a higher level of care (as compared to patients who died in the ward without ever experiencing intra‐hospital transfer) suggests, but does not prove, that prolonged efforts were being made to keep them alive. We were also limited in terms of having access to other process data (eg, physician staffing levels, provision and timing of palliative care). Having ICU severity of illness scores would have permitted us to compare our cohort to those of other recent studies showing elevated mortality rates among transfer patients,911 but we have not yet developed that capability.
Consideration of our study findings suggests a possible research agenda that could be implemented by hospitalist researchers. This agenda should emphasize three areas: detection, intervention, and reflection.
With respect to detection, attention needs to be paid to better tools for quantifying patient risk at the time a decision to admit to the ward is made. It is likely that such tools will need to combine the attributes of our severity score (LAPS) with those of the manually assigned scores.30, 34 In some cases, use of these tools could lead a physician to change the locus of admission from the ward to the TCU or ICU, which could improve outcomes by ensuring more timely provision of intensive care. Since problems with initial triage could be due to factors other than the failure to suspect or anticipate impending instability, future research should also include a cognitive component (eg, quantifying what proportion of subsequent patient deteriorations could be ascribed to missed diagnoses35). Additional work also needs to be done on developing mathematical models that can inform electronic monitoring of ward (not just ICU) patients.
Research on interventions that hospitalists can use to prevent the need for intensive care or to improve the rescue rate should take two routes. The first is a disease‐specific route, which builds on the fact that a relatively small set of conditions (pneumonia, sepsis, gastrointestinal bleeding) account for most transfers to a higher level of care. Condition‐specific protocols, checklists, and bundles36 tailored to a ward environment (as opposed to the ICU or to the entire hospital) might prevent deteriorations in these patients, as has been reported for sepsis.37 The second route is to improve the overall capabilities of rapid response and code blue teams. Such research would need to include a more careful assessment of what commonalities exist among patients who were and were not successfully rescued by these teams. This approach would probably yield more insights than the current literature, which focuses on whether rapid response teams are a good thing or not.
Finally, research also needs to be performed on how hospitalists reflect on adverse outcomes among ward patients. Greater emphasis needs to be placed on moving beyond trigger tool approaches that rely on manual chart review. In an era of expanding use of electronic medical record systems, more work needs to be done on how to harness these to provide hospitalists with better quantitative and risk‐adjusted information. This information should not be limited to simply reporting rates of transfers and deaths. Rather, finer distinctions must be provided with respect of the type of patients (ie, more diagnostic detail), the clinical status of patients (ie, more physiologic detail), as well as the effects of including or excluding patients in whom therapeutic options may be limited (ie, do not resuscitate and comfort care patients) on reported rates. Ideally, researchers should develop better process and outcomes measures that could be tested in collaborative networks that include multiple nonacademic general medical‐surgical wards.
Acknowledgements
The authors thank Drs. Paul Feigenbaum, Alan Whippy, Joseph V. Selby, and Philip Madvig for reviewing the manuscript and Ms. Jennifer Calhoun for formatting the manuscript.
- ,,.To Err is Human: Building a Safer Health System.Washington, D. C.:National Academy Press;2000.
- Institute for Healthcare Improvement. Protecting 5 million lives from harm. Available at: http://www.ihi.org/IHI/Programs/Campaign. Accessed June2010.
- ,.Identifying poor‐quality hospitals. Can hospital mortality rates detect quality problems for medical diagnoses?Med Care.1996;34(8):737–753.
- ,,.Surgical mortality as an indicator of hospital quality: the problem with small sample size.JAMA.2004;292(7):847–851.
- State of California Office of Statewide Health Planning and Development. AHRQ ‐ Inpatient quality indicators (IQIs) hospital inpatient mortality indicators for California. Available at: http://www.oshpd.ca.gov/HID/Products/PatDischargeData/AHRQ/iqi‐imi_overview.html. Accessed June2010.
- ,,, et al.Enhancement of claims data to improve risk adjustment of hospital mortality.JAMA.2007;297(1):71–76.
- ,,, et al.Variation in outcomes in Veterans Affairs intensive care units with a computerized severity measure.Crit Care Med.2005;33(5):930–939.
- ,,,.Acute Physiology and Chronic Health Evaluation (APACHE) IV: hospital mortality assessment for today's critically ill patients.Crit Care Med.2006;34(5):1297–1310.
- ,,,.Day of the week of intensive care admission and patient outcomes: a multisite regional evaluation.Med Care.2002;40(6):530–539.
- ,,, et al.The hospital mortality of patients admitted to the ICU on weekends.Chest.2004;126(4):1292–1298.
- ,,, et al.Mortality among patients admitted to intensive care units during weekday day shifts compared with “off” hours.Crit Care Med.2007;35(1):3–11.
- ,,, et al.Septic shock: an analysis of outcomes for patients with onset on hospital wards versus intensive care units.Crit Care Med.1998;26(6):1020–1024.
- ,,,,.Clinical antecedents to in‐hospital cardiopulmonary arrest.Chest.1990;98(6):1388–1392.
- ,.Developing strategies to prevent inhospital cardiac arrest: analyzing responses of physicians and nurses in the hours before the event.Crit Care Med.1994;22(2):244–247.
- MERIT Study Investigators.Introduction of the medical emergency team (MET) system: a cluster‐randomized controlled trial.Lancet.2005;365(9477):2091–2097.
- Institute for Healthcare Improvement.The “MERIT” Trial of Medical Emergency Teams in Australia: An Analysis of Findings and Implications.Boston, MA:2005. Available on www.ihi.org
- ,,.Rapid response teams‐‐walk, don't run.JAMA.2006;296(13):1645–1647.
- ,.IHI Global Trigger Tool for Measuring Adverse Events.2nd ed.Cambridge, Massachusetts:Institute for Healthcare Improvement;2009.
- ,,,,,.Risk adjusting hospital inpatient mortality using automated inpatient, outpatient, and laboratory databases.Medical Care.2008;46(3):232–239.
- ,,,.The Kaiser Permanente inpatient risk adjustment methodology was valid in an external patient population.J Clin Epidemiol.2010;63(7):798–803.
- .Linking automated databases for research in managed care settings.Ann Intern Med.1997;127(8 Pt 2):719–724.
- ,,, et al.Anticoagulation therapy for stroke prevention in atrial fibrillation: how well do randomized trials translate into clinical practice?JAMA.2003;290(20):2685–2692.
- ,,, et al.Richardson score predicts short‐term adverse respiratory outcomes in newborns >/=34 weeks gestation.J Pediatr.2004;145(6):754–760.
- ,,, et al.Risk adjusting community‐acquired pneumonia hospital outcomes using automated databases.Am J Manag Care.2008;14(3):158–166.
- Statistical Analysis Software [computer program]. Version 8.Cary, NC:SAS Institute, Inc.;2000.
- .Use and misuse of the receiver operating characteristic curve in risk prediction.Circulation.2007;115(7):928–935.
- ,,,.Hospital and patient characteristics associated with death after surgery. A study of adverse occurrence and failure to rescue.Med Care.1992;30(7):615–629.
- ,,.Comparing the contributions of groups of predictors: which outcomes vary with hospital rather than patient characteristics?J Am Stat Assoc.1995;90(429):7–18.
- ,.Beyond the intensive care unit: A review of interventions aimed at anticipating and preventing in‐hospital cardiopulmonary arrest.Resuscitation.2005;67(1):13–23.
- ,,.Reproducibility of physiological track‐and‐trigger warning systems for identifying at‐risk patients on the ward.Intensive Care Med.2007;33(4):619–624.
- ,,,,.Serial evaluation of the SOFA score to predict outcome in critically ill patients.JAMA.2001;286(14):1754–1758.
- ,,.Incorporation of Physiologic Trend and Interaction Effects in Neonatal Severity of Illness Scores: An Experiment Using a Variant of the Richardson Score.Intensive Care Med.2007;33(9):1602–1608.
- ,,, et al.Diagnostic and prognostic value of procalcitonin in patients with septic shock.Crit Care Med.2004;32(5):1166–1169.
- ,,, et al.Identifying the sick: can biochemical measurements be used to aid decision making on presentation to the accident and emergency department.Br J Anaesth.2005;94(6):735–741.
- .Improving patient care. The cognitive psychology of missed diagnoses.Ann Intern Med.2005;142(2):115–120.
- ,,,,,.Using care bundles to reduce in‐hospital mortality: quantitative survey.BMJ.2010;340:c1234.
- ,,, et al.Effect of a rapid response system for patients in shock on time to treatment and mortality during 5 years.Crit Care Med.2007;35(11):2568–2575.
Considerable research and public attention is being paid to the quantification, risk adjustment, and reporting of inpatient mortality.15 Inpatient mortality is reported as aggregate mortality (for all hospitalized patients or those with a specific diagnosis3, 6) or intensive care unit (ICU) mortality.7, 8 While reporting aggregate hospital or aggregate ICU mortality rates is useful, it is also important to develop reporting strategies that go beyond simply using data elements found in administrative databases (eg, diagnosis and procedure codes) to quantify practice variation. Ideally, such strategies would permit delineating processes of careparticularly those potentially under the control of hospitalists, not only intensiviststo identify improvement opportunities. One such process, which can be tracked using the bed history component of a patient's electronic medical record, is the transfer of patients between different units within the same hospital.
Several studies have documented that risk of ICU death is highest among patients transferred from general medical‐surgical wards, intermediate among direct admissions from the emergency department, and lowest among surgical admissions.911 Opportunities to reduce subsequent ICU mortality have been studied among ward patients who develop sepsis and are then transferred to the ICU,12 among patients who experience cardiac arrest,13, 14 as well as among patients with any physiological deterioration (eg, through the use of rapid response teams).1517 Most of these studies have been single‐center studies and/or studies reporting only an ICU denominator. While useful in some respects, such studies are less helpful to hospitalists, who would benefit from better understanding of the types of patients transferred and the total impact that transfers to a higher level of care make on general medical‐surgical wards. In addition, entities such as the Institute for Healthcare Improvement recommend the manual review of records of patients who were transferred from the ward to the ICU18 to identify performance improvement opportunities. While laudable, such approaches do not lend themselves to automated reporting strategies.
We recently described a new risk adjustment methodology for inpatient mortality based entirely on automated data preceding hospital admission and not restricted to ICU patients. This methodology, which has been externally validated in Ottawa, Canada, after development in the Kaiser Permanente Medical Care Program (KPMCP), permits quantification of a patient's pre‐existing comorbidity burden, physiologic derangement at the time of admission, and overall inpatient mortality risk.19, 20 The primary purpose of this study was to combine this methodology with bed history analysis to quantify the in‐hospital mortality and length of stay (LOS) of patients who experienced intra‐hospital transfers in a large, multihospital system. As a secondary goal, we also wanted to assess the degree to which these transfers could be predicted based on information available prior to a patient's admission.
ABBREVIATIONS AND TERMS USED IN TEXT
COPS: COmorbidity Point Score. Point score based on a patient's health care utilization diagnoses (during the year preceding admission to the hospital. Analogous to POA (present on admission) coding. Scores can range from 0 to a theoretical maximum of 701 but scores >200 are rare. With respect to a patient's pre‐existing comorbidity burden, the unadjusted relationship of COPS and inpatient mortality is as follows: a COPS <50 is associated with a mortality risk of <1%, <100 with a mortality risk of <5%, 100 to 145 with a mortality risk of 5% to 10%, and >145 with a mortality risk of 10% or more.
ICU: Intensive Care Unit. In this study, all ICUs have a minimum registered nurse to patient ratio of 1:2.
LAPS: Laboratory Acute Physiology Score. Point score based on 14 laboratory test results obtained in the 72 hours preceding hospitalization. With respect to a patient's physiologic derangement, the unadjusted relationship of LAPS and inpatient mortality is as follows: a LAPS <7 is associated with a mortality risk of <1%, <7 to 30 with a mortality risk of <5%, 30 to 60 with a mortality risk of 5% to 9%, and >60 with a mortality risk of 10% or more.
LOS: Exact hospital Length Of Stay. LOS is calculated from admission until first discharge home (i.e., it may span more than one hospital stay if a patient experienced inter‐hospital transport).
Predicted (expected) mortality risk: the % risk of death for a given patient based on his/her age, sex, admission diagnosis, COPS, and LAPS.
OEMR: Observed to Expected Mortality Ratio. For a given patient subset, the ratio of the actual mortality experienced by the subset to the expected (predicted) mortality for the subset. Predicted mortality is based on patients' age, sex, admission diagnosis, COPS, and LAPS.
OMELOS: Observed Minus Expected LOS. For a given patient subset, the difference between the actual number of hospital days experienced by the subset and the expected (predicted) number of hospital days for the subset. Predicted LOS is based on patients' age, sex, admission diagnosis, COPS, and LAPS.
TCU: Transitional Care Unit (also called intermediate care unit or stepdown unit). In this study, TCUs have variable nurse to patient ratios ranging from 1:2.5 to 1:3 and did not provide assisted ventilation, continuous pressor infusions, or invasive monitoring.
Materials and Methods
This project was approved by the Northern California KPMCP Institutional Review Board for the Protection of Human Subjects.
The Northern California KPMCP serves a total population of approximately 3.3 million members. Under a mutual exclusivity arrangement, physicians of The Permanente Medical Group, Inc., care for Kaiser Foundation Health Plan, Inc. members at facilities owned by Kaiser Foundation Hospitals, Inc. All Northern California KPMCP hospitals and clinics employ the same information systems with a common medical record number and can track care covered by the plan but delivered elsewhere. Databases maintained by the KPMCP capture admission and discharge times, admission and discharge diagnoses and procedures (assigned by professional coders), bed histories, inter‐hospital transfers, as well as the results of all inpatient and outpatient laboratory tests. The use of these databases for research has been described in multiple reports.2124
Our setting consisted of all 19 hospitals owned and operated by the KPMCP, whose characteristics are summarized in the Supporting Information Appendix available to interested readers. These include the 17 described in our previous report19 as well as 2 new hospitals (Antioch and Manteca) which are similar in size and type of population served. Our study population consisted of all patients admitted to these 19 hospitals who met these criteria: 1) hospitalization began from November 1st, 2006 through January 31st, 2008; 2) initial hospitalization occurred at a Northern California KPMCP hospital (ie, for inter‐hospital transfers, the first hospital stay occurred within the KPMCP); 3) age 15 years; and 4) hospitalization was not for childbirth.
We defined a linked hospitalization as the time period that began with a patient's admission to the hospital and ended with the patient's discharge (home, to a nursing home, or death). Linked hospitalizations can thus involve more than 1 hospital stay and could include a patient transfer from one hospital to another prior to definitive discharge. For linked hospitalizations, mortality was attributed to the admitting KPMCP hospital (ie, if a patient was admitted to hospital A, transferred to B, and died at hospital B, mortality was attributed to hospital A). We defined total LOS as the exact time in hours from when a patient was first admitted to the hospital until death or final discharge home or to a nursing home, while total ICU or transitional care unit (TCU, referred to as stepdown unit in some hospitals) LOS was calculated for all individual ICU or TCU stays during the hospital stay.
Intra‐Hospital Transfers
We grouped all possible hospital units into four types: general medical‐surgical ward (henceforth, ward); operating room (OR)/post‐anesthesia recovery (PAR); TCU; and ICU. In 2003, the KPMCP implemented a mandatory minimum staffing ratio of one registered nurse for every four patients in all its hospital units; in addition, staffing levels for designated ICUs adhered to the previously mandated minimum of one nurse for every 2 patients. So long as they adhere to these minimum ratios, individual hospitals have considerable autonomy with respect to how they staff or designate individual hospital units. Registered nurse‐to‐patient ratios during the time of this study were as follows: ward patients, 1:3.5 to 1:4; TCU patients, 1:2.5 to 1:3; and ICU patients, 1:1 to 1:2. Staffing ratios for the OR and PAR are more variable, depending on the surgical procedures involved. Current KPMCP databases do not permit accurate quantification of physician staffing. All 19 study hospitals had designated ICUs, 6 were teaching hospitals, and 11 had designated TCUs. None of the study hospitals had closed ICUs (units where only intensivists admit patients) and none had continuous coverage of the ICU by intensivists. While we were not able to employ electronic data to determine who made the decision to transfer, we did find considerable variation with respect to how intensivists covered the ICUs and how they interfaced with hospitalists. Staffing levels for specialized coronary care units and non‐ICU monitored beds were not standardized. All study hospitals had rapid response teams as well as code blue teams during the time period covered by this report. Respiratory care practitioners were available to patients in all hospital units, but considerable variation existed with respect to other services available (eg, cardiac catheterization units, provision of noninvasive positive pressure ventilation outside the ICU, etc.).
This report focuses on intra‐hospital transfers to the ICU and TCU, with special emphasis on nonsurgical transfers (due to space limitations, we are not reporting on the outcomes of patients whose first hospital unit was the OR; additional details on these patients are provided in the Supporting Information Appendix). For the purposes of this report, we defined the following admission types: direct admits (patients admitted to the ICU or TCU whose first hospital unit on admission was the ICU or TCU); and nonsurgical transfers to a higher level of care. These latter transfers could be of 3 types: ward to ICU, ward to TCU, and TCU to ICU. We also quantified the effect of inter‐hospital transfers.
Independent Variables
In addition to patients' age and sex, we employed the following independent variables to predict transfer to a higher level of care. These variables are part of the risk adjustment model described in greater detail in our previous report19 and were available electronically for all patients in the cohort. We grouped admission diagnoses into 44 broad diagnostic categories (Primary Conditions), and admission types into 4 groups (emergency medical, emergency surgical, elective medical, and elective surgical). We quantified patients' degree of physiologic derangement using a Laboratory‐based Acute Physiology Score (LAPS) using laboratory test results prior to hospitalization. We quantified patients' comorbid illness burden using a Comorbidity Point Score (COPS) based on patients' pre‐existing diagnoses over the 12‐month period preceding hospitalization. Lastly, we assigned each patient a predicted mortality risk (%) and LOS based on the above predictors,19 permitting calculation of observed to expected mortality ratios (OEMRs) and observed minus expected LOS (OMELOS).
Statistical Methods
All analyses were performed in SAS.25 We calculated standard descriptive statistics (medians, means, standard deviations) and compared different patient groupings using t and chi‐square tests. We employed a similar approach to that reported by Render et al.7 to calculate OEMR and OMELOS.
To determine the degree to which transfers to a higher level of care from the ward or TCU would be predictable using information available at the time of admission, we performed 4 sets of logistic regression analyses using the above‐mentioned predictors in which the outcome variables were as follows: 1) transfer occurring in the first 48 hours after admission (time frame by which point approximately half of the transferred patients experienced a transfer) among ward or TCU patients and 2) transfer occurring after 48 hours among ward or TCU patients. We evaluated the discrimination and calibration of these models using the same methods described in our original report (measuring the area under the receiver operator characteristic curve, or c statistic, and visually examining observed and expected mortality rates among predicted risk bands as well as risk deciles) as well as additional statistical tests recommended by Cook.19, 26
Results
During the study period, a total of 249,129 individual hospital stays involving 170,151 patients occurred at these 19 hospitals. After concatenation of inter‐hospital transfers, we were left with 237,208 linked hospitalizations. We excluded 26,738 linked hospitalizations that began at a non‐KPMCP hospital (ie, they were transported in), leaving a total of 210,470 linked hospitalizations involving 150,495 patients. The overall linked hospitalization mortality rate was 3.30%.
Table 1 summarizes cohort characteristics based on initial hospital location. On admission, ICU patients had the highest degree of physiologic derangement as well as the highest predicted mortality. Considerable inter‐hospital variation was present in both predictors and outcomes; details on these variations are provided in the Supporting Information Appendix.
| Ward | TCU | ICU | All* | |
|---|---|---|---|---|
| ||||
| n | 121,237 | 20,556 | 16,001 | 210,470 |
| Admitted via emergency department, n (%) | 99,909 (82.4) | 18,612 (90.5) | 13,847 (86.5) | 139,036 (66.1) |
| % range across hospitals | 55.0‐94.2 | 64.7‐97.6 | 49.5‐97.4 | 53.6‐76.9 |
| Male, n (%) | 53,744 (44.3) | 10,362 (50.4) | 8,378 (52.4) | 94,451 (44.9) |
| Age in years (mean SD) | 64.5 19.2 | 69.0 15.6 | 63.7 17.8 | 63.2 18.6 |
| LAPS (mean SD) | 19.2 18.0 | 23.3 19.5 | 31.7 25.7 | 16.7 19.0 |
| COPS (mean SD) | 90.4 64.0 | 99.2 65.9 | 94.5 67.5 | 84.7 61.8 |
| % predicted mortality (mean SD) | 4.0 7.1 | 4.6 7.3 | 8.7 12.8 | 3.6 7.3 |
| Observed in‐hospital deaths (n, %) | 3,793 (3.1) | 907 (4.4) | 1,995 (12.5) | 6,952 (3.3) |
| Observed to expected mortality ratio | 0.79 (0.77‐0.82) | 0.95 (0.89‐1.02) | 1.43 (1.36‐1.49) | 0.92 (0.89‐0.94) |
| Total hospital LOS, days (mean SD) | 4.6 7.5 | 5.3 10.0 | 7.8 14.0 | 4.6 8.1 |
Table 2 summarizes data from 3 groups of patients: patients initially admitted to the ward, or TCU, who did not experience a transfer to a higher level of care and patients admitted to these 2 units who did experience such a transfer. Patients who experienced a transfer constituted 5.3% (6,484/121,237) of ward patients and 6.7% (1,384/20,556) of TCU patients. Transferred patients tended to be older, have more acute physiologic derangement (higher LAPS), a greater pre‐existing illness burden (higher COPS), and a higher predicted mortality risk. Among ward patients, those with the following admission diagnoses were most likely to experience a transfer to a higher level of care: gastrointestinal bleeding (10.8% of all transfers), pneumonia (8.7%), and other infections (8.2%). The diagnoses most likely to be associated with death following transfer were cancer (death rate among transferred patients, 48%), renal disease (death rate, 36%), and liver disease (33%). Similar distributions were observed for TCU patients.
| Patients Initially Admitted to Ward, Remained There | Patients Initially Admitted to TCU, Remained There | Patients Transferred to Higher Level of Care | All | |
|---|---|---|---|---|
| ||||
| n | 114,753 | 19,172 | 7,868 | 141,793 |
| Male, n (%) | 50,586 (44.1) | 9,626 (50.2) | 3,894 (49.5) | 64,106 (45.2) |
| Age (mean SD) | 64.3 19.4 | 69.0 15.7 | 68.1 16.1 | 65.2 18.8 |
| LAPS (mean SD) | 18.9 17.8 | 22.7 19.1 | 26.7 21.0 | 19.8 18.3 |
| COPS (mean SD) | 89.4 63.7 | 98.3 65.5 | 107.9 67.6 | 91.7 64.4 |
| % predicted mortality risk (mean SD) | 3.8 7.0 | 4.4 7.0 | 6.5 8.8 | 4.1 7.1 |
| Admission diagnosis of pneumonia, n (%) | 5,624 (4.9) | 865 (4.5) | 684 (8.7) | 7,173 (5.1) |
| Admission diagnosis of sepsis, n (%) | 1,181 (1.0) | 227 (1.2) | 168 (2.1) | 1,576 (1.1) |
| Admission diagnosis of GI bleed, n (%) | 13,615 (11.9) | 1,448 (7.6) | 851 (10.8) | 15,914 (11.2) |
| Admission diagnosis of cancer, n (%) | 2,406 (2.1) | 80 (0.4) | 186 (2.4) | 2,672 (1.9) |
Table 3 compares outcomes among ward and TCU patients who did and did not experience a transfer to a higher level of care. The table shows that transferred patients were almost 3 times as likely to die, even after controlling for severity of illness, and that their hospital LOS was 9 days higher than expected. This increased risk was seen in all hospitals and among all transfer types (ward to ICU, ward to TCU, and TCU to ICU).
| Patients Initially Admitted to Ward, Remained There | Patients Initially Admitted to TCU, Remained There | Patients Transferred to Higher Level of Care | |
|---|---|---|---|
| |||
| n | 114,753 | 19,172 | 7,868 |
| Admitted to ICU, n (%) | 0 (0.0) | 0 (0.0) | 5,245 (66.7) |
| Ventilated, n (%) | 0 (0.0) | 0 (0.0) | 1,346 (17.1) |
| Died in the hospital, n (%) | 2,619 (2.3) | 572 (3.0) | 1,509 (19.2) |
| Length of stay, in days, at time of death (mean SD) | 7.0 11.9 | 8.3 12.4 | 16.2 23.7 |
| Observed to expected mortality ratio (95% CI) | 0.60 (0.57‐0.62) | 0.68 (0.63‐0.74) | 2.93 (2.79‐3.09) |
| Total hospital length of stay, days (mean SD) | 4.0 5.7 | 4.4 6.9 | 14.3 21.3 |
| Observed minus expected length of stay (95% CI) | 0.4 (0.3‐0.4) | 0.8 (0.7‐0.9) | 9.1 (8.6‐9.5) |
| Length of stay, in hours, at time of transfer (mean SD) | 80.8 167.2 | ||
Table 3 also shows that, among decedent patients, those who never left the ward or TCU died much sooner than those who died following transfer. Among direct admits to the ICU, the median LOS at time of death was 3.9 days, with a mean of 9.4 standard deviation of 19.9 days, while the corresponding times for TCU direct admits were a median and mean LOS of 6.5 and 11.7 19.5 days.
Table 4 summarizes outcomes among different patient subgroups that did and did not experience a transfer to a higher level of care. Based on location, patients who experienced a transfer from the TCU to the ICU had the highest crude death rate, but patients transferred from the ward to the ICU had the highest OEMR. On the other hand, if one divides patients by the degree of physiologic derangement, patients with low LAPS who experienced a transfer had the highest OEMR. With respect to LOS, patients transferred from the TCU to the ICU had the highest OMELOS (13.4 extra days).
| n (%)* | Death Rate (%) | OEMR | LOS (mean SD) | OMELOS | |
|---|---|---|---|---|---|
| |||||
| Never admitted to TCU or ICU | 157,632 (74.9) | 1.6 | 0.55 (0.53‐0.57) | 3.6 4.6 | 0.04 (0.02‐0.07) |
| Direct admit to TCU | 18,464 (8.8) | 2.9 | 0.66 (0.61‐0.72) | 4.2 5.8 | 0.60 (0.52‐0.68) |
| Direct admit to ICU | 14,655 (7.0) | 11.9 | 1.38 (1.32‐1.45) | 6.4 9.4 | 2.28 (2.14‐2.43) |
| Transferred from ward to ICU | 5,145 (2.4) | 21.5 | 3.23 (3.04‐3.42) | 15.7 21.6 | 10.33 (9.70‐10.96) |
| Transferred from ward to TCU | 3,144 (1.5) | 11.9 | 1.99 (1.79‐2.20) | 13.6 23.2 | 8.02 (7.23‐8.82) |
| Transferred from TCU to ICU | 1,107 (0.5) | 25.7 | 2.94 (2.61‐3.31) | 18.0 28.2 | 13.35 (11.49‐15.21) |
| Admitted to ward, COPS 80, no transfer to ICU or TCU | 55,405 (26.3) | 3.4 | 0.59 (0.56‐0.62) | 4.5 5.9 | 0.29 (0.24‐0.34) |
| Admitted to ward, COPS 80, did experience transfer to ICU or TCU | 4,851 (2.3) | 19.3 | 2.72 (2.55‐2.90) | 14.2 20.0 | 8.14 (7.56‐8.71) |
| Admitted to ward, COPS <80, no transfer to ICU or TCU | 57,421 (27.3) | 1.1 | 0.55 (0.51‐0.59) | 3.4 4.2 | 0.23 (0.19‐0.26) |
| Admitted to ward, COPS <80, did experience transfer to ICU or TCU | 3,560 (1.7) | 9.8 | 2.93 (2.63‐3.26) | 12.0 19.0 | 7.52 (6.89‐8.15) |
| Admitted to ward, LAPS 20, no transfer to ICU or TCU | 46,492 (22.1) | 4.2 | 0.59 (0.56‐0.61) | 4.6 5.4 | 0.16 (0.12‐0.21) |
| Admitted to ward, LAPS 20, did experience transfer to ICU or TCU | 4,070 (1.9) | 21.4 | 2.37 (2.22‐2.54) | 14.8 21.0 | 8.76 (8.06‐9.47) |
| Admitted to ward, LAPS <20, no transfer to ICU or TCU | 66,334 (31.5) | 0.9 | 0.55 (0.51‐0.60) | 3.5 4.9 | 0.32 (0.28‐0.36) |
| Admitted to ward, LAPS <20, did experience transfer to ICU or TCU | 4,341 (2.1) | 9.5 | 4.31 (3.90‐4.74) | 11.8 18.1 | 7.12 (6.61‐7.64) |
Transfers to a higher level of care at a different hospital, which in the KPMCP are usually planned, experienced lower mortality than transfers within the same hospital. For ward to TCU transfers, intra‐hospital transfers had a mortality of 12.1% while inter‐hospital transfers had a mortality of 5.7%. Corresponding rates for ward to ICU transfers were 21.7% and 11.2%, and for TCU to ICU transfers the rates were 25.9% and 12.5%, respectively.
Among patients initially admitted to the ward, a model to predict the occurrence of a transfer to a higher level of care (within 48 hours after admission) that included age, sex, admission type, primary condition, LAPS, COPS, and interaction terms had poor discrimination, with an area under the receiver operator characteristic (c statistic) of only 0.64. The c statistic for a model to predict transfer after 48 hours was 0.66. The corresponding models for TCU admits had c statistics of 0.67 and 0.68. All four models had poor calibration.
Discussion
Using automated bed history data permits characterizing a patient population with disproportionate mortality and LOS: intra‐hospital transfers to special care units (ICUs or TCUs). Indeed, the largest subset of these patients (those initially admitted to the ward or TCU) constituted only 3.7% of all admissions, but accounted for 24.2% of all ICU admissions, 21.7% of all hospital deaths, and 13.2% of all hospital days. These patients also had very elevated OEMRs and OMELOS. Models based on age, sex, preadmission laboratory test results, and comorbidities did not predict the occurrence of these transfers.
We performed multivariate analyses to explore the degree to which electronically assigned preadmission severity scores could predict these transfers. These analyses found that, compared to our ability to predict inpatient or 30‐day mortality at the time of admission, which is excellent, our ability to predict the occurrence of transfer after admission is much more limited. These results highlight the limitations of severity scores that rely on automated data, which may not have adequate discrimination when it comes to determining the risk of an adverse outcome within a narrow time frame. For example, among the 121,237 patients initially admitted to the ward who did not experience an intra‐hospital transfer, the mean LAPS was 18.9, while the mean LAPS among the 6,484 ward patients who did experience a transfer was 25.5. Differences between the mean and median LAPS, COPS, and predicted mortality risk among transferred and non‐transferred patients were significant (P < 0.0001 for all comparisons). However, examination of the distribution of LAPS, COPS, and predicted mortality risk between these two groups of patients showed considerable overlap.
Our methodology resembles Silber et al.'s27, 28 concept of failure to rescue in that it focuses on events occurring after hospitalization. Silber et al. argue that a hospital's quality can be measured by quantifying the degree to which patients who experience new problems are successfully rescued. Furthermore, quantification of those situations where rescue attempts are unsuccessful is felt to be superior to simply comparing raw or adjusted mortality rates because these are primarily determined by underlying case mix. The primary difference between Silber et al.'s approach and ours is at the level of detailthey specified a specific set of complications, whereas our measure is more generic and would include patients with many of the complications specified by Silber et al.27, 28
Most of the patients transferred to a higher level of care in our cohort survived (ie, were rescued), indicating that intensive care is beneficial. However, the fact that these patients had elevated OEMRs and OMELOS indicates that the real challenge facing hospitalists involves the timing of provision of a beneficial intervention. In theory, improved timing could result from earlier detection of problems, which is the underlying rationale for employing rapid response teams. However, the fact that our electronic tools (LAPS, COPS) cannot predict patient deteriorations within a narrow time frame suggests that early detection will remain a major challenge. Manually assigned vital signs scores designed for this purpose do not have good discrimination either.29, 30 This raises the possibility that, though patient groups may differ in terms of overall illness severity and mortality risk, differences at the individual patient level may be too subtle for clinicians to detect. Future research may thus need to focus on scores that combine laboratory data, vital signs, trends in data,31, 32 and newer proteomic markers (eg, procalcitonin).33 We also found that most transfers occurred early (within <72 hours), raising the possibility that at least some of these transfers may involve issues around triage rather than sudden deterioration.
Our study has important limitations. Due to resource constraints and limited data availability, we could not characterize the patients as well as might be desirable; in particular, we could not make full determinations of the actual reasons for patients' transfer for all patients. Broadly speaking, transfer to a higher level of care could be due to inappropriate triage, appropriate (preventive) transfer (which could include transfer to a more richly staffed unit for a specific procedure), relentless progression of disease despite maximal therapy, the occurrence of management errors, patient and family uncertainty about goals of care or inadequate understanding of treatment options and prognoses, or a combination of these factors. We could not make these distinctions with currently available electronic data. This is also true of postsurgical patients, in whom it is difficult to determine which transfers to intensive care might be planned (eg, in the case of surgical procedures where ICU care is anticipated) as opposed to the occurrence of a deterioration during or following surgery. Another major limitation of this study is our inability to identify code or no code status electronically. The elapsed LOS at time of death among patients who experienced a transfer to a higher level of care (as compared to patients who died in the ward without ever experiencing intra‐hospital transfer) suggests, but does not prove, that prolonged efforts were being made to keep them alive. We were also limited in terms of having access to other process data (eg, physician staffing levels, provision and timing of palliative care). Having ICU severity of illness scores would have permitted us to compare our cohort to those of other recent studies showing elevated mortality rates among transfer patients,911 but we have not yet developed that capability.
Consideration of our study findings suggests a possible research agenda that could be implemented by hospitalist researchers. This agenda should emphasize three areas: detection, intervention, and reflection.
With respect to detection, attention needs to be paid to better tools for quantifying patient risk at the time a decision to admit to the ward is made. It is likely that such tools will need to combine the attributes of our severity score (LAPS) with those of the manually assigned scores.30, 34 In some cases, use of these tools could lead a physician to change the locus of admission from the ward to the TCU or ICU, which could improve outcomes by ensuring more timely provision of intensive care. Since problems with initial triage could be due to factors other than the failure to suspect or anticipate impending instability, future research should also include a cognitive component (eg, quantifying what proportion of subsequent patient deteriorations could be ascribed to missed diagnoses35). Additional work also needs to be done on developing mathematical models that can inform electronic monitoring of ward (not just ICU) patients.
Research on interventions that hospitalists can use to prevent the need for intensive care or to improve the rescue rate should take two routes. The first is a disease‐specific route, which builds on the fact that a relatively small set of conditions (pneumonia, sepsis, gastrointestinal bleeding) account for most transfers to a higher level of care. Condition‐specific protocols, checklists, and bundles36 tailored to a ward environment (as opposed to the ICU or to the entire hospital) might prevent deteriorations in these patients, as has been reported for sepsis.37 The second route is to improve the overall capabilities of rapid response and code blue teams. Such research would need to include a more careful assessment of what commonalities exist among patients who were and were not successfully rescued by these teams. This approach would probably yield more insights than the current literature, which focuses on whether rapid response teams are a good thing or not.
Finally, research also needs to be performed on how hospitalists reflect on adverse outcomes among ward patients. Greater emphasis needs to be placed on moving beyond trigger tool approaches that rely on manual chart review. In an era of expanding use of electronic medical record systems, more work needs to be done on how to harness these to provide hospitalists with better quantitative and risk‐adjusted information. This information should not be limited to simply reporting rates of transfers and deaths. Rather, finer distinctions must be provided with respect of the type of patients (ie, more diagnostic detail), the clinical status of patients (ie, more physiologic detail), as well as the effects of including or excluding patients in whom therapeutic options may be limited (ie, do not resuscitate and comfort care patients) on reported rates. Ideally, researchers should develop better process and outcomes measures that could be tested in collaborative networks that include multiple nonacademic general medical‐surgical wards.
Acknowledgements
The authors thank Drs. Paul Feigenbaum, Alan Whippy, Joseph V. Selby, and Philip Madvig for reviewing the manuscript and Ms. Jennifer Calhoun for formatting the manuscript.
- ,,.To Err is Human: Building a Safer Health System.Washington, D. C.:National Academy Press;2000.
- Institute for Healthcare Improvement. Protecting 5 million lives from harm. Available at: http://www.ihi.org/IHI/Programs/Campaign. Accessed June2010.
- ,.Identifying poor‐quality hospitals. Can hospital mortality rates detect quality problems for medical diagnoses?Med Care.1996;34(8):737–753.
- ,,.Surgical mortality as an indicator of hospital quality: the problem with small sample size.JAMA.2004;292(7):847–851.
- State of California Office of Statewide Health Planning and Development. AHRQ ‐ Inpatient quality indicators (IQIs) hospital inpatient mortality indicators for California. Available at: http://www.oshpd.ca.gov/HID/Products/PatDischargeData/AHRQ/iqi‐imi_overview.html. Accessed June2010.
- ,,, et al.Enhancement of claims data to improve risk adjustment of hospital mortality.JAMA.2007;297(1):71–76.
- ,,, et al.Variation in outcomes in Veterans Affairs intensive care units with a computerized severity measure.Crit Care Med.2005;33(5):930–939.
- ,,,.Acute Physiology and Chronic Health Evaluation (APACHE) IV: hospital mortality assessment for today's critically ill patients.Crit Care Med.2006;34(5):1297–1310.
- ,,,.Day of the week of intensive care admission and patient outcomes: a multisite regional evaluation.Med Care.2002;40(6):530–539.
- ,,, et al.The hospital mortality of patients admitted to the ICU on weekends.Chest.2004;126(4):1292–1298.
- ,,, et al.Mortality among patients admitted to intensive care units during weekday day shifts compared with “off” hours.Crit Care Med.2007;35(1):3–11.
- ,,, et al.Septic shock: an analysis of outcomes for patients with onset on hospital wards versus intensive care units.Crit Care Med.1998;26(6):1020–1024.
- ,,,,.Clinical antecedents to in‐hospital cardiopulmonary arrest.Chest.1990;98(6):1388–1392.
- ,.Developing strategies to prevent inhospital cardiac arrest: analyzing responses of physicians and nurses in the hours before the event.Crit Care Med.1994;22(2):244–247.
- MERIT Study Investigators.Introduction of the medical emergency team (MET) system: a cluster‐randomized controlled trial.Lancet.2005;365(9477):2091–2097.
- Institute for Healthcare Improvement.The “MERIT” Trial of Medical Emergency Teams in Australia: An Analysis of Findings and Implications.Boston, MA:2005. Available on www.ihi.org
- ,,.Rapid response teams‐‐walk, don't run.JAMA.2006;296(13):1645–1647.
- ,.IHI Global Trigger Tool for Measuring Adverse Events.2nd ed.Cambridge, Massachusetts:Institute for Healthcare Improvement;2009.
- ,,,,,.Risk adjusting hospital inpatient mortality using automated inpatient, outpatient, and laboratory databases.Medical Care.2008;46(3):232–239.
- ,,,.The Kaiser Permanente inpatient risk adjustment methodology was valid in an external patient population.J Clin Epidemiol.2010;63(7):798–803.
- .Linking automated databases for research in managed care settings.Ann Intern Med.1997;127(8 Pt 2):719–724.
- ,,, et al.Anticoagulation therapy for stroke prevention in atrial fibrillation: how well do randomized trials translate into clinical practice?JAMA.2003;290(20):2685–2692.
- ,,, et al.Richardson score predicts short‐term adverse respiratory outcomes in newborns >/=34 weeks gestation.J Pediatr.2004;145(6):754–760.
- ,,, et al.Risk adjusting community‐acquired pneumonia hospital outcomes using automated databases.Am J Manag Care.2008;14(3):158–166.
- Statistical Analysis Software [computer program]. Version 8.Cary, NC:SAS Institute, Inc.;2000.
- .Use and misuse of the receiver operating characteristic curve in risk prediction.Circulation.2007;115(7):928–935.
- ,,,.Hospital and patient characteristics associated with death after surgery. A study of adverse occurrence and failure to rescue.Med Care.1992;30(7):615–629.
- ,,.Comparing the contributions of groups of predictors: which outcomes vary with hospital rather than patient characteristics?J Am Stat Assoc.1995;90(429):7–18.
- ,.Beyond the intensive care unit: A review of interventions aimed at anticipating and preventing in‐hospital cardiopulmonary arrest.Resuscitation.2005;67(1):13–23.
- ,,.Reproducibility of physiological track‐and‐trigger warning systems for identifying at‐risk patients on the ward.Intensive Care Med.2007;33(4):619–624.
- ,,,,.Serial evaluation of the SOFA score to predict outcome in critically ill patients.JAMA.2001;286(14):1754–1758.
- ,,.Incorporation of Physiologic Trend and Interaction Effects in Neonatal Severity of Illness Scores: An Experiment Using a Variant of the Richardson Score.Intensive Care Med.2007;33(9):1602–1608.
- ,,, et al.Diagnostic and prognostic value of procalcitonin in patients with septic shock.Crit Care Med.2004;32(5):1166–1169.
- ,,, et al.Identifying the sick: can biochemical measurements be used to aid decision making on presentation to the accident and emergency department.Br J Anaesth.2005;94(6):735–741.
- .Improving patient care. The cognitive psychology of missed diagnoses.Ann Intern Med.2005;142(2):115–120.
- ,,,,,.Using care bundles to reduce in‐hospital mortality: quantitative survey.BMJ.2010;340:c1234.
- ,,, et al.Effect of a rapid response system for patients in shock on time to treatment and mortality during 5 years.Crit Care Med.2007;35(11):2568–2575.
Copyright © 2010 Society of Hospital Medicine