User login
Statistical Modeling and Aggregate-Weighted Scoring Systems in Prediction of Mortality and ICU Transfer: A Systematic Review
Ensuring the delivery of safe and cost-effective care is the core mission of hospitals,1 but nearly 90% of unplanned patient transfers to critical care may be the result of a new or worsening condition.2 The cost of treatment of sepsis, respiratory failure, and arrest, which are among the deadliest conditions for hospitalized patients,3,4 are estimated to be $30.7 billion annually (8.1% of national hospital costs).5 As many as 44% of adverse events may be avoidable,6 and concerns about patient safety have motivated hospitals and health systems to find solutions to identify and treat deteriorating patients expeditiously. Evidence suggests that many hospitalized patients presenting with rapid decline showed warning signs 24-48 hours before the event.7 Therefore, ample time may be available for early identification and intervention in many patients.
As early as 1997, hospitals have used early warning systems (EWSs) to identify at-risk patients and proactively inform clinicians.8 EWSs can predict a proportion of patients who are at risk for clinical deterioration (this benefit is measured with sensitivity) with the tradeoff that some alerts are false (as measured with positive predictive value [PPV] or its inverse, workup-to-detection ratio [WDR]9-11). Historically, EWS tools were paper-based instruments designed for fast manual calculation by hospital staff. Many aggregate-weighted EWS instruments continue to be used for research and practice, including the Modified Early Warning Systems (MEWS)12 and National Early Warning System (NEWS).13,14 Aggregate-weighted EWSs lack predictive precision because they use simple addition of a few clinical parameter scores, including vital signs and level of consciousness.15 Recently, a new category has emerged, which use multivariable regression or machine learning; we refer to this category as “EWSs using statistical modeling”. This type of EWS uses more computationally intensive risk stratification methods to predict risk16 by adjusting for a larger set of clinical covariates, thereby reducing the degree of unexplained variance. Although these EWSs are thought to be more precise and to generate fewer false positive alarms compared with others,14,17-19 no review to date has systematically synthesized and compared their performance against aggregate-weighted EWSs.
Purpose
The purpose of this systematic review was to evaluate the recent literature regarding prognostic test accuracy and clinical workloads generated by EWSs using statistical modeling versus aggregate-weighted systems.
METHODS
Search Strategy
Adhering to PRISMA protocol guidelines for systematic reviews, we searched the peer-reviewed literature in PubMed and CINAHL Plus, as well as conference proceedings and online repositories of patient safety organizations published between January 1, 2012 and September 15, 2018. We selected this timeframe because EWSs using statistical modeling are relatively new approaches compared with the body of evidence concerning aggregate-weighted EWSs. An expert PhD researcher confirmed the search results in a blinded independent query.
Inclusion and Exclusion Criteria
We included peer-reviewed articles reporting the area under the receiver operator curve (AUC),20 or the equivalent c-statistic, of models predicting clinical deterioration (measured as the composite of transfer to intensive care unit (ICU) and/or mortality) among adult patients in general hospital wards. We excluded studies if they did not compare an EWS using statistical modeling with an aggregate-weighted EWS, did not report AUC, or only reported on an aggregate-weighted EWS. Excluded settings were pediatrics, obstetrics, emergency departments, ICUs, transitional care units, and oncology. We also excluded studies with samples limited to physiological monitoring, sepsis, or postsurgical subpopulations.
Data Abstraction
Following the TRIPOD guidelines for the reporting of predictive models,21 and the PRISMA and Cochrane Collaboration guidelines for systematic reviews,22-24 we extracted study characteristics (Table 1), sample demographics (Appendix Table 4), model characteristics and performance (Appendix Table 5), and level of scientific evidence and risk of bias (Appendix Table 6). To address the potential for overfitting, we selected model performance results of the validation dataset rather than the derivation dataset, if reported. If studies reported multiple models in either EWS category, we selected the best-performing model for comparison.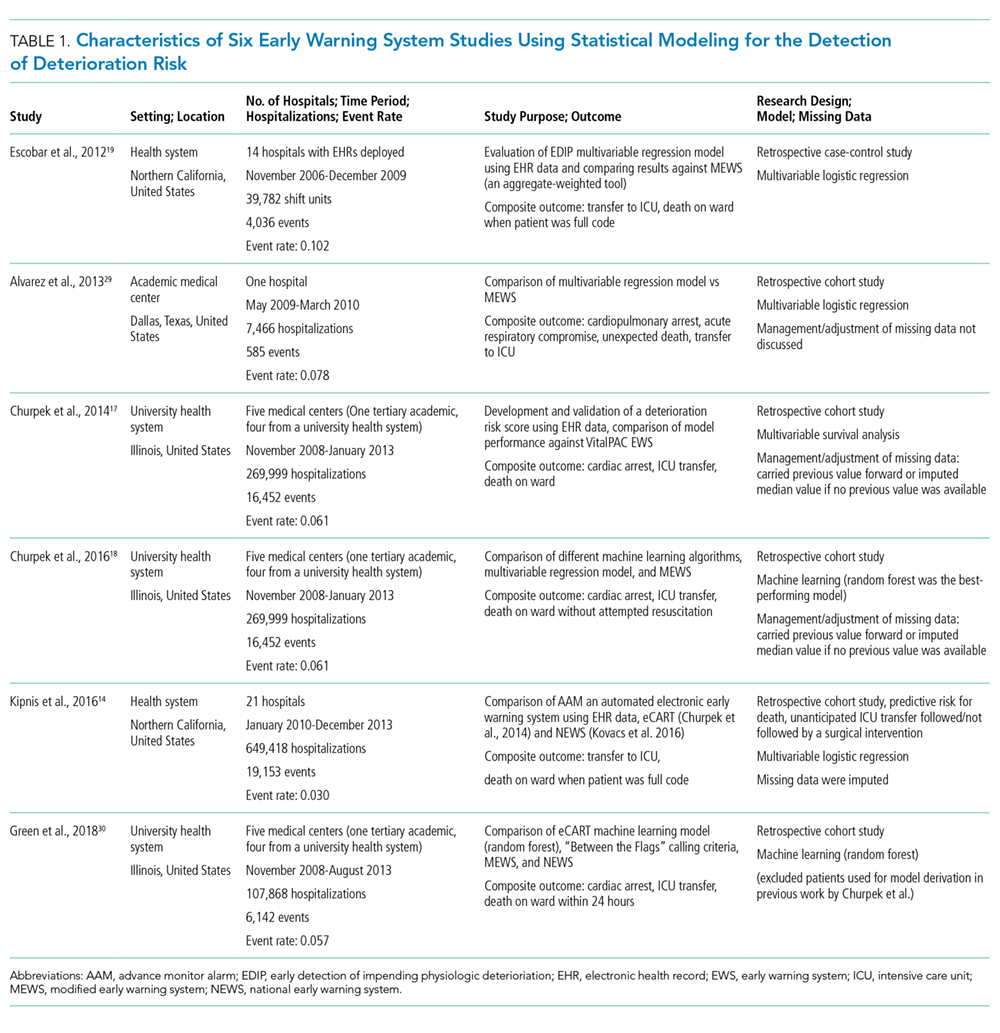
Measures of Model Performance
Because predictive models can achieve good case identification at the expense of high clinical workloads, an assessment of model performance would be incomplete without measures of clinical utility. For clinicians, this aspect can be measured as the model’s PPV (the percentage of true positive alerts among all alerts), or more intelligibly, as the WDR, which equals 1/PPV. WDR indicates the number of patients requiring evaluation to identify and treat one true positive case.9-11 It is known that differences in event rates (prevalence or pretest probability) influence a model’s PPV25 and its reciprocal WDR. However, for systematic comparison, PPV and WDR can be standardized using a fixed representative event rate across studies.24,26 We abstracted the reported PPV and WDR, and computed standardized PPV and WDR for an event rate of 4%.
Other measures included the area under the receiver operator curve (AUC),20 sensitivity, and specificity. AUC plots a model’s false positive rate (x-axis) against its true positive rate (y-axis), with an ideal scenario of very high y-values and very low x-values.27 Sensitivity (the model’s ability to detect a true positive case among all cases) and specificity (the model’s ability to detect a true noncase among all noncases28) are influenced by chosen alert thresholds. It is incorrect to assume that a given model produces only one sensitivity/specificity result; for systematic comparison, we therefore selected results in the 50% sensitivity range, and separately, in the 92% specificity range for EWSs using statistical modeling. Then, we simulated a fixed sensitivity of 0.51 and assumed specificity of 0.87 in aggregate-weighted EWSs.
RESULTS
Search Results
The PubMed search for “early warning score OR early warning system AND deterioration OR predict transfer ICU” returned 285 peer-reviewed articles. A search on CINAHL Plus using the same filters and query terms returned 219 articles with no additional matches (Figure 1). Of the 285 articles, we excluded 269 during the abstract screen and 10 additional articles during full-text review (Figure 1). A final review of the reference lists of the six selected studies did not yield additional articles.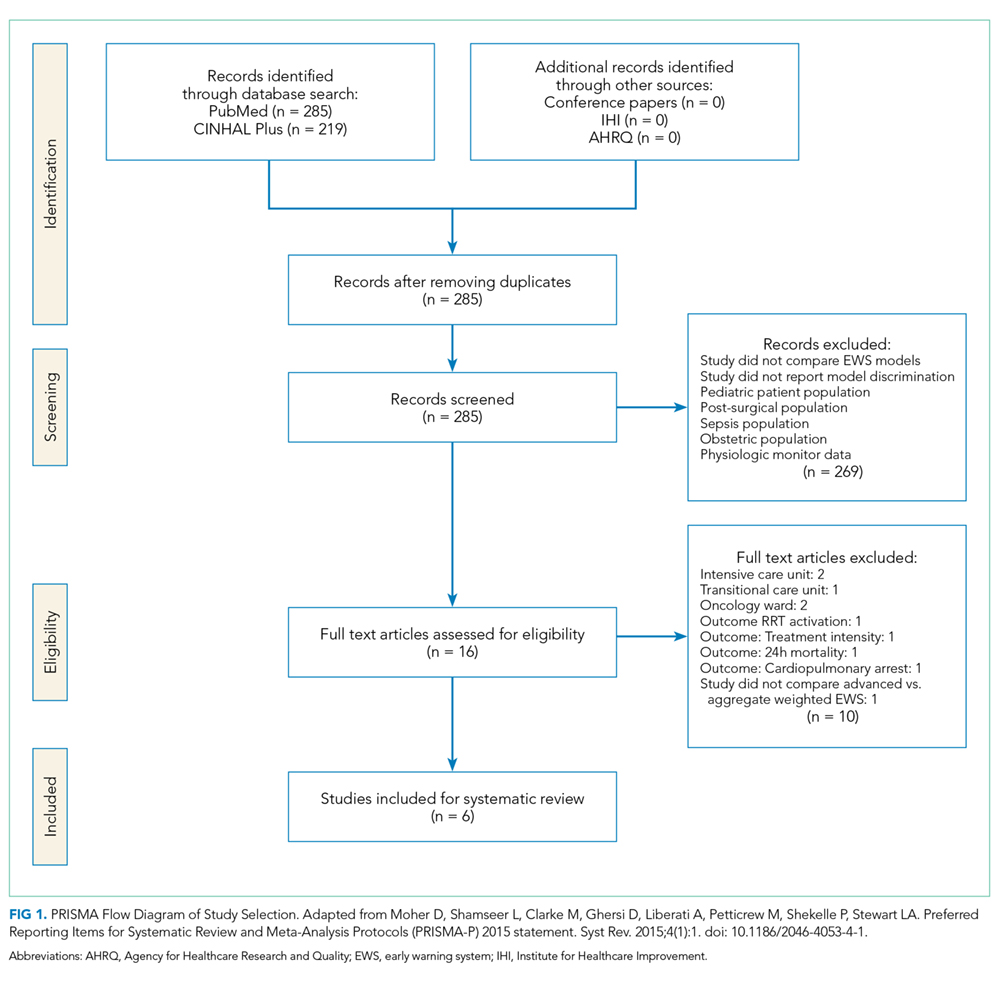
Study Characteristics
There were several similarities across the selected studies (Table 1). All occurred in the United States; all compared their model’s performance against at least one aggregate-weighted EWS model;14,17-19,29 and all used retrospective cohort designs. Of the six studies, one took place in a single hospital;29 three pooled data from five hospitals;17,18,30 and two occurred in a large integrated healthcare delivery system using data from 14 and, subsequently, 21 hospitals.14,19 The largest study14 included nearly 650,000 admissions, while the smallest study29 reported slightly less than 7,500 admissions. Of the six studies, four used multivariable regression,14,17,19,29 and two used machine learning techniques for outcome prediction.18,30
Outcome Variables
The primary outcome for inclusion in this review was clinical deterioration measured by the composite of transfer to ICU and some measure of mortality. Churpek et al.10,11 and Green et al.30 also included cardiac arrest, and Alvarez et al.22 included respiratory compromise in their outcome composite.
Researchers used varying definitions of mortality, including “death outside the ICU in a patient whose care directive was full code;”14,19 “death on the wards without attempted resuscitation;”17,18 “an in-hospital death in patients without a DNR order at admission that occurred on the medical ward or in ICU within 24 hours after transfer;”29 or “death within 24 hours.”30
Predictor Variables
We observed a broad assortment of predictor variables. All models included vital signs (heart rate, respiratory rate, blood pressure, and venous oxygen saturation); mental state; laboratory data; age; and sex. Additional variables included comorbidity, shock index,31 severity of illness score, length of stay, event time of day, season, admission category, and length of stay,14,19 among others.
Model Performance
Reported PPV ranged from 0.16 to 0.42 (mean = 0.27) in EWSs using statistical modeling and 0.15 to 0.28 (mean = 0.19) in aggregate-weighted EWS models. The weighted mean standardized PPV, adjusted for an event rate of 4% across studies (Table 2), was 0.21 in EWSs using statistical modeling versus 0.14 in aggregate-weighted EWS models (simulated at 0.51 sensitivity and 0.87 specificity).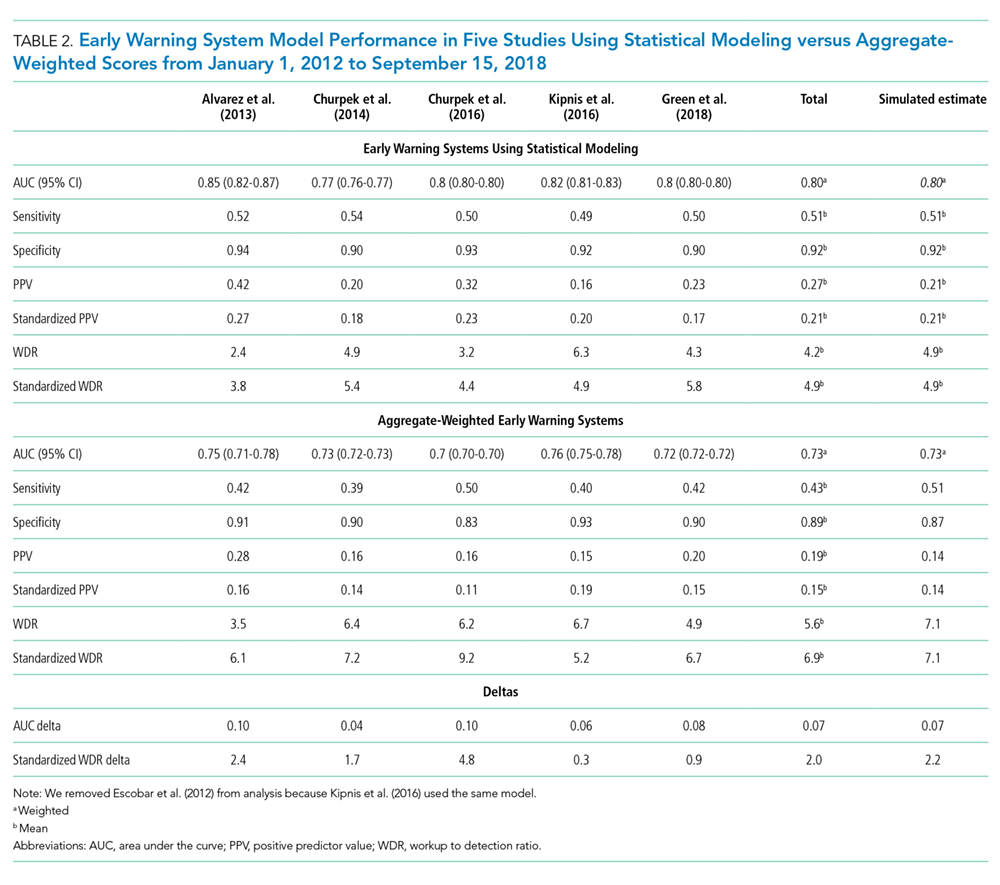
Only two studies14,19 reported the WDR metric (alerts generated to identify one true positive case) explicitly. Based on the above PPV results, EWSs using statistical modeling generated a standardized WDR of 4.9 in models using statistical modeling versus 7.1 in aggregate-weighted models (Figure 2). The delta of 2.2 evaluations to find and treat one true positive case equals a 45% relative increase in RRT evaluation workloads using aggregate-weighted EWSs.
AUC values ranged from 0.77 to 0.85 (weighted mean = 0.80) in EWSs using statistical modeling, indicating good model discrimination. AUCs of aggregate-weighted EWSs ranged from 0.70 to 0.76 (weighted mean = 0.73), indicating fair model discrimination (Figure 2). The overall AUC delta was 0.07. However, our estimates may possibly be favoring EWSs that use statistical modeling by virtue of their derivation in an original research population compared with aggregate-weighted EWSs that were derived externally. For example, sensitivity analysis of eCART,18 an EWS using machine learning, showed an AUC drop of 1% in a large external patient population,14 while NEWS AUCs13 dropped between 11% and 15% in two large external populations (Appendix Table 7).14,30 For hospitals adopting an externally developed EWS using statistical modeling, these results suggest that an AUC delta of approximately 5% can be expected and 7% for an internally developed EWS.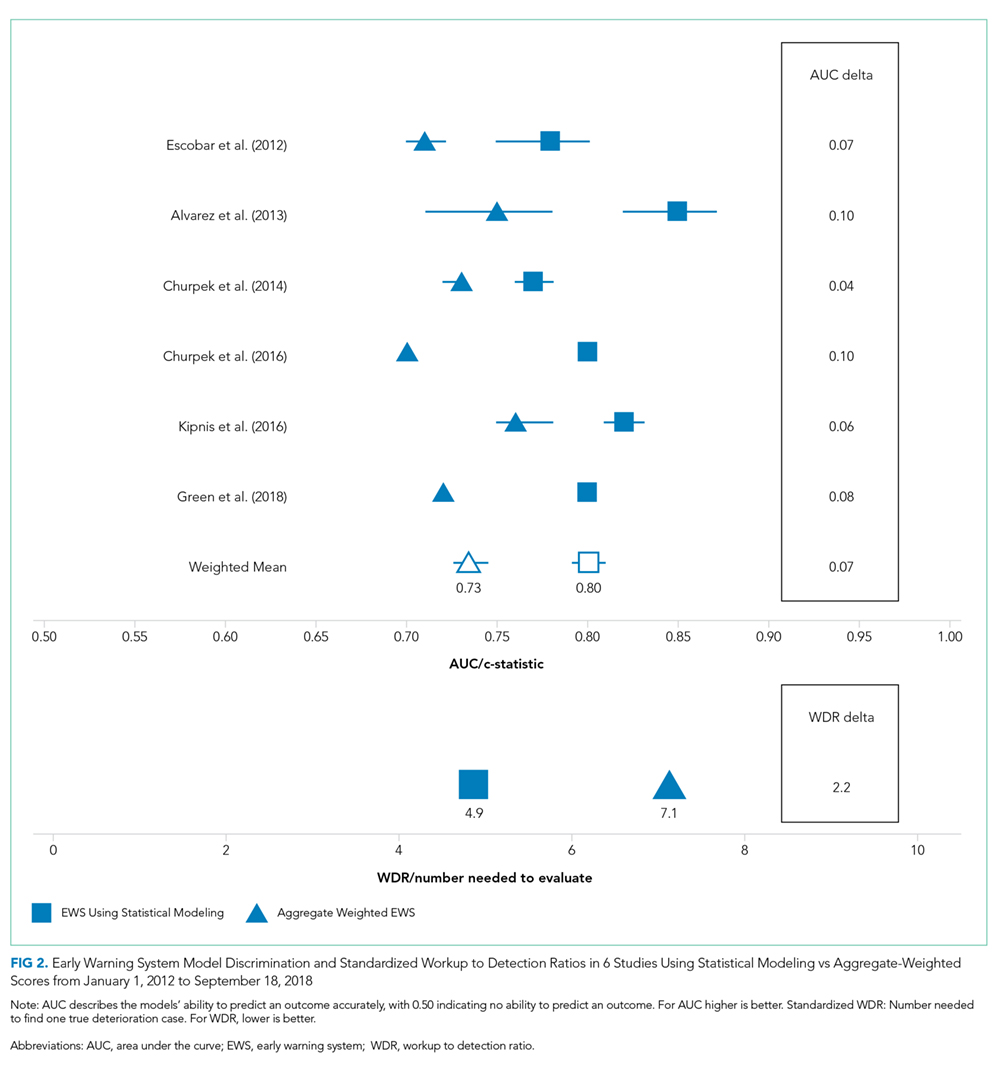
The models’ sensitivity ranged from 0.49 to 0.54 (mean = 0.51) for EWSs using statistical modeling and 0.39 to 0.50 (mean = 0.43). These results were based on chosen alert volume cutoffs. Specificity ranged from 0.90 to 0.94 (mean = 0.92) in EWSs using statistical modeling compared with 0.83 to 0.93 (mean = 0.89) in aggregate-weighted EWS models. At the 0.51 sensitivity level (mean sensitivity of reported EWSs using statistical modeling), aggregate-weighted EWSs would have an estimated specificity of approximately 0.87. Conversely, to reach a specificity of 0.92 (mean specificity of reported EWSs using statistical modeling, aggregate-weighted EWSs would have a sensitivity of approximately 0.42 compared with 0.50 in EWSs using statistical modeling (based on three studies reporting both sensitivity and specificity or an AUC graph).
Risk of Bias Assessment
We scored the studies by adapting the Cochrane Collaboration tool for assessing risk of bias 32 (Appendix Table 5). Of the six studies, five received total scores between 1.0 and 2.0 (indicating relatively low bias risk), and one study had a score of 3.5 (indicating higher bias risk). Low bias studies14,17-19,30 used large samples across multiple hospitals, discussed the choice of predictor variables and outcomes more precisely, and reported their measurement approaches and analytic methods in more detail, including imputation of missing data and model calibration.
DISCUSSION
In this systematic review, we assessed the predictive ability of EWSs using statistical modeling versus aggregate-weighted EWS models to detect clinical deterioration risk in hospitalized adults in general wards. From 2007 to 2018, at least five systematic reviews examined aggregate-weighted EWSs in adult inpatient settings.33-37 No systematic review, however, has synthesized the evidence of EWSs using statistical modeling.
The recent evidence is limited to six studies, of which five had favorable risk of bias scores. All studies included in this review demonstrated superior model performance of the EWSs using statistical modeling compared with an aggregate-weighted EWS, and at least five of the six studies employed rigor in design, measurement, and analytic method. The AUC absolute difference between EWSs using statistical modeling and aggregate-weighted EWSs was 7% overall, moving model performance from fair to good (Table 2; Figure 2). Although this increase in discriminative power may appear modest, it translates into avoiding a 45% increase in WDR workload generated by an aggregate-weighted EWS, approximately two patient evaluations for each true positive case.
Results of our review suggest that EWSs using statistical modeling predict clinical deterioration risk with better precision. This is an important finding for the following reasons: (1) Better risk prediction can support the activation of rescue; (2) Given federal mandates to curb spending, the elimination of some resource-intensive false positive evaluations supports high-value care;38 and (3) The Quadruple Aim39 accounts for clinician wellbeing. EWSs using statistical modeling may offer benefits in terms of clinician satisfaction with the human–system interface because better discrimination reduces the daily evaluation workload/cognitive burden and because the reduction of false positive alerts may reduce alert fatigue.40,41
Still, an important issue with risk detection is that it is unknown which percentage of patients are uniquely identified by an EWS and not already under evaluation by the clinical team. For example, a recent study by Bedoya et al.42 found that using NEWS did not improve clinical outcomes and nurses frequently disregarded the alert. Another study43 found that the combined clinical judgment of physicians and nurses had an AUC of 0.90 in predicting mortality. These results suggest that at certain times, an EWS alert may not add new useful information for clinicians even when it correctly identifies deterioration risk. It remains difficult to define exactly how many patients an EWS would have to uniquely identify to have clinical utility.
Even EWSs that use statistical modeling cannot detect all true deterioration cases perfectly, and they may at times trigger an alert only when the clinical team is already aware of a patient’s clinical decline. Consequently, EWSs using statistical modeling can at best augment and support—but not replace—RRT rounding, physician workup, and vigilant frontline staff. However, clinicians, too, are not perfect, and the failure-to-rescue literature suggests that certain human factors are antecedents to patient crises (eg, stress and distraction,44-46 judging by precedent/experience,44,47 and innate limitations of human cognition47). Because neither clinicians nor EWSs can predict deterioration perfectly, the best possible rescue response combines clinical vigilance, RRT rounding, and EWSs using statistical modeling as complementary solutions.
Our findings suggest that predictive models cannot be judged purely on AUC (in fact, it would be ill-advised) but also by their clinical utility (expressed in WDR and PPV): How many patients does a clinician need to evaluate?9-11 Precision is not meaningful if it comes at the expense of unmanageable evaluation workloads, and our findings suggest that clinicians should evaluate models based on their clinical utility. Hospitals considering adoption of an EWS using statistical modeling should consider that externally developed EWSs appear to experience a performance drop when applied to a new patient population; a slightly higher WDR and slightly lower AUC can be expected. EWSs using statistical modeling appear to perform best when tailored to the targeted patient population (or are derived in-house). Model depreciation over time will likely require recalibration. In addition, adoption of a machine learning algorithm may mean that original model results are obscured by the black box output of the algorithm.48-50
Findings from this systematic review are subject to several limitations. First, we applied strict inclusion criteria, which led us to exclude studies that offered findings in specialty units and specific patient subpopulations, among others. In the interest of systematic comparison, our findings are limited to general wards. We also restricted our search to recent studies that reported on models predicting clinical deterioration, which we defined as the composite of ICU transfer and/or death. Clinically, deteriorating patients in general wards either die or are transferred to ICU. This criterion resulted in exclusion of the Rothman Index,51 which predicts “death within 24 hours” but not ICU transfer. The AUC in this study was higher than those selected in this review (0.93 compared to 0.82 for MEWS; AUC delta: 0.09). The higher AUC may be a function of the outcome definition (30-day mortality would be more challenging to predict). Therefore, hospitals or health systems interested in purchasing an EWS using statistical modeling should carefully consider the outcome selection and definition.
Second, as is true for systematic reviews in general,52 the degree of clinical and methodological heterogeneity across the selected studies may limit our findings. Studies occurred in various settings (university hospital, teaching hospitals, and community hospitals), which may serve diverging patient populations. We observed that studies in university-based settings had a higher event rate ranging from 5.6% to 7.8%, which may result in higher PPV results in these settings. However, this increase would apply to both EWS types equally. To arrive at a “true” reflection of model performance, the simulations for PPV and WDR have used a more conservative event rate of 4%. We observed heterogenous mortality definitions, which did not always account for the reality that a patient’s death may be an appropriate outcome (ie, it was concordant with treatment wishes in the context of severe illness or an end-of-life trajectory). Studies also used different sampling procedures; some allowed multiple observations although most did not. The variation in sampling may change PPV and limit our systematic comparison. However, regardless of methodological differences, our review suggests that EWSs using statistical modeling perform better than aggregate-weighted EWSs in each of the selected studies.
Third, systematic reviews may be subject to the issue of publication bias because they can only compare published results and could possibly omit an unknown number of unpublished studies. However, the selected studies uniformly demonstrated similar model improvements, which are plausibly related to the larger number of covariates, statistical methods, and shrinkage of random error.
Finally, this review was limited to the comparison of observational studies, which aimed to answer how the two EWS classes compared. These studies did not address whether an alert had an impact on clinical care and patient outcomes. Results from at least one randomized nonblinded controlled trial suggest that alert-driven RRT activation may reduce the length of stay by 24 hours and use of oximetry, but has no impact on mortality, ICU transfer, and ICU length of stay.53
CONCLUSION
Our findings point to three areas of need for the field of predictive EWS research: (1) a standardized set of clinical deterioration outcome measures, (2) a standardized set of measures capturing clinical evaluation workload and alert frequency, and (3) cost estimates of clinical workloads with and without deployment of an EWS using statistical modeling. Given the present divergence of outcome definitions, EWS research may benefit from a common “clinical deterioration” outcome standard, including transfer to ICU, inpatient/30-day/90-day mortality, and death with DNR, comfort care, or hospice. The field is lacking a standardized clinical workload measure and an understanding of the net percentage of patients uniquely identified by an EWS.
By using predictive analytics, health systems may be better able to achieve the goals of high-value care and patient safety and support the Quadruple Aim. Still, gaps in knowledge exist regarding the measurement of the clinical processes triggered by EWSs, evaluation workloads, alert fatigue, clinician burnout associated with the human-alert interface, and costs versus benefits. Future research should evaluate the degree to which EWSs can identify risk among patients who are not already under evaluation by the clinical team, assess the balanced treatment effects of RRT interventions between decedents and survivors, and investigate clinical process times relative to the time of an EWS alert using statistical modeling.
Acknowledgments
The authors would like to thank Ms. Jill Pope at the Kaiser Permanente Center for Health Research in Portland, OR for her assistance with manuscript preparation. Daniel Linnen would like to thank Dr. Linda Franck, PhD, RN, FAAN, Professor at the University of California, San Francisco, School of Nursing for reviewing the manuscript.
Disclosures
The authors declare no conflicts of interest.
Funding
The Maribelle & Stephen Leavitt Scholarship, the Jonas Nurse Scholars Scholarship at the University of California, San Francisco, and the Nurse Scholars Academy Predoctoral Research Fellowship at Kaiser Permanente Northern California supported this study during Daniel Linnen’s doctoral training at the University of California, San Francisco. Dr. Vincent Liu was funded by National Institute of General Medical Sciences Grant K23GM112018.
1. Institute of Medicine (US) Committee on Quality of Health Care in America; Kohn LT, Corrigan JM, Donaldson MS, editors. To Err is Human: Building a Safer Health System. Washington (DC): National Academies Press (US); 2000. PubMed
2. Bapoje SR, Gaudiani JL, Narayanan V, Albert RK. Unplanned transfers to a medical intensive care unit: causes and relationship to preventable errors in care. J Hosp Med. 2011;6(2):68-72. doi: 10.1002/jhm.812. PubMed
3. Liu V, Escobar GJ, Greene JD, et al. Hospital deaths in patients with sepsis from 2 independent cohorts. JAMA. 2014;312(1):90-92. doi: 10.1001/jama.2014.5804. PubMed
4. Winters BD, Pham JC, Hunt EA, et al. Rapid response systems: a systematic review. Crit Care Med. 2007;35(5):1238-1243. doi: 10.1097/01.CCM.0000262388.85669.68. PubMed
5. Torio C. Andrews RM (AHRQ). National inpatient hospital costs: the most expensive conditions by payer, 2011. HCUP Statistical Brief# 160. August 2013. Agency for Healthcare Research and Quality, Rockville, MD. Agency for Healthcare Research and Quality. 2015. http://www.ncbi.nlm.nih.gov/books/NBK169005/. Accessed July 10, 2018. PubMed
6. Levinson DR, General I. Adverse events in hospitals: national incidence among Medicare beneficiaries. Department of Health and Human Services Office of the Inspector General. 2010.
7. McGaughey J, Alderdice F, Fowler R, et al. Outreach and Early Warning Systems (EWS) for the prevention of intensive care admission and death of critically ill adult patients on general hospital wards. Cochrane Database Syst Rev. 2007;3(3):CD005529:Cd005529. doi: 10.1002/14651858.CD005529.pub2. PubMed
8. Morgan R, Williams F, Wright M. An early warning score for the early detection of patients with impending illness. Clin Intensive Care. 1997;8:100.
9. Escobar GJ, Dellinger RP. Early detection, prevention, and mitigation of critical illness outside intensive care settings. J Hosp Med. 2016;11(1):S5-S10. doi: 10.1002/jhm.2653. PubMed
10. Escobar GJ, Ragins A, Scheirer P, et al. Nonelective rehospitalizations and postdischarge mortality: predictive models suitable for use in real time. Med Care. 2015;53(11):916-923. doi: 10.1097/MLR.0000000000000435. PubMed
11. Liu VX. Toward the “plateau of productivity”: enhancing the value of machine learning in critical care. Crit Care Med. 2018;46(7):1196-1197. doi: 10.1097/CCM.0000000000003170. PubMed
12. Subbe CP, Kruger M, Rutherford P, Gemmel L. Validation of a modified Early Warning Score in medical admissions. QJM. 2001;94(10):521-526. doi: 10.1093/qjmed/94.10.521. PubMed
13. Smith GB, Prytherch DR, Meredith P, Schmidt PE, Featherstone PI. The ability of the National Early Warning Score (NEWS) to discriminate patients at risk of early cardiac arrest, unanticipated intensive care unit admission, and death. Resuscitation. 2013;84(4):465-470. doi: 10.1016/j.resuscitation.2012.12.016. PubMed
14. Kipnis P, Turk BJ, Wulf DA, et al. Development and validation of an electronic medical record-based alert score for detection of inpatient deterioration outside the ICU. J Biomed Inform. 2016;64:10-19. doi: 10.1016/j.jbi.2016.09.013. PubMed
15. Romero-Brufau S, Huddleston JM, Naessens JM, et al. Widely used track and trigger scores: are they ready for automation in practice? Resuscitation. 2014;85(4):549-552. doi: 10.1016/j.resuscitation.2013.12.017. PubMed
16. Bates DW, Saria S, Ohno-Machado L, Shah A, Escobar G. Big data in health care: using analytics to identify and manage high-risk and high-cost patients. Health Aff (Millwood). 2014;33(7):1123-1131. doi: 10.1377/hlthaff.2014.0041. PubMed
17. Churpek MM, Yuen TC, Park SY, Gibbons R, Edelson DP. Using electronic health record data to develop and validate a prediction model for adverse outcomes in the wards. Crit Care Med. 2014;42(4):841-848. doi: 10.1097/CCM.0000000000000038. PubMed
18. Churpek MM, Yuen TC, Winslow C, et al. Multicenter comparison of machine learning methods and conventional regression for predicting clinical deterioration on the wards. Crit Care Med. 2016;44(2):368-374. doi: 10.1097/CCM.0000000000001571. PubMed
19. Escobar GJ, LaGuardia JC, Turk BJ, et al. Early detection of impending physiologic deterioration among patients who are not in intensive care: development of predictive models using data from an automated electronic medical record. J Hosp Med. 2012;7(5):388-395. doi: 10.1002/jhm.1929. PubMed
20. Zweig MH, Campbell G. Receiver-operating characteristic (ROC) plots: a fundamental evaluation tool in clinical medicine. Clin Chem. 1993;39(4):561-577. PubMed
21. Collins GS, Reitsma JB, Altman DG, Moons KG. Transparent reporting of a multivariable prediction model for individual prognosis or diagnosis (TRIPOD): the TRIPOD statement. BMC Med. 2015;13(1):1. doi: 10.1186/s12916-014-0241-z. PubMed
22. Moher D, Liberati A, Tetzlaff J, Altman DG, PRISMA Group. Preferred reporting items for systematic reviews and meta-analyses: the Prisma statement. PLOS Med. 2009;6(7):e1000097. doi: 10.1371/journal.pmed.1000097. PubMed
23. Higgins JP, Green S. Cochrane handbook for systematic reviews of interventions version 5.1. 0. The Cochrane Collaboration. 2011;5.
24. Bossuyt P, Davenport C, Deeks J, et al. Interpreting results and drawing conclusions. In: Higgins PTJ, Green S, eds. Cochrane Handbook for Systematic Reviews of Diagnostic Test Accuracy Version 0.9. The Cochrane Collaboration; 2013. Chapter 11
25. Altman DG, Bland JM. Statistics Notes: Diagnostic tests 2: predictive values. BMJ. 1994;309(6947):102. doi: 10.1136/bmj.309.6947.102. PubMed
26. Heston TF. Standardizing predictive values in diagnostic imaging research. J Magn Reson Imaging. 2011;33(2):505; author reply 506-507. doi: 10.1002/jmri.22466. PubMed
27. Hanley JA, McNeil BJ. The meaning and use of the area under a receiver operating characteristic (ROC) curve. Radiology. 1982;143(1):29-36. doi: 10.1148/radiology.143.1.7063747. PubMed
28. Bewick V, Cheek L, Ball J. Statistics review 13: receiver operating characteristic curves. Crit Care. 2004;8(6):508-512. doi: 10.1186/cc3000. PubMed
29. Alvarez CA, Clark CA, Zhang S, et al. Predicting out of intensive care unit cardiopulmonary arrest or death using electronic medical record data. BMC Med Inform Decis Mak. 2013;13:28. doi: 10.1186/1472-6947-13-28. PubMed
30. Green M, Lander H, Snyder A, et al. Comparison of the between the FLAGS calling criteria to the MEWS, NEWS and the electronic Cardiac Arrest Risk Triage (eCART) score for the identification of deteriorating ward patients. Resuscitation. 2018;123:86-91. doi: 10.1016/j.resuscitation.2017.10.028. PubMed
31. Berger T, Green J, Horeczko T, et al. Shock index and early recognition of sepsis in the emergency department: pilot study. West J Emerg Med. 2013;14(2):168-174. doi: 10.5811/westjem.2012.8.11546. PubMed
32. Higgins JPT, Altman DG, Gøtzsche PC, et al. The Cochrane Collaboration’s tool for assessing risk of bias in randomised trials. BMJ. 2011;343:d5928-d5928. doi: 10.1136/bmj.d5928.
33. Johnstone CC, Rattray J, Myers L. Physiological risk factors, early warning scoring systems and organizational changes. Nurs Crit Care. 2007;12(5):219-224. doi: 10.1111/j.1478-5153.2007.00238.x. PubMed
34. McNeill G, Bryden D. Do either early warning systems or emergency response teams improve hospital patient survival? A systematic review. Resuscitation. 2013;84(12):1652-1667. doi: 10.1016/j.resuscitation.2013.08.006. PubMed
35. Smith M, Chiovaro J, O’Neil M, et al. Early Warning System Scores: A Systematic Review. In: Washington (DC): Department of Veterans Affairs (US); 2014 Jan: https://www.ncbi.nlm.nih.gov/books/NBK259031/. Accessed January 23, 2017. PubMed
36. Smith ME, Chiovaro JC, O’Neil M, et al. Early warning system scores for clinical deterioration in hospitalized patients: a systematic review. Ann Am Thorac Soc. 2014;11(9):1454-1465. doi: 10.1513/AnnalsATS.201403-102OC. PubMed
37. Subbe CP, Williams E, Fligelstone L, Gemmell L. Does earlier detection of critically ill patients on surgical wards lead to better outcomes? Ann R Coll Surg Engl. 2005;87(4):226-232. doi: 10.1308/003588405X50921. PubMed
38. Berwick DM, Hackbarth AD. Eliminating waste in us health care. JAMA. 2012;307(14):1513-1516. doi: 10.1001/jama.2012.362. PubMed
39. Sikka R, Morath JM, Leape L. The Quadruple Aim: care, health, cost and meaning in work.. BMJ Quality & Safety. 2015;24(10):608-610. doi: 10.1136/bmjqs-2015-004160. PubMed
40. Guardia-Labar LM, Scruth EA, Edworthy J, Foss-Durant AM, Burgoon DH. Alarm fatigue: the human-system interface. Clin Nurse Spec. 2014;28(3):135-137. doi: 10.1097/NUR.0000000000000039. PubMed
41. Ruskin KJ, Hueske-Kraus D. Alarm fatigue: impacts on patient safety. Curr Opin Anaesthesiol. 2015;28(6):685-690. doi: 10.1097/ACO.0000000000000260. PubMed
42. Bedoya AD, Clement ME, Phelan M, et al. Minimal impact of implemented early warning score and best practice alert for patient deterioration. Crit Care Med. 2019;47(1):49-55. doi: 10.1097/CCM.0000000000003439. PubMed
43. Brabrand M, Hallas J, Knudsen T. Nurses and physicians in a medical admission unit can accurately predict mortality of acutely admitted patients: A prospective cohort study. PLoS One. 2014;9(7):e101739. doi: 10.1371/journal.pone.0101739. PubMed
44. Acquaviva K, Haskell H, Johnson J. Human cognition and the dynamics of failure to rescue: the Lewis Blackman case. J Prof Nurs. 2013;29(2):95-101. doi: 10.1016/j.profnurs.2012.12.009. PubMed
45. Jones A, Johnstone MJ. Inattentional blindness and failures to rescue the deteriorating patient in critical care, emergency and perioperative settings: four case scenarios. Aust Crit Care. 2017;30(4):219-223. doi: 10.1016/j.aucc.2016.09.005. PubMed
46. Reason J. Understanding adverse events: human factors. Qual Health Care. 1995;4(2):80-89. doi: 10.1136/qshc.4.2.80. PubMed
47. Bate L, Hutchinson A, Underhill J, Maskrey N. How clinical decisions are made. Br J Clin Pharmacol. 2012;74(4):614-620. doi: 10.1111/j.1365-2125.2012.04366.x. PubMed
48. Cabitza F, Rasoini R, Gensini GF. Unintended consequences of machine learning in medicine. JAMA. 2017;318(6):517-518. doi: 10.1001/jama.2017.7797. PubMed
49. Stead WW. Clinical implications and challenges of artificial intelligence and deep learning. JAMA. 2018;320(11):1107-1108. doi: 10.1001/jama.2018.11029. PubMed
50. Wong TY, Bressler NM. Artificial intelligence with deep learning technology looks into diabetic retinopathy screening. JAMA. 2016;316(22):2366-2367. doi: 10.1001/jama.2016.17563. PubMed
51. Finlay GD, Rothman MJ, Smith RA. Measuring the modified early warning score and the Rothman index: advantages of utilizing the electronic medical record in an early warning system. J Hosp Med. 2014;9(2):116-119. doi: 10.1002/jhm.2132. PubMed
52. Gagnier JJ, Moher D, Boon H, Beyene J, Bombardier C. Investigating clinical heterogeneity in systematic reviews: a methodologic review of guidance in the literature. BMC Med Res Methodol. 2012;12:111-111. doi: 10.1186/1471-2288-12-111. PubMed
53. Kollef MH, Chen Y, Heard K, et al. A randomized trial of real-time automated clinical deterioration alerts sent to a rapid response team. J Hosp Med. 2014;9(7):424-429. doi: 10.1002/jhm.2193. PubMed
Ensuring the delivery of safe and cost-effective care is the core mission of hospitals,1 but nearly 90% of unplanned patient transfers to critical care may be the result of a new or worsening condition.2 The cost of treatment of sepsis, respiratory failure, and arrest, which are among the deadliest conditions for hospitalized patients,3,4 are estimated to be $30.7 billion annually (8.1% of national hospital costs).5 As many as 44% of adverse events may be avoidable,6 and concerns about patient safety have motivated hospitals and health systems to find solutions to identify and treat deteriorating patients expeditiously. Evidence suggests that many hospitalized patients presenting with rapid decline showed warning signs 24-48 hours before the event.7 Therefore, ample time may be available for early identification and intervention in many patients.
As early as 1997, hospitals have used early warning systems (EWSs) to identify at-risk patients and proactively inform clinicians.8 EWSs can predict a proportion of patients who are at risk for clinical deterioration (this benefit is measured with sensitivity) with the tradeoff that some alerts are false (as measured with positive predictive value [PPV] or its inverse, workup-to-detection ratio [WDR]9-11). Historically, EWS tools were paper-based instruments designed for fast manual calculation by hospital staff. Many aggregate-weighted EWS instruments continue to be used for research and practice, including the Modified Early Warning Systems (MEWS)12 and National Early Warning System (NEWS).13,14 Aggregate-weighted EWSs lack predictive precision because they use simple addition of a few clinical parameter scores, including vital signs and level of consciousness.15 Recently, a new category has emerged, which use multivariable regression or machine learning; we refer to this category as “EWSs using statistical modeling”. This type of EWS uses more computationally intensive risk stratification methods to predict risk16 by adjusting for a larger set of clinical covariates, thereby reducing the degree of unexplained variance. Although these EWSs are thought to be more precise and to generate fewer false positive alarms compared with others,14,17-19 no review to date has systematically synthesized and compared their performance against aggregate-weighted EWSs.
Purpose
The purpose of this systematic review was to evaluate the recent literature regarding prognostic test accuracy and clinical workloads generated by EWSs using statistical modeling versus aggregate-weighted systems.
METHODS
Search Strategy
Adhering to PRISMA protocol guidelines for systematic reviews, we searched the peer-reviewed literature in PubMed and CINAHL Plus, as well as conference proceedings and online repositories of patient safety organizations published between January 1, 2012 and September 15, 2018. We selected this timeframe because EWSs using statistical modeling are relatively new approaches compared with the body of evidence concerning aggregate-weighted EWSs. An expert PhD researcher confirmed the search results in a blinded independent query.
Inclusion and Exclusion Criteria
We included peer-reviewed articles reporting the area under the receiver operator curve (AUC),20 or the equivalent c-statistic, of models predicting clinical deterioration (measured as the composite of transfer to intensive care unit (ICU) and/or mortality) among adult patients in general hospital wards. We excluded studies if they did not compare an EWS using statistical modeling with an aggregate-weighted EWS, did not report AUC, or only reported on an aggregate-weighted EWS. Excluded settings were pediatrics, obstetrics, emergency departments, ICUs, transitional care units, and oncology. We also excluded studies with samples limited to physiological monitoring, sepsis, or postsurgical subpopulations.
Data Abstraction
Following the TRIPOD guidelines for the reporting of predictive models,21 and the PRISMA and Cochrane Collaboration guidelines for systematic reviews,22-24 we extracted study characteristics (Table 1), sample demographics (Appendix Table 4), model characteristics and performance (Appendix Table 5), and level of scientific evidence and risk of bias (Appendix Table 6). To address the potential for overfitting, we selected model performance results of the validation dataset rather than the derivation dataset, if reported. If studies reported multiple models in either EWS category, we selected the best-performing model for comparison.
Measures of Model Performance
Because predictive models can achieve good case identification at the expense of high clinical workloads, an assessment of model performance would be incomplete without measures of clinical utility. For clinicians, this aspect can be measured as the model’s PPV (the percentage of true positive alerts among all alerts), or more intelligibly, as the WDR, which equals 1/PPV. WDR indicates the number of patients requiring evaluation to identify and treat one true positive case.9-11 It is known that differences in event rates (prevalence or pretest probability) influence a model’s PPV25 and its reciprocal WDR. However, for systematic comparison, PPV and WDR can be standardized using a fixed representative event rate across studies.24,26 We abstracted the reported PPV and WDR, and computed standardized PPV and WDR for an event rate of 4%.
Other measures included the area under the receiver operator curve (AUC),20 sensitivity, and specificity. AUC plots a model’s false positive rate (x-axis) against its true positive rate (y-axis), with an ideal scenario of very high y-values and very low x-values.27 Sensitivity (the model’s ability to detect a true positive case among all cases) and specificity (the model’s ability to detect a true noncase among all noncases28) are influenced by chosen alert thresholds. It is incorrect to assume that a given model produces only one sensitivity/specificity result; for systematic comparison, we therefore selected results in the 50% sensitivity range, and separately, in the 92% specificity range for EWSs using statistical modeling. Then, we simulated a fixed sensitivity of 0.51 and assumed specificity of 0.87 in aggregate-weighted EWSs.
RESULTS
Search Results
The PubMed search for “early warning score OR early warning system AND deterioration OR predict transfer ICU” returned 285 peer-reviewed articles. A search on CINAHL Plus using the same filters and query terms returned 219 articles with no additional matches (Figure 1). Of the 285 articles, we excluded 269 during the abstract screen and 10 additional articles during full-text review (Figure 1). A final review of the reference lists of the six selected studies did not yield additional articles.
Study Characteristics
There were several similarities across the selected studies (Table 1). All occurred in the United States; all compared their model’s performance against at least one aggregate-weighted EWS model;14,17-19,29 and all used retrospective cohort designs. Of the six studies, one took place in a single hospital;29 three pooled data from five hospitals;17,18,30 and two occurred in a large integrated healthcare delivery system using data from 14 and, subsequently, 21 hospitals.14,19 The largest study14 included nearly 650,000 admissions, while the smallest study29 reported slightly less than 7,500 admissions. Of the six studies, four used multivariable regression,14,17,19,29 and two used machine learning techniques for outcome prediction.18,30
Outcome Variables
The primary outcome for inclusion in this review was clinical deterioration measured by the composite of transfer to ICU and some measure of mortality. Churpek et al.10,11 and Green et al.30 also included cardiac arrest, and Alvarez et al.22 included respiratory compromise in their outcome composite.
Researchers used varying definitions of mortality, including “death outside the ICU in a patient whose care directive was full code;”14,19 “death on the wards without attempted resuscitation;”17,18 “an in-hospital death in patients without a DNR order at admission that occurred on the medical ward or in ICU within 24 hours after transfer;”29 or “death within 24 hours.”30
Predictor Variables
We observed a broad assortment of predictor variables. All models included vital signs (heart rate, respiratory rate, blood pressure, and venous oxygen saturation); mental state; laboratory data; age; and sex. Additional variables included comorbidity, shock index,31 severity of illness score, length of stay, event time of day, season, admission category, and length of stay,14,19 among others.
Model Performance
Reported PPV ranged from 0.16 to 0.42 (mean = 0.27) in EWSs using statistical modeling and 0.15 to 0.28 (mean = 0.19) in aggregate-weighted EWS models. The weighted mean standardized PPV, adjusted for an event rate of 4% across studies (Table 2), was 0.21 in EWSs using statistical modeling versus 0.14 in aggregate-weighted EWS models (simulated at 0.51 sensitivity and 0.87 specificity).
Only two studies14,19 reported the WDR metric (alerts generated to identify one true positive case) explicitly. Based on the above PPV results, EWSs using statistical modeling generated a standardized WDR of 4.9 in models using statistical modeling versus 7.1 in aggregate-weighted models (Figure 2). The delta of 2.2 evaluations to find and treat one true positive case equals a 45% relative increase in RRT evaluation workloads using aggregate-weighted EWSs.
AUC values ranged from 0.77 to 0.85 (weighted mean = 0.80) in EWSs using statistical modeling, indicating good model discrimination. AUCs of aggregate-weighted EWSs ranged from 0.70 to 0.76 (weighted mean = 0.73), indicating fair model discrimination (Figure 2). The overall AUC delta was 0.07. However, our estimates may possibly be favoring EWSs that use statistical modeling by virtue of their derivation in an original research population compared with aggregate-weighted EWSs that were derived externally. For example, sensitivity analysis of eCART,18 an EWS using machine learning, showed an AUC drop of 1% in a large external patient population,14 while NEWS AUCs13 dropped between 11% and 15% in two large external populations (Appendix Table 7).14,30 For hospitals adopting an externally developed EWS using statistical modeling, these results suggest that an AUC delta of approximately 5% can be expected and 7% for an internally developed EWS.
The models’ sensitivity ranged from 0.49 to 0.54 (mean = 0.51) for EWSs using statistical modeling and 0.39 to 0.50 (mean = 0.43). These results were based on chosen alert volume cutoffs. Specificity ranged from 0.90 to 0.94 (mean = 0.92) in EWSs using statistical modeling compared with 0.83 to 0.93 (mean = 0.89) in aggregate-weighted EWS models. At the 0.51 sensitivity level (mean sensitivity of reported EWSs using statistical modeling), aggregate-weighted EWSs would have an estimated specificity of approximately 0.87. Conversely, to reach a specificity of 0.92 (mean specificity of reported EWSs using statistical modeling, aggregate-weighted EWSs would have a sensitivity of approximately 0.42 compared with 0.50 in EWSs using statistical modeling (based on three studies reporting both sensitivity and specificity or an AUC graph).
Risk of Bias Assessment
We scored the studies by adapting the Cochrane Collaboration tool for assessing risk of bias 32 (Appendix Table 5). Of the six studies, five received total scores between 1.0 and 2.0 (indicating relatively low bias risk), and one study had a score of 3.5 (indicating higher bias risk). Low bias studies14,17-19,30 used large samples across multiple hospitals, discussed the choice of predictor variables and outcomes more precisely, and reported their measurement approaches and analytic methods in more detail, including imputation of missing data and model calibration.
DISCUSSION
In this systematic review, we assessed the predictive ability of EWSs using statistical modeling versus aggregate-weighted EWS models to detect clinical deterioration risk in hospitalized adults in general wards. From 2007 to 2018, at least five systematic reviews examined aggregate-weighted EWSs in adult inpatient settings.33-37 No systematic review, however, has synthesized the evidence of EWSs using statistical modeling.
The recent evidence is limited to six studies, of which five had favorable risk of bias scores. All studies included in this review demonstrated superior model performance of the EWSs using statistical modeling compared with an aggregate-weighted EWS, and at least five of the six studies employed rigor in design, measurement, and analytic method. The AUC absolute difference between EWSs using statistical modeling and aggregate-weighted EWSs was 7% overall, moving model performance from fair to good (Table 2; Figure 2). Although this increase in discriminative power may appear modest, it translates into avoiding a 45% increase in WDR workload generated by an aggregate-weighted EWS, approximately two patient evaluations for each true positive case.
Results of our review suggest that EWSs using statistical modeling predict clinical deterioration risk with better precision. This is an important finding for the following reasons: (1) Better risk prediction can support the activation of rescue; (2) Given federal mandates to curb spending, the elimination of some resource-intensive false positive evaluations supports high-value care;38 and (3) The Quadruple Aim39 accounts for clinician wellbeing. EWSs using statistical modeling may offer benefits in terms of clinician satisfaction with the human–system interface because better discrimination reduces the daily evaluation workload/cognitive burden and because the reduction of false positive alerts may reduce alert fatigue.40,41
Still, an important issue with risk detection is that it is unknown which percentage of patients are uniquely identified by an EWS and not already under evaluation by the clinical team. For example, a recent study by Bedoya et al.42 found that using NEWS did not improve clinical outcomes and nurses frequently disregarded the alert. Another study43 found that the combined clinical judgment of physicians and nurses had an AUC of 0.90 in predicting mortality. These results suggest that at certain times, an EWS alert may not add new useful information for clinicians even when it correctly identifies deterioration risk. It remains difficult to define exactly how many patients an EWS would have to uniquely identify to have clinical utility.
Even EWSs that use statistical modeling cannot detect all true deterioration cases perfectly, and they may at times trigger an alert only when the clinical team is already aware of a patient’s clinical decline. Consequently, EWSs using statistical modeling can at best augment and support—but not replace—RRT rounding, physician workup, and vigilant frontline staff. However, clinicians, too, are not perfect, and the failure-to-rescue literature suggests that certain human factors are antecedents to patient crises (eg, stress and distraction,44-46 judging by precedent/experience,44,47 and innate limitations of human cognition47). Because neither clinicians nor EWSs can predict deterioration perfectly, the best possible rescue response combines clinical vigilance, RRT rounding, and EWSs using statistical modeling as complementary solutions.
Our findings suggest that predictive models cannot be judged purely on AUC (in fact, it would be ill-advised) but also by their clinical utility (expressed in WDR and PPV): How many patients does a clinician need to evaluate?9-11 Precision is not meaningful if it comes at the expense of unmanageable evaluation workloads, and our findings suggest that clinicians should evaluate models based on their clinical utility. Hospitals considering adoption of an EWS using statistical modeling should consider that externally developed EWSs appear to experience a performance drop when applied to a new patient population; a slightly higher WDR and slightly lower AUC can be expected. EWSs using statistical modeling appear to perform best when tailored to the targeted patient population (or are derived in-house). Model depreciation over time will likely require recalibration. In addition, adoption of a machine learning algorithm may mean that original model results are obscured by the black box output of the algorithm.48-50
Findings from this systematic review are subject to several limitations. First, we applied strict inclusion criteria, which led us to exclude studies that offered findings in specialty units and specific patient subpopulations, among others. In the interest of systematic comparison, our findings are limited to general wards. We also restricted our search to recent studies that reported on models predicting clinical deterioration, which we defined as the composite of ICU transfer and/or death. Clinically, deteriorating patients in general wards either die or are transferred to ICU. This criterion resulted in exclusion of the Rothman Index,51 which predicts “death within 24 hours” but not ICU transfer. The AUC in this study was higher than those selected in this review (0.93 compared to 0.82 for MEWS; AUC delta: 0.09). The higher AUC may be a function of the outcome definition (30-day mortality would be more challenging to predict). Therefore, hospitals or health systems interested in purchasing an EWS using statistical modeling should carefully consider the outcome selection and definition.
Second, as is true for systematic reviews in general,52 the degree of clinical and methodological heterogeneity across the selected studies may limit our findings. Studies occurred in various settings (university hospital, teaching hospitals, and community hospitals), which may serve diverging patient populations. We observed that studies in university-based settings had a higher event rate ranging from 5.6% to 7.8%, which may result in higher PPV results in these settings. However, this increase would apply to both EWS types equally. To arrive at a “true” reflection of model performance, the simulations for PPV and WDR have used a more conservative event rate of 4%. We observed heterogenous mortality definitions, which did not always account for the reality that a patient’s death may be an appropriate outcome (ie, it was concordant with treatment wishes in the context of severe illness or an end-of-life trajectory). Studies also used different sampling procedures; some allowed multiple observations although most did not. The variation in sampling may change PPV and limit our systematic comparison. However, regardless of methodological differences, our review suggests that EWSs using statistical modeling perform better than aggregate-weighted EWSs in each of the selected studies.
Third, systematic reviews may be subject to the issue of publication bias because they can only compare published results and could possibly omit an unknown number of unpublished studies. However, the selected studies uniformly demonstrated similar model improvements, which are plausibly related to the larger number of covariates, statistical methods, and shrinkage of random error.
Finally, this review was limited to the comparison of observational studies, which aimed to answer how the two EWS classes compared. These studies did not address whether an alert had an impact on clinical care and patient outcomes. Results from at least one randomized nonblinded controlled trial suggest that alert-driven RRT activation may reduce the length of stay by 24 hours and use of oximetry, but has no impact on mortality, ICU transfer, and ICU length of stay.53
CONCLUSION
Our findings point to three areas of need for the field of predictive EWS research: (1) a standardized set of clinical deterioration outcome measures, (2) a standardized set of measures capturing clinical evaluation workload and alert frequency, and (3) cost estimates of clinical workloads with and without deployment of an EWS using statistical modeling. Given the present divergence of outcome definitions, EWS research may benefit from a common “clinical deterioration” outcome standard, including transfer to ICU, inpatient/30-day/90-day mortality, and death with DNR, comfort care, or hospice. The field is lacking a standardized clinical workload measure and an understanding of the net percentage of patients uniquely identified by an EWS.
By using predictive analytics, health systems may be better able to achieve the goals of high-value care and patient safety and support the Quadruple Aim. Still, gaps in knowledge exist regarding the measurement of the clinical processes triggered by EWSs, evaluation workloads, alert fatigue, clinician burnout associated with the human-alert interface, and costs versus benefits. Future research should evaluate the degree to which EWSs can identify risk among patients who are not already under evaluation by the clinical team, assess the balanced treatment effects of RRT interventions between decedents and survivors, and investigate clinical process times relative to the time of an EWS alert using statistical modeling.
Acknowledgments
The authors would like to thank Ms. Jill Pope at the Kaiser Permanente Center for Health Research in Portland, OR for her assistance with manuscript preparation. Daniel Linnen would like to thank Dr. Linda Franck, PhD, RN, FAAN, Professor at the University of California, San Francisco, School of Nursing for reviewing the manuscript.
Disclosures
The authors declare no conflicts of interest.
Funding
The Maribelle & Stephen Leavitt Scholarship, the Jonas Nurse Scholars Scholarship at the University of California, San Francisco, and the Nurse Scholars Academy Predoctoral Research Fellowship at Kaiser Permanente Northern California supported this study during Daniel Linnen’s doctoral training at the University of California, San Francisco. Dr. Vincent Liu was funded by National Institute of General Medical Sciences Grant K23GM112018.
1. Institute of Medicine (US) Committee on Quality of Health Care in America; Kohn LT, Corrigan JM, Donaldson MS, editors. To Err is Human: Building a Safer Health System. Washington (DC): National Academies Press (US); 2000. PubMed
2. Bapoje SR, Gaudiani JL, Narayanan V, Albert RK. Unplanned transfers to a medical intensive care unit: causes and relationship to preventable errors in care. J Hosp Med. 2011;6(2):68-72. doi: 10.1002/jhm.812. PubMed
3. Liu V, Escobar GJ, Greene JD, et al. Hospital deaths in patients with sepsis from 2 independent cohorts. JAMA. 2014;312(1):90-92. doi: 10.1001/jama.2014.5804. PubMed
4. Winters BD, Pham JC, Hunt EA, et al. Rapid response systems: a systematic review. Crit Care Med. 2007;35(5):1238-1243. doi: 10.1097/01.CCM.0000262388.85669.68. PubMed
5. Torio C. Andrews RM (AHRQ). National inpatient hospital costs: the most expensive conditions by payer, 2011. HCUP Statistical Brief# 160. August 2013. Agency for Healthcare Research and Quality, Rockville, MD. Agency for Healthcare Research and Quality. 2015. http://www.ncbi.nlm.nih.gov/books/NBK169005/. Accessed July 10, 2018. PubMed
6. Levinson DR, General I. Adverse events in hospitals: national incidence among Medicare beneficiaries. Department of Health and Human Services Office of the Inspector General. 2010.
7. McGaughey J, Alderdice F, Fowler R, et al. Outreach and Early Warning Systems (EWS) for the prevention of intensive care admission and death of critically ill adult patients on general hospital wards. Cochrane Database Syst Rev. 2007;3(3):CD005529:Cd005529. doi: 10.1002/14651858.CD005529.pub2. PubMed
8. Morgan R, Williams F, Wright M. An early warning score for the early detection of patients with impending illness. Clin Intensive Care. 1997;8:100.
9. Escobar GJ, Dellinger RP. Early detection, prevention, and mitigation of critical illness outside intensive care settings. J Hosp Med. 2016;11(1):S5-S10. doi: 10.1002/jhm.2653. PubMed
10. Escobar GJ, Ragins A, Scheirer P, et al. Nonelective rehospitalizations and postdischarge mortality: predictive models suitable for use in real time. Med Care. 2015;53(11):916-923. doi: 10.1097/MLR.0000000000000435. PubMed
11. Liu VX. Toward the “plateau of productivity”: enhancing the value of machine learning in critical care. Crit Care Med. 2018;46(7):1196-1197. doi: 10.1097/CCM.0000000000003170. PubMed
12. Subbe CP, Kruger M, Rutherford P, Gemmel L. Validation of a modified Early Warning Score in medical admissions. QJM. 2001;94(10):521-526. doi: 10.1093/qjmed/94.10.521. PubMed
13. Smith GB, Prytherch DR, Meredith P, Schmidt PE, Featherstone PI. The ability of the National Early Warning Score (NEWS) to discriminate patients at risk of early cardiac arrest, unanticipated intensive care unit admission, and death. Resuscitation. 2013;84(4):465-470. doi: 10.1016/j.resuscitation.2012.12.016. PubMed
14. Kipnis P, Turk BJ, Wulf DA, et al. Development and validation of an electronic medical record-based alert score for detection of inpatient deterioration outside the ICU. J Biomed Inform. 2016;64:10-19. doi: 10.1016/j.jbi.2016.09.013. PubMed
15. Romero-Brufau S, Huddleston JM, Naessens JM, et al. Widely used track and trigger scores: are they ready for automation in practice? Resuscitation. 2014;85(4):549-552. doi: 10.1016/j.resuscitation.2013.12.017. PubMed
16. Bates DW, Saria S, Ohno-Machado L, Shah A, Escobar G. Big data in health care: using analytics to identify and manage high-risk and high-cost patients. Health Aff (Millwood). 2014;33(7):1123-1131. doi: 10.1377/hlthaff.2014.0041. PubMed
17. Churpek MM, Yuen TC, Park SY, Gibbons R, Edelson DP. Using electronic health record data to develop and validate a prediction model for adverse outcomes in the wards. Crit Care Med. 2014;42(4):841-848. doi: 10.1097/CCM.0000000000000038. PubMed
18. Churpek MM, Yuen TC, Winslow C, et al. Multicenter comparison of machine learning methods and conventional regression for predicting clinical deterioration on the wards. Crit Care Med. 2016;44(2):368-374. doi: 10.1097/CCM.0000000000001571. PubMed
19. Escobar GJ, LaGuardia JC, Turk BJ, et al. Early detection of impending physiologic deterioration among patients who are not in intensive care: development of predictive models using data from an automated electronic medical record. J Hosp Med. 2012;7(5):388-395. doi: 10.1002/jhm.1929. PubMed
20. Zweig MH, Campbell G. Receiver-operating characteristic (ROC) plots: a fundamental evaluation tool in clinical medicine. Clin Chem. 1993;39(4):561-577. PubMed
21. Collins GS, Reitsma JB, Altman DG, Moons KG. Transparent reporting of a multivariable prediction model for individual prognosis or diagnosis (TRIPOD): the TRIPOD statement. BMC Med. 2015;13(1):1. doi: 10.1186/s12916-014-0241-z. PubMed
22. Moher D, Liberati A, Tetzlaff J, Altman DG, PRISMA Group. Preferred reporting items for systematic reviews and meta-analyses: the Prisma statement. PLOS Med. 2009;6(7):e1000097. doi: 10.1371/journal.pmed.1000097. PubMed
23. Higgins JP, Green S. Cochrane handbook for systematic reviews of interventions version 5.1. 0. The Cochrane Collaboration. 2011;5.
24. Bossuyt P, Davenport C, Deeks J, et al. Interpreting results and drawing conclusions. In: Higgins PTJ, Green S, eds. Cochrane Handbook for Systematic Reviews of Diagnostic Test Accuracy Version 0.9. The Cochrane Collaboration; 2013. Chapter 11
25. Altman DG, Bland JM. Statistics Notes: Diagnostic tests 2: predictive values. BMJ. 1994;309(6947):102. doi: 10.1136/bmj.309.6947.102. PubMed
26. Heston TF. Standardizing predictive values in diagnostic imaging research. J Magn Reson Imaging. 2011;33(2):505; author reply 506-507. doi: 10.1002/jmri.22466. PubMed
27. Hanley JA, McNeil BJ. The meaning and use of the area under a receiver operating characteristic (ROC) curve. Radiology. 1982;143(1):29-36. doi: 10.1148/radiology.143.1.7063747. PubMed
28. Bewick V, Cheek L, Ball J. Statistics review 13: receiver operating characteristic curves. Crit Care. 2004;8(6):508-512. doi: 10.1186/cc3000. PubMed
29. Alvarez CA, Clark CA, Zhang S, et al. Predicting out of intensive care unit cardiopulmonary arrest or death using electronic medical record data. BMC Med Inform Decis Mak. 2013;13:28. doi: 10.1186/1472-6947-13-28. PubMed
30. Green M, Lander H, Snyder A, et al. Comparison of the between the FLAGS calling criteria to the MEWS, NEWS and the electronic Cardiac Arrest Risk Triage (eCART) score for the identification of deteriorating ward patients. Resuscitation. 2018;123:86-91. doi: 10.1016/j.resuscitation.2017.10.028. PubMed
31. Berger T, Green J, Horeczko T, et al. Shock index and early recognition of sepsis in the emergency department: pilot study. West J Emerg Med. 2013;14(2):168-174. doi: 10.5811/westjem.2012.8.11546. PubMed
32. Higgins JPT, Altman DG, Gøtzsche PC, et al. The Cochrane Collaboration’s tool for assessing risk of bias in randomised trials. BMJ. 2011;343:d5928-d5928. doi: 10.1136/bmj.d5928.
33. Johnstone CC, Rattray J, Myers L. Physiological risk factors, early warning scoring systems and organizational changes. Nurs Crit Care. 2007;12(5):219-224. doi: 10.1111/j.1478-5153.2007.00238.x. PubMed
34. McNeill G, Bryden D. Do either early warning systems or emergency response teams improve hospital patient survival? A systematic review. Resuscitation. 2013;84(12):1652-1667. doi: 10.1016/j.resuscitation.2013.08.006. PubMed
35. Smith M, Chiovaro J, O’Neil M, et al. Early Warning System Scores: A Systematic Review. In: Washington (DC): Department of Veterans Affairs (US); 2014 Jan: https://www.ncbi.nlm.nih.gov/books/NBK259031/. Accessed January 23, 2017. PubMed
36. Smith ME, Chiovaro JC, O’Neil M, et al. Early warning system scores for clinical deterioration in hospitalized patients: a systematic review. Ann Am Thorac Soc. 2014;11(9):1454-1465. doi: 10.1513/AnnalsATS.201403-102OC. PubMed
37. Subbe CP, Williams E, Fligelstone L, Gemmell L. Does earlier detection of critically ill patients on surgical wards lead to better outcomes? Ann R Coll Surg Engl. 2005;87(4):226-232. doi: 10.1308/003588405X50921. PubMed
38. Berwick DM, Hackbarth AD. Eliminating waste in us health care. JAMA. 2012;307(14):1513-1516. doi: 10.1001/jama.2012.362. PubMed
39. Sikka R, Morath JM, Leape L. The Quadruple Aim: care, health, cost and meaning in work.. BMJ Quality & Safety. 2015;24(10):608-610. doi: 10.1136/bmjqs-2015-004160. PubMed
40. Guardia-Labar LM, Scruth EA, Edworthy J, Foss-Durant AM, Burgoon DH. Alarm fatigue: the human-system interface. Clin Nurse Spec. 2014;28(3):135-137. doi: 10.1097/NUR.0000000000000039. PubMed
41. Ruskin KJ, Hueske-Kraus D. Alarm fatigue: impacts on patient safety. Curr Opin Anaesthesiol. 2015;28(6):685-690. doi: 10.1097/ACO.0000000000000260. PubMed
42. Bedoya AD, Clement ME, Phelan M, et al. Minimal impact of implemented early warning score and best practice alert for patient deterioration. Crit Care Med. 2019;47(1):49-55. doi: 10.1097/CCM.0000000000003439. PubMed
43. Brabrand M, Hallas J, Knudsen T. Nurses and physicians in a medical admission unit can accurately predict mortality of acutely admitted patients: A prospective cohort study. PLoS One. 2014;9(7):e101739. doi: 10.1371/journal.pone.0101739. PubMed
44. Acquaviva K, Haskell H, Johnson J. Human cognition and the dynamics of failure to rescue: the Lewis Blackman case. J Prof Nurs. 2013;29(2):95-101. doi: 10.1016/j.profnurs.2012.12.009. PubMed
45. Jones A, Johnstone MJ. Inattentional blindness and failures to rescue the deteriorating patient in critical care, emergency and perioperative settings: four case scenarios. Aust Crit Care. 2017;30(4):219-223. doi: 10.1016/j.aucc.2016.09.005. PubMed
46. Reason J. Understanding adverse events: human factors. Qual Health Care. 1995;4(2):80-89. doi: 10.1136/qshc.4.2.80. PubMed
47. Bate L, Hutchinson A, Underhill J, Maskrey N. How clinical decisions are made. Br J Clin Pharmacol. 2012;74(4):614-620. doi: 10.1111/j.1365-2125.2012.04366.x. PubMed
48. Cabitza F, Rasoini R, Gensini GF. Unintended consequences of machine learning in medicine. JAMA. 2017;318(6):517-518. doi: 10.1001/jama.2017.7797. PubMed
49. Stead WW. Clinical implications and challenges of artificial intelligence and deep learning. JAMA. 2018;320(11):1107-1108. doi: 10.1001/jama.2018.11029. PubMed
50. Wong TY, Bressler NM. Artificial intelligence with deep learning technology looks into diabetic retinopathy screening. JAMA. 2016;316(22):2366-2367. doi: 10.1001/jama.2016.17563. PubMed
51. Finlay GD, Rothman MJ, Smith RA. Measuring the modified early warning score and the Rothman index: advantages of utilizing the electronic medical record in an early warning system. J Hosp Med. 2014;9(2):116-119. doi: 10.1002/jhm.2132. PubMed
52. Gagnier JJ, Moher D, Boon H, Beyene J, Bombardier C. Investigating clinical heterogeneity in systematic reviews: a methodologic review of guidance in the literature. BMC Med Res Methodol. 2012;12:111-111. doi: 10.1186/1471-2288-12-111. PubMed
53. Kollef MH, Chen Y, Heard K, et al. A randomized trial of real-time automated clinical deterioration alerts sent to a rapid response team. J Hosp Med. 2014;9(7):424-429. doi: 10.1002/jhm.2193. PubMed
© 2019 Society of Hospital Medicine
Incorporating an EWS Into Practice
Patients who deteriorate outside highly monitored settings and who require unplanned transfer to the intensive care unit (ICU) are known to have high mortality and morbidity.[1, 2, 3, 4, 5] The notion that early detection of a deteriorating patient improves outcomes has intuitive appeal and is discussed in a large number of publications.[6, 7, 8, 9, 10] However, much less information is available on what should be done after early detection is made.[11] Existing literature on early warning systems (EWSs) does not provide enough detail to serve as a map for implementation. This lack of transparency is complicated by the fact that, although the comprehensive inpatient electronic medical record (EMR) now constitutes the central locus for clinical practice, much of the existing literature comes from research institutions that may employ home‐grown EMRs, not community hospitals that employ commercially available systems.
In this issue of the Journal of Hospital Medicine, we describe our efforts to bridge that gap by implementing an EWS in a pair of community hospitals. The EWS's development and its basic statistical and electronic infrastructure are described in the articles by Escobar and Dellinger and Escobar et al.[2, 12, 13] In this report, we focus on how we addressed clinicians' primary concern: What do we do when we get an alert? Because it is described in detail by Granich et al.[14] elsewhere in this issue of the Journal of Hospital Medicine, a critical component of our implementation process (ensuring that patient preferences with respect to supportive care are honored) is not discussed.
Our article is divided into the following sections: rationale, preimplementation preparatory work, workflow development, response protocols, challenges and key learnings, and concluding reflections.
RATIONALE
Much of the previous work on the implementation of alarm systems has focused on the statistics behind detection or on the quantification of processes (eg, how many rapid response calls were triggered) or on outcomes such as mortality. The conceptual underpinnings and practical steps necessary for successful integration of an alarm system into the clinicians' workflow have not been articulated. Our theoretical framework was based on (1) improving situational awareness[15] (knowing what is going on around you and what is likely to happen next) and (2) mitigating cognitive errors.
An EWS enhances situational awareness most directly by earlier identification of a problem with a particular patient. As is detailed by Escobar et al.[16] in this issue of the Journal of Hospital Medicine, our EWS extracts EMR data every 6 hours, performs multiple calculations, and then displays 3 scores in real time in the inpatient dashboard (known as the Patient Lists activity in the Epic EMR). The first of these scores is the Laboratory‐Based Acute Physiologic Score, version 2 (LAPS2), an objective severity score whose retrospective version is already in use in Kaiser Permanente Northern California (KPNC) for internal benchmarking.[13] This score captures a patient's overall degree of physiologic instability within the preceding 72 hours. The second is the Comorbidity Point Score, version 2 (COPS2), a longitudinal comorbidity score based on the patient's diagnoses over the preceding 12 months.[13] This score captures a patient's overall comorbidity burden. Thus, it is possible for a patient to be very ill (high COPS2) while also being stable (low LAPS2) or vice versa. Both of these scores have other uses, including prediction of rehospitalization risk in real time,[17] which is also being piloted at KPNC. Finally, the Advanced Alert Monitoring (AAM) score, which integrates the LAPS2 and COPS2 with other variables, provides a 12‐hour deterioration risk, with a threshold value of 8% triggering response protocols. At or above this threshold, which was agreed to prior to implementation, the system achieves 25% sensitivity, 98% specificity, with a number needed to evaluate of 10 to 12, a level of workload that was felt to be acceptable by clinicians. Actions triggered by the EWS may be quite different from those one would take when being notified of a code blue, which is called at the time an event occurs. The EWS focuses attention on patients who might be missed because they do not yet appear critically ill. It also provides a shared, quantifiable measure of a patient's risk that can trigger a standardized plan of action to follow in evaluating and treating a patient.[15]
In addition to enhancing situational awareness, we intended the alarms to produce cognitive change in practitioners. Our goal was to replace medical intuition with analytic, evidence‐based judgment of future illness. We proceeded with the understanding that replacing quick intuition with slower analytic response is an essential skill in developing sound clinical reasoning.[18, 19, 20] The alert encourages physicians to reassess high‐risk patients facilitating a cognitive shift from automatic, error‐prone processing to slower, deliberate processing. Given the busy pace of ward work, slowing down permits clinicians to reassess previously overlooked details. Related to this process of inducing cognitive change is a secondary effect: we uncovered and discussed physician biases. Physicians are subject to potential biases that allow patients to deteriorate.[18, 19, 20] Therefore, we addressed bias through education. By reviewing particular cases of unanticipated deterioration at each hospital facility, we provided evidence for the problem of in‐hospital deterioration. This framed the new tool as an opportunity for improving treatment and encouraged physicians to act on the alert using a structured process.
INTERVENTIONS
Preimplementation Preparatory Work
Initial KPNC data provided strong support for the generally accepted notion that unplanned transfer patients have poor outcomes.[2, 4, 5] However, published reports failed to provide the granular detail clinicians need to implement a response arm at the unit and patient level. In preparation for going live, we conducted a retrospective chart review. This included data from patients hospitalized from January 1, 2011 through December 31, 2012 (additional detail is provided in the Supporting Information, Appendix, in the online version of this article). The key findings from our internal review of subjective documentation preceding deterioration are similar to those described in the literature and summarized in Figure 1, which displays the 5 most common clinical presentations associated with unplanned transfers.
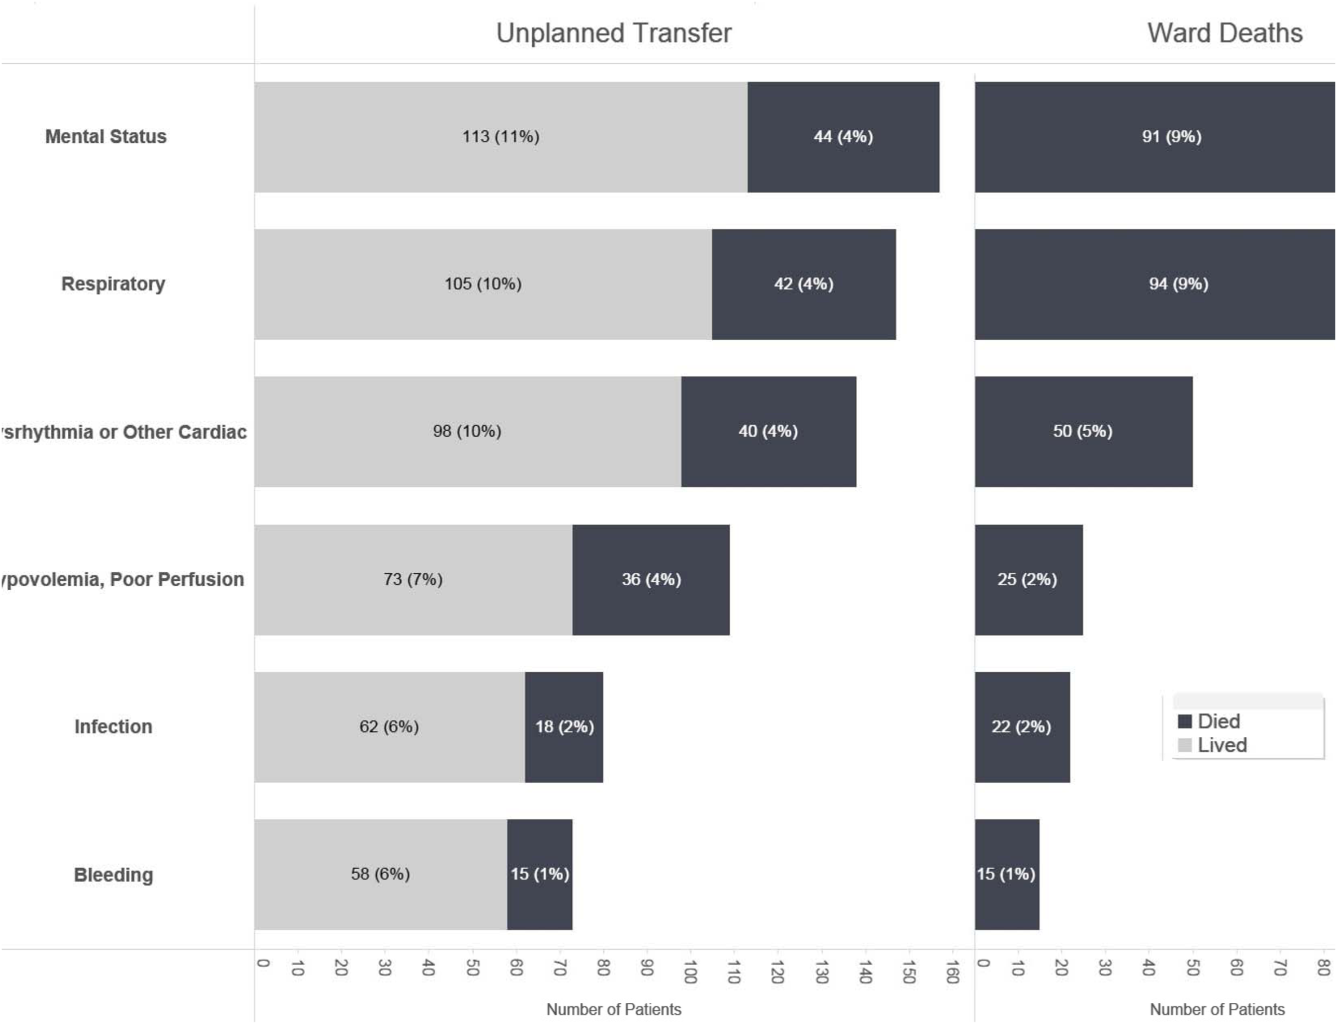
The chart review served several major roles. First, it facilitated cognitive change by eliminating the notion that it can't happen here. Second, it provided considerable guidance on key clinical components that had to be incorporated into the workflow. Third, it engaged the rapid response team (RRT) in reviewing our work retrospectively to identify future opportunities. Finally, the review provided considerable guidance with respect to structuring documentation requirements.
As a result of the above efforts, other processes detailed below, and knowledge described in several of the companion articles in this issue of the Journal of Hospital Medicine, 3 critical elements, which had been explicitly required by our leadership, were in place prior to the go‐live date: a general consensus among hospitalists and nurses that this would be worth testing, a basic clinical response workflow, and an automated checklist for documentation. We refined these in a 2‐week shadowing phase preceding the start date. In this phase, the alerts were not displayed in the EMR. Instead, programmers working on the project notified selected physician leaders by phone. This permitted them to understand exactly what sort of patients were reaching the physiologic threshold so that they could better prepare both RRT registered nurses (RNs) and hospitalists for the go‐live date. This also provided an opportunity to begin refining the documentation process using actual patients.
The original name for our project was Early Detection of Impending Physiologic Deterioration. However, during the preparatory phase, consultation with our public relations staff led to a concern that the name could be frightening to some patients. This highlights the need to consider patient perceptions and how words used in 1 way by physicians can have different connotations to nonclinicians. Consequently, the system was renamed, and it is now referred to as Advance Alert Monitoring (AAM).
Workflow Development
We carefully examined the space where electronic data, graphical user interfaces, and clinical practice blend, a nexus now commonly referred to as workflow or user experience.[21] To promote situational awareness and effect cognitive change, we utilized the Institute for Health Care Improvement's Plan‐Do‐Study‐Act model.[22, 23] We then facilitated the iterative development of a clinician‐endorsed workflow.[22, 23, 24, 25] By adjusting the workflow based on ongoing experience and giving clinicians multiple opportunities to revise (a process that continues to date), we ensured clinicians would approach and endorse the alarm system as a useful tool for decision support.
Table 1 summarizes the work groups assembled for our implementation, and Table 2 provides a system‐oriented checklist indicating key components that need to be in place prior to having an early warning system go live in a hospital. Figure 2 summarizes the alert response protocols we developed through an iterative process at the 2 pilot sites. The care path shown in Figure 2 is the result of considerable revision, mostly due to actual experience acquired following the go live date. The diagram also includes a component that is still work in progress. This is how an emergency department probability estimate (triage support) will be integrated into both the ward as well as the ICU workflows. Although this is beyond the scope of this article, other hospitals may be experimenting with triage support (eg, for sepsis patients), so it is important to consider how one would incorporate such support into workflows.
| Workgroup | Goals |
|---|---|
| |
| Clinical checklist | Perform structured chart review of selected unplanned transfer patients and near misses |
| Develop a checklist for mitigation strategies given an alert | |
| Develop documentation standards given an alert | |
| Develop escalation protocol given an alert | |
| Workload and threshold | Determine threshold for sensitivity of alerts and resulting impact on clinician workload |
| Patient preferences | Prepare background information to be presented to providers regarding end‐of‐life care and POLST orders |
| Coordinate with clinical checklist workgroup to generate documentation templates that provide guidance for appropriate management of patients regarding preferences on escalation of care and end‐of‐life care | |
| Electronic medical record coordination | Review proposed electronic medical record changes |
| Make recommendation for further changes as needed | |
| Develop plan for rollout of new and/or revised electronic record tools | |
| Designate contact list for questions/emssues that may arise regarding electronic record changes during the pilot | |
| Determine alert display choices and mode of alert notification | |
| Nursing committee | Review staffing needs in anticipation of alert |
| Coordinate with workload and threshold group | |
| Develop training calendar to ensure skills necessary for successful implementation of alerts | |
| Make recommendations for potential modification of rapid response team's role in development of a clinical checklist for nurses responding to an alert | |
| Design educational materials for clinicians | |
| Local communication strategy | Develop internal communication plan (for clinical staff not directly involved with pilot) |
| Develop external communication plan (for nonclinicians who may hear about the project) | |
| Level | Tasks |
|---|---|
| Administration | Obtain executive committee approval |
| Establish communication protocols with quality assurance and quality improvement committees | |
| Review protocols with medicallegal department | |
| Communication | Write media material for patients and families |
| Develop and disseminate scripts for front‐line staff | |
| Develop communication and meet with all relevant front‐line staff on merits of project | |
| Educate all staff on workflow changes and impacts | |
| Clinical preparation | Conduct internal review of unplanned transfers and present results to all clinicians |
| Determine service level agreements, ownership of at‐risk patients, who will access alerts | |
| Conduct staff meetings to educate staff | |
| Perform debriefs on relevant cases | |
| Determine desired outcomes, process measures, balancing measures | |
| Determine acceptable clinician burden (alerts/day) | |
| Technology | Establish documentation templates |
| Ensure access to new data fields (electronic medical record security process must be followed for access rights) | |
| Workflows | Workflows (clinical response, patient preferences, supportive care, communication, documentation) must be in place prior to actual go live |
| Shadowing | Testing period (alerts communicated to selected clinicians prior to going live) should occur |
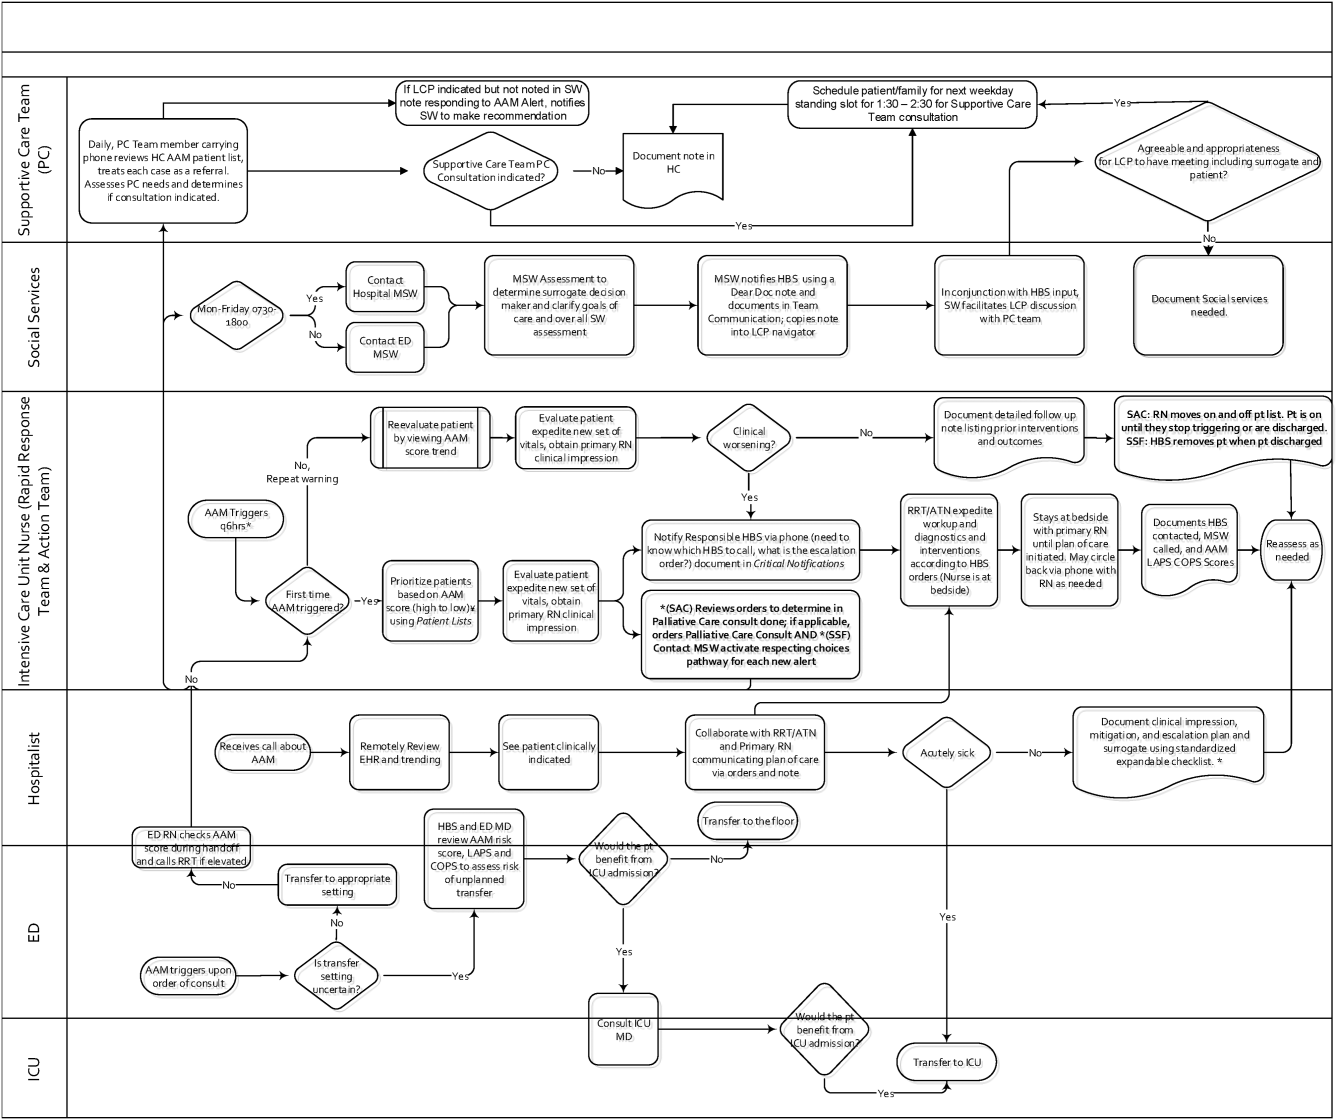
RESPONSE PROTOCOLS
At South San Francisco, the RRT consists of an ICU nurse, a respiratory care therapist, and a designated hospitalist; at Sacramento, the team is also augmented by an additional nurse (the house supervisor). In addition to responding to the AAM alerts, RRT nurses respond to other emergency calls such as code blues, stroke alerts, and patient or patient‐familyinitiated rapid response calls. They also expedite time sensitive workups and treatments. They check up on recent transfers from the ICU to ensure continued improvement justifying staying on the ward. Serving as peer educators, they assist with processes such as chest tube or central line insertions, troubleshoot high‐risk medication administration, and ensure that treatment bundles (eg, for sepsis) occur expeditiously.
The RRT reviews EWS scores every 6 hours. The AAM score is seen as soon as providers open the chart, which helps triage patients for evaluation. Because patients can still be at risk even without an elevated AAM score, all normal escalation pathways remain in place. Once an alert is noted in the inpatient dashboard, the RRT nurse obtains a fresh set of vital signs, assesses the patient's clinical status, and informs the physician, social worker, and primary nurse (Figure 2). Team members work with the bedside nurse, providing support with assessment, interventions, plans, and follow‐up. Once advised of the alert, the hospitalist performs a second chart review and evaluates the patient at the bedside to identify factors that could underlie potential deterioration. After this evaluation, the hospitalist documents concerns, orders appropriate interventions (which can include escalation), and determines appropriate follow‐up. We made sure the team knew that respiratory distress, arrhythmias, mental status changes, or worsening infection were responsible for over 80% of in‐hospital deterioration cases. We also involved palliative care earlier in patient care, streamlining the process so the RRT makes just 1 phone call to the social worker, who contacts the palliative care physician and nurse to ensure patients have a designated surrogate in the event of further deterioration.
Our initial documentation template consisted of a comprehensive organ system‐based physician checklist. However, although this was of use to covering physicians unfamiliar with a given patient, it was redundant and annoying to attending providers already familiar with the patient. After more than 30 iterations, we settled on a succinct note that only documented the clinicians' clinical judgment as to what constituted the major risk for deterioration and what the mitigation strategies would be. Both of these judgments are in a checklist format (see Supporting Information, Appendix, in the online version of this article for the components of the physician and nurse notes).
Prior to the implementation of the system, RRT nurses performed proactive rounding by manually checking patient labs and vital signs, an inefficient process due to the poor sensitivity and specificity of individual values. Following implementation of the system, RRT RNs and clinicians switched to sorting patients by the 3 scores (COPS2, LAPS2, AAM). For example, patients may be stable at admission (as evidenced by their AAM score) but be at high risk due to their comorbidities. One approach that has been employed is to proactively check such patients to ensure they have a care directive in place, as is described in the article by Granich et al.[14] The Supportive Care Team (detailed in Granich et al.) assesses needs for palliative care and provides in‐hospital consultation as needed. Social services staff perform chart reviews to ensure a patient surrogate has been defined and also works with patients and their families to clarify goals of care.
CHALLENGES AND KEY LEARNINGS
One challenge that arose was reconciling the periodic nature of the alert (every 6 hours) with physicians' availability, which varied due to different rounding workflows at the 2 sites. Consequently, the alert cycle was changed; at the first site, the cycle was set to 1000‐1600‐2200‐0400, whereas the second site chose 0800‐1400‐2000‐0200.
One essential but problematic component of the clinical response is the issue of documentation. Inadequate documentation could lead to adverse outcomes, clinician malpractice exposure, and placing the entire hospital at risk for enterprise liability when clinical responses are not documented. This issue is complicated by the fact that overzealous efforts could lead to less or no documentation by making it too onerous for busy clinicians. We found that the ease with which data can populate progress notes in the EMR can lead to note bloat. Clearly, no documentation is not enough, and a complete history and physical is too much. Paradoxically, 1 of the issues underlying our problems with documentation was the proactive nature of the alerts themselves; because they are based on an outcome prediction in the next 12 hours, documenting the response to them may lack (perceived) urgency.
Shortly after the system went live, a patient who had been recently transferred out to the ward from the ICU triggered an alert. As a response was mounted, the team realized that existing ward protocols did not specify which physician service (intensivist or hospitalist) was responsible for patients who were transitioning from 1 unit to another. We also had to perform multiple revisions of the protocols specifying how alerts were handled when they occurred at times of change of shift. Eventually, we settled on having the combination of a hospitalist and an RRT nurse as the cornerstone of the response, with the hospitalist service as the primary owner of the entire process, but this arrangement might need to be varied in different settings. As a result of the experience with the pilot, the business case for deployment in the remaining 19 hospitals includes a formal budget request so that all have properly staffed RRTs, although the issue of primary ownership of the alert process for different patient types (eg, surgical patients) will be decided on a hospital‐by‐hospital basis. These experiences raise the intriguing possibility that implementation of alert systems can lead to the identification of systemic gaps in existing protocols. These gaps can include specific components of the hospital service agreements between multiple departments (emergency, hospital medicine, ICU, palliative care, surgery) as well as problems with existing workflows.
In addition to ongoing tweaking of care protocols, 3 issues remain unresolved. First is the issue of documentation. The current documentation notes are not completely satisfactory, and we are working with the KPNC EMR administrators to refine the tool. Desirable refinements include (1) having the system scores populate in more accessible sectors of the EMR where their retrieval will facilitate increased automation of the note writing process, (2) changing the note type to a note that will facilitate process audits, and (3) linking the note to other EMR tools so that the response arm can be tracked more formally. The second issue is the need to develop strategies to address staff turnover; for example, newer staff may not have received the same degree of exposure to the system as those who were there when it was started. Finally, due to limited resources, we have done very limited work on more mechanistic analyses of the clinical response itself. For example, it would be desirable to perform a formal quantitative, risk‐adjusted process‐outcome analysis of why some patients' outcomes are better than others following an alert.
Finally, it is also the case that we have had some unexpected occurrences that hint at new uses and benefits of alert systems. One of these is the phenomenon of chasing the alert. Some clinicians, on their own, have taken a more proactive stance in the care of patients in whom the AAM score is rising or near the alert threshold. This has 2 potential consequences. Some patients are stabilized and thus do not reach threshold instability levels. In other cases, patients reach threshold but the response team is informed that things are already under control. A second unexpected result is increased requests for COPS2 scores by clinicians who have heard about the system, particularly surgeons who would like to use the comorbidity scores as a screening tool in the outpatient setting. Because KPNC is an integrated system, it is not likely that such alternatives will be implemented immediately without considerable analysis, but it is clear that the system's deployment has captured the clinicians' imagination.
CONCLUSIONS AND FUTURE DIRECTIONS
Our preparatory efforts have been successful. We have found that embedding an EWS in a commercially available EMR is acceptable to hospital physicians and nurses. We have developed a coordinated workflow for mitigation and escalation that is tightly linked to the availability of probabilistic alerts in real time. Although resource limitations have precluded us from conducting formal clinician surveys, the EWS has been discussed at multiple hospital‐wide as well as department‐specific meetings. Although there have been requests for clarification, refinements, and modifications in workflows, no one has suggested that the system be discontinued. Further, many of the other KPNC hospitals have requested that the EWS be deployed at their site. We have examined KPNC databases that track patient complaints and have not found any complaints that could be linked to the EWS. Most importantly, the existence of the workflows we have developed has played a major role in KPNC's decision to deploy the system in its remaining hospitals.
Although alert fatigue is the number 1 reason that clinicians do not utilize embedded clinical decision support,[26] simply calibrating statistical models is insufficient. Careful consideration of clinicians' needs and responsibilities, particularly around ownership of patients and documentation, is essential. Such consideration needs to include planning time and socializing the system (providing multiple venues for clinicians to learn about the system as well as participate in the process for using it).
We anticipate that, as the system leaves the pilot stage and becomes a routine component of hospital care, additional enhancements (eg, sending notifications to smart phones, providing an alert response tracking system) will be added. Our organization is also implementing real‐time concurrent review of inpatient EMRs (eg, for proactive detection of an expanded range of potential process failures), and work is underway on how to link the workflows we describe here with this effort. As has been the case with other systems,[27] it is likely that we will eventually move to continuous scanning of patient data rather than only every 6 hours. Given that the basic workflow is quite robust and amenable to local modifications, we are confident that our clinicians and hospitals will adapt to future system enhancements.
Lastly, we intend to conduct additional research on the clinical response itself. In particular, we consider it extremely important to conduct formal quantitative analyses on why some patients' outcomes are better than others following an alert. A key component of this effort will be to develop tools that can permit an automatedor nearly automatedassessment of the clinical response. For example, we are considering automated approaches that would scan the EMR for the presence of specific orders, notes, vital signs patterns, and laboratory tests following an alert. Whereas it may not be possible to dispense with manual chart review, even partial automation of a feedback process could lead to significant enhancement of our quality improvement efforts.
Acknowledgements
The authors thank Dr. Michelle Caughey, Dr. Philip Madvig, Dr. Brian Hoberman, Dr. Patricia Conolly, and Ms. Barbara Crawford for their administrative support; Dr. Tracy Lieu for reviewing the manuscript; and Ms. Rachel Lesser for formatting the manuscript. The authors also thank Drs. Jason Anderson, John Fitzgibbon, Elena M. Nishimura, and Najm Haq for their support of the project. We are particularly grateful to our nurses, Theresa A. Villorente, Zoe Sutton, Doanh Ly, Catherine Burger, and Hillary R. Mitchell, for their critical assistance. Last but not least, we also thank all the hospitalists and nurses at the Kaiser Permanente Sacramento and South San Francisco hospitals.
Disclosures: This work was supported by a grant from the Gordon and Betty Moore Foundation (Early Detection, Prevention, and Mitigation of Impending Physiologic Deterioration in Hospitalized Patients Outside Intensive Care: Phase 3, pilot), The Permanente Medical Group, Inc., and Kaiser Foundation Hospitals, Inc. Dr. Liu was supported by the National Institute for General Medical Sciences award K23GM112018. As part of our agreement with the Moore Foundation, we made a commitment to disseminate our findings in articles such as this one. However, the Gordon and Betty Moore Foundation played no role in how we actually structured our articles, nor did they review or preapprove any of the manuscripts submitted as part of the dissemination component; the same was the case with the other sponsors. None of the authors has any conflicts of interest to declare of relevance to this work
- , , , , . Location of patients before transfer to a tertiary care intensive care unit: impact on outcome. J Crit Care. 2009;24(1):108–113.
- , , , , , . Intra‐hospital transfers to a higher level of care: contribution to total hospital and intensive care unit (ICU) mortality and length of stay (LOS). J Hosp Med. 2011;6(2):74–80.
- , , , . Unplanned transfers to a medical intensive care unit: causes and relationship to preventable errors in care. J Hosp Med. 2011;6(2):68–72.
- , , , . Adverse outcomes associated with delayed intensive care unit transfers in an integrated healthcare system. J Hosp Med. 2012;7(3):224–230.
- , , , , , . Risk factors for unplanned transfer to intensive care within 24 hours of admission from the emergency department in an integrated healthcare system. J Hosp Med. 2013;8(1):13–19.
- , , , , , . Reducing hospital standardized mortality rate with early interventions. J Trauma Nursing. 2006;13(4):178–182.
- , , , , , . Centile‐based early warning scores derived from statistical distributions of vital signs. Resuscitation. 2011;82(8):1013–1018.
- , , , et al. Randomized trial of automated, electronic monitoring to facilitate early detection of sepsis in the intensive care unit. Crit Care Med. 2012;40(7):2096–2101.
- , , , et al. Early recognition of acutely deteriorating patients in non‐intensive care units: assessment of an innovative monitoring technology. J Hosp Med. 2012;7(8):628–633.
- , , , et al. A randomized trial of real‐time automated clinical deterioration alerts sent to a rapid response team. J Hosp Med. 2014;9(7):424–429.
- , , , et al. Improving situation awareness to reduce unrecognized clinical deterioration and serious safety events. Pediatrics. 2013;131(1):e298–e308.
- , , , , , . Early detection of impending physiologic deterioration among patients who are not in intensive care: development of predictive models using data from an automated electronic medical record. J Hosp Med. 2012;7(5):388–395.
- , , , , . Risk‐adjusting hospital mortality using a comprehensive electronic record in an integrated healthcare delivery system. Med Care. 2013;51(5):446–453.
- , , . et al. Early detection of critical illness outside the intensive care unit: clarifying treatment plans and honoring goals of care using a supportive care team. J Hosp Med. 2016;11:000–000.
- , . A qualitative study examining the influences on situation awareness and the identification, mitigation and escalation of recognised patient risk. BMJ Qual Saf. 2014;23(2):153–161.
- , , , et al. Piloting electronic medical record‐based early detection of inpatient deterioration in community hospitals. J Hosp Med. 2016;11:000–000.
- , , , , , . Nonelective rehospitalizations and postdischarge mortality: predictive models suitable for use in real time. Med Care. 2015;53(11):916–923.
- . The importance of cognitive errors in diagnosis and strategies to minimize them. Acad Med. 2003;78(8):775–780.
- , , . Cognitive debiasing 1: origins of bias and theory of debiasing. BMJ Qual Saf. 2013;22(suppl 2):ii58–ii64.
- , , . Cognitive debiasing 2: impediments to and strategies for change. BMJ Qual Saf. 2013;22(suppl 2):ii65–ii72.
- , , . Use of health information technology to reduce diagnostic errors. BMJ Qual Saf. 2013;22(suppl 2):ii40–ii51.
- , , , , , . The Improvement Guide: A Practical Approach to Enhancing Organizational Performance. 2nd ed. San Francisco, CA: Jossey‐Bass; 2009.
- , , , , . Understanding the components of quality improvement collaboratives: a systematic literature review. Milbank Q. 2013;91(2):354–394.
- , , . Reducing diagnostic errors in medicine: what's the goal? Acad Med. 2002;77(10):981–992.
- , , , . Huddling for high reliability and situation awareness. BMJ Qual Saf. 2013;22(11):899–906.
- Top 10 patient safety concerns for healthcare organizations. ECRI Institute website. Available at: https://www.ecri.org/Pages/Top‐10‐Patient‐Safety‐Concerns.aspx. Accessed February 18, 2016.
- , , , et al. Automated detection of physiologic deterioration in hospitalized patients. J Am Med Inform Assoc. 2015;22(2):350–360.
Patients who deteriorate outside highly monitored settings and who require unplanned transfer to the intensive care unit (ICU) are known to have high mortality and morbidity.[1, 2, 3, 4, 5] The notion that early detection of a deteriorating patient improves outcomes has intuitive appeal and is discussed in a large number of publications.[6, 7, 8, 9, 10] However, much less information is available on what should be done after early detection is made.[11] Existing literature on early warning systems (EWSs) does not provide enough detail to serve as a map for implementation. This lack of transparency is complicated by the fact that, although the comprehensive inpatient electronic medical record (EMR) now constitutes the central locus for clinical practice, much of the existing literature comes from research institutions that may employ home‐grown EMRs, not community hospitals that employ commercially available systems.
In this issue of the Journal of Hospital Medicine, we describe our efforts to bridge that gap by implementing an EWS in a pair of community hospitals. The EWS's development and its basic statistical and electronic infrastructure are described in the articles by Escobar and Dellinger and Escobar et al.[2, 12, 13] In this report, we focus on how we addressed clinicians' primary concern: What do we do when we get an alert? Because it is described in detail by Granich et al.[14] elsewhere in this issue of the Journal of Hospital Medicine, a critical component of our implementation process (ensuring that patient preferences with respect to supportive care are honored) is not discussed.
Our article is divided into the following sections: rationale, preimplementation preparatory work, workflow development, response protocols, challenges and key learnings, and concluding reflections.
RATIONALE
Much of the previous work on the implementation of alarm systems has focused on the statistics behind detection or on the quantification of processes (eg, how many rapid response calls were triggered) or on outcomes such as mortality. The conceptual underpinnings and practical steps necessary for successful integration of an alarm system into the clinicians' workflow have not been articulated. Our theoretical framework was based on (1) improving situational awareness[15] (knowing what is going on around you and what is likely to happen next) and (2) mitigating cognitive errors.
An EWS enhances situational awareness most directly by earlier identification of a problem with a particular patient. As is detailed by Escobar et al.[16] in this issue of the Journal of Hospital Medicine, our EWS extracts EMR data every 6 hours, performs multiple calculations, and then displays 3 scores in real time in the inpatient dashboard (known as the Patient Lists activity in the Epic EMR). The first of these scores is the Laboratory‐Based Acute Physiologic Score, version 2 (LAPS2), an objective severity score whose retrospective version is already in use in Kaiser Permanente Northern California (KPNC) for internal benchmarking.[13] This score captures a patient's overall degree of physiologic instability within the preceding 72 hours. The second is the Comorbidity Point Score, version 2 (COPS2), a longitudinal comorbidity score based on the patient's diagnoses over the preceding 12 months.[13] This score captures a patient's overall comorbidity burden. Thus, it is possible for a patient to be very ill (high COPS2) while also being stable (low LAPS2) or vice versa. Both of these scores have other uses, including prediction of rehospitalization risk in real time,[17] which is also being piloted at KPNC. Finally, the Advanced Alert Monitoring (AAM) score, which integrates the LAPS2 and COPS2 with other variables, provides a 12‐hour deterioration risk, with a threshold value of 8% triggering response protocols. At or above this threshold, which was agreed to prior to implementation, the system achieves 25% sensitivity, 98% specificity, with a number needed to evaluate of 10 to 12, a level of workload that was felt to be acceptable by clinicians. Actions triggered by the EWS may be quite different from those one would take when being notified of a code blue, which is called at the time an event occurs. The EWS focuses attention on patients who might be missed because they do not yet appear critically ill. It also provides a shared, quantifiable measure of a patient's risk that can trigger a standardized plan of action to follow in evaluating and treating a patient.[15]
In addition to enhancing situational awareness, we intended the alarms to produce cognitive change in practitioners. Our goal was to replace medical intuition with analytic, evidence‐based judgment of future illness. We proceeded with the understanding that replacing quick intuition with slower analytic response is an essential skill in developing sound clinical reasoning.[18, 19, 20] The alert encourages physicians to reassess high‐risk patients facilitating a cognitive shift from automatic, error‐prone processing to slower, deliberate processing. Given the busy pace of ward work, slowing down permits clinicians to reassess previously overlooked details. Related to this process of inducing cognitive change is a secondary effect: we uncovered and discussed physician biases. Physicians are subject to potential biases that allow patients to deteriorate.[18, 19, 20] Therefore, we addressed bias through education. By reviewing particular cases of unanticipated deterioration at each hospital facility, we provided evidence for the problem of in‐hospital deterioration. This framed the new tool as an opportunity for improving treatment and encouraged physicians to act on the alert using a structured process.
INTERVENTIONS
Preimplementation Preparatory Work
Initial KPNC data provided strong support for the generally accepted notion that unplanned transfer patients have poor outcomes.[2, 4, 5] However, published reports failed to provide the granular detail clinicians need to implement a response arm at the unit and patient level. In preparation for going live, we conducted a retrospective chart review. This included data from patients hospitalized from January 1, 2011 through December 31, 2012 (additional detail is provided in the Supporting Information, Appendix, in the online version of this article). The key findings from our internal review of subjective documentation preceding deterioration are similar to those described in the literature and summarized in Figure 1, which displays the 5 most common clinical presentations associated with unplanned transfers.
The chart review served several major roles. First, it facilitated cognitive change by eliminating the notion that it can't happen here. Second, it provided considerable guidance on key clinical components that had to be incorporated into the workflow. Third, it engaged the rapid response team (RRT) in reviewing our work retrospectively to identify future opportunities. Finally, the review provided considerable guidance with respect to structuring documentation requirements.
As a result of the above efforts, other processes detailed below, and knowledge described in several of the companion articles in this issue of the Journal of Hospital Medicine, 3 critical elements, which had been explicitly required by our leadership, were in place prior to the go‐live date: a general consensus among hospitalists and nurses that this would be worth testing, a basic clinical response workflow, and an automated checklist for documentation. We refined these in a 2‐week shadowing phase preceding the start date. In this phase, the alerts were not displayed in the EMR. Instead, programmers working on the project notified selected physician leaders by phone. This permitted them to understand exactly what sort of patients were reaching the physiologic threshold so that they could better prepare both RRT registered nurses (RNs) and hospitalists for the go‐live date. This also provided an opportunity to begin refining the documentation process using actual patients.
The original name for our project was Early Detection of Impending Physiologic Deterioration. However, during the preparatory phase, consultation with our public relations staff led to a concern that the name could be frightening to some patients. This highlights the need to consider patient perceptions and how words used in 1 way by physicians can have different connotations to nonclinicians. Consequently, the system was renamed, and it is now referred to as Advance Alert Monitoring (AAM).
Workflow Development
We carefully examined the space where electronic data, graphical user interfaces, and clinical practice blend, a nexus now commonly referred to as workflow or user experience.[21] To promote situational awareness and effect cognitive change, we utilized the Institute for Health Care Improvement's Plan‐Do‐Study‐Act model.[22, 23] We then facilitated the iterative development of a clinician‐endorsed workflow.[22, 23, 24, 25] By adjusting the workflow based on ongoing experience and giving clinicians multiple opportunities to revise (a process that continues to date), we ensured clinicians would approach and endorse the alarm system as a useful tool for decision support.
Table 1 summarizes the work groups assembled for our implementation, and Table 2 provides a system‐oriented checklist indicating key components that need to be in place prior to having an early warning system go live in a hospital. Figure 2 summarizes the alert response protocols we developed through an iterative process at the 2 pilot sites. The care path shown in Figure 2 is the result of considerable revision, mostly due to actual experience acquired following the go live date. The diagram also includes a component that is still work in progress. This is how an emergency department probability estimate (triage support) will be integrated into both the ward as well as the ICU workflows. Although this is beyond the scope of this article, other hospitals may be experimenting with triage support (eg, for sepsis patients), so it is important to consider how one would incorporate such support into workflows.
| Workgroup | Goals |
|---|---|
| |
| Clinical checklist | Perform structured chart review of selected unplanned transfer patients and near misses |
| Develop a checklist for mitigation strategies given an alert | |
| Develop documentation standards given an alert | |
| Develop escalation protocol given an alert | |
| Workload and threshold | Determine threshold for sensitivity of alerts and resulting impact on clinician workload |
| Patient preferences | Prepare background information to be presented to providers regarding end‐of‐life care and POLST orders |
| Coordinate with clinical checklist workgroup to generate documentation templates that provide guidance for appropriate management of patients regarding preferences on escalation of care and end‐of‐life care | |
| Electronic medical record coordination | Review proposed electronic medical record changes |
| Make recommendation for further changes as needed | |
| Develop plan for rollout of new and/or revised electronic record tools | |
| Designate contact list for questions/emssues that may arise regarding electronic record changes during the pilot | |
| Determine alert display choices and mode of alert notification | |
| Nursing committee | Review staffing needs in anticipation of alert |
| Coordinate with workload and threshold group | |
| Develop training calendar to ensure skills necessary for successful implementation of alerts | |
| Make recommendations for potential modification of rapid response team's role in development of a clinical checklist for nurses responding to an alert | |
| Design educational materials for clinicians | |
| Local communication strategy | Develop internal communication plan (for clinical staff not directly involved with pilot) |
| Develop external communication plan (for nonclinicians who may hear about the project) | |
| Level | Tasks |
|---|---|
| Administration | Obtain executive committee approval |
| Establish communication protocols with quality assurance and quality improvement committees | |
| Review protocols with medicallegal department | |
| Communication | Write media material for patients and families |
| Develop and disseminate scripts for front‐line staff | |
| Develop communication and meet with all relevant front‐line staff on merits of project | |
| Educate all staff on workflow changes and impacts | |
| Clinical preparation | Conduct internal review of unplanned transfers and present results to all clinicians |
| Determine service level agreements, ownership of at‐risk patients, who will access alerts | |
| Conduct staff meetings to educate staff | |
| Perform debriefs on relevant cases | |
| Determine desired outcomes, process measures, balancing measures | |
| Determine acceptable clinician burden (alerts/day) | |
| Technology | Establish documentation templates |
| Ensure access to new data fields (electronic medical record security process must be followed for access rights) | |
| Workflows | Workflows (clinical response, patient preferences, supportive care, communication, documentation) must be in place prior to actual go live |
| Shadowing | Testing period (alerts communicated to selected clinicians prior to going live) should occur |
RESPONSE PROTOCOLS
At South San Francisco, the RRT consists of an ICU nurse, a respiratory care therapist, and a designated hospitalist; at Sacramento, the team is also augmented by an additional nurse (the house supervisor). In addition to responding to the AAM alerts, RRT nurses respond to other emergency calls such as code blues, stroke alerts, and patient or patient‐familyinitiated rapid response calls. They also expedite time sensitive workups and treatments. They check up on recent transfers from the ICU to ensure continued improvement justifying staying on the ward. Serving as peer educators, they assist with processes such as chest tube or central line insertions, troubleshoot high‐risk medication administration, and ensure that treatment bundles (eg, for sepsis) occur expeditiously.
The RRT reviews EWS scores every 6 hours. The AAM score is seen as soon as providers open the chart, which helps triage patients for evaluation. Because patients can still be at risk even without an elevated AAM score, all normal escalation pathways remain in place. Once an alert is noted in the inpatient dashboard, the RRT nurse obtains a fresh set of vital signs, assesses the patient's clinical status, and informs the physician, social worker, and primary nurse (Figure 2). Team members work with the bedside nurse, providing support with assessment, interventions, plans, and follow‐up. Once advised of the alert, the hospitalist performs a second chart review and evaluates the patient at the bedside to identify factors that could underlie potential deterioration. After this evaluation, the hospitalist documents concerns, orders appropriate interventions (which can include escalation), and determines appropriate follow‐up. We made sure the team knew that respiratory distress, arrhythmias, mental status changes, or worsening infection were responsible for over 80% of in‐hospital deterioration cases. We also involved palliative care earlier in patient care, streamlining the process so the RRT makes just 1 phone call to the social worker, who contacts the palliative care physician and nurse to ensure patients have a designated surrogate in the event of further deterioration.
Our initial documentation template consisted of a comprehensive organ system‐based physician checklist. However, although this was of use to covering physicians unfamiliar with a given patient, it was redundant and annoying to attending providers already familiar with the patient. After more than 30 iterations, we settled on a succinct note that only documented the clinicians' clinical judgment as to what constituted the major risk for deterioration and what the mitigation strategies would be. Both of these judgments are in a checklist format (see Supporting Information, Appendix, in the online version of this article for the components of the physician and nurse notes).
Prior to the implementation of the system, RRT nurses performed proactive rounding by manually checking patient labs and vital signs, an inefficient process due to the poor sensitivity and specificity of individual values. Following implementation of the system, RRT RNs and clinicians switched to sorting patients by the 3 scores (COPS2, LAPS2, AAM). For example, patients may be stable at admission (as evidenced by their AAM score) but be at high risk due to their comorbidities. One approach that has been employed is to proactively check such patients to ensure they have a care directive in place, as is described in the article by Granich et al.[14] The Supportive Care Team (detailed in Granich et al.) assesses needs for palliative care and provides in‐hospital consultation as needed. Social services staff perform chart reviews to ensure a patient surrogate has been defined and also works with patients and their families to clarify goals of care.
CHALLENGES AND KEY LEARNINGS
One challenge that arose was reconciling the periodic nature of the alert (every 6 hours) with physicians' availability, which varied due to different rounding workflows at the 2 sites. Consequently, the alert cycle was changed; at the first site, the cycle was set to 1000‐1600‐2200‐0400, whereas the second site chose 0800‐1400‐2000‐0200.
One essential but problematic component of the clinical response is the issue of documentation. Inadequate documentation could lead to adverse outcomes, clinician malpractice exposure, and placing the entire hospital at risk for enterprise liability when clinical responses are not documented. This issue is complicated by the fact that overzealous efforts could lead to less or no documentation by making it too onerous for busy clinicians. We found that the ease with which data can populate progress notes in the EMR can lead to note bloat. Clearly, no documentation is not enough, and a complete history and physical is too much. Paradoxically, 1 of the issues underlying our problems with documentation was the proactive nature of the alerts themselves; because they are based on an outcome prediction in the next 12 hours, documenting the response to them may lack (perceived) urgency.
Shortly after the system went live, a patient who had been recently transferred out to the ward from the ICU triggered an alert. As a response was mounted, the team realized that existing ward protocols did not specify which physician service (intensivist or hospitalist) was responsible for patients who were transitioning from 1 unit to another. We also had to perform multiple revisions of the protocols specifying how alerts were handled when they occurred at times of change of shift. Eventually, we settled on having the combination of a hospitalist and an RRT nurse as the cornerstone of the response, with the hospitalist service as the primary owner of the entire process, but this arrangement might need to be varied in different settings. As a result of the experience with the pilot, the business case for deployment in the remaining 19 hospitals includes a formal budget request so that all have properly staffed RRTs, although the issue of primary ownership of the alert process for different patient types (eg, surgical patients) will be decided on a hospital‐by‐hospital basis. These experiences raise the intriguing possibility that implementation of alert systems can lead to the identification of systemic gaps in existing protocols. These gaps can include specific components of the hospital service agreements between multiple departments (emergency, hospital medicine, ICU, palliative care, surgery) as well as problems with existing workflows.
In addition to ongoing tweaking of care protocols, 3 issues remain unresolved. First is the issue of documentation. The current documentation notes are not completely satisfactory, and we are working with the KPNC EMR administrators to refine the tool. Desirable refinements include (1) having the system scores populate in more accessible sectors of the EMR where their retrieval will facilitate increased automation of the note writing process, (2) changing the note type to a note that will facilitate process audits, and (3) linking the note to other EMR tools so that the response arm can be tracked more formally. The second issue is the need to develop strategies to address staff turnover; for example, newer staff may not have received the same degree of exposure to the system as those who were there when it was started. Finally, due to limited resources, we have done very limited work on more mechanistic analyses of the clinical response itself. For example, it would be desirable to perform a formal quantitative, risk‐adjusted process‐outcome analysis of why some patients' outcomes are better than others following an alert.
Finally, it is also the case that we have had some unexpected occurrences that hint at new uses and benefits of alert systems. One of these is the phenomenon of chasing the alert. Some clinicians, on their own, have taken a more proactive stance in the care of patients in whom the AAM score is rising or near the alert threshold. This has 2 potential consequences. Some patients are stabilized and thus do not reach threshold instability levels. In other cases, patients reach threshold but the response team is informed that things are already under control. A second unexpected result is increased requests for COPS2 scores by clinicians who have heard about the system, particularly surgeons who would like to use the comorbidity scores as a screening tool in the outpatient setting. Because KPNC is an integrated system, it is not likely that such alternatives will be implemented immediately without considerable analysis, but it is clear that the system's deployment has captured the clinicians' imagination.
CONCLUSIONS AND FUTURE DIRECTIONS
Our preparatory efforts have been successful. We have found that embedding an EWS in a commercially available EMR is acceptable to hospital physicians and nurses. We have developed a coordinated workflow for mitigation and escalation that is tightly linked to the availability of probabilistic alerts in real time. Although resource limitations have precluded us from conducting formal clinician surveys, the EWS has been discussed at multiple hospital‐wide as well as department‐specific meetings. Although there have been requests for clarification, refinements, and modifications in workflows, no one has suggested that the system be discontinued. Further, many of the other KPNC hospitals have requested that the EWS be deployed at their site. We have examined KPNC databases that track patient complaints and have not found any complaints that could be linked to the EWS. Most importantly, the existence of the workflows we have developed has played a major role in KPNC's decision to deploy the system in its remaining hospitals.
Although alert fatigue is the number 1 reason that clinicians do not utilize embedded clinical decision support,[26] simply calibrating statistical models is insufficient. Careful consideration of clinicians' needs and responsibilities, particularly around ownership of patients and documentation, is essential. Such consideration needs to include planning time and socializing the system (providing multiple venues for clinicians to learn about the system as well as participate in the process for using it).
We anticipate that, as the system leaves the pilot stage and becomes a routine component of hospital care, additional enhancements (eg, sending notifications to smart phones, providing an alert response tracking system) will be added. Our organization is also implementing real‐time concurrent review of inpatient EMRs (eg, for proactive detection of an expanded range of potential process failures), and work is underway on how to link the workflows we describe here with this effort. As has been the case with other systems,[27] it is likely that we will eventually move to continuous scanning of patient data rather than only every 6 hours. Given that the basic workflow is quite robust and amenable to local modifications, we are confident that our clinicians and hospitals will adapt to future system enhancements.
Lastly, we intend to conduct additional research on the clinical response itself. In particular, we consider it extremely important to conduct formal quantitative analyses on why some patients' outcomes are better than others following an alert. A key component of this effort will be to develop tools that can permit an automatedor nearly automatedassessment of the clinical response. For example, we are considering automated approaches that would scan the EMR for the presence of specific orders, notes, vital signs patterns, and laboratory tests following an alert. Whereas it may not be possible to dispense with manual chart review, even partial automation of a feedback process could lead to significant enhancement of our quality improvement efforts.
Acknowledgements
The authors thank Dr. Michelle Caughey, Dr. Philip Madvig, Dr. Brian Hoberman, Dr. Patricia Conolly, and Ms. Barbara Crawford for their administrative support; Dr. Tracy Lieu for reviewing the manuscript; and Ms. Rachel Lesser for formatting the manuscript. The authors also thank Drs. Jason Anderson, John Fitzgibbon, Elena M. Nishimura, and Najm Haq for their support of the project. We are particularly grateful to our nurses, Theresa A. Villorente, Zoe Sutton, Doanh Ly, Catherine Burger, and Hillary R. Mitchell, for their critical assistance. Last but not least, we also thank all the hospitalists and nurses at the Kaiser Permanente Sacramento and South San Francisco hospitals.
Disclosures: This work was supported by a grant from the Gordon and Betty Moore Foundation (Early Detection, Prevention, and Mitigation of Impending Physiologic Deterioration in Hospitalized Patients Outside Intensive Care: Phase 3, pilot), The Permanente Medical Group, Inc., and Kaiser Foundation Hospitals, Inc. Dr. Liu was supported by the National Institute for General Medical Sciences award K23GM112018. As part of our agreement with the Moore Foundation, we made a commitment to disseminate our findings in articles such as this one. However, the Gordon and Betty Moore Foundation played no role in how we actually structured our articles, nor did they review or preapprove any of the manuscripts submitted as part of the dissemination component; the same was the case with the other sponsors. None of the authors has any conflicts of interest to declare of relevance to this work
- , , , , . Location of patients before transfer to a tertiary care intensive care unit: impact on outcome. J Crit Care. 2009;24(1):108–113.
- , , , , , . Intra‐hospital transfers to a higher level of care: contribution to total hospital and intensive care unit (ICU) mortality and length of stay (LOS). J Hosp Med. 2011;6(2):74–80.
- , , , . Unplanned transfers to a medical intensive care unit: causes and relationship to preventable errors in care. J Hosp Med. 2011;6(2):68–72.
- , , , . Adverse outcomes associated with delayed intensive care unit transfers in an integrated healthcare system. J Hosp Med. 2012;7(3):224–230.
- , , , , , . Risk factors for unplanned transfer to intensive care within 24 hours of admission from the emergency department in an integrated healthcare system. J Hosp Med. 2013;8(1):13–19.
- , , , , , . Reducing hospital standardized mortality rate with early interventions. J Trauma Nursing. 2006;13(4):178–182.
- , , , , , . Centile‐based early warning scores derived from statistical distributions of vital signs. Resuscitation. 2011;82(8):1013–1018.
- , , , et al. Randomized trial of automated, electronic monitoring to facilitate early detection of sepsis in the intensive care unit. Crit Care Med. 2012;40(7):2096–2101.
- , , , et al. Early recognition of acutely deteriorating patients in non‐intensive care units: assessment of an innovative monitoring technology. J Hosp Med. 2012;7(8):628–633.
- , , , et al. A randomized trial of real‐time automated clinical deterioration alerts sent to a rapid response team. J Hosp Med. 2014;9(7):424–429.
- , , , et al. Improving situation awareness to reduce unrecognized clinical deterioration and serious safety events. Pediatrics. 2013;131(1):e298–e308.
- , , , , , . Early detection of impending physiologic deterioration among patients who are not in intensive care: development of predictive models using data from an automated electronic medical record. J Hosp Med. 2012;7(5):388–395.
- , , , , . Risk‐adjusting hospital mortality using a comprehensive electronic record in an integrated healthcare delivery system. Med Care. 2013;51(5):446–453.
- , , . et al. Early detection of critical illness outside the intensive care unit: clarifying treatment plans and honoring goals of care using a supportive care team. J Hosp Med. 2016;11:000–000.
- , . A qualitative study examining the influences on situation awareness and the identification, mitigation and escalation of recognised patient risk. BMJ Qual Saf. 2014;23(2):153–161.
- , , , et al. Piloting electronic medical record‐based early detection of inpatient deterioration in community hospitals. J Hosp Med. 2016;11:000–000.
- , , , , , . Nonelective rehospitalizations and postdischarge mortality: predictive models suitable for use in real time. Med Care. 2015;53(11):916–923.
- . The importance of cognitive errors in diagnosis and strategies to minimize them. Acad Med. 2003;78(8):775–780.
- , , . Cognitive debiasing 1: origins of bias and theory of debiasing. BMJ Qual Saf. 2013;22(suppl 2):ii58–ii64.
- , , . Cognitive debiasing 2: impediments to and strategies for change. BMJ Qual Saf. 2013;22(suppl 2):ii65–ii72.
- , , . Use of health information technology to reduce diagnostic errors. BMJ Qual Saf. 2013;22(suppl 2):ii40–ii51.
- , , , , , . The Improvement Guide: A Practical Approach to Enhancing Organizational Performance. 2nd ed. San Francisco, CA: Jossey‐Bass; 2009.
- , , , , . Understanding the components of quality improvement collaboratives: a systematic literature review. Milbank Q. 2013;91(2):354–394.
- , , . Reducing diagnostic errors in medicine: what's the goal? Acad Med. 2002;77(10):981–992.
- , , , . Huddling for high reliability and situation awareness. BMJ Qual Saf. 2013;22(11):899–906.
- Top 10 patient safety concerns for healthcare organizations. ECRI Institute website. Available at: https://www.ecri.org/Pages/Top‐10‐Patient‐Safety‐Concerns.aspx. Accessed February 18, 2016.
- , , , et al. Automated detection of physiologic deterioration in hospitalized patients. J Am Med Inform Assoc. 2015;22(2):350–360.

EMR‐Based Detection of Deterioration
Patients who deteriorate in the hospital and are transferred to the intensive care unit (ICU) have higher mortality and greater morbidity than those directly admitted from the emergency department.[1, 2, 3] Rapid response teams (RRTs) were created to address this problem.[4, 5] Quantitative tools, such as the Modified Early Warning Score (MEWS),[6] have been used to support RRTs almost since their inception. Nonetheless, work on developing scores that can serve as triggers for RRT evaluation or intervention continues. The notion that comprehensive inpatient electronic medical records (EMRs) could support RRTs (both as a source of patient data and a platform for providing alerts) has intuitive appeal. Not surprisingly, in addition to newer versions of manual scores,[7] electronic scores are now entering clinical practice. These newer systems are being tested in research institutions,[8] hospitals with advanced capabilities,[9] and as part of proprietary systems.[10] Although a fair amount of statistical information (eg, area under the receiver operator characteristic curve of a given predictive model) on the performance of various trigger systems has been published, existing reports have not described details of how the electronic architecture is integrated with clinical practice.
Electronic alert systems generated from physiology‐based predictive models do not yet constitute mature technologies. No consensus or legal mandate regarding their role yet exists. Given this situation, studying different implementation approaches and their outcomes has value. It is instructive to consider how a given institutional solution addresses common contingenciesoperational constraints that are likely to be present, albeit in different forms, in most placesto help others understand the limitations and issues they may present. In this article we describe the structure of an EMR‐based early warning system in 2 pilot hospitals at Kaiser Permanente Northern California (KPNC). In this pilot, we embedded an updated version of a previously described early warning score[11] into the EMR. We will emphasize how its components address institutional, operational, and technological constraints. Finally, we will also describe unfinished businesschanges we would like to see in a future dissemination phase. Two important aspects of the pilot (development of a clinical response arm and addressing patient preferences with respect to supportive care) are being described elsewhere in this issue of the Journal of Hospital Medicine. Analyses of the actual impact on patient outcomes will be reported elsewhere; initial results appear favorable.[12]
INITIAL CONSTRAINTS
The ability to actually prevent inpatient deteriorations may be limited,[13] and doubts regarding the value of RRTs persist.[14, 15, 16] Consequently, work that led to the pilot occurred in stages. In the first stage (prior to 2010), our team presented data to internal audiences documenting the rates and outcomes of unplanned transfers from the ward to the ICU. Concurrently, our team developed a first generation risk adjustment methodology that was published in 2008.[17] We used this methodology to show that unplanned transfers did, in fact, have elevated mortality, and that this persisted after risk adjustment.[1, 2, 3] This phase of our work coincided with KPNC's deployment of the Epic inpatient EMR (
Once we demonstrated that we could, in fact, predict inpatient deteriorations, we still had to address medicallegal considerations, the need for a clinical response arm, and how to address patient preferences with respect to supportive or palliative care. To address these concerns and ensure that the implementation would be seamlessly integrated with routine clinical practice, our team worked for 1 year with hospitalists and other clinicians at the pilot sites prior to the go‐live date.
The primary concern from a medicallegal perspective is that once results from a predictive model (which could be an alert, severity score, comorbidity score, or other probability estimate) are displayed in the chart, relevant clinical information has been changed. Thus, failure to address such an EMR item could lead to malpractice risk for individuals and/or enterprise liability for an organization. After discussing this with senior leadership, they specified that it would be permissible to go forward so long as we could document that an educational intervention was in place to make sure that clinicians understood the system and that it was linked to specific protocols approved by hospitalists.
Current predictive models, including ours, generate a probability estimate. They do not necessarily identify the etiology of a problem or what solutions ought to be considered. Consequently, our senior leadership insisted that we be able to answer clinicians' basic question: What do we do when we get an alert? The article by Dummett et al.[20] in this issue of the Journal of Hospital Medicine describes how we addressed this constraint. Lastly, not all patients can be rescued. The article by Granich et al.[21] describes how we handled the need to respect patient choices.
PROCEDURAL COMPONENTS
The Gordon and Betty Moore Foundation, which funded the pilot, only had 1 restriction (inclusion of a hospital in the Sacramento, California area). The other site was selected based on 2 initial criteria: (1) the chosen site had to be 1 of the smaller KPNC hospitals, and (2) the chosen site had to be easily accessible for the lead author (G.J.E.). The KPNC South San Francisco hospital was selected as the alpha site and the KPNC Sacramento hospital as the beta site. One of the major drivers for these decisions was that both had robust palliative care services. The Sacramento hospital is a larger hospital with a more complex caseload.
Prior to the go‐live dates (November 19, 2013 for South San Francisco and April 16, 2014 for Sacramento), the executive committees at both hospitals reviewed preliminary data and the implementation plans for the early warning system. Following these reviews, the executive committees approved the deployment. Also during this phase, in consultation with our communications departments, we adopted the name Advance Alert Monitoring (AAM) as the outward facing name for the system. We also developed recommended scripts for clinical staff to employ when approaching a patient in whom an alert had been issued (this is because the alert is calibrated so as to predict increased risk of deterioration within the next 12 hours, which means that a patient might be surprised as to why clinicians were suddenly evaluating them). Facility approvals occurred approximately 1 month prior to the go‐live date at each hospital, permitting a shadowing phase. In this phase, selected physicians were provided with probability estimates and severity scores, but these were not displayed in the EMR front end. This shadowing phase permitted clinicians to finalize the response arms' protocols that are described in the articles by Dummett et al.[20] and Granich et al.[21] We obtained approval from the KPNC Institutional Review Board for the Protection of Human Subjects for the evaluation component that is described below.
EARLY DETECTION ALGORITHMS
The early detection algorithms we employed, which are being updated periodically, were based on our previously published work.[11, 18] Even though admitting diagnoses were found to be predictive in our original model, during actual development of the real‐time data extraction algorithms, we found that diagnoses could not be obtained reliably, so we made the decision to use a single predictive equation for all patients. The core components of the AAM score equation are the above‐mentioned LAPS2 and COPS2; these are combined with other data elements (Table 1). None of the scores are proprietary, and our equations could be replicated by any entity with a comprehensive inpatient EMR. Our early detection system is calibrated using outcomes that occurred 12 hours from when the alert is issued. For prediction, it uses data from the preceding 12 months for the COPS2 and the preceding 24 to 72 hours for physiologic data.
| Category | Elements Included | Comment |
|---|---|---|
| Demographics | Age, sex | |
| Patient location | Unit indicators (eg, 3 West); also known as bed history indicators | Only patients in general medicalsurgical ward, transitional care unit, and telemetry unit are eligible. Patients in the operating room, postanesthesia recovery room, labor and delivery service, and pediatrics are ineligible. |
| Health services | Admission venue | Emergency department admission or not. |
| Elapsed length of stay in hospital up to the point when data are scanned | Interhospital transport is common in our integrated delivery system; this data element requires linking both unit stays as well as stays involving different hospitals. | |
| Status | Care directive orders | Patients with a comfort careonly order are not eligible; all other patients (full code, partial code, and do not resuscitate) are. |
| Admission status | Inpatients and patients admitted for observation status are eligible. | |
| Physiologic | Vital signs, laboratory tests, neurological status checks | See online Appendices and references [6] and [15] for details on how we extract, format, and transform these variables. |
| Composite indices | Generic severity of illness score | See text and description in reference [15] for details on the Laboratory‐based Acute Physiology score, version 2 and the Comorbidity Point Score, version 2. |
| Longitudinal comorbidity score |
During the course of developing the real‐time extraction algorithms, we encountered a number of delays in real‐time data acquisition. These fall into 2 categories: charting delay and server delay. Charting delay is due to nonautomated charting of vital signs by nurses (eg, a nurse obtains vital signs on a patient, writes them down on paper, and then enters them later). In general, this delay was in the 15‐ to 30‐minute range, but occasionally was as high as 2 hours. Server delay, which was variable and ranged from a few minutes to (occasionally) 1 to 2 hours, is due to 2 factors. The first is that certain point of care tests were not always uploaded into the EMR immediately. This is because the testing units, which can display results to clinicians within minutes, must be physically connected to a computer for uploading results. The second is the processing time required for the system to cycle through hundreds of patient records in the context of a very large EMR system (the KPNC Epic build runs in 6 separate geographic instances, and our system runs in 2 of these). Figure 1 shows that each probability estimate thus has what we called an uncertainty period of 2 hours (the +2 hours addresses the fact that we needed to give clinicians a minimum time to respond to an alert). Given limited resources and the need to balance accuracy of the alerts, adequate lead time, the presence of an uncertainty period, and alert fatigue, we elected to issue alerts every 6 hours (with the exact timing based on facility preferences).

A summary of the components of our equation is provided in the Supporting Information, Appendices, in the online version of this article. The statistical performance characteristics of our final equation, which are based on approximately 262 million individual data points from 650,684 hospitalizations in which patients experienced 20,471 deteriorations, is being reported elsewhere. Between November 19, 2013 and November 30, 2015 (the most recent data currently available to us for analysis), a total of 26,386 patients admitted to the ward or transitional care unit at the 2 pilot sites were scored by the AAM system, and these patients generated 3,881 alerts involving a total of 1,413 patients, which meant an average of 2 alerts per day at South San Francisco and 4 alerts per day in Sacramento. Resource limitations have precluded us from conducting formal surveys to assess clinician acceptance. However, repeated meetings with both hospitalists as well as RRT nurses indicated that favorable departmental consensus exists.
INSTANTIATION OF ALGORITHMS IN THE EMR
Given the complexity of the calculations involving many variables (Table 1), we elected to employ Web services to extract data for processing using a Java application outside the EMR, which then pushed results into the EMR front end (Figure 2). Additional details on this decision are provided in the Supporting Information, Appendices, in the online version of this article. Our team had to expend considerable resources and time to map all necessary data elements in the real time environment, whose identifying characteristics are not the same as those employed by the KPHC data warehouse. Considerable debugging was required during the first 7 months of the pilot. Troubleshooting for the application was often required on very short notice (eg, when the system unexpectedly stopped issuing alerts during a weekend, or when 1 class of patients suddenly stopped receiving scores). It is likely that future efforts to embed algorithms in EMRs will experience similar difficulties, and it is wise to budget so as maximize available analytic and application programmer resources.
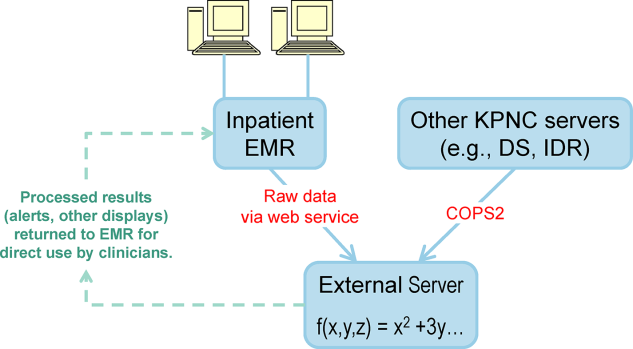
Figure 3 shows the final appearance of the graphical user interface at KPHC, which provides clinicians with 3 numbers: ADV ALERT SCORE (AAM score) is the probability of experiencing unplanned transfer within the next 12 hours, COPS is the COPS2, and LAPS is the LAPS2 assigned at the time a patient is placed in a hospital room. The current protocol in place is that the clinical response arm is triggered when the AAM score is 8.
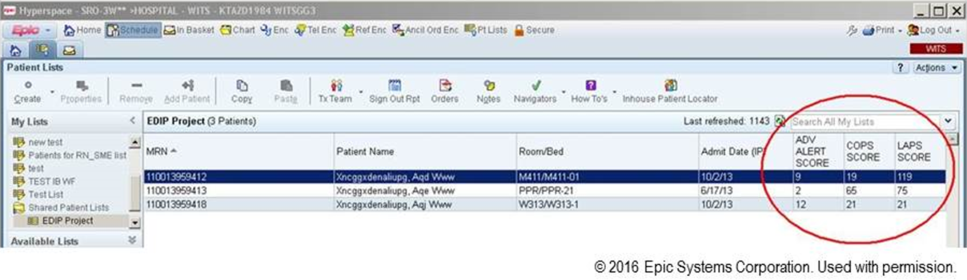
LIMITATIONS
One of the limitations of working with a commercial EMR in a large system, such as KPNC, is that of scalability. Understandably, the organization is reluctant to make changes in the EMR that will not ultimately be deployed across all hospitals in the system. Thus, any significant modification of the EMR or its associated workflows must, from the outset, be structured for subsequent spread to the remaining hospitals (19 in our case). Because we had not deployed a system like this before, we did not know what to expect and, had we known then what experience has taught us, our initial requests would have been different. Table 2 summarizes the major changes we would have made to our implementation strategy had we known then what we know now.
| Component | Status in Pilot Application | Desirable Changes |
|---|---|---|
| ||
| Degree of disaster recovery support | System outages are handled on an ad hoc basis. | Same level of support as is seen in regular clinical systems (24/7 technical support). |
| Laboratory data feed | Web service. | It would be extremely valuable to have a definite answer about whether alternative data feeds would be faster and more reliable. |
| LAPS2 score | Score appears only on ward or TCU patients. | Display for all hospitalized adults (include anyone 18 years and include ICU patients). |
| Score appears only on inpatient physician dashboard. | Display scores in multiple dashboards (eg, emergency department dashboard). | |
| COPS2 score | Score appears only on ward or TCU patients. | Display for all hospitalized adults (include anyone 18 years and include ICU patients). |
| Score appears only on inpatient physician dashboard. | Display scores in multiple dashboards (eg, emergency department dashboard). | |
| Alert response tracking | None is available. | Functionality that permits tracking what the status is of patients in whom an alert was issued (who responded, where it is charted, etc.)could be structured as a workbench report in KP HealthConnectvery important because of medical legal reasons. |
| Trending capability for scores | None is available. | Trending display available in same location where vital signs and laboratory test results are displayed. |
| Messaging capability | Not currently available. | Transmission of scores to rapid response team (or other designated first responder) via a smartphone, thus obviating the need for staff to check the inpatient dashboard manually every 6 hours. |
EVALUATION STRATEGY
Due to institutional constraints, it is not possible for us to conduct a gold standard pilot using patient‐level randomization, as described by Kollef et al.[8] Consequently, in addition to using the pilot to surface specific implementation issues, we had to develop a parallel scoring system for capturing key data points (scores, outcomes) not just at the 2 pilot sites, but also at the remaining 19 KPNC hospitals. This required that we develop electronic tools that would permit us to capture these data elements continuously, both prospectively as well as retrospectively. Thus, to give an example, we developed a macro that we call LAPS2 any time that permits us to assign a retrospective severity score given any T0. Our ultimate goal is to evaluate the system's deployment using a stepped wedge design[22] in which geographically contiguous clusters of 2 to 4 hospitals go live periodically. The silver standard (a cluster trial involving randomization at the individual hospital level[23]) is not feasible because KPNC hospitals span a very broad geographic area, and it is more resource intensive in a shorter time span. In this context, the most important output from a pilot such as this is to generate an estimate of likely impact; this estimate then becomes a critical component for power calculations for the stepped wedge.
Our ongoing evaluation has all the limitations inherent in the analysis of nonrandomized interventions. Because it only involves 2 hospitals, it is difficult to assess variation due to facility‐specific factors. Finally, because our priority was to avoid alert fatigue, the total number of patients who experience an alert is small, limiting available sample size. Given these constraints, we will employ a counterfactual method, multivariate matching,[24, 25, 26] so as to come as close as possible to simulating a randomized trial. To control for hospital‐specific factors, matching will be combined with difference‐in‐differences[27, 28] methodology. Our basic approach takes advantage of the fact that, although our alert system is currently running in 2 hospitals, it is possible for us to assign a retrospective alert to patients at all KPNC hospitals. Using multivariate matching techniques, we will then create a cohort in which each patient who received an alert is matched to 2 patients who are given a retrospective virtual alert during the same time period in control facilities. The pre‐ and postimplementation outcomes of pilot and matched controls are compared. The matching algorithms specify exact matches on membership status, whether or not the patient had been admitted to the ICU prior to the first alert, and whether or not the patient was full code at the time of an alert. Once potential matches are found using the above procedures, our algorithms seek the closest match for the following variables: age, alert probability, COPS2, and admission LAPS2. Membership status is important, because many individuals who are not covered by the Kaiser Foundation Health Plan, Inc., are hospitalized at KPNC hospitals. Because these nonmembers' postdischarge outcomes cannot be tracked, it is important to control for this variable in our analyses.
Our electronic evaluation strategy also can be used to quantify pilot effects on length of stay (total, after an alert, and ICU), rehospitalization, use of hospice, mortality, and cost. However, it is not adequate for the evaluation of whether or not patient preferences are respected. Consequently, we have also developed manual review instruments for structured electronic chart review (the coding form and manual are provided in the online Appendix of the article in this issue of Journal of Hospital Medicine by Granich et al.[21]). This review will focus on issues such as whether or not patients' surrogates were identified, whether goals of care were discussed, and so forth. In those cases where patients died in the hospital, we will also review whether death occurred after resuscitation, whether family members were present, and so forth.
As noted above and in Figure 1, charting delays can result in uncertainty periods. We have found that these delays can also result in discrepancies in which data extracted from the real time system do not match those extracted from the data warehouse. These discrepancies can complicate creation of analysis datasets, which in turn can lead to delays in completing analyses. Such delays can cause significant problems with stakeholders. In retrospect, we should have devoted more resources to ongoing electronic audits and to the development of algorithms that formally address charting delays.
LESSONS LEARNED AND THOUGHTS ON FUTURE DISSEMINATION
We believe that embedding predictive models in the EMR will become an essential component of clinical care. Despite resource limitations and having to work in a frontier area, we did 3 things well. We were able to embed a complex set of equations and display their outputs in a commercial EMR outside the research setting. In a setting where hospitalists could have requested discontinuation of the system, we achieved consensus that it should remain the standard of care. Lastly, as a result of this work, KPNC will be deploying this early warning system in all its hospitals, so our overall implementation and communication strategy has been sound.
Nonetheless, our road to implementation has been a bumpy one, and we have learned a number of valuable lessons that are being incorporated into our future work. They merit sharing with the broader medical community. Using the title of a song by Ricky SkaggsIf I Had It All Again to Dowe can summarize what we learned with 3 phrases: engage leadership early, provide simpler explanations, and embed the evaluation in the solution.
Although our research on risk adjustment and the epidemiology was known to many KPNC leaders and clinicians, our initial engagement focus was on connecting with hospital physicians and operational leaders who worked in quality improvement. In retrospect, the research team should have engaged with 2 different communities much soonerthe information technology community and that component of leadership that focused on the EMR and information technology issues. Although these 2 broad communities interact with operations all the time, they do not necessarily have regular contact with research developments that might affect both EMR as well as quality improvement operations simultaneously. Not seeking this early engagement probably slowed our work by 9 to 15 months, because of repeated delays resulting from our assumption that the information technology teams understood things that were clear to us but not to them. One major result of this at KPNC is that we now have a regular quarterly meeting between researchers and the EMR leadership. The goal of this regular meeting is to make sure that operational leaders and researchers contemplating projects with an informatics component communicate early, long before any consideration of implementation occurs.
Whereas the notion of providing early warning seems intuitive and simple, translating this into a set of equations is challenging. However, we have found that developing equations is much easier than developing communication strategies suitable for people who are not interested in statistics, a group that probably constitutes the majority of clinicians. One major result of this learning now guiding our work is that our team devotes more time to considering existing and possible workflows. This process includes spending more time engaging with clinicians around how they use information. We are also experimenting with different ways of illustrating statistical concepts (eg, probabilities, likelihood ratios).
As is discussed in the article by Dummett et al.,[20] 1 workflow component that remains unresolved is that of documentation. It is not clear what the documentation standard should be for a deterioration probability. Solving this particular conundrum is not something that can be done by electronic or statistical means. However, also with the benefit of hindsight, we now know that we should have put more energy into automated electronic tools that provide support for documentation after an alert. In addition to being requested by clinicians, having tools that automatically generate tracers as part of both the alerting and documentation process would also make evaluation easier. For example, it would permit a better delineation of the causal path between the intervention (providing a deterioration probability) and patient outcomes. In future projects, incorporation of such tools will get much more prominence.
Acknowledgements
The authors thank Dr. Michelle Caughey, Dr. Philip Madvig, Dr. Patricia Conolly, and Ms. Barbara Crawford for their administrative support, Dr. Tracy Lieu for reviewing the manuscript, and Ms. Rachel Lesser for formatting the manuscript.
Disclosures: This work was supported by a grant from the Gordon and Betty Moore Foundation (Early Detection, Prevention, and Mitigation of Impending Physiologic Deterioration in Hospitalized Patients Outside Intensive Care: Phase 3, pilot), The Permanente Medical Group, Inc., and Kaiser Foundation Hospitals, Inc. As part of our agreement with the Gordon and Betty Moore Foundation, we made a commitment to disseminate our findings in articles such as this one. However, the Foundation and its staff played no role in how we actually structured our articles, nor did they review or preapprove any of the manuscripts submitted as part of the dissemination component. Dr. Liu was supported by the National Institute for General Medical Sciences award K23GM112018. None of the sponsors had any involvement in our decision to submit this manuscript or in the determination of its contents. None of the authors has any conflicts of interest to declare of relevance to this work
- , , , , , . Intra‐hospital transfers to a higher level of care: contribution to total hospital and intensive care unit (ICU) mortality and length of stay (LOS). J Hosp Med. 2011;6(2):74–80.
- , , , . Adverse outcomes associated with delayed intensive care unit transfers in an integrated healthcare system. J Hosp Med. 2012;7(3):224–230.
- , , , , , . Risk factors for unplanned transfer to intensive care within 24 hours of admission from the emergency department in an integrated healthcare system. J Hosp Med. 2012;8(1):13–19.
- , , , , . The medical emergency team: a new strategy to identify and intervene in high‐risk surgical patients. Clin Intensive Care. 1995;6:269–272.
- , , , . The medical emergency team. Anaesth Intensive Care. 1995;23(2):183–186.
- . The critically ill: following your MEWS. QJM. 2001;94(10):507–510.
- National Health Service. National Early Warning Score (NEWS). Standardising the Assessment Of Acute‐Illness Severity in the NHS. Report of a Working Party. London, United Kingdom: Royal College of Physicians; 2012.
- , , , et al. A randomized trial of real‐time automated clinical deterioration alerts sent to a rapid response team. J Hosp Med. 2014;9(7):424–429.
- , , , et al. Automated detection of physiologic deterioration in hospitalized patients. J Am Med Inform Assoc. 2015;22(2):350–360.
- , , , , . Identifying patients at increased risk for unplanned readmission. Med Care. 2013;51(9):761–766.
- , , , , , . Early detection of impending physiologic deterioration among patients who are not in intensive care: development of predictive models using data from an automated electronic medical record. J Hosp Med. 2012;7(5):388–395.
- , , , et al. Early detection of impending deterioration outside the ICU: a difference‐in‐differences (DiD) study. Presented at: American Thoracic Society International Conference, San Francisco, California; May 13–18, 2016; A7614.
- , , , . Unplanned transfers to a medical intensive care unit: causes and relationship to preventable errors in care. J Hosp Med. 2011;6(2):68–72.
- , , . Rapid response teams—walk, don't run. JAMA. 2006;296(13):1645–1647.
- , , , , , . Rapid response systems: a systematic review. Crit Care Med. 2007;35(5):1238–1243.
- , . Rethinking rapid response teams. JAMA. 2010;304(12):1375–1376.
- , , , , , . Risk adjusting hospital inpatient mortality using automated inpatient, outpatient, and laboratory databases. Med Care. 2008;46(3):232–239.
- , , , , . Risk‐adjusting hospital mortality using a comprehensive electronic record in an integrated healthcare delivery system. Med Care. 2013;51(5):446–453.
- , , , , , . Nonelective rehospitalizations and post‐discharge mortality: predictive models suitable for use in real time. Med Care. 2015;53(11):916–923.
- et al. J Hosp Med. 2016;11:000–000.
- et al. J Hosp Med. 2016;11:000–000.
- , . Design and analysis of stepped wedge cluster randomized trials. Contemp Clin Trials. 2007;28(2):182–191.
- , . Cluster randomized trials: evaluating treatments applied to groups. JAMA. 2015;313(20):2068–2069.
- , . Comparison of multivariate matching methods: structures, distances, and algorithms. J Comput Graph Stat. 1993;2(4):405–420.
- , , . A method/macro based on propensity score and Mahalanobis distance to reduce bias in treatment comparison in observational study. Eli Lilly working paper available at: http://www.lexjansen.com/pharmasug/2006/publichealthresearch/pr05.pdf.
- . Matching methods for causal inference: a review and a look forward. Stat Sci. 2010;25(1):1–21.
- , . Methods for evaluating changes in health care policy: the difference‐in‐differences approach. JAMA. 2014;312(22):2401–2402.
- , , . Why we should not be indifferent to specification choices for difference‐in‐differences. Health Serv Res. 2015;50(4):1211–1235.
Patients who deteriorate in the hospital and are transferred to the intensive care unit (ICU) have higher mortality and greater morbidity than those directly admitted from the emergency department.[1, 2, 3] Rapid response teams (RRTs) were created to address this problem.[4, 5] Quantitative tools, such as the Modified Early Warning Score (MEWS),[6] have been used to support RRTs almost since their inception. Nonetheless, work on developing scores that can serve as triggers for RRT evaluation or intervention continues. The notion that comprehensive inpatient electronic medical records (EMRs) could support RRTs (both as a source of patient data and a platform for providing alerts) has intuitive appeal. Not surprisingly, in addition to newer versions of manual scores,[7] electronic scores are now entering clinical practice. These newer systems are being tested in research institutions,[8] hospitals with advanced capabilities,[9] and as part of proprietary systems.[10] Although a fair amount of statistical information (eg, area under the receiver operator characteristic curve of a given predictive model) on the performance of various trigger systems has been published, existing reports have not described details of how the electronic architecture is integrated with clinical practice.
Electronic alert systems generated from physiology‐based predictive models do not yet constitute mature technologies. No consensus or legal mandate regarding their role yet exists. Given this situation, studying different implementation approaches and their outcomes has value. It is instructive to consider how a given institutional solution addresses common contingenciesoperational constraints that are likely to be present, albeit in different forms, in most placesto help others understand the limitations and issues they may present. In this article we describe the structure of an EMR‐based early warning system in 2 pilot hospitals at Kaiser Permanente Northern California (KPNC). In this pilot, we embedded an updated version of a previously described early warning score[11] into the EMR. We will emphasize how its components address institutional, operational, and technological constraints. Finally, we will also describe unfinished businesschanges we would like to see in a future dissemination phase. Two important aspects of the pilot (development of a clinical response arm and addressing patient preferences with respect to supportive care) are being described elsewhere in this issue of the Journal of Hospital Medicine. Analyses of the actual impact on patient outcomes will be reported elsewhere; initial results appear favorable.[12]
INITIAL CONSTRAINTS
The ability to actually prevent inpatient deteriorations may be limited,[13] and doubts regarding the value of RRTs persist.[14, 15, 16] Consequently, work that led to the pilot occurred in stages. In the first stage (prior to 2010), our team presented data to internal audiences documenting the rates and outcomes of unplanned transfers from the ward to the ICU. Concurrently, our team developed a first generation risk adjustment methodology that was published in 2008.[17] We used this methodology to show that unplanned transfers did, in fact, have elevated mortality, and that this persisted after risk adjustment.[1, 2, 3] This phase of our work coincided with KPNC's deployment of the Epic inpatient EMR (
Once we demonstrated that we could, in fact, predict inpatient deteriorations, we still had to address medicallegal considerations, the need for a clinical response arm, and how to address patient preferences with respect to supportive or palliative care. To address these concerns and ensure that the implementation would be seamlessly integrated with routine clinical practice, our team worked for 1 year with hospitalists and other clinicians at the pilot sites prior to the go‐live date.
The primary concern from a medicallegal perspective is that once results from a predictive model (which could be an alert, severity score, comorbidity score, or other probability estimate) are displayed in the chart, relevant clinical information has been changed. Thus, failure to address such an EMR item could lead to malpractice risk for individuals and/or enterprise liability for an organization. After discussing this with senior leadership, they specified that it would be permissible to go forward so long as we could document that an educational intervention was in place to make sure that clinicians understood the system and that it was linked to specific protocols approved by hospitalists.
Current predictive models, including ours, generate a probability estimate. They do not necessarily identify the etiology of a problem or what solutions ought to be considered. Consequently, our senior leadership insisted that we be able to answer clinicians' basic question: What do we do when we get an alert? The article by Dummett et al.[20] in this issue of the Journal of Hospital Medicine describes how we addressed this constraint. Lastly, not all patients can be rescued. The article by Granich et al.[21] describes how we handled the need to respect patient choices.
PROCEDURAL COMPONENTS
The Gordon and Betty Moore Foundation, which funded the pilot, only had 1 restriction (inclusion of a hospital in the Sacramento, California area). The other site was selected based on 2 initial criteria: (1) the chosen site had to be 1 of the smaller KPNC hospitals, and (2) the chosen site had to be easily accessible for the lead author (G.J.E.). The KPNC South San Francisco hospital was selected as the alpha site and the KPNC Sacramento hospital as the beta site. One of the major drivers for these decisions was that both had robust palliative care services. The Sacramento hospital is a larger hospital with a more complex caseload.
Prior to the go‐live dates (November 19, 2013 for South San Francisco and April 16, 2014 for Sacramento), the executive committees at both hospitals reviewed preliminary data and the implementation plans for the early warning system. Following these reviews, the executive committees approved the deployment. Also during this phase, in consultation with our communications departments, we adopted the name Advance Alert Monitoring (AAM) as the outward facing name for the system. We also developed recommended scripts for clinical staff to employ when approaching a patient in whom an alert had been issued (this is because the alert is calibrated so as to predict increased risk of deterioration within the next 12 hours, which means that a patient might be surprised as to why clinicians were suddenly evaluating them). Facility approvals occurred approximately 1 month prior to the go‐live date at each hospital, permitting a shadowing phase. In this phase, selected physicians were provided with probability estimates and severity scores, but these were not displayed in the EMR front end. This shadowing phase permitted clinicians to finalize the response arms' protocols that are described in the articles by Dummett et al.[20] and Granich et al.[21] We obtained approval from the KPNC Institutional Review Board for the Protection of Human Subjects for the evaluation component that is described below.
EARLY DETECTION ALGORITHMS
The early detection algorithms we employed, which are being updated periodically, were based on our previously published work.[11, 18] Even though admitting diagnoses were found to be predictive in our original model, during actual development of the real‐time data extraction algorithms, we found that diagnoses could not be obtained reliably, so we made the decision to use a single predictive equation for all patients. The core components of the AAM score equation are the above‐mentioned LAPS2 and COPS2; these are combined with other data elements (Table 1). None of the scores are proprietary, and our equations could be replicated by any entity with a comprehensive inpatient EMR. Our early detection system is calibrated using outcomes that occurred 12 hours from when the alert is issued. For prediction, it uses data from the preceding 12 months for the COPS2 and the preceding 24 to 72 hours for physiologic data.
| Category | Elements Included | Comment |
|---|---|---|
| Demographics | Age, sex | |
| Patient location | Unit indicators (eg, 3 West); also known as bed history indicators | Only patients in general medicalsurgical ward, transitional care unit, and telemetry unit are eligible. Patients in the operating room, postanesthesia recovery room, labor and delivery service, and pediatrics are ineligible. |
| Health services | Admission venue | Emergency department admission or not. |
| Elapsed length of stay in hospital up to the point when data are scanned | Interhospital transport is common in our integrated delivery system; this data element requires linking both unit stays as well as stays involving different hospitals. | |
| Status | Care directive orders | Patients with a comfort careonly order are not eligible; all other patients (full code, partial code, and do not resuscitate) are. |
| Admission status | Inpatients and patients admitted for observation status are eligible. | |
| Physiologic | Vital signs, laboratory tests, neurological status checks | See online Appendices and references [6] and [15] for details on how we extract, format, and transform these variables. |
| Composite indices | Generic severity of illness score | See text and description in reference [15] for details on the Laboratory‐based Acute Physiology score, version 2 and the Comorbidity Point Score, version 2. |
| Longitudinal comorbidity score |
During the course of developing the real‐time extraction algorithms, we encountered a number of delays in real‐time data acquisition. These fall into 2 categories: charting delay and server delay. Charting delay is due to nonautomated charting of vital signs by nurses (eg, a nurse obtains vital signs on a patient, writes them down on paper, and then enters them later). In general, this delay was in the 15‐ to 30‐minute range, but occasionally was as high as 2 hours. Server delay, which was variable and ranged from a few minutes to (occasionally) 1 to 2 hours, is due to 2 factors. The first is that certain point of care tests were not always uploaded into the EMR immediately. This is because the testing units, which can display results to clinicians within minutes, must be physically connected to a computer for uploading results. The second is the processing time required for the system to cycle through hundreds of patient records in the context of a very large EMR system (the KPNC Epic build runs in 6 separate geographic instances, and our system runs in 2 of these). Figure 1 shows that each probability estimate thus has what we called an uncertainty period of 2 hours (the +2 hours addresses the fact that we needed to give clinicians a minimum time to respond to an alert). Given limited resources and the need to balance accuracy of the alerts, adequate lead time, the presence of an uncertainty period, and alert fatigue, we elected to issue alerts every 6 hours (with the exact timing based on facility preferences).
A summary of the components of our equation is provided in the Supporting Information, Appendices, in the online version of this article. The statistical performance characteristics of our final equation, which are based on approximately 262 million individual data points from 650,684 hospitalizations in which patients experienced 20,471 deteriorations, is being reported elsewhere. Between November 19, 2013 and November 30, 2015 (the most recent data currently available to us for analysis), a total of 26,386 patients admitted to the ward or transitional care unit at the 2 pilot sites were scored by the AAM system, and these patients generated 3,881 alerts involving a total of 1,413 patients, which meant an average of 2 alerts per day at South San Francisco and 4 alerts per day in Sacramento. Resource limitations have precluded us from conducting formal surveys to assess clinician acceptance. However, repeated meetings with both hospitalists as well as RRT nurses indicated that favorable departmental consensus exists.
INSTANTIATION OF ALGORITHMS IN THE EMR
Given the complexity of the calculations involving many variables (Table 1), we elected to employ Web services to extract data for processing using a Java application outside the EMR, which then pushed results into the EMR front end (Figure 2). Additional details on this decision are provided in the Supporting Information, Appendices, in the online version of this article. Our team had to expend considerable resources and time to map all necessary data elements in the real time environment, whose identifying characteristics are not the same as those employed by the KPHC data warehouse. Considerable debugging was required during the first 7 months of the pilot. Troubleshooting for the application was often required on very short notice (eg, when the system unexpectedly stopped issuing alerts during a weekend, or when 1 class of patients suddenly stopped receiving scores). It is likely that future efforts to embed algorithms in EMRs will experience similar difficulties, and it is wise to budget so as maximize available analytic and application programmer resources.
Figure 3 shows the final appearance of the graphical user interface at KPHC, which provides clinicians with 3 numbers: ADV ALERT SCORE (AAM score) is the probability of experiencing unplanned transfer within the next 12 hours, COPS is the COPS2, and LAPS is the LAPS2 assigned at the time a patient is placed in a hospital room. The current protocol in place is that the clinical response arm is triggered when the AAM score is 8.
LIMITATIONS
One of the limitations of working with a commercial EMR in a large system, such as KPNC, is that of scalability. Understandably, the organization is reluctant to make changes in the EMR that will not ultimately be deployed across all hospitals in the system. Thus, any significant modification of the EMR or its associated workflows must, from the outset, be structured for subsequent spread to the remaining hospitals (19 in our case). Because we had not deployed a system like this before, we did not know what to expect and, had we known then what experience has taught us, our initial requests would have been different. Table 2 summarizes the major changes we would have made to our implementation strategy had we known then what we know now.
| Component | Status in Pilot Application | Desirable Changes |
|---|---|---|
| ||
| Degree of disaster recovery support | System outages are handled on an ad hoc basis. | Same level of support as is seen in regular clinical systems (24/7 technical support). |
| Laboratory data feed | Web service. | It would be extremely valuable to have a definite answer about whether alternative data feeds would be faster and more reliable. |
| LAPS2 score | Score appears only on ward or TCU patients. | Display for all hospitalized adults (include anyone 18 years and include ICU patients). |
| Score appears only on inpatient physician dashboard. | Display scores in multiple dashboards (eg, emergency department dashboard). | |
| COPS2 score | Score appears only on ward or TCU patients. | Display for all hospitalized adults (include anyone 18 years and include ICU patients). |
| Score appears only on inpatient physician dashboard. | Display scores in multiple dashboards (eg, emergency department dashboard). | |
| Alert response tracking | None is available. | Functionality that permits tracking what the status is of patients in whom an alert was issued (who responded, where it is charted, etc.)could be structured as a workbench report in KP HealthConnectvery important because of medical legal reasons. |
| Trending capability for scores | None is available. | Trending display available in same location where vital signs and laboratory test results are displayed. |
| Messaging capability | Not currently available. | Transmission of scores to rapid response team (or other designated first responder) via a smartphone, thus obviating the need for staff to check the inpatient dashboard manually every 6 hours. |
EVALUATION STRATEGY
Due to institutional constraints, it is not possible for us to conduct a gold standard pilot using patient‐level randomization, as described by Kollef et al.[8] Consequently, in addition to using the pilot to surface specific implementation issues, we had to develop a parallel scoring system for capturing key data points (scores, outcomes) not just at the 2 pilot sites, but also at the remaining 19 KPNC hospitals. This required that we develop electronic tools that would permit us to capture these data elements continuously, both prospectively as well as retrospectively. Thus, to give an example, we developed a macro that we call LAPS2 any time that permits us to assign a retrospective severity score given any T0. Our ultimate goal is to evaluate the system's deployment using a stepped wedge design[22] in which geographically contiguous clusters of 2 to 4 hospitals go live periodically. The silver standard (a cluster trial involving randomization at the individual hospital level[23]) is not feasible because KPNC hospitals span a very broad geographic area, and it is more resource intensive in a shorter time span. In this context, the most important output from a pilot such as this is to generate an estimate of likely impact; this estimate then becomes a critical component for power calculations for the stepped wedge.
Our ongoing evaluation has all the limitations inherent in the analysis of nonrandomized interventions. Because it only involves 2 hospitals, it is difficult to assess variation due to facility‐specific factors. Finally, because our priority was to avoid alert fatigue, the total number of patients who experience an alert is small, limiting available sample size. Given these constraints, we will employ a counterfactual method, multivariate matching,[24, 25, 26] so as to come as close as possible to simulating a randomized trial. To control for hospital‐specific factors, matching will be combined with difference‐in‐differences[27, 28] methodology. Our basic approach takes advantage of the fact that, although our alert system is currently running in 2 hospitals, it is possible for us to assign a retrospective alert to patients at all KPNC hospitals. Using multivariate matching techniques, we will then create a cohort in which each patient who received an alert is matched to 2 patients who are given a retrospective virtual alert during the same time period in control facilities. The pre‐ and postimplementation outcomes of pilot and matched controls are compared. The matching algorithms specify exact matches on membership status, whether or not the patient had been admitted to the ICU prior to the first alert, and whether or not the patient was full code at the time of an alert. Once potential matches are found using the above procedures, our algorithms seek the closest match for the following variables: age, alert probability, COPS2, and admission LAPS2. Membership status is important, because many individuals who are not covered by the Kaiser Foundation Health Plan, Inc., are hospitalized at KPNC hospitals. Because these nonmembers' postdischarge outcomes cannot be tracked, it is important to control for this variable in our analyses.
Our electronic evaluation strategy also can be used to quantify pilot effects on length of stay (total, after an alert, and ICU), rehospitalization, use of hospice, mortality, and cost. However, it is not adequate for the evaluation of whether or not patient preferences are respected. Consequently, we have also developed manual review instruments for structured electronic chart review (the coding form and manual are provided in the online Appendix of the article in this issue of Journal of Hospital Medicine by Granich et al.[21]). This review will focus on issues such as whether or not patients' surrogates were identified, whether goals of care were discussed, and so forth. In those cases where patients died in the hospital, we will also review whether death occurred after resuscitation, whether family members were present, and so forth.
As noted above and in Figure 1, charting delays can result in uncertainty periods. We have found that these delays can also result in discrepancies in which data extracted from the real time system do not match those extracted from the data warehouse. These discrepancies can complicate creation of analysis datasets, which in turn can lead to delays in completing analyses. Such delays can cause significant problems with stakeholders. In retrospect, we should have devoted more resources to ongoing electronic audits and to the development of algorithms that formally address charting delays.
LESSONS LEARNED AND THOUGHTS ON FUTURE DISSEMINATION
We believe that embedding predictive models in the EMR will become an essential component of clinical care. Despite resource limitations and having to work in a frontier area, we did 3 things well. We were able to embed a complex set of equations and display their outputs in a commercial EMR outside the research setting. In a setting where hospitalists could have requested discontinuation of the system, we achieved consensus that it should remain the standard of care. Lastly, as a result of this work, KPNC will be deploying this early warning system in all its hospitals, so our overall implementation and communication strategy has been sound.
Nonetheless, our road to implementation has been a bumpy one, and we have learned a number of valuable lessons that are being incorporated into our future work. They merit sharing with the broader medical community. Using the title of a song by Ricky SkaggsIf I Had It All Again to Dowe can summarize what we learned with 3 phrases: engage leadership early, provide simpler explanations, and embed the evaluation in the solution.
Although our research on risk adjustment and the epidemiology was known to many KPNC leaders and clinicians, our initial engagement focus was on connecting with hospital physicians and operational leaders who worked in quality improvement. In retrospect, the research team should have engaged with 2 different communities much soonerthe information technology community and that component of leadership that focused on the EMR and information technology issues. Although these 2 broad communities interact with operations all the time, they do not necessarily have regular contact with research developments that might affect both EMR as well as quality improvement operations simultaneously. Not seeking this early engagement probably slowed our work by 9 to 15 months, because of repeated delays resulting from our assumption that the information technology teams understood things that were clear to us but not to them. One major result of this at KPNC is that we now have a regular quarterly meeting between researchers and the EMR leadership. The goal of this regular meeting is to make sure that operational leaders and researchers contemplating projects with an informatics component communicate early, long before any consideration of implementation occurs.
Whereas the notion of providing early warning seems intuitive and simple, translating this into a set of equations is challenging. However, we have found that developing equations is much easier than developing communication strategies suitable for people who are not interested in statistics, a group that probably constitutes the majority of clinicians. One major result of this learning now guiding our work is that our team devotes more time to considering existing and possible workflows. This process includes spending more time engaging with clinicians around how they use information. We are also experimenting with different ways of illustrating statistical concepts (eg, probabilities, likelihood ratios).
As is discussed in the article by Dummett et al.,[20] 1 workflow component that remains unresolved is that of documentation. It is not clear what the documentation standard should be for a deterioration probability. Solving this particular conundrum is not something that can be done by electronic or statistical means. However, also with the benefit of hindsight, we now know that we should have put more energy into automated electronic tools that provide support for documentation after an alert. In addition to being requested by clinicians, having tools that automatically generate tracers as part of both the alerting and documentation process would also make evaluation easier. For example, it would permit a better delineation of the causal path between the intervention (providing a deterioration probability) and patient outcomes. In future projects, incorporation of such tools will get much more prominence.
Acknowledgements
The authors thank Dr. Michelle Caughey, Dr. Philip Madvig, Dr. Patricia Conolly, and Ms. Barbara Crawford for their administrative support, Dr. Tracy Lieu for reviewing the manuscript, and Ms. Rachel Lesser for formatting the manuscript.
Disclosures: This work was supported by a grant from the Gordon and Betty Moore Foundation (Early Detection, Prevention, and Mitigation of Impending Physiologic Deterioration in Hospitalized Patients Outside Intensive Care: Phase 3, pilot), The Permanente Medical Group, Inc., and Kaiser Foundation Hospitals, Inc. As part of our agreement with the Gordon and Betty Moore Foundation, we made a commitment to disseminate our findings in articles such as this one. However, the Foundation and its staff played no role in how we actually structured our articles, nor did they review or preapprove any of the manuscripts submitted as part of the dissemination component. Dr. Liu was supported by the National Institute for General Medical Sciences award K23GM112018. None of the sponsors had any involvement in our decision to submit this manuscript or in the determination of its contents. None of the authors has any conflicts of interest to declare of relevance to this work
- , , , , , . Intra‐hospital transfers to a higher level of care: contribution to total hospital and intensive care unit (ICU) mortality and length of stay (LOS). J Hosp Med. 2011;6(2):74–80.
- , , , . Adverse outcomes associated with delayed intensive care unit transfers in an integrated healthcare system. J Hosp Med. 2012;7(3):224–230.
- , , , , , . Risk factors for unplanned transfer to intensive care within 24 hours of admission from the emergency department in an integrated healthcare system. J Hosp Med. 2012;8(1):13–19.
- , , , , . The medical emergency team: a new strategy to identify and intervene in high‐risk surgical patients. Clin Intensive Care. 1995;6:269–272.
- , , , . The medical emergency team. Anaesth Intensive Care. 1995;23(2):183–186.
- . The critically ill: following your MEWS. QJM. 2001;94(10):507–510.
- National Health Service. National Early Warning Score (NEWS). Standardising the Assessment Of Acute‐Illness Severity in the NHS. Report of a Working Party. London, United Kingdom: Royal College of Physicians; 2012.
- , , , et al. A randomized trial of real‐time automated clinical deterioration alerts sent to a rapid response team. J Hosp Med. 2014;9(7):424–429.
- , , , et al. Automated detection of physiologic deterioration in hospitalized patients. J Am Med Inform Assoc. 2015;22(2):350–360.
- , , , , . Identifying patients at increased risk for unplanned readmission. Med Care. 2013;51(9):761–766.
- , , , , , . Early detection of impending physiologic deterioration among patients who are not in intensive care: development of predictive models using data from an automated electronic medical record. J Hosp Med. 2012;7(5):388–395.
- , , , et al. Early detection of impending deterioration outside the ICU: a difference‐in‐differences (DiD) study. Presented at: American Thoracic Society International Conference, San Francisco, California; May 13–18, 2016; A7614.
- , , , . Unplanned transfers to a medical intensive care unit: causes and relationship to preventable errors in care. J Hosp Med. 2011;6(2):68–72.
- , , . Rapid response teams—walk, don't run. JAMA. 2006;296(13):1645–1647.
- , , , , , . Rapid response systems: a systematic review. Crit Care Med. 2007;35(5):1238–1243.
- , . Rethinking rapid response teams. JAMA. 2010;304(12):1375–1376.
- , , , , , . Risk adjusting hospital inpatient mortality using automated inpatient, outpatient, and laboratory databases. Med Care. 2008;46(3):232–239.
- , , , , . Risk‐adjusting hospital mortality using a comprehensive electronic record in an integrated healthcare delivery system. Med Care. 2013;51(5):446–453.
- , , , , , . Nonelective rehospitalizations and post‐discharge mortality: predictive models suitable for use in real time. Med Care. 2015;53(11):916–923.
- et al. J Hosp Med. 2016;11:000–000.
- et al. J Hosp Med. 2016;11:000–000.
- , . Design and analysis of stepped wedge cluster randomized trials. Contemp Clin Trials. 2007;28(2):182–191.
- , . Cluster randomized trials: evaluating treatments applied to groups. JAMA. 2015;313(20):2068–2069.
- , . Comparison of multivariate matching methods: structures, distances, and algorithms. J Comput Graph Stat. 1993;2(4):405–420.
- , , . A method/macro based on propensity score and Mahalanobis distance to reduce bias in treatment comparison in observational study. Eli Lilly working paper available at: http://www.lexjansen.com/pharmasug/2006/publichealthresearch/pr05.pdf.
- . Matching methods for causal inference: a review and a look forward. Stat Sci. 2010;25(1):1–21.
- , . Methods for evaluating changes in health care policy: the difference‐in‐differences approach. JAMA. 2014;312(22):2401–2402.
- , , . Why we should not be indifferent to specification choices for difference‐in‐differences. Health Serv Res. 2015;50(4):1211–1235.
© 2016 Society of Hospital Medicine
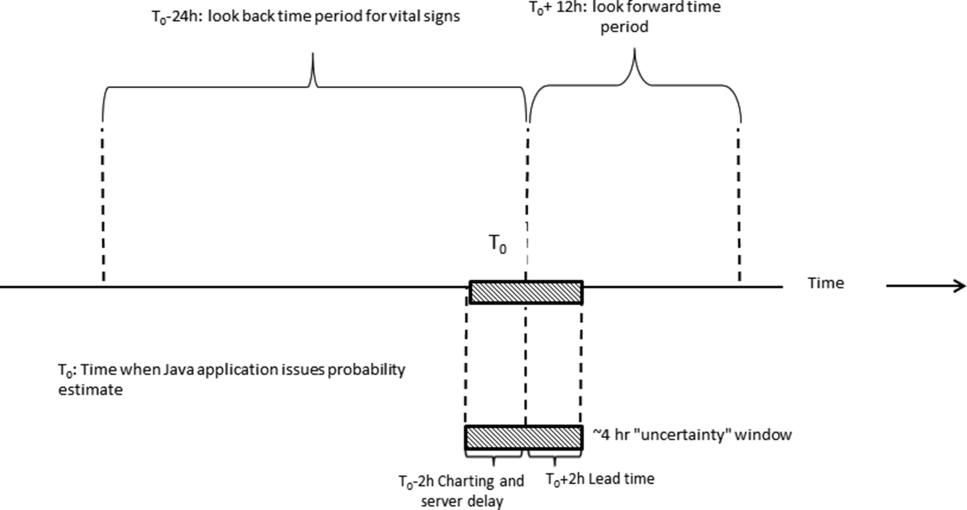
Healthcare Utilization after Sepsis
Sepsis, the systemic inflammatory response to infection, is a major public health concern.[1] Worldwide, sepsis affects millions of hospitalized patients each year.[2] In the United States, it is the single most expensive cause of hospitalization.[3, 4, 5, 6] Multiple studies suggest that sepsis hospitalizations are also increasing in frequency.[3, 6, 7, 8, 9, 10]
Improved sepsis care has dramatically reduced in‐hospital mortality.[11, 12, 13] However, the result is a growing number of sepsis survivors discharged with new disability.[1, 9, 14, 15, 16] Despite being a common cause of hospitalization, little is known about how to improve postsepsis care.[15, 17, 18, 19] This contrasts with other, often less common, hospital conditions for which many studies evaluating readmission and postdischarge care are available.[20, 21, 22, 23] Identifying the factors contributing to high utilization could lend critical insight to designing interventions that improve long‐term sepsis outcomes.[24]
We conducted a retrospective study of sepsis patients discharged in 2010 at Kaiser Permanente Northern California (KPNC) to describe their posthospital trajectories. In this diverse community‐hospitalbased population, we sought to identify the patient‐level factors that impact the posthospital healthcare utilization of sepsis survivors.
METHODS
This study was approved by the KPNC institutional review board.
Setting
We conducted a retrospective study of sepsis patients aged 18 years admitted to KPNC hospitals in 2010 whose hospitalizations included an overnight stay, began in a KPNC hospital, and was not for peripartum care. We identified sepsis based on International Classification of Disease, 9th Edition principal diagnosis codes used at KPNC, which capture a similar population to that from the Angus definition (see Supporting Appendix, Table 1, in the online version of this article).[7, 25, 26] We denoted each patient's first sepsis hospitalization as the index event.
| Predicted Hospital Mortality Quartiles (n=1,586 for Each Group) | |||||
|---|---|---|---|---|---|
| Overall | 1 | 2 | 3 | 4 | |
| |||||
| Baseline | |||||
| Age, y, mean | 71.915.7 | 62.317.8 | 71.214.2 | 75.612.7 | 78.612.2 |
| By age category | |||||
| <45 years | 410 (6.5) | 290 (18.3) | 71 (4.5) | 25 (1.6) | 24 (1.5) |
| 4564 years | 1,425 (22.5) | 539 (34.0) | 407 (25.7) | 292 (18.4) | 187 (11.8) |
| 6584 years | 3,036 (47.9) | 601 (37.9) | 814 (51.3) | 832 (52.5) | 789 (49.8) |
| 85 years | 1,473 (23.2) | 156 (9.8) | 294 (18.5) | 437 (27.6) | 586 (37.0) |
| Male | 2,973 (46.9) | 686 (43.3) | 792 (49.9) | 750 (47.3) | 745 (47.0) |
| Comorbidity | |||||
| COPS2 score | 5143 | 2627 | 5441 | 6445 | 6245 |
| Charlson score | 2.01.5 | 1.31.2 | 2.11.4 | 2.41.5 | 2.41.5 |
| Hospitalization | |||||
| LAPS2 severity score | 10742 | 6621 | 9020 | 11423 | 15928 |
| Admitted via emergency department | 6,176 (97.4) | 1,522 (96.0) | 1,537 (96.9) | 1,539 (97.0) | 1,578 (99.5) |
| Direct ICU admission | 1,730 (27.3) | 169 (10.7) | 309 (19.5) | 482 (30.4) | 770 (48.6) |
| ICU transfer, at any time | 2,206 (34.8) | 279 (17.6) | 474 (29.9) | 603 (38.0) | 850 (53.6) |
| Hospital mortality | |||||
| Predicted, % | 10.513.8 | 1.00.1 | 3.40.1 | 8.32.3 | 29.415.8 |
| Observed | 865 (13.6) | 26 (1.6) | 86 (5.4) | 197 (12.4) | 556 (35.1) |
| Hospital length of stay, d | 5.86.4 | 4.43.8 | 5.45.7 | 6.68.0 | 6.66.9 |
We linked hospital episodes with existing KPNC inpatient databases to describe patient characteristics.[27, 28, 29, 30] We categorized patients by age (45, 4564, 6584, and 85 years) and used Charlson comorbidity scores and Comorbidity Point Scores 2 (COPS2) to quantify comorbid illness burden.[28, 30, 31, 32] We quantified acute severity of illness using the Laboratory Acute Physiology Scores 2 (LAPS2), which incorporates 15 laboratory values, 5 vital signs, and mental status prior to hospital admission (including emergency department data).[30] Both the COPS2 and LAPS2 are independently associated with hospital mortality.[30, 31] We also generated a summary predicted risk of hospital mortality based on a validated risk model and stratified patients by quartiles.[30] We determined whether patients were admitted to the intensive care unit (ICU).[29]
Outcomes
We used patients' health insurance administrative data to quantify postsepsis utilization. Within the KPNC integrated healthcare delivery system, uniform information systems capture all healthcare utilization of insured members including services received at non‐KPNC facilities.[28, 30] We collected utilization data from the year preceding index hospitalization (presepsis) and for the year after discharge date or until death (postsepsis). We ascertained mortality after discharge from KPNC medical records as well as state and national death record files.
We grouped services into facility‐based or outpatient categories. Facility‐based services included inpatient admission, subacute nursing facility or long‐term acute care, and emergency department visits. We grouped outpatient services as hospice, home health, outpatient surgery, clinic, or other (eg, laboratory). We excluded patients whose utilization records were not available over the full presepsis interval. Among these 1211 patients (12.5% of total), the median length of records prior to index hospitalization was 67 days, with a mean value of 117 days.
Statistical Analysis
Our primary outcomes of interest were hospital readmission and utilization in the year after sepsis. We defined a hospital readmission as any inpatient stay after the index hospitalization grouped within 1‐, 3‐, 6‐, and 12‐month intervals. We designated those within 30 days as an early readmission. We grouped readmission principal diagnoses, where available, by the 17 Healthcare Cost and Utilization Project (HCUP) Clinical Classifications Software multilevel categories with sepsis in the infectious category.[33, 34] In secondary analysis, we also designated other infectious diagnoses not included in the standard HCUP infection category (eg, pneumonia, meningitis, cellulitis) as infection (see Supporting Appendix in the online version of this article).
We quantified outpatient utilization based on the number of episodes recorded. For facility‐based utilization, we calculated patient length of stay intervals. Because patients surviving their index hospitalization might not survive the entire year after discharge, we also calculated utilization adjusted for patients' living days by dividing the total facility length of stay by the number of living days after discharge.
Continuous data are represented as mean (standard deviation [SD]) and categorical data as number (%). We compared groups with analysis of variance or 2 testing. We estimated survival with Kaplan‐Meier analysis (95% confidence interval) and compared groups with log‐rank testing. We compared pre‐ and postsepsis healthcare utilization with paired t tests.
To identify factors associated with early readmission after sepsis, we used a competing risks regression model.[35] The dependent variable was time to readmission and the competing hazard was death within 30 days without early readmission; patients without early readmission or death were censored at 30 days. The independent variables included age, gender, comorbid disease burden (COPS2), acute severity of illness (LAPS2), any use of intensive care, total index length of stay, and percentage of living days prior to sepsis hospitalization spent utilizing facility‐based care. We also used logistic regression to quantify the association between these variables and high postsepsis utilization; we defined high utilization as 15% of living days postsepsis spent in facility‐based care. For each model, we quantified the relative contribution of each predictor variable to model performance based on differences in log likelihoods.[35, 36] We conducted analyses using STATA/SE version 11.2 (StataCorp, College Station, TX) and considered a P value of <0.05 to be significant.
RESULTS
Cohort Characteristics
Our study cohort included 6344 patients with index sepsis hospitalizations in 2010 (Table 1). Mean age was 72 (SD 16) years including 1835 (28.9%) patients aged <65 years. During index hospitalizations, higher predicted mortality was associated with increased age, comorbid disease burden, and severity of illness (P<0.01 for each). ICU utilization increased across predicted mortality strata; for example, 10.7% of patients in the lowest quartile were admitted directly to the ICU compared with 48.6% in the highest quartile. In the highest quartile, observed mortality was 35.1%.
One‐Year Survival
A total of 5479 (86.4%) patients survived their index sepsis hospitalization. Overall survival after living discharge was 90.5% (range, 89.6%91.2%) at 30 days and 71.3% (range, 70.1%72.5%) at 1 year. However, postsepsis survival was strongly modified by age (Figure 1). For example, 1‐year survival was 94.1% (range, 91.2%96.0%) for <45 year olds and 54.4% (range, 51.5%57.2%) for 85 year olds (P<0.01). Survival was also modified by predicted mortality, however, not by ICU admission during index hospitalization (P=0.18) (see Supporting Appendix, Figure 1, in the online version of this article).

Hospital Readmission
Overall, 978 (17.9%) patients had early readmission after index discharge (Table 2); nearly half were readmitted at least once in the year following discharge. Rehospitalization frequency was slightly lower when including patients with incomplete presepsis data (see Supporting Appendix, Table 2, in the online version of this article). The frequency of hospital readmission varied based on patient age and severity of illness. For example, 22.3% of patients in the highest predicted mortality quartile had early readmission compared with 11.6% in the lowest. The median time from discharge to early readmission was 11 days. Principal diagnoses were available for 78.6% of all readmissions (see Supporting Appendix, Table 3, in the online version of this article). Between 28.3% and 42.7% of those readmissions were for infectious diagnoses (including sepsis).
| Predicted Mortality Quartile | |||||
|---|---|---|---|---|---|
| Readmission | Overall | 1 | 2 | 3 | 4 |
| Within 30 days | 978 (17.9) | 158 (11.6) | 242 (17.7) | 274 (20.0) | 304 (22.3) |
| Within 90 days | 1,643 (30.1) | 276 (20.2) | 421 (30.8) | 463 (33.9) | 483 (35.4) |
| Within 180 days | 2,061 (37.7) | 368 (26.9) | 540 (39.5) | 584 (42.7) | 569 (41.7) |
| Within 365 days | 2,618 (47.9) | 498 (36.4) | 712 (52.1) | 723 (52.9) | 685 (50.2) |
| Variable | Hazard Ratio for Early Readmission | Odds Ratio for High Utilization | ||
|---|---|---|---|---|
| HR (95% CI) | Relative Contribution | OR (95% CI) | Relative Contribution | |
| ||||
| Age category | 1.2% | 11.1% | ||
| <45 years | 1.00 [reference] | 1.00 [reference] | ||
| 4564 years | 0.86 (0.64‐1.16) | 2.22 (1.30‐3.83)a | ||
| 6584 years | 0.92 (0.69‐1.21) | 3.66 (2.17‐6.18)a | ||
| 85 years | 0.95 (0.70‐1.28) | 4.98 (2.92‐8.50)a | ||
| Male | 0.99 (0.88‐1.13) | 0.0% | 0.86 (0.74‐1.00) | 0.1% |
| Severity of illness (LAPS2) | 1.08 (1.04‐1.12)a | 12.4% | 1.22 (1.17‐1.27)a | 11.3% |
| Comorbid illness (COPS2) | 1.16 (1.12‐1.19)a | 73.9% | 1.13 (1.09‐1.17)a | 5.9% |
| Intensive care | 1.21 (1.05‐1.40)a | 5.2% | 1.02 (0.85‐1.21) | 0.0% |
| Hospital length of stay, day | 1.01 (1.001.02)b | 6.6% | 1.04 (1.03‐1.06)a | 6.9% |
| Prior utilization, per 10% | 0.98 (0.95‐1.02) | 0.7% | 1.74 (1.61‐1.88)a | 64.2% |
Healthcare Utilization
The unadjusted difference between pre‐ and postsepsis healthcare utilization among survivors was statistically significant for most categories but of modest clinical significance (see Supporting Appendix, Table 4, in the online version of this article). For example, the mean number of presepsis hospitalizations was 0.9 (1.4) compared to 1.0 (1.5) postsepsis (P<0.01). After adjusting for postsepsis living days, the difference in utilization was more pronounced (Figure 2). Overall, there was roughly a 3‐fold increase in the mean percentage of living days spent in facility‐based care between patients' pre‐ and postsepsis phases (5.3% vs 15.0%, P<0.01). Again, the difference was strongly modified by age. For patients aged <45 years, the difference was not statistically significant (2.4% vs 2.9%, P=0.32), whereas for those aged 65 years, it was highly significant (6.2% vs 18.5%, P<0.01).
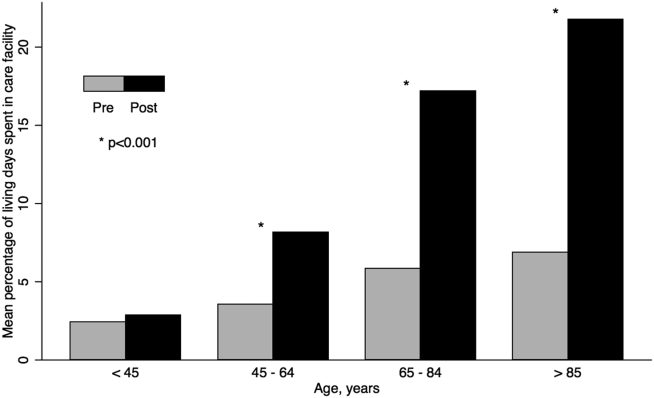
Factors associated with early readmission included severity of illness, comorbid disease burden, index hospital length of stay, and intensive care (Table 3). However, the dominant factor explaining variation in the risk of early readmission was patients' prior comorbid disease burden (73.9%), followed by acute severity of illness (12.4%), total hospital length of stay (6.6%), and the need for intensive care (5.2%). Severity of illness and age were also significantly associated with higher odds of high postsepsis utilization; however, the dominant factor contributing to this risk was a history of high presepsis utilization (64.2%).
DISCUSSION
In this population‐based study in a community healthcare system, the impact of sepsis extended well beyond the initial hospitalization. One in 6 sepsis survivors was readmitted within 30 days, and roughly half were readmitted within 1 year. Fewer than half of rehospitalizations were for sepsis. Patients had a 3‐fold increase in the percentage of living days spent in hospitals or care facilities after sepsis hospitalization. Although age and acute severity of illness strongly modified healthcare utilization and mortality after sepsis, the dominant factors contributing to early readmission and high utilization ratescomorbid disease burden and presepsis healthcare utilizationwere present prior to hospitalization.
Sepsis is the single most expensive cause of US hospitalizations.[3, 4, 5] Despite its prevalence, there are little contemporary data identifying factors that impact healthcare utilization among sepsis survivors.[9, 16, 17, 19, 24, 36, 37] Recently, Prescott and others found that in Medicare beneficiaries, following severe sepsis, healthcare utilization was markedly increased.[17] More than one‐quarter of survivors were readmitted within 30 days, and 63.8% were readmitted within a year. Severe sepsis survivors also spent an average of 26% of their living days in a healthcare facility, a nearly 4‐fold increase compared to their presepsis phase. The current study included a population with a broader age and severity range; however, in a similar subgroup of patients, for those aged 65 years within the highest predicted mortality quartile, the frequency of readmission was similar. These findings are concordant with those from prior studies.[17, 19, 36, 37]
Among sepsis survivors, most readmissions were not for sepsis or infectious diagnoses, which is a novel finding with implications for designing approaches to reduce rehospitalization. The pattern in sepsis is similar to that seen in other common and costly hospital conditions.[17, 20, 23, 38, 39, 40] For example, between 18% and 25% of Medicare beneficiaries hospitalized for heart failure, acute myocardial infarction, or pneumonia were readmitted within 30 days; fewer than one‐third had the same diagnosis.[20] The timing of readmission in our sepsis cohort was also similar to that seen in other conditions.[20] For example, the median time of early readmission in this study was 11 days; it was between 10 and 12 days for patients with heart failure, pneumonia, and myocardial infarction.[20]
Krumholz and others suggest that the pattern of early rehospitalization after common acute conditions reflects a posthospital syndromean acquired, transient period of vulnerabilitythat could be the byproduct of common hospital factors.[20, 41] Such universal impairments might result from new physical and neurocognitive disability, nutritional deficiency, and sleep deprivation or delirium, among others.[41] If this construct were also true in sepsis, it could have important implications on the design of postsepsis care. However, prior studies suggest that sepsis patients may be particularly vulnerable to the sequelae of hospitalization.[2, 42, 43, 44, 45]
Among Medicare beneficiaries, Iwashyna and others reported that hospitalizations for severe sepsis resulted in significant increases in physical limitations and moderate to severe cognitive impairment.[1, 14, 46] Encephalopathy, sleep deprivation, and delirium are also frequently seen in sepsis patients.[47, 48] Furthermore, sepsis patients frequently need intensive care, which is also associated with increased patient disability and injury.[16, 46, 49, 50] We found that severity of illness and the need for intensive care were both predictive of the need for early readmission following sepsis. We also confirmed the results of prior studies suggesting that sepsis outcomes are strongly modified by age.[16, 19, 43, 51]
However, we found that the dominant factors contributing to patients' health trajectories were conditions present prior to admission. This finding is in accord with prior suggestions that acute severity of illness only partially predicts patients facing adverse posthospital sequelae.[23, 41, 52] Among sepsis patients, prior work demonstrates that inadequate consideration for presepsis level of function and utilization can result in an overestimation of the impact of sepsis on postdischarge health.[52, 53] Further, we found that the need for intensive care was not independently associated with an increased risk of high postsepsis utilization after adjusting for illness severity, a finding also seen in prior studies.[17, 23, 38, 51]
Taken together, our findings might suggest that an optimal approach to posthospital care in sepsis should focus on treatment approaches that address disease‐specific problems within the much larger context of common hospital risks. However, further study is necessary to clearly define the mechanisms by which age, severity of illness, and intensive care affect subsequent healthcare utilization. Furthermore, sepsis patients are a heterogeneous population in terms of severity of illness, site and pathogen of infection, and underlying comorbidity whose posthospital course remains incompletely characterized, limiting our ability to draw strong inferences.
These results should be interpreted in light of the study's limitations. First, our cohort included patients with healthcare insurance within a community‐based healthcare system. Care within the KPNC system, which bears similarities with accountable care organizations, is enhanced through service integration and a comprehensive health information system. Although prior studies suggest that these characteristics result in improved population‐based care, it is unclear whether there is a similar impact in hospital‐based conditions such as sepsis.[54, 55] Furthermore, care within an integrated system may impact posthospital utilization patterns and could limit generalizability. However, prior studies demonstrate the similarity of KPNC members to other patients in the same region in terms of age, socioeconomics, overall health behaviors, and racial/ethnic diversity.[56] Second, our study did not characterize organ dysfunction based on diagnosis coding, a common feature of sepsis studies that lack detailed physiologic severity data.[4, 5, 6, 8, 26] Instead, we focused on using granular laboratory and vital signs data to ensure accurate risk adjustment using a validated system developed in >400,000 hospitalizations.[30] Although this method may hamper comparisons with existing studies, traditional methods of grading severity by diagnosis codes can be vulnerable to biases resulting in wide variability.[10, 23, 26, 57, 58] Nonetheless, it is likely that characterizing preexisting and acute organ dysfunction will improve risk stratification in the heterogeneous sepsis population. Third, this study did not include data regarding patients' functional status, which has been shown to strongly predict patient outcomes following hospitalization. Fourth, this study did not address the cost of care following sepsis hospitalizations.[19, 59] Finally, our study excluded patients with incomplete utilization records, a choice designed to avoid the spurious inferences that can result from such comparisons.[53]
In summary, we found that sepsis exacted a considerable toll on patients in the hospital and in the year following discharge. Sepsis patients were frequently rehospitalized within a month of discharge, and on average had a 3‐fold increase in their subsequent time spent in healthcare facilities. Although age, severity of illness, and the need for ICU care impacted postsepsis utilization, the dominant contributing factorscomorbid disease burden or presepsis utilizationwere present prior to sepsis hospitalization. Early readmission patterns in sepsis appeared similar to those seen in other important hospital conditions, suggesting a role for shared posthospital, rather than just postsepsis, care approaches.
Disclosures
The funding for this study was provided by The Permanente Medical Group, Inc. and Kaiser Foundation Hospitals. The authors have no conflict of interests to disclose relevant to this article.
- . The lingering consequences of sepsis: a hidden public health disaster? JAMA. 2010;304(16):1833–1834.
- , , , et al.; Surviving Sepsis Campaign Guidelines Committee including the Pediatric Subgroup. Surviving sepsis campaign: international guidelines for management of severe sepsis and septic shock: 2012. Crit Care Med. 2013;41(2):580–637.
- , , . Costs for hospital stays in the United States, 2010. HCUP statistical brief #16. January 2013. Rockville, MD: Agency for Healthcare Research and Quality; 2013. Available at: http://www.hcup‐us.ahrq.gov/reports/statbriefs/sb146.pdf. Accessed October 1, 2013.
- , , , . The epidemiology of sepsis in the United States from 1979 through 2000. N Engl J Med. 2003;348(16):1546–1554.
- , , , , , . Epidemiology of severe sepsis in the United States: analysis of incidence, outcome, and associated costs of care. Crit Care Med. 2001;29(7):1303–1310.
- , , , . Rapid increase in hospitalization and mortality rates for severe sepsis in the United States: a trend analysis from 1993 to 2003. Crit Care Med. 2007;35(5):1244–1250.
- , , . Septicemia in U.S. hospitals, 2009. HCUP statistical brief #122. October 2011. Rockville, MD: Agency for Healthcare Research and Quality; 2011. Available at: http://www.hcup‐us.ahrq.gov/reports/statbriefs/sb122.pdf. Accessed October 1, 2013.
- , , , , , . Hospitalizations, costs, and outcomes of severe sepsis in the United States 2003 to 2007. Crit Care Med. 2012;40(3):754–761.
- , , , . Population burden of long‐term survivorship after severe sepsis in older Americans. J Am Geriatr Soc. 2012;60(6):1070–1077.
- , , , . Benchmarking the incidence and mortality of severe sepsis in the United States. Crit Care Med. 2013;41(5):1167–1174.
- , , , et al. Outcomes of the Surviving Sepsis Campaign in intensive care units in the USA and Europe: a prospective cohort study. Lancet Infect Dis. 2012;12(12):919–924.
- , , , . Reducing mortality in severe sepsis: the Surviving Sepsis Campaign. Clin Chest Med. 2008;29(4):721–733, x.
- , , , et al.; Early Goal‐Directed Therapy Collaborative Group. Early goal‐directed therapy in the treatment of severe sepsis and septic shock. N Engl J Med. 2001;345(19):1368–1377.
- , , , . Long‐term cognitive impairment and functional disability among survivors of severe sepsis. JAMA. 2010;304(16):1787–1794.
- , , , , , . Long‐term mortality and quality of life in sepsis: a systematic review. Crit Care Med. 2010;38(5):1276–1283.
- , , , et al.; the Scottish Critical Care Trials Group and the Scottish Intensive Care Society Audit Group. Mortality and quality of life in the five years after severe sepsis. Crit Care. 2013;17(2):R70.
- , , , , . Post‐Discharge Health Care Use Is Markedly Higher in Survivors of Severe Sepsis. Am J Respir Crit Care Med 2013;187:A1573.
- , , , . Long‐term survival and function after suspected gram‐negative sepsis. JAMA. 1995;274(4):338–345.
- , , , , . Long‐term mortality and medical care charges in patients with severe sepsis. Crit Care Med. 2003;31(9):2316–2323.
- , , , et al. Diagnoses and timing of 30‐day readmissions after hospitalization for heart failure, acute myocardial infarction, or pneumonia. JAMA. 2013;309(4):355–363.
- , , , , . A systematic review and meta‐analysis of studies comparing readmission rates and mortality rates in patients with heart failure. Arch Intern Med. 2004;164(21):2315–2320.
- , . Hospitalizations for heart failure in the United States—a sign of hope. JAMA. 2011;306(15):1705–1706.
- , , , et al. Risk prediction models for hospital readmission: a systematic review. JAMA. 2011;306(15):1688–1698.
- , . Sepsis after Scotland: enough with the averages, show us the effect modifiers. Crit Care. 2013;17(3):148.
- , , , et al. Kaiser Permanente's performance improvement system, part 3: multisite improvements in care for patients with sepsis. Jt Comm J Qual Patient Saf. 2011;37(11): 483–493.
- , , , et al. Identifying patients with severe sepsis using administrative claims: patient‐level validation of the Angus implementation of the International Consensus Conference Definition of Severe Sepsis [published online ahead of print September 18, 2012]. Med Care. doi: 10.1097/MLR.0b013e318268ac86. Epub ahead of print.
- . Linking automated databases for research in managed care settings. Ann Intern Med. 1997;127(8 pt 2):719–724.
- , , , , , . Risk‐adjusting hospital inpatient mortality using automated inpatient, outpatient, and laboratory databases. Med Care. 2008;46(3):232–239.
- , , , , . An electronic Simplified Acute Physiology Score‐based risk adjustment score for critical illness in an integrated healthcare system. Crit Care Med. 2013;41(1):41–48.
- , , , , . Risk‐adjusting hospital mortality using a comprehensive electronic record in an integrated health care delivery system. Med Care. 2013;51(5):446–453.
- , , , , , . Early detection of impending physiologic deterioration among patients who are not in intensive care: development of predictive models using data from an automated electronic medical record. J Hosp Med. 2012;7(5):388–395.
- , , , . The Kaiser Permanente inpatient risk adjustment methodology was valid in an external patient population. J Clin Epidemiol. 2009;63(7):798–803.
- , , , , , . Casemix adjustment of managed care claims data using the clinical classification for health policy research method. Med Care. 1998;36(7):1108–1113.
- Agency for Healthcare Research and Quality Healthcare Cost and Utilization Project. Clinical Classifications Software (CCS) for ICD‐9‐CM Fact Sheet. Available at: http://www.hcup‐us.ahrq.gov/toolssoftware/ccs/ccsfactsheet.jsp. Accessed January 20, 2013.
- , . A proportional hazards model for the subdistribution of a competing risk. J Am Stat Assoc. 1997;94(446):496–509.
- , , . Severe sepsis in managed care: analysis of incidence, one‐year mortality, and associated costs of care. J Manag Care Pharm. 2004;10(6):521–530.
- , , , , , . Detailed cost analysis of care for survivors of severe sepsis. Crit Care Med. 2004;32(4):981–985.
- , , , , et al. Readmissions among patients with severe sepsis/septic shock among inner‐city minority New Yorkers. Chest. 2012;142:286A.
- , , . Readmission and late mortality after pediatric severe sepsis. Pediatrics. 2009;123(3):849–857.
- , , . Rehospitalizations among patients in the Medicare fee‐for‐service program. N Engl J Med. 2009;360(14):1418–1428.
- . Post‐hospital syndrome—an acquired, transient condition of generalized risk. N Engl J Med. 2013;368(2):100–102.
- , , , et al. Definitions for sepsis and organ failure and guidelines for the use of innovative therapies in sepsis. The ACCP/SCCM Consensus Conference Committee. American College of Chest Physicians/Society of Critical Care Medicine. Chest. 1992;101(6):1644–1655.
- , , . The effect of age on the development and outcome of adult sepsis. Crit Care Med. 2006;34(1):15–21.
- , . Multiple systems organ failure: failure of host defense homeostasis. Crit Care Clin. 1989;5(2):199–220.
- . Pathophysiology of sepsis. Am J Pathol. 2007;170(5):1435–1444.
- , . Surviving intensive care: a report from the 2002 Brussels Roundtable. Intensive Care Med. 2003;29(3):368–377.
- , , . The encephalopathy in sepsis. Crit Care Clin. 2008;24(1):67–82, viii.
- , . Sepsis‐associated encephalopathy. Nat Rev Neurol. 2012;8(10):557–566.
- , , , et al. Improving long‐term outcomes after discharge from intensive care unit: report from a stakeholders' conference. Crit Care Med. 2012;40(2):502–509.
- , , , , . The association between sepsis and potential medical injury among hospitalized patients. Chest. 2012;142(3):606–613.
- , , , , , . Three‐year outcomes for Medicare beneficiaries who survive intensive care. JAMA. 2010;303(9):849–856.
- , , , , , . Does acute organ dysfunction predict patient‐centered outcomes? Chest. 2002;121(6):1963–1971.
- , , , . Spurious inferences about long‐term outcomes: the case of severe sepsis and geriatric conditions. Am J Respir Crit Care Med. 2012;185(8):835–841.
- , , , , , . Population trends in the incidence and outcomes of acute myocardial infarction. N Engl J Med. 2010;362(23):2155–2165.
- , , , et al., Outpatient electronic health records and the clinical care and outcomes of patients with diabetes mellitus. Ann Intern Med. 2012;157(7):482–489.
- . Similarity of the adult Kaiser Permanente membership in Northern California to the insured and general population in Northern California: statistics from the 2009 California Health Interview Survey. Internal Division of Research Report. Oakland, CA: Kaiser Permanente Division of Research; January 24, 2012. Available at: http://www.dor.kaiser.org/external/chis_non_kp_2009. Accessed January 20, 2013.
- , , , , . Association of diagnostic coding with trends in hospitalizations and mortality of patients with pneumonia, 2003–2009. JAMA. 2012;307(13):1405–1413.
- , . Finding pure and simple truths with administrative data. JAMA. 2012;307(13):1433–1435.
- , , , . Cost savings attributable to reductions in intensive care unit length of stay for mechanically ventilated patients. Med Care. 2008;46(12):1226–1233.
Sepsis, the systemic inflammatory response to infection, is a major public health concern.[1] Worldwide, sepsis affects millions of hospitalized patients each year.[2] In the United States, it is the single most expensive cause of hospitalization.[3, 4, 5, 6] Multiple studies suggest that sepsis hospitalizations are also increasing in frequency.[3, 6, 7, 8, 9, 10]
Improved sepsis care has dramatically reduced in‐hospital mortality.[11, 12, 13] However, the result is a growing number of sepsis survivors discharged with new disability.[1, 9, 14, 15, 16] Despite being a common cause of hospitalization, little is known about how to improve postsepsis care.[15, 17, 18, 19] This contrasts with other, often less common, hospital conditions for which many studies evaluating readmission and postdischarge care are available.[20, 21, 22, 23] Identifying the factors contributing to high utilization could lend critical insight to designing interventions that improve long‐term sepsis outcomes.[24]
We conducted a retrospective study of sepsis patients discharged in 2010 at Kaiser Permanente Northern California (KPNC) to describe their posthospital trajectories. In this diverse community‐hospitalbased population, we sought to identify the patient‐level factors that impact the posthospital healthcare utilization of sepsis survivors.
METHODS
This study was approved by the KPNC institutional review board.
Setting
We conducted a retrospective study of sepsis patients aged 18 years admitted to KPNC hospitals in 2010 whose hospitalizations included an overnight stay, began in a KPNC hospital, and was not for peripartum care. We identified sepsis based on International Classification of Disease, 9th Edition principal diagnosis codes used at KPNC, which capture a similar population to that from the Angus definition (see Supporting Appendix, Table 1, in the online version of this article).[7, 25, 26] We denoted each patient's first sepsis hospitalization as the index event.
| Predicted Hospital Mortality Quartiles (n=1,586 for Each Group) | |||||
|---|---|---|---|---|---|
| Overall | 1 | 2 | 3 | 4 | |
| |||||
| Baseline | |||||
| Age, y, mean | 71.915.7 | 62.317.8 | 71.214.2 | 75.612.7 | 78.612.2 |
| By age category | |||||
| <45 years | 410 (6.5) | 290 (18.3) | 71 (4.5) | 25 (1.6) | 24 (1.5) |
| 4564 years | 1,425 (22.5) | 539 (34.0) | 407 (25.7) | 292 (18.4) | 187 (11.8) |
| 6584 years | 3,036 (47.9) | 601 (37.9) | 814 (51.3) | 832 (52.5) | 789 (49.8) |
| 85 years | 1,473 (23.2) | 156 (9.8) | 294 (18.5) | 437 (27.6) | 586 (37.0) |
| Male | 2,973 (46.9) | 686 (43.3) | 792 (49.9) | 750 (47.3) | 745 (47.0) |
| Comorbidity | |||||
| COPS2 score | 5143 | 2627 | 5441 | 6445 | 6245 |
| Charlson score | 2.01.5 | 1.31.2 | 2.11.4 | 2.41.5 | 2.41.5 |
| Hospitalization | |||||
| LAPS2 severity score | 10742 | 6621 | 9020 | 11423 | 15928 |
| Admitted via emergency department | 6,176 (97.4) | 1,522 (96.0) | 1,537 (96.9) | 1,539 (97.0) | 1,578 (99.5) |
| Direct ICU admission | 1,730 (27.3) | 169 (10.7) | 309 (19.5) | 482 (30.4) | 770 (48.6) |
| ICU transfer, at any time | 2,206 (34.8) | 279 (17.6) | 474 (29.9) | 603 (38.0) | 850 (53.6) |
| Hospital mortality | |||||
| Predicted, % | 10.513.8 | 1.00.1 | 3.40.1 | 8.32.3 | 29.415.8 |
| Observed | 865 (13.6) | 26 (1.6) | 86 (5.4) | 197 (12.4) | 556 (35.1) |
| Hospital length of stay, d | 5.86.4 | 4.43.8 | 5.45.7 | 6.68.0 | 6.66.9 |
We linked hospital episodes with existing KPNC inpatient databases to describe patient characteristics.[27, 28, 29, 30] We categorized patients by age (45, 4564, 6584, and 85 years) and used Charlson comorbidity scores and Comorbidity Point Scores 2 (COPS2) to quantify comorbid illness burden.[28, 30, 31, 32] We quantified acute severity of illness using the Laboratory Acute Physiology Scores 2 (LAPS2), which incorporates 15 laboratory values, 5 vital signs, and mental status prior to hospital admission (including emergency department data).[30] Both the COPS2 and LAPS2 are independently associated with hospital mortality.[30, 31] We also generated a summary predicted risk of hospital mortality based on a validated risk model and stratified patients by quartiles.[30] We determined whether patients were admitted to the intensive care unit (ICU).[29]
Outcomes
We used patients' health insurance administrative data to quantify postsepsis utilization. Within the KPNC integrated healthcare delivery system, uniform information systems capture all healthcare utilization of insured members including services received at non‐KPNC facilities.[28, 30] We collected utilization data from the year preceding index hospitalization (presepsis) and for the year after discharge date or until death (postsepsis). We ascertained mortality after discharge from KPNC medical records as well as state and national death record files.
We grouped services into facility‐based or outpatient categories. Facility‐based services included inpatient admission, subacute nursing facility or long‐term acute care, and emergency department visits. We grouped outpatient services as hospice, home health, outpatient surgery, clinic, or other (eg, laboratory). We excluded patients whose utilization records were not available over the full presepsis interval. Among these 1211 patients (12.5% of total), the median length of records prior to index hospitalization was 67 days, with a mean value of 117 days.
Statistical Analysis
Our primary outcomes of interest were hospital readmission and utilization in the year after sepsis. We defined a hospital readmission as any inpatient stay after the index hospitalization grouped within 1‐, 3‐, 6‐, and 12‐month intervals. We designated those within 30 days as an early readmission. We grouped readmission principal diagnoses, where available, by the 17 Healthcare Cost and Utilization Project (HCUP) Clinical Classifications Software multilevel categories with sepsis in the infectious category.[33, 34] In secondary analysis, we also designated other infectious diagnoses not included in the standard HCUP infection category (eg, pneumonia, meningitis, cellulitis) as infection (see Supporting Appendix in the online version of this article).
We quantified outpatient utilization based on the number of episodes recorded. For facility‐based utilization, we calculated patient length of stay intervals. Because patients surviving their index hospitalization might not survive the entire year after discharge, we also calculated utilization adjusted for patients' living days by dividing the total facility length of stay by the number of living days after discharge.
Continuous data are represented as mean (standard deviation [SD]) and categorical data as number (%). We compared groups with analysis of variance or 2 testing. We estimated survival with Kaplan‐Meier analysis (95% confidence interval) and compared groups with log‐rank testing. We compared pre‐ and postsepsis healthcare utilization with paired t tests.
To identify factors associated with early readmission after sepsis, we used a competing risks regression model.[35] The dependent variable was time to readmission and the competing hazard was death within 30 days without early readmission; patients without early readmission or death were censored at 30 days. The independent variables included age, gender, comorbid disease burden (COPS2), acute severity of illness (LAPS2), any use of intensive care, total index length of stay, and percentage of living days prior to sepsis hospitalization spent utilizing facility‐based care. We also used logistic regression to quantify the association between these variables and high postsepsis utilization; we defined high utilization as 15% of living days postsepsis spent in facility‐based care. For each model, we quantified the relative contribution of each predictor variable to model performance based on differences in log likelihoods.[35, 36] We conducted analyses using STATA/SE version 11.2 (StataCorp, College Station, TX) and considered a P value of <0.05 to be significant.
RESULTS
Cohort Characteristics
Our study cohort included 6344 patients with index sepsis hospitalizations in 2010 (Table 1). Mean age was 72 (SD 16) years including 1835 (28.9%) patients aged <65 years. During index hospitalizations, higher predicted mortality was associated with increased age, comorbid disease burden, and severity of illness (P<0.01 for each). ICU utilization increased across predicted mortality strata; for example, 10.7% of patients in the lowest quartile were admitted directly to the ICU compared with 48.6% in the highest quartile. In the highest quartile, observed mortality was 35.1%.
One‐Year Survival
A total of 5479 (86.4%) patients survived their index sepsis hospitalization. Overall survival after living discharge was 90.5% (range, 89.6%91.2%) at 30 days and 71.3% (range, 70.1%72.5%) at 1 year. However, postsepsis survival was strongly modified by age (Figure 1). For example, 1‐year survival was 94.1% (range, 91.2%96.0%) for <45 year olds and 54.4% (range, 51.5%57.2%) for 85 year olds (P<0.01). Survival was also modified by predicted mortality, however, not by ICU admission during index hospitalization (P=0.18) (see Supporting Appendix, Figure 1, in the online version of this article).
Hospital Readmission
Overall, 978 (17.9%) patients had early readmission after index discharge (Table 2); nearly half were readmitted at least once in the year following discharge. Rehospitalization frequency was slightly lower when including patients with incomplete presepsis data (see Supporting Appendix, Table 2, in the online version of this article). The frequency of hospital readmission varied based on patient age and severity of illness. For example, 22.3% of patients in the highest predicted mortality quartile had early readmission compared with 11.6% in the lowest. The median time from discharge to early readmission was 11 days. Principal diagnoses were available for 78.6% of all readmissions (see Supporting Appendix, Table 3, in the online version of this article). Between 28.3% and 42.7% of those readmissions were for infectious diagnoses (including sepsis).
| Predicted Mortality Quartile | |||||
|---|---|---|---|---|---|
| Readmission | Overall | 1 | 2 | 3 | 4 |
| Within 30 days | 978 (17.9) | 158 (11.6) | 242 (17.7) | 274 (20.0) | 304 (22.3) |
| Within 90 days | 1,643 (30.1) | 276 (20.2) | 421 (30.8) | 463 (33.9) | 483 (35.4) |
| Within 180 days | 2,061 (37.7) | 368 (26.9) | 540 (39.5) | 584 (42.7) | 569 (41.7) |
| Within 365 days | 2,618 (47.9) | 498 (36.4) | 712 (52.1) | 723 (52.9) | 685 (50.2) |
| Variable | Hazard Ratio for Early Readmission | Odds Ratio for High Utilization | ||
|---|---|---|---|---|
| HR (95% CI) | Relative Contribution | OR (95% CI) | Relative Contribution | |
| ||||
| Age category | 1.2% | 11.1% | ||
| <45 years | 1.00 [reference] | 1.00 [reference] | ||
| 4564 years | 0.86 (0.64‐1.16) | 2.22 (1.30‐3.83)a | ||
| 6584 years | 0.92 (0.69‐1.21) | 3.66 (2.17‐6.18)a | ||
| 85 years | 0.95 (0.70‐1.28) | 4.98 (2.92‐8.50)a | ||
| Male | 0.99 (0.88‐1.13) | 0.0% | 0.86 (0.74‐1.00) | 0.1% |
| Severity of illness (LAPS2) | 1.08 (1.04‐1.12)a | 12.4% | 1.22 (1.17‐1.27)a | 11.3% |
| Comorbid illness (COPS2) | 1.16 (1.12‐1.19)a | 73.9% | 1.13 (1.09‐1.17)a | 5.9% |
| Intensive care | 1.21 (1.05‐1.40)a | 5.2% | 1.02 (0.85‐1.21) | 0.0% |
| Hospital length of stay, day | 1.01 (1.001.02)b | 6.6% | 1.04 (1.03‐1.06)a | 6.9% |
| Prior utilization, per 10% | 0.98 (0.95‐1.02) | 0.7% | 1.74 (1.61‐1.88)a | 64.2% |
Healthcare Utilization
The unadjusted difference between pre‐ and postsepsis healthcare utilization among survivors was statistically significant for most categories but of modest clinical significance (see Supporting Appendix, Table 4, in the online version of this article). For example, the mean number of presepsis hospitalizations was 0.9 (1.4) compared to 1.0 (1.5) postsepsis (P<0.01). After adjusting for postsepsis living days, the difference in utilization was more pronounced (Figure 2). Overall, there was roughly a 3‐fold increase in the mean percentage of living days spent in facility‐based care between patients' pre‐ and postsepsis phases (5.3% vs 15.0%, P<0.01). Again, the difference was strongly modified by age. For patients aged <45 years, the difference was not statistically significant (2.4% vs 2.9%, P=0.32), whereas for those aged 65 years, it was highly significant (6.2% vs 18.5%, P<0.01).
Factors associated with early readmission included severity of illness, comorbid disease burden, index hospital length of stay, and intensive care (Table 3). However, the dominant factor explaining variation in the risk of early readmission was patients' prior comorbid disease burden (73.9%), followed by acute severity of illness (12.4%), total hospital length of stay (6.6%), and the need for intensive care (5.2%). Severity of illness and age were also significantly associated with higher odds of high postsepsis utilization; however, the dominant factor contributing to this risk was a history of high presepsis utilization (64.2%).
DISCUSSION
In this population‐based study in a community healthcare system, the impact of sepsis extended well beyond the initial hospitalization. One in 6 sepsis survivors was readmitted within 30 days, and roughly half were readmitted within 1 year. Fewer than half of rehospitalizations were for sepsis. Patients had a 3‐fold increase in the percentage of living days spent in hospitals or care facilities after sepsis hospitalization. Although age and acute severity of illness strongly modified healthcare utilization and mortality after sepsis, the dominant factors contributing to early readmission and high utilization ratescomorbid disease burden and presepsis healthcare utilizationwere present prior to hospitalization.
Sepsis is the single most expensive cause of US hospitalizations.[3, 4, 5] Despite its prevalence, there are little contemporary data identifying factors that impact healthcare utilization among sepsis survivors.[9, 16, 17, 19, 24, 36, 37] Recently, Prescott and others found that in Medicare beneficiaries, following severe sepsis, healthcare utilization was markedly increased.[17] More than one‐quarter of survivors were readmitted within 30 days, and 63.8% were readmitted within a year. Severe sepsis survivors also spent an average of 26% of their living days in a healthcare facility, a nearly 4‐fold increase compared to their presepsis phase. The current study included a population with a broader age and severity range; however, in a similar subgroup of patients, for those aged 65 years within the highest predicted mortality quartile, the frequency of readmission was similar. These findings are concordant with those from prior studies.[17, 19, 36, 37]
Among sepsis survivors, most readmissions were not for sepsis or infectious diagnoses, which is a novel finding with implications for designing approaches to reduce rehospitalization. The pattern in sepsis is similar to that seen in other common and costly hospital conditions.[17, 20, 23, 38, 39, 40] For example, between 18% and 25% of Medicare beneficiaries hospitalized for heart failure, acute myocardial infarction, or pneumonia were readmitted within 30 days; fewer than one‐third had the same diagnosis.[20] The timing of readmission in our sepsis cohort was also similar to that seen in other conditions.[20] For example, the median time of early readmission in this study was 11 days; it was between 10 and 12 days for patients with heart failure, pneumonia, and myocardial infarction.[20]
Krumholz and others suggest that the pattern of early rehospitalization after common acute conditions reflects a posthospital syndromean acquired, transient period of vulnerabilitythat could be the byproduct of common hospital factors.[20, 41] Such universal impairments might result from new physical and neurocognitive disability, nutritional deficiency, and sleep deprivation or delirium, among others.[41] If this construct were also true in sepsis, it could have important implications on the design of postsepsis care. However, prior studies suggest that sepsis patients may be particularly vulnerable to the sequelae of hospitalization.[2, 42, 43, 44, 45]
Among Medicare beneficiaries, Iwashyna and others reported that hospitalizations for severe sepsis resulted in significant increases in physical limitations and moderate to severe cognitive impairment.[1, 14, 46] Encephalopathy, sleep deprivation, and delirium are also frequently seen in sepsis patients.[47, 48] Furthermore, sepsis patients frequently need intensive care, which is also associated with increased patient disability and injury.[16, 46, 49, 50] We found that severity of illness and the need for intensive care were both predictive of the need for early readmission following sepsis. We also confirmed the results of prior studies suggesting that sepsis outcomes are strongly modified by age.[16, 19, 43, 51]
However, we found that the dominant factors contributing to patients' health trajectories were conditions present prior to admission. This finding is in accord with prior suggestions that acute severity of illness only partially predicts patients facing adverse posthospital sequelae.[23, 41, 52] Among sepsis patients, prior work demonstrates that inadequate consideration for presepsis level of function and utilization can result in an overestimation of the impact of sepsis on postdischarge health.[52, 53] Further, we found that the need for intensive care was not independently associated with an increased risk of high postsepsis utilization after adjusting for illness severity, a finding also seen in prior studies.[17, 23, 38, 51]
Taken together, our findings might suggest that an optimal approach to posthospital care in sepsis should focus on treatment approaches that address disease‐specific problems within the much larger context of common hospital risks. However, further study is necessary to clearly define the mechanisms by which age, severity of illness, and intensive care affect subsequent healthcare utilization. Furthermore, sepsis patients are a heterogeneous population in terms of severity of illness, site and pathogen of infection, and underlying comorbidity whose posthospital course remains incompletely characterized, limiting our ability to draw strong inferences.
These results should be interpreted in light of the study's limitations. First, our cohort included patients with healthcare insurance within a community‐based healthcare system. Care within the KPNC system, which bears similarities with accountable care organizations, is enhanced through service integration and a comprehensive health information system. Although prior studies suggest that these characteristics result in improved population‐based care, it is unclear whether there is a similar impact in hospital‐based conditions such as sepsis.[54, 55] Furthermore, care within an integrated system may impact posthospital utilization patterns and could limit generalizability. However, prior studies demonstrate the similarity of KPNC members to other patients in the same region in terms of age, socioeconomics, overall health behaviors, and racial/ethnic diversity.[56] Second, our study did not characterize organ dysfunction based on diagnosis coding, a common feature of sepsis studies that lack detailed physiologic severity data.[4, 5, 6, 8, 26] Instead, we focused on using granular laboratory and vital signs data to ensure accurate risk adjustment using a validated system developed in >400,000 hospitalizations.[30] Although this method may hamper comparisons with existing studies, traditional methods of grading severity by diagnosis codes can be vulnerable to biases resulting in wide variability.[10, 23, 26, 57, 58] Nonetheless, it is likely that characterizing preexisting and acute organ dysfunction will improve risk stratification in the heterogeneous sepsis population. Third, this study did not include data regarding patients' functional status, which has been shown to strongly predict patient outcomes following hospitalization. Fourth, this study did not address the cost of care following sepsis hospitalizations.[19, 59] Finally, our study excluded patients with incomplete utilization records, a choice designed to avoid the spurious inferences that can result from such comparisons.[53]
In summary, we found that sepsis exacted a considerable toll on patients in the hospital and in the year following discharge. Sepsis patients were frequently rehospitalized within a month of discharge, and on average had a 3‐fold increase in their subsequent time spent in healthcare facilities. Although age, severity of illness, and the need for ICU care impacted postsepsis utilization, the dominant contributing factorscomorbid disease burden or presepsis utilizationwere present prior to sepsis hospitalization. Early readmission patterns in sepsis appeared similar to those seen in other important hospital conditions, suggesting a role for shared posthospital, rather than just postsepsis, care approaches.
Disclosures
The funding for this study was provided by The Permanente Medical Group, Inc. and Kaiser Foundation Hospitals. The authors have no conflict of interests to disclose relevant to this article.
- . The lingering consequences of sepsis: a hidden public health disaster? JAMA. 2010;304(16):1833–1834.
- , , , et al.; Surviving Sepsis Campaign Guidelines Committee including the Pediatric Subgroup. Surviving sepsis campaign: international guidelines for management of severe sepsis and septic shock: 2012. Crit Care Med. 2013;41(2):580–637.
- , , . Costs for hospital stays in the United States, 2010. HCUP statistical brief #16. January 2013. Rockville, MD: Agency for Healthcare Research and Quality; 2013. Available at: http://www.hcup‐us.ahrq.gov/reports/statbriefs/sb146.pdf. Accessed October 1, 2013.
- , , , . The epidemiology of sepsis in the United States from 1979 through 2000. N Engl J Med. 2003;348(16):1546–1554.
- , , , , , . Epidemiology of severe sepsis in the United States: analysis of incidence, outcome, and associated costs of care. Crit Care Med. 2001;29(7):1303–1310.
- , , , . Rapid increase in hospitalization and mortality rates for severe sepsis in the United States: a trend analysis from 1993 to 2003. Crit Care Med. 2007;35(5):1244–1250.
- , , . Septicemia in U.S. hospitals, 2009. HCUP statistical brief #122. October 2011. Rockville, MD: Agency for Healthcare Research and Quality; 2011. Available at: http://www.hcup‐us.ahrq.gov/reports/statbriefs/sb122.pdf. Accessed October 1, 2013.
- , , , , , . Hospitalizations, costs, and outcomes of severe sepsis in the United States 2003 to 2007. Crit Care Med. 2012;40(3):754–761.
- , , , . Population burden of long‐term survivorship after severe sepsis in older Americans. J Am Geriatr Soc. 2012;60(6):1070–1077.
- , , , . Benchmarking the incidence and mortality of severe sepsis in the United States. Crit Care Med. 2013;41(5):1167–1174.
- , , , et al. Outcomes of the Surviving Sepsis Campaign in intensive care units in the USA and Europe: a prospective cohort study. Lancet Infect Dis. 2012;12(12):919–924.
- , , , . Reducing mortality in severe sepsis: the Surviving Sepsis Campaign. Clin Chest Med. 2008;29(4):721–733, x.
- , , , et al.; Early Goal‐Directed Therapy Collaborative Group. Early goal‐directed therapy in the treatment of severe sepsis and septic shock. N Engl J Med. 2001;345(19):1368–1377.
- , , , . Long‐term cognitive impairment and functional disability among survivors of severe sepsis. JAMA. 2010;304(16):1787–1794.
- , , , , , . Long‐term mortality and quality of life in sepsis: a systematic review. Crit Care Med. 2010;38(5):1276–1283.
- , , , et al.; the Scottish Critical Care Trials Group and the Scottish Intensive Care Society Audit Group. Mortality and quality of life in the five years after severe sepsis. Crit Care. 2013;17(2):R70.
- , , , , . Post‐Discharge Health Care Use Is Markedly Higher in Survivors of Severe Sepsis. Am J Respir Crit Care Med 2013;187:A1573.
- , , , . Long‐term survival and function after suspected gram‐negative sepsis. JAMA. 1995;274(4):338–345.
- , , , , . Long‐term mortality and medical care charges in patients with severe sepsis. Crit Care Med. 2003;31(9):2316–2323.
- , , , et al. Diagnoses and timing of 30‐day readmissions after hospitalization for heart failure, acute myocardial infarction, or pneumonia. JAMA. 2013;309(4):355–363.
- , , , , . A systematic review and meta‐analysis of studies comparing readmission rates and mortality rates in patients with heart failure. Arch Intern Med. 2004;164(21):2315–2320.
- , . Hospitalizations for heart failure in the United States—a sign of hope. JAMA. 2011;306(15):1705–1706.
- , , , et al. Risk prediction models for hospital readmission: a systematic review. JAMA. 2011;306(15):1688–1698.
- , . Sepsis after Scotland: enough with the averages, show us the effect modifiers. Crit Care. 2013;17(3):148.
- , , , et al. Kaiser Permanente's performance improvement system, part 3: multisite improvements in care for patients with sepsis. Jt Comm J Qual Patient Saf. 2011;37(11): 483–493.
- , , , et al. Identifying patients with severe sepsis using administrative claims: patient‐level validation of the Angus implementation of the International Consensus Conference Definition of Severe Sepsis [published online ahead of print September 18, 2012]. Med Care. doi: 10.1097/MLR.0b013e318268ac86. Epub ahead of print.
- . Linking automated databases for research in managed care settings. Ann Intern Med. 1997;127(8 pt 2):719–724.
- , , , , , . Risk‐adjusting hospital inpatient mortality using automated inpatient, outpatient, and laboratory databases. Med Care. 2008;46(3):232–239.
- , , , , . An electronic Simplified Acute Physiology Score‐based risk adjustment score for critical illness in an integrated healthcare system. Crit Care Med. 2013;41(1):41–48.
- , , , , . Risk‐adjusting hospital mortality using a comprehensive electronic record in an integrated health care delivery system. Med Care. 2013;51(5):446–453.
- , , , , , . Early detection of impending physiologic deterioration among patients who are not in intensive care: development of predictive models using data from an automated electronic medical record. J Hosp Med. 2012;7(5):388–395.
- , , , . The Kaiser Permanente inpatient risk adjustment methodology was valid in an external patient population. J Clin Epidemiol. 2009;63(7):798–803.
- , , , , , . Casemix adjustment of managed care claims data using the clinical classification for health policy research method. Med Care. 1998;36(7):1108–1113.
- Agency for Healthcare Research and Quality Healthcare Cost and Utilization Project. Clinical Classifications Software (CCS) for ICD‐9‐CM Fact Sheet. Available at: http://www.hcup‐us.ahrq.gov/toolssoftware/ccs/ccsfactsheet.jsp. Accessed January 20, 2013.
- , . A proportional hazards model for the subdistribution of a competing risk. J Am Stat Assoc. 1997;94(446):496–509.
- , , . Severe sepsis in managed care: analysis of incidence, one‐year mortality, and associated costs of care. J Manag Care Pharm. 2004;10(6):521–530.
- , , , , , . Detailed cost analysis of care for survivors of severe sepsis. Crit Care Med. 2004;32(4):981–985.
- , , , , et al. Readmissions among patients with severe sepsis/septic shock among inner‐city minority New Yorkers. Chest. 2012;142:286A.
- , , . Readmission and late mortality after pediatric severe sepsis. Pediatrics. 2009;123(3):849–857.
- , , . Rehospitalizations among patients in the Medicare fee‐for‐service program. N Engl J Med. 2009;360(14):1418–1428.
- . Post‐hospital syndrome—an acquired, transient condition of generalized risk. N Engl J Med. 2013;368(2):100–102.
- , , , et al. Definitions for sepsis and organ failure and guidelines for the use of innovative therapies in sepsis. The ACCP/SCCM Consensus Conference Committee. American College of Chest Physicians/Society of Critical Care Medicine. Chest. 1992;101(6):1644–1655.
- , , . The effect of age on the development and outcome of adult sepsis. Crit Care Med. 2006;34(1):15–21.
- , . Multiple systems organ failure: failure of host defense homeostasis. Crit Care Clin. 1989;5(2):199–220.
- . Pathophysiology of sepsis. Am J Pathol. 2007;170(5):1435–1444.
- , . Surviving intensive care: a report from the 2002 Brussels Roundtable. Intensive Care Med. 2003;29(3):368–377.
- , , . The encephalopathy in sepsis. Crit Care Clin. 2008;24(1):67–82, viii.
- , . Sepsis‐associated encephalopathy. Nat Rev Neurol. 2012;8(10):557–566.
- , , , et al. Improving long‐term outcomes after discharge from intensive care unit: report from a stakeholders' conference. Crit Care Med. 2012;40(2):502–509.
- , , , , . The association between sepsis and potential medical injury among hospitalized patients. Chest. 2012;142(3):606–613.
- , , , , , . Three‐year outcomes for Medicare beneficiaries who survive intensive care. JAMA. 2010;303(9):849–856.
- , , , , , . Does acute organ dysfunction predict patient‐centered outcomes? Chest. 2002;121(6):1963–1971.
- , , , . Spurious inferences about long‐term outcomes: the case of severe sepsis and geriatric conditions. Am J Respir Crit Care Med. 2012;185(8):835–841.
- , , , , , . Population trends in the incidence and outcomes of acute myocardial infarction. N Engl J Med. 2010;362(23):2155–2165.
- , , , et al., Outpatient electronic health records and the clinical care and outcomes of patients with diabetes mellitus. Ann Intern Med. 2012;157(7):482–489.
- . Similarity of the adult Kaiser Permanente membership in Northern California to the insured and general population in Northern California: statistics from the 2009 California Health Interview Survey. Internal Division of Research Report. Oakland, CA: Kaiser Permanente Division of Research; January 24, 2012. Available at: http://www.dor.kaiser.org/external/chis_non_kp_2009. Accessed January 20, 2013.
- , , , , . Association of diagnostic coding with trends in hospitalizations and mortality of patients with pneumonia, 2003–2009. JAMA. 2012;307(13):1405–1413.
- , . Finding pure and simple truths with administrative data. JAMA. 2012;307(13):1433–1435.
- , , , . Cost savings attributable to reductions in intensive care unit length of stay for mechanically ventilated patients. Med Care. 2008;46(12):1226–1233.
© 2014 Society of Hospital Medicine
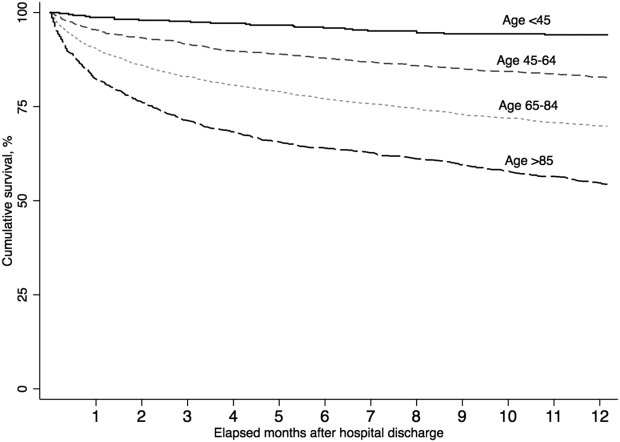
Risk Factors For Unplanned ICU Transfer
Emergency Department (ED) patients who are hospitalized and require unplanned transfer to the intensive care unit (ICU) within 24 hours of arrival on the ward have higher mortality than direct ICU admissions.1, 2 Previous research found that 5% of ED admissions experienced unplanned ICU transfer during their hospitalization, yet these patients account for 25% of in‐hospital deaths and have a longer length of stay than direct ICU admissions.1, 3 For these reasons, inpatient rapid‐response teams and early warning systems have been studied to reduce the mortality of patients who rapidly deteriorate on the hospital ward.410 However, there is little conclusive evidence that these interventions decrease mortality.710 It is possible that with better recognition and intervention in the ED, a portion of these unplanned ICU transfers and their subsequent adverse outcomes could be prevented.11
Previous research on risk factors for unplanned ICU transfers among ED admissions is limited. While 2 previous studies from non‐US hospitals used administrative data to identify some general populations at risk for unplanned ICU transfer,12, 13 these studies did not differentiate between transfers shortly after admission and those that occurred during a prolonged hospital staya critical distinction since the outcomes between these groups differs substantially.1 Another limitation of these studies is the absence of physiologic measures at ED presentation, which have been shown to be highly predictive of mortality.14
In this study, we describe risk factors for unplanned transfer to the ICU within 24 hours of arrival on the ward, among a large cohort of ED hospitalizations across 13 community hospitals. Focusing on admitting diagnoses most at risk, our goal was to inform efforts to improve the triage of ED admissions and determine which patients may benefit from additional interventions, such as improved resuscitation, closer monitoring, or risk stratification tools. We also hypothesized that higher volume hospitals would have lower rates of unplanned ICU transfers, as these hospitals are more likely have more patient care resources on the hospital ward and a higher threshold to transfer to the ICU.
METHODS
Setting and Patients
The setting for this study was Kaiser Permanente Northern California (KPNC), a large integrated healthcare delivery system serving approximately 3.3 million members.1, 3, 15, 16 We extracted data on all adult ED admissions (18 years old) to the hospital between 2007 and 2009. We excluded patients who went directly to the operating room or the ICU, as well as gynecological/pregnancy‐related admissions, as these patients have substantially different mortality risks.14 ED admissions to hospital wards could either go to medicalsurgical units or transitional care units (TCU), an intermediate level of care between the medicalsurgical units and the ICU. We chose to focus on hospitals with similar inpatient structures. Thus, 8 hospitals without TCUs were excluded, leaving 13 hospitals for analysis. The KPNC Institutional Review Board approved this study.
Main Outcome Measure
The main outcome measure was unplanned transfer to the ICU within 24 hours of arrival to the hospital ward, based upon bed history data. As in previous research, we make the assumptionwhich is supported by the high observed‐to‐expected mortality ratios found in these patientsthat these transfers to the ICU were due to clinical deterioration, and thus were unplanned, rather than a planned transfer to the ICU as is more common after an elective surgical procedure.13 The comparison population was patients admitted from the ED to the ward who never experienced a transfer to the ICU.
Patient and Hospital Characteristics
We extracted patient data on age, sex, admitting diagnosis, chronic illness burden, acute physiologic derangement in the ED, and hospital unit length of stay. Chronic illness was measured using the Comorbidity Point Score (COPS), and physiologic derangement was measured using the Laboratory Acute Physiology Score (LAPS) calculated from labs collected in the ED.1, 14, 17 The derivation of these variables from the electronic medical record has been previously described.14 The COPS was derived from International Classification of Diseases, Ninth Revision (ICD‐9) codes for all Kaiser Permanente Medical Care Program (KPMCP) inpatient and outpatient encounters prior to hospitalization. The LAPS is based on 14 possible lab tests that could be drawn in the ED or in the 72 hours prior to hospitalization. The admitting diagnosis is the ICD‐9 code assigned for the primary diagnosis determined by the admitting physician at the time when hospital admission orders are entered. We further collapsed a previously used categorization of 44 primary condition diagnoses, based on admission ICD‐9 codes,14 into 25 broad diagnostic categories based on pathophysiologic plausibility and mortality rates. We tabulated inpatient admissions originating in the ED to derive a hospital volume measure.
Statistical Analyses
We compared patient characteristics, hospital volume, and outcomes by whether or not an unplanned ICU transfer occurred. Unadjusted analyses were performed with analysis of variance (ANOVA) and chi‐square tests. We calculated crude rates of unplanned ICU transfer per 1,000 ED inpatient admissions by patient characteristics and by hospital, stratified by hospital volume.
We used a hierarchical multivariate logistic regression model to estimate adjusted odds ratios for unplanned ICU transfer as a function of both patient‐level variables (age, sex, COPS, LAPS, time of admission, admission to TCU vs ward, admitting diagnosis) and hospital‐level variables (volume) in the model. We planned to choose the reference group for admitting diagnosis as the one with an unadjusted odds ratio closest to the null (1.00). This model addresses correlations between patients with multiple hospitalizations and clustering by hospital, by fitting random intercepts for these clusters. All analyses were performed in Stata 12 (StataCorp, College Station, TX), and statistics are presented with 95% confidence intervals (CI). The Stata program gllamm (Generalized Linear Latent and Mixed Models) was used for hierarchical modeling.18
RESULTS
Of 178,315 ED non‐ICU hospitalizations meeting inclusion criteria, 4,252 (2.4%) were admitted to the ward and were transferred to the ICU within 24 hours of leaving the ED. There were 122,251 unique patients in our study population. Table 1 compares the characteristics of ED hospitalizations in which an unplanned transfer occurred to those that did not experience an unplanned transfer. Unplanned transfers were more likely to have a higher comorbidity burden, more deranged physiology, and more likely to arrive on the floor during the overnight shift.
| Characteristics | Unplanned Transfer to ICU Within 24 h of Leaving ED? | P Value* | |
|---|---|---|---|
| Yes | No | ||
| N = 4,252 (2.4%) | N = 174,063 (97.6%) | ||
| |||
| Age, median (IQR) | 69 (5680) | 70 (5681) | <0.01 |
| Male, % | 51.3 | 45.9 | <0.01 |
| Comorbidity Points Score (COPS), median (IQR) | 100 (46158) | 89 (42144) | <0.01 |
| Laboratory Acute Physiology Score (LAPS), median (IQR) | 26 (1342) | 18 (633) | <0.01 |
| Nursing shift on arrival to floor, % | |||
| Day: 7 am3 pm (Reference) | 20.1 | 20.1 | NS |
| Evening: 3 pm11 pm | 47.6 | 50.2 | NS |
| Overnight: 11 pm7 am | 32.3 | 29.7 | <0.01 |
| Weekend admission, % | 33.7 | 32.7 | NS |
| Admitted to monitored bed, % | 24.1 | 24.9 | NS |
| Emergency department annual volume, mean (SD) | 48,755 (15,379) | 50,570 (15,276) | <0.01 |
| Non‐ICU annual admission volume, mean (SD) | 5,562 (1,626) | 5,774 (1,568) | <0.01 |
| Admitting diagnosis, listed by descending frequency, % | NS | ||
| Pneumonia and respiratory infections | 16.3 | 11.8 | <0.01 |
| Gastrointestinal bleeding | 12.8 | 13.6 | NS |
| Chest pain | 7.3 | 10.0 | <0.01 |
| Miscellaneous conditions | 5.6 | 6.2 | NS |
| All other acute infections | 4.7 | 6.0 | <0.01 |
| Seizures | 4.1 | 5.9 | <0.01 |
| AMI | 3.9 | 3.3 | <0.05 |
| COPD | 3.8 | 3.0 | <0.01 |
| CHF | 3.5 | 3.7 | NS |
| Arrhythmias and pulmonary embolism | 3.5 | 3.3 | NS |
| Stroke | 3.4 | 3.5 | NS |
| Diabetic emergencies | 3.3 | 2.6 | <0.01 |
| Metabolic, endocrine, electrolytes | 3.0 | 2.9 | NS |
| Sepsis | 3.0 | 1.2 | <0.01 |
| Other neurology and toxicology | 3.0 | 2.9 | NS |
| Urinary tract infections | 2.9 | 3.2 | NS |
| Catastrophic conditions | 2.6 | 1.2 | <0.01 |
| Rheumatology | 2.5 | 3.5 | <0.01 |
| Hematology and oncology | 2.4 | 2.4 | NS |
| Acute renal failure | 1.9 | 1.1 | <0.01 |
| Pancreatic and liver | 1.7 | 2.0 | NS |
| Trauma, fractures, and dislocations | 1.6 | 1.8 | NS |
| Bowel obstructions and diseases | 1.6 | 2.9 | <0.01 |
| Other cardiac conditions | 1.5 | 1.3 | NS |
| Other renal conditions | 0.6 | 1.0 | <0.01 |
| Inpatient length of stay, median days (IQR) | 4.7 (2.78.6) | 2.6 (1.54.4) | <0.01 |
| Died during hospitalization, % | 12.7 | 2.4 | <0.01 |
Unplanned ICU transfers were more frequent in lower volume hospitals (Table 1). Figure 1 displays the inverse relationship between hospital annual ED inpatient admission volume and unplanned ICU transfers rates. The lowest volume hospital had a crude rate twice as high as the 2 highest volume hospitals (39 vs 20, per 1,000 admissions).
Pneumonia/respiratory infection was the most frequent admitting condition associated with unplanned transfer (16.3%) (Table 1). There was also wide variation in crude rates for unplanned ICU transfer by admitting condition (Figure 2). Patients admitted with sepsis had the highest rate (59 per 1,000 admissions), while patients admitted with renal conditions other than acute renal failure had the lowest rates (14.3 per 1,000 admissions).
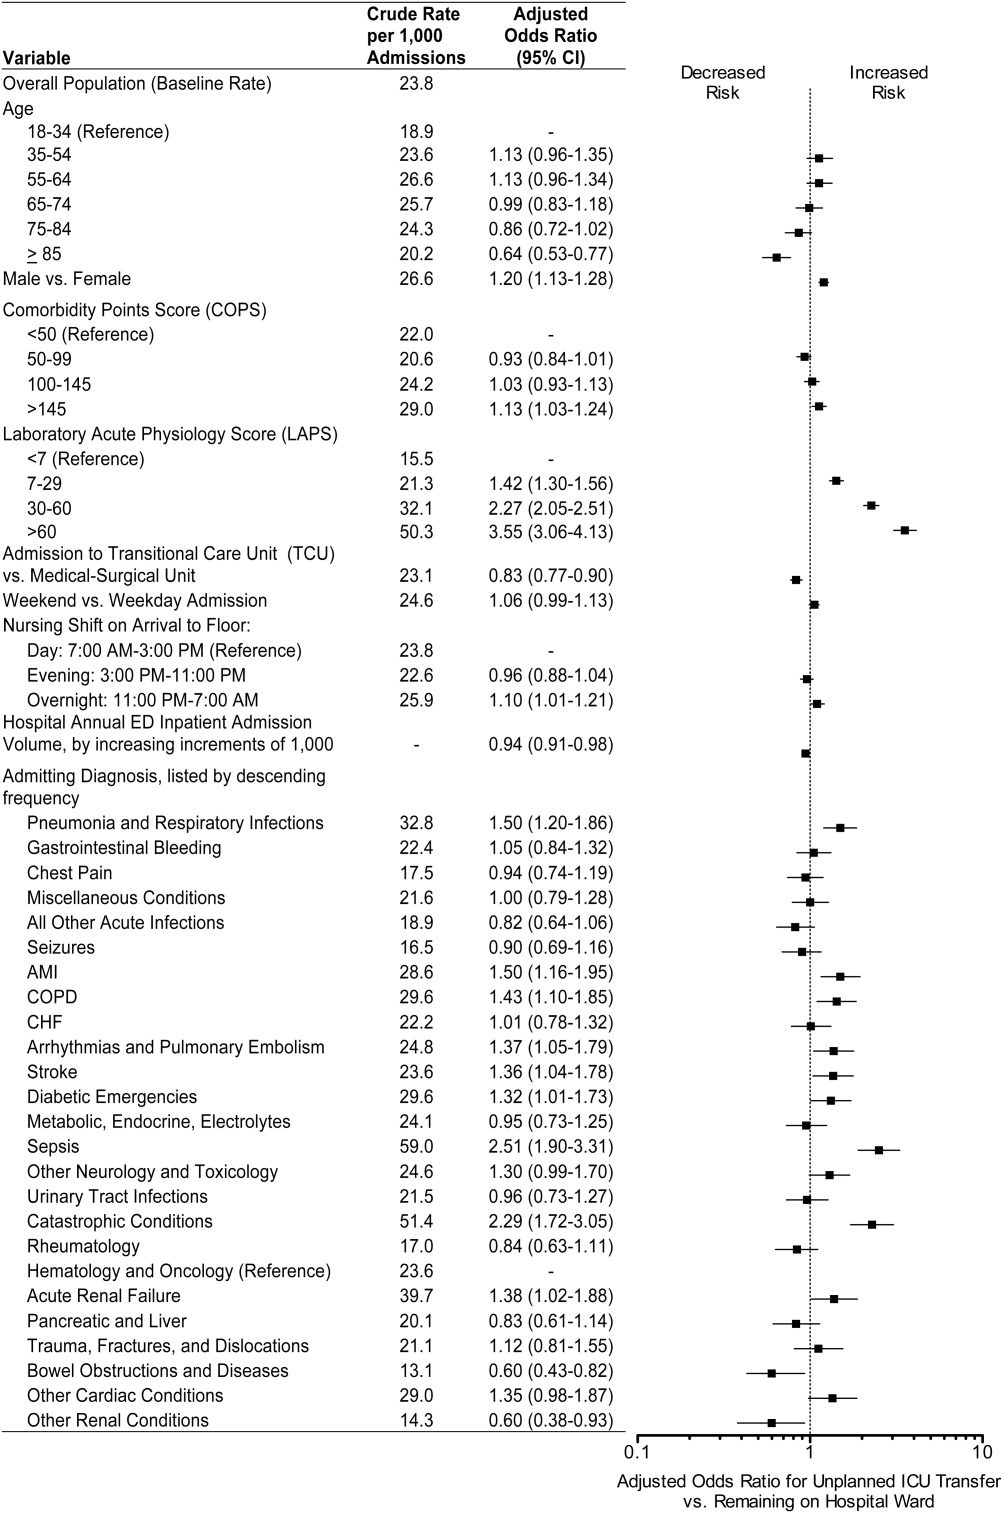
We confirmed that almost all diagnoses found to account for a disproportionately high share of unplanned ICU transfers in Table 1 were indeed independently associated with this phenomenon after adjustment for patient and hospital differences (Figure 2). Pneumonia remained the most frequent condition associated with unplanned ICU transfer (odds ratio [OR] 1.50; 95% CI 1.201.86). Although less frequent, sepsis had the strongest association of any condition with unplanned transfer (OR 2.51; 95% CI 1.903.31). However, metabolic, endocrine, and electrolyte conditions were no longer associated with unplanned transfer after adjustment, while arrhythmias and pulmonary embolism were. Other conditions confirmed to be associated with increased risk of unplanned transfer included: myocardial infarction (MI), chronic obstructive pulmonary disease (COPD), stroke, diabetic emergencies, catastrophic conditions (includes aortic catastrophes, all forms of shock except septic shock, and intracranial hemorrhage), and acute renal failure. After taking into account the frequency of admitting diagnoses, respiratory conditions (COPD, pneumonia/acute respiratory infection) comprised nearly half (47%) of all conditions associated with increased risk of unplanned ICU transfer.
Other factors confirmed to be independently associated with unplanned ICU transfer included: male sex (OR 1.20; 95% CI 1.131.28), high comorbidity burden as measured by COPS >145 (OR 1.13; 95% CI 1.031.24), increasingly abnormal physiology compared to a LAPS <7, and arrival on ward during the overnight shift (OR 1.10; 95% CI 1.011.21). After adjustment, we did find that admission to the TCU rather than a medicalsurgical unit was associated with decreased risk of unplanned ICU transfer (OR 0.83; 95% CI 0.770.90). Age 85 was associated with decreased risk of unplanned ICU transfer relative to the youngest age group of 1834‐year‐old patients (OR 0.64; 95% CI 0.530.77).
ED admissions to higher volume hospitals were 6% less likely to experience an unplanned transfer for each additional 1,000 annual ED hospitalizations over a lower volume hospital (OR 0.94; 95% CI 0.910.98). In other words, a patient admitted to a hospital with 8,000 annual ED hospitalizations had 30% decreased odds of unplanned ICU transfer compared to a hospital with only 3,000 annual ED hospitalizations.
DISCUSSION
Patients admitted with respiratory conditions accounted for half of all admitting diagnoses associated with increased risk of unplanned transfer to the ICU within 24 hours of arrival to the ward. We found that 1 in 30 ED ward admissions for pneumonia, and 1 in 33 for COPD, were transferred to the ICU within 24 hours. These findings indicate that there is some room for improvement in early care of respiratory conditions, given the average unplanned transfer rate of 1 in 42, and previous research showing that patients with pneumonia and patients with COPD, who experience unplanned ICU transfer, have substantially worse mortality than those directly admitted to the ICU.1
Although less frequent than hospitalizations for respiratory conditions, patients admitted with sepsis were at the highest risk of unplanned ICU transfer (1 in 17 ED non‐ICU hospitalizations). We also found that MI and stroke ward admissions had a higher risk of unplanned ICU transfer. However, we previously found that unplanned ICU transfers for sepsis, MI, and stroke did not have worse mortality than direct ICU admits for these conditions.1 Therefore, quality improvement efforts to reduce excess mortality related to early decompensation in the hospital and unplanned ICU transfer would be most effective if targeted towards respiratory conditions such as pneumonia and COPD.
This is the only in‐depth study, to our knowledge, to explore the association between a set of mutually exclusive diagnostic categories and risk of unplanned ICU transfer within 24 hours, and it is the first study to identify risk factors for unplanned ICU transfer in a multi‐hospital cohort adjusted for patient‐ and hospital‐level characteristics. We also identified a novel hospital volumeoutcome relationship: Unplanned ICU transfers are up to twice as likely to occur in the smallest volume hospitals compared with highest volume hospitals. Hospital volume has long been proposed as a proxy for hospital resources; there are several studies showing a relationship between low‐volume hospitals and worse outcomes for a number of conditions.19, 20 Possible mechanisms may include decreased ICU capacity, decreased on‐call intensivists in the hospital after hours, and less experience with certain critical care conditions seen more frequently in high‐volume hospitals.21
Patients at risk of unplanned ICU transfer were also more likely to have physiologic derangement identified on laboratory testing, high comorbidity burden, and arrive on the ward between 11 PM and 7 AM. Given the strong correlation between comorbidity burden and physiologic derangement and mortality,14 it is not surprising that the COPS and LAPS were independent predictors of unplanned transfer. It is unclear, however, why arriving on the ward on the overnight shift is associated with higher risk. One possibility is that patients who arrive on the wards during 11 PM to 7 AM are also likely to have been in the ED during evening peak hours most associated with ED crowding.22 High levels of ED crowding have been associated with delays in care, worse quality care, lapses in patient safety, and even increased in‐hospital mortality.22, 23 Other possible reasons include decreased in‐hospital staffing and longer delays in critical diagnostic tests and interventions.2428
Admission to TCUs was associated with decreased risk of unplanned ICU transfer in the first 24 hours of hospitalization. This may be due to the continuous monitoring, decreased nursing‐to‐patient ratios, or the availability to provide some critical care interventions. In our study, age 85 was associated with lower likelihood of unplanned transfer. Unfortunately, we did not have access to data on advanced directives or patient preferences. Data on advanced directives would help to distinguish whether this phenomenon was related to end‐of‐life care goals versus other explanations.
Our study confirms some risk factors identified in previous studies. These include specific diagnoses such as pneumonia and COPD,12, 13, 29 heavy comorbidity burden,12, 13, 29 abnormal labs,29 and male sex.13 Pneumonia has consistently been shown to be a risk factor for unplanned ICU transfer. This may stem from the dynamic nature of this condition and its ability to rapidly progress, and the fact that some ICUs may not accept pneumonia patients unless they demonstrate a need for mechanical ventilation.30 Recently, a prediction rule has been developed to determine which patients with pneumonia are likely to have an unplanned ICU transfer.30 It is possible that with validation and application of this rule, unplanned transfer rates for pneumonia could be reduced. It is unclear whether males have unmeasured factors associated with increased risk of unplanned transfer or whether a true gender disparity exists.
Our findings should be interpreted within the context of this study's limitations. First, this study was not designed to distinguish the underlying cause of the unplanned transfer such as under‐recognition of illness severity in the ED, evolving clinical disease after leaving the ED, or delays in critical interventions on the ward. These are a focus of our ongoing research efforts. Second, while previous studies have demonstrated that our automated risk adjustment variables can accurately predict in‐hospital mortality (0.88 area under curve in external populations),17 additional data on vital signs and mental status could further improve risk adjustment. However, using automated data allowed us to study risk factors for unplanned transfer in a multi‐hospital cohort with a much larger population than has been previously studied. Serial data on vital signs and mental status both in the ED and during hospitalization could also be helpful in determining which unplanned transfers could be prevented with earlier recognition and intervention. Finally, all patient care occurred within an integrated healthcare delivery system. Thus, differences in case‐mix, hospital resources, ICU structure, and geographic location should be considered when applying our results to other healthcare systems.
This study raises several new areas for future research. With access to richer data becoming available in electronic medical records, prediction rules should be developed to enable better triage to appropriate levels of care for ED admissions. Future research should also analyze the comparative effectiveness of intermediate monitored units versus non‐monitored wards for preventing clinical deterioration by admitting diagnosis. Diagnoses that have been shown to have an increased risk of death after unplanned ICU transfer, such as pneumonia/respiratory infection and COPD,1 should be prioritized in this research. Better understanding is needed on the diagnosis‐specific differences and the differences in ED triage process and ICU structure that may explain why high‐volume hospitals have significantly lower rates of early unplanned ICU transfers compared with low‐volume hospitals. In particular, determining the effect of TCU and ICU capacities and census at the time of admission, and comparing patient risk characteristics across hospital‐volume strata would be very useful. Finally, more work is needed to determine whether the higher rate of unplanned transfers during overnight nursing shifts is related to decreased resource availability, preceding ED crowding, or other organizational causes.
In conclusion, patients admitted with respiratory conditions, sepsis, MI, high comorbidity, and abnormal labs are at modestly increased risk of unplanned ICU transfer within 24 hours of admission from the ED. Patients admitted with respiratory conditions (pneumonia/respiratory infections and COPD) accounted for half of the admitting diagnoses that are at increased risk for unplanned ICU transfer. These patients may benefit from better inpatient triage from the ED, earlier intervention, or closer monitoring. More research is needed to determine the specific aspects of care associated with admission to intermediate care units and high‐volume hospitals that reduce the risk of unplanned ICU transfer.
Acknowledgements
The authors thank John D. Greene, Juan Carlos La Guardia, and Benjamin Turk for their assistance with formatting of the dataset; Dr Alan S. Go, Acting Director of the Division of Research, for reviewing the manuscript; and Alina Schnake‐Mahl for formatting the manuscript.
- , , , et al. Adverse outcomes associated with delayed intensive care unit transfers in an integrated healthcare system. J Hosp Med. 2011;7(3):224–230.
- , , , et al. Inpatient transfers to the intensive care unit. J Gen Intern Med. 2003;18(2):77–83.
- , , , et al. Intra‐hospital transfers to a higher level of care: contribution to total hospital and intensive care unit (ICU) mortality and length of stay (LOS). J Hosp Med. 2011;6:74–80.
- , , , et al. Hospital‐wide code rates and mortality before and after implementation of a rapid response team. JAMA. 2008;300(21):2506–2513.
- , , , et al. Effect of a rapid response team on hospital‐wide mortality and code rates outside the ICU in a children's hospital. JAMA. 2007;298(19):2267–2274.
- , , , et al. Introduction of the medical emergency team (MET) system: a cluster‐randomised controlled trial. Lancet. 2005;365(9477):2091–2097.
- , , , et al. Rapid response systems: A systematic review. Crit Care Med. 2007;35(5):1238–1243.
- , , , et al. Effects of rapid response systems on clinical outcomes: systematic review and meta‐analysis. J Hosp Med. 2007;2(6):422–432.
- , , , et al. Rapid response teams: a systematic review and meta‐analysis. Arch Intern Med. 2010;170(1):18–26.
- , , , et al. Outreach and early warning systems (EWS) for the prevention of intensive care admission and death of critically ill adult patients on general hospital wards. Cochrane Database Syst Rev. 2007;3:CD005529.
- , , , et al. Unplanned transfers to a medical intensive care unit: Causes and relationship to preventable errors in care. J Hosp Med. 2011;6:68–72.
- , , , et al. Using administrative data to develop a nomogram for individualising risk of unplanned admission to intensive care. Resuscitation. 2008;79(2):241–248.
- , , , et al. Unplanned admission to intensive care after emergency hospitalisation: risk factors and development of a nomogram for individualising risk. Resuscitation. 2009;80(2):224–230.
- , , , et al. Risk‐adjusting hospital inpatient mortality using automated inpatient, outpatient, and laboratory databases. Med Care. 2008;46(3):232–239.
- . Linking automated databases for research in managed care settings. Ann Intern Med. 1997;127(8 pt 2):719–724.
- , , , et al. Risk adjusting community‐acquired pneumonia hospital outcomes using automated databases. Am J Manag Care. 2008;14(3):158–166.
- , , , et al. The Kaiser Permanente inpatient risk adjustment methodology was valid in an external patient population. J Clin Epidemiol. 2011;63(7):798–803.
- , , . Maximum likelihood estimation of limited and discrete dependent variable models with nested random effects. J Econometrics. 2005;128(2):301–323.
- . The relation between volume and outcome in health care. N Engl J Med. 1999;340(21):1677–1679.
- , , . Is volume related to outcome in health care? A systematic review and methodologic critique of the literature. Ann Intern Med. 2002;137(6):511–520.
- , , . Working with capacity limitations: operations management in critical care. Crit Care. 2011;15(4):308.
- , . Systematic review of emergency department crowding: causes, effects, and solutions. Ann Intern Med. 2008;52(2):126–136.
- , , , et al. The effect of emergency department crowding on clinically oriented outcomes. Acad Emerg Med. 2009;16(1):1–10.
- , , , et al. Association between time of admission to the ICU and mortality. Chest. 2010;138(1):68–75.
- , , , et al. Off‐hour admission and in‐hospital stroke case fatality in the get with the guidelines‐stroke program. Stroke. 2009;40(2):569–576.
- , , , et al. Relationship between time of day, day of week, timeliness of reperfusion, and in‐hospital mortality for patients with acute ST‐segment elevation myocardial infarction. JAMA. 2005;294(7):803–812.
- , , , et al. Hospital mortality among adults admitted to and discharged from intensive care on weekends and evenings. J Crit Care. 2008;23(3):317–324.
- , , , et al. Association between ICU admission during morning rounds and mortality. Chest. 2009;136(6):1489–1495.
- , , , et al. Identifying infected emergency department patients admitted to the hospital ward at risk of clinical deterioration and intensive care unit transfer. Acad Emerg Med. 2010;17(10):1080–1085.
- , , , et al. Risk stratification of early admission to the intensive care unit of patients with no major criteria of severe community‐acquired pneumonia: development of an international prediction rule. Crit Care. 2009;13(2):R54.
Emergency Department (ED) patients who are hospitalized and require unplanned transfer to the intensive care unit (ICU) within 24 hours of arrival on the ward have higher mortality than direct ICU admissions.1, 2 Previous research found that 5% of ED admissions experienced unplanned ICU transfer during their hospitalization, yet these patients account for 25% of in‐hospital deaths and have a longer length of stay than direct ICU admissions.1, 3 For these reasons, inpatient rapid‐response teams and early warning systems have been studied to reduce the mortality of patients who rapidly deteriorate on the hospital ward.410 However, there is little conclusive evidence that these interventions decrease mortality.710 It is possible that with better recognition and intervention in the ED, a portion of these unplanned ICU transfers and their subsequent adverse outcomes could be prevented.11
Previous research on risk factors for unplanned ICU transfers among ED admissions is limited. While 2 previous studies from non‐US hospitals used administrative data to identify some general populations at risk for unplanned ICU transfer,12, 13 these studies did not differentiate between transfers shortly after admission and those that occurred during a prolonged hospital staya critical distinction since the outcomes between these groups differs substantially.1 Another limitation of these studies is the absence of physiologic measures at ED presentation, which have been shown to be highly predictive of mortality.14
In this study, we describe risk factors for unplanned transfer to the ICU within 24 hours of arrival on the ward, among a large cohort of ED hospitalizations across 13 community hospitals. Focusing on admitting diagnoses most at risk, our goal was to inform efforts to improve the triage of ED admissions and determine which patients may benefit from additional interventions, such as improved resuscitation, closer monitoring, or risk stratification tools. We also hypothesized that higher volume hospitals would have lower rates of unplanned ICU transfers, as these hospitals are more likely have more patient care resources on the hospital ward and a higher threshold to transfer to the ICU.
METHODS
Setting and Patients
The setting for this study was Kaiser Permanente Northern California (KPNC), a large integrated healthcare delivery system serving approximately 3.3 million members.1, 3, 15, 16 We extracted data on all adult ED admissions (18 years old) to the hospital between 2007 and 2009. We excluded patients who went directly to the operating room or the ICU, as well as gynecological/pregnancy‐related admissions, as these patients have substantially different mortality risks.14 ED admissions to hospital wards could either go to medicalsurgical units or transitional care units (TCU), an intermediate level of care between the medicalsurgical units and the ICU. We chose to focus on hospitals with similar inpatient structures. Thus, 8 hospitals without TCUs were excluded, leaving 13 hospitals for analysis. The KPNC Institutional Review Board approved this study.
Main Outcome Measure
The main outcome measure was unplanned transfer to the ICU within 24 hours of arrival to the hospital ward, based upon bed history data. As in previous research, we make the assumptionwhich is supported by the high observed‐to‐expected mortality ratios found in these patientsthat these transfers to the ICU were due to clinical deterioration, and thus were unplanned, rather than a planned transfer to the ICU as is more common after an elective surgical procedure.13 The comparison population was patients admitted from the ED to the ward who never experienced a transfer to the ICU.
Patient and Hospital Characteristics
We extracted patient data on age, sex, admitting diagnosis, chronic illness burden, acute physiologic derangement in the ED, and hospital unit length of stay. Chronic illness was measured using the Comorbidity Point Score (COPS), and physiologic derangement was measured using the Laboratory Acute Physiology Score (LAPS) calculated from labs collected in the ED.1, 14, 17 The derivation of these variables from the electronic medical record has been previously described.14 The COPS was derived from International Classification of Diseases, Ninth Revision (ICD‐9) codes for all Kaiser Permanente Medical Care Program (KPMCP) inpatient and outpatient encounters prior to hospitalization. The LAPS is based on 14 possible lab tests that could be drawn in the ED or in the 72 hours prior to hospitalization. The admitting diagnosis is the ICD‐9 code assigned for the primary diagnosis determined by the admitting physician at the time when hospital admission orders are entered. We further collapsed a previously used categorization of 44 primary condition diagnoses, based on admission ICD‐9 codes,14 into 25 broad diagnostic categories based on pathophysiologic plausibility and mortality rates. We tabulated inpatient admissions originating in the ED to derive a hospital volume measure.
Statistical Analyses
We compared patient characteristics, hospital volume, and outcomes by whether or not an unplanned ICU transfer occurred. Unadjusted analyses were performed with analysis of variance (ANOVA) and chi‐square tests. We calculated crude rates of unplanned ICU transfer per 1,000 ED inpatient admissions by patient characteristics and by hospital, stratified by hospital volume.
We used a hierarchical multivariate logistic regression model to estimate adjusted odds ratios for unplanned ICU transfer as a function of both patient‐level variables (age, sex, COPS, LAPS, time of admission, admission to TCU vs ward, admitting diagnosis) and hospital‐level variables (volume) in the model. We planned to choose the reference group for admitting diagnosis as the one with an unadjusted odds ratio closest to the null (1.00). This model addresses correlations between patients with multiple hospitalizations and clustering by hospital, by fitting random intercepts for these clusters. All analyses were performed in Stata 12 (StataCorp, College Station, TX), and statistics are presented with 95% confidence intervals (CI). The Stata program gllamm (Generalized Linear Latent and Mixed Models) was used for hierarchical modeling.18
RESULTS
Of 178,315 ED non‐ICU hospitalizations meeting inclusion criteria, 4,252 (2.4%) were admitted to the ward and were transferred to the ICU within 24 hours of leaving the ED. There were 122,251 unique patients in our study population. Table 1 compares the characteristics of ED hospitalizations in which an unplanned transfer occurred to those that did not experience an unplanned transfer. Unplanned transfers were more likely to have a higher comorbidity burden, more deranged physiology, and more likely to arrive on the floor during the overnight shift.
| Characteristics | Unplanned Transfer to ICU Within 24 h of Leaving ED? | P Value* | |
|---|---|---|---|
| Yes | No | ||
| N = 4,252 (2.4%) | N = 174,063 (97.6%) | ||
| |||
| Age, median (IQR) | 69 (5680) | 70 (5681) | <0.01 |
| Male, % | 51.3 | 45.9 | <0.01 |
| Comorbidity Points Score (COPS), median (IQR) | 100 (46158) | 89 (42144) | <0.01 |
| Laboratory Acute Physiology Score (LAPS), median (IQR) | 26 (1342) | 18 (633) | <0.01 |
| Nursing shift on arrival to floor, % | |||
| Day: 7 am3 pm (Reference) | 20.1 | 20.1 | NS |
| Evening: 3 pm11 pm | 47.6 | 50.2 | NS |
| Overnight: 11 pm7 am | 32.3 | 29.7 | <0.01 |
| Weekend admission, % | 33.7 | 32.7 | NS |
| Admitted to monitored bed, % | 24.1 | 24.9 | NS |
| Emergency department annual volume, mean (SD) | 48,755 (15,379) | 50,570 (15,276) | <0.01 |
| Non‐ICU annual admission volume, mean (SD) | 5,562 (1,626) | 5,774 (1,568) | <0.01 |
| Admitting diagnosis, listed by descending frequency, % | NS | ||
| Pneumonia and respiratory infections | 16.3 | 11.8 | <0.01 |
| Gastrointestinal bleeding | 12.8 | 13.6 | NS |
| Chest pain | 7.3 | 10.0 | <0.01 |
| Miscellaneous conditions | 5.6 | 6.2 | NS |
| All other acute infections | 4.7 | 6.0 | <0.01 |
| Seizures | 4.1 | 5.9 | <0.01 |
| AMI | 3.9 | 3.3 | <0.05 |
| COPD | 3.8 | 3.0 | <0.01 |
| CHF | 3.5 | 3.7 | NS |
| Arrhythmias and pulmonary embolism | 3.5 | 3.3 | NS |
| Stroke | 3.4 | 3.5 | NS |
| Diabetic emergencies | 3.3 | 2.6 | <0.01 |
| Metabolic, endocrine, electrolytes | 3.0 | 2.9 | NS |
| Sepsis | 3.0 | 1.2 | <0.01 |
| Other neurology and toxicology | 3.0 | 2.9 | NS |
| Urinary tract infections | 2.9 | 3.2 | NS |
| Catastrophic conditions | 2.6 | 1.2 | <0.01 |
| Rheumatology | 2.5 | 3.5 | <0.01 |
| Hematology and oncology | 2.4 | 2.4 | NS |
| Acute renal failure | 1.9 | 1.1 | <0.01 |
| Pancreatic and liver | 1.7 | 2.0 | NS |
| Trauma, fractures, and dislocations | 1.6 | 1.8 | NS |
| Bowel obstructions and diseases | 1.6 | 2.9 | <0.01 |
| Other cardiac conditions | 1.5 | 1.3 | NS |
| Other renal conditions | 0.6 | 1.0 | <0.01 |
| Inpatient length of stay, median days (IQR) | 4.7 (2.78.6) | 2.6 (1.54.4) | <0.01 |
| Died during hospitalization, % | 12.7 | 2.4 | <0.01 |
Unplanned ICU transfers were more frequent in lower volume hospitals (Table 1). Figure 1 displays the inverse relationship between hospital annual ED inpatient admission volume and unplanned ICU transfers rates. The lowest volume hospital had a crude rate twice as high as the 2 highest volume hospitals (39 vs 20, per 1,000 admissions).
Pneumonia/respiratory infection was the most frequent admitting condition associated with unplanned transfer (16.3%) (Table 1). There was also wide variation in crude rates for unplanned ICU transfer by admitting condition (Figure 2). Patients admitted with sepsis had the highest rate (59 per 1,000 admissions), while patients admitted with renal conditions other than acute renal failure had the lowest rates (14.3 per 1,000 admissions).
We confirmed that almost all diagnoses found to account for a disproportionately high share of unplanned ICU transfers in Table 1 were indeed independently associated with this phenomenon after adjustment for patient and hospital differences (Figure 2). Pneumonia remained the most frequent condition associated with unplanned ICU transfer (odds ratio [OR] 1.50; 95% CI 1.201.86). Although less frequent, sepsis had the strongest association of any condition with unplanned transfer (OR 2.51; 95% CI 1.903.31). However, metabolic, endocrine, and electrolyte conditions were no longer associated with unplanned transfer after adjustment, while arrhythmias and pulmonary embolism were. Other conditions confirmed to be associated with increased risk of unplanned transfer included: myocardial infarction (MI), chronic obstructive pulmonary disease (COPD), stroke, diabetic emergencies, catastrophic conditions (includes aortic catastrophes, all forms of shock except septic shock, and intracranial hemorrhage), and acute renal failure. After taking into account the frequency of admitting diagnoses, respiratory conditions (COPD, pneumonia/acute respiratory infection) comprised nearly half (47%) of all conditions associated with increased risk of unplanned ICU transfer.
Other factors confirmed to be independently associated with unplanned ICU transfer included: male sex (OR 1.20; 95% CI 1.131.28), high comorbidity burden as measured by COPS >145 (OR 1.13; 95% CI 1.031.24), increasingly abnormal physiology compared to a LAPS <7, and arrival on ward during the overnight shift (OR 1.10; 95% CI 1.011.21). After adjustment, we did find that admission to the TCU rather than a medicalsurgical unit was associated with decreased risk of unplanned ICU transfer (OR 0.83; 95% CI 0.770.90). Age 85 was associated with decreased risk of unplanned ICU transfer relative to the youngest age group of 1834‐year‐old patients (OR 0.64; 95% CI 0.530.77).
ED admissions to higher volume hospitals were 6% less likely to experience an unplanned transfer for each additional 1,000 annual ED hospitalizations over a lower volume hospital (OR 0.94; 95% CI 0.910.98). In other words, a patient admitted to a hospital with 8,000 annual ED hospitalizations had 30% decreased odds of unplanned ICU transfer compared to a hospital with only 3,000 annual ED hospitalizations.
DISCUSSION
Patients admitted with respiratory conditions accounted for half of all admitting diagnoses associated with increased risk of unplanned transfer to the ICU within 24 hours of arrival to the ward. We found that 1 in 30 ED ward admissions for pneumonia, and 1 in 33 for COPD, were transferred to the ICU within 24 hours. These findings indicate that there is some room for improvement in early care of respiratory conditions, given the average unplanned transfer rate of 1 in 42, and previous research showing that patients with pneumonia and patients with COPD, who experience unplanned ICU transfer, have substantially worse mortality than those directly admitted to the ICU.1
Although less frequent than hospitalizations for respiratory conditions, patients admitted with sepsis were at the highest risk of unplanned ICU transfer (1 in 17 ED non‐ICU hospitalizations). We also found that MI and stroke ward admissions had a higher risk of unplanned ICU transfer. However, we previously found that unplanned ICU transfers for sepsis, MI, and stroke did not have worse mortality than direct ICU admits for these conditions.1 Therefore, quality improvement efforts to reduce excess mortality related to early decompensation in the hospital and unplanned ICU transfer would be most effective if targeted towards respiratory conditions such as pneumonia and COPD.
This is the only in‐depth study, to our knowledge, to explore the association between a set of mutually exclusive diagnostic categories and risk of unplanned ICU transfer within 24 hours, and it is the first study to identify risk factors for unplanned ICU transfer in a multi‐hospital cohort adjusted for patient‐ and hospital‐level characteristics. We also identified a novel hospital volumeoutcome relationship: Unplanned ICU transfers are up to twice as likely to occur in the smallest volume hospitals compared with highest volume hospitals. Hospital volume has long been proposed as a proxy for hospital resources; there are several studies showing a relationship between low‐volume hospitals and worse outcomes for a number of conditions.19, 20 Possible mechanisms may include decreased ICU capacity, decreased on‐call intensivists in the hospital after hours, and less experience with certain critical care conditions seen more frequently in high‐volume hospitals.21
Patients at risk of unplanned ICU transfer were also more likely to have physiologic derangement identified on laboratory testing, high comorbidity burden, and arrive on the ward between 11 PM and 7 AM. Given the strong correlation between comorbidity burden and physiologic derangement and mortality,14 it is not surprising that the COPS and LAPS were independent predictors of unplanned transfer. It is unclear, however, why arriving on the ward on the overnight shift is associated with higher risk. One possibility is that patients who arrive on the wards during 11 PM to 7 AM are also likely to have been in the ED during evening peak hours most associated with ED crowding.22 High levels of ED crowding have been associated with delays in care, worse quality care, lapses in patient safety, and even increased in‐hospital mortality.22, 23 Other possible reasons include decreased in‐hospital staffing and longer delays in critical diagnostic tests and interventions.2428
Admission to TCUs was associated with decreased risk of unplanned ICU transfer in the first 24 hours of hospitalization. This may be due to the continuous monitoring, decreased nursing‐to‐patient ratios, or the availability to provide some critical care interventions. In our study, age 85 was associated with lower likelihood of unplanned transfer. Unfortunately, we did not have access to data on advanced directives or patient preferences. Data on advanced directives would help to distinguish whether this phenomenon was related to end‐of‐life care goals versus other explanations.
Our study confirms some risk factors identified in previous studies. These include specific diagnoses such as pneumonia and COPD,12, 13, 29 heavy comorbidity burden,12, 13, 29 abnormal labs,29 and male sex.13 Pneumonia has consistently been shown to be a risk factor for unplanned ICU transfer. This may stem from the dynamic nature of this condition and its ability to rapidly progress, and the fact that some ICUs may not accept pneumonia patients unless they demonstrate a need for mechanical ventilation.30 Recently, a prediction rule has been developed to determine which patients with pneumonia are likely to have an unplanned ICU transfer.30 It is possible that with validation and application of this rule, unplanned transfer rates for pneumonia could be reduced. It is unclear whether males have unmeasured factors associated with increased risk of unplanned transfer or whether a true gender disparity exists.
Our findings should be interpreted within the context of this study's limitations. First, this study was not designed to distinguish the underlying cause of the unplanned transfer such as under‐recognition of illness severity in the ED, evolving clinical disease after leaving the ED, or delays in critical interventions on the ward. These are a focus of our ongoing research efforts. Second, while previous studies have demonstrated that our automated risk adjustment variables can accurately predict in‐hospital mortality (0.88 area under curve in external populations),17 additional data on vital signs and mental status could further improve risk adjustment. However, using automated data allowed us to study risk factors for unplanned transfer in a multi‐hospital cohort with a much larger population than has been previously studied. Serial data on vital signs and mental status both in the ED and during hospitalization could also be helpful in determining which unplanned transfers could be prevented with earlier recognition and intervention. Finally, all patient care occurred within an integrated healthcare delivery system. Thus, differences in case‐mix, hospital resources, ICU structure, and geographic location should be considered when applying our results to other healthcare systems.
This study raises several new areas for future research. With access to richer data becoming available in electronic medical records, prediction rules should be developed to enable better triage to appropriate levels of care for ED admissions. Future research should also analyze the comparative effectiveness of intermediate monitored units versus non‐monitored wards for preventing clinical deterioration by admitting diagnosis. Diagnoses that have been shown to have an increased risk of death after unplanned ICU transfer, such as pneumonia/respiratory infection and COPD,1 should be prioritized in this research. Better understanding is needed on the diagnosis‐specific differences and the differences in ED triage process and ICU structure that may explain why high‐volume hospitals have significantly lower rates of early unplanned ICU transfers compared with low‐volume hospitals. In particular, determining the effect of TCU and ICU capacities and census at the time of admission, and comparing patient risk characteristics across hospital‐volume strata would be very useful. Finally, more work is needed to determine whether the higher rate of unplanned transfers during overnight nursing shifts is related to decreased resource availability, preceding ED crowding, or other organizational causes.
In conclusion, patients admitted with respiratory conditions, sepsis, MI, high comorbidity, and abnormal labs are at modestly increased risk of unplanned ICU transfer within 24 hours of admission from the ED. Patients admitted with respiratory conditions (pneumonia/respiratory infections and COPD) accounted for half of the admitting diagnoses that are at increased risk for unplanned ICU transfer. These patients may benefit from better inpatient triage from the ED, earlier intervention, or closer monitoring. More research is needed to determine the specific aspects of care associated with admission to intermediate care units and high‐volume hospitals that reduce the risk of unplanned ICU transfer.
Acknowledgements
The authors thank John D. Greene, Juan Carlos La Guardia, and Benjamin Turk for their assistance with formatting of the dataset; Dr Alan S. Go, Acting Director of the Division of Research, for reviewing the manuscript; and Alina Schnake‐Mahl for formatting the manuscript.
- , , , et al. Adverse outcomes associated with delayed intensive care unit transfers in an integrated healthcare system. J Hosp Med. 2011;7(3):224–230.
- , , , et al. Inpatient transfers to the intensive care unit. J Gen Intern Med. 2003;18(2):77–83.
- , , , et al. Intra‐hospital transfers to a higher level of care: contribution to total hospital and intensive care unit (ICU) mortality and length of stay (LOS). J Hosp Med. 2011;6:74–80.
- , , , et al. Hospital‐wide code rates and mortality before and after implementation of a rapid response team. JAMA. 2008;300(21):2506–2513.
- , , , et al. Effect of a rapid response team on hospital‐wide mortality and code rates outside the ICU in a children's hospital. JAMA. 2007;298(19):2267–2274.
- , , , et al. Introduction of the medical emergency team (MET) system: a cluster‐randomised controlled trial. Lancet. 2005;365(9477):2091–2097.
- , , , et al. Rapid response systems: A systematic review. Crit Care Med. 2007;35(5):1238–1243.
- , , , et al. Effects of rapid response systems on clinical outcomes: systematic review and meta‐analysis. J Hosp Med. 2007;2(6):422–432.
- , , , et al. Rapid response teams: a systematic review and meta‐analysis. Arch Intern Med. 2010;170(1):18–26.
- , , , et al. Outreach and early warning systems (EWS) for the prevention of intensive care admission and death of critically ill adult patients on general hospital wards. Cochrane Database Syst Rev. 2007;3:CD005529.
- , , , et al. Unplanned transfers to a medical intensive care unit: Causes and relationship to preventable errors in care. J Hosp Med. 2011;6:68–72.
- , , , et al. Using administrative data to develop a nomogram for individualising risk of unplanned admission to intensive care. Resuscitation. 2008;79(2):241–248.
- , , , et al. Unplanned admission to intensive care after emergency hospitalisation: risk factors and development of a nomogram for individualising risk. Resuscitation. 2009;80(2):224–230.
- , , , et al. Risk‐adjusting hospital inpatient mortality using automated inpatient, outpatient, and laboratory databases. Med Care. 2008;46(3):232–239.
- . Linking automated databases for research in managed care settings. Ann Intern Med. 1997;127(8 pt 2):719–724.
- , , , et al. Risk adjusting community‐acquired pneumonia hospital outcomes using automated databases. Am J Manag Care. 2008;14(3):158–166.
- , , , et al. The Kaiser Permanente inpatient risk adjustment methodology was valid in an external patient population. J Clin Epidemiol. 2011;63(7):798–803.
- , , . Maximum likelihood estimation of limited and discrete dependent variable models with nested random effects. J Econometrics. 2005;128(2):301–323.
- . The relation between volume and outcome in health care. N Engl J Med. 1999;340(21):1677–1679.
- , , . Is volume related to outcome in health care? A systematic review and methodologic critique of the literature. Ann Intern Med. 2002;137(6):511–520.
- , , . Working with capacity limitations: operations management in critical care. Crit Care. 2011;15(4):308.
- , . Systematic review of emergency department crowding: causes, effects, and solutions. Ann Intern Med. 2008;52(2):126–136.
- , , , et al. The effect of emergency department crowding on clinically oriented outcomes. Acad Emerg Med. 2009;16(1):1–10.
- , , , et al. Association between time of admission to the ICU and mortality. Chest. 2010;138(1):68–75.
- , , , et al. Off‐hour admission and in‐hospital stroke case fatality in the get with the guidelines‐stroke program. Stroke. 2009;40(2):569–576.
- , , , et al. Relationship between time of day, day of week, timeliness of reperfusion, and in‐hospital mortality for patients with acute ST‐segment elevation myocardial infarction. JAMA. 2005;294(7):803–812.
- , , , et al. Hospital mortality among adults admitted to and discharged from intensive care on weekends and evenings. J Crit Care. 2008;23(3):317–324.
- , , , et al. Association between ICU admission during morning rounds and mortality. Chest. 2009;136(6):1489–1495.
- , , , et al. Identifying infected emergency department patients admitted to the hospital ward at risk of clinical deterioration and intensive care unit transfer. Acad Emerg Med. 2010;17(10):1080–1085.
- , , , et al. Risk stratification of early admission to the intensive care unit of patients with no major criteria of severe community‐acquired pneumonia: development of an international prediction rule. Crit Care. 2009;13(2):R54.
Copyright © 2012 Society of Hospital Medicine

Outcomes of Delayed ICU Transfer
Hospitalized patients who require transfer from medical wards to the intensive care unit (ICU) have high in‐hospital mortality, in some reports exceeding 55%.14 In a previous report in this journal, we found that while these unplanned ICU transfers occurred in only 4% of hospitalizations, they were present in nearly one‐quarter of fatal hospitalizations and were associated with substantial increases in resource utilization.4 For these reasons, interventions aimed at identifying and treating this high‐risk group have received considerable attention and have been proposed as measures of inpatient safety.2, 49
Notably, mortality among patients with unplanned ICU transfers exceeds mortality among patients admitted to the ICU directly from the emergency department (ED)a group traditionally considered to have the highest risk of death.13, 10 Previous single‐center studies suggest that increased mortality rates are present even among patients transferred within 24 hours of hospital admission, and reinforce the notion that earlier recognition of critical illness may result in improved outcomes.1113 However, these studies have been performed primarily in small cohorts of heterogeneous patients, and may obscure the independent effect of unplanned transfers on mortality and hamper efforts to use unplanned transfer rates as a metric of healthcare quality.1, 2, 4, 9
In this study, we evaluated early unplanned ICU transfers drawn from a cohort of 499,995 hospitalizations in an integrated healthcare delivery system. Using patient data, extracted from the automated electronic medical record, we matched unplanned transfer cases to patients directly admitted to the ICU and described the association between delayed ICU transfers and adverse outcomes.
METHODS
Setting and Participants
We performed a retrospective analysis of adult patient (age 18 years) hospitalizations at 21 Northern California Kaiser Permanente (KP) Medical Care Program hospitals between January 2007 and December 2009. This work expanded on our previous report of hospital stays from November 2006 to January 2008.4 The 21 study hospitals used the same electronic health information systems; databases captured admission, discharge, and bed history data. The use of these databases for research has been described in our previous study and other reports; hospital characteristics, unit staffing, and resource levels have also been detailed previously.4, 1417 This study was approved by the KP Institutional Review Board.
Identifying Unplanned Transfers
We evaluated patients with medical hospitalizationsdefined as those whose first hospital location was not in a surgical setting such as the operating room or post‐anesthesia recovery areawhose admission originated in the ED; patients admitted for surgery were removed because of significant differences in observed mortality (see Supporting Information Appendix Figure 1 and Appendix Table 1 in the online version of this article). Patients whose admission did not originate in the ED were excluded to eliminate confounding resulting from differences in preadmission care. We also excluded patients admitted for gynecological and pregnancy‐related care because of low hospital mortality.
Initial patient locations included the medical wards (wards); the transitional care unit (TCU); and the intensive care unit (ICU). Bed history data, based on time stamps and available for all patients, were used to track patient locations from the time of admission, defined as the first non‐ED hospital location, until discharge. Patient length of stay (LOS) was calculated at each location and for the entire hospitalization.
Transfers to the ICU after a patient's initial admission to the ward or TCU were termed unplanned (or delayed) ICU transfers; patients admitted from the ED to the ICU were termed direct ICU admit patients. Direct ICU admit patients were excluded from the unplanned transfer group even if they required a readmission to the ICU later in their hospital course. We focused on patients with unplanned ICU transfers early after hospitalization to identify those in whom prompt recognition and intervention could be effective; thus, our primary analyses were on patients with transfers within 24 hours of admission. In secondary analysis, we also evaluated patients with unplanned ICU transfers occurring within 48 hours after hospital admission.
Admission Severity of Illness
To account for severity of illness at admission, we used a predicted mortality measure developed at KP.14 This method strictly utilizes information available prior to hospital admissionincluding that from the ED; variables included age, gender, admitting diagnosis, and measures of laboratory test and comorbid disease burden. The method, derived using 259,669 KP hospitalizations, produced a c‐statistic of 0.88 for inpatient mortality; external validation, based on 188,724 hospitalizations in Ottawa, produced a c‐statistic of 0.92.14, 18
Admitting diagnoses were based on admission International Classification of Diseases, 9th revision (ICD‐9) codes, and grouped into 44 broad Primary Conditions based on pathophysiologic plausibility and mortality rates.14 The method also quantified each patient's physiologic derangement and preexisting disease burden based on automated laboratory and comorbidity measuresthe Laboratory Acute Physiology Score (LAPS) and the Comorbidity Point Score (COPS).14
In brief, the LAPS was derived from 14 possible test results obtained in the 24‐hour time period preceding hospitalization, including: anion gap; arterial pH, PaCO2, and PaO2; bicarbonate; serum levels of albumin, total bilirubin, creatinine, glucose, sodium, and troponin I; blood urea nitrogen; creatinine; hematocrit; and total white blood cell count.14 The COPS was calculated from each subject's inpatient and outpatient diagnoses, based on Diagnostic Cost Groups software,19 during the 12‐month period preceding hospitalization.14 Increasing LAPS and COPS values were associated with increases in hospital mortality; detailed information about the development, application, and validation are available in previous work.14, 18
Statistical Analysis
Evaluating excess adverse outcomes associated with unplanned transfers requires adequate control of confounding variables. Our approach to reduce confounding was multivariable case matchinga technique used for assessing treatment effects in observational data.20, 21 Patients with unplanned transfersidentified as caseswere matched with similar controls based on observed variables at the time of hospital admission.
We first matched patients with unplanned ICU transfers within 24 hours of hospital admission to direct ICU admit controls based on predicted in‐hospital mortality (to within 1%); age (by decade); gender; and admitting diagnosis. If a case was matched to multiple controls, we selected 1 control with the most similar admission characteristics (weekday or weekend admission and nursing shift). The risk of death associated with unplanned transfers was estimated using multivariable conditional logistic regression. In secondary analysis, we repeated this analysis only among case‐control pairs within the same hospital facilities.
To cross‐validate the results from multivariable matching techniques, we also performed mixed‐effects multivariable logistic regression including all early unplanned transfer patients and direct ICU admit patients, while adjusting for predicted hospital mortality, age, gender, admitting diagnosis, LAPS, COPS, weekend versus weekday admission, nursing shift, and hospital facility random effects. We repeated these same analyses where cases were defined as patients transferred to the ICU within 48 hours of hospitalization.
Unplanned Transfer Timing
Using bed history data, we identified the elapsed time from admission to unplanned transfer, and categorized patients in increments of elapsed time from admission to unplanned transfer. Time‐to‐unplanned transfer was summarized using Kaplan‐Meier curve.
All analyses were performed in Stata/IC 11.0 for Mac (StataCorp LP, College Station, TX). Continuous variables were reported as mean standard deviation (SD). Cohort comparisons were performed with analysis of variance (ANOVA). Categorical variables were summarized using frequencies and compared with chi‐squared testing. A P value <0.05 was considered statistically significant.
RESULTS
During the study period, 313,797 medical hospitalizations originated in the ED (Table 1). Overall, patients' mean age was 67 18 years; 53.7% were female. Patient characteristics differed significantly based on the need for ICU admission. For example, average LAPS was highest among patients admitted directly to the ICU and lowest among patients who never required ICU care (P < 0.01). Patients with unplanned ICU transfers during hospitalization had longer length of stay and higher hospital mortality than direct ICU admit patients (P < 0.01). Overall, more than 1 in 15 patients experienced an unplanned transfer to the ICU.
| Early Delayed ICU Transfer (by Elapsed Time Since Hospital Admission) | ||||
|---|---|---|---|---|
| Variable | Overall | Within 24 hr | Within 48 hr | Direct ICU Admit |
| ||||
| No. (%) | 313,797 | 6,369 (2.0) | 9,816 (3.1) | 29,929 (9.5) |
| Age* | 67 18 | 67 16 | 68 16 | 64 17 |
| Female* | 169,358 (53.7) | 3,125 (49.1) | 4,882 (49.7) | 14,488 (48.4) |
| Weekend admission* | 83,327 (26.6) | 1,783 (28.0) | 2,733 (27.8) | 8,152 (27.2) |
| Nursing shift at admission* | ||||
| Day (7 AM‐3 PM) | 65,303 (20.8) | 1,335 (21.0) | 2,112 (21.5) | 7,065 (23.6) |
| Evening (3 PM‐11 PM) | 155,037 (49.4) | 2,990 (47.0) | 4,691 (47.8) | 13,158 (44.0) |
| Night (11 PM‐7 AM) | 93,457 (29.8) | 2,044 (32.1) | 3,013 (30.7) | 9,706 (32.4) |
| Initial hospital location* | ||||
| Ward | 234,915 (82.8) | 5,177 (81.3) | 7,987 (81.4) | |
| Transitional care unit | 48,953 (17.2) | 1,192 (18.7) | 1,829 (18.6) | |
| LAPS* | 24 19 | 28 20 | 28 20 | 35 25 |
| COPS* | 98 67 | 105 70 | 106 70 | 99 71 |
| Length of stay (days) | 4.6 7.5 | 8.4 12.2 | 9.1 13.4 | 6.4 9.5 |
| In‐hospital mortality | 12,686 (4.0) | 800 (12.6) | 1,388 (14.1) | 3,602 (12.0) |
The majority of unplanned transfers occurred within the first 48 hours of hospitalization (57.6%, Figure 1); nearly 80% occurred within the first 4 days. The rate of unplanned transfer peaked within 24 hours of hospital admission and decreased gradually as elapsed hospital LOS increased (Figure 1). While most patients experienced a single unplanned ICU transfer, 12.7% required multiple transfers to the ICU throughout their hospitalization.
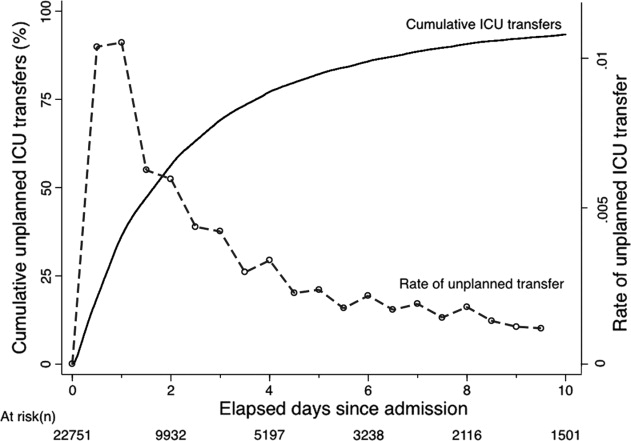
Multivariable case matching between unplanned transfer cases within 24 hours of admission and direct ICU admit controls resulted in 5839 (92%) case‐control pairs (Table 2). Matched pairs were most frequently admitted with diagnoses in Primary Condition groups that included respiratory infections and pneumonia (15.6%); angina, acute myocardial infarction (AMI), and heart failure (15.6%); or gastrointestinal bleeding (13.8%).
| ICU Cohorts (by Elapsed Time to Transfer Since Hospital Admission) | ||||
|---|---|---|---|---|
| Within 24 hr (n = 5,839) | Within 48 hr (n = 8,976) | |||
| Delayed ICU Transfer (Case) | Direct ICU Admit (Control) | Delayed ICU Transfer (Case) | Direct ICU Admit (Control) | |
| ||||
| Age | 67 16 | 66 16 | 67 16 | 67 16 |
| Female | 2,868 (49.1) | 2,868 (49.1) | 4,477 (49.9) | 4,477 (49.9) |
| Admitting diagnosis | ||||
| Pneumonia | 911 (15.6) | 911 (15.6) | 1,526 (17.0) | 1,526 (17.0) |
| Heart failure or MI | 909 (15.6) | 909 (15.6) | 1,331 (14.8) | 1,331 (14.8) |
| Gastrointestinal bleeding | 806 (13.8) | 806 (13.8) | 1,191 (13.3) | 1,191 (13.3) |
| Infections (including sepsis) | 295 (5.1) | 295 (5.1) | 474 (5.3) | 474 (5.3) |
| Outcomes | ||||
| Length of stay (days)* | 8 12 | 6 9 | 9 13 | 6 9 |
| In‐hospital mortality* | 678 (11.6) | 498 (8.5) | 1,181 (13.2) | 814 (9.1) |
In‐hospital mortality was significantly higher among cases (11.6%) than among ICU controls (8.5%, P < 0.001); mean LOS was also longer among cases (8 12 days) than among controls (6 9 days, P < 0.001). Unplanned transfer cases were at an increased odds of death when compared with ICU controls (adjusted odds ratio [OR], 1.44; 95% confidence interval [CI], 1.26‐1.64; P < 0.001); they also had a significantly higher observed‐to‐expected mortality ratio. When cases and controls were matched by hospital facility, the number of case‐control pairs decreased (2949 pairs; 42% matching frequency) but the odds of death was of similar magnitude (OR, 1.43; 95% CI, 1.21‐1.68; P < 0.001). Multivariable mixed‐effects logistic regression including all early unplanned transfer and direct ICU admit patients produced an effect size of similar magnitude (OR, 1.37; 95% CI, 1.24‐1.50; P < 0.001).
Results were similar when cases were limited to patients with transfers within 12 hours of admission; mortality was 10.9% among cases and 9.1% among controls (P = 0.02). When including patients with unplanned transfers within 48 hours of hospital admission, the difference in mortality between cases and controls increased (13.2% vs 9.1%, P < 0.001). The odds of death among patients with unplanned transfers increased as the elapsed time between admission and ICU transfer lengthened (Figure 2); the adjusted OR was statistically significant at each point between 8 and 48 hours.
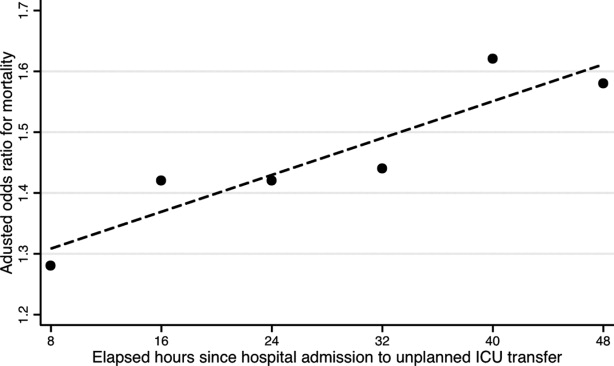
When stratified by admitting diagnosis groups, cases with unplanned transfers within the first 48 hours had increased mortality compared with matched controls in some categories (Table 3). For example, for patients in the respiratory infection and pneumonia group, mortality was 16.8% among unplanned transfer cases and 13.0% among early matched ICU controls (P < 0.01). A similar pattern was present in groups including: gastrointestinal bleeding, chronic obstructive pulmonary disease (COPD) exacerbation, and seizure groups (Table 3). However, for patients with AMI alone, mortality was 5.0% among cases and 3.7% among matched controls (P = 0.12). Patients with sepsis had a mortality rate of 15.2% among cases and 20.8% among matched controls (P = 0.07). Similarly, patients with stroke had a mortality rate of 12.4% among unplanned transfer cases and 11.4% in the matched controls (P = 0.54).
| Primary Condition Group | Mortality in ICU Case‐Control Cohorts, No. (%) | |||
|---|---|---|---|---|
| Within 24 hr | Within 48 hr | |||
| Delayed ICU Transfer (Case) | Direct ICU Admit (Control) | Delayed ICU Transfer (Case) | Direct ICU Admit (Control) | |
| ||||
| Respiratory infections | 143 (15.7) | 126 (13.8) | 493 (16.8) | 380 (13.0) |
| Angina, heart failure, or MI | 60 (6.6) | 41 (4.5) | 324 (7.7) | 152 (3.6) |
| Acute MI alone | 16 (5.7) | 17 (6.1) | 82 (5.0) | 61 (3.7) |
| Gastrointestinal bleeding | 96 (11.9) | 55 (6.8) | 549 (19.3) | 188 (6.6) |
| Infections including sepsis | 20 (9.8) | 52 (11.2) | 228 (14.8) | 220 (14.2) |
| Sepsis alone | 32 (18.9) | 31 (18.3) | 123 (15.2) | 168 (20.8) |
| COPD exacerbation | 20 (9.8) | 12 (5.9) | 74 (10.8) | 43 (6.3) |
| Stroke | 18 (10.2) | 19 (10.8) | 77 (12.4) | 71 (11.4) |
| Seizure | 21 (8.6) | 9 (3.7) | 68 (7.1) | 34 (3.6) |
DISCUSSION
This study found that unplanned ICU transfers were common among medical patients, occurring in 5% of all hospitalizations originating in the ED. The majority of unplanned transfers occurred within 48 hours of admission; the rate of ICU transfers peaked within 24 hours after hospitalization. Compared with patients admitted directly from the ED to the ICU, those transferred early after admission had significantly increased mortality; for example, patients transferred within 24 hours were at a 44% increased odds of hospital death. The adverse outcomes associated with unplanned transfers varied considerably by admission diagnosis subgroups.
Our findings confirm previous reports of increased mortality among patients with unplanned ICU transfers. Escarce and Kelley reported that patients admitted to the ICU from non‐ED locationsincluding wards, intermediate care units, and other hospitalswere at an increased risk of hospital death.1 Multiple subsequent studies have confirmed the increased mortality among patients with unplanned transfers.24, 10, 13, 22, 23 We previously evaluated patients who required a transfer to any higher level of care and reported an observed‐to‐expected mortality ratio of 2.93.4
Fewer studies, however, have evaluated the association between the timing of unplanned transfers and inpatient outcomes; previous small reports suggest that delays in ICU transfer adversely affect mortality and length of stay.12, 13, 24 Parkhe et al. compared 99 direct ICU admit patients with 23 who experienced early unplanned transfers; mortality at 30 days was significantly higher among patients with unplanned transfers.13 The current multifacility study included considerably more patients and confirmed an in‐hospital mortality gapalbeit a smaller onebetween patients with early transfers and those directly admitted to the ICU.
We focused on unplanned transfers during the earliest phase of hospitalization to identify patients who might benefit from improved recognition of, and intervention for, impending critical illness. We found that even patients requiring transfers within 8 hours of hospital admission were at an increased risk of death. Bapoje et al. recently reported that as many as 80% of early unplanned transfers were preventable and that most resulted from inappropriate admission triage.11 Together, these findings suggest that heightened attention to identifying such patients at admission or within the first day of hospitalizationwhen the rates of unplanned transfers peakis critical.
Several important limitations should be recognized in interpreting these results. First, this study was not designed to specifically identify the reasons for unplanned transfers, limiting our ability to characterize episodes in which timely care could have prevented excess mortality. Notably, while previous work suggests that many early unplanned transfers might be prevented with appropriate triage, it is likely that some excess deaths are not preventable even if every patient could be admitted to the ICU directly.
We were able to characterize patient outcomes by admitting diagnoses. Patients admitted for pneumonia and respiratory infection, gastrointestinal bleeding, COPD exacerbation, or seizures demonstrated excess mortality compared with matched ICU controls, while those with AMI, sepsis, and stroke did not. It is possible that differences in diagnosis‐specific excess mortality resulted from increasing adherence to well‐defined practice guidelines for specific high‐risk conditions.2527 For example, international awareness campaigns for the treatment of sepsis, AMI, and strokeSurviving Sepsis, Door‐to‐Balloon, and F.A.S.T.emphasize early interventions to minimize morbidity and mortality.
Second, the data utilized in this study were based on automated variables extracted from the electronic medical record. Mortality prediction models based on automated variables have demonstrated excellent performance among ICU and non‐ICU populations14, 18, 28; however, the inclusion of additional data (eg, vital signs or neurological status) would likely improve baseline risk adjustment.5, 10, 2931 Multiple studies have demonstrated that vital signs and clinician judgment can predict patients at an increased risk of deterioration.5, 10, 2931 Such data might also provide insight into residual factors that influenced clinicians' decisions to triage patients to an ICU versus non‐ICU admissiona focus area of our ongoing research efforts. Utilizing electronically available data, however, facilitated the identification of a cohort of patients far larger than that in prior studies. Where previous work has also been limited by substantial variability in baseline characteristics among study subjects,1, 2, 12, 13 our large sample produced a high percentage of multivariable case matches.
Third, we chose to match patients with a severity of illness index based on variables available at the time of hospital admission. While this mortality prediction model has demonstrated excellent performance in internal and external populations,14, 18 it is calibrated for general inpatient, rather than critically ill, populations. It remains possible that case matching with ICU‐specific severity of illness scores might alter matching characteristics, however, previous studies suggest that severity of illness, as measured by these scores, is comparable between direct ICU admits and early ICU transfers.13 Importantly, our matching procedure avoided the potential confounding known to exist with the use of prediction models based on discharge or intra‐hospitalization data.32, 33
Finally, while we were able to evaluate unplanned transfer timing in a multifacility sample, all patient care occurred within a large integrated healthcare delivery system. The overall observed mortality in our study was lower than that reported in prior studies which considered more limited patient cohorts.1, 2, 12, 13, 22 Thus, differences in patient case‐mix or ICU structure must be considered when applying our results to other healthcare delivery systems.
This hypothesis‐generating study, based on a large, multifacility sample of hospitalizations, suggests several areas of future investigation. Future work should detail specific aspects of care among patients with unplanned transfer, including: evaluating the structures and processes involved in triage decisions, measuring the effects on mortality through implementation of interventions (eg, rapid response teams or diagnosis‐specific treatment protocols), and defining the causes and risk factors for unplanned transfers by elapsed time.
In conclusion, the risk of an unplanned ICU transfera common event among hospitalized patientsis highest within 24 hours of hospitalization. Patients with early unplanned transfers have increased mortality and length of stay compared to those admitted directly to the ICU. Even patients transferred to the ICU within 8 hours of hospital admission are at an increased risk of death when compared with those admitted directly. Substantial variability in unplanned transfer outcomes exists based on admitting diagnoses. Future research should characterize unplanned transfers in greater detail with the goal of identifying patients that would benefit from improved triage and early ICU transfer.
- ,.Admission source to the medical intensive care unit predicts hospital death independent of APACHE II score.JAMA.1990;264(18):2389–2394.
- ,,,,,.Unplanned admission to intensive care after emergency hospitalisation: risk factors and development of a nomogram for individualising risk.Resuscitation.2009;80(2):224–230.
- ,.Outcome of intensive care patients in a group of British intensive care units.Crit Care Med.1998;26(8):1337–1345.
- ,,,,,.Intra‐hospital transfers to a higher level of care: contribution to total hospital and intensive care unit (ICU) mortality and length of stay (LOS).J Hosp Med.2010;6(2):74–80.
- ,.Medical patients at high risk for catastrophic deterioration.Crit Care Med.1987;15(5):510–515.
- ,,, et al.Introduction of the medical emergency team (MET) system: a cluster‐randomised controlled trial.Lancet.2005;365(9477):2091–2097.
- ,,, et al.Effect of a rapid response team on hospital‐wide mortality and code rates outside the ICU in a children's hospital.JAMA.2007;298(19):2267–2274.
- ,,,,,.Validity of unplanned admission to an intensive care unit as a measure of patient safety in surgical patients.Anesthesiology.2005;103(6):1121–1129.
- ,,,.The 100,000 lives campaign: setting a goal and a deadline for improving health care quality.JAMA.2006;295(3):324–327.
- ,,, et al.Duration of life‐threatening antecedents prior to intensive care admission.Intensive Care Med.2002;28(11):1629–1634.
- ,,,.Unplanned transfers to a medical intensive care unit: causes and relationship to preventable errors in care.J Hosp Med.2011;6(2):68–72.
- ,,,,.Inpatient transfers to the intensive care unit: delays are associated with increased mortality and morbidity.J Gen Intern Med.2003;18(2):77–83.
- ,,,.Outcome of emergency department patients with delayed admission to an intensive care unit.Emerg Med (Fremantle).2002;14(1):50–57.
- ,,,,,.Risk‐adjusting hospital inpatient mortality using automated inpatient, outpatient, and laboratory databases.Med Care.2008;46(3):232–239.
- ,,, et al.Risk adjusting community‐acquired pneumonia hospital outcomes using automated databases.Am J Manag Care.2008;14(3):158–166.
- .Linking automated databases for research in managed care settings.Ann Intern Med.1997;127(8 pt 2):719–724.
- ,,, et al.Anticoagulation therapy for stroke prevention in atrial fibrillation: how well do randomized trials translate into clinical practice?JAMA.2003;290(20):2685–2692.
- ,,,.The Kaiser Permanente inpatient risk adjustment methodology was valid in an external patient population.J Clin Epidemiol.2009;63(7):798–803.
- ,.Refinements to the diagnostic cost group (DCG) model.Inquiry.1995;32(4):418–429.
- ,.Excess length of stay, charges, and mortality attributable to medical injuries during hospitalization.JAMA.2003;290(14):1868–1874.
- .Optimal matching in observational studies.J Am Stat Assoc.1989;84:1024–1032.
- ,,,.Admissions to intensive care units from emergency departments: a descriptive study.Emerg Med J.2005;22(6):423–428.
- ,,,.Using administrative data to develop a nomogram for individualising risk of unplanned admission to intensive care.Resuscitation.2008;79(2):241–248.
- ,,,.Unplanned intensive care unit transfers: a useful tool to improve quality of care [abstract]. In: Hospital Medicine 2010 abstract booklet. Society of Hospital Medicine 2010 Annual Meeting, April 9–11, 2010, Washington, DC;2010:10–11.
- ,,, et al.Surviving Sepsis Campaign: international guidelines for management of severe sepsis and septic shock: 2008.Crit Care Med.2008;36(1):296–327.
- ,,, et al.2009 Focused Updates: ACC/AHA Guidelines for the Management of Patients With ST‐Elevation Myocardial Infarction (updating the 2004 Guideline and 2007 Focused Update) and ACC/AHA/SCAI Guidelines on Percutaneous Coronary Intervention (updating the 2005 Guideline and 2007 Focused Update): a report of the American College of Cardiology Foundation/American Heart Association Task Force on Practice Guidelines.Circulation.2009;120(22):2271–2306.
- ,,, et al.Translating evidence into practice: a decade of efforts by the American Heart Association/American Stroke Association to reduce death and disability due to stroke: a presidential advisory from the American Heart Association/American Stroke Association.Stroke.2010;41(5):1051–1065.
- ,,, et al.Veterans Affairs intensive care unit risk adjustment model: validation, updating, recalibration.Crit Care Med.2008;36(4):1031–1042.
- ,,, et al.Recommended guidelines for monitoring, reporting, and conducting research on medical emergency team, outreach, and rapid response systems: an Utstein‐style scientific statement: a scientific statement from the International Liaison Committee on Resuscitation (American Heart Association, Australian Resuscitation Council, European Resuscitation Council, Heart and Stroke Foundation of Canada, InterAmerican Heart Foundation, Resuscitation Council of Southern Africa, and the New Zealand Resuscitation Council); the American Heart Association Emergency Cardiovascular Care Committee; the Council on Cardiopulmonary, Perioperative, and Critical Care; and the Interdisciplinary Working Group on Quality of Care and Outcomes Research.Circulation.2007;116(21):2481–2500.
- ,,,,,.Realizing the potential of clinical judgment: a real‐time strategy for predicting outcomes and cost for medical inpatients.Am J Med.2000;109(3):189–195.
- ,,.Physiological values and procedures in the 24 h before ICU admission from the ward.Anaesthesia.1999;54(6):529–534.
- ,,,,,.Predicting who dies depends on how severity is measured: implications for evaluating patient outcomes.Ann Intern Med.1995;123(10):763–770.
- ,,, et al.Enhancement of claims data to improve risk adjustment of hospital mortality.JAMA.2007;297(1):71–76.
Hospitalized patients who require transfer from medical wards to the intensive care unit (ICU) have high in‐hospital mortality, in some reports exceeding 55%.14 In a previous report in this journal, we found that while these unplanned ICU transfers occurred in only 4% of hospitalizations, they were present in nearly one‐quarter of fatal hospitalizations and were associated with substantial increases in resource utilization.4 For these reasons, interventions aimed at identifying and treating this high‐risk group have received considerable attention and have been proposed as measures of inpatient safety.2, 49
Notably, mortality among patients with unplanned ICU transfers exceeds mortality among patients admitted to the ICU directly from the emergency department (ED)a group traditionally considered to have the highest risk of death.13, 10 Previous single‐center studies suggest that increased mortality rates are present even among patients transferred within 24 hours of hospital admission, and reinforce the notion that earlier recognition of critical illness may result in improved outcomes.1113 However, these studies have been performed primarily in small cohorts of heterogeneous patients, and may obscure the independent effect of unplanned transfers on mortality and hamper efforts to use unplanned transfer rates as a metric of healthcare quality.1, 2, 4, 9
In this study, we evaluated early unplanned ICU transfers drawn from a cohort of 499,995 hospitalizations in an integrated healthcare delivery system. Using patient data, extracted from the automated electronic medical record, we matched unplanned transfer cases to patients directly admitted to the ICU and described the association between delayed ICU transfers and adverse outcomes.
METHODS
Setting and Participants
We performed a retrospective analysis of adult patient (age 18 years) hospitalizations at 21 Northern California Kaiser Permanente (KP) Medical Care Program hospitals between January 2007 and December 2009. This work expanded on our previous report of hospital stays from November 2006 to January 2008.4 The 21 study hospitals used the same electronic health information systems; databases captured admission, discharge, and bed history data. The use of these databases for research has been described in our previous study and other reports; hospital characteristics, unit staffing, and resource levels have also been detailed previously.4, 1417 This study was approved by the KP Institutional Review Board.
Identifying Unplanned Transfers
We evaluated patients with medical hospitalizationsdefined as those whose first hospital location was not in a surgical setting such as the operating room or post‐anesthesia recovery areawhose admission originated in the ED; patients admitted for surgery were removed because of significant differences in observed mortality (see Supporting Information Appendix Figure 1 and Appendix Table 1 in the online version of this article). Patients whose admission did not originate in the ED were excluded to eliminate confounding resulting from differences in preadmission care. We also excluded patients admitted for gynecological and pregnancy‐related care because of low hospital mortality.
Initial patient locations included the medical wards (wards); the transitional care unit (TCU); and the intensive care unit (ICU). Bed history data, based on time stamps and available for all patients, were used to track patient locations from the time of admission, defined as the first non‐ED hospital location, until discharge. Patient length of stay (LOS) was calculated at each location and for the entire hospitalization.
Transfers to the ICU after a patient's initial admission to the ward or TCU were termed unplanned (or delayed) ICU transfers; patients admitted from the ED to the ICU were termed direct ICU admit patients. Direct ICU admit patients were excluded from the unplanned transfer group even if they required a readmission to the ICU later in their hospital course. We focused on patients with unplanned ICU transfers early after hospitalization to identify those in whom prompt recognition and intervention could be effective; thus, our primary analyses were on patients with transfers within 24 hours of admission. In secondary analysis, we also evaluated patients with unplanned ICU transfers occurring within 48 hours after hospital admission.
Admission Severity of Illness
To account for severity of illness at admission, we used a predicted mortality measure developed at KP.14 This method strictly utilizes information available prior to hospital admissionincluding that from the ED; variables included age, gender, admitting diagnosis, and measures of laboratory test and comorbid disease burden. The method, derived using 259,669 KP hospitalizations, produced a c‐statistic of 0.88 for inpatient mortality; external validation, based on 188,724 hospitalizations in Ottawa, produced a c‐statistic of 0.92.14, 18
Admitting diagnoses were based on admission International Classification of Diseases, 9th revision (ICD‐9) codes, and grouped into 44 broad Primary Conditions based on pathophysiologic plausibility and mortality rates.14 The method also quantified each patient's physiologic derangement and preexisting disease burden based on automated laboratory and comorbidity measuresthe Laboratory Acute Physiology Score (LAPS) and the Comorbidity Point Score (COPS).14
In brief, the LAPS was derived from 14 possible test results obtained in the 24‐hour time period preceding hospitalization, including: anion gap; arterial pH, PaCO2, and PaO2; bicarbonate; serum levels of albumin, total bilirubin, creatinine, glucose, sodium, and troponin I; blood urea nitrogen; creatinine; hematocrit; and total white blood cell count.14 The COPS was calculated from each subject's inpatient and outpatient diagnoses, based on Diagnostic Cost Groups software,19 during the 12‐month period preceding hospitalization.14 Increasing LAPS and COPS values were associated with increases in hospital mortality; detailed information about the development, application, and validation are available in previous work.14, 18
Statistical Analysis
Evaluating excess adverse outcomes associated with unplanned transfers requires adequate control of confounding variables. Our approach to reduce confounding was multivariable case matchinga technique used for assessing treatment effects in observational data.20, 21 Patients with unplanned transfersidentified as caseswere matched with similar controls based on observed variables at the time of hospital admission.
We first matched patients with unplanned ICU transfers within 24 hours of hospital admission to direct ICU admit controls based on predicted in‐hospital mortality (to within 1%); age (by decade); gender; and admitting diagnosis. If a case was matched to multiple controls, we selected 1 control with the most similar admission characteristics (weekday or weekend admission and nursing shift). The risk of death associated with unplanned transfers was estimated using multivariable conditional logistic regression. In secondary analysis, we repeated this analysis only among case‐control pairs within the same hospital facilities.
To cross‐validate the results from multivariable matching techniques, we also performed mixed‐effects multivariable logistic regression including all early unplanned transfer patients and direct ICU admit patients, while adjusting for predicted hospital mortality, age, gender, admitting diagnosis, LAPS, COPS, weekend versus weekday admission, nursing shift, and hospital facility random effects. We repeated these same analyses where cases were defined as patients transferred to the ICU within 48 hours of hospitalization.
Unplanned Transfer Timing
Using bed history data, we identified the elapsed time from admission to unplanned transfer, and categorized patients in increments of elapsed time from admission to unplanned transfer. Time‐to‐unplanned transfer was summarized using Kaplan‐Meier curve.
All analyses were performed in Stata/IC 11.0 for Mac (StataCorp LP, College Station, TX). Continuous variables were reported as mean standard deviation (SD). Cohort comparisons were performed with analysis of variance (ANOVA). Categorical variables were summarized using frequencies and compared with chi‐squared testing. A P value <0.05 was considered statistically significant.
RESULTS
During the study period, 313,797 medical hospitalizations originated in the ED (Table 1). Overall, patients' mean age was 67 18 years; 53.7% were female. Patient characteristics differed significantly based on the need for ICU admission. For example, average LAPS was highest among patients admitted directly to the ICU and lowest among patients who never required ICU care (P < 0.01). Patients with unplanned ICU transfers during hospitalization had longer length of stay and higher hospital mortality than direct ICU admit patients (P < 0.01). Overall, more than 1 in 15 patients experienced an unplanned transfer to the ICU.
| Early Delayed ICU Transfer (by Elapsed Time Since Hospital Admission) | ||||
|---|---|---|---|---|
| Variable | Overall | Within 24 hr | Within 48 hr | Direct ICU Admit |
| ||||
| No. (%) | 313,797 | 6,369 (2.0) | 9,816 (3.1) | 29,929 (9.5) |
| Age* | 67 18 | 67 16 | 68 16 | 64 17 |
| Female* | 169,358 (53.7) | 3,125 (49.1) | 4,882 (49.7) | 14,488 (48.4) |
| Weekend admission* | 83,327 (26.6) | 1,783 (28.0) | 2,733 (27.8) | 8,152 (27.2) |
| Nursing shift at admission* | ||||
| Day (7 AM‐3 PM) | 65,303 (20.8) | 1,335 (21.0) | 2,112 (21.5) | 7,065 (23.6) |
| Evening (3 PM‐11 PM) | 155,037 (49.4) | 2,990 (47.0) | 4,691 (47.8) | 13,158 (44.0) |
| Night (11 PM‐7 AM) | 93,457 (29.8) | 2,044 (32.1) | 3,013 (30.7) | 9,706 (32.4) |
| Initial hospital location* | ||||
| Ward | 234,915 (82.8) | 5,177 (81.3) | 7,987 (81.4) | |
| Transitional care unit | 48,953 (17.2) | 1,192 (18.7) | 1,829 (18.6) | |
| LAPS* | 24 19 | 28 20 | 28 20 | 35 25 |
| COPS* | 98 67 | 105 70 | 106 70 | 99 71 |
| Length of stay (days) | 4.6 7.5 | 8.4 12.2 | 9.1 13.4 | 6.4 9.5 |
| In‐hospital mortality | 12,686 (4.0) | 800 (12.6) | 1,388 (14.1) | 3,602 (12.0) |
The majority of unplanned transfers occurred within the first 48 hours of hospitalization (57.6%, Figure 1); nearly 80% occurred within the first 4 days. The rate of unplanned transfer peaked within 24 hours of hospital admission and decreased gradually as elapsed hospital LOS increased (Figure 1). While most patients experienced a single unplanned ICU transfer, 12.7% required multiple transfers to the ICU throughout their hospitalization.
Multivariable case matching between unplanned transfer cases within 24 hours of admission and direct ICU admit controls resulted in 5839 (92%) case‐control pairs (Table 2). Matched pairs were most frequently admitted with diagnoses in Primary Condition groups that included respiratory infections and pneumonia (15.6%); angina, acute myocardial infarction (AMI), and heart failure (15.6%); or gastrointestinal bleeding (13.8%).
| ICU Cohorts (by Elapsed Time to Transfer Since Hospital Admission) | ||||
|---|---|---|---|---|
| Within 24 hr (n = 5,839) | Within 48 hr (n = 8,976) | |||
| Delayed ICU Transfer (Case) | Direct ICU Admit (Control) | Delayed ICU Transfer (Case) | Direct ICU Admit (Control) | |
| ||||
| Age | 67 16 | 66 16 | 67 16 | 67 16 |
| Female | 2,868 (49.1) | 2,868 (49.1) | 4,477 (49.9) | 4,477 (49.9) |
| Admitting diagnosis | ||||
| Pneumonia | 911 (15.6) | 911 (15.6) | 1,526 (17.0) | 1,526 (17.0) |
| Heart failure or MI | 909 (15.6) | 909 (15.6) | 1,331 (14.8) | 1,331 (14.8) |
| Gastrointestinal bleeding | 806 (13.8) | 806 (13.8) | 1,191 (13.3) | 1,191 (13.3) |
| Infections (including sepsis) | 295 (5.1) | 295 (5.1) | 474 (5.3) | 474 (5.3) |
| Outcomes | ||||
| Length of stay (days)* | 8 12 | 6 9 | 9 13 | 6 9 |
| In‐hospital mortality* | 678 (11.6) | 498 (8.5) | 1,181 (13.2) | 814 (9.1) |
In‐hospital mortality was significantly higher among cases (11.6%) than among ICU controls (8.5%, P < 0.001); mean LOS was also longer among cases (8 12 days) than among controls (6 9 days, P < 0.001). Unplanned transfer cases were at an increased odds of death when compared with ICU controls (adjusted odds ratio [OR], 1.44; 95% confidence interval [CI], 1.26‐1.64; P < 0.001); they also had a significantly higher observed‐to‐expected mortality ratio. When cases and controls were matched by hospital facility, the number of case‐control pairs decreased (2949 pairs; 42% matching frequency) but the odds of death was of similar magnitude (OR, 1.43; 95% CI, 1.21‐1.68; P < 0.001). Multivariable mixed‐effects logistic regression including all early unplanned transfer and direct ICU admit patients produced an effect size of similar magnitude (OR, 1.37; 95% CI, 1.24‐1.50; P < 0.001).
Results were similar when cases were limited to patients with transfers within 12 hours of admission; mortality was 10.9% among cases and 9.1% among controls (P = 0.02). When including patients with unplanned transfers within 48 hours of hospital admission, the difference in mortality between cases and controls increased (13.2% vs 9.1%, P < 0.001). The odds of death among patients with unplanned transfers increased as the elapsed time between admission and ICU transfer lengthened (Figure 2); the adjusted OR was statistically significant at each point between 8 and 48 hours.
When stratified by admitting diagnosis groups, cases with unplanned transfers within the first 48 hours had increased mortality compared with matched controls in some categories (Table 3). For example, for patients in the respiratory infection and pneumonia group, mortality was 16.8% among unplanned transfer cases and 13.0% among early matched ICU controls (P < 0.01). A similar pattern was present in groups including: gastrointestinal bleeding, chronic obstructive pulmonary disease (COPD) exacerbation, and seizure groups (Table 3). However, for patients with AMI alone, mortality was 5.0% among cases and 3.7% among matched controls (P = 0.12). Patients with sepsis had a mortality rate of 15.2% among cases and 20.8% among matched controls (P = 0.07). Similarly, patients with stroke had a mortality rate of 12.4% among unplanned transfer cases and 11.4% in the matched controls (P = 0.54).
| Primary Condition Group | Mortality in ICU Case‐Control Cohorts, No. (%) | |||
|---|---|---|---|---|
| Within 24 hr | Within 48 hr | |||
| Delayed ICU Transfer (Case) | Direct ICU Admit (Control) | Delayed ICU Transfer (Case) | Direct ICU Admit (Control) | |
| ||||
| Respiratory infections | 143 (15.7) | 126 (13.8) | 493 (16.8) | 380 (13.0) |
| Angina, heart failure, or MI | 60 (6.6) | 41 (4.5) | 324 (7.7) | 152 (3.6) |
| Acute MI alone | 16 (5.7) | 17 (6.1) | 82 (5.0) | 61 (3.7) |
| Gastrointestinal bleeding | 96 (11.9) | 55 (6.8) | 549 (19.3) | 188 (6.6) |
| Infections including sepsis | 20 (9.8) | 52 (11.2) | 228 (14.8) | 220 (14.2) |
| Sepsis alone | 32 (18.9) | 31 (18.3) | 123 (15.2) | 168 (20.8) |
| COPD exacerbation | 20 (9.8) | 12 (5.9) | 74 (10.8) | 43 (6.3) |
| Stroke | 18 (10.2) | 19 (10.8) | 77 (12.4) | 71 (11.4) |
| Seizure | 21 (8.6) | 9 (3.7) | 68 (7.1) | 34 (3.6) |
DISCUSSION
This study found that unplanned ICU transfers were common among medical patients, occurring in 5% of all hospitalizations originating in the ED. The majority of unplanned transfers occurred within 48 hours of admission; the rate of ICU transfers peaked within 24 hours after hospitalization. Compared with patients admitted directly from the ED to the ICU, those transferred early after admission had significantly increased mortality; for example, patients transferred within 24 hours were at a 44% increased odds of hospital death. The adverse outcomes associated with unplanned transfers varied considerably by admission diagnosis subgroups.
Our findings confirm previous reports of increased mortality among patients with unplanned ICU transfers. Escarce and Kelley reported that patients admitted to the ICU from non‐ED locationsincluding wards, intermediate care units, and other hospitalswere at an increased risk of hospital death.1 Multiple subsequent studies have confirmed the increased mortality among patients with unplanned transfers.24, 10, 13, 22, 23 We previously evaluated patients who required a transfer to any higher level of care and reported an observed‐to‐expected mortality ratio of 2.93.4
Fewer studies, however, have evaluated the association between the timing of unplanned transfers and inpatient outcomes; previous small reports suggest that delays in ICU transfer adversely affect mortality and length of stay.12, 13, 24 Parkhe et al. compared 99 direct ICU admit patients with 23 who experienced early unplanned transfers; mortality at 30 days was significantly higher among patients with unplanned transfers.13 The current multifacility study included considerably more patients and confirmed an in‐hospital mortality gapalbeit a smaller onebetween patients with early transfers and those directly admitted to the ICU.
We focused on unplanned transfers during the earliest phase of hospitalization to identify patients who might benefit from improved recognition of, and intervention for, impending critical illness. We found that even patients requiring transfers within 8 hours of hospital admission were at an increased risk of death. Bapoje et al. recently reported that as many as 80% of early unplanned transfers were preventable and that most resulted from inappropriate admission triage.11 Together, these findings suggest that heightened attention to identifying such patients at admission or within the first day of hospitalizationwhen the rates of unplanned transfers peakis critical.
Several important limitations should be recognized in interpreting these results. First, this study was not designed to specifically identify the reasons for unplanned transfers, limiting our ability to characterize episodes in which timely care could have prevented excess mortality. Notably, while previous work suggests that many early unplanned transfers might be prevented with appropriate triage, it is likely that some excess deaths are not preventable even if every patient could be admitted to the ICU directly.
We were able to characterize patient outcomes by admitting diagnoses. Patients admitted for pneumonia and respiratory infection, gastrointestinal bleeding, COPD exacerbation, or seizures demonstrated excess mortality compared with matched ICU controls, while those with AMI, sepsis, and stroke did not. It is possible that differences in diagnosis‐specific excess mortality resulted from increasing adherence to well‐defined practice guidelines for specific high‐risk conditions.2527 For example, international awareness campaigns for the treatment of sepsis, AMI, and strokeSurviving Sepsis, Door‐to‐Balloon, and F.A.S.T.emphasize early interventions to minimize morbidity and mortality.
Second, the data utilized in this study were based on automated variables extracted from the electronic medical record. Mortality prediction models based on automated variables have demonstrated excellent performance among ICU and non‐ICU populations14, 18, 28; however, the inclusion of additional data (eg, vital signs or neurological status) would likely improve baseline risk adjustment.5, 10, 2931 Multiple studies have demonstrated that vital signs and clinician judgment can predict patients at an increased risk of deterioration.5, 10, 2931 Such data might also provide insight into residual factors that influenced clinicians' decisions to triage patients to an ICU versus non‐ICU admissiona focus area of our ongoing research efforts. Utilizing electronically available data, however, facilitated the identification of a cohort of patients far larger than that in prior studies. Where previous work has also been limited by substantial variability in baseline characteristics among study subjects,1, 2, 12, 13 our large sample produced a high percentage of multivariable case matches.
Third, we chose to match patients with a severity of illness index based on variables available at the time of hospital admission. While this mortality prediction model has demonstrated excellent performance in internal and external populations,14, 18 it is calibrated for general inpatient, rather than critically ill, populations. It remains possible that case matching with ICU‐specific severity of illness scores might alter matching characteristics, however, previous studies suggest that severity of illness, as measured by these scores, is comparable between direct ICU admits and early ICU transfers.13 Importantly, our matching procedure avoided the potential confounding known to exist with the use of prediction models based on discharge or intra‐hospitalization data.32, 33
Finally, while we were able to evaluate unplanned transfer timing in a multifacility sample, all patient care occurred within a large integrated healthcare delivery system. The overall observed mortality in our study was lower than that reported in prior studies which considered more limited patient cohorts.1, 2, 12, 13, 22 Thus, differences in patient case‐mix or ICU structure must be considered when applying our results to other healthcare delivery systems.
This hypothesis‐generating study, based on a large, multifacility sample of hospitalizations, suggests several areas of future investigation. Future work should detail specific aspects of care among patients with unplanned transfer, including: evaluating the structures and processes involved in triage decisions, measuring the effects on mortality through implementation of interventions (eg, rapid response teams or diagnosis‐specific treatment protocols), and defining the causes and risk factors for unplanned transfers by elapsed time.
In conclusion, the risk of an unplanned ICU transfera common event among hospitalized patientsis highest within 24 hours of hospitalization. Patients with early unplanned transfers have increased mortality and length of stay compared to those admitted directly to the ICU. Even patients transferred to the ICU within 8 hours of hospital admission are at an increased risk of death when compared with those admitted directly. Substantial variability in unplanned transfer outcomes exists based on admitting diagnoses. Future research should characterize unplanned transfers in greater detail with the goal of identifying patients that would benefit from improved triage and early ICU transfer.
- ,.Admission source to the medical intensive care unit predicts hospital death independent of APACHE II score.JAMA.1990;264(18):2389–2394.
- ,,,,,.Unplanned admission to intensive care after emergency hospitalisation: risk factors and development of a nomogram for individualising risk.Resuscitation.2009;80(2):224–230.
- ,.Outcome of intensive care patients in a group of British intensive care units.Crit Care Med.1998;26(8):1337–1345.
- ,,,,,.Intra‐hospital transfers to a higher level of care: contribution to total hospital and intensive care unit (ICU) mortality and length of stay (LOS).J Hosp Med.2010;6(2):74–80.
- ,.Medical patients at high risk for catastrophic deterioration.Crit Care Med.1987;15(5):510–515.
- ,,, et al.Introduction of the medical emergency team (MET) system: a cluster‐randomised controlled trial.Lancet.2005;365(9477):2091–2097.
- ,,, et al.Effect of a rapid response team on hospital‐wide mortality and code rates outside the ICU in a children's hospital.JAMA.2007;298(19):2267–2274.
- ,,,,,.Validity of unplanned admission to an intensive care unit as a measure of patient safety in surgical patients.Anesthesiology.2005;103(6):1121–1129.
- ,,,.The 100,000 lives campaign: setting a goal and a deadline for improving health care quality.JAMA.2006;295(3):324–327.
- ,,, et al.Duration of life‐threatening antecedents prior to intensive care admission.Intensive Care Med.2002;28(11):1629–1634.
- ,,,.Unplanned transfers to a medical intensive care unit: causes and relationship to preventable errors in care.J Hosp Med.2011;6(2):68–72.
- ,,,,.Inpatient transfers to the intensive care unit: delays are associated with increased mortality and morbidity.J Gen Intern Med.2003;18(2):77–83.
- ,,,.Outcome of emergency department patients with delayed admission to an intensive care unit.Emerg Med (Fremantle).2002;14(1):50–57.
- ,,,,,.Risk‐adjusting hospital inpatient mortality using automated inpatient, outpatient, and laboratory databases.Med Care.2008;46(3):232–239.
- ,,, et al.Risk adjusting community‐acquired pneumonia hospital outcomes using automated databases.Am J Manag Care.2008;14(3):158–166.
- .Linking automated databases for research in managed care settings.Ann Intern Med.1997;127(8 pt 2):719–724.
- ,,, et al.Anticoagulation therapy for stroke prevention in atrial fibrillation: how well do randomized trials translate into clinical practice?JAMA.2003;290(20):2685–2692.
- ,,,.The Kaiser Permanente inpatient risk adjustment methodology was valid in an external patient population.J Clin Epidemiol.2009;63(7):798–803.
- ,.Refinements to the diagnostic cost group (DCG) model.Inquiry.1995;32(4):418–429.
- ,.Excess length of stay, charges, and mortality attributable to medical injuries during hospitalization.JAMA.2003;290(14):1868–1874.
- .Optimal matching in observational studies.J Am Stat Assoc.1989;84:1024–1032.
- ,,,.Admissions to intensive care units from emergency departments: a descriptive study.Emerg Med J.2005;22(6):423–428.
- ,,,.Using administrative data to develop a nomogram for individualising risk of unplanned admission to intensive care.Resuscitation.2008;79(2):241–248.
- ,,,.Unplanned intensive care unit transfers: a useful tool to improve quality of care [abstract]. In: Hospital Medicine 2010 abstract booklet. Society of Hospital Medicine 2010 Annual Meeting, April 9–11, 2010, Washington, DC;2010:10–11.
- ,,, et al.Surviving Sepsis Campaign: international guidelines for management of severe sepsis and septic shock: 2008.Crit Care Med.2008;36(1):296–327.
- ,,, et al.2009 Focused Updates: ACC/AHA Guidelines for the Management of Patients With ST‐Elevation Myocardial Infarction (updating the 2004 Guideline and 2007 Focused Update) and ACC/AHA/SCAI Guidelines on Percutaneous Coronary Intervention (updating the 2005 Guideline and 2007 Focused Update): a report of the American College of Cardiology Foundation/American Heart Association Task Force on Practice Guidelines.Circulation.2009;120(22):2271–2306.
- ,,, et al.Translating evidence into practice: a decade of efforts by the American Heart Association/American Stroke Association to reduce death and disability due to stroke: a presidential advisory from the American Heart Association/American Stroke Association.Stroke.2010;41(5):1051–1065.
- ,,, et al.Veterans Affairs intensive care unit risk adjustment model: validation, updating, recalibration.Crit Care Med.2008;36(4):1031–1042.
- ,,, et al.Recommended guidelines for monitoring, reporting, and conducting research on medical emergency team, outreach, and rapid response systems: an Utstein‐style scientific statement: a scientific statement from the International Liaison Committee on Resuscitation (American Heart Association, Australian Resuscitation Council, European Resuscitation Council, Heart and Stroke Foundation of Canada, InterAmerican Heart Foundation, Resuscitation Council of Southern Africa, and the New Zealand Resuscitation Council); the American Heart Association Emergency Cardiovascular Care Committee; the Council on Cardiopulmonary, Perioperative, and Critical Care; and the Interdisciplinary Working Group on Quality of Care and Outcomes Research.Circulation.2007;116(21):2481–2500.
- ,,,,,.Realizing the potential of clinical judgment: a real‐time strategy for predicting outcomes and cost for medical inpatients.Am J Med.2000;109(3):189–195.
- ,,.Physiological values and procedures in the 24 h before ICU admission from the ward.Anaesthesia.1999;54(6):529–534.
- ,,,,,.Predicting who dies depends on how severity is measured: implications for evaluating patient outcomes.Ann Intern Med.1995;123(10):763–770.
- ,,, et al.Enhancement of claims data to improve risk adjustment of hospital mortality.JAMA.2007;297(1):71–76.
Copyright © 2011 Society of Hospital Medicine
