User login
Electronic Order Set for AMI
Although the prevalence of coronary heart disease and death from acute myocardial infarction (AMI) have declined steadily, about 935,000 heart attacks still occur annually in the United States, with approximately one‐third of these being fatal.[1, 2, 3] Studies have demonstrated decreased 30‐day and longer‐term mortality in AMI patients who receive evidence‐based treatment, including aspirin, ‐blockers, angiotensin‐converting enzyme (ACE) inhibitors or angiotensin receptor blockers (ARBs), anticoagulation therapy, and statins.[4, 5, 6, 7] Despite clinical practice guidelines (CPGs) outlining evidence‐based care and considerable efforts to implement processes that improve patient outcomes, delivery of effective therapy remains suboptimal.[8] For example, the Hospital Quality Alliance Program[9] found that in AMI patients, use of aspirin on admission was only 81% to 92%, ‐blocker on admission 75% to 85%, and ACE inhibitors for left ventricular dysfunction 71% to 74%.
Efforts to increase adherence to CPGs and improve patient outcomes in AMI have resulted in variable degrees of success. They include promotion of CPGs,[4, 5, 6, 7] physician education with feedback, report cards, care paths, registries,[10] Joint Commission standardized measures,[11] and paper checklists or order sets (OS).[12, 13]
In this report, we describe the association between use of an evidence‐based, electronic OS for AMI (AMI‐OS) and better adherence to CPGs. This AMI‐OS was implemented in the inpatient electronic medical records (EMRs) of a large integrated healthcare delivery system, Kaiser Permanente Northern California (KPNC). The purpose of our investigation was to determine (1) whether use of the AMI‐OS was associated with improved AMI processes and patient outcomes, and (2) whether these associations persisted after risk adjustment using a comprehensive severity of illness scoring system.
MATERIALS AND METHODS
This project was approved by the KPNC institutional review board.
Under a mutual exclusivity arrangement, salaried physicians of The Permanente Medical Group, Inc., care for 3.4 million Kaiser Foundation Health Plan, Inc. members at facilities owned by Kaiser Foundation Hospitals, Inc. All KPNC facilities employ the same information systems with a common medical record number and can track care covered by the plan but delivered elsewhere.[14] Our setting consisted of 21 KPNC hospitals described in previous reports,[15, 16, 17, 18] using the same commercially available EMR system that includes computerized physician order entry (CPOE). Deployment of the customized inpatient Epic EMR (
In this EMR's CPOE, physicians have options to select individual orders (a la carte) or they can utilize an OS, which is a collection of the most appropriate orders associated with specific diagnoses, procedures, or treatments. The evidence‐based AMI‐OS studied in this project was developed by a multidisciplinary team (for detailed components see Supporting Appendix 1Appendix 5 in the online version of this article).
Our study focused on the first set of hospital admission orders for patients with AMI. The study sample consisted of patients meeting these criteria: (1) age 18 years at admission; (2) admitted to a KPNC hospital for an overnight stay between September 28, 2008 and December 31, 2010; (3) principal diagnosis was AMI (International Classification of Diseases, 9th Revision [ICD‐9][19] codes 410.00, 01, 10, 11, 20, 21, 30, 31, 40, 41, 50, 51, 60, 61, 70, 71, 80, 90, and 91); and (4) KPHC had been operational at the hospital for at least 3 months to be included (for assembly descriptions see Supporting Appendices 15 in the online version of this article). At the study hospitals, troponin I was measured using the Beckman Access AccuTnI assay (Beckman Coulter, Inc., Brea, CA), whose upper reference limit (99th percentile) is 0.04 ng/mL. We excluded patients initially hospitalized for AMI at a non‐KPNC site and transferred into a study hospital.
The data processing methods we employed have been detailed elsewhere.[14, 15, 17, 20, 21, 22] The dependent outcome variables were total hospital length of stay, inpatient mortality, 30‐day mortality, and all‐cause rehospitalization within 30 days of discharge. Linked state mortality data were unavailable for the entire study period, so we ascertained 30‐day mortality based on the combination of KPNC patient demographic data and publicly available Social Security Administration decedent files. We ascertained rehospitalization by scanning KPNC hospitalization databases, which also track out‐of‐plan use.
The dependent process variables were use of aspirin within 24 hours of admission, ‐blockers, anticoagulation, ACE inhibitors or ARBs, and statins. The primary independent variable of interest was whether or not the admitting physician employed the AMI‐OS when admission orders were entered. Consequently, this variable is dichotomous (AMI‐OS vs a la carte).
We controlled for acute illness severity and chronic illness burden using a recent modification[22] of an externally validated risk‐adjustment system applicable to all hospitalized patients.[15, 16, 23, 24, 25] Our methodology included vital signs, neurological status checks, and laboratory test results obtained in the 72 hours preceding hospital admission; comorbidities were captured longitudinally using data from the year preceding hospitalization (for comparison purposes, we also assigned a Charlson Comorbidity Index score[26]).
End‐of‐life care directives are mandatory on admission at KPNC hospitals. Physicians have 4 options: full code, partial code, do not resuscitate, and comfort care only. Because of small numbers in some categories, we collapsed these 4 categories into full code and not full code. Because patients' care directives may change, we elected to capture the care directive in effect when a patient first entered a hospital unit other than the emergency department (ED).
Two authors (M.B., P.C.L.), one of whom is a board‐certified cardiologist, reviewed all admission electrocardiograms and made a consensus determination as to whether or not criteria for ST‐segment elevation myocardial infarction (STEMI) were present (ie, new ST‐segment elevation or left bundle branch block); we also reviewed the records of all patients with missing troponin I data to confirm the AMI diagnosis.
Statistical Methods
We performed unadjusted comparisons between AMI‐OS and nonAMI‐OS patients using the t test or the [2] test, as appropriate.
We hypothesized that the AMI‐OS plays a mediating role on patient outcomes through its effect on adherence to recommended treatment. We evaluated this hypothesis for inpatient mortality by first fitting a multivariable logistic regression model for inpatient mortality as the outcome and either the 5 evidence‐based therapies or the total number of evidence‐based therapies used (ranging from 02, 3, 4, or 5) as the dependent variable controlling for age, gender, presence of STEMI, troponin I, comorbidities, illness severity, ED length of stay (LOS), care directive status, and timing of cardiac catheterization referral as covariates to confirm the protective effect of these therapies on mortality. We then used the same model to estimate the effect of AMI‐OS on inpatient mortality, substituting the therapies with AMI‐OS as the dependent variable and using the same covariates. Last, we included both the therapies and the AMI‐OS in the model to evaluate their combined effects.[27]
We used 2 different methods to estimate the effects of AMI‐OS and number of therapies provided on the outcomes while adjusting for observed baseline differences between the 2 groups of patients: propensity risk score matching, which estimates the average treatment effect for the treated,[28, 29] and inverse probability of treatment weighting, which is used to estimate the average treatment effect.[30, 31, 32] The propensity score was defined as the probability of receiving the intervention for a patient with specific predictive factors.[33, 34] We computed a propensity score for each patient by using logistic regression, with the dependent variable being receipt of AMI‐OS and the independent variables being the covariates used for the multivariate logistic regression as well as ICD‐9 code for final diagnosis. We calculated the Mahalanobis distance between patients who received AMI‐OS (cases) and patients who did not received AMI‐OS (controls) using the same set of covariates. We matched each case to a single control within the same facility based on the nearest available Mahalanobis metric matching within calipers defied as the maximum width of 0.2 standard deviations of the logit of the estimated propensity score.[29, 35] We estimated the odds ratios for the binary dependent variables based on a conditional logistic regression model to account for the matched pairs design.[28] We used a generalized linear model with the log‐transformed LOS as the outcome to estimate the ratio of the LOS geometric mean of the cases to the controls. We calculated the relative risk for patients receiving AMI‐OS via the inverse probability weighting method by first defining a weight for each patient. [We assigned a weight of 1/psi to patients who received the AMI‐OS and a weight of 1/(1psi) to patients who did not receive the AMI‐OS, where psi denotes the propensity score for patient i]. We used a logistic regression model for the binary dependent variables with the same set of covariates described above to estimate the adjusted odds ratios while weighting each observation by its corresponding weight. Last, we used a weighted generalized linear model to estimate the AMI‐OS effect on the log‐transformed LOS.
RESULTS
Table 1 summarizes the characteristics of the 5879 patients. It shows that AMI‐OS patients were more likely to receive evidence‐based therapies for AMI (aspirin, ‐blockers, ACE inhibitors or ARBs, anticoagulation, and statins) and had a 46% lower mortality rate in hospital (3.51 % vs 6.52%) and 33% lower rate at 30 days (5.66% vs 8.48%). AMI‐OS patients were also found to be at lower risk for an adverse outcome than nonAMI‐OS patients. The AMI‐OS patients had lower peak troponin I values, severity of illness (lower Laboratory‐Based Acute Physiology Score, version 2 [LAPS2] scores), comorbidity burdens (lower Comorbidity Point Score, version 2 [COPS2] and Charlson scores), and global predicted mortality risk. AMI‐OS patients were also less likely to have required intensive care. AMI‐OS patients were at higher risk of death than nonAMI‐OS patients with respect to only 1 variable (being full code at the time of admission), but although this difference was statistically significant, it was of minor clinical impact (86% vs 88%).
| Patients Initially Managed Using | P Valuea | ||
|---|---|---|---|
| AMI Order Set, N=3,531b | A La Carte Orders, N=2,348b | ||
| |||
| Age, y, median (meanSD) | 70 (69.413.8) | 70 (69.213.8) | 0.5603 |
| Age (% >65 years) | 2,134 (60.4%) | 1,415 (60.3%) | 0.8949 |
| Sex (% male) | 2,202 (62.4%) | 1,451 (61.8%) | 0.6620 |
| STEMI (% with)c | 166 (4.7%) | 369 (15.7%) | <0.0001 |
| Troponin I (% missing) | 111 (3.1%) | 151 (6.4%) | <0.0001 |
| Troponin I median (meanSD) | 0.57 (3.08.2) | 0.27 (2.58.9) | 0.0651 |
| Charlson score median (meanSD)d | 2.0 (2.51.5) | 2.0 (2.71.6) | <0.0001 |
| COPS2, median (meanSD)e | 14.0 (29.831.7) | 17.0 (34.334.4) | <0.0001 |
| LAPS2, median (meanSD)e | 0.0 (35.643.5) | 27.0 (40.948.1) | <0.0001 |
| Length of stay in ED, h, median (meanSD) | 5.7 (5.93.0) | 5.7 (5.43.1) | <0.0001 |
| Patients receiving aspirin within 24 hoursf | 3,470 (98.3%) | 2,202 (93.8%) | <0.0001 |
| Patients receiving anticoagulation therapyf | 2,886 (81.7%) | 1,846 (78.6%) | 0.0032 |
| Patients receiving ‐blockersf | 3,196 (90.5%) | 1,926 (82.0%) | <0.0001 |
| Patients receiving ACE inhibitors or ARBsf | 2,395 (67.8%) | 1,244 (53.0%) | <0.0001 |
| Patients receiving statinsf | 3,337 (94.5%) | 1,975 (84.1%) | <0.0001 |
| Patient received 1 or more therapies | 3,531 (100.0%) | 2,330 (99.2%) | <0.0001 |
| Patient received 2 or more therapies | 3,521 (99.7%) | 2,266 (96.5%) | <0.0001 |
| Patient received 3 or more therapies | 3,440 (97.4%) | 2,085 (88.8%) | <0.0001 |
| Patient received 4 or more therapies | 3,015 (85.4%) | 1,646 (70.1%) | <0.0001 |
| Patient received all 5 therapies | 1,777 (50.3%) | 866 (35.9%) | <0.0001 |
| Predicted mortality risk, %, median, (meanSD)f | 0.86 (3.27.4) | 1.19 (4.810.8) | <0.0001 |
| Full code at time of hospital entry (%)g | 3,041 (86.1%) | 2,066 (88.0%) | 0.0379 |
| Admitted to ICU (%)i | |||
| Direct admit | 826 (23.4%) | 567 (24.2%) | 0.5047 |
| Unplanned transfer | 222 (6.3%) | 133 (5.7%) | 0.3262 |
| Ever | 1,283 (36.3%) | 1,169 (49.8%) | <0.0001 |
| Length of stay, h, median (meanSD) | 68.3 (109.4140.9) | 68.9 (113.8154.3) | 0.2615 |
| Inpatient mortality (%) | 124 (3.5%) | 153 (6.5%) | <0.0001 |
| 30‐day mortality (%) | 200 (5.7%) | 199 (8.5%) | <0.0001 |
| All‐cause rehospitalization within 30 days (%) | 576 (16.3%) | 401 (17.1%) | 0.4398 |
| Cardiac catheterization procedure referral timing | |||
| 1 day preadmission to discharge | 2,018 (57.2%) | 1,348 (57.4%) | 0.1638 |
| 2 days preadmission or earlier | 97 (2.8%) | 87 (3.7%) | |
| After discharge | 149 (4.2%) | 104 (4.4%) | |
| No referral | 1,267 (35.9%) | 809 (34.5%) | |
Table 2 shows the result of a logistic regression model in which the dependent variable was inpatient mortality and either the 5 evidence‐based therapies or the total number of evidence‐based therapies are the dependent variables. ‐blocker, statin, and ACE inhibitor or ARB therapies all had a protective effect on mortality, with odds ratios ranging from 0.48 (95% confidence interval [CI]: 0.36‐0.64), 0.63 (95% CI: 0.45‐0.89), and 0.40 (95% CI: 0.30‐0.53), respectively. An increased number of therapies also had a beneficial effect on inpatient mortality, with patients having 3 or more of the evidence‐based therapies showing an adjusted odds ratio (AOR) of 0.49 (95% CI: 0.33‐0.73), 4 or more therapies an AOR of 0.29 (95% CI: 0.20‐0.42), and 0.17 (95% CI: 0.11‐0.25) for 5 or more therapies.
| Multiple Therapies Effect | Individual Therapies Effect | |||
|---|---|---|---|---|
| Outcome | Death | Death | ||
| Number of outcomes | 277 | 277 | ||
| AORa | 95% CIb | AORa | 95% CIb | |
| ||||
| Age in years | ||||
| 1839 | Ref | Ref | ||
| 4064 | 1.02 | (0.147.73) | 1.01 | (0.137.66) |
| 6584 | 4.05 | (0.5529.72) | 3.89 | (0.5328.66) |
| 85+ | 4.99 | (0.6737.13) | 4.80 | (0.6435.84) |
| Sex | ||||
| Female | Ref | |||
| Male | 1.05 | (0.811.37) | 1.07 | (0.821.39) |
| STEMIc | ||||
| Absent | Ref | Ref | ||
| Present | 4.00 | (2.755.81) | 3.86 | (2.645.63) |
| Troponin I | ||||
| 0.1 ng/ml | Ref | Ref | ||
| >0.1 ng/ml | 1.01 | (0.721.42) | 1.02 | (0.731.43) |
| COPS2d (AOR per 10 points) | 1.05 | (1.011.08) | 1.04 | (1.011.08) |
| LAPS2d (AOR per 10 points) | 1.09 | (1.061.11) | 1.09 | (1.061.11) |
| ED LOSe (hours) | ||||
| <6 | Ref | Ref | ||
| 67 | 0.74 | (0.531.03) | 0.76 | (0.541.06) |
| >=12 | 0.82 | (0.391.74) | 0.83 | (0.391.78) |
| Code Statusf | ||||
| Full Code | Ref | |||
| Not Full Code | 1.08 | (0.781.49) | 1.09 | (0.791.51) |
| Cardiac procedure referral | ||||
| None during stay | Ref | |||
| 1 day pre adm until discharge | 0.40 | (0.290.54) | 0.39 | (0.280.53) |
| Number of therapies received | ||||
| 2 or less | Ref | |||
| 3 | 0.49 | (0.330.73) | ||
| 4 | 0.29 | (0.200.42) | ||
| 5 | 0.17 | (0.110.25) | ||
| Aspirin therapy | 0.80 | (0.491.32) | ||
| Anticoagulation therapy | 0.86 | (0.641.16) | ||
| Beta Blocker therapy | 0.48 | (0.360.64) | ||
| Statin therapy | 0.63 | (0.450.89) | ||
| ACE inhibitors or ARBs | 0.40 | (0.300.53) | ||
| C Statistic | 0.814 | 0.822 | ||
| Hosmer‐Lemeshow p value | 0.509 | 0.934 | ||
Table 3 shows that the use of the AMI‐OS is protective, with an AOR of 0.59 and a 95% CI of 0.45‐0.76. Table 3 also shows that the most potent predictors were comorbidity burden (AOR: 1.07, 95% CI: 1.03‐1.10 per 10 COPS2 points), severity of illness (AOR: 1.09, 95% CI: 1.07‐1.12 per 10 LAPS2 points), STEMI (AOR: 3.86, 95% CI: 2.68‐5.58), and timing of cardiac catheterization referral occurring immediately prior to or during the admission (AOR: 0.37, 95% CI: 0.27‐0.51). The statistical significance of the AMI‐OS effect disappears when both AMI‐OS and the individual therapies are included in the same model (see Supporting Information, Appendices 15, in the online version of this article).
| Outcome | Death | |
|---|---|---|
| Number of outcomes | 277 | |
| AORa | 95% CIb | |
| ||
| Age in years | ||
| 1839 | Ref | |
| 4064 | 1.16 | (0.158.78) |
| 6584 | 4.67 | (0.6334.46) |
| 85+ | 5.45 | (0.7340.86) |
| Sex | ||
| Female | Ref | |
| Male | 1.05 | (0.811.36) |
| STEMIc | ||
| Absent | Ref | |
| Present | 3.86 | (2.685.58) |
| Troponin I | ||
| 0.1 ng/ml | Ref | |
| >0.1 ng/ml | 1.16 | (0.831.62) |
| COPS2d (AOR per 10 points) | 1.07 | (1.031.10) |
| LAPS2d (AOR per 10 points) | 1.09 | (1.071.12) |
| ED LOSe (hours) | ||
| <6 | Ref | |
| 67 | 0.72 | (0.521.00) |
| >=12 | 0.70 | (0.331.48) |
| Code statusf | ||
| Full code | Ref | |
| Not full code | 1.22 | (0.891.68) |
| Cardiac procedure referral | ||
| None during stay | Ref | |
| 1 day pre adm until discharge | 0.37 | (0.270.51) |
| Order set employedg | ||
| No | Ref | |
| Yes | 0.59 | (0.450.76) |
| C Statistic | 0.792 | |
| Hosmer‐Lemeshow p value | 0.273 | |
Table 4 shows separately the average treatment effect (ATE) and average treatment effect for the treated (ATT) of AMI‐OS and of increasing number of therapies on other outcomes (30‐day mortality, LOS, and readmission). Both the ATE and ATT show that the use of the AMI‐OS was significantly protective with respect to mortality and total hospital LOS but not significant with respect to readmission. The effect of the number of therapies on mortality is significantly higher with increasing number of therapies. For example, patients who received 5 therapies had an average treatment effect on 30‐day inpatient mortality of 0.23 (95% CI: 0.15‐0.35) compared to 0.64 (95% CI: 0.43‐0.96) for 3 therapies, almost a 3‐fold difference. The effects of increasing number of therapies were not significant for LOS or readmission. A sensitivity analysis in which the 535 STEMI patients were removed showed essentially the same results, so it is not reported here.
| Outcome | Order Seta | 3 Therapiesb | 4 Therapiesb | 5 Therapiesb |
|---|---|---|---|---|
| ||||
| Average treatment effectc | ||||
| Inpatient mortality | 0.67 (0.520.86) | 0.64 (0.430.96) | 0.37 (0.250.54) | 0.23 (0.150.35) |
| 30‐day mortality | 0.77 (0.620.96) | 0.68 (0.480.98) | 0.34 (0.240.48) | 0.26 (0.180.37) |
| Readmission | 1.03 (0.901.19) | 1.20 (0.871.66) | 1.19 (0.881.60) | 1.30 (0.961.76) |
| LOS, ratio of the geometric means | 0.91 (0.870.95) | 1.16 (1.031.30) | 1.17 (1.051.30) | 1.12 (1.001.24) |
| Average treatment effect on the treatedd | ||||
| Inpatient mortality | 0.69 (0.520.92) | 0.35 (0.130.93) | 0.17 (0.070.43) | 0.08 (0.030.20) |
| 30‐day mortality | 0.84 (0.661.06) | 0.35 (0.150.79) | 0.17 (0.070.37) | 0.09 (0.040.20) |
| Readmission | 1.02 (0.871.20) | 1.39 (0.852.26) | 1.36 (0.882.12) | 1.23 (0.801.89) |
| LOS, ratio of the geometric meanse | 0.92 (0.870.97) | 1.18 (1.021.37) | 1.16 (1.011.33) | 1.04 (0.911.19) |
To further elucidate possible reasons why physicians did not use the AMI‐OS, the lead author reviewed 105 randomly selected records where the AMI‐OS was not used, 5 records from each of the 21 study hospitals. This review found that in 36% of patients, the AMI‐OS was not used because emergent catheterization or transfer to a facility with percutaneous coronary intervention capability occurred. Presence of other significant medical conditions, including critical illness, was the reason in 17% of these cases, patient or family refusal of treatments in 8%, issues around end‐of‐life care in 3%, and specific medical contraindications in 1%. In the remaining 34%, no reason for not using the AMI‐OS could be identified.
DISCUSSION
We evaluated the use of an evidence‐based electronic AMI‐OS embedded in a comprehensive EMR and found that it was beneficial. Its use was associated with increased adherence to evidence‐based therapies, which in turn were associated with improved outcomes. Using data from a large cohort of hospitalized AMI patients in 21 community hospitals, we were able to use risk adjustment that included physiologic illness severity to adjust for baseline mortality risk. Patients in whom the AMI‐OS was employed tended to be at lower risk; nonetheless, after controlling for confounding variables and adjusting for bias using propensity scores, the AMI‐OS was associated with increased use of evidence‐based therapies and decreased mortality. Most importantly, it appears that the benefits of the OS were not just due to increased receipt of individual recommended therapies, but to increased concurrent receipt of multiple recommended therapies.
Modern EMRs have great potential for significant improvements in the quality, efficiency, and safety of care provided,[36] and our study highlights this potential. However, a number of important limitations to our study must be considered. Although we had access to a very rich dataset, we could not control for all possible confounders, and our risk adjustment cannot match the level of information available to clinicians. In particular, the measurements available to us with respect to cardiac risk are limited. Thus, we have to recognize that the strength of our findings does not approximate that of a randomized trial, and one would expect that the magnitude of the beneficial association would fall under more controlled conditions. Resource limitations also did not permit us to gather more time course data (eg, sequential measurements of patient instability, cardiac damage, or use of recommended therapies), which could provide a better delineation of differences in both processes and outcomes.
Limitations also exist to the generalizability of the use of order sets in other settings that go beyond the availability of a comprehensive EMR. Our study population was cared for in a setting with an unusually high level of integration.[1] For example, KPNC has an elaborate administrative infrastructure for training in the use of the EMR as well as ensuring that order sets are not just evidence‐based, but that they are perceived by clinicians to be of significant value. This infrastructure, established to ensure physician buy‐in, may not be easy to replicate in smaller or less‐integrated settings. Thus, it is conceivable that factors other than the degree of support during the EMR deployments can affect rates of order set use.
Although our use of counterfactual methods included illness severity (LAPS2) and longitudinal comorbidity burden (COPS2), which are not yet available outside highly integrated delivery services employing comprehensive EMRs, it is possible they are insufficient. We cannot exclude the possibility that other biases or patient characteristics were present that led clinicians to preferentially employ the electronic order set in some patients but not in others. One could also argue that future studies should consider using overall adherence to recommended AMI treatment guidelines as a risk adjustment tool that would permit one to analyze what other factors may be playing a role in residual differences in patient outcomes. Last, one could object to our inclusion of STEMI patients; however, this was not a study on optimum treatment strategies for STEMI patients. Rather, it was a study on the impact on AMI outcomes of a specific component of computerized order entry outside the research setting.
Despite these limitations, we believe that our findings provide strong support for the continued use of electronic evidence‐based order sets in the inpatient medical setting. Once the initial implementation of a comprehensive EMR has occurred, deployment of these electronic order sets is a relatively inexpensive but effective method to foster compliance with evidence‐based care.
Future research in healthcare information technology can take a number of directions. One important area, of course, revolves around ways to promote enhanced physician adoption of EMRs. Our audit of records where the AMI‐OS was not used found that specific reasons for not using the order set (eg, treatment refusals, emergent intervention) were present in two‐thirds of the cases. This suggests that future analyses of adherence involving EMRs and CPOE implementation should take a more nuanced look at how order entry is actually enabled. It may be that understanding how order sets affect care enhances clinician acceptance and thus could serve as an incentive to EMR adoption. However, once an EMR is adopted, a need exists to continue evaluations such as this because, ultimately, the gold standard should be improved patient care processes and better outcomes for patients.
Acknowledgement
The authors give special thanks to Dr. Brian Hoberman for sponsoring this work, Dr. Alan S. Go for providing assistance with obtaining copies of electrocardiograms for review, Drs. Tracy Lieu and Vincent Liu for reviewing the manuscript, and Ms. Rachel Lesser for formatting the manuscript.
Disclosures: This work was supported by The Permanente Medical Group, Inc. and Kaiser Foundation Hospitals, Inc. The algorithms used to extract data and perform risk adjustment were developed with funding from the Sidney Garfield Memorial Fund (Early Detection of Impending Physiologic Deterioration in Hospitalized Patients, 1159518), the Agency for Healthcare Quality and Research (Rapid Clinical Snapshots From the EMR Among Pneumonia Patients, 1R01HS018480‐01), and the Gordon and Betty Moore Foundation (Early Detection of Impending Physiologic Deterioration: Electronic Early Warning System).
- , , , , , . Population trends in the incidence and outcomes of acute myocardial infarction. N Engl J Med. 2010;362(23):2155–2165.
- , , , et al. Twenty‐two‐year trends in incidence of myocardial infarction, coronary heart disease mortality, and case fatality in 4 US communities, 1987–2008. Circulation. 2012;125(15):1848–1857.
- , , , et al. Heart disease and stroke statistics—2012 update: a report from the American Heart Association. Circulation. 2012;125(1):e2–e220.
- , , , et al. ACC/AHA 2007 guidelines for the management of patients with unstable angina/non‐ST‐Elevation myocardial infarction: a report of the American College of Cardiology/American Heart Association Task Force on Practice Guidelines (Writing Committee to Revise the 2002 Guidelines for the Management of Patients With Unstable Angina/Non‐ST‐Elevation Myocardial Infarction) developed in collaboration with the American College of Emergency Physicians, the Society for Cardiovascular Angiography and Interventions, and the Society of Thoracic Surgeons endorsed by the American Association of Cardiovascular and Pulmonary Rehabilitation and the Society for Academic Emergency Medicine. J Am Coll Cardiol. 2007;50(7):e1–e157.
- , , , et al. 2007 focused update of the ACC/AHA 2004 guidelines for the management of patients with ST‐elevation myocardial infarction: a report of the American College of Cardiology/American Heart Association Task Force on Practice Guidelines. J Am Coll Cardiol. 2008;51(2):210–247.
- , , , , , . Association between adoption of evidence‐based treatment and survival for patients with ST‐elevation myocardial infarction. JAMA. 2011;305(16):1677–1684.
- , , , et al. Association of changes in clinical characteristics and management with improvement in survival among patients with ST‐elevation myocardial infarction. JAMA. 2012;308(10):998–1006.
- , , , et al. Changes in myocardial infarction guideline adherence as a function of patient risk: an end to paradoxical care? J Am Coll Cardiol. 2011;58(17):1760–1765.
- , , , . Care in U.S. hospitals—the Hospital Quality Alliance program. N Engl J Med. 2005;353(3):265–274.
- , , et al. Challenges in the treatment of NSTEMI patients at high risk for both ischemic and bleeding events: insights from the ACTION Registry‐GWTG. J Am Coll Cardiol. 2011;57:E913–E913.
- , , , , . Quality of care in U.S. hospitals as reflected by standardized measures, 2002–2004. N Engl J Med. 2005;353(3):255–264.
- , , . Guideline‐based standardized care is associated with substantially lower mortality in medicare patients with acute myocardial infarction. J Am Coll Cardiol. 2005;46(7):1242–1248.
- , , , et al. Impact of a standardized heart failure order set on mortality, readmission, and quality and costs of care. Int J Qual Health Care. 2010;22(6):437–444.
- . Linking automated databases for research in managed care settings. Ann Intern Med. 1997;127(8 pt 2):719–724.
- , , , , , . Risk adjusting hospital inpatient mortality using automated inpatient, outpatient, and laboratory databases. Med Care. 2008;46(3):232–239.
- , , , . Length of stay predictions: improvements through the use of automated laboratory and comorbidity variables. Med Care. 2010;48(8):739–744.
- , , , , , . Intra‐hospital transfers to a higher level of care: contribution to total hospital and intensive care unit (ICU) mortality and length of stay (LOS). J Hosp Med. 2011;6(2):74–80.
- , , , . Adverse outcomes associated with delayed intensive care unit transfers in an integrated healthcare system. J Hosp Med. 2012;7(3):224–230.
- International Classification of Diseases, 9th Revision‐Clinical Modification. 4th ed. 3 Vols. Los Angeles, CA: Practice Management Information Corporation; 2006.
- , , , et al. Anticoagulation therapy for stroke prevention in atrial fibrillation: how well do randomized trials translate into clinical practice? JAMA. 2003;290(20):2685–2692.
- , , , , , . Early detection of impending physiologic deterioration among patients who are not in intensive care: development of predictive models using data from an automated electronic medical record. J Hosp Med. 2012;7(5):388–395.
- , , , , . Risk‐adjusting hospital mortality using a comprehensive electronic record in an integrated healthcare delivery system. Med Care. 2013;51(5):446–453.
- , , . Effect of choice of estimation method on inter‐hospital mortality rate comparisons. Med Care. 2010;48(5):456–485.
- , , , . The Kaiser Permanente inpatient risk adjustment methodology was valid in an external patient population. J Clin Epidemiol. 2010;63(7):798–803.
- , , , , . Derivation and validation of a model to predict daily risk of death in hospital. Med Care. 2011;49(8):734–743.
- , , . Adapting a clinical comorbidity index for use with ICD‐9‐CM administrative databases. J Clin Epidemiol. 1992;45(6):613–619.
- . Introduction to Statistical Mediation Analysis. New York, NY: Lawrence Erlbaum Associates; 2008.
- . Nonparametric estimation of average treatment effects under exogenity: a review. Rev Econ Stat. 2004;86:25.
- . Design of Observational Studies. New York, NY: Springer Science+Business Media; 2010.
- . Balance diagnostics for comparing the distribution of baseline covariates between treatment groups in propensity‐score matched samples. Stat Med. 2009;28:24.
- , , . Estimation of regression coefficients when some regressors are not always observed. J Am Stat Assoc. 1994(89):846–866.
- , . Stratification and weighting via the propensity score in estimation of causal treatment effects: a comparative study. Stat Med. 2004;23(19):2937–2960.
- . Discussing hidden bias in observational studies. Ann Intern Med. 1991;115(11):901–905.
- . Propensity score methods for bias reduction in the comparison of a treatment to a non‐randomized control group. Stat Med. 1998;17(19):2265–2281.
- , , . A method/macro based on propensity score and Mahalanobis distance to reduce bias in treatment comparison in observational study, 2005. www.lexjansen.com/pharmasug/2006/publichealthresearch/pr05.pdf. Accessed on September 14, 2013.
- . Using health information technology to improve health care. Arch Intern Med. 2012;172(22):1728–1730.
Although the prevalence of coronary heart disease and death from acute myocardial infarction (AMI) have declined steadily, about 935,000 heart attacks still occur annually in the United States, with approximately one‐third of these being fatal.[1, 2, 3] Studies have demonstrated decreased 30‐day and longer‐term mortality in AMI patients who receive evidence‐based treatment, including aspirin, ‐blockers, angiotensin‐converting enzyme (ACE) inhibitors or angiotensin receptor blockers (ARBs), anticoagulation therapy, and statins.[4, 5, 6, 7] Despite clinical practice guidelines (CPGs) outlining evidence‐based care and considerable efforts to implement processes that improve patient outcomes, delivery of effective therapy remains suboptimal.[8] For example, the Hospital Quality Alliance Program[9] found that in AMI patients, use of aspirin on admission was only 81% to 92%, ‐blocker on admission 75% to 85%, and ACE inhibitors for left ventricular dysfunction 71% to 74%.
Efforts to increase adherence to CPGs and improve patient outcomes in AMI have resulted in variable degrees of success. They include promotion of CPGs,[4, 5, 6, 7] physician education with feedback, report cards, care paths, registries,[10] Joint Commission standardized measures,[11] and paper checklists or order sets (OS).[12, 13]
In this report, we describe the association between use of an evidence‐based, electronic OS for AMI (AMI‐OS) and better adherence to CPGs. This AMI‐OS was implemented in the inpatient electronic medical records (EMRs) of a large integrated healthcare delivery system, Kaiser Permanente Northern California (KPNC). The purpose of our investigation was to determine (1) whether use of the AMI‐OS was associated with improved AMI processes and patient outcomes, and (2) whether these associations persisted after risk adjustment using a comprehensive severity of illness scoring system.
MATERIALS AND METHODS
This project was approved by the KPNC institutional review board.
Under a mutual exclusivity arrangement, salaried physicians of The Permanente Medical Group, Inc., care for 3.4 million Kaiser Foundation Health Plan, Inc. members at facilities owned by Kaiser Foundation Hospitals, Inc. All KPNC facilities employ the same information systems with a common medical record number and can track care covered by the plan but delivered elsewhere.[14] Our setting consisted of 21 KPNC hospitals described in previous reports,[15, 16, 17, 18] using the same commercially available EMR system that includes computerized physician order entry (CPOE). Deployment of the customized inpatient Epic EMR (
In this EMR's CPOE, physicians have options to select individual orders (a la carte) or they can utilize an OS, which is a collection of the most appropriate orders associated with specific diagnoses, procedures, or treatments. The evidence‐based AMI‐OS studied in this project was developed by a multidisciplinary team (for detailed components see Supporting Appendix 1Appendix 5 in the online version of this article).
Our study focused on the first set of hospital admission orders for patients with AMI. The study sample consisted of patients meeting these criteria: (1) age 18 years at admission; (2) admitted to a KPNC hospital for an overnight stay between September 28, 2008 and December 31, 2010; (3) principal diagnosis was AMI (International Classification of Diseases, 9th Revision [ICD‐9][19] codes 410.00, 01, 10, 11, 20, 21, 30, 31, 40, 41, 50, 51, 60, 61, 70, 71, 80, 90, and 91); and (4) KPHC had been operational at the hospital for at least 3 months to be included (for assembly descriptions see Supporting Appendices 15 in the online version of this article). At the study hospitals, troponin I was measured using the Beckman Access AccuTnI assay (Beckman Coulter, Inc., Brea, CA), whose upper reference limit (99th percentile) is 0.04 ng/mL. We excluded patients initially hospitalized for AMI at a non‐KPNC site and transferred into a study hospital.
The data processing methods we employed have been detailed elsewhere.[14, 15, 17, 20, 21, 22] The dependent outcome variables were total hospital length of stay, inpatient mortality, 30‐day mortality, and all‐cause rehospitalization within 30 days of discharge. Linked state mortality data were unavailable for the entire study period, so we ascertained 30‐day mortality based on the combination of KPNC patient demographic data and publicly available Social Security Administration decedent files. We ascertained rehospitalization by scanning KPNC hospitalization databases, which also track out‐of‐plan use.
The dependent process variables were use of aspirin within 24 hours of admission, ‐blockers, anticoagulation, ACE inhibitors or ARBs, and statins. The primary independent variable of interest was whether or not the admitting physician employed the AMI‐OS when admission orders were entered. Consequently, this variable is dichotomous (AMI‐OS vs a la carte).
We controlled for acute illness severity and chronic illness burden using a recent modification[22] of an externally validated risk‐adjustment system applicable to all hospitalized patients.[15, 16, 23, 24, 25] Our methodology included vital signs, neurological status checks, and laboratory test results obtained in the 72 hours preceding hospital admission; comorbidities were captured longitudinally using data from the year preceding hospitalization (for comparison purposes, we also assigned a Charlson Comorbidity Index score[26]).
End‐of‐life care directives are mandatory on admission at KPNC hospitals. Physicians have 4 options: full code, partial code, do not resuscitate, and comfort care only. Because of small numbers in some categories, we collapsed these 4 categories into full code and not full code. Because patients' care directives may change, we elected to capture the care directive in effect when a patient first entered a hospital unit other than the emergency department (ED).
Two authors (M.B., P.C.L.), one of whom is a board‐certified cardiologist, reviewed all admission electrocardiograms and made a consensus determination as to whether or not criteria for ST‐segment elevation myocardial infarction (STEMI) were present (ie, new ST‐segment elevation or left bundle branch block); we also reviewed the records of all patients with missing troponin I data to confirm the AMI diagnosis.
Statistical Methods
We performed unadjusted comparisons between AMI‐OS and nonAMI‐OS patients using the t test or the [2] test, as appropriate.
We hypothesized that the AMI‐OS plays a mediating role on patient outcomes through its effect on adherence to recommended treatment. We evaluated this hypothesis for inpatient mortality by first fitting a multivariable logistic regression model for inpatient mortality as the outcome and either the 5 evidence‐based therapies or the total number of evidence‐based therapies used (ranging from 02, 3, 4, or 5) as the dependent variable controlling for age, gender, presence of STEMI, troponin I, comorbidities, illness severity, ED length of stay (LOS), care directive status, and timing of cardiac catheterization referral as covariates to confirm the protective effect of these therapies on mortality. We then used the same model to estimate the effect of AMI‐OS on inpatient mortality, substituting the therapies with AMI‐OS as the dependent variable and using the same covariates. Last, we included both the therapies and the AMI‐OS in the model to evaluate their combined effects.[27]
We used 2 different methods to estimate the effects of AMI‐OS and number of therapies provided on the outcomes while adjusting for observed baseline differences between the 2 groups of patients: propensity risk score matching, which estimates the average treatment effect for the treated,[28, 29] and inverse probability of treatment weighting, which is used to estimate the average treatment effect.[30, 31, 32] The propensity score was defined as the probability of receiving the intervention for a patient with specific predictive factors.[33, 34] We computed a propensity score for each patient by using logistic regression, with the dependent variable being receipt of AMI‐OS and the independent variables being the covariates used for the multivariate logistic regression as well as ICD‐9 code for final diagnosis. We calculated the Mahalanobis distance between patients who received AMI‐OS (cases) and patients who did not received AMI‐OS (controls) using the same set of covariates. We matched each case to a single control within the same facility based on the nearest available Mahalanobis metric matching within calipers defied as the maximum width of 0.2 standard deviations of the logit of the estimated propensity score.[29, 35] We estimated the odds ratios for the binary dependent variables based on a conditional logistic regression model to account for the matched pairs design.[28] We used a generalized linear model with the log‐transformed LOS as the outcome to estimate the ratio of the LOS geometric mean of the cases to the controls. We calculated the relative risk for patients receiving AMI‐OS via the inverse probability weighting method by first defining a weight for each patient. [We assigned a weight of 1/psi to patients who received the AMI‐OS and a weight of 1/(1psi) to patients who did not receive the AMI‐OS, where psi denotes the propensity score for patient i]. We used a logistic regression model for the binary dependent variables with the same set of covariates described above to estimate the adjusted odds ratios while weighting each observation by its corresponding weight. Last, we used a weighted generalized linear model to estimate the AMI‐OS effect on the log‐transformed LOS.
RESULTS
Table 1 summarizes the characteristics of the 5879 patients. It shows that AMI‐OS patients were more likely to receive evidence‐based therapies for AMI (aspirin, ‐blockers, ACE inhibitors or ARBs, anticoagulation, and statins) and had a 46% lower mortality rate in hospital (3.51 % vs 6.52%) and 33% lower rate at 30 days (5.66% vs 8.48%). AMI‐OS patients were also found to be at lower risk for an adverse outcome than nonAMI‐OS patients. The AMI‐OS patients had lower peak troponin I values, severity of illness (lower Laboratory‐Based Acute Physiology Score, version 2 [LAPS2] scores), comorbidity burdens (lower Comorbidity Point Score, version 2 [COPS2] and Charlson scores), and global predicted mortality risk. AMI‐OS patients were also less likely to have required intensive care. AMI‐OS patients were at higher risk of death than nonAMI‐OS patients with respect to only 1 variable (being full code at the time of admission), but although this difference was statistically significant, it was of minor clinical impact (86% vs 88%).
| Patients Initially Managed Using | P Valuea | ||
|---|---|---|---|
| AMI Order Set, N=3,531b | A La Carte Orders, N=2,348b | ||
| |||
| Age, y, median (meanSD) | 70 (69.413.8) | 70 (69.213.8) | 0.5603 |
| Age (% >65 years) | 2,134 (60.4%) | 1,415 (60.3%) | 0.8949 |
| Sex (% male) | 2,202 (62.4%) | 1,451 (61.8%) | 0.6620 |
| STEMI (% with)c | 166 (4.7%) | 369 (15.7%) | <0.0001 |
| Troponin I (% missing) | 111 (3.1%) | 151 (6.4%) | <0.0001 |
| Troponin I median (meanSD) | 0.57 (3.08.2) | 0.27 (2.58.9) | 0.0651 |
| Charlson score median (meanSD)d | 2.0 (2.51.5) | 2.0 (2.71.6) | <0.0001 |
| COPS2, median (meanSD)e | 14.0 (29.831.7) | 17.0 (34.334.4) | <0.0001 |
| LAPS2, median (meanSD)e | 0.0 (35.643.5) | 27.0 (40.948.1) | <0.0001 |
| Length of stay in ED, h, median (meanSD) | 5.7 (5.93.0) | 5.7 (5.43.1) | <0.0001 |
| Patients receiving aspirin within 24 hoursf | 3,470 (98.3%) | 2,202 (93.8%) | <0.0001 |
| Patients receiving anticoagulation therapyf | 2,886 (81.7%) | 1,846 (78.6%) | 0.0032 |
| Patients receiving ‐blockersf | 3,196 (90.5%) | 1,926 (82.0%) | <0.0001 |
| Patients receiving ACE inhibitors or ARBsf | 2,395 (67.8%) | 1,244 (53.0%) | <0.0001 |
| Patients receiving statinsf | 3,337 (94.5%) | 1,975 (84.1%) | <0.0001 |
| Patient received 1 or more therapies | 3,531 (100.0%) | 2,330 (99.2%) | <0.0001 |
| Patient received 2 or more therapies | 3,521 (99.7%) | 2,266 (96.5%) | <0.0001 |
| Patient received 3 or more therapies | 3,440 (97.4%) | 2,085 (88.8%) | <0.0001 |
| Patient received 4 or more therapies | 3,015 (85.4%) | 1,646 (70.1%) | <0.0001 |
| Patient received all 5 therapies | 1,777 (50.3%) | 866 (35.9%) | <0.0001 |
| Predicted mortality risk, %, median, (meanSD)f | 0.86 (3.27.4) | 1.19 (4.810.8) | <0.0001 |
| Full code at time of hospital entry (%)g | 3,041 (86.1%) | 2,066 (88.0%) | 0.0379 |
| Admitted to ICU (%)i | |||
| Direct admit | 826 (23.4%) | 567 (24.2%) | 0.5047 |
| Unplanned transfer | 222 (6.3%) | 133 (5.7%) | 0.3262 |
| Ever | 1,283 (36.3%) | 1,169 (49.8%) | <0.0001 |
| Length of stay, h, median (meanSD) | 68.3 (109.4140.9) | 68.9 (113.8154.3) | 0.2615 |
| Inpatient mortality (%) | 124 (3.5%) | 153 (6.5%) | <0.0001 |
| 30‐day mortality (%) | 200 (5.7%) | 199 (8.5%) | <0.0001 |
| All‐cause rehospitalization within 30 days (%) | 576 (16.3%) | 401 (17.1%) | 0.4398 |
| Cardiac catheterization procedure referral timing | |||
| 1 day preadmission to discharge | 2,018 (57.2%) | 1,348 (57.4%) | 0.1638 |
| 2 days preadmission or earlier | 97 (2.8%) | 87 (3.7%) | |
| After discharge | 149 (4.2%) | 104 (4.4%) | |
| No referral | 1,267 (35.9%) | 809 (34.5%) | |
Table 2 shows the result of a logistic regression model in which the dependent variable was inpatient mortality and either the 5 evidence‐based therapies or the total number of evidence‐based therapies are the dependent variables. ‐blocker, statin, and ACE inhibitor or ARB therapies all had a protective effect on mortality, with odds ratios ranging from 0.48 (95% confidence interval [CI]: 0.36‐0.64), 0.63 (95% CI: 0.45‐0.89), and 0.40 (95% CI: 0.30‐0.53), respectively. An increased number of therapies also had a beneficial effect on inpatient mortality, with patients having 3 or more of the evidence‐based therapies showing an adjusted odds ratio (AOR) of 0.49 (95% CI: 0.33‐0.73), 4 or more therapies an AOR of 0.29 (95% CI: 0.20‐0.42), and 0.17 (95% CI: 0.11‐0.25) for 5 or more therapies.
| Multiple Therapies Effect | Individual Therapies Effect | |||
|---|---|---|---|---|
| Outcome | Death | Death | ||
| Number of outcomes | 277 | 277 | ||
| AORa | 95% CIb | AORa | 95% CIb | |
| ||||
| Age in years | ||||
| 1839 | Ref | Ref | ||
| 4064 | 1.02 | (0.147.73) | 1.01 | (0.137.66) |
| 6584 | 4.05 | (0.5529.72) | 3.89 | (0.5328.66) |
| 85+ | 4.99 | (0.6737.13) | 4.80 | (0.6435.84) |
| Sex | ||||
| Female | Ref | |||
| Male | 1.05 | (0.811.37) | 1.07 | (0.821.39) |
| STEMIc | ||||
| Absent | Ref | Ref | ||
| Present | 4.00 | (2.755.81) | 3.86 | (2.645.63) |
| Troponin I | ||||
| 0.1 ng/ml | Ref | Ref | ||
| >0.1 ng/ml | 1.01 | (0.721.42) | 1.02 | (0.731.43) |
| COPS2d (AOR per 10 points) | 1.05 | (1.011.08) | 1.04 | (1.011.08) |
| LAPS2d (AOR per 10 points) | 1.09 | (1.061.11) | 1.09 | (1.061.11) |
| ED LOSe (hours) | ||||
| <6 | Ref | Ref | ||
| 67 | 0.74 | (0.531.03) | 0.76 | (0.541.06) |
| >=12 | 0.82 | (0.391.74) | 0.83 | (0.391.78) |
| Code Statusf | ||||
| Full Code | Ref | |||
| Not Full Code | 1.08 | (0.781.49) | 1.09 | (0.791.51) |
| Cardiac procedure referral | ||||
| None during stay | Ref | |||
| 1 day pre adm until discharge | 0.40 | (0.290.54) | 0.39 | (0.280.53) |
| Number of therapies received | ||||
| 2 or less | Ref | |||
| 3 | 0.49 | (0.330.73) | ||
| 4 | 0.29 | (0.200.42) | ||
| 5 | 0.17 | (0.110.25) | ||
| Aspirin therapy | 0.80 | (0.491.32) | ||
| Anticoagulation therapy | 0.86 | (0.641.16) | ||
| Beta Blocker therapy | 0.48 | (0.360.64) | ||
| Statin therapy | 0.63 | (0.450.89) | ||
| ACE inhibitors or ARBs | 0.40 | (0.300.53) | ||
| C Statistic | 0.814 | 0.822 | ||
| Hosmer‐Lemeshow p value | 0.509 | 0.934 | ||
Table 3 shows that the use of the AMI‐OS is protective, with an AOR of 0.59 and a 95% CI of 0.45‐0.76. Table 3 also shows that the most potent predictors were comorbidity burden (AOR: 1.07, 95% CI: 1.03‐1.10 per 10 COPS2 points), severity of illness (AOR: 1.09, 95% CI: 1.07‐1.12 per 10 LAPS2 points), STEMI (AOR: 3.86, 95% CI: 2.68‐5.58), and timing of cardiac catheterization referral occurring immediately prior to or during the admission (AOR: 0.37, 95% CI: 0.27‐0.51). The statistical significance of the AMI‐OS effect disappears when both AMI‐OS and the individual therapies are included in the same model (see Supporting Information, Appendices 15, in the online version of this article).
| Outcome | Death | |
|---|---|---|
| Number of outcomes | 277 | |
| AORa | 95% CIb | |
| ||
| Age in years | ||
| 1839 | Ref | |
| 4064 | 1.16 | (0.158.78) |
| 6584 | 4.67 | (0.6334.46) |
| 85+ | 5.45 | (0.7340.86) |
| Sex | ||
| Female | Ref | |
| Male | 1.05 | (0.811.36) |
| STEMIc | ||
| Absent | Ref | |
| Present | 3.86 | (2.685.58) |
| Troponin I | ||
| 0.1 ng/ml | Ref | |
| >0.1 ng/ml | 1.16 | (0.831.62) |
| COPS2d (AOR per 10 points) | 1.07 | (1.031.10) |
| LAPS2d (AOR per 10 points) | 1.09 | (1.071.12) |
| ED LOSe (hours) | ||
| <6 | Ref | |
| 67 | 0.72 | (0.521.00) |
| >=12 | 0.70 | (0.331.48) |
| Code statusf | ||
| Full code | Ref | |
| Not full code | 1.22 | (0.891.68) |
| Cardiac procedure referral | ||
| None during stay | Ref | |
| 1 day pre adm until discharge | 0.37 | (0.270.51) |
| Order set employedg | ||
| No | Ref | |
| Yes | 0.59 | (0.450.76) |
| C Statistic | 0.792 | |
| Hosmer‐Lemeshow p value | 0.273 | |
Table 4 shows separately the average treatment effect (ATE) and average treatment effect for the treated (ATT) of AMI‐OS and of increasing number of therapies on other outcomes (30‐day mortality, LOS, and readmission). Both the ATE and ATT show that the use of the AMI‐OS was significantly protective with respect to mortality and total hospital LOS but not significant with respect to readmission. The effect of the number of therapies on mortality is significantly higher with increasing number of therapies. For example, patients who received 5 therapies had an average treatment effect on 30‐day inpatient mortality of 0.23 (95% CI: 0.15‐0.35) compared to 0.64 (95% CI: 0.43‐0.96) for 3 therapies, almost a 3‐fold difference. The effects of increasing number of therapies were not significant for LOS or readmission. A sensitivity analysis in which the 535 STEMI patients were removed showed essentially the same results, so it is not reported here.
| Outcome | Order Seta | 3 Therapiesb | 4 Therapiesb | 5 Therapiesb |
|---|---|---|---|---|
| ||||
| Average treatment effectc | ||||
| Inpatient mortality | 0.67 (0.520.86) | 0.64 (0.430.96) | 0.37 (0.250.54) | 0.23 (0.150.35) |
| 30‐day mortality | 0.77 (0.620.96) | 0.68 (0.480.98) | 0.34 (0.240.48) | 0.26 (0.180.37) |
| Readmission | 1.03 (0.901.19) | 1.20 (0.871.66) | 1.19 (0.881.60) | 1.30 (0.961.76) |
| LOS, ratio of the geometric means | 0.91 (0.870.95) | 1.16 (1.031.30) | 1.17 (1.051.30) | 1.12 (1.001.24) |
| Average treatment effect on the treatedd | ||||
| Inpatient mortality | 0.69 (0.520.92) | 0.35 (0.130.93) | 0.17 (0.070.43) | 0.08 (0.030.20) |
| 30‐day mortality | 0.84 (0.661.06) | 0.35 (0.150.79) | 0.17 (0.070.37) | 0.09 (0.040.20) |
| Readmission | 1.02 (0.871.20) | 1.39 (0.852.26) | 1.36 (0.882.12) | 1.23 (0.801.89) |
| LOS, ratio of the geometric meanse | 0.92 (0.870.97) | 1.18 (1.021.37) | 1.16 (1.011.33) | 1.04 (0.911.19) |
To further elucidate possible reasons why physicians did not use the AMI‐OS, the lead author reviewed 105 randomly selected records where the AMI‐OS was not used, 5 records from each of the 21 study hospitals. This review found that in 36% of patients, the AMI‐OS was not used because emergent catheterization or transfer to a facility with percutaneous coronary intervention capability occurred. Presence of other significant medical conditions, including critical illness, was the reason in 17% of these cases, patient or family refusal of treatments in 8%, issues around end‐of‐life care in 3%, and specific medical contraindications in 1%. In the remaining 34%, no reason for not using the AMI‐OS could be identified.
DISCUSSION
We evaluated the use of an evidence‐based electronic AMI‐OS embedded in a comprehensive EMR and found that it was beneficial. Its use was associated with increased adherence to evidence‐based therapies, which in turn were associated with improved outcomes. Using data from a large cohort of hospitalized AMI patients in 21 community hospitals, we were able to use risk adjustment that included physiologic illness severity to adjust for baseline mortality risk. Patients in whom the AMI‐OS was employed tended to be at lower risk; nonetheless, after controlling for confounding variables and adjusting for bias using propensity scores, the AMI‐OS was associated with increased use of evidence‐based therapies and decreased mortality. Most importantly, it appears that the benefits of the OS were not just due to increased receipt of individual recommended therapies, but to increased concurrent receipt of multiple recommended therapies.
Modern EMRs have great potential for significant improvements in the quality, efficiency, and safety of care provided,[36] and our study highlights this potential. However, a number of important limitations to our study must be considered. Although we had access to a very rich dataset, we could not control for all possible confounders, and our risk adjustment cannot match the level of information available to clinicians. In particular, the measurements available to us with respect to cardiac risk are limited. Thus, we have to recognize that the strength of our findings does not approximate that of a randomized trial, and one would expect that the magnitude of the beneficial association would fall under more controlled conditions. Resource limitations also did not permit us to gather more time course data (eg, sequential measurements of patient instability, cardiac damage, or use of recommended therapies), which could provide a better delineation of differences in both processes and outcomes.
Limitations also exist to the generalizability of the use of order sets in other settings that go beyond the availability of a comprehensive EMR. Our study population was cared for in a setting with an unusually high level of integration.[1] For example, KPNC has an elaborate administrative infrastructure for training in the use of the EMR as well as ensuring that order sets are not just evidence‐based, but that they are perceived by clinicians to be of significant value. This infrastructure, established to ensure physician buy‐in, may not be easy to replicate in smaller or less‐integrated settings. Thus, it is conceivable that factors other than the degree of support during the EMR deployments can affect rates of order set use.
Although our use of counterfactual methods included illness severity (LAPS2) and longitudinal comorbidity burden (COPS2), which are not yet available outside highly integrated delivery services employing comprehensive EMRs, it is possible they are insufficient. We cannot exclude the possibility that other biases or patient characteristics were present that led clinicians to preferentially employ the electronic order set in some patients but not in others. One could also argue that future studies should consider using overall adherence to recommended AMI treatment guidelines as a risk adjustment tool that would permit one to analyze what other factors may be playing a role in residual differences in patient outcomes. Last, one could object to our inclusion of STEMI patients; however, this was not a study on optimum treatment strategies for STEMI patients. Rather, it was a study on the impact on AMI outcomes of a specific component of computerized order entry outside the research setting.
Despite these limitations, we believe that our findings provide strong support for the continued use of electronic evidence‐based order sets in the inpatient medical setting. Once the initial implementation of a comprehensive EMR has occurred, deployment of these electronic order sets is a relatively inexpensive but effective method to foster compliance with evidence‐based care.
Future research in healthcare information technology can take a number of directions. One important area, of course, revolves around ways to promote enhanced physician adoption of EMRs. Our audit of records where the AMI‐OS was not used found that specific reasons for not using the order set (eg, treatment refusals, emergent intervention) were present in two‐thirds of the cases. This suggests that future analyses of adherence involving EMRs and CPOE implementation should take a more nuanced look at how order entry is actually enabled. It may be that understanding how order sets affect care enhances clinician acceptance and thus could serve as an incentive to EMR adoption. However, once an EMR is adopted, a need exists to continue evaluations such as this because, ultimately, the gold standard should be improved patient care processes and better outcomes for patients.
Acknowledgement
The authors give special thanks to Dr. Brian Hoberman for sponsoring this work, Dr. Alan S. Go for providing assistance with obtaining copies of electrocardiograms for review, Drs. Tracy Lieu and Vincent Liu for reviewing the manuscript, and Ms. Rachel Lesser for formatting the manuscript.
Disclosures: This work was supported by The Permanente Medical Group, Inc. and Kaiser Foundation Hospitals, Inc. The algorithms used to extract data and perform risk adjustment were developed with funding from the Sidney Garfield Memorial Fund (Early Detection of Impending Physiologic Deterioration in Hospitalized Patients, 1159518), the Agency for Healthcare Quality and Research (Rapid Clinical Snapshots From the EMR Among Pneumonia Patients, 1R01HS018480‐01), and the Gordon and Betty Moore Foundation (Early Detection of Impending Physiologic Deterioration: Electronic Early Warning System).
- , , , , , . Population trends in the incidence and outcomes of acute myocardial infarction. N Engl J Med. 2010;362(23):2155–2165.
- , , , et al. Twenty‐two‐year trends in incidence of myocardial infarction, coronary heart disease mortality, and case fatality in 4 US communities, 1987–2008. Circulation. 2012;125(15):1848–1857.
- , , , et al. Heart disease and stroke statistics—2012 update: a report from the American Heart Association. Circulation. 2012;125(1):e2–e220.
- , , , et al. ACC/AHA 2007 guidelines for the management of patients with unstable angina/non‐ST‐Elevation myocardial infarction: a report of the American College of Cardiology/American Heart Association Task Force on Practice Guidelines (Writing Committee to Revise the 2002 Guidelines for the Management of Patients With Unstable Angina/Non‐ST‐Elevation Myocardial Infarction) developed in collaboration with the American College of Emergency Physicians, the Society for Cardiovascular Angiography and Interventions, and the Society of Thoracic Surgeons endorsed by the American Association of Cardiovascular and Pulmonary Rehabilitation and the Society for Academic Emergency Medicine. J Am Coll Cardiol. 2007;50(7):e1–e157.
- , , , et al. 2007 focused update of the ACC/AHA 2004 guidelines for the management of patients with ST‐elevation myocardial infarction: a report of the American College of Cardiology/American Heart Association Task Force on Practice Guidelines. J Am Coll Cardiol. 2008;51(2):210–247.
- , , , , , . Association between adoption of evidence‐based treatment and survival for patients with ST‐elevation myocardial infarction. JAMA. 2011;305(16):1677–1684.
- , , , et al. Association of changes in clinical characteristics and management with improvement in survival among patients with ST‐elevation myocardial infarction. JAMA. 2012;308(10):998–1006.
- , , , et al. Changes in myocardial infarction guideline adherence as a function of patient risk: an end to paradoxical care? J Am Coll Cardiol. 2011;58(17):1760–1765.
- , , , . Care in U.S. hospitals—the Hospital Quality Alliance program. N Engl J Med. 2005;353(3):265–274.
- , , et al. Challenges in the treatment of NSTEMI patients at high risk for both ischemic and bleeding events: insights from the ACTION Registry‐GWTG. J Am Coll Cardiol. 2011;57:E913–E913.
- , , , , . Quality of care in U.S. hospitals as reflected by standardized measures, 2002–2004. N Engl J Med. 2005;353(3):255–264.
- , , . Guideline‐based standardized care is associated with substantially lower mortality in medicare patients with acute myocardial infarction. J Am Coll Cardiol. 2005;46(7):1242–1248.
- , , , et al. Impact of a standardized heart failure order set on mortality, readmission, and quality and costs of care. Int J Qual Health Care. 2010;22(6):437–444.
- . Linking automated databases for research in managed care settings. Ann Intern Med. 1997;127(8 pt 2):719–724.
- , , , , , . Risk adjusting hospital inpatient mortality using automated inpatient, outpatient, and laboratory databases. Med Care. 2008;46(3):232–239.
- , , , . Length of stay predictions: improvements through the use of automated laboratory and comorbidity variables. Med Care. 2010;48(8):739–744.
- , , , , , . Intra‐hospital transfers to a higher level of care: contribution to total hospital and intensive care unit (ICU) mortality and length of stay (LOS). J Hosp Med. 2011;6(2):74–80.
- , , , . Adverse outcomes associated with delayed intensive care unit transfers in an integrated healthcare system. J Hosp Med. 2012;7(3):224–230.
- International Classification of Diseases, 9th Revision‐Clinical Modification. 4th ed. 3 Vols. Los Angeles, CA: Practice Management Information Corporation; 2006.
- , , , et al. Anticoagulation therapy for stroke prevention in atrial fibrillation: how well do randomized trials translate into clinical practice? JAMA. 2003;290(20):2685–2692.
- , , , , , . Early detection of impending physiologic deterioration among patients who are not in intensive care: development of predictive models using data from an automated electronic medical record. J Hosp Med. 2012;7(5):388–395.
- , , , , . Risk‐adjusting hospital mortality using a comprehensive electronic record in an integrated healthcare delivery system. Med Care. 2013;51(5):446–453.
- , , . Effect of choice of estimation method on inter‐hospital mortality rate comparisons. Med Care. 2010;48(5):456–485.
- , , , . The Kaiser Permanente inpatient risk adjustment methodology was valid in an external patient population. J Clin Epidemiol. 2010;63(7):798–803.
- , , , , . Derivation and validation of a model to predict daily risk of death in hospital. Med Care. 2011;49(8):734–743.
- , , . Adapting a clinical comorbidity index for use with ICD‐9‐CM administrative databases. J Clin Epidemiol. 1992;45(6):613–619.
- . Introduction to Statistical Mediation Analysis. New York, NY: Lawrence Erlbaum Associates; 2008.
- . Nonparametric estimation of average treatment effects under exogenity: a review. Rev Econ Stat. 2004;86:25.
- . Design of Observational Studies. New York, NY: Springer Science+Business Media; 2010.
- . Balance diagnostics for comparing the distribution of baseline covariates between treatment groups in propensity‐score matched samples. Stat Med. 2009;28:24.
- , , . Estimation of regression coefficients when some regressors are not always observed. J Am Stat Assoc. 1994(89):846–866.
- , . Stratification and weighting via the propensity score in estimation of causal treatment effects: a comparative study. Stat Med. 2004;23(19):2937–2960.
- . Discussing hidden bias in observational studies. Ann Intern Med. 1991;115(11):901–905.
- . Propensity score methods for bias reduction in the comparison of a treatment to a non‐randomized control group. Stat Med. 1998;17(19):2265–2281.
- , , . A method/macro based on propensity score and Mahalanobis distance to reduce bias in treatment comparison in observational study, 2005. www.lexjansen.com/pharmasug/2006/publichealthresearch/pr05.pdf. Accessed on September 14, 2013.
- . Using health information technology to improve health care. Arch Intern Med. 2012;172(22):1728–1730.
© 2014 Society of Hospital Medicine
Risk Factors For Unplanned ICU Transfer
Emergency Department (ED) patients who are hospitalized and require unplanned transfer to the intensive care unit (ICU) within 24 hours of arrival on the ward have higher mortality than direct ICU admissions.1, 2 Previous research found that 5% of ED admissions experienced unplanned ICU transfer during their hospitalization, yet these patients account for 25% of in‐hospital deaths and have a longer length of stay than direct ICU admissions.1, 3 For these reasons, inpatient rapid‐response teams and early warning systems have been studied to reduce the mortality of patients who rapidly deteriorate on the hospital ward.410 However, there is little conclusive evidence that these interventions decrease mortality.710 It is possible that with better recognition and intervention in the ED, a portion of these unplanned ICU transfers and their subsequent adverse outcomes could be prevented.11
Previous research on risk factors for unplanned ICU transfers among ED admissions is limited. While 2 previous studies from non‐US hospitals used administrative data to identify some general populations at risk for unplanned ICU transfer,12, 13 these studies did not differentiate between transfers shortly after admission and those that occurred during a prolonged hospital staya critical distinction since the outcomes between these groups differs substantially.1 Another limitation of these studies is the absence of physiologic measures at ED presentation, which have been shown to be highly predictive of mortality.14
In this study, we describe risk factors for unplanned transfer to the ICU within 24 hours of arrival on the ward, among a large cohort of ED hospitalizations across 13 community hospitals. Focusing on admitting diagnoses most at risk, our goal was to inform efforts to improve the triage of ED admissions and determine which patients may benefit from additional interventions, such as improved resuscitation, closer monitoring, or risk stratification tools. We also hypothesized that higher volume hospitals would have lower rates of unplanned ICU transfers, as these hospitals are more likely have more patient care resources on the hospital ward and a higher threshold to transfer to the ICU.
METHODS
Setting and Patients
The setting for this study was Kaiser Permanente Northern California (KPNC), a large integrated healthcare delivery system serving approximately 3.3 million members.1, 3, 15, 16 We extracted data on all adult ED admissions (18 years old) to the hospital between 2007 and 2009. We excluded patients who went directly to the operating room or the ICU, as well as gynecological/pregnancy‐related admissions, as these patients have substantially different mortality risks.14 ED admissions to hospital wards could either go to medicalsurgical units or transitional care units (TCU), an intermediate level of care between the medicalsurgical units and the ICU. We chose to focus on hospitals with similar inpatient structures. Thus, 8 hospitals without TCUs were excluded, leaving 13 hospitals for analysis. The KPNC Institutional Review Board approved this study.
Main Outcome Measure
The main outcome measure was unplanned transfer to the ICU within 24 hours of arrival to the hospital ward, based upon bed history data. As in previous research, we make the assumptionwhich is supported by the high observed‐to‐expected mortality ratios found in these patientsthat these transfers to the ICU were due to clinical deterioration, and thus were unplanned, rather than a planned transfer to the ICU as is more common after an elective surgical procedure.13 The comparison population was patients admitted from the ED to the ward who never experienced a transfer to the ICU.
Patient and Hospital Characteristics
We extracted patient data on age, sex, admitting diagnosis, chronic illness burden, acute physiologic derangement in the ED, and hospital unit length of stay. Chronic illness was measured using the Comorbidity Point Score (COPS), and physiologic derangement was measured using the Laboratory Acute Physiology Score (LAPS) calculated from labs collected in the ED.1, 14, 17 The derivation of these variables from the electronic medical record has been previously described.14 The COPS was derived from International Classification of Diseases, Ninth Revision (ICD‐9) codes for all Kaiser Permanente Medical Care Program (KPMCP) inpatient and outpatient encounters prior to hospitalization. The LAPS is based on 14 possible lab tests that could be drawn in the ED or in the 72 hours prior to hospitalization. The admitting diagnosis is the ICD‐9 code assigned for the primary diagnosis determined by the admitting physician at the time when hospital admission orders are entered. We further collapsed a previously used categorization of 44 primary condition diagnoses, based on admission ICD‐9 codes,14 into 25 broad diagnostic categories based on pathophysiologic plausibility and mortality rates. We tabulated inpatient admissions originating in the ED to derive a hospital volume measure.
Statistical Analyses
We compared patient characteristics, hospital volume, and outcomes by whether or not an unplanned ICU transfer occurred. Unadjusted analyses were performed with analysis of variance (ANOVA) and chi‐square tests. We calculated crude rates of unplanned ICU transfer per 1,000 ED inpatient admissions by patient characteristics and by hospital, stratified by hospital volume.
We used a hierarchical multivariate logistic regression model to estimate adjusted odds ratios for unplanned ICU transfer as a function of both patient‐level variables (age, sex, COPS, LAPS, time of admission, admission to TCU vs ward, admitting diagnosis) and hospital‐level variables (volume) in the model. We planned to choose the reference group for admitting diagnosis as the one with an unadjusted odds ratio closest to the null (1.00). This model addresses correlations between patients with multiple hospitalizations and clustering by hospital, by fitting random intercepts for these clusters. All analyses were performed in Stata 12 (StataCorp, College Station, TX), and statistics are presented with 95% confidence intervals (CI). The Stata program gllamm (Generalized Linear Latent and Mixed Models) was used for hierarchical modeling.18
RESULTS
Of 178,315 ED non‐ICU hospitalizations meeting inclusion criteria, 4,252 (2.4%) were admitted to the ward and were transferred to the ICU within 24 hours of leaving the ED. There were 122,251 unique patients in our study population. Table 1 compares the characteristics of ED hospitalizations in which an unplanned transfer occurred to those that did not experience an unplanned transfer. Unplanned transfers were more likely to have a higher comorbidity burden, more deranged physiology, and more likely to arrive on the floor during the overnight shift.
| Characteristics | Unplanned Transfer to ICU Within 24 h of Leaving ED? | P Value* | |
|---|---|---|---|
| Yes | No | ||
| N = 4,252 (2.4%) | N = 174,063 (97.6%) | ||
| |||
| Age, median (IQR) | 69 (5680) | 70 (5681) | <0.01 |
| Male, % | 51.3 | 45.9 | <0.01 |
| Comorbidity Points Score (COPS), median (IQR) | 100 (46158) | 89 (42144) | <0.01 |
| Laboratory Acute Physiology Score (LAPS), median (IQR) | 26 (1342) | 18 (633) | <0.01 |
| Nursing shift on arrival to floor, % | |||
| Day: 7 am3 pm (Reference) | 20.1 | 20.1 | NS |
| Evening: 3 pm11 pm | 47.6 | 50.2 | NS |
| Overnight: 11 pm7 am | 32.3 | 29.7 | <0.01 |
| Weekend admission, % | 33.7 | 32.7 | NS |
| Admitted to monitored bed, % | 24.1 | 24.9 | NS |
| Emergency department annual volume, mean (SD) | 48,755 (15,379) | 50,570 (15,276) | <0.01 |
| Non‐ICU annual admission volume, mean (SD) | 5,562 (1,626) | 5,774 (1,568) | <0.01 |
| Admitting diagnosis, listed by descending frequency, % | NS | ||
| Pneumonia and respiratory infections | 16.3 | 11.8 | <0.01 |
| Gastrointestinal bleeding | 12.8 | 13.6 | NS |
| Chest pain | 7.3 | 10.0 | <0.01 |
| Miscellaneous conditions | 5.6 | 6.2 | NS |
| All other acute infections | 4.7 | 6.0 | <0.01 |
| Seizures | 4.1 | 5.9 | <0.01 |
| AMI | 3.9 | 3.3 | <0.05 |
| COPD | 3.8 | 3.0 | <0.01 |
| CHF | 3.5 | 3.7 | NS |
| Arrhythmias and pulmonary embolism | 3.5 | 3.3 | NS |
| Stroke | 3.4 | 3.5 | NS |
| Diabetic emergencies | 3.3 | 2.6 | <0.01 |
| Metabolic, endocrine, electrolytes | 3.0 | 2.9 | NS |
| Sepsis | 3.0 | 1.2 | <0.01 |
| Other neurology and toxicology | 3.0 | 2.9 | NS |
| Urinary tract infections | 2.9 | 3.2 | NS |
| Catastrophic conditions | 2.6 | 1.2 | <0.01 |
| Rheumatology | 2.5 | 3.5 | <0.01 |
| Hematology and oncology | 2.4 | 2.4 | NS |
| Acute renal failure | 1.9 | 1.1 | <0.01 |
| Pancreatic and liver | 1.7 | 2.0 | NS |
| Trauma, fractures, and dislocations | 1.6 | 1.8 | NS |
| Bowel obstructions and diseases | 1.6 | 2.9 | <0.01 |
| Other cardiac conditions | 1.5 | 1.3 | NS |
| Other renal conditions | 0.6 | 1.0 | <0.01 |
| Inpatient length of stay, median days (IQR) | 4.7 (2.78.6) | 2.6 (1.54.4) | <0.01 |
| Died during hospitalization, % | 12.7 | 2.4 | <0.01 |
Unplanned ICU transfers were more frequent in lower volume hospitals (Table 1). Figure 1 displays the inverse relationship between hospital annual ED inpatient admission volume and unplanned ICU transfers rates. The lowest volume hospital had a crude rate twice as high as the 2 highest volume hospitals (39 vs 20, per 1,000 admissions).
Pneumonia/respiratory infection was the most frequent admitting condition associated with unplanned transfer (16.3%) (Table 1). There was also wide variation in crude rates for unplanned ICU transfer by admitting condition (Figure 2). Patients admitted with sepsis had the highest rate (59 per 1,000 admissions), while patients admitted with renal conditions other than acute renal failure had the lowest rates (14.3 per 1,000 admissions).
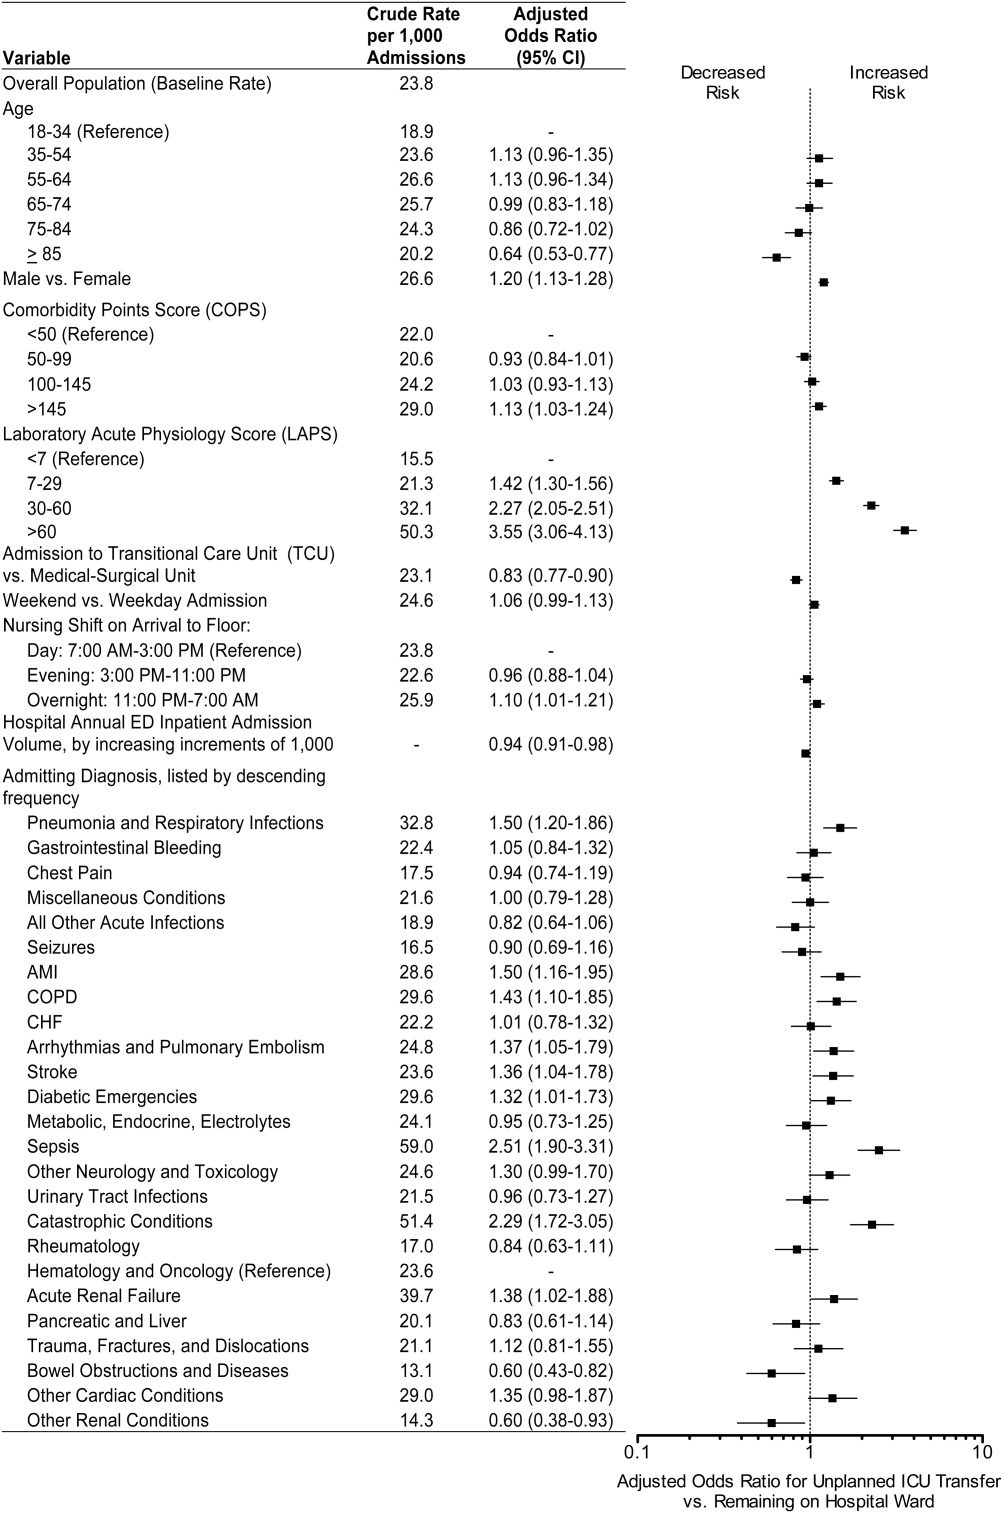
We confirmed that almost all diagnoses found to account for a disproportionately high share of unplanned ICU transfers in Table 1 were indeed independently associated with this phenomenon after adjustment for patient and hospital differences (Figure 2). Pneumonia remained the most frequent condition associated with unplanned ICU transfer (odds ratio [OR] 1.50; 95% CI 1.201.86). Although less frequent, sepsis had the strongest association of any condition with unplanned transfer (OR 2.51; 95% CI 1.903.31). However, metabolic, endocrine, and electrolyte conditions were no longer associated with unplanned transfer after adjustment, while arrhythmias and pulmonary embolism were. Other conditions confirmed to be associated with increased risk of unplanned transfer included: myocardial infarction (MI), chronic obstructive pulmonary disease (COPD), stroke, diabetic emergencies, catastrophic conditions (includes aortic catastrophes, all forms of shock except septic shock, and intracranial hemorrhage), and acute renal failure. After taking into account the frequency of admitting diagnoses, respiratory conditions (COPD, pneumonia/acute respiratory infection) comprised nearly half (47%) of all conditions associated with increased risk of unplanned ICU transfer.
Other factors confirmed to be independently associated with unplanned ICU transfer included: male sex (OR 1.20; 95% CI 1.131.28), high comorbidity burden as measured by COPS >145 (OR 1.13; 95% CI 1.031.24), increasingly abnormal physiology compared to a LAPS <7, and arrival on ward during the overnight shift (OR 1.10; 95% CI 1.011.21). After adjustment, we did find that admission to the TCU rather than a medicalsurgical unit was associated with decreased risk of unplanned ICU transfer (OR 0.83; 95% CI 0.770.90). Age 85 was associated with decreased risk of unplanned ICU transfer relative to the youngest age group of 1834‐year‐old patients (OR 0.64; 95% CI 0.530.77).
ED admissions to higher volume hospitals were 6% less likely to experience an unplanned transfer for each additional 1,000 annual ED hospitalizations over a lower volume hospital (OR 0.94; 95% CI 0.910.98). In other words, a patient admitted to a hospital with 8,000 annual ED hospitalizations had 30% decreased odds of unplanned ICU transfer compared to a hospital with only 3,000 annual ED hospitalizations.
DISCUSSION
Patients admitted with respiratory conditions accounted for half of all admitting diagnoses associated with increased risk of unplanned transfer to the ICU within 24 hours of arrival to the ward. We found that 1 in 30 ED ward admissions for pneumonia, and 1 in 33 for COPD, were transferred to the ICU within 24 hours. These findings indicate that there is some room for improvement in early care of respiratory conditions, given the average unplanned transfer rate of 1 in 42, and previous research showing that patients with pneumonia and patients with COPD, who experience unplanned ICU transfer, have substantially worse mortality than those directly admitted to the ICU.1
Although less frequent than hospitalizations for respiratory conditions, patients admitted with sepsis were at the highest risk of unplanned ICU transfer (1 in 17 ED non‐ICU hospitalizations). We also found that MI and stroke ward admissions had a higher risk of unplanned ICU transfer. However, we previously found that unplanned ICU transfers for sepsis, MI, and stroke did not have worse mortality than direct ICU admits for these conditions.1 Therefore, quality improvement efforts to reduce excess mortality related to early decompensation in the hospital and unplanned ICU transfer would be most effective if targeted towards respiratory conditions such as pneumonia and COPD.
This is the only in‐depth study, to our knowledge, to explore the association between a set of mutually exclusive diagnostic categories and risk of unplanned ICU transfer within 24 hours, and it is the first study to identify risk factors for unplanned ICU transfer in a multi‐hospital cohort adjusted for patient‐ and hospital‐level characteristics. We also identified a novel hospital volumeoutcome relationship: Unplanned ICU transfers are up to twice as likely to occur in the smallest volume hospitals compared with highest volume hospitals. Hospital volume has long been proposed as a proxy for hospital resources; there are several studies showing a relationship between low‐volume hospitals and worse outcomes for a number of conditions.19, 20 Possible mechanisms may include decreased ICU capacity, decreased on‐call intensivists in the hospital after hours, and less experience with certain critical care conditions seen more frequently in high‐volume hospitals.21
Patients at risk of unplanned ICU transfer were also more likely to have physiologic derangement identified on laboratory testing, high comorbidity burden, and arrive on the ward between 11 PM and 7 AM. Given the strong correlation between comorbidity burden and physiologic derangement and mortality,14 it is not surprising that the COPS and LAPS were independent predictors of unplanned transfer. It is unclear, however, why arriving on the ward on the overnight shift is associated with higher risk. One possibility is that patients who arrive on the wards during 11 PM to 7 AM are also likely to have been in the ED during evening peak hours most associated with ED crowding.22 High levels of ED crowding have been associated with delays in care, worse quality care, lapses in patient safety, and even increased in‐hospital mortality.22, 23 Other possible reasons include decreased in‐hospital staffing and longer delays in critical diagnostic tests and interventions.2428
Admission to TCUs was associated with decreased risk of unplanned ICU transfer in the first 24 hours of hospitalization. This may be due to the continuous monitoring, decreased nursing‐to‐patient ratios, or the availability to provide some critical care interventions. In our study, age 85 was associated with lower likelihood of unplanned transfer. Unfortunately, we did not have access to data on advanced directives or patient preferences. Data on advanced directives would help to distinguish whether this phenomenon was related to end‐of‐life care goals versus other explanations.
Our study confirms some risk factors identified in previous studies. These include specific diagnoses such as pneumonia and COPD,12, 13, 29 heavy comorbidity burden,12, 13, 29 abnormal labs,29 and male sex.13 Pneumonia has consistently been shown to be a risk factor for unplanned ICU transfer. This may stem from the dynamic nature of this condition and its ability to rapidly progress, and the fact that some ICUs may not accept pneumonia patients unless they demonstrate a need for mechanical ventilation.30 Recently, a prediction rule has been developed to determine which patients with pneumonia are likely to have an unplanned ICU transfer.30 It is possible that with validation and application of this rule, unplanned transfer rates for pneumonia could be reduced. It is unclear whether males have unmeasured factors associated with increased risk of unplanned transfer or whether a true gender disparity exists.
Our findings should be interpreted within the context of this study's limitations. First, this study was not designed to distinguish the underlying cause of the unplanned transfer such as under‐recognition of illness severity in the ED, evolving clinical disease after leaving the ED, or delays in critical interventions on the ward. These are a focus of our ongoing research efforts. Second, while previous studies have demonstrated that our automated risk adjustment variables can accurately predict in‐hospital mortality (0.88 area under curve in external populations),17 additional data on vital signs and mental status could further improve risk adjustment. However, using automated data allowed us to study risk factors for unplanned transfer in a multi‐hospital cohort with a much larger population than has been previously studied. Serial data on vital signs and mental status both in the ED and during hospitalization could also be helpful in determining which unplanned transfers could be prevented with earlier recognition and intervention. Finally, all patient care occurred within an integrated healthcare delivery system. Thus, differences in case‐mix, hospital resources, ICU structure, and geographic location should be considered when applying our results to other healthcare systems.
This study raises several new areas for future research. With access to richer data becoming available in electronic medical records, prediction rules should be developed to enable better triage to appropriate levels of care for ED admissions. Future research should also analyze the comparative effectiveness of intermediate monitored units versus non‐monitored wards for preventing clinical deterioration by admitting diagnosis. Diagnoses that have been shown to have an increased risk of death after unplanned ICU transfer, such as pneumonia/respiratory infection and COPD,1 should be prioritized in this research. Better understanding is needed on the diagnosis‐specific differences and the differences in ED triage process and ICU structure that may explain why high‐volume hospitals have significantly lower rates of early unplanned ICU transfers compared with low‐volume hospitals. In particular, determining the effect of TCU and ICU capacities and census at the time of admission, and comparing patient risk characteristics across hospital‐volume strata would be very useful. Finally, more work is needed to determine whether the higher rate of unplanned transfers during overnight nursing shifts is related to decreased resource availability, preceding ED crowding, or other organizational causes.
In conclusion, patients admitted with respiratory conditions, sepsis, MI, high comorbidity, and abnormal labs are at modestly increased risk of unplanned ICU transfer within 24 hours of admission from the ED. Patients admitted with respiratory conditions (pneumonia/respiratory infections and COPD) accounted for half of the admitting diagnoses that are at increased risk for unplanned ICU transfer. These patients may benefit from better inpatient triage from the ED, earlier intervention, or closer monitoring. More research is needed to determine the specific aspects of care associated with admission to intermediate care units and high‐volume hospitals that reduce the risk of unplanned ICU transfer.
Acknowledgements
The authors thank John D. Greene, Juan Carlos La Guardia, and Benjamin Turk for their assistance with formatting of the dataset; Dr Alan S. Go, Acting Director of the Division of Research, for reviewing the manuscript; and Alina Schnake‐Mahl for formatting the manuscript.
- , , , et al. Adverse outcomes associated with delayed intensive care unit transfers in an integrated healthcare system. J Hosp Med. 2011;7(3):224–230.
- , , , et al. Inpatient transfers to the intensive care unit. J Gen Intern Med. 2003;18(2):77–83.
- , , , et al. Intra‐hospital transfers to a higher level of care: contribution to total hospital and intensive care unit (ICU) mortality and length of stay (LOS). J Hosp Med. 2011;6:74–80.
- , , , et al. Hospital‐wide code rates and mortality before and after implementation of a rapid response team. JAMA. 2008;300(21):2506–2513.
- , , , et al. Effect of a rapid response team on hospital‐wide mortality and code rates outside the ICU in a children's hospital. JAMA. 2007;298(19):2267–2274.
- , , , et al. Introduction of the medical emergency team (MET) system: a cluster‐randomised controlled trial. Lancet. 2005;365(9477):2091–2097.
- , , , et al. Rapid response systems: A systematic review. Crit Care Med. 2007;35(5):1238–1243.
- , , , et al. Effects of rapid response systems on clinical outcomes: systematic review and meta‐analysis. J Hosp Med. 2007;2(6):422–432.
- , , , et al. Rapid response teams: a systematic review and meta‐analysis. Arch Intern Med. 2010;170(1):18–26.
- , , , et al. Outreach and early warning systems (EWS) for the prevention of intensive care admission and death of critically ill adult patients on general hospital wards. Cochrane Database Syst Rev. 2007;3:CD005529.
- , , , et al. Unplanned transfers to a medical intensive care unit: Causes and relationship to preventable errors in care. J Hosp Med. 2011;6:68–72.
- , , , et al. Using administrative data to develop a nomogram for individualising risk of unplanned admission to intensive care. Resuscitation. 2008;79(2):241–248.
- , , , et al. Unplanned admission to intensive care after emergency hospitalisation: risk factors and development of a nomogram for individualising risk. Resuscitation. 2009;80(2):224–230.
- , , , et al. Risk‐adjusting hospital inpatient mortality using automated inpatient, outpatient, and laboratory databases. Med Care. 2008;46(3):232–239.
- . Linking automated databases for research in managed care settings. Ann Intern Med. 1997;127(8 pt 2):719–724.
- , , , et al. Risk adjusting community‐acquired pneumonia hospital outcomes using automated databases. Am J Manag Care. 2008;14(3):158–166.
- , , , et al. The Kaiser Permanente inpatient risk adjustment methodology was valid in an external patient population. J Clin Epidemiol. 2011;63(7):798–803.
- , , . Maximum likelihood estimation of limited and discrete dependent variable models with nested random effects. J Econometrics. 2005;128(2):301–323.
- . The relation between volume and outcome in health care. N Engl J Med. 1999;340(21):1677–1679.
- , , . Is volume related to outcome in health care? A systematic review and methodologic critique of the literature. Ann Intern Med. 2002;137(6):511–520.
- , , . Working with capacity limitations: operations management in critical care. Crit Care. 2011;15(4):308.
- , . Systematic review of emergency department crowding: causes, effects, and solutions. Ann Intern Med. 2008;52(2):126–136.
- , , , et al. The effect of emergency department crowding on clinically oriented outcomes. Acad Emerg Med. 2009;16(1):1–10.
- , , , et al. Association between time of admission to the ICU and mortality. Chest. 2010;138(1):68–75.
- , , , et al. Off‐hour admission and in‐hospital stroke case fatality in the get with the guidelines‐stroke program. Stroke. 2009;40(2):569–576.
- , , , et al. Relationship between time of day, day of week, timeliness of reperfusion, and in‐hospital mortality for patients with acute ST‐segment elevation myocardial infarction. JAMA. 2005;294(7):803–812.
- , , , et al. Hospital mortality among adults admitted to and discharged from intensive care on weekends and evenings. J Crit Care. 2008;23(3):317–324.
- , , , et al. Association between ICU admission during morning rounds and mortality. Chest. 2009;136(6):1489–1495.
- , , , et al. Identifying infected emergency department patients admitted to the hospital ward at risk of clinical deterioration and intensive care unit transfer. Acad Emerg Med. 2010;17(10):1080–1085.
- , , , et al. Risk stratification of early admission to the intensive care unit of patients with no major criteria of severe community‐acquired pneumonia: development of an international prediction rule. Crit Care. 2009;13(2):R54.
Emergency Department (ED) patients who are hospitalized and require unplanned transfer to the intensive care unit (ICU) within 24 hours of arrival on the ward have higher mortality than direct ICU admissions.1, 2 Previous research found that 5% of ED admissions experienced unplanned ICU transfer during their hospitalization, yet these patients account for 25% of in‐hospital deaths and have a longer length of stay than direct ICU admissions.1, 3 For these reasons, inpatient rapid‐response teams and early warning systems have been studied to reduce the mortality of patients who rapidly deteriorate on the hospital ward.410 However, there is little conclusive evidence that these interventions decrease mortality.710 It is possible that with better recognition and intervention in the ED, a portion of these unplanned ICU transfers and their subsequent adverse outcomes could be prevented.11
Previous research on risk factors for unplanned ICU transfers among ED admissions is limited. While 2 previous studies from non‐US hospitals used administrative data to identify some general populations at risk for unplanned ICU transfer,12, 13 these studies did not differentiate between transfers shortly after admission and those that occurred during a prolonged hospital staya critical distinction since the outcomes between these groups differs substantially.1 Another limitation of these studies is the absence of physiologic measures at ED presentation, which have been shown to be highly predictive of mortality.14
In this study, we describe risk factors for unplanned transfer to the ICU within 24 hours of arrival on the ward, among a large cohort of ED hospitalizations across 13 community hospitals. Focusing on admitting diagnoses most at risk, our goal was to inform efforts to improve the triage of ED admissions and determine which patients may benefit from additional interventions, such as improved resuscitation, closer monitoring, or risk stratification tools. We also hypothesized that higher volume hospitals would have lower rates of unplanned ICU transfers, as these hospitals are more likely have more patient care resources on the hospital ward and a higher threshold to transfer to the ICU.
METHODS
Setting and Patients
The setting for this study was Kaiser Permanente Northern California (KPNC), a large integrated healthcare delivery system serving approximately 3.3 million members.1, 3, 15, 16 We extracted data on all adult ED admissions (18 years old) to the hospital between 2007 and 2009. We excluded patients who went directly to the operating room or the ICU, as well as gynecological/pregnancy‐related admissions, as these patients have substantially different mortality risks.14 ED admissions to hospital wards could either go to medicalsurgical units or transitional care units (TCU), an intermediate level of care between the medicalsurgical units and the ICU. We chose to focus on hospitals with similar inpatient structures. Thus, 8 hospitals without TCUs were excluded, leaving 13 hospitals for analysis. The KPNC Institutional Review Board approved this study.
Main Outcome Measure
The main outcome measure was unplanned transfer to the ICU within 24 hours of arrival to the hospital ward, based upon bed history data. As in previous research, we make the assumptionwhich is supported by the high observed‐to‐expected mortality ratios found in these patientsthat these transfers to the ICU were due to clinical deterioration, and thus were unplanned, rather than a planned transfer to the ICU as is more common after an elective surgical procedure.13 The comparison population was patients admitted from the ED to the ward who never experienced a transfer to the ICU.
Patient and Hospital Characteristics
We extracted patient data on age, sex, admitting diagnosis, chronic illness burden, acute physiologic derangement in the ED, and hospital unit length of stay. Chronic illness was measured using the Comorbidity Point Score (COPS), and physiologic derangement was measured using the Laboratory Acute Physiology Score (LAPS) calculated from labs collected in the ED.1, 14, 17 The derivation of these variables from the electronic medical record has been previously described.14 The COPS was derived from International Classification of Diseases, Ninth Revision (ICD‐9) codes for all Kaiser Permanente Medical Care Program (KPMCP) inpatient and outpatient encounters prior to hospitalization. The LAPS is based on 14 possible lab tests that could be drawn in the ED or in the 72 hours prior to hospitalization. The admitting diagnosis is the ICD‐9 code assigned for the primary diagnosis determined by the admitting physician at the time when hospital admission orders are entered. We further collapsed a previously used categorization of 44 primary condition diagnoses, based on admission ICD‐9 codes,14 into 25 broad diagnostic categories based on pathophysiologic plausibility and mortality rates. We tabulated inpatient admissions originating in the ED to derive a hospital volume measure.
Statistical Analyses
We compared patient characteristics, hospital volume, and outcomes by whether or not an unplanned ICU transfer occurred. Unadjusted analyses were performed with analysis of variance (ANOVA) and chi‐square tests. We calculated crude rates of unplanned ICU transfer per 1,000 ED inpatient admissions by patient characteristics and by hospital, stratified by hospital volume.
We used a hierarchical multivariate logistic regression model to estimate adjusted odds ratios for unplanned ICU transfer as a function of both patient‐level variables (age, sex, COPS, LAPS, time of admission, admission to TCU vs ward, admitting diagnosis) and hospital‐level variables (volume) in the model. We planned to choose the reference group for admitting diagnosis as the one with an unadjusted odds ratio closest to the null (1.00). This model addresses correlations between patients with multiple hospitalizations and clustering by hospital, by fitting random intercepts for these clusters. All analyses were performed in Stata 12 (StataCorp, College Station, TX), and statistics are presented with 95% confidence intervals (CI). The Stata program gllamm (Generalized Linear Latent and Mixed Models) was used for hierarchical modeling.18
RESULTS
Of 178,315 ED non‐ICU hospitalizations meeting inclusion criteria, 4,252 (2.4%) were admitted to the ward and were transferred to the ICU within 24 hours of leaving the ED. There were 122,251 unique patients in our study population. Table 1 compares the characteristics of ED hospitalizations in which an unplanned transfer occurred to those that did not experience an unplanned transfer. Unplanned transfers were more likely to have a higher comorbidity burden, more deranged physiology, and more likely to arrive on the floor during the overnight shift.
| Characteristics | Unplanned Transfer to ICU Within 24 h of Leaving ED? | P Value* | |
|---|---|---|---|
| Yes | No | ||
| N = 4,252 (2.4%) | N = 174,063 (97.6%) | ||
| |||
| Age, median (IQR) | 69 (5680) | 70 (5681) | <0.01 |
| Male, % | 51.3 | 45.9 | <0.01 |
| Comorbidity Points Score (COPS), median (IQR) | 100 (46158) | 89 (42144) | <0.01 |
| Laboratory Acute Physiology Score (LAPS), median (IQR) | 26 (1342) | 18 (633) | <0.01 |
| Nursing shift on arrival to floor, % | |||
| Day: 7 am3 pm (Reference) | 20.1 | 20.1 | NS |
| Evening: 3 pm11 pm | 47.6 | 50.2 | NS |
| Overnight: 11 pm7 am | 32.3 | 29.7 | <0.01 |
| Weekend admission, % | 33.7 | 32.7 | NS |
| Admitted to monitored bed, % | 24.1 | 24.9 | NS |
| Emergency department annual volume, mean (SD) | 48,755 (15,379) | 50,570 (15,276) | <0.01 |
| Non‐ICU annual admission volume, mean (SD) | 5,562 (1,626) | 5,774 (1,568) | <0.01 |
| Admitting diagnosis, listed by descending frequency, % | NS | ||
| Pneumonia and respiratory infections | 16.3 | 11.8 | <0.01 |
| Gastrointestinal bleeding | 12.8 | 13.6 | NS |
| Chest pain | 7.3 | 10.0 | <0.01 |
| Miscellaneous conditions | 5.6 | 6.2 | NS |
| All other acute infections | 4.7 | 6.0 | <0.01 |
| Seizures | 4.1 | 5.9 | <0.01 |
| AMI | 3.9 | 3.3 | <0.05 |
| COPD | 3.8 | 3.0 | <0.01 |
| CHF | 3.5 | 3.7 | NS |
| Arrhythmias and pulmonary embolism | 3.5 | 3.3 | NS |
| Stroke | 3.4 | 3.5 | NS |
| Diabetic emergencies | 3.3 | 2.6 | <0.01 |
| Metabolic, endocrine, electrolytes | 3.0 | 2.9 | NS |
| Sepsis | 3.0 | 1.2 | <0.01 |
| Other neurology and toxicology | 3.0 | 2.9 | NS |
| Urinary tract infections | 2.9 | 3.2 | NS |
| Catastrophic conditions | 2.6 | 1.2 | <0.01 |
| Rheumatology | 2.5 | 3.5 | <0.01 |
| Hematology and oncology | 2.4 | 2.4 | NS |
| Acute renal failure | 1.9 | 1.1 | <0.01 |
| Pancreatic and liver | 1.7 | 2.0 | NS |
| Trauma, fractures, and dislocations | 1.6 | 1.8 | NS |
| Bowel obstructions and diseases | 1.6 | 2.9 | <0.01 |
| Other cardiac conditions | 1.5 | 1.3 | NS |
| Other renal conditions | 0.6 | 1.0 | <0.01 |
| Inpatient length of stay, median days (IQR) | 4.7 (2.78.6) | 2.6 (1.54.4) | <0.01 |
| Died during hospitalization, % | 12.7 | 2.4 | <0.01 |
Unplanned ICU transfers were more frequent in lower volume hospitals (Table 1). Figure 1 displays the inverse relationship between hospital annual ED inpatient admission volume and unplanned ICU transfers rates. The lowest volume hospital had a crude rate twice as high as the 2 highest volume hospitals (39 vs 20, per 1,000 admissions).
Pneumonia/respiratory infection was the most frequent admitting condition associated with unplanned transfer (16.3%) (Table 1). There was also wide variation in crude rates for unplanned ICU transfer by admitting condition (Figure 2). Patients admitted with sepsis had the highest rate (59 per 1,000 admissions), while patients admitted with renal conditions other than acute renal failure had the lowest rates (14.3 per 1,000 admissions).
We confirmed that almost all diagnoses found to account for a disproportionately high share of unplanned ICU transfers in Table 1 were indeed independently associated with this phenomenon after adjustment for patient and hospital differences (Figure 2). Pneumonia remained the most frequent condition associated with unplanned ICU transfer (odds ratio [OR] 1.50; 95% CI 1.201.86). Although less frequent, sepsis had the strongest association of any condition with unplanned transfer (OR 2.51; 95% CI 1.903.31). However, metabolic, endocrine, and electrolyte conditions were no longer associated with unplanned transfer after adjustment, while arrhythmias and pulmonary embolism were. Other conditions confirmed to be associated with increased risk of unplanned transfer included: myocardial infarction (MI), chronic obstructive pulmonary disease (COPD), stroke, diabetic emergencies, catastrophic conditions (includes aortic catastrophes, all forms of shock except septic shock, and intracranial hemorrhage), and acute renal failure. After taking into account the frequency of admitting diagnoses, respiratory conditions (COPD, pneumonia/acute respiratory infection) comprised nearly half (47%) of all conditions associated with increased risk of unplanned ICU transfer.
Other factors confirmed to be independently associated with unplanned ICU transfer included: male sex (OR 1.20; 95% CI 1.131.28), high comorbidity burden as measured by COPS >145 (OR 1.13; 95% CI 1.031.24), increasingly abnormal physiology compared to a LAPS <7, and arrival on ward during the overnight shift (OR 1.10; 95% CI 1.011.21). After adjustment, we did find that admission to the TCU rather than a medicalsurgical unit was associated with decreased risk of unplanned ICU transfer (OR 0.83; 95% CI 0.770.90). Age 85 was associated with decreased risk of unplanned ICU transfer relative to the youngest age group of 1834‐year‐old patients (OR 0.64; 95% CI 0.530.77).
ED admissions to higher volume hospitals were 6% less likely to experience an unplanned transfer for each additional 1,000 annual ED hospitalizations over a lower volume hospital (OR 0.94; 95% CI 0.910.98). In other words, a patient admitted to a hospital with 8,000 annual ED hospitalizations had 30% decreased odds of unplanned ICU transfer compared to a hospital with only 3,000 annual ED hospitalizations.
DISCUSSION
Patients admitted with respiratory conditions accounted for half of all admitting diagnoses associated with increased risk of unplanned transfer to the ICU within 24 hours of arrival to the ward. We found that 1 in 30 ED ward admissions for pneumonia, and 1 in 33 for COPD, were transferred to the ICU within 24 hours. These findings indicate that there is some room for improvement in early care of respiratory conditions, given the average unplanned transfer rate of 1 in 42, and previous research showing that patients with pneumonia and patients with COPD, who experience unplanned ICU transfer, have substantially worse mortality than those directly admitted to the ICU.1
Although less frequent than hospitalizations for respiratory conditions, patients admitted with sepsis were at the highest risk of unplanned ICU transfer (1 in 17 ED non‐ICU hospitalizations). We also found that MI and stroke ward admissions had a higher risk of unplanned ICU transfer. However, we previously found that unplanned ICU transfers for sepsis, MI, and stroke did not have worse mortality than direct ICU admits for these conditions.1 Therefore, quality improvement efforts to reduce excess mortality related to early decompensation in the hospital and unplanned ICU transfer would be most effective if targeted towards respiratory conditions such as pneumonia and COPD.
This is the only in‐depth study, to our knowledge, to explore the association between a set of mutually exclusive diagnostic categories and risk of unplanned ICU transfer within 24 hours, and it is the first study to identify risk factors for unplanned ICU transfer in a multi‐hospital cohort adjusted for patient‐ and hospital‐level characteristics. We also identified a novel hospital volumeoutcome relationship: Unplanned ICU transfers are up to twice as likely to occur in the smallest volume hospitals compared with highest volume hospitals. Hospital volume has long been proposed as a proxy for hospital resources; there are several studies showing a relationship between low‐volume hospitals and worse outcomes for a number of conditions.19, 20 Possible mechanisms may include decreased ICU capacity, decreased on‐call intensivists in the hospital after hours, and less experience with certain critical care conditions seen more frequently in high‐volume hospitals.21
Patients at risk of unplanned ICU transfer were also more likely to have physiologic derangement identified on laboratory testing, high comorbidity burden, and arrive on the ward between 11 PM and 7 AM. Given the strong correlation between comorbidity burden and physiologic derangement and mortality,14 it is not surprising that the COPS and LAPS were independent predictors of unplanned transfer. It is unclear, however, why arriving on the ward on the overnight shift is associated with higher risk. One possibility is that patients who arrive on the wards during 11 PM to 7 AM are also likely to have been in the ED during evening peak hours most associated with ED crowding.22 High levels of ED crowding have been associated with delays in care, worse quality care, lapses in patient safety, and even increased in‐hospital mortality.22, 23 Other possible reasons include decreased in‐hospital staffing and longer delays in critical diagnostic tests and interventions.2428
Admission to TCUs was associated with decreased risk of unplanned ICU transfer in the first 24 hours of hospitalization. This may be due to the continuous monitoring, decreased nursing‐to‐patient ratios, or the availability to provide some critical care interventions. In our study, age 85 was associated with lower likelihood of unplanned transfer. Unfortunately, we did not have access to data on advanced directives or patient preferences. Data on advanced directives would help to distinguish whether this phenomenon was related to end‐of‐life care goals versus other explanations.
Our study confirms some risk factors identified in previous studies. These include specific diagnoses such as pneumonia and COPD,12, 13, 29 heavy comorbidity burden,12, 13, 29 abnormal labs,29 and male sex.13 Pneumonia has consistently been shown to be a risk factor for unplanned ICU transfer. This may stem from the dynamic nature of this condition and its ability to rapidly progress, and the fact that some ICUs may not accept pneumonia patients unless they demonstrate a need for mechanical ventilation.30 Recently, a prediction rule has been developed to determine which patients with pneumonia are likely to have an unplanned ICU transfer.30 It is possible that with validation and application of this rule, unplanned transfer rates for pneumonia could be reduced. It is unclear whether males have unmeasured factors associated with increased risk of unplanned transfer or whether a true gender disparity exists.
Our findings should be interpreted within the context of this study's limitations. First, this study was not designed to distinguish the underlying cause of the unplanned transfer such as under‐recognition of illness severity in the ED, evolving clinical disease after leaving the ED, or delays in critical interventions on the ward. These are a focus of our ongoing research efforts. Second, while previous studies have demonstrated that our automated risk adjustment variables can accurately predict in‐hospital mortality (0.88 area under curve in external populations),17 additional data on vital signs and mental status could further improve risk adjustment. However, using automated data allowed us to study risk factors for unplanned transfer in a multi‐hospital cohort with a much larger population than has been previously studied. Serial data on vital signs and mental status both in the ED and during hospitalization could also be helpful in determining which unplanned transfers could be prevented with earlier recognition and intervention. Finally, all patient care occurred within an integrated healthcare delivery system. Thus, differences in case‐mix, hospital resources, ICU structure, and geographic location should be considered when applying our results to other healthcare systems.
This study raises several new areas for future research. With access to richer data becoming available in electronic medical records, prediction rules should be developed to enable better triage to appropriate levels of care for ED admissions. Future research should also analyze the comparative effectiveness of intermediate monitored units versus non‐monitored wards for preventing clinical deterioration by admitting diagnosis. Diagnoses that have been shown to have an increased risk of death after unplanned ICU transfer, such as pneumonia/respiratory infection and COPD,1 should be prioritized in this research. Better understanding is needed on the diagnosis‐specific differences and the differences in ED triage process and ICU structure that may explain why high‐volume hospitals have significantly lower rates of early unplanned ICU transfers compared with low‐volume hospitals. In particular, determining the effect of TCU and ICU capacities and census at the time of admission, and comparing patient risk characteristics across hospital‐volume strata would be very useful. Finally, more work is needed to determine whether the higher rate of unplanned transfers during overnight nursing shifts is related to decreased resource availability, preceding ED crowding, or other organizational causes.
In conclusion, patients admitted with respiratory conditions, sepsis, MI, high comorbidity, and abnormal labs are at modestly increased risk of unplanned ICU transfer within 24 hours of admission from the ED. Patients admitted with respiratory conditions (pneumonia/respiratory infections and COPD) accounted for half of the admitting diagnoses that are at increased risk for unplanned ICU transfer. These patients may benefit from better inpatient triage from the ED, earlier intervention, or closer monitoring. More research is needed to determine the specific aspects of care associated with admission to intermediate care units and high‐volume hospitals that reduce the risk of unplanned ICU transfer.
Acknowledgements
The authors thank John D. Greene, Juan Carlos La Guardia, and Benjamin Turk for their assistance with formatting of the dataset; Dr Alan S. Go, Acting Director of the Division of Research, for reviewing the manuscript; and Alina Schnake‐Mahl for formatting the manuscript.
- , , , et al. Adverse outcomes associated with delayed intensive care unit transfers in an integrated healthcare system. J Hosp Med. 2011;7(3):224–230.
- , , , et al. Inpatient transfers to the intensive care unit. J Gen Intern Med. 2003;18(2):77–83.
- , , , et al. Intra‐hospital transfers to a higher level of care: contribution to total hospital and intensive care unit (ICU) mortality and length of stay (LOS). J Hosp Med. 2011;6:74–80.
- , , , et al. Hospital‐wide code rates and mortality before and after implementation of a rapid response team. JAMA. 2008;300(21):2506–2513.
- , , , et al. Effect of a rapid response team on hospital‐wide mortality and code rates outside the ICU in a children's hospital. JAMA. 2007;298(19):2267–2274.
- , , , et al. Introduction of the medical emergency team (MET) system: a cluster‐randomised controlled trial. Lancet. 2005;365(9477):2091–2097.
- , , , et al. Rapid response systems: A systematic review. Crit Care Med. 2007;35(5):1238–1243.
- , , , et al. Effects of rapid response systems on clinical outcomes: systematic review and meta‐analysis. J Hosp Med. 2007;2(6):422–432.
- , , , et al. Rapid response teams: a systematic review and meta‐analysis. Arch Intern Med. 2010;170(1):18–26.
- , , , et al. Outreach and early warning systems (EWS) for the prevention of intensive care admission and death of critically ill adult patients on general hospital wards. Cochrane Database Syst Rev. 2007;3:CD005529.
- , , , et al. Unplanned transfers to a medical intensive care unit: Causes and relationship to preventable errors in care. J Hosp Med. 2011;6:68–72.
- , , , et al. Using administrative data to develop a nomogram for individualising risk of unplanned admission to intensive care. Resuscitation. 2008;79(2):241–248.
- , , , et al. Unplanned admission to intensive care after emergency hospitalisation: risk factors and development of a nomogram for individualising risk. Resuscitation. 2009;80(2):224–230.
- , , , et al. Risk‐adjusting hospital inpatient mortality using automated inpatient, outpatient, and laboratory databases. Med Care. 2008;46(3):232–239.
- . Linking automated databases for research in managed care settings. Ann Intern Med. 1997;127(8 pt 2):719–724.
- , , , et al. Risk adjusting community‐acquired pneumonia hospital outcomes using automated databases. Am J Manag Care. 2008;14(3):158–166.
- , , , et al. The Kaiser Permanente inpatient risk adjustment methodology was valid in an external patient population. J Clin Epidemiol. 2011;63(7):798–803.
- , , . Maximum likelihood estimation of limited and discrete dependent variable models with nested random effects. J Econometrics. 2005;128(2):301–323.
- . The relation between volume and outcome in health care. N Engl J Med. 1999;340(21):1677–1679.
- , , . Is volume related to outcome in health care? A systematic review and methodologic critique of the literature. Ann Intern Med. 2002;137(6):511–520.
- , , . Working with capacity limitations: operations management in critical care. Crit Care. 2011;15(4):308.
- , . Systematic review of emergency department crowding: causes, effects, and solutions. Ann Intern Med. 2008;52(2):126–136.
- , , , et al. The effect of emergency department crowding on clinically oriented outcomes. Acad Emerg Med. 2009;16(1):1–10.
- , , , et al. Association between time of admission to the ICU and mortality. Chest. 2010;138(1):68–75.
- , , , et al. Off‐hour admission and in‐hospital stroke case fatality in the get with the guidelines‐stroke program. Stroke. 2009;40(2):569–576.
- , , , et al. Relationship between time of day, day of week, timeliness of reperfusion, and in‐hospital mortality for patients with acute ST‐segment elevation myocardial infarction. JAMA. 2005;294(7):803–812.
- , , , et al. Hospital mortality among adults admitted to and discharged from intensive care on weekends and evenings. J Crit Care. 2008;23(3):317–324.
- , , , et al. Association between ICU admission during morning rounds and mortality. Chest. 2009;136(6):1489–1495.
- , , , et al. Identifying infected emergency department patients admitted to the hospital ward at risk of clinical deterioration and intensive care unit transfer. Acad Emerg Med. 2010;17(10):1080–1085.
- , , , et al. Risk stratification of early admission to the intensive care unit of patients with no major criteria of severe community‐acquired pneumonia: development of an international prediction rule. Crit Care. 2009;13(2):R54.
Copyright © 2012 Society of Hospital Medicine

Continuing Medical Education Program in
If you wish to receive credit for this activity, which begins on the next page, please refer to the website:
Accreditation and Designation Statement
Blackwell Futura Media Services designates this educational activity for a 1 AMA PRA Category 1 Credit. Physicians should only claim credit commensurate with the extent of their participation in the activity.
Blackwell Futura Media Services is accredited by the Accreditation Council for Continuing Medical Education to provide continuing medical education for physicians.
Educational Objectives
Upon completion of this educational activity, participants will be better able to employ automated bed history data to examine outcomes of intra‐hospital transfers using all hospital admissions as the denominator.
Continuous participation in the Journal of Hospital Medicine CME program will enable learners to be better able to:
-
Interpret clinical guidelines and their applications for higher quality and more efficient care for all hospitalized patients.
-
Describe the standard of care for common illnesses and conditions treated in the hospital; such as pneumonia, COPD exacerbation, acute coronary syndrome, HF exacerbation, glycemic control, venous thromboembolic disease, stroke, etc.
-
Discuss evidence‐based recommendations involving transitions of care, including the hospital discharge process.
-
Gain insights into the roles of hospitalists as medical educators, researchers, medical ethicists, palliative care providers, and hospital‐based geriatricians.
-
Incorporate best practices for hospitalist administration, including quality improvement, patient safety, practice management, leadership, and demonstrating hospitalist value.
-
Identify evidence‐based best practices and trends for both adult and pediatric hospital medicine.
Instructions on Receiving Credit
For information on applicability and acceptance of continuing medical education credit for this activity, please consult your professional licensing board.
This activity is designed to be completed within the time designated on the title page; physicians should claim only those credits that reflect the time actually spent in the activity. To successfully earn credit, participants must complete the activity during the valid credit period that is noted on the title page.
Follow these steps to earn credit:
-
Log on to
www.blackwellpublishing.com/cme . -
Read the target audience, learning objectives, and author disclosures.
-
Read the article in print or online format.
-
Reflect on the article.
-
Access the CME Exam, and choose the best answer to each question.
-
Complete the required evaluation component of the activity.
Intra‐Hospital Transfer to a Higher Level of Care
Considerable research and public attention is being paid to the quantification, risk adjustment, and reporting of inpatient mortality.15 Inpatient mortality is reported as aggregate mortality (for all hospitalized patients or those with a specific diagnosis3, 6) or intensive care unit (ICU) mortality.7, 8 While reporting aggregate hospital or aggregate ICU mortality rates is useful, it is also important to develop reporting strategies that go beyond simply using data elements found in administrative databases (eg, diagnosis and procedure codes) to quantify practice variation. Ideally, such strategies would permit delineating processes of careparticularly those potentially under the control of hospitalists, not only intensiviststo identify improvement opportunities. One such process, which can be tracked using the bed history component of a patient's electronic medical record, is the transfer of patients between different units within the same hospital.
Several studies have documented that risk of ICU death is highest among patients transferred from general medical‐surgical wards, intermediate among direct admissions from the emergency department, and lowest among surgical admissions.911 Opportunities to reduce subsequent ICU mortality have been studied among ward patients who develop sepsis and are then transferred to the ICU,12 among patients who experience cardiac arrest,13, 14 as well as among patients with any physiological deterioration (eg, through the use of rapid response teams).1517 Most of these studies have been single‐center studies and/or studies reporting only an ICU denominator. While useful in some respects, such studies are less helpful to hospitalists, who would benefit from better understanding of the types of patients transferred and the total impact that transfers to a higher level of care make on general medical‐surgical wards. In addition, entities such as the Institute for Healthcare Improvement recommend the manual review of records of patients who were transferred from the ward to the ICU18 to identify performance improvement opportunities. While laudable, such approaches do not lend themselves to automated reporting strategies.
We recently described a new risk adjustment methodology for inpatient mortality based entirely on automated data preceding hospital admission and not restricted to ICU patients. This methodology, which has been externally validated in Ottawa, Canada, after development in the Kaiser Permanente Medical Care Program (KPMCP), permits quantification of a patient's pre‐existing comorbidity burden, physiologic derangement at the time of admission, and overall inpatient mortality risk.19, 20 The primary purpose of this study was to combine this methodology with bed history analysis to quantify the in‐hospital mortality and length of stay (LOS) of patients who experienced intra‐hospital transfers in a large, multihospital system. As a secondary goal, we also wanted to assess the degree to which these transfers could be predicted based on information available prior to a patient's admission.
ABBREVIATIONS AND TERMS USED IN TEXT
COPS: COmorbidity Point Score. Point score based on a patient's health care utilization diagnoses (during the year preceding admission to the hospital. Analogous to POA (present on admission) coding. Scores can range from 0 to a theoretical maximum of 701 but scores >200 are rare. With respect to a patient's pre‐existing comorbidity burden, the unadjusted relationship of COPS and inpatient mortality is as follows: a COPS <50 is associated with a mortality risk of <1%, <100 with a mortality risk of <5%, 100 to 145 with a mortality risk of 5% to 10%, and >145 with a mortality risk of 10% or more.
ICU: Intensive Care Unit. In this study, all ICUs have a minimum registered nurse to patient ratio of 1:2.
LAPS: Laboratory Acute Physiology Score. Point score based on 14 laboratory test results obtained in the 72 hours preceding hospitalization. With respect to a patient's physiologic derangement, the unadjusted relationship of LAPS and inpatient mortality is as follows: a LAPS <7 is associated with a mortality risk of <1%, <7 to 30 with a mortality risk of <5%, 30 to 60 with a mortality risk of 5% to 9%, and >60 with a mortality risk of 10% or more.
LOS: Exact hospital Length Of Stay. LOS is calculated from admission until first discharge home (i.e., it may span more than one hospital stay if a patient experienced inter‐hospital transport).
Predicted (expected) mortality risk: the % risk of death for a given patient based on his/her age, sex, admission diagnosis, COPS, and LAPS.
OEMR: Observed to Expected Mortality Ratio. For a given patient subset, the ratio of the actual mortality experienced by the subset to the expected (predicted) mortality for the subset. Predicted mortality is based on patients' age, sex, admission diagnosis, COPS, and LAPS.
OMELOS: Observed Minus Expected LOS. For a given patient subset, the difference between the actual number of hospital days experienced by the subset and the expected (predicted) number of hospital days for the subset. Predicted LOS is based on patients' age, sex, admission diagnosis, COPS, and LAPS.
TCU: Transitional Care Unit (also called intermediate care unit or stepdown unit). In this study, TCUs have variable nurse to patient ratios ranging from 1:2.5 to 1:3 and did not provide assisted ventilation, continuous pressor infusions, or invasive monitoring.
Materials and Methods
This project was approved by the Northern California KPMCP Institutional Review Board for the Protection of Human Subjects.
The Northern California KPMCP serves a total population of approximately 3.3 million members. Under a mutual exclusivity arrangement, physicians of The Permanente Medical Group, Inc., care for Kaiser Foundation Health Plan, Inc. members at facilities owned by Kaiser Foundation Hospitals, Inc. All Northern California KPMCP hospitals and clinics employ the same information systems with a common medical record number and can track care covered by the plan but delivered elsewhere. Databases maintained by the KPMCP capture admission and discharge times, admission and discharge diagnoses and procedures (assigned by professional coders), bed histories, inter‐hospital transfers, as well as the results of all inpatient and outpatient laboratory tests. The use of these databases for research has been described in multiple reports.2124
Our setting consisted of all 19 hospitals owned and operated by the KPMCP, whose characteristics are summarized in the Supporting Information Appendix available to interested readers. These include the 17 described in our previous report19 as well as 2 new hospitals (Antioch and Manteca) which are similar in size and type of population served. Our study population consisted of all patients admitted to these 19 hospitals who met these criteria: 1) hospitalization began from November 1st, 2006 through January 31st, 2008; 2) initial hospitalization occurred at a Northern California KPMCP hospital (ie, for inter‐hospital transfers, the first hospital stay occurred within the KPMCP); 3) age 15 years; and 4) hospitalization was not for childbirth.
We defined a linked hospitalization as the time period that began with a patient's admission to the hospital and ended with the patient's discharge (home, to a nursing home, or death). Linked hospitalizations can thus involve more than 1 hospital stay and could include a patient transfer from one hospital to another prior to definitive discharge. For linked hospitalizations, mortality was attributed to the admitting KPMCP hospital (ie, if a patient was admitted to hospital A, transferred to B, and died at hospital B, mortality was attributed to hospital A). We defined total LOS as the exact time in hours from when a patient was first admitted to the hospital until death or final discharge home or to a nursing home, while total ICU or transitional care unit (TCU, referred to as stepdown unit in some hospitals) LOS was calculated for all individual ICU or TCU stays during the hospital stay.
Intra‐Hospital Transfers
We grouped all possible hospital units into four types: general medical‐surgical ward (henceforth, ward); operating room (OR)/post‐anesthesia recovery (PAR); TCU; and ICU. In 2003, the KPMCP implemented a mandatory minimum staffing ratio of one registered nurse for every four patients in all its hospital units; in addition, staffing levels for designated ICUs adhered to the previously mandated minimum of one nurse for every 2 patients. So long as they adhere to these minimum ratios, individual hospitals have considerable autonomy with respect to how they staff or designate individual hospital units. Registered nurse‐to‐patient ratios during the time of this study were as follows: ward patients, 1:3.5 to 1:4; TCU patients, 1:2.5 to 1:3; and ICU patients, 1:1 to 1:2. Staffing ratios for the OR and PAR are more variable, depending on the surgical procedures involved. Current KPMCP databases do not permit accurate quantification of physician staffing. All 19 study hospitals had designated ICUs, 6 were teaching hospitals, and 11 had designated TCUs. None of the study hospitals had closed ICUs (units where only intensivists admit patients) and none had continuous coverage of the ICU by intensivists. While we were not able to employ electronic data to determine who made the decision to transfer, we did find considerable variation with respect to how intensivists covered the ICUs and how they interfaced with hospitalists. Staffing levels for specialized coronary care units and non‐ICU monitored beds were not standardized. All study hospitals had rapid response teams as well as code blue teams during the time period covered by this report. Respiratory care practitioners were available to patients in all hospital units, but considerable variation existed with respect to other services available (eg, cardiac catheterization units, provision of noninvasive positive pressure ventilation outside the ICU, etc.).
This report focuses on intra‐hospital transfers to the ICU and TCU, with special emphasis on nonsurgical transfers (due to space limitations, we are not reporting on the outcomes of patients whose first hospital unit was the OR; additional details on these patients are provided in the Supporting Information Appendix). For the purposes of this report, we defined the following admission types: direct admits (patients admitted to the ICU or TCU whose first hospital unit on admission was the ICU or TCU); and nonsurgical transfers to a higher level of care. These latter transfers could be of 3 types: ward to ICU, ward to TCU, and TCU to ICU. We also quantified the effect of inter‐hospital transfers.
Independent Variables
In addition to patients' age and sex, we employed the following independent variables to predict transfer to a higher level of care. These variables are part of the risk adjustment model described in greater detail in our previous report19 and were available electronically for all patients in the cohort. We grouped admission diagnoses into 44 broad diagnostic categories (Primary Conditions), and admission types into 4 groups (emergency medical, emergency surgical, elective medical, and elective surgical). We quantified patients' degree of physiologic derangement using a Laboratory‐based Acute Physiology Score (LAPS) using laboratory test results prior to hospitalization. We quantified patients' comorbid illness burden using a Comorbidity Point Score (COPS) based on patients' pre‐existing diagnoses over the 12‐month period preceding hospitalization. Lastly, we assigned each patient a predicted mortality risk (%) and LOS based on the above predictors,19 permitting calculation of observed to expected mortality ratios (OEMRs) and observed minus expected LOS (OMELOS).
Statistical Methods
All analyses were performed in SAS.25 We calculated standard descriptive statistics (medians, means, standard deviations) and compared different patient groupings using t and chi‐square tests. We employed a similar approach to that reported by Render et al.7 to calculate OEMR and OMELOS.
To determine the degree to which transfers to a higher level of care from the ward or TCU would be predictable using information available at the time of admission, we performed 4 sets of logistic regression analyses using the above‐mentioned predictors in which the outcome variables were as follows: 1) transfer occurring in the first 48 hours after admission (time frame by which point approximately half of the transferred patients experienced a transfer) among ward or TCU patients and 2) transfer occurring after 48 hours among ward or TCU patients. We evaluated the discrimination and calibration of these models using the same methods described in our original report (measuring the area under the receiver operator characteristic curve, or c statistic, and visually examining observed and expected mortality rates among predicted risk bands as well as risk deciles) as well as additional statistical tests recommended by Cook.19, 26
Results
During the study period, a total of 249,129 individual hospital stays involving 170,151 patients occurred at these 19 hospitals. After concatenation of inter‐hospital transfers, we were left with 237,208 linked hospitalizations. We excluded 26,738 linked hospitalizations that began at a non‐KPMCP hospital (ie, they were transported in), leaving a total of 210,470 linked hospitalizations involving 150,495 patients. The overall linked hospitalization mortality rate was 3.30%.
Table 1 summarizes cohort characteristics based on initial hospital location. On admission, ICU patients had the highest degree of physiologic derangement as well as the highest predicted mortality. Considerable inter‐hospital variation was present in both predictors and outcomes; details on these variations are provided in the Supporting Information Appendix.
| Ward | TCU | ICU | All* | |
|---|---|---|---|---|
| ||||
| n | 121,237 | 20,556 | 16,001 | 210,470 |
| Admitted via emergency department, n (%) | 99,909 (82.4) | 18,612 (90.5) | 13,847 (86.5) | 139,036 (66.1) |
| % range across hospitals | 55.0‐94.2 | 64.7‐97.6 | 49.5‐97.4 | 53.6‐76.9 |
| Male, n (%) | 53,744 (44.3) | 10,362 (50.4) | 8,378 (52.4) | 94,451 (44.9) |
| Age in years (mean SD) | 64.5 19.2 | 69.0 15.6 | 63.7 17.8 | 63.2 18.6 |
| LAPS (mean SD) | 19.2 18.0 | 23.3 19.5 | 31.7 25.7 | 16.7 19.0 |
| COPS (mean SD) | 90.4 64.0 | 99.2 65.9 | 94.5 67.5 | 84.7 61.8 |
| % predicted mortality (mean SD) | 4.0 7.1 | 4.6 7.3 | 8.7 12.8 | 3.6 7.3 |
| Observed in‐hospital deaths (n, %) | 3,793 (3.1) | 907 (4.4) | 1,995 (12.5) | 6,952 (3.3) |
| Observed to expected mortality ratio | 0.79 (0.77‐0.82) | 0.95 (0.89‐1.02) | 1.43 (1.36‐1.49) | 0.92 (0.89‐0.94) |
| Total hospital LOS, days (mean SD) | 4.6 7.5 | 5.3 10.0 | 7.8 14.0 | 4.6 8.1 |
Table 2 summarizes data from 3 groups of patients: patients initially admitted to the ward, or TCU, who did not experience a transfer to a higher level of care and patients admitted to these 2 units who did experience such a transfer. Patients who experienced a transfer constituted 5.3% (6,484/121,237) of ward patients and 6.7% (1,384/20,556) of TCU patients. Transferred patients tended to be older, have more acute physiologic derangement (higher LAPS), a greater pre‐existing illness burden (higher COPS), and a higher predicted mortality risk. Among ward patients, those with the following admission diagnoses were most likely to experience a transfer to a higher level of care: gastrointestinal bleeding (10.8% of all transfers), pneumonia (8.7%), and other infections (8.2%). The diagnoses most likely to be associated with death following transfer were cancer (death rate among transferred patients, 48%), renal disease (death rate, 36%), and liver disease (33%). Similar distributions were observed for TCU patients.
| Patients Initially Admitted to Ward, Remained There | Patients Initially Admitted to TCU, Remained There | Patients Transferred to Higher Level of Care | All | |
|---|---|---|---|---|
| ||||
| n | 114,753 | 19,172 | 7,868 | 141,793 |
| Male, n (%) | 50,586 (44.1) | 9,626 (50.2) | 3,894 (49.5) | 64,106 (45.2) |
| Age (mean SD) | 64.3 19.4 | 69.0 15.7 | 68.1 16.1 | 65.2 18.8 |
| LAPS (mean SD) | 18.9 17.8 | 22.7 19.1 | 26.7 21.0 | 19.8 18.3 |
| COPS (mean SD) | 89.4 63.7 | 98.3 65.5 | 107.9 67.6 | 91.7 64.4 |
| % predicted mortality risk (mean SD) | 3.8 7.0 | 4.4 7.0 | 6.5 8.8 | 4.1 7.1 |
| Admission diagnosis of pneumonia, n (%) | 5,624 (4.9) | 865 (4.5) | 684 (8.7) | 7,173 (5.1) |
| Admission diagnosis of sepsis, n (%) | 1,181 (1.0) | 227 (1.2) | 168 (2.1) | 1,576 (1.1) |
| Admission diagnosis of GI bleed, n (%) | 13,615 (11.9) | 1,448 (7.6) | 851 (10.8) | 15,914 (11.2) |
| Admission diagnosis of cancer, n (%) | 2,406 (2.1) | 80 (0.4) | 186 (2.4) | 2,672 (1.9) |
Table 3 compares outcomes among ward and TCU patients who did and did not experience a transfer to a higher level of care. The table shows that transferred patients were almost 3 times as likely to die, even after controlling for severity of illness, and that their hospital LOS was 9 days higher than expected. This increased risk was seen in all hospitals and among all transfer types (ward to ICU, ward to TCU, and TCU to ICU).
| Patients Initially Admitted to Ward, Remained There | Patients Initially Admitted to TCU, Remained There | Patients Transferred to Higher Level of Care | |
|---|---|---|---|
| |||
| n | 114,753 | 19,172 | 7,868 |
| Admitted to ICU, n (%) | 0 (0.0) | 0 (0.0) | 5,245 (66.7) |
| Ventilated, n (%) | 0 (0.0) | 0 (0.0) | 1,346 (17.1) |
| Died in the hospital, n (%) | 2,619 (2.3) | 572 (3.0) | 1,509 (19.2) |
| Length of stay, in days, at time of death (mean SD) | 7.0 11.9 | 8.3 12.4 | 16.2 23.7 |
| Observed to expected mortality ratio (95% CI) | 0.60 (0.57‐0.62) | 0.68 (0.63‐0.74) | 2.93 (2.79‐3.09) |
| Total hospital length of stay, days (mean SD) | 4.0 5.7 | 4.4 6.9 | 14.3 21.3 |
| Observed minus expected length of stay (95% CI) | 0.4 (0.3‐0.4) | 0.8 (0.7‐0.9) | 9.1 (8.6‐9.5) |
| Length of stay, in hours, at time of transfer (mean SD) | 80.8 167.2 | ||
Table 3 also shows that, among decedent patients, those who never left the ward or TCU died much sooner than those who died following transfer. Among direct admits to the ICU, the median LOS at time of death was 3.9 days, with a mean of 9.4 standard deviation of 19.9 days, while the corresponding times for TCU direct admits were a median and mean LOS of 6.5 and 11.7 19.5 days.
Table 4 summarizes outcomes among different patient subgroups that did and did not experience a transfer to a higher level of care. Based on location, patients who experienced a transfer from the TCU to the ICU had the highest crude death rate, but patients transferred from the ward to the ICU had the highest OEMR. On the other hand, if one divides patients by the degree of physiologic derangement, patients with low LAPS who experienced a transfer had the highest OEMR. With respect to LOS, patients transferred from the TCU to the ICU had the highest OMELOS (13.4 extra days).
| n (%)* | Death Rate (%) | OEMR | LOS (mean SD) | OMELOS | |
|---|---|---|---|---|---|
| |||||
| Never admitted to TCU or ICU | 157,632 (74.9) | 1.6 | 0.55 (0.53‐0.57) | 3.6 4.6 | 0.04 (0.02‐0.07) |
| Direct admit to TCU | 18,464 (8.8) | 2.9 | 0.66 (0.61‐0.72) | 4.2 5.8 | 0.60 (0.52‐0.68) |
| Direct admit to ICU | 14,655 (7.0) | 11.9 | 1.38 (1.32‐1.45) | 6.4 9.4 | 2.28 (2.14‐2.43) |
| Transferred from ward to ICU | 5,145 (2.4) | 21.5 | 3.23 (3.04‐3.42) | 15.7 21.6 | 10.33 (9.70‐10.96) |
| Transferred from ward to TCU | 3,144 (1.5) | 11.9 | 1.99 (1.79‐2.20) | 13.6 23.2 | 8.02 (7.23‐8.82) |
| Transferred from TCU to ICU | 1,107 (0.5) | 25.7 | 2.94 (2.61‐3.31) | 18.0 28.2 | 13.35 (11.49‐15.21) |
| Admitted to ward, COPS 80, no transfer to ICU or TCU | 55,405 (26.3) | 3.4 | 0.59 (0.56‐0.62) | 4.5 5.9 | 0.29 (0.24‐0.34) |
| Admitted to ward, COPS 80, did experience transfer to ICU or TCU | 4,851 (2.3) | 19.3 | 2.72 (2.55‐2.90) | 14.2 20.0 | 8.14 (7.56‐8.71) |
| Admitted to ward, COPS <80, no transfer to ICU or TCU | 57,421 (27.3) | 1.1 | 0.55 (0.51‐0.59) | 3.4 4.2 | 0.23 (0.19‐0.26) |
| Admitted to ward, COPS <80, did experience transfer to ICU or TCU | 3,560 (1.7) | 9.8 | 2.93 (2.63‐3.26) | 12.0 19.0 | 7.52 (6.89‐8.15) |
| Admitted to ward, LAPS 20, no transfer to ICU or TCU | 46,492 (22.1) | 4.2 | 0.59 (0.56‐0.61) | 4.6 5.4 | 0.16 (0.12‐0.21) |
| Admitted to ward, LAPS 20, did experience transfer to ICU or TCU | 4,070 (1.9) | 21.4 | 2.37 (2.22‐2.54) | 14.8 21.0 | 8.76 (8.06‐9.47) |
| Admitted to ward, LAPS <20, no transfer to ICU or TCU | 66,334 (31.5) | 0.9 | 0.55 (0.51‐0.60) | 3.5 4.9 | 0.32 (0.28‐0.36) |
| Admitted to ward, LAPS <20, did experience transfer to ICU or TCU | 4,341 (2.1) | 9.5 | 4.31 (3.90‐4.74) | 11.8 18.1 | 7.12 (6.61‐7.64) |
Transfers to a higher level of care at a different hospital, which in the KPMCP are usually planned, experienced lower mortality than transfers within the same hospital. For ward to TCU transfers, intra‐hospital transfers had a mortality of 12.1% while inter‐hospital transfers had a mortality of 5.7%. Corresponding rates for ward to ICU transfers were 21.7% and 11.2%, and for TCU to ICU transfers the rates were 25.9% and 12.5%, respectively.
Among patients initially admitted to the ward, a model to predict the occurrence of a transfer to a higher level of care (within 48 hours after admission) that included age, sex, admission type, primary condition, LAPS, COPS, and interaction terms had poor discrimination, with an area under the receiver operator characteristic (c statistic) of only 0.64. The c statistic for a model to predict transfer after 48 hours was 0.66. The corresponding models for TCU admits had c statistics of 0.67 and 0.68. All four models had poor calibration.
Discussion
Using automated bed history data permits characterizing a patient population with disproportionate mortality and LOS: intra‐hospital transfers to special care units (ICUs or TCUs). Indeed, the largest subset of these patients (those initially admitted to the ward or TCU) constituted only 3.7% of all admissions, but accounted for 24.2% of all ICU admissions, 21.7% of all hospital deaths, and 13.2% of all hospital days. These patients also had very elevated OEMRs and OMELOS. Models based on age, sex, preadmission laboratory test results, and comorbidities did not predict the occurrence of these transfers.
We performed multivariate analyses to explore the degree to which electronically assigned preadmission severity scores could predict these transfers. These analyses found that, compared to our ability to predict inpatient or 30‐day mortality at the time of admission, which is excellent, our ability to predict the occurrence of transfer after admission is much more limited. These results highlight the limitations of severity scores that rely on automated data, which may not have adequate discrimination when it comes to determining the risk of an adverse outcome within a narrow time frame. For example, among the 121,237 patients initially admitted to the ward who did not experience an intra‐hospital transfer, the mean LAPS was 18.9, while the mean LAPS among the 6,484 ward patients who did experience a transfer was 25.5. Differences between the mean and median LAPS, COPS, and predicted mortality risk among transferred and non‐transferred patients were significant (P < 0.0001 for all comparisons). However, examination of the distribution of LAPS, COPS, and predicted mortality risk between these two groups of patients showed considerable overlap.
Our methodology resembles Silber et al.'s27, 28 concept of failure to rescue in that it focuses on events occurring after hospitalization. Silber et al. argue that a hospital's quality can be measured by quantifying the degree to which patients who experience new problems are successfully rescued. Furthermore, quantification of those situations where rescue attempts are unsuccessful is felt to be superior to simply comparing raw or adjusted mortality rates because these are primarily determined by underlying case mix. The primary difference between Silber et al.'s approach and ours is at the level of detailthey specified a specific set of complications, whereas our measure is more generic and would include patients with many of the complications specified by Silber et al.27, 28
Most of the patients transferred to a higher level of care in our cohort survived (ie, were rescued), indicating that intensive care is beneficial. However, the fact that these patients had elevated OEMRs and OMELOS indicates that the real challenge facing hospitalists involves the timing of provision of a beneficial intervention. In theory, improved timing could result from earlier detection of problems, which is the underlying rationale for employing rapid response teams. However, the fact that our electronic tools (LAPS, COPS) cannot predict patient deteriorations within a narrow time frame suggests that early detection will remain a major challenge. Manually assigned vital signs scores designed for this purpose do not have good discrimination either.29, 30 This raises the possibility that, though patient groups may differ in terms of overall illness severity and mortality risk, differences at the individual patient level may be too subtle for clinicians to detect. Future research may thus need to focus on scores that combine laboratory data, vital signs, trends in data,31, 32 and newer proteomic markers (eg, procalcitonin).33 We also found that most transfers occurred early (within <72 hours), raising the possibility that at least some of these transfers may involve issues around triage rather than sudden deterioration.
Our study has important limitations. Due to resource constraints and limited data availability, we could not characterize the patients as well as might be desirable; in particular, we could not make full determinations of the actual reasons for patients' transfer for all patients. Broadly speaking, transfer to a higher level of care could be due to inappropriate triage, appropriate (preventive) transfer (which could include transfer to a more richly staffed unit for a specific procedure), relentless progression of disease despite maximal therapy, the occurrence of management errors, patient and family uncertainty about goals of care or inadequate understanding of treatment options and prognoses, or a combination of these factors. We could not make these distinctions with currently available electronic data. This is also true of postsurgical patients, in whom it is difficult to determine which transfers to intensive care might be planned (eg, in the case of surgical procedures where ICU care is anticipated) as opposed to the occurrence of a deterioration during or following surgery. Another major limitation of this study is our inability to identify code or no code status electronically. The elapsed LOS at time of death among patients who experienced a transfer to a higher level of care (as compared to patients who died in the ward without ever experiencing intra‐hospital transfer) suggests, but does not prove, that prolonged efforts were being made to keep them alive. We were also limited in terms of having access to other process data (eg, physician staffing levels, provision and timing of palliative care). Having ICU severity of illness scores would have permitted us to compare our cohort to those of other recent studies showing elevated mortality rates among transfer patients,911 but we have not yet developed that capability.
Consideration of our study findings suggests a possible research agenda that could be implemented by hospitalist researchers. This agenda should emphasize three areas: detection, intervention, and reflection.
With respect to detection, attention needs to be paid to better tools for quantifying patient risk at the time a decision to admit to the ward is made. It is likely that such tools will need to combine the attributes of our severity score (LAPS) with those of the manually assigned scores.30, 34 In some cases, use of these tools could lead a physician to change the locus of admission from the ward to the TCU or ICU, which could improve outcomes by ensuring more timely provision of intensive care. Since problems with initial triage could be due to factors other than the failure to suspect or anticipate impending instability, future research should also include a cognitive component (eg, quantifying what proportion of subsequent patient deteriorations could be ascribed to missed diagnoses35). Additional work also needs to be done on developing mathematical models that can inform electronic monitoring of ward (not just ICU) patients.
Research on interventions that hospitalists can use to prevent the need for intensive care or to improve the rescue rate should take two routes. The first is a disease‐specific route, which builds on the fact that a relatively small set of conditions (pneumonia, sepsis, gastrointestinal bleeding) account for most transfers to a higher level of care. Condition‐specific protocols, checklists, and bundles36 tailored to a ward environment (as opposed to the ICU or to the entire hospital) might prevent deteriorations in these patients, as has been reported for sepsis.37 The second route is to improve the overall capabilities of rapid response and code blue teams. Such research would need to include a more careful assessment of what commonalities exist among patients who were and were not successfully rescued by these teams. This approach would probably yield more insights than the current literature, which focuses on whether rapid response teams are a good thing or not.
Finally, research also needs to be performed on how hospitalists reflect on adverse outcomes among ward patients. Greater emphasis needs to be placed on moving beyond trigger tool approaches that rely on manual chart review. In an era of expanding use of electronic medical record systems, more work needs to be done on how to harness these to provide hospitalists with better quantitative and risk‐adjusted information. This information should not be limited to simply reporting rates of transfers and deaths. Rather, finer distinctions must be provided with respect of the type of patients (ie, more diagnostic detail), the clinical status of patients (ie, more physiologic detail), as well as the effects of including or excluding patients in whom therapeutic options may be limited (ie, do not resuscitate and comfort care patients) on reported rates. Ideally, researchers should develop better process and outcomes measures that could be tested in collaborative networks that include multiple nonacademic general medical‐surgical wards.
Acknowledgements
The authors thank Drs. Paul Feigenbaum, Alan Whippy, Joseph V. Selby, and Philip Madvig for reviewing the manuscript and Ms. Jennifer Calhoun for formatting the manuscript.
- ,,.To Err is Human: Building a Safer Health System.Washington, D. C.:National Academy Press;2000.
- Institute for Healthcare Improvement. Protecting 5 million lives from harm. Available at: http://www.ihi.org/IHI/Programs/Campaign. Accessed June2010.
- ,.Identifying poor‐quality hospitals. Can hospital mortality rates detect quality problems for medical diagnoses?Med Care.1996;34(8):737–753.
- ,,.Surgical mortality as an indicator of hospital quality: the problem with small sample size.JAMA.2004;292(7):847–851.
- State of California Office of Statewide Health Planning and Development. AHRQ ‐ Inpatient quality indicators (IQIs) hospital inpatient mortality indicators for California. Available at: http://www.oshpd.ca.gov/HID/Products/PatDischargeData/AHRQ/iqi‐imi_overview.html. Accessed June2010.
- ,,, et al.Enhancement of claims data to improve risk adjustment of hospital mortality.JAMA.2007;297(1):71–76.
- ,,, et al.Variation in outcomes in Veterans Affairs intensive care units with a computerized severity measure.Crit Care Med.2005;33(5):930–939.
- ,,,.Acute Physiology and Chronic Health Evaluation (APACHE) IV: hospital mortality assessment for today's critically ill patients.Crit Care Med.2006;34(5):1297–1310.
- ,,,.Day of the week of intensive care admission and patient outcomes: a multisite regional evaluation.Med Care.2002;40(6):530–539.
- ,,, et al.The hospital mortality of patients admitted to the ICU on weekends.Chest.2004;126(4):1292–1298.
- ,,, et al.Mortality among patients admitted to intensive care units during weekday day shifts compared with “off” hours.Crit Care Med.2007;35(1):3–11.
- ,,, et al.Septic shock: an analysis of outcomes for patients with onset on hospital wards versus intensive care units.Crit Care Med.1998;26(6):1020–1024.
- ,,,,.Clinical antecedents to in‐hospital cardiopulmonary arrest.Chest.1990;98(6):1388–1392.
- ,.Developing strategies to prevent inhospital cardiac arrest: analyzing responses of physicians and nurses in the hours before the event.Crit Care Med.1994;22(2):244–247.
- MERIT Study Investigators.Introduction of the medical emergency team (MET) system: a cluster‐randomized controlled trial.Lancet.2005;365(9477):2091–2097.
- Institute for Healthcare Improvement.The “MERIT” Trial of Medical Emergency Teams in Australia: An Analysis of Findings and Implications.Boston, MA:2005. Available on www.ihi.org
- ,,.Rapid response teams‐‐walk, don't run.JAMA.2006;296(13):1645–1647.
- ,.IHI Global Trigger Tool for Measuring Adverse Events.2nd ed.Cambridge, Massachusetts:Institute for Healthcare Improvement;2009.
- ,,,,,.Risk adjusting hospital inpatient mortality using automated inpatient, outpatient, and laboratory databases.Medical Care.2008;46(3):232–239.
- ,,,.The Kaiser Permanente inpatient risk adjustment methodology was valid in an external patient population.J Clin Epidemiol.2010;63(7):798–803.
- .Linking automated databases for research in managed care settings.Ann Intern Med.1997;127(8 Pt 2):719–724.
- ,,, et al.Anticoagulation therapy for stroke prevention in atrial fibrillation: how well do randomized trials translate into clinical practice?JAMA.2003;290(20):2685–2692.
- ,,, et al.Richardson score predicts short‐term adverse respiratory outcomes in newborns >/=34 weeks gestation.J Pediatr.2004;145(6):754–760.
- ,,, et al.Risk adjusting community‐acquired pneumonia hospital outcomes using automated databases.Am J Manag Care.2008;14(3):158–166.
- Statistical Analysis Software [computer program]. Version 8.Cary, NC:SAS Institute, Inc.;2000.
- .Use and misuse of the receiver operating characteristic curve in risk prediction.Circulation.2007;115(7):928–935.
- ,,,.Hospital and patient characteristics associated with death after surgery. A study of adverse occurrence and failure to rescue.Med Care.1992;30(7):615–629.
- ,,.Comparing the contributions of groups of predictors: which outcomes vary with hospital rather than patient characteristics?J Am Stat Assoc.1995;90(429):7–18.
- ,.Beyond the intensive care unit: A review of interventions aimed at anticipating and preventing in‐hospital cardiopulmonary arrest.Resuscitation.2005;67(1):13–23.
- ,,.Reproducibility of physiological track‐and‐trigger warning systems for identifying at‐risk patients on the ward.Intensive Care Med.2007;33(4):619–624.
- ,,,,.Serial evaluation of the SOFA score to predict outcome in critically ill patients.JAMA.2001;286(14):1754–1758.
- ,,.Incorporation of Physiologic Trend and Interaction Effects in Neonatal Severity of Illness Scores: An Experiment Using a Variant of the Richardson Score.Intensive Care Med.2007;33(9):1602–1608.
- ,,, et al.Diagnostic and prognostic value of procalcitonin in patients with septic shock.Crit Care Med.2004;32(5):1166–1169.
- ,,, et al.Identifying the sick: can biochemical measurements be used to aid decision making on presentation to the accident and emergency department.Br J Anaesth.2005;94(6):735–741.
- .Improving patient care. The cognitive psychology of missed diagnoses.Ann Intern Med.2005;142(2):115–120.
- ,,,,,.Using care bundles to reduce in‐hospital mortality: quantitative survey.BMJ.2010;340:c1234.
- ,,, et al.Effect of a rapid response system for patients in shock on time to treatment and mortality during 5 years.Crit Care Med.2007;35(11):2568–2575.
Considerable research and public attention is being paid to the quantification, risk adjustment, and reporting of inpatient mortality.15 Inpatient mortality is reported as aggregate mortality (for all hospitalized patients or those with a specific diagnosis3, 6) or intensive care unit (ICU) mortality.7, 8 While reporting aggregate hospital or aggregate ICU mortality rates is useful, it is also important to develop reporting strategies that go beyond simply using data elements found in administrative databases (eg, diagnosis and procedure codes) to quantify practice variation. Ideally, such strategies would permit delineating processes of careparticularly those potentially under the control of hospitalists, not only intensiviststo identify improvement opportunities. One such process, which can be tracked using the bed history component of a patient's electronic medical record, is the transfer of patients between different units within the same hospital.
Several studies have documented that risk of ICU death is highest among patients transferred from general medical‐surgical wards, intermediate among direct admissions from the emergency department, and lowest among surgical admissions.911 Opportunities to reduce subsequent ICU mortality have been studied among ward patients who develop sepsis and are then transferred to the ICU,12 among patients who experience cardiac arrest,13, 14 as well as among patients with any physiological deterioration (eg, through the use of rapid response teams).1517 Most of these studies have been single‐center studies and/or studies reporting only an ICU denominator. While useful in some respects, such studies are less helpful to hospitalists, who would benefit from better understanding of the types of patients transferred and the total impact that transfers to a higher level of care make on general medical‐surgical wards. In addition, entities such as the Institute for Healthcare Improvement recommend the manual review of records of patients who were transferred from the ward to the ICU18 to identify performance improvement opportunities. While laudable, such approaches do not lend themselves to automated reporting strategies.
We recently described a new risk adjustment methodology for inpatient mortality based entirely on automated data preceding hospital admission and not restricted to ICU patients. This methodology, which has been externally validated in Ottawa, Canada, after development in the Kaiser Permanente Medical Care Program (KPMCP), permits quantification of a patient's pre‐existing comorbidity burden, physiologic derangement at the time of admission, and overall inpatient mortality risk.19, 20 The primary purpose of this study was to combine this methodology with bed history analysis to quantify the in‐hospital mortality and length of stay (LOS) of patients who experienced intra‐hospital transfers in a large, multihospital system. As a secondary goal, we also wanted to assess the degree to which these transfers could be predicted based on information available prior to a patient's admission.
ABBREVIATIONS AND TERMS USED IN TEXT
COPS: COmorbidity Point Score. Point score based on a patient's health care utilization diagnoses (during the year preceding admission to the hospital. Analogous to POA (present on admission) coding. Scores can range from 0 to a theoretical maximum of 701 but scores >200 are rare. With respect to a patient's pre‐existing comorbidity burden, the unadjusted relationship of COPS and inpatient mortality is as follows: a COPS <50 is associated with a mortality risk of <1%, <100 with a mortality risk of <5%, 100 to 145 with a mortality risk of 5% to 10%, and >145 with a mortality risk of 10% or more.
ICU: Intensive Care Unit. In this study, all ICUs have a minimum registered nurse to patient ratio of 1:2.
LAPS: Laboratory Acute Physiology Score. Point score based on 14 laboratory test results obtained in the 72 hours preceding hospitalization. With respect to a patient's physiologic derangement, the unadjusted relationship of LAPS and inpatient mortality is as follows: a LAPS <7 is associated with a mortality risk of <1%, <7 to 30 with a mortality risk of <5%, 30 to 60 with a mortality risk of 5% to 9%, and >60 with a mortality risk of 10% or more.
LOS: Exact hospital Length Of Stay. LOS is calculated from admission until first discharge home (i.e., it may span more than one hospital stay if a patient experienced inter‐hospital transport).
Predicted (expected) mortality risk: the % risk of death for a given patient based on his/her age, sex, admission diagnosis, COPS, and LAPS.
OEMR: Observed to Expected Mortality Ratio. For a given patient subset, the ratio of the actual mortality experienced by the subset to the expected (predicted) mortality for the subset. Predicted mortality is based on patients' age, sex, admission diagnosis, COPS, and LAPS.
OMELOS: Observed Minus Expected LOS. For a given patient subset, the difference between the actual number of hospital days experienced by the subset and the expected (predicted) number of hospital days for the subset. Predicted LOS is based on patients' age, sex, admission diagnosis, COPS, and LAPS.
TCU: Transitional Care Unit (also called intermediate care unit or stepdown unit). In this study, TCUs have variable nurse to patient ratios ranging from 1:2.5 to 1:3 and did not provide assisted ventilation, continuous pressor infusions, or invasive monitoring.
Materials and Methods
This project was approved by the Northern California KPMCP Institutional Review Board for the Protection of Human Subjects.
The Northern California KPMCP serves a total population of approximately 3.3 million members. Under a mutual exclusivity arrangement, physicians of The Permanente Medical Group, Inc., care for Kaiser Foundation Health Plan, Inc. members at facilities owned by Kaiser Foundation Hospitals, Inc. All Northern California KPMCP hospitals and clinics employ the same information systems with a common medical record number and can track care covered by the plan but delivered elsewhere. Databases maintained by the KPMCP capture admission and discharge times, admission and discharge diagnoses and procedures (assigned by professional coders), bed histories, inter‐hospital transfers, as well as the results of all inpatient and outpatient laboratory tests. The use of these databases for research has been described in multiple reports.2124
Our setting consisted of all 19 hospitals owned and operated by the KPMCP, whose characteristics are summarized in the Supporting Information Appendix available to interested readers. These include the 17 described in our previous report19 as well as 2 new hospitals (Antioch and Manteca) which are similar in size and type of population served. Our study population consisted of all patients admitted to these 19 hospitals who met these criteria: 1) hospitalization began from November 1st, 2006 through January 31st, 2008; 2) initial hospitalization occurred at a Northern California KPMCP hospital (ie, for inter‐hospital transfers, the first hospital stay occurred within the KPMCP); 3) age 15 years; and 4) hospitalization was not for childbirth.
We defined a linked hospitalization as the time period that began with a patient's admission to the hospital and ended with the patient's discharge (home, to a nursing home, or death). Linked hospitalizations can thus involve more than 1 hospital stay and could include a patient transfer from one hospital to another prior to definitive discharge. For linked hospitalizations, mortality was attributed to the admitting KPMCP hospital (ie, if a patient was admitted to hospital A, transferred to B, and died at hospital B, mortality was attributed to hospital A). We defined total LOS as the exact time in hours from when a patient was first admitted to the hospital until death or final discharge home or to a nursing home, while total ICU or transitional care unit (TCU, referred to as stepdown unit in some hospitals) LOS was calculated for all individual ICU or TCU stays during the hospital stay.
Intra‐Hospital Transfers
We grouped all possible hospital units into four types: general medical‐surgical ward (henceforth, ward); operating room (OR)/post‐anesthesia recovery (PAR); TCU; and ICU. In 2003, the KPMCP implemented a mandatory minimum staffing ratio of one registered nurse for every four patients in all its hospital units; in addition, staffing levels for designated ICUs adhered to the previously mandated minimum of one nurse for every 2 patients. So long as they adhere to these minimum ratios, individual hospitals have considerable autonomy with respect to how they staff or designate individual hospital units. Registered nurse‐to‐patient ratios during the time of this study were as follows: ward patients, 1:3.5 to 1:4; TCU patients, 1:2.5 to 1:3; and ICU patients, 1:1 to 1:2. Staffing ratios for the OR and PAR are more variable, depending on the surgical procedures involved. Current KPMCP databases do not permit accurate quantification of physician staffing. All 19 study hospitals had designated ICUs, 6 were teaching hospitals, and 11 had designated TCUs. None of the study hospitals had closed ICUs (units where only intensivists admit patients) and none had continuous coverage of the ICU by intensivists. While we were not able to employ electronic data to determine who made the decision to transfer, we did find considerable variation with respect to how intensivists covered the ICUs and how they interfaced with hospitalists. Staffing levels for specialized coronary care units and non‐ICU monitored beds were not standardized. All study hospitals had rapid response teams as well as code blue teams during the time period covered by this report. Respiratory care practitioners were available to patients in all hospital units, but considerable variation existed with respect to other services available (eg, cardiac catheterization units, provision of noninvasive positive pressure ventilation outside the ICU, etc.).
This report focuses on intra‐hospital transfers to the ICU and TCU, with special emphasis on nonsurgical transfers (due to space limitations, we are not reporting on the outcomes of patients whose first hospital unit was the OR; additional details on these patients are provided in the Supporting Information Appendix). For the purposes of this report, we defined the following admission types: direct admits (patients admitted to the ICU or TCU whose first hospital unit on admission was the ICU or TCU); and nonsurgical transfers to a higher level of care. These latter transfers could be of 3 types: ward to ICU, ward to TCU, and TCU to ICU. We also quantified the effect of inter‐hospital transfers.
Independent Variables
In addition to patients' age and sex, we employed the following independent variables to predict transfer to a higher level of care. These variables are part of the risk adjustment model described in greater detail in our previous report19 and were available electronically for all patients in the cohort. We grouped admission diagnoses into 44 broad diagnostic categories (Primary Conditions), and admission types into 4 groups (emergency medical, emergency surgical, elective medical, and elective surgical). We quantified patients' degree of physiologic derangement using a Laboratory‐based Acute Physiology Score (LAPS) using laboratory test results prior to hospitalization. We quantified patients' comorbid illness burden using a Comorbidity Point Score (COPS) based on patients' pre‐existing diagnoses over the 12‐month period preceding hospitalization. Lastly, we assigned each patient a predicted mortality risk (%) and LOS based on the above predictors,19 permitting calculation of observed to expected mortality ratios (OEMRs) and observed minus expected LOS (OMELOS).
Statistical Methods
All analyses were performed in SAS.25 We calculated standard descriptive statistics (medians, means, standard deviations) and compared different patient groupings using t and chi‐square tests. We employed a similar approach to that reported by Render et al.7 to calculate OEMR and OMELOS.
To determine the degree to which transfers to a higher level of care from the ward or TCU would be predictable using information available at the time of admission, we performed 4 sets of logistic regression analyses using the above‐mentioned predictors in which the outcome variables were as follows: 1) transfer occurring in the first 48 hours after admission (time frame by which point approximately half of the transferred patients experienced a transfer) among ward or TCU patients and 2) transfer occurring after 48 hours among ward or TCU patients. We evaluated the discrimination and calibration of these models using the same methods described in our original report (measuring the area under the receiver operator characteristic curve, or c statistic, and visually examining observed and expected mortality rates among predicted risk bands as well as risk deciles) as well as additional statistical tests recommended by Cook.19, 26
Results
During the study period, a total of 249,129 individual hospital stays involving 170,151 patients occurred at these 19 hospitals. After concatenation of inter‐hospital transfers, we were left with 237,208 linked hospitalizations. We excluded 26,738 linked hospitalizations that began at a non‐KPMCP hospital (ie, they were transported in), leaving a total of 210,470 linked hospitalizations involving 150,495 patients. The overall linked hospitalization mortality rate was 3.30%.
Table 1 summarizes cohort characteristics based on initial hospital location. On admission, ICU patients had the highest degree of physiologic derangement as well as the highest predicted mortality. Considerable inter‐hospital variation was present in both predictors and outcomes; details on these variations are provided in the Supporting Information Appendix.
| Ward | TCU | ICU | All* | |
|---|---|---|---|---|
| ||||
| n | 121,237 | 20,556 | 16,001 | 210,470 |
| Admitted via emergency department, n (%) | 99,909 (82.4) | 18,612 (90.5) | 13,847 (86.5) | 139,036 (66.1) |
| % range across hospitals | 55.0‐94.2 | 64.7‐97.6 | 49.5‐97.4 | 53.6‐76.9 |
| Male, n (%) | 53,744 (44.3) | 10,362 (50.4) | 8,378 (52.4) | 94,451 (44.9) |
| Age in years (mean SD) | 64.5 19.2 | 69.0 15.6 | 63.7 17.8 | 63.2 18.6 |
| LAPS (mean SD) | 19.2 18.0 | 23.3 19.5 | 31.7 25.7 | 16.7 19.0 |
| COPS (mean SD) | 90.4 64.0 | 99.2 65.9 | 94.5 67.5 | 84.7 61.8 |
| % predicted mortality (mean SD) | 4.0 7.1 | 4.6 7.3 | 8.7 12.8 | 3.6 7.3 |
| Observed in‐hospital deaths (n, %) | 3,793 (3.1) | 907 (4.4) | 1,995 (12.5) | 6,952 (3.3) |
| Observed to expected mortality ratio | 0.79 (0.77‐0.82) | 0.95 (0.89‐1.02) | 1.43 (1.36‐1.49) | 0.92 (0.89‐0.94) |
| Total hospital LOS, days (mean SD) | 4.6 7.5 | 5.3 10.0 | 7.8 14.0 | 4.6 8.1 |
Table 2 summarizes data from 3 groups of patients: patients initially admitted to the ward, or TCU, who did not experience a transfer to a higher level of care and patients admitted to these 2 units who did experience such a transfer. Patients who experienced a transfer constituted 5.3% (6,484/121,237) of ward patients and 6.7% (1,384/20,556) of TCU patients. Transferred patients tended to be older, have more acute physiologic derangement (higher LAPS), a greater pre‐existing illness burden (higher COPS), and a higher predicted mortality risk. Among ward patients, those with the following admission diagnoses were most likely to experience a transfer to a higher level of care: gastrointestinal bleeding (10.8% of all transfers), pneumonia (8.7%), and other infections (8.2%). The diagnoses most likely to be associated with death following transfer were cancer (death rate among transferred patients, 48%), renal disease (death rate, 36%), and liver disease (33%). Similar distributions were observed for TCU patients.
| Patients Initially Admitted to Ward, Remained There | Patients Initially Admitted to TCU, Remained There | Patients Transferred to Higher Level of Care | All | |
|---|---|---|---|---|
| ||||
| n | 114,753 | 19,172 | 7,868 | 141,793 |
| Male, n (%) | 50,586 (44.1) | 9,626 (50.2) | 3,894 (49.5) | 64,106 (45.2) |
| Age (mean SD) | 64.3 19.4 | 69.0 15.7 | 68.1 16.1 | 65.2 18.8 |
| LAPS (mean SD) | 18.9 17.8 | 22.7 19.1 | 26.7 21.0 | 19.8 18.3 |
| COPS (mean SD) | 89.4 63.7 | 98.3 65.5 | 107.9 67.6 | 91.7 64.4 |
| % predicted mortality risk (mean SD) | 3.8 7.0 | 4.4 7.0 | 6.5 8.8 | 4.1 7.1 |
| Admission diagnosis of pneumonia, n (%) | 5,624 (4.9) | 865 (4.5) | 684 (8.7) | 7,173 (5.1) |
| Admission diagnosis of sepsis, n (%) | 1,181 (1.0) | 227 (1.2) | 168 (2.1) | 1,576 (1.1) |
| Admission diagnosis of GI bleed, n (%) | 13,615 (11.9) | 1,448 (7.6) | 851 (10.8) | 15,914 (11.2) |
| Admission diagnosis of cancer, n (%) | 2,406 (2.1) | 80 (0.4) | 186 (2.4) | 2,672 (1.9) |
Table 3 compares outcomes among ward and TCU patients who did and did not experience a transfer to a higher level of care. The table shows that transferred patients were almost 3 times as likely to die, even after controlling for severity of illness, and that their hospital LOS was 9 days higher than expected. This increased risk was seen in all hospitals and among all transfer types (ward to ICU, ward to TCU, and TCU to ICU).
| Patients Initially Admitted to Ward, Remained There | Patients Initially Admitted to TCU, Remained There | Patients Transferred to Higher Level of Care | |
|---|---|---|---|
| |||
| n | 114,753 | 19,172 | 7,868 |
| Admitted to ICU, n (%) | 0 (0.0) | 0 (0.0) | 5,245 (66.7) |
| Ventilated, n (%) | 0 (0.0) | 0 (0.0) | 1,346 (17.1) |
| Died in the hospital, n (%) | 2,619 (2.3) | 572 (3.0) | 1,509 (19.2) |
| Length of stay, in days, at time of death (mean SD) | 7.0 11.9 | 8.3 12.4 | 16.2 23.7 |
| Observed to expected mortality ratio (95% CI) | 0.60 (0.57‐0.62) | 0.68 (0.63‐0.74) | 2.93 (2.79‐3.09) |
| Total hospital length of stay, days (mean SD) | 4.0 5.7 | 4.4 6.9 | 14.3 21.3 |
| Observed minus expected length of stay (95% CI) | 0.4 (0.3‐0.4) | 0.8 (0.7‐0.9) | 9.1 (8.6‐9.5) |
| Length of stay, in hours, at time of transfer (mean SD) | 80.8 167.2 | ||
Table 3 also shows that, among decedent patients, those who never left the ward or TCU died much sooner than those who died following transfer. Among direct admits to the ICU, the median LOS at time of death was 3.9 days, with a mean of 9.4 standard deviation of 19.9 days, while the corresponding times for TCU direct admits were a median and mean LOS of 6.5 and 11.7 19.5 days.
Table 4 summarizes outcomes among different patient subgroups that did and did not experience a transfer to a higher level of care. Based on location, patients who experienced a transfer from the TCU to the ICU had the highest crude death rate, but patients transferred from the ward to the ICU had the highest OEMR. On the other hand, if one divides patients by the degree of physiologic derangement, patients with low LAPS who experienced a transfer had the highest OEMR. With respect to LOS, patients transferred from the TCU to the ICU had the highest OMELOS (13.4 extra days).
| n (%)* | Death Rate (%) | OEMR | LOS (mean SD) | OMELOS | |
|---|---|---|---|---|---|
| |||||
| Never admitted to TCU or ICU | 157,632 (74.9) | 1.6 | 0.55 (0.53‐0.57) | 3.6 4.6 | 0.04 (0.02‐0.07) |
| Direct admit to TCU | 18,464 (8.8) | 2.9 | 0.66 (0.61‐0.72) | 4.2 5.8 | 0.60 (0.52‐0.68) |
| Direct admit to ICU | 14,655 (7.0) | 11.9 | 1.38 (1.32‐1.45) | 6.4 9.4 | 2.28 (2.14‐2.43) |
| Transferred from ward to ICU | 5,145 (2.4) | 21.5 | 3.23 (3.04‐3.42) | 15.7 21.6 | 10.33 (9.70‐10.96) |
| Transferred from ward to TCU | 3,144 (1.5) | 11.9 | 1.99 (1.79‐2.20) | 13.6 23.2 | 8.02 (7.23‐8.82) |
| Transferred from TCU to ICU | 1,107 (0.5) | 25.7 | 2.94 (2.61‐3.31) | 18.0 28.2 | 13.35 (11.49‐15.21) |
| Admitted to ward, COPS 80, no transfer to ICU or TCU | 55,405 (26.3) | 3.4 | 0.59 (0.56‐0.62) | 4.5 5.9 | 0.29 (0.24‐0.34) |
| Admitted to ward, COPS 80, did experience transfer to ICU or TCU | 4,851 (2.3) | 19.3 | 2.72 (2.55‐2.90) | 14.2 20.0 | 8.14 (7.56‐8.71) |
| Admitted to ward, COPS <80, no transfer to ICU or TCU | 57,421 (27.3) | 1.1 | 0.55 (0.51‐0.59) | 3.4 4.2 | 0.23 (0.19‐0.26) |
| Admitted to ward, COPS <80, did experience transfer to ICU or TCU | 3,560 (1.7) | 9.8 | 2.93 (2.63‐3.26) | 12.0 19.0 | 7.52 (6.89‐8.15) |
| Admitted to ward, LAPS 20, no transfer to ICU or TCU | 46,492 (22.1) | 4.2 | 0.59 (0.56‐0.61) | 4.6 5.4 | 0.16 (0.12‐0.21) |
| Admitted to ward, LAPS 20, did experience transfer to ICU or TCU | 4,070 (1.9) | 21.4 | 2.37 (2.22‐2.54) | 14.8 21.0 | 8.76 (8.06‐9.47) |
| Admitted to ward, LAPS <20, no transfer to ICU or TCU | 66,334 (31.5) | 0.9 | 0.55 (0.51‐0.60) | 3.5 4.9 | 0.32 (0.28‐0.36) |
| Admitted to ward, LAPS <20, did experience transfer to ICU or TCU | 4,341 (2.1) | 9.5 | 4.31 (3.90‐4.74) | 11.8 18.1 | 7.12 (6.61‐7.64) |
Transfers to a higher level of care at a different hospital, which in the KPMCP are usually planned, experienced lower mortality than transfers within the same hospital. For ward to TCU transfers, intra‐hospital transfers had a mortality of 12.1% while inter‐hospital transfers had a mortality of 5.7%. Corresponding rates for ward to ICU transfers were 21.7% and 11.2%, and for TCU to ICU transfers the rates were 25.9% and 12.5%, respectively.
Among patients initially admitted to the ward, a model to predict the occurrence of a transfer to a higher level of care (within 48 hours after admission) that included age, sex, admission type, primary condition, LAPS, COPS, and interaction terms had poor discrimination, with an area under the receiver operator characteristic (c statistic) of only 0.64. The c statistic for a model to predict transfer after 48 hours was 0.66. The corresponding models for TCU admits had c statistics of 0.67 and 0.68. All four models had poor calibration.
Discussion
Using automated bed history data permits characterizing a patient population with disproportionate mortality and LOS: intra‐hospital transfers to special care units (ICUs or TCUs). Indeed, the largest subset of these patients (those initially admitted to the ward or TCU) constituted only 3.7% of all admissions, but accounted for 24.2% of all ICU admissions, 21.7% of all hospital deaths, and 13.2% of all hospital days. These patients also had very elevated OEMRs and OMELOS. Models based on age, sex, preadmission laboratory test results, and comorbidities did not predict the occurrence of these transfers.
We performed multivariate analyses to explore the degree to which electronically assigned preadmission severity scores could predict these transfers. These analyses found that, compared to our ability to predict inpatient or 30‐day mortality at the time of admission, which is excellent, our ability to predict the occurrence of transfer after admission is much more limited. These results highlight the limitations of severity scores that rely on automated data, which may not have adequate discrimination when it comes to determining the risk of an adverse outcome within a narrow time frame. For example, among the 121,237 patients initially admitted to the ward who did not experience an intra‐hospital transfer, the mean LAPS was 18.9, while the mean LAPS among the 6,484 ward patients who did experience a transfer was 25.5. Differences between the mean and median LAPS, COPS, and predicted mortality risk among transferred and non‐transferred patients were significant (P < 0.0001 for all comparisons). However, examination of the distribution of LAPS, COPS, and predicted mortality risk between these two groups of patients showed considerable overlap.
Our methodology resembles Silber et al.'s27, 28 concept of failure to rescue in that it focuses on events occurring after hospitalization. Silber et al. argue that a hospital's quality can be measured by quantifying the degree to which patients who experience new problems are successfully rescued. Furthermore, quantification of those situations where rescue attempts are unsuccessful is felt to be superior to simply comparing raw or adjusted mortality rates because these are primarily determined by underlying case mix. The primary difference between Silber et al.'s approach and ours is at the level of detailthey specified a specific set of complications, whereas our measure is more generic and would include patients with many of the complications specified by Silber et al.27, 28
Most of the patients transferred to a higher level of care in our cohort survived (ie, were rescued), indicating that intensive care is beneficial. However, the fact that these patients had elevated OEMRs and OMELOS indicates that the real challenge facing hospitalists involves the timing of provision of a beneficial intervention. In theory, improved timing could result from earlier detection of problems, which is the underlying rationale for employing rapid response teams. However, the fact that our electronic tools (LAPS, COPS) cannot predict patient deteriorations within a narrow time frame suggests that early detection will remain a major challenge. Manually assigned vital signs scores designed for this purpose do not have good discrimination either.29, 30 This raises the possibility that, though patient groups may differ in terms of overall illness severity and mortality risk, differences at the individual patient level may be too subtle for clinicians to detect. Future research may thus need to focus on scores that combine laboratory data, vital signs, trends in data,31, 32 and newer proteomic markers (eg, procalcitonin).33 We also found that most transfers occurred early (within <72 hours), raising the possibility that at least some of these transfers may involve issues around triage rather than sudden deterioration.
Our study has important limitations. Due to resource constraints and limited data availability, we could not characterize the patients as well as might be desirable; in particular, we could not make full determinations of the actual reasons for patients' transfer for all patients. Broadly speaking, transfer to a higher level of care could be due to inappropriate triage, appropriate (preventive) transfer (which could include transfer to a more richly staffed unit for a specific procedure), relentless progression of disease despite maximal therapy, the occurrence of management errors, patient and family uncertainty about goals of care or inadequate understanding of treatment options and prognoses, or a combination of these factors. We could not make these distinctions with currently available electronic data. This is also true of postsurgical patients, in whom it is difficult to determine which transfers to intensive care might be planned (eg, in the case of surgical procedures where ICU care is anticipated) as opposed to the occurrence of a deterioration during or following surgery. Another major limitation of this study is our inability to identify code or no code status electronically. The elapsed LOS at time of death among patients who experienced a transfer to a higher level of care (as compared to patients who died in the ward without ever experiencing intra‐hospital transfer) suggests, but does not prove, that prolonged efforts were being made to keep them alive. We were also limited in terms of having access to other process data (eg, physician staffing levels, provision and timing of palliative care). Having ICU severity of illness scores would have permitted us to compare our cohort to those of other recent studies showing elevated mortality rates among transfer patients,911 but we have not yet developed that capability.
Consideration of our study findings suggests a possible research agenda that could be implemented by hospitalist researchers. This agenda should emphasize three areas: detection, intervention, and reflection.
With respect to detection, attention needs to be paid to better tools for quantifying patient risk at the time a decision to admit to the ward is made. It is likely that such tools will need to combine the attributes of our severity score (LAPS) with those of the manually assigned scores.30, 34 In some cases, use of these tools could lead a physician to change the locus of admission from the ward to the TCU or ICU, which could improve outcomes by ensuring more timely provision of intensive care. Since problems with initial triage could be due to factors other than the failure to suspect or anticipate impending instability, future research should also include a cognitive component (eg, quantifying what proportion of subsequent patient deteriorations could be ascribed to missed diagnoses35). Additional work also needs to be done on developing mathematical models that can inform electronic monitoring of ward (not just ICU) patients.
Research on interventions that hospitalists can use to prevent the need for intensive care or to improve the rescue rate should take two routes. The first is a disease‐specific route, which builds on the fact that a relatively small set of conditions (pneumonia, sepsis, gastrointestinal bleeding) account for most transfers to a higher level of care. Condition‐specific protocols, checklists, and bundles36 tailored to a ward environment (as opposed to the ICU or to the entire hospital) might prevent deteriorations in these patients, as has been reported for sepsis.37 The second route is to improve the overall capabilities of rapid response and code blue teams. Such research would need to include a more careful assessment of what commonalities exist among patients who were and were not successfully rescued by these teams. This approach would probably yield more insights than the current literature, which focuses on whether rapid response teams are a good thing or not.
Finally, research also needs to be performed on how hospitalists reflect on adverse outcomes among ward patients. Greater emphasis needs to be placed on moving beyond trigger tool approaches that rely on manual chart review. In an era of expanding use of electronic medical record systems, more work needs to be done on how to harness these to provide hospitalists with better quantitative and risk‐adjusted information. This information should not be limited to simply reporting rates of transfers and deaths. Rather, finer distinctions must be provided with respect of the type of patients (ie, more diagnostic detail), the clinical status of patients (ie, more physiologic detail), as well as the effects of including or excluding patients in whom therapeutic options may be limited (ie, do not resuscitate and comfort care patients) on reported rates. Ideally, researchers should develop better process and outcomes measures that could be tested in collaborative networks that include multiple nonacademic general medical‐surgical wards.
Acknowledgements
The authors thank Drs. Paul Feigenbaum, Alan Whippy, Joseph V. Selby, and Philip Madvig for reviewing the manuscript and Ms. Jennifer Calhoun for formatting the manuscript.
- ,,.To Err is Human: Building a Safer Health System.Washington, D. C.:National Academy Press;2000.
- Institute for Healthcare Improvement. Protecting 5 million lives from harm. Available at: http://www.ihi.org/IHI/Programs/Campaign. Accessed June2010.
- ,.Identifying poor‐quality hospitals. Can hospital mortality rates detect quality problems for medical diagnoses?Med Care.1996;34(8):737–753.
- ,,.Surgical mortality as an indicator of hospital quality: the problem with small sample size.JAMA.2004;292(7):847–851.
- State of California Office of Statewide Health Planning and Development. AHRQ ‐ Inpatient quality indicators (IQIs) hospital inpatient mortality indicators for California. Available at: http://www.oshpd.ca.gov/HID/Products/PatDischargeData/AHRQ/iqi‐imi_overview.html. Accessed June2010.
- ,,, et al.Enhancement of claims data to improve risk adjustment of hospital mortality.JAMA.2007;297(1):71–76.
- ,,, et al.Variation in outcomes in Veterans Affairs intensive care units with a computerized severity measure.Crit Care Med.2005;33(5):930–939.
- ,,,.Acute Physiology and Chronic Health Evaluation (APACHE) IV: hospital mortality assessment for today's critically ill patients.Crit Care Med.2006;34(5):1297–1310.
- ,,,.Day of the week of intensive care admission and patient outcomes: a multisite regional evaluation.Med Care.2002;40(6):530–539.
- ,,, et al.The hospital mortality of patients admitted to the ICU on weekends.Chest.2004;126(4):1292–1298.
- ,,, et al.Mortality among patients admitted to intensive care units during weekday day shifts compared with “off” hours.Crit Care Med.2007;35(1):3–11.
- ,,, et al.Septic shock: an analysis of outcomes for patients with onset on hospital wards versus intensive care units.Crit Care Med.1998;26(6):1020–1024.
- ,,,,.Clinical antecedents to in‐hospital cardiopulmonary arrest.Chest.1990;98(6):1388–1392.
- ,.Developing strategies to prevent inhospital cardiac arrest: analyzing responses of physicians and nurses in the hours before the event.Crit Care Med.1994;22(2):244–247.
- MERIT Study Investigators.Introduction of the medical emergency team (MET) system: a cluster‐randomized controlled trial.Lancet.2005;365(9477):2091–2097.
- Institute for Healthcare Improvement.The “MERIT” Trial of Medical Emergency Teams in Australia: An Analysis of Findings and Implications.Boston, MA:2005. Available on www.ihi.org
- ,,.Rapid response teams‐‐walk, don't run.JAMA.2006;296(13):1645–1647.
- ,.IHI Global Trigger Tool for Measuring Adverse Events.2nd ed.Cambridge, Massachusetts:Institute for Healthcare Improvement;2009.
- ,,,,,.Risk adjusting hospital inpatient mortality using automated inpatient, outpatient, and laboratory databases.Medical Care.2008;46(3):232–239.
- ,,,.The Kaiser Permanente inpatient risk adjustment methodology was valid in an external patient population.J Clin Epidemiol.2010;63(7):798–803.
- .Linking automated databases for research in managed care settings.Ann Intern Med.1997;127(8 Pt 2):719–724.
- ,,, et al.Anticoagulation therapy for stroke prevention in atrial fibrillation: how well do randomized trials translate into clinical practice?JAMA.2003;290(20):2685–2692.
- ,,, et al.Richardson score predicts short‐term adverse respiratory outcomes in newborns >/=34 weeks gestation.J Pediatr.2004;145(6):754–760.
- ,,, et al.Risk adjusting community‐acquired pneumonia hospital outcomes using automated databases.Am J Manag Care.2008;14(3):158–166.
- Statistical Analysis Software [computer program]. Version 8.Cary, NC:SAS Institute, Inc.;2000.
- .Use and misuse of the receiver operating characteristic curve in risk prediction.Circulation.2007;115(7):928–935.
- ,,,.Hospital and patient characteristics associated with death after surgery. A study of adverse occurrence and failure to rescue.Med Care.1992;30(7):615–629.
- ,,.Comparing the contributions of groups of predictors: which outcomes vary with hospital rather than patient characteristics?J Am Stat Assoc.1995;90(429):7–18.
- ,.Beyond the intensive care unit: A review of interventions aimed at anticipating and preventing in‐hospital cardiopulmonary arrest.Resuscitation.2005;67(1):13–23.
- ,,.Reproducibility of physiological track‐and‐trigger warning systems for identifying at‐risk patients on the ward.Intensive Care Med.2007;33(4):619–624.
- ,,,,.Serial evaluation of the SOFA score to predict outcome in critically ill patients.JAMA.2001;286(14):1754–1758.
- ,,.Incorporation of Physiologic Trend and Interaction Effects in Neonatal Severity of Illness Scores: An Experiment Using a Variant of the Richardson Score.Intensive Care Med.2007;33(9):1602–1608.
- ,,, et al.Diagnostic and prognostic value of procalcitonin in patients with septic shock.Crit Care Med.2004;32(5):1166–1169.
- ,,, et al.Identifying the sick: can biochemical measurements be used to aid decision making on presentation to the accident and emergency department.Br J Anaesth.2005;94(6):735–741.
- .Improving patient care. The cognitive psychology of missed diagnoses.Ann Intern Med.2005;142(2):115–120.
- ,,,,,.Using care bundles to reduce in‐hospital mortality: quantitative survey.BMJ.2010;340:c1234.
- ,,, et al.Effect of a rapid response system for patients in shock on time to treatment and mortality during 5 years.Crit Care Med.2007;35(11):2568–2575.
Copyright © 2010 Society of Hospital Medicine