User login
EMR‐Based Detection of Deterioration
Patients who deteriorate in the hospital and are transferred to the intensive care unit (ICU) have higher mortality and greater morbidity than those directly admitted from the emergency department.[1, 2, 3] Rapid response teams (RRTs) were created to address this problem.[4, 5] Quantitative tools, such as the Modified Early Warning Score (MEWS),[6] have been used to support RRTs almost since their inception. Nonetheless, work on developing scores that can serve as triggers for RRT evaluation or intervention continues. The notion that comprehensive inpatient electronic medical records (EMRs) could support RRTs (both as a source of patient data and a platform for providing alerts) has intuitive appeal. Not surprisingly, in addition to newer versions of manual scores,[7] electronic scores are now entering clinical practice. These newer systems are being tested in research institutions,[8] hospitals with advanced capabilities,[9] and as part of proprietary systems.[10] Although a fair amount of statistical information (eg, area under the receiver operator characteristic curve of a given predictive model) on the performance of various trigger systems has been published, existing reports have not described details of how the electronic architecture is integrated with clinical practice.
Electronic alert systems generated from physiology‐based predictive models do not yet constitute mature technologies. No consensus or legal mandate regarding their role yet exists. Given this situation, studying different implementation approaches and their outcomes has value. It is instructive to consider how a given institutional solution addresses common contingenciesoperational constraints that are likely to be present, albeit in different forms, in most placesto help others understand the limitations and issues they may present. In this article we describe the structure of an EMR‐based early warning system in 2 pilot hospitals at Kaiser Permanente Northern California (KPNC). In this pilot, we embedded an updated version of a previously described early warning score[11] into the EMR. We will emphasize how its components address institutional, operational, and technological constraints. Finally, we will also describe unfinished businesschanges we would like to see in a future dissemination phase. Two important aspects of the pilot (development of a clinical response arm and addressing patient preferences with respect to supportive care) are being described elsewhere in this issue of the Journal of Hospital Medicine. Analyses of the actual impact on patient outcomes will be reported elsewhere; initial results appear favorable.[12]
INITIAL CONSTRAINTS
The ability to actually prevent inpatient deteriorations may be limited,[13] and doubts regarding the value of RRTs persist.[14, 15, 16] Consequently, work that led to the pilot occurred in stages. In the first stage (prior to 2010), our team presented data to internal audiences documenting the rates and outcomes of unplanned transfers from the ward to the ICU. Concurrently, our team developed a first generation risk adjustment methodology that was published in 2008.[17] We used this methodology to show that unplanned transfers did, in fact, have elevated mortality, and that this persisted after risk adjustment.[1, 2, 3] This phase of our work coincided with KPNC's deployment of the Epic inpatient EMR (
Once we demonstrated that we could, in fact, predict inpatient deteriorations, we still had to address medicallegal considerations, the need for a clinical response arm, and how to address patient preferences with respect to supportive or palliative care. To address these concerns and ensure that the implementation would be seamlessly integrated with routine clinical practice, our team worked for 1 year with hospitalists and other clinicians at the pilot sites prior to the go‐live date.
The primary concern from a medicallegal perspective is that once results from a predictive model (which could be an alert, severity score, comorbidity score, or other probability estimate) are displayed in the chart, relevant clinical information has been changed. Thus, failure to address such an EMR item could lead to malpractice risk for individuals and/or enterprise liability for an organization. After discussing this with senior leadership, they specified that it would be permissible to go forward so long as we could document that an educational intervention was in place to make sure that clinicians understood the system and that it was linked to specific protocols approved by hospitalists.
Current predictive models, including ours, generate a probability estimate. They do not necessarily identify the etiology of a problem or what solutions ought to be considered. Consequently, our senior leadership insisted that we be able to answer clinicians' basic question: What do we do when we get an alert? The article by Dummett et al.[20] in this issue of the Journal of Hospital Medicine describes how we addressed this constraint. Lastly, not all patients can be rescued. The article by Granich et al.[21] describes how we handled the need to respect patient choices.
PROCEDURAL COMPONENTS
The Gordon and Betty Moore Foundation, which funded the pilot, only had 1 restriction (inclusion of a hospital in the Sacramento, California area). The other site was selected based on 2 initial criteria: (1) the chosen site had to be 1 of the smaller KPNC hospitals, and (2) the chosen site had to be easily accessible for the lead author (G.J.E.). The KPNC South San Francisco hospital was selected as the alpha site and the KPNC Sacramento hospital as the beta site. One of the major drivers for these decisions was that both had robust palliative care services. The Sacramento hospital is a larger hospital with a more complex caseload.
Prior to the go‐live dates (November 19, 2013 for South San Francisco and April 16, 2014 for Sacramento), the executive committees at both hospitals reviewed preliminary data and the implementation plans for the early warning system. Following these reviews, the executive committees approved the deployment. Also during this phase, in consultation with our communications departments, we adopted the name Advance Alert Monitoring (AAM) as the outward facing name for the system. We also developed recommended scripts for clinical staff to employ when approaching a patient in whom an alert had been issued (this is because the alert is calibrated so as to predict increased risk of deterioration within the next 12 hours, which means that a patient might be surprised as to why clinicians were suddenly evaluating them). Facility approvals occurred approximately 1 month prior to the go‐live date at each hospital, permitting a shadowing phase. In this phase, selected physicians were provided with probability estimates and severity scores, but these were not displayed in the EMR front end. This shadowing phase permitted clinicians to finalize the response arms' protocols that are described in the articles by Dummett et al.[20] and Granich et al.[21] We obtained approval from the KPNC Institutional Review Board for the Protection of Human Subjects for the evaluation component that is described below.
EARLY DETECTION ALGORITHMS
The early detection algorithms we employed, which are being updated periodically, were based on our previously published work.[11, 18] Even though admitting diagnoses were found to be predictive in our original model, during actual development of the real‐time data extraction algorithms, we found that diagnoses could not be obtained reliably, so we made the decision to use a single predictive equation for all patients. The core components of the AAM score equation are the above‐mentioned LAPS2 and COPS2; these are combined with other data elements (Table 1). None of the scores are proprietary, and our equations could be replicated by any entity with a comprehensive inpatient EMR. Our early detection system is calibrated using outcomes that occurred 12 hours from when the alert is issued. For prediction, it uses data from the preceding 12 months for the COPS2 and the preceding 24 to 72 hours for physiologic data.
| Category | Elements Included | Comment |
|---|---|---|
| Demographics | Age, sex | |
| Patient location | Unit indicators (eg, 3 West); also known as bed history indicators | Only patients in general medicalsurgical ward, transitional care unit, and telemetry unit are eligible. Patients in the operating room, postanesthesia recovery room, labor and delivery service, and pediatrics are ineligible. |
| Health services | Admission venue | Emergency department admission or not. |
| Elapsed length of stay in hospital up to the point when data are scanned | Interhospital transport is common in our integrated delivery system; this data element requires linking both unit stays as well as stays involving different hospitals. | |
| Status | Care directive orders | Patients with a comfort careonly order are not eligible; all other patients (full code, partial code, and do not resuscitate) are. |
| Admission status | Inpatients and patients admitted for observation status are eligible. | |
| Physiologic | Vital signs, laboratory tests, neurological status checks | See online Appendices and references [6] and [15] for details on how we extract, format, and transform these variables. |
| Composite indices | Generic severity of illness score | See text and description in reference [15] for details on the Laboratory‐based Acute Physiology score, version 2 and the Comorbidity Point Score, version 2. |
| Longitudinal comorbidity score |
During the course of developing the real‐time extraction algorithms, we encountered a number of delays in real‐time data acquisition. These fall into 2 categories: charting delay and server delay. Charting delay is due to nonautomated charting of vital signs by nurses (eg, a nurse obtains vital signs on a patient, writes them down on paper, and then enters them later). In general, this delay was in the 15‐ to 30‐minute range, but occasionally was as high as 2 hours. Server delay, which was variable and ranged from a few minutes to (occasionally) 1 to 2 hours, is due to 2 factors. The first is that certain point of care tests were not always uploaded into the EMR immediately. This is because the testing units, which can display results to clinicians within minutes, must be physically connected to a computer for uploading results. The second is the processing time required for the system to cycle through hundreds of patient records in the context of a very large EMR system (the KPNC Epic build runs in 6 separate geographic instances, and our system runs in 2 of these). Figure 1 shows that each probability estimate thus has what we called an uncertainty period of 2 hours (the +2 hours addresses the fact that we needed to give clinicians a minimum time to respond to an alert). Given limited resources and the need to balance accuracy of the alerts, adequate lead time, the presence of an uncertainty period, and alert fatigue, we elected to issue alerts every 6 hours (with the exact timing based on facility preferences).

A summary of the components of our equation is provided in the Supporting Information, Appendices, in the online version of this article. The statistical performance characteristics of our final equation, which are based on approximately 262 million individual data points from 650,684 hospitalizations in which patients experienced 20,471 deteriorations, is being reported elsewhere. Between November 19, 2013 and November 30, 2015 (the most recent data currently available to us for analysis), a total of 26,386 patients admitted to the ward or transitional care unit at the 2 pilot sites were scored by the AAM system, and these patients generated 3,881 alerts involving a total of 1,413 patients, which meant an average of 2 alerts per day at South San Francisco and 4 alerts per day in Sacramento. Resource limitations have precluded us from conducting formal surveys to assess clinician acceptance. However, repeated meetings with both hospitalists as well as RRT nurses indicated that favorable departmental consensus exists.
INSTANTIATION OF ALGORITHMS IN THE EMR
Given the complexity of the calculations involving many variables (Table 1), we elected to employ Web services to extract data for processing using a Java application outside the EMR, which then pushed results into the EMR front end (Figure 2). Additional details on this decision are provided in the Supporting Information, Appendices, in the online version of this article. Our team had to expend considerable resources and time to map all necessary data elements in the real time environment, whose identifying characteristics are not the same as those employed by the KPHC data warehouse. Considerable debugging was required during the first 7 months of the pilot. Troubleshooting for the application was often required on very short notice (eg, when the system unexpectedly stopped issuing alerts during a weekend, or when 1 class of patients suddenly stopped receiving scores). It is likely that future efforts to embed algorithms in EMRs will experience similar difficulties, and it is wise to budget so as maximize available analytic and application programmer resources.
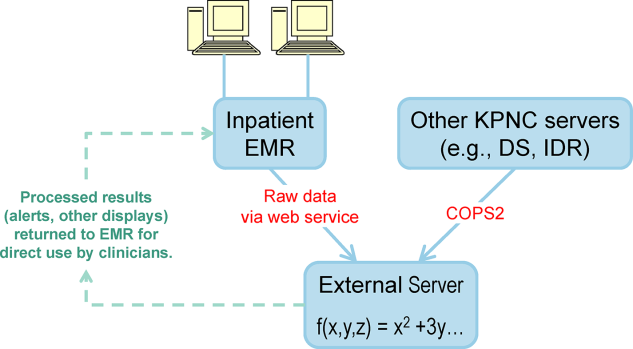
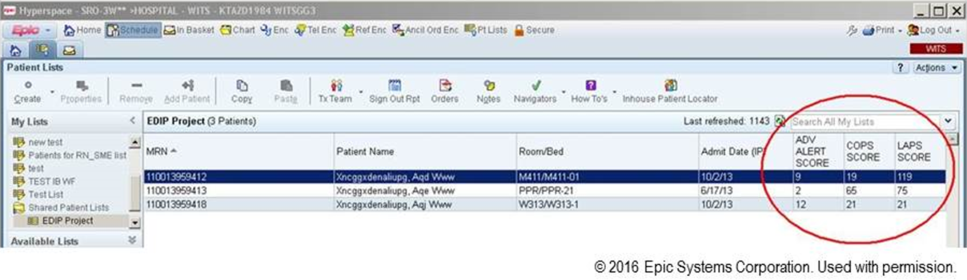
Figure 3 shows the final appearance of the graphical user interface at KPHC, which provides clinicians with 3 numbers: ADV ALERT SCORE (AAM score) is the probability of experiencing unplanned transfer within the next 12 hours, COPS is the COPS2, and LAPS is the LAPS2 assigned at the time a patient is placed in a hospital room. The current protocol in place is that the clinical response arm is triggered when the AAM score is 8.
LIMITATIONS
One of the limitations of working with a commercial EMR in a large system, such as KPNC, is that of scalability. Understandably, the organization is reluctant to make changes in the EMR that will not ultimately be deployed across all hospitals in the system. Thus, any significant modification of the EMR or its associated workflows must, from the outset, be structured for subsequent spread to the remaining hospitals (19 in our case). Because we had not deployed a system like this before, we did not know what to expect and, had we known then what experience has taught us, our initial requests would have been different. Table 2 summarizes the major changes we would have made to our implementation strategy had we known then what we know now.
| Component | Status in Pilot Application | Desirable Changes |
|---|---|---|
| ||
| Degree of disaster recovery support | System outages are handled on an ad hoc basis. | Same level of support as is seen in regular clinical systems (24/7 technical support). |
| Laboratory data feed | Web service. | It would be extremely valuable to have a definite answer about whether alternative data feeds would be faster and more reliable. |
| LAPS2 score | Score appears only on ward or TCU patients. | Display for all hospitalized adults (include anyone 18 years and include ICU patients). |
| Score appears only on inpatient physician dashboard. | Display scores in multiple dashboards (eg, emergency department dashboard). | |
| COPS2 score | Score appears only on ward or TCU patients. | Display for all hospitalized adults (include anyone 18 years and include ICU patients). |
| Score appears only on inpatient physician dashboard. | Display scores in multiple dashboards (eg, emergency department dashboard). | |
| Alert response tracking | None is available. | Functionality that permits tracking what the status is of patients in whom an alert was issued (who responded, where it is charted, etc.)could be structured as a workbench report in KP HealthConnectvery important because of medical legal reasons. |
| Trending capability for scores | None is available. | Trending display available in same location where vital signs and laboratory test results are displayed. |
| Messaging capability | Not currently available. | Transmission of scores to rapid response team (or other designated first responder) via a smartphone, thus obviating the need for staff to check the inpatient dashboard manually every 6 hours. |
EVALUATION STRATEGY
Due to institutional constraints, it is not possible for us to conduct a gold standard pilot using patient‐level randomization, as described by Kollef et al.[8] Consequently, in addition to using the pilot to surface specific implementation issues, we had to develop a parallel scoring system for capturing key data points (scores, outcomes) not just at the 2 pilot sites, but also at the remaining 19 KPNC hospitals. This required that we develop electronic tools that would permit us to capture these data elements continuously, both prospectively as well as retrospectively. Thus, to give an example, we developed a macro that we call LAPS2 any time that permits us to assign a retrospective severity score given any T0. Our ultimate goal is to evaluate the system's deployment using a stepped wedge design[22] in which geographically contiguous clusters of 2 to 4 hospitals go live periodically. The silver standard (a cluster trial involving randomization at the individual hospital level[23]) is not feasible because KPNC hospitals span a very broad geographic area, and it is more resource intensive in a shorter time span. In this context, the most important output from a pilot such as this is to generate an estimate of likely impact; this estimate then becomes a critical component for power calculations for the stepped wedge.
Our ongoing evaluation has all the limitations inherent in the analysis of nonrandomized interventions. Because it only involves 2 hospitals, it is difficult to assess variation due to facility‐specific factors. Finally, because our priority was to avoid alert fatigue, the total number of patients who experience an alert is small, limiting available sample size. Given these constraints, we will employ a counterfactual method, multivariate matching,[24, 25, 26] so as to come as close as possible to simulating a randomized trial. To control for hospital‐specific factors, matching will be combined with difference‐in‐differences[27, 28] methodology. Our basic approach takes advantage of the fact that, although our alert system is currently running in 2 hospitals, it is possible for us to assign a retrospective alert to patients at all KPNC hospitals. Using multivariate matching techniques, we will then create a cohort in which each patient who received an alert is matched to 2 patients who are given a retrospective virtual alert during the same time period in control facilities. The pre‐ and postimplementation outcomes of pilot and matched controls are compared. The matching algorithms specify exact matches on membership status, whether or not the patient had been admitted to the ICU prior to the first alert, and whether or not the patient was full code at the time of an alert. Once potential matches are found using the above procedures, our algorithms seek the closest match for the following variables: age, alert probability, COPS2, and admission LAPS2. Membership status is important, because many individuals who are not covered by the Kaiser Foundation Health Plan, Inc., are hospitalized at KPNC hospitals. Because these nonmembers' postdischarge outcomes cannot be tracked, it is important to control for this variable in our analyses.
Our electronic evaluation strategy also can be used to quantify pilot effects on length of stay (total, after an alert, and ICU), rehospitalization, use of hospice, mortality, and cost. However, it is not adequate for the evaluation of whether or not patient preferences are respected. Consequently, we have also developed manual review instruments for structured electronic chart review (the coding form and manual are provided in the online Appendix of the article in this issue of Journal of Hospital Medicine by Granich et al.[21]). This review will focus on issues such as whether or not patients' surrogates were identified, whether goals of care were discussed, and so forth. In those cases where patients died in the hospital, we will also review whether death occurred after resuscitation, whether family members were present, and so forth.
As noted above and in Figure 1, charting delays can result in uncertainty periods. We have found that these delays can also result in discrepancies in which data extracted from the real time system do not match those extracted from the data warehouse. These discrepancies can complicate creation of analysis datasets, which in turn can lead to delays in completing analyses. Such delays can cause significant problems with stakeholders. In retrospect, we should have devoted more resources to ongoing electronic audits and to the development of algorithms that formally address charting delays.
LESSONS LEARNED AND THOUGHTS ON FUTURE DISSEMINATION
We believe that embedding predictive models in the EMR will become an essential component of clinical care. Despite resource limitations and having to work in a frontier area, we did 3 things well. We were able to embed a complex set of equations and display their outputs in a commercial EMR outside the research setting. In a setting where hospitalists could have requested discontinuation of the system, we achieved consensus that it should remain the standard of care. Lastly, as a result of this work, KPNC will be deploying this early warning system in all its hospitals, so our overall implementation and communication strategy has been sound.
Nonetheless, our road to implementation has been a bumpy one, and we have learned a number of valuable lessons that are being incorporated into our future work. They merit sharing with the broader medical community. Using the title of a song by Ricky SkaggsIf I Had It All Again to Dowe can summarize what we learned with 3 phrases: engage leadership early, provide simpler explanations, and embed the evaluation in the solution.
Although our research on risk adjustment and the epidemiology was known to many KPNC leaders and clinicians, our initial engagement focus was on connecting with hospital physicians and operational leaders who worked in quality improvement. In retrospect, the research team should have engaged with 2 different communities much soonerthe information technology community and that component of leadership that focused on the EMR and information technology issues. Although these 2 broad communities interact with operations all the time, they do not necessarily have regular contact with research developments that might affect both EMR as well as quality improvement operations simultaneously. Not seeking this early engagement probably slowed our work by 9 to 15 months, because of repeated delays resulting from our assumption that the information technology teams understood things that were clear to us but not to them. One major result of this at KPNC is that we now have a regular quarterly meeting between researchers and the EMR leadership. The goal of this regular meeting is to make sure that operational leaders and researchers contemplating projects with an informatics component communicate early, long before any consideration of implementation occurs.
Whereas the notion of providing early warning seems intuitive and simple, translating this into a set of equations is challenging. However, we have found that developing equations is much easier than developing communication strategies suitable for people who are not interested in statistics, a group that probably constitutes the majority of clinicians. One major result of this learning now guiding our work is that our team devotes more time to considering existing and possible workflows. This process includes spending more time engaging with clinicians around how they use information. We are also experimenting with different ways of illustrating statistical concepts (eg, probabilities, likelihood ratios).
As is discussed in the article by Dummett et al.,[20] 1 workflow component that remains unresolved is that of documentation. It is not clear what the documentation standard should be for a deterioration probability. Solving this particular conundrum is not something that can be done by electronic or statistical means. However, also with the benefit of hindsight, we now know that we should have put more energy into automated electronic tools that provide support for documentation after an alert. In addition to being requested by clinicians, having tools that automatically generate tracers as part of both the alerting and documentation process would also make evaluation easier. For example, it would permit a better delineation of the causal path between the intervention (providing a deterioration probability) and patient outcomes. In future projects, incorporation of such tools will get much more prominence.
Acknowledgements
The authors thank Dr. Michelle Caughey, Dr. Philip Madvig, Dr. Patricia Conolly, and Ms. Barbara Crawford for their administrative support, Dr. Tracy Lieu for reviewing the manuscript, and Ms. Rachel Lesser for formatting the manuscript.
Disclosures: This work was supported by a grant from the Gordon and Betty Moore Foundation (Early Detection, Prevention, and Mitigation of Impending Physiologic Deterioration in Hospitalized Patients Outside Intensive Care: Phase 3, pilot), The Permanente Medical Group, Inc., and Kaiser Foundation Hospitals, Inc. As part of our agreement with the Gordon and Betty Moore Foundation, we made a commitment to disseminate our findings in articles such as this one. However, the Foundation and its staff played no role in how we actually structured our articles, nor did they review or preapprove any of the manuscripts submitted as part of the dissemination component. Dr. Liu was supported by the National Institute for General Medical Sciences award K23GM112018. None of the sponsors had any involvement in our decision to submit this manuscript or in the determination of its contents. None of the authors has any conflicts of interest to declare of relevance to this work
- , , , , , . Intra‐hospital transfers to a higher level of care: contribution to total hospital and intensive care unit (ICU) mortality and length of stay (LOS). J Hosp Med. 2011;6(2):74–80.
- , , , . Adverse outcomes associated with delayed intensive care unit transfers in an integrated healthcare system. J Hosp Med. 2012;7(3):224–230.
- , , , , , . Risk factors for unplanned transfer to intensive care within 24 hours of admission from the emergency department in an integrated healthcare system. J Hosp Med. 2012;8(1):13–19.
- , , , , . The medical emergency team: a new strategy to identify and intervene in high‐risk surgical patients. Clin Intensive Care. 1995;6:269–272.
- , , , . The medical emergency team. Anaesth Intensive Care. 1995;23(2):183–186.
- . The critically ill: following your MEWS. QJM. 2001;94(10):507–510.
- National Health Service. National Early Warning Score (NEWS). Standardising the Assessment Of Acute‐Illness Severity in the NHS. Report of a Working Party. London, United Kingdom: Royal College of Physicians; 2012.
- , , , et al. A randomized trial of real‐time automated clinical deterioration alerts sent to a rapid response team. J Hosp Med. 2014;9(7):424–429.
- , , , et al. Automated detection of physiologic deterioration in hospitalized patients. J Am Med Inform Assoc. 2015;22(2):350–360.
- , , , , . Identifying patients at increased risk for unplanned readmission. Med Care. 2013;51(9):761–766.
- , , , , , . Early detection of impending physiologic deterioration among patients who are not in intensive care: development of predictive models using data from an automated electronic medical record. J Hosp Med. 2012;7(5):388–395.
- , , , et al. Early detection of impending deterioration outside the ICU: a difference‐in‐differences (DiD) study. Presented at: American Thoracic Society International Conference, San Francisco, California; May 13–18, 2016; A7614.
- , , , . Unplanned transfers to a medical intensive care unit: causes and relationship to preventable errors in care. J Hosp Med. 2011;6(2):68–72.
- , , . Rapid response teams—walk, don't run. JAMA. 2006;296(13):1645–1647.
- , , , , , . Rapid response systems: a systematic review. Crit Care Med. 2007;35(5):1238–1243.
- , . Rethinking rapid response teams. JAMA. 2010;304(12):1375–1376.
- , , , , , . Risk adjusting hospital inpatient mortality using automated inpatient, outpatient, and laboratory databases. Med Care. 2008;46(3):232–239.
- , , , , . Risk‐adjusting hospital mortality using a comprehensive electronic record in an integrated healthcare delivery system. Med Care. 2013;51(5):446–453.
- , , , , , . Nonelective rehospitalizations and post‐discharge mortality: predictive models suitable for use in real time. Med Care. 2015;53(11):916–923.
- et al. J Hosp Med. 2016;11:000–000.
- et al. J Hosp Med. 2016;11:000–000.
- , . Design and analysis of stepped wedge cluster randomized trials. Contemp Clin Trials. 2007;28(2):182–191.
- , . Cluster randomized trials: evaluating treatments applied to groups. JAMA. 2015;313(20):2068–2069.
- , . Comparison of multivariate matching methods: structures, distances, and algorithms. J Comput Graph Stat. 1993;2(4):405–420.
- , , . A method/macro based on propensity score and Mahalanobis distance to reduce bias in treatment comparison in observational study. Eli Lilly working paper available at: http://www.lexjansen.com/pharmasug/2006/publichealthresearch/pr05.pdf.
- . Matching methods for causal inference: a review and a look forward. Stat Sci. 2010;25(1):1–21.
- , . Methods for evaluating changes in health care policy: the difference‐in‐differences approach. JAMA. 2014;312(22):2401–2402.
- , , . Why we should not be indifferent to specification choices for difference‐in‐differences. Health Serv Res. 2015;50(4):1211–1235.
Patients who deteriorate in the hospital and are transferred to the intensive care unit (ICU) have higher mortality and greater morbidity than those directly admitted from the emergency department.[1, 2, 3] Rapid response teams (RRTs) were created to address this problem.[4, 5] Quantitative tools, such as the Modified Early Warning Score (MEWS),[6] have been used to support RRTs almost since their inception. Nonetheless, work on developing scores that can serve as triggers for RRT evaluation or intervention continues. The notion that comprehensive inpatient electronic medical records (EMRs) could support RRTs (both as a source of patient data and a platform for providing alerts) has intuitive appeal. Not surprisingly, in addition to newer versions of manual scores,[7] electronic scores are now entering clinical practice. These newer systems are being tested in research institutions,[8] hospitals with advanced capabilities,[9] and as part of proprietary systems.[10] Although a fair amount of statistical information (eg, area under the receiver operator characteristic curve of a given predictive model) on the performance of various trigger systems has been published, existing reports have not described details of how the electronic architecture is integrated with clinical practice.
Electronic alert systems generated from physiology‐based predictive models do not yet constitute mature technologies. No consensus or legal mandate regarding their role yet exists. Given this situation, studying different implementation approaches and their outcomes has value. It is instructive to consider how a given institutional solution addresses common contingenciesoperational constraints that are likely to be present, albeit in different forms, in most placesto help others understand the limitations and issues they may present. In this article we describe the structure of an EMR‐based early warning system in 2 pilot hospitals at Kaiser Permanente Northern California (KPNC). In this pilot, we embedded an updated version of a previously described early warning score[11] into the EMR. We will emphasize how its components address institutional, operational, and technological constraints. Finally, we will also describe unfinished businesschanges we would like to see in a future dissemination phase. Two important aspects of the pilot (development of a clinical response arm and addressing patient preferences with respect to supportive care) are being described elsewhere in this issue of the Journal of Hospital Medicine. Analyses of the actual impact on patient outcomes will be reported elsewhere; initial results appear favorable.[12]
INITIAL CONSTRAINTS
The ability to actually prevent inpatient deteriorations may be limited,[13] and doubts regarding the value of RRTs persist.[14, 15, 16] Consequently, work that led to the pilot occurred in stages. In the first stage (prior to 2010), our team presented data to internal audiences documenting the rates and outcomes of unplanned transfers from the ward to the ICU. Concurrently, our team developed a first generation risk adjustment methodology that was published in 2008.[17] We used this methodology to show that unplanned transfers did, in fact, have elevated mortality, and that this persisted after risk adjustment.[1, 2, 3] This phase of our work coincided with KPNC's deployment of the Epic inpatient EMR (
Once we demonstrated that we could, in fact, predict inpatient deteriorations, we still had to address medicallegal considerations, the need for a clinical response arm, and how to address patient preferences with respect to supportive or palliative care. To address these concerns and ensure that the implementation would be seamlessly integrated with routine clinical practice, our team worked for 1 year with hospitalists and other clinicians at the pilot sites prior to the go‐live date.
The primary concern from a medicallegal perspective is that once results from a predictive model (which could be an alert, severity score, comorbidity score, or other probability estimate) are displayed in the chart, relevant clinical information has been changed. Thus, failure to address such an EMR item could lead to malpractice risk for individuals and/or enterprise liability for an organization. After discussing this with senior leadership, they specified that it would be permissible to go forward so long as we could document that an educational intervention was in place to make sure that clinicians understood the system and that it was linked to specific protocols approved by hospitalists.
Current predictive models, including ours, generate a probability estimate. They do not necessarily identify the etiology of a problem or what solutions ought to be considered. Consequently, our senior leadership insisted that we be able to answer clinicians' basic question: What do we do when we get an alert? The article by Dummett et al.[20] in this issue of the Journal of Hospital Medicine describes how we addressed this constraint. Lastly, not all patients can be rescued. The article by Granich et al.[21] describes how we handled the need to respect patient choices.
PROCEDURAL COMPONENTS
The Gordon and Betty Moore Foundation, which funded the pilot, only had 1 restriction (inclusion of a hospital in the Sacramento, California area). The other site was selected based on 2 initial criteria: (1) the chosen site had to be 1 of the smaller KPNC hospitals, and (2) the chosen site had to be easily accessible for the lead author (G.J.E.). The KPNC South San Francisco hospital was selected as the alpha site and the KPNC Sacramento hospital as the beta site. One of the major drivers for these decisions was that both had robust palliative care services. The Sacramento hospital is a larger hospital with a more complex caseload.
Prior to the go‐live dates (November 19, 2013 for South San Francisco and April 16, 2014 for Sacramento), the executive committees at both hospitals reviewed preliminary data and the implementation plans for the early warning system. Following these reviews, the executive committees approved the deployment. Also during this phase, in consultation with our communications departments, we adopted the name Advance Alert Monitoring (AAM) as the outward facing name for the system. We also developed recommended scripts for clinical staff to employ when approaching a patient in whom an alert had been issued (this is because the alert is calibrated so as to predict increased risk of deterioration within the next 12 hours, which means that a patient might be surprised as to why clinicians were suddenly evaluating them). Facility approvals occurred approximately 1 month prior to the go‐live date at each hospital, permitting a shadowing phase. In this phase, selected physicians were provided with probability estimates and severity scores, but these were not displayed in the EMR front end. This shadowing phase permitted clinicians to finalize the response arms' protocols that are described in the articles by Dummett et al.[20] and Granich et al.[21] We obtained approval from the KPNC Institutional Review Board for the Protection of Human Subjects for the evaluation component that is described below.
EARLY DETECTION ALGORITHMS
The early detection algorithms we employed, which are being updated periodically, were based on our previously published work.[11, 18] Even though admitting diagnoses were found to be predictive in our original model, during actual development of the real‐time data extraction algorithms, we found that diagnoses could not be obtained reliably, so we made the decision to use a single predictive equation for all patients. The core components of the AAM score equation are the above‐mentioned LAPS2 and COPS2; these are combined with other data elements (Table 1). None of the scores are proprietary, and our equations could be replicated by any entity with a comprehensive inpatient EMR. Our early detection system is calibrated using outcomes that occurred 12 hours from when the alert is issued. For prediction, it uses data from the preceding 12 months for the COPS2 and the preceding 24 to 72 hours for physiologic data.
| Category | Elements Included | Comment |
|---|---|---|
| Demographics | Age, sex | |
| Patient location | Unit indicators (eg, 3 West); also known as bed history indicators | Only patients in general medicalsurgical ward, transitional care unit, and telemetry unit are eligible. Patients in the operating room, postanesthesia recovery room, labor and delivery service, and pediatrics are ineligible. |
| Health services | Admission venue | Emergency department admission or not. |
| Elapsed length of stay in hospital up to the point when data are scanned | Interhospital transport is common in our integrated delivery system; this data element requires linking both unit stays as well as stays involving different hospitals. | |
| Status | Care directive orders | Patients with a comfort careonly order are not eligible; all other patients (full code, partial code, and do not resuscitate) are. |
| Admission status | Inpatients and patients admitted for observation status are eligible. | |
| Physiologic | Vital signs, laboratory tests, neurological status checks | See online Appendices and references [6] and [15] for details on how we extract, format, and transform these variables. |
| Composite indices | Generic severity of illness score | See text and description in reference [15] for details on the Laboratory‐based Acute Physiology score, version 2 and the Comorbidity Point Score, version 2. |
| Longitudinal comorbidity score |
During the course of developing the real‐time extraction algorithms, we encountered a number of delays in real‐time data acquisition. These fall into 2 categories: charting delay and server delay. Charting delay is due to nonautomated charting of vital signs by nurses (eg, a nurse obtains vital signs on a patient, writes them down on paper, and then enters them later). In general, this delay was in the 15‐ to 30‐minute range, but occasionally was as high as 2 hours. Server delay, which was variable and ranged from a few minutes to (occasionally) 1 to 2 hours, is due to 2 factors. The first is that certain point of care tests were not always uploaded into the EMR immediately. This is because the testing units, which can display results to clinicians within minutes, must be physically connected to a computer for uploading results. The second is the processing time required for the system to cycle through hundreds of patient records in the context of a very large EMR system (the KPNC Epic build runs in 6 separate geographic instances, and our system runs in 2 of these). Figure 1 shows that each probability estimate thus has what we called an uncertainty period of 2 hours (the +2 hours addresses the fact that we needed to give clinicians a minimum time to respond to an alert). Given limited resources and the need to balance accuracy of the alerts, adequate lead time, the presence of an uncertainty period, and alert fatigue, we elected to issue alerts every 6 hours (with the exact timing based on facility preferences).
A summary of the components of our equation is provided in the Supporting Information, Appendices, in the online version of this article. The statistical performance characteristics of our final equation, which are based on approximately 262 million individual data points from 650,684 hospitalizations in which patients experienced 20,471 deteriorations, is being reported elsewhere. Between November 19, 2013 and November 30, 2015 (the most recent data currently available to us for analysis), a total of 26,386 patients admitted to the ward or transitional care unit at the 2 pilot sites were scored by the AAM system, and these patients generated 3,881 alerts involving a total of 1,413 patients, which meant an average of 2 alerts per day at South San Francisco and 4 alerts per day in Sacramento. Resource limitations have precluded us from conducting formal surveys to assess clinician acceptance. However, repeated meetings with both hospitalists as well as RRT nurses indicated that favorable departmental consensus exists.
INSTANTIATION OF ALGORITHMS IN THE EMR
Given the complexity of the calculations involving many variables (Table 1), we elected to employ Web services to extract data for processing using a Java application outside the EMR, which then pushed results into the EMR front end (Figure 2). Additional details on this decision are provided in the Supporting Information, Appendices, in the online version of this article. Our team had to expend considerable resources and time to map all necessary data elements in the real time environment, whose identifying characteristics are not the same as those employed by the KPHC data warehouse. Considerable debugging was required during the first 7 months of the pilot. Troubleshooting for the application was often required on very short notice (eg, when the system unexpectedly stopped issuing alerts during a weekend, or when 1 class of patients suddenly stopped receiving scores). It is likely that future efforts to embed algorithms in EMRs will experience similar difficulties, and it is wise to budget so as maximize available analytic and application programmer resources.
Figure 3 shows the final appearance of the graphical user interface at KPHC, which provides clinicians with 3 numbers: ADV ALERT SCORE (AAM score) is the probability of experiencing unplanned transfer within the next 12 hours, COPS is the COPS2, and LAPS is the LAPS2 assigned at the time a patient is placed in a hospital room. The current protocol in place is that the clinical response arm is triggered when the AAM score is 8.
LIMITATIONS
One of the limitations of working with a commercial EMR in a large system, such as KPNC, is that of scalability. Understandably, the organization is reluctant to make changes in the EMR that will not ultimately be deployed across all hospitals in the system. Thus, any significant modification of the EMR or its associated workflows must, from the outset, be structured for subsequent spread to the remaining hospitals (19 in our case). Because we had not deployed a system like this before, we did not know what to expect and, had we known then what experience has taught us, our initial requests would have been different. Table 2 summarizes the major changes we would have made to our implementation strategy had we known then what we know now.
| Component | Status in Pilot Application | Desirable Changes |
|---|---|---|
| ||
| Degree of disaster recovery support | System outages are handled on an ad hoc basis. | Same level of support as is seen in regular clinical systems (24/7 technical support). |
| Laboratory data feed | Web service. | It would be extremely valuable to have a definite answer about whether alternative data feeds would be faster and more reliable. |
| LAPS2 score | Score appears only on ward or TCU patients. | Display for all hospitalized adults (include anyone 18 years and include ICU patients). |
| Score appears only on inpatient physician dashboard. | Display scores in multiple dashboards (eg, emergency department dashboard). | |
| COPS2 score | Score appears only on ward or TCU patients. | Display for all hospitalized adults (include anyone 18 years and include ICU patients). |
| Score appears only on inpatient physician dashboard. | Display scores in multiple dashboards (eg, emergency department dashboard). | |
| Alert response tracking | None is available. | Functionality that permits tracking what the status is of patients in whom an alert was issued (who responded, where it is charted, etc.)could be structured as a workbench report in KP HealthConnectvery important because of medical legal reasons. |
| Trending capability for scores | None is available. | Trending display available in same location where vital signs and laboratory test results are displayed. |
| Messaging capability | Not currently available. | Transmission of scores to rapid response team (or other designated first responder) via a smartphone, thus obviating the need for staff to check the inpatient dashboard manually every 6 hours. |
EVALUATION STRATEGY
Due to institutional constraints, it is not possible for us to conduct a gold standard pilot using patient‐level randomization, as described by Kollef et al.[8] Consequently, in addition to using the pilot to surface specific implementation issues, we had to develop a parallel scoring system for capturing key data points (scores, outcomes) not just at the 2 pilot sites, but also at the remaining 19 KPNC hospitals. This required that we develop electronic tools that would permit us to capture these data elements continuously, both prospectively as well as retrospectively. Thus, to give an example, we developed a macro that we call LAPS2 any time that permits us to assign a retrospective severity score given any T0. Our ultimate goal is to evaluate the system's deployment using a stepped wedge design[22] in which geographically contiguous clusters of 2 to 4 hospitals go live periodically. The silver standard (a cluster trial involving randomization at the individual hospital level[23]) is not feasible because KPNC hospitals span a very broad geographic area, and it is more resource intensive in a shorter time span. In this context, the most important output from a pilot such as this is to generate an estimate of likely impact; this estimate then becomes a critical component for power calculations for the stepped wedge.
Our ongoing evaluation has all the limitations inherent in the analysis of nonrandomized interventions. Because it only involves 2 hospitals, it is difficult to assess variation due to facility‐specific factors. Finally, because our priority was to avoid alert fatigue, the total number of patients who experience an alert is small, limiting available sample size. Given these constraints, we will employ a counterfactual method, multivariate matching,[24, 25, 26] so as to come as close as possible to simulating a randomized trial. To control for hospital‐specific factors, matching will be combined with difference‐in‐differences[27, 28] methodology. Our basic approach takes advantage of the fact that, although our alert system is currently running in 2 hospitals, it is possible for us to assign a retrospective alert to patients at all KPNC hospitals. Using multivariate matching techniques, we will then create a cohort in which each patient who received an alert is matched to 2 patients who are given a retrospective virtual alert during the same time period in control facilities. The pre‐ and postimplementation outcomes of pilot and matched controls are compared. The matching algorithms specify exact matches on membership status, whether or not the patient had been admitted to the ICU prior to the first alert, and whether or not the patient was full code at the time of an alert. Once potential matches are found using the above procedures, our algorithms seek the closest match for the following variables: age, alert probability, COPS2, and admission LAPS2. Membership status is important, because many individuals who are not covered by the Kaiser Foundation Health Plan, Inc., are hospitalized at KPNC hospitals. Because these nonmembers' postdischarge outcomes cannot be tracked, it is important to control for this variable in our analyses.
Our electronic evaluation strategy also can be used to quantify pilot effects on length of stay (total, after an alert, and ICU), rehospitalization, use of hospice, mortality, and cost. However, it is not adequate for the evaluation of whether or not patient preferences are respected. Consequently, we have also developed manual review instruments for structured electronic chart review (the coding form and manual are provided in the online Appendix of the article in this issue of Journal of Hospital Medicine by Granich et al.[21]). This review will focus on issues such as whether or not patients' surrogates were identified, whether goals of care were discussed, and so forth. In those cases where patients died in the hospital, we will also review whether death occurred after resuscitation, whether family members were present, and so forth.
As noted above and in Figure 1, charting delays can result in uncertainty periods. We have found that these delays can also result in discrepancies in which data extracted from the real time system do not match those extracted from the data warehouse. These discrepancies can complicate creation of analysis datasets, which in turn can lead to delays in completing analyses. Such delays can cause significant problems with stakeholders. In retrospect, we should have devoted more resources to ongoing electronic audits and to the development of algorithms that formally address charting delays.
LESSONS LEARNED AND THOUGHTS ON FUTURE DISSEMINATION
We believe that embedding predictive models in the EMR will become an essential component of clinical care. Despite resource limitations and having to work in a frontier area, we did 3 things well. We were able to embed a complex set of equations and display their outputs in a commercial EMR outside the research setting. In a setting where hospitalists could have requested discontinuation of the system, we achieved consensus that it should remain the standard of care. Lastly, as a result of this work, KPNC will be deploying this early warning system in all its hospitals, so our overall implementation and communication strategy has been sound.
Nonetheless, our road to implementation has been a bumpy one, and we have learned a number of valuable lessons that are being incorporated into our future work. They merit sharing with the broader medical community. Using the title of a song by Ricky SkaggsIf I Had It All Again to Dowe can summarize what we learned with 3 phrases: engage leadership early, provide simpler explanations, and embed the evaluation in the solution.
Although our research on risk adjustment and the epidemiology was known to many KPNC leaders and clinicians, our initial engagement focus was on connecting with hospital physicians and operational leaders who worked in quality improvement. In retrospect, the research team should have engaged with 2 different communities much soonerthe information technology community and that component of leadership that focused on the EMR and information technology issues. Although these 2 broad communities interact with operations all the time, they do not necessarily have regular contact with research developments that might affect both EMR as well as quality improvement operations simultaneously. Not seeking this early engagement probably slowed our work by 9 to 15 months, because of repeated delays resulting from our assumption that the information technology teams understood things that were clear to us but not to them. One major result of this at KPNC is that we now have a regular quarterly meeting between researchers and the EMR leadership. The goal of this regular meeting is to make sure that operational leaders and researchers contemplating projects with an informatics component communicate early, long before any consideration of implementation occurs.
Whereas the notion of providing early warning seems intuitive and simple, translating this into a set of equations is challenging. However, we have found that developing equations is much easier than developing communication strategies suitable for people who are not interested in statistics, a group that probably constitutes the majority of clinicians. One major result of this learning now guiding our work is that our team devotes more time to considering existing and possible workflows. This process includes spending more time engaging with clinicians around how they use information. We are also experimenting with different ways of illustrating statistical concepts (eg, probabilities, likelihood ratios).
As is discussed in the article by Dummett et al.,[20] 1 workflow component that remains unresolved is that of documentation. It is not clear what the documentation standard should be for a deterioration probability. Solving this particular conundrum is not something that can be done by electronic or statistical means. However, also with the benefit of hindsight, we now know that we should have put more energy into automated electronic tools that provide support for documentation after an alert. In addition to being requested by clinicians, having tools that automatically generate tracers as part of both the alerting and documentation process would also make evaluation easier. For example, it would permit a better delineation of the causal path between the intervention (providing a deterioration probability) and patient outcomes. In future projects, incorporation of such tools will get much more prominence.
Acknowledgements
The authors thank Dr. Michelle Caughey, Dr. Philip Madvig, Dr. Patricia Conolly, and Ms. Barbara Crawford for their administrative support, Dr. Tracy Lieu for reviewing the manuscript, and Ms. Rachel Lesser for formatting the manuscript.
Disclosures: This work was supported by a grant from the Gordon and Betty Moore Foundation (Early Detection, Prevention, and Mitigation of Impending Physiologic Deterioration in Hospitalized Patients Outside Intensive Care: Phase 3, pilot), The Permanente Medical Group, Inc., and Kaiser Foundation Hospitals, Inc. As part of our agreement with the Gordon and Betty Moore Foundation, we made a commitment to disseminate our findings in articles such as this one. However, the Foundation and its staff played no role in how we actually structured our articles, nor did they review or preapprove any of the manuscripts submitted as part of the dissemination component. Dr. Liu was supported by the National Institute for General Medical Sciences award K23GM112018. None of the sponsors had any involvement in our decision to submit this manuscript or in the determination of its contents. None of the authors has any conflicts of interest to declare of relevance to this work
- , , , , , . Intra‐hospital transfers to a higher level of care: contribution to total hospital and intensive care unit (ICU) mortality and length of stay (LOS). J Hosp Med. 2011;6(2):74–80.
- , , , . Adverse outcomes associated with delayed intensive care unit transfers in an integrated healthcare system. J Hosp Med. 2012;7(3):224–230.
- , , , , , . Risk factors for unplanned transfer to intensive care within 24 hours of admission from the emergency department in an integrated healthcare system. J Hosp Med. 2012;8(1):13–19.
- , , , , . The medical emergency team: a new strategy to identify and intervene in high‐risk surgical patients. Clin Intensive Care. 1995;6:269–272.
- , , , . The medical emergency team. Anaesth Intensive Care. 1995;23(2):183–186.
- . The critically ill: following your MEWS. QJM. 2001;94(10):507–510.
- National Health Service. National Early Warning Score (NEWS). Standardising the Assessment Of Acute‐Illness Severity in the NHS. Report of a Working Party. London, United Kingdom: Royal College of Physicians; 2012.
- , , , et al. A randomized trial of real‐time automated clinical deterioration alerts sent to a rapid response team. J Hosp Med. 2014;9(7):424–429.
- , , , et al. Automated detection of physiologic deterioration in hospitalized patients. J Am Med Inform Assoc. 2015;22(2):350–360.
- , , , , . Identifying patients at increased risk for unplanned readmission. Med Care. 2013;51(9):761–766.
- , , , , , . Early detection of impending physiologic deterioration among patients who are not in intensive care: development of predictive models using data from an automated electronic medical record. J Hosp Med. 2012;7(5):388–395.
- , , , et al. Early detection of impending deterioration outside the ICU: a difference‐in‐differences (DiD) study. Presented at: American Thoracic Society International Conference, San Francisco, California; May 13–18, 2016; A7614.
- , , , . Unplanned transfers to a medical intensive care unit: causes and relationship to preventable errors in care. J Hosp Med. 2011;6(2):68–72.
- , , . Rapid response teams—walk, don't run. JAMA. 2006;296(13):1645–1647.
- , , , , , . Rapid response systems: a systematic review. Crit Care Med. 2007;35(5):1238–1243.
- , . Rethinking rapid response teams. JAMA. 2010;304(12):1375–1376.
- , , , , , . Risk adjusting hospital inpatient mortality using automated inpatient, outpatient, and laboratory databases. Med Care. 2008;46(3):232–239.
- , , , , . Risk‐adjusting hospital mortality using a comprehensive electronic record in an integrated healthcare delivery system. Med Care. 2013;51(5):446–453.
- , , , , , . Nonelective rehospitalizations and post‐discharge mortality: predictive models suitable for use in real time. Med Care. 2015;53(11):916–923.
- et al. J Hosp Med. 2016;11:000–000.
- et al. J Hosp Med. 2016;11:000–000.
- , . Design and analysis of stepped wedge cluster randomized trials. Contemp Clin Trials. 2007;28(2):182–191.
- , . Cluster randomized trials: evaluating treatments applied to groups. JAMA. 2015;313(20):2068–2069.
- , . Comparison of multivariate matching methods: structures, distances, and algorithms. J Comput Graph Stat. 1993;2(4):405–420.
- , , . A method/macro based on propensity score and Mahalanobis distance to reduce bias in treatment comparison in observational study. Eli Lilly working paper available at: http://www.lexjansen.com/pharmasug/2006/publichealthresearch/pr05.pdf.
- . Matching methods for causal inference: a review and a look forward. Stat Sci. 2010;25(1):1–21.
- , . Methods for evaluating changes in health care policy: the difference‐in‐differences approach. JAMA. 2014;312(22):2401–2402.
- , , . Why we should not be indifferent to specification choices for difference‐in‐differences. Health Serv Res. 2015;50(4):1211–1235.
© 2016 Society of Hospital Medicine
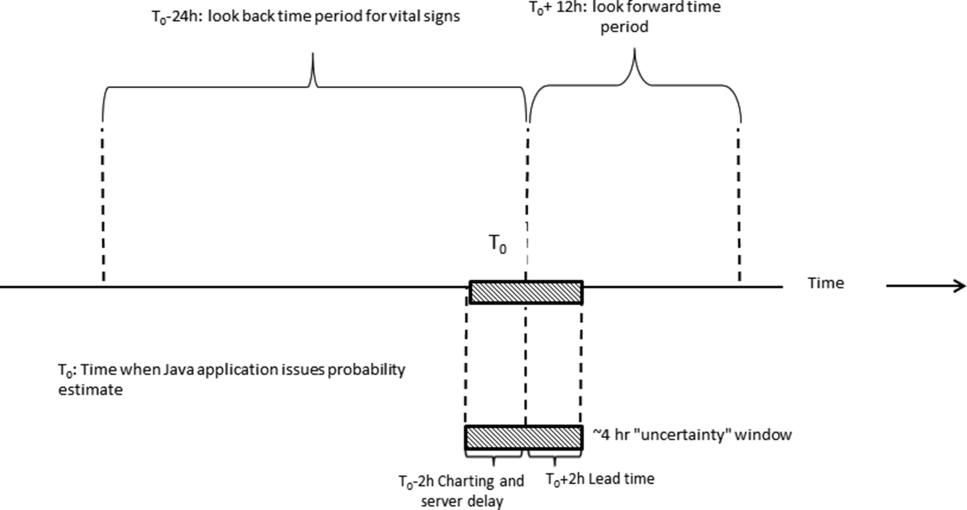
Electronic Order Set for AMI
Although the prevalence of coronary heart disease and death from acute myocardial infarction (AMI) have declined steadily, about 935,000 heart attacks still occur annually in the United States, with approximately one‐third of these being fatal.[1, 2, 3] Studies have demonstrated decreased 30‐day and longer‐term mortality in AMI patients who receive evidence‐based treatment, including aspirin, ‐blockers, angiotensin‐converting enzyme (ACE) inhibitors or angiotensin receptor blockers (ARBs), anticoagulation therapy, and statins.[4, 5, 6, 7] Despite clinical practice guidelines (CPGs) outlining evidence‐based care and considerable efforts to implement processes that improve patient outcomes, delivery of effective therapy remains suboptimal.[8] For example, the Hospital Quality Alliance Program[9] found that in AMI patients, use of aspirin on admission was only 81% to 92%, ‐blocker on admission 75% to 85%, and ACE inhibitors for left ventricular dysfunction 71% to 74%.
Efforts to increase adherence to CPGs and improve patient outcomes in AMI have resulted in variable degrees of success. They include promotion of CPGs,[4, 5, 6, 7] physician education with feedback, report cards, care paths, registries,[10] Joint Commission standardized measures,[11] and paper checklists or order sets (OS).[12, 13]
In this report, we describe the association between use of an evidence‐based, electronic OS for AMI (AMI‐OS) and better adherence to CPGs. This AMI‐OS was implemented in the inpatient electronic medical records (EMRs) of a large integrated healthcare delivery system, Kaiser Permanente Northern California (KPNC). The purpose of our investigation was to determine (1) whether use of the AMI‐OS was associated with improved AMI processes and patient outcomes, and (2) whether these associations persisted after risk adjustment using a comprehensive severity of illness scoring system.
MATERIALS AND METHODS
This project was approved by the KPNC institutional review board.
Under a mutual exclusivity arrangement, salaried physicians of The Permanente Medical Group, Inc., care for 3.4 million Kaiser Foundation Health Plan, Inc. members at facilities owned by Kaiser Foundation Hospitals, Inc. All KPNC facilities employ the same information systems with a common medical record number and can track care covered by the plan but delivered elsewhere.[14] Our setting consisted of 21 KPNC hospitals described in previous reports,[15, 16, 17, 18] using the same commercially available EMR system that includes computerized physician order entry (CPOE). Deployment of the customized inpatient Epic EMR (
In this EMR's CPOE, physicians have options to select individual orders (a la carte) or they can utilize an OS, which is a collection of the most appropriate orders associated with specific diagnoses, procedures, or treatments. The evidence‐based AMI‐OS studied in this project was developed by a multidisciplinary team (for detailed components see Supporting Appendix 1Appendix 5 in the online version of this article).
Our study focused on the first set of hospital admission orders for patients with AMI. The study sample consisted of patients meeting these criteria: (1) age 18 years at admission; (2) admitted to a KPNC hospital for an overnight stay between September 28, 2008 and December 31, 2010; (3) principal diagnosis was AMI (International Classification of Diseases, 9th Revision [ICD‐9][19] codes 410.00, 01, 10, 11, 20, 21, 30, 31, 40, 41, 50, 51, 60, 61, 70, 71, 80, 90, and 91); and (4) KPHC had been operational at the hospital for at least 3 months to be included (for assembly descriptions see Supporting Appendices 15 in the online version of this article). At the study hospitals, troponin I was measured using the Beckman Access AccuTnI assay (Beckman Coulter, Inc., Brea, CA), whose upper reference limit (99th percentile) is 0.04 ng/mL. We excluded patients initially hospitalized for AMI at a non‐KPNC site and transferred into a study hospital.
The data processing methods we employed have been detailed elsewhere.[14, 15, 17, 20, 21, 22] The dependent outcome variables were total hospital length of stay, inpatient mortality, 30‐day mortality, and all‐cause rehospitalization within 30 days of discharge. Linked state mortality data were unavailable for the entire study period, so we ascertained 30‐day mortality based on the combination of KPNC patient demographic data and publicly available Social Security Administration decedent files. We ascertained rehospitalization by scanning KPNC hospitalization databases, which also track out‐of‐plan use.
The dependent process variables were use of aspirin within 24 hours of admission, ‐blockers, anticoagulation, ACE inhibitors or ARBs, and statins. The primary independent variable of interest was whether or not the admitting physician employed the AMI‐OS when admission orders were entered. Consequently, this variable is dichotomous (AMI‐OS vs a la carte).
We controlled for acute illness severity and chronic illness burden using a recent modification[22] of an externally validated risk‐adjustment system applicable to all hospitalized patients.[15, 16, 23, 24, 25] Our methodology included vital signs, neurological status checks, and laboratory test results obtained in the 72 hours preceding hospital admission; comorbidities were captured longitudinally using data from the year preceding hospitalization (for comparison purposes, we also assigned a Charlson Comorbidity Index score[26]).
End‐of‐life care directives are mandatory on admission at KPNC hospitals. Physicians have 4 options: full code, partial code, do not resuscitate, and comfort care only. Because of small numbers in some categories, we collapsed these 4 categories into full code and not full code. Because patients' care directives may change, we elected to capture the care directive in effect when a patient first entered a hospital unit other than the emergency department (ED).
Two authors (M.B., P.C.L.), one of whom is a board‐certified cardiologist, reviewed all admission electrocardiograms and made a consensus determination as to whether or not criteria for ST‐segment elevation myocardial infarction (STEMI) were present (ie, new ST‐segment elevation or left bundle branch block); we also reviewed the records of all patients with missing troponin I data to confirm the AMI diagnosis.
Statistical Methods
We performed unadjusted comparisons between AMI‐OS and nonAMI‐OS patients using the t test or the [2] test, as appropriate.
We hypothesized that the AMI‐OS plays a mediating role on patient outcomes through its effect on adherence to recommended treatment. We evaluated this hypothesis for inpatient mortality by first fitting a multivariable logistic regression model for inpatient mortality as the outcome and either the 5 evidence‐based therapies or the total number of evidence‐based therapies used (ranging from 02, 3, 4, or 5) as the dependent variable controlling for age, gender, presence of STEMI, troponin I, comorbidities, illness severity, ED length of stay (LOS), care directive status, and timing of cardiac catheterization referral as covariates to confirm the protective effect of these therapies on mortality. We then used the same model to estimate the effect of AMI‐OS on inpatient mortality, substituting the therapies with AMI‐OS as the dependent variable and using the same covariates. Last, we included both the therapies and the AMI‐OS in the model to evaluate their combined effects.[27]
We used 2 different methods to estimate the effects of AMI‐OS and number of therapies provided on the outcomes while adjusting for observed baseline differences between the 2 groups of patients: propensity risk score matching, which estimates the average treatment effect for the treated,[28, 29] and inverse probability of treatment weighting, which is used to estimate the average treatment effect.[30, 31, 32] The propensity score was defined as the probability of receiving the intervention for a patient with specific predictive factors.[33, 34] We computed a propensity score for each patient by using logistic regression, with the dependent variable being receipt of AMI‐OS and the independent variables being the covariates used for the multivariate logistic regression as well as ICD‐9 code for final diagnosis. We calculated the Mahalanobis distance between patients who received AMI‐OS (cases) and patients who did not received AMI‐OS (controls) using the same set of covariates. We matched each case to a single control within the same facility based on the nearest available Mahalanobis metric matching within calipers defied as the maximum width of 0.2 standard deviations of the logit of the estimated propensity score.[29, 35] We estimated the odds ratios for the binary dependent variables based on a conditional logistic regression model to account for the matched pairs design.[28] We used a generalized linear model with the log‐transformed LOS as the outcome to estimate the ratio of the LOS geometric mean of the cases to the controls. We calculated the relative risk for patients receiving AMI‐OS via the inverse probability weighting method by first defining a weight for each patient. [We assigned a weight of 1/psi to patients who received the AMI‐OS and a weight of 1/(1psi) to patients who did not receive the AMI‐OS, where psi denotes the propensity score for patient i]. We used a logistic regression model for the binary dependent variables with the same set of covariates described above to estimate the adjusted odds ratios while weighting each observation by its corresponding weight. Last, we used a weighted generalized linear model to estimate the AMI‐OS effect on the log‐transformed LOS.
RESULTS
Table 1 summarizes the characteristics of the 5879 patients. It shows that AMI‐OS patients were more likely to receive evidence‐based therapies for AMI (aspirin, ‐blockers, ACE inhibitors or ARBs, anticoagulation, and statins) and had a 46% lower mortality rate in hospital (3.51 % vs 6.52%) and 33% lower rate at 30 days (5.66% vs 8.48%). AMI‐OS patients were also found to be at lower risk for an adverse outcome than nonAMI‐OS patients. The AMI‐OS patients had lower peak troponin I values, severity of illness (lower Laboratory‐Based Acute Physiology Score, version 2 [LAPS2] scores), comorbidity burdens (lower Comorbidity Point Score, version 2 [COPS2] and Charlson scores), and global predicted mortality risk. AMI‐OS patients were also less likely to have required intensive care. AMI‐OS patients were at higher risk of death than nonAMI‐OS patients with respect to only 1 variable (being full code at the time of admission), but although this difference was statistically significant, it was of minor clinical impact (86% vs 88%).
| Patients Initially Managed Using | P Valuea | ||
|---|---|---|---|
| AMI Order Set, N=3,531b | A La Carte Orders, N=2,348b | ||
| |||
| Age, y, median (meanSD) | 70 (69.413.8) | 70 (69.213.8) | 0.5603 |
| Age (% >65 years) | 2,134 (60.4%) | 1,415 (60.3%) | 0.8949 |
| Sex (% male) | 2,202 (62.4%) | 1,451 (61.8%) | 0.6620 |
| STEMI (% with)c | 166 (4.7%) | 369 (15.7%) | <0.0001 |
| Troponin I (% missing) | 111 (3.1%) | 151 (6.4%) | <0.0001 |
| Troponin I median (meanSD) | 0.57 (3.08.2) | 0.27 (2.58.9) | 0.0651 |
| Charlson score median (meanSD)d | 2.0 (2.51.5) | 2.0 (2.71.6) | <0.0001 |
| COPS2, median (meanSD)e | 14.0 (29.831.7) | 17.0 (34.334.4) | <0.0001 |
| LAPS2, median (meanSD)e | 0.0 (35.643.5) | 27.0 (40.948.1) | <0.0001 |
| Length of stay in ED, h, median (meanSD) | 5.7 (5.93.0) | 5.7 (5.43.1) | <0.0001 |
| Patients receiving aspirin within 24 hoursf | 3,470 (98.3%) | 2,202 (93.8%) | <0.0001 |
| Patients receiving anticoagulation therapyf | 2,886 (81.7%) | 1,846 (78.6%) | 0.0032 |
| Patients receiving ‐blockersf | 3,196 (90.5%) | 1,926 (82.0%) | <0.0001 |
| Patients receiving ACE inhibitors or ARBsf | 2,395 (67.8%) | 1,244 (53.0%) | <0.0001 |
| Patients receiving statinsf | 3,337 (94.5%) | 1,975 (84.1%) | <0.0001 |
| Patient received 1 or more therapies | 3,531 (100.0%) | 2,330 (99.2%) | <0.0001 |
| Patient received 2 or more therapies | 3,521 (99.7%) | 2,266 (96.5%) | <0.0001 |
| Patient received 3 or more therapies | 3,440 (97.4%) | 2,085 (88.8%) | <0.0001 |
| Patient received 4 or more therapies | 3,015 (85.4%) | 1,646 (70.1%) | <0.0001 |
| Patient received all 5 therapies | 1,777 (50.3%) | 866 (35.9%) | <0.0001 |
| Predicted mortality risk, %, median, (meanSD)f | 0.86 (3.27.4) | 1.19 (4.810.8) | <0.0001 |
| Full code at time of hospital entry (%)g | 3,041 (86.1%) | 2,066 (88.0%) | 0.0379 |
| Admitted to ICU (%)i | |||
| Direct admit | 826 (23.4%) | 567 (24.2%) | 0.5047 |
| Unplanned transfer | 222 (6.3%) | 133 (5.7%) | 0.3262 |
| Ever | 1,283 (36.3%) | 1,169 (49.8%) | <0.0001 |
| Length of stay, h, median (meanSD) | 68.3 (109.4140.9) | 68.9 (113.8154.3) | 0.2615 |
| Inpatient mortality (%) | 124 (3.5%) | 153 (6.5%) | <0.0001 |
| 30‐day mortality (%) | 200 (5.7%) | 199 (8.5%) | <0.0001 |
| All‐cause rehospitalization within 30 days (%) | 576 (16.3%) | 401 (17.1%) | 0.4398 |
| Cardiac catheterization procedure referral timing | |||
| 1 day preadmission to discharge | 2,018 (57.2%) | 1,348 (57.4%) | 0.1638 |
| 2 days preadmission or earlier | 97 (2.8%) | 87 (3.7%) | |
| After discharge | 149 (4.2%) | 104 (4.4%) | |
| No referral | 1,267 (35.9%) | 809 (34.5%) | |
Table 2 shows the result of a logistic regression model in which the dependent variable was inpatient mortality and either the 5 evidence‐based therapies or the total number of evidence‐based therapies are the dependent variables. ‐blocker, statin, and ACE inhibitor or ARB therapies all had a protective effect on mortality, with odds ratios ranging from 0.48 (95% confidence interval [CI]: 0.36‐0.64), 0.63 (95% CI: 0.45‐0.89), and 0.40 (95% CI: 0.30‐0.53), respectively. An increased number of therapies also had a beneficial effect on inpatient mortality, with patients having 3 or more of the evidence‐based therapies showing an adjusted odds ratio (AOR) of 0.49 (95% CI: 0.33‐0.73), 4 or more therapies an AOR of 0.29 (95% CI: 0.20‐0.42), and 0.17 (95% CI: 0.11‐0.25) for 5 or more therapies.
| Multiple Therapies Effect | Individual Therapies Effect | |||
|---|---|---|---|---|
| Outcome | Death | Death | ||
| Number of outcomes | 277 | 277 | ||
| AORa | 95% CIb | AORa | 95% CIb | |
| ||||
| Age in years | ||||
| 1839 | Ref | Ref | ||
| 4064 | 1.02 | (0.147.73) | 1.01 | (0.137.66) |
| 6584 | 4.05 | (0.5529.72) | 3.89 | (0.5328.66) |
| 85+ | 4.99 | (0.6737.13) | 4.80 | (0.6435.84) |
| Sex | ||||
| Female | Ref | |||
| Male | 1.05 | (0.811.37) | 1.07 | (0.821.39) |
| STEMIc | ||||
| Absent | Ref | Ref | ||
| Present | 4.00 | (2.755.81) | 3.86 | (2.645.63) |
| Troponin I | ||||
| 0.1 ng/ml | Ref | Ref | ||
| >0.1 ng/ml | 1.01 | (0.721.42) | 1.02 | (0.731.43) |
| COPS2d (AOR per 10 points) | 1.05 | (1.011.08) | 1.04 | (1.011.08) |
| LAPS2d (AOR per 10 points) | 1.09 | (1.061.11) | 1.09 | (1.061.11) |
| ED LOSe (hours) | ||||
| <6 | Ref | Ref | ||
| 67 | 0.74 | (0.531.03) | 0.76 | (0.541.06) |
| >=12 | 0.82 | (0.391.74) | 0.83 | (0.391.78) |
| Code Statusf | ||||
| Full Code | Ref | |||
| Not Full Code | 1.08 | (0.781.49) | 1.09 | (0.791.51) |
| Cardiac procedure referral | ||||
| None during stay | Ref | |||
| 1 day pre adm until discharge | 0.40 | (0.290.54) | 0.39 | (0.280.53) |
| Number of therapies received | ||||
| 2 or less | Ref | |||
| 3 | 0.49 | (0.330.73) | ||
| 4 | 0.29 | (0.200.42) | ||
| 5 | 0.17 | (0.110.25) | ||
| Aspirin therapy | 0.80 | (0.491.32) | ||
| Anticoagulation therapy | 0.86 | (0.641.16) | ||
| Beta Blocker therapy | 0.48 | (0.360.64) | ||
| Statin therapy | 0.63 | (0.450.89) | ||
| ACE inhibitors or ARBs | 0.40 | (0.300.53) | ||
| C Statistic | 0.814 | 0.822 | ||
| Hosmer‐Lemeshow p value | 0.509 | 0.934 | ||
Table 3 shows that the use of the AMI‐OS is protective, with an AOR of 0.59 and a 95% CI of 0.45‐0.76. Table 3 also shows that the most potent predictors were comorbidity burden (AOR: 1.07, 95% CI: 1.03‐1.10 per 10 COPS2 points), severity of illness (AOR: 1.09, 95% CI: 1.07‐1.12 per 10 LAPS2 points), STEMI (AOR: 3.86, 95% CI: 2.68‐5.58), and timing of cardiac catheterization referral occurring immediately prior to or during the admission (AOR: 0.37, 95% CI: 0.27‐0.51). The statistical significance of the AMI‐OS effect disappears when both AMI‐OS and the individual therapies are included in the same model (see Supporting Information, Appendices 15, in the online version of this article).
| Outcome | Death | |
|---|---|---|
| Number of outcomes | 277 | |
| AORa | 95% CIb | |
| ||
| Age in years | ||
| 1839 | Ref | |
| 4064 | 1.16 | (0.158.78) |
| 6584 | 4.67 | (0.6334.46) |
| 85+ | 5.45 | (0.7340.86) |
| Sex | ||
| Female | Ref | |
| Male | 1.05 | (0.811.36) |
| STEMIc | ||
| Absent | Ref | |
| Present | 3.86 | (2.685.58) |
| Troponin I | ||
| 0.1 ng/ml | Ref | |
| >0.1 ng/ml | 1.16 | (0.831.62) |
| COPS2d (AOR per 10 points) | 1.07 | (1.031.10) |
| LAPS2d (AOR per 10 points) | 1.09 | (1.071.12) |
| ED LOSe (hours) | ||
| <6 | Ref | |
| 67 | 0.72 | (0.521.00) |
| >=12 | 0.70 | (0.331.48) |
| Code statusf | ||
| Full code | Ref | |
| Not full code | 1.22 | (0.891.68) |
| Cardiac procedure referral | ||
| None during stay | Ref | |
| 1 day pre adm until discharge | 0.37 | (0.270.51) |
| Order set employedg | ||
| No | Ref | |
| Yes | 0.59 | (0.450.76) |
| C Statistic | 0.792 | |
| Hosmer‐Lemeshow p value | 0.273 | |
Table 4 shows separately the average treatment effect (ATE) and average treatment effect for the treated (ATT) of AMI‐OS and of increasing number of therapies on other outcomes (30‐day mortality, LOS, and readmission). Both the ATE and ATT show that the use of the AMI‐OS was significantly protective with respect to mortality and total hospital LOS but not significant with respect to readmission. The effect of the number of therapies on mortality is significantly higher with increasing number of therapies. For example, patients who received 5 therapies had an average treatment effect on 30‐day inpatient mortality of 0.23 (95% CI: 0.15‐0.35) compared to 0.64 (95% CI: 0.43‐0.96) for 3 therapies, almost a 3‐fold difference. The effects of increasing number of therapies were not significant for LOS or readmission. A sensitivity analysis in which the 535 STEMI patients were removed showed essentially the same results, so it is not reported here.
| Outcome | Order Seta | 3 Therapiesb | 4 Therapiesb | 5 Therapiesb |
|---|---|---|---|---|
| ||||
| Average treatment effectc | ||||
| Inpatient mortality | 0.67 (0.520.86) | 0.64 (0.430.96) | 0.37 (0.250.54) | 0.23 (0.150.35) |
| 30‐day mortality | 0.77 (0.620.96) | 0.68 (0.480.98) | 0.34 (0.240.48) | 0.26 (0.180.37) |
| Readmission | 1.03 (0.901.19) | 1.20 (0.871.66) | 1.19 (0.881.60) | 1.30 (0.961.76) |
| LOS, ratio of the geometric means | 0.91 (0.870.95) | 1.16 (1.031.30) | 1.17 (1.051.30) | 1.12 (1.001.24) |
| Average treatment effect on the treatedd | ||||
| Inpatient mortality | 0.69 (0.520.92) | 0.35 (0.130.93) | 0.17 (0.070.43) | 0.08 (0.030.20) |
| 30‐day mortality | 0.84 (0.661.06) | 0.35 (0.150.79) | 0.17 (0.070.37) | 0.09 (0.040.20) |
| Readmission | 1.02 (0.871.20) | 1.39 (0.852.26) | 1.36 (0.882.12) | 1.23 (0.801.89) |
| LOS, ratio of the geometric meanse | 0.92 (0.870.97) | 1.18 (1.021.37) | 1.16 (1.011.33) | 1.04 (0.911.19) |
To further elucidate possible reasons why physicians did not use the AMI‐OS, the lead author reviewed 105 randomly selected records where the AMI‐OS was not used, 5 records from each of the 21 study hospitals. This review found that in 36% of patients, the AMI‐OS was not used because emergent catheterization or transfer to a facility with percutaneous coronary intervention capability occurred. Presence of other significant medical conditions, including critical illness, was the reason in 17% of these cases, patient or family refusal of treatments in 8%, issues around end‐of‐life care in 3%, and specific medical contraindications in 1%. In the remaining 34%, no reason for not using the AMI‐OS could be identified.
DISCUSSION
We evaluated the use of an evidence‐based electronic AMI‐OS embedded in a comprehensive EMR and found that it was beneficial. Its use was associated with increased adherence to evidence‐based therapies, which in turn were associated with improved outcomes. Using data from a large cohort of hospitalized AMI patients in 21 community hospitals, we were able to use risk adjustment that included physiologic illness severity to adjust for baseline mortality risk. Patients in whom the AMI‐OS was employed tended to be at lower risk; nonetheless, after controlling for confounding variables and adjusting for bias using propensity scores, the AMI‐OS was associated with increased use of evidence‐based therapies and decreased mortality. Most importantly, it appears that the benefits of the OS were not just due to increased receipt of individual recommended therapies, but to increased concurrent receipt of multiple recommended therapies.
Modern EMRs have great potential for significant improvements in the quality, efficiency, and safety of care provided,[36] and our study highlights this potential. However, a number of important limitations to our study must be considered. Although we had access to a very rich dataset, we could not control for all possible confounders, and our risk adjustment cannot match the level of information available to clinicians. In particular, the measurements available to us with respect to cardiac risk are limited. Thus, we have to recognize that the strength of our findings does not approximate that of a randomized trial, and one would expect that the magnitude of the beneficial association would fall under more controlled conditions. Resource limitations also did not permit us to gather more time course data (eg, sequential measurements of patient instability, cardiac damage, or use of recommended therapies), which could provide a better delineation of differences in both processes and outcomes.
Limitations also exist to the generalizability of the use of order sets in other settings that go beyond the availability of a comprehensive EMR. Our study population was cared for in a setting with an unusually high level of integration.[1] For example, KPNC has an elaborate administrative infrastructure for training in the use of the EMR as well as ensuring that order sets are not just evidence‐based, but that they are perceived by clinicians to be of significant value. This infrastructure, established to ensure physician buy‐in, may not be easy to replicate in smaller or less‐integrated settings. Thus, it is conceivable that factors other than the degree of support during the EMR deployments can affect rates of order set use.
Although our use of counterfactual methods included illness severity (LAPS2) and longitudinal comorbidity burden (COPS2), which are not yet available outside highly integrated delivery services employing comprehensive EMRs, it is possible they are insufficient. We cannot exclude the possibility that other biases or patient characteristics were present that led clinicians to preferentially employ the electronic order set in some patients but not in others. One could also argue that future studies should consider using overall adherence to recommended AMI treatment guidelines as a risk adjustment tool that would permit one to analyze what other factors may be playing a role in residual differences in patient outcomes. Last, one could object to our inclusion of STEMI patients; however, this was not a study on optimum treatment strategies for STEMI patients. Rather, it was a study on the impact on AMI outcomes of a specific component of computerized order entry outside the research setting.
Despite these limitations, we believe that our findings provide strong support for the continued use of electronic evidence‐based order sets in the inpatient medical setting. Once the initial implementation of a comprehensive EMR has occurred, deployment of these electronic order sets is a relatively inexpensive but effective method to foster compliance with evidence‐based care.
Future research in healthcare information technology can take a number of directions. One important area, of course, revolves around ways to promote enhanced physician adoption of EMRs. Our audit of records where the AMI‐OS was not used found that specific reasons for not using the order set (eg, treatment refusals, emergent intervention) were present in two‐thirds of the cases. This suggests that future analyses of adherence involving EMRs and CPOE implementation should take a more nuanced look at how order entry is actually enabled. It may be that understanding how order sets affect care enhances clinician acceptance and thus could serve as an incentive to EMR adoption. However, once an EMR is adopted, a need exists to continue evaluations such as this because, ultimately, the gold standard should be improved patient care processes and better outcomes for patients.
Acknowledgement
The authors give special thanks to Dr. Brian Hoberman for sponsoring this work, Dr. Alan S. Go for providing assistance with obtaining copies of electrocardiograms for review, Drs. Tracy Lieu and Vincent Liu for reviewing the manuscript, and Ms. Rachel Lesser for formatting the manuscript.
Disclosures: This work was supported by The Permanente Medical Group, Inc. and Kaiser Foundation Hospitals, Inc. The algorithms used to extract data and perform risk adjustment were developed with funding from the Sidney Garfield Memorial Fund (Early Detection of Impending Physiologic Deterioration in Hospitalized Patients, 1159518), the Agency for Healthcare Quality and Research (Rapid Clinical Snapshots From the EMR Among Pneumonia Patients, 1R01HS018480‐01), and the Gordon and Betty Moore Foundation (Early Detection of Impending Physiologic Deterioration: Electronic Early Warning System).
- , , , , , . Population trends in the incidence and outcomes of acute myocardial infarction. N Engl J Med. 2010;362(23):2155–2165.
- , , , et al. Twenty‐two‐year trends in incidence of myocardial infarction, coronary heart disease mortality, and case fatality in 4 US communities, 1987–2008. Circulation. 2012;125(15):1848–1857.
- , , , et al. Heart disease and stroke statistics—2012 update: a report from the American Heart Association. Circulation. 2012;125(1):e2–e220.
- , , , et al. ACC/AHA 2007 guidelines for the management of patients with unstable angina/non‐ST‐Elevation myocardial infarction: a report of the American College of Cardiology/American Heart Association Task Force on Practice Guidelines (Writing Committee to Revise the 2002 Guidelines for the Management of Patients With Unstable Angina/Non‐ST‐Elevation Myocardial Infarction) developed in collaboration with the American College of Emergency Physicians, the Society for Cardiovascular Angiography and Interventions, and the Society of Thoracic Surgeons endorsed by the American Association of Cardiovascular and Pulmonary Rehabilitation and the Society for Academic Emergency Medicine. J Am Coll Cardiol. 2007;50(7):e1–e157.
- , , , et al. 2007 focused update of the ACC/AHA 2004 guidelines for the management of patients with ST‐elevation myocardial infarction: a report of the American College of Cardiology/American Heart Association Task Force on Practice Guidelines. J Am Coll Cardiol. 2008;51(2):210–247.
- , , , , , . Association between adoption of evidence‐based treatment and survival for patients with ST‐elevation myocardial infarction. JAMA. 2011;305(16):1677–1684.
- , , , et al. Association of changes in clinical characteristics and management with improvement in survival among patients with ST‐elevation myocardial infarction. JAMA. 2012;308(10):998–1006.
- , , , et al. Changes in myocardial infarction guideline adherence as a function of patient risk: an end to paradoxical care? J Am Coll Cardiol. 2011;58(17):1760–1765.
- , , , . Care in U.S. hospitals—the Hospital Quality Alliance program. N Engl J Med. 2005;353(3):265–274.
- , , et al. Challenges in the treatment of NSTEMI patients at high risk for both ischemic and bleeding events: insights from the ACTION Registry‐GWTG. J Am Coll Cardiol. 2011;57:E913–E913.
- , , , , . Quality of care in U.S. hospitals as reflected by standardized measures, 2002–2004. N Engl J Med. 2005;353(3):255–264.
- , , . Guideline‐based standardized care is associated with substantially lower mortality in medicare patients with acute myocardial infarction. J Am Coll Cardiol. 2005;46(7):1242–1248.
- , , , et al. Impact of a standardized heart failure order set on mortality, readmission, and quality and costs of care. Int J Qual Health Care. 2010;22(6):437–444.
- . Linking automated databases for research in managed care settings. Ann Intern Med. 1997;127(8 pt 2):719–724.
- , , , , , . Risk adjusting hospital inpatient mortality using automated inpatient, outpatient, and laboratory databases. Med Care. 2008;46(3):232–239.
- , , , . Length of stay predictions: improvements through the use of automated laboratory and comorbidity variables. Med Care. 2010;48(8):739–744.
- , , , , , . Intra‐hospital transfers to a higher level of care: contribution to total hospital and intensive care unit (ICU) mortality and length of stay (LOS). J Hosp Med. 2011;6(2):74–80.
- , , , . Adverse outcomes associated with delayed intensive care unit transfers in an integrated healthcare system. J Hosp Med. 2012;7(3):224–230.
- International Classification of Diseases, 9th Revision‐Clinical Modification. 4th ed. 3 Vols. Los Angeles, CA: Practice Management Information Corporation; 2006.
- , , , et al. Anticoagulation therapy for stroke prevention in atrial fibrillation: how well do randomized trials translate into clinical practice? JAMA. 2003;290(20):2685–2692.
- , , , , , . Early detection of impending physiologic deterioration among patients who are not in intensive care: development of predictive models using data from an automated electronic medical record. J Hosp Med. 2012;7(5):388–395.
- , , , , . Risk‐adjusting hospital mortality using a comprehensive electronic record in an integrated healthcare delivery system. Med Care. 2013;51(5):446–453.
- , , . Effect of choice of estimation method on inter‐hospital mortality rate comparisons. Med Care. 2010;48(5):456–485.
- , , , . The Kaiser Permanente inpatient risk adjustment methodology was valid in an external patient population. J Clin Epidemiol. 2010;63(7):798–803.
- , , , , . Derivation and validation of a model to predict daily risk of death in hospital. Med Care. 2011;49(8):734–743.
- , , . Adapting a clinical comorbidity index for use with ICD‐9‐CM administrative databases. J Clin Epidemiol. 1992;45(6):613–619.
- . Introduction to Statistical Mediation Analysis. New York, NY: Lawrence Erlbaum Associates; 2008.
- . Nonparametric estimation of average treatment effects under exogenity: a review. Rev Econ Stat. 2004;86:25.
- . Design of Observational Studies. New York, NY: Springer Science+Business Media; 2010.
- . Balance diagnostics for comparing the distribution of baseline covariates between treatment groups in propensity‐score matched samples. Stat Med. 2009;28:24.
- , , . Estimation of regression coefficients when some regressors are not always observed. J Am Stat Assoc. 1994(89):846–866.
- , . Stratification and weighting via the propensity score in estimation of causal treatment effects: a comparative study. Stat Med. 2004;23(19):2937–2960.
- . Discussing hidden bias in observational studies. Ann Intern Med. 1991;115(11):901–905.
- . Propensity score methods for bias reduction in the comparison of a treatment to a non‐randomized control group. Stat Med. 1998;17(19):2265–2281.
- , , . A method/macro based on propensity score and Mahalanobis distance to reduce bias in treatment comparison in observational study, 2005. www.lexjansen.com/pharmasug/2006/publichealthresearch/pr05.pdf. Accessed on September 14, 2013.
- . Using health information technology to improve health care. Arch Intern Med. 2012;172(22):1728–1730.
Although the prevalence of coronary heart disease and death from acute myocardial infarction (AMI) have declined steadily, about 935,000 heart attacks still occur annually in the United States, with approximately one‐third of these being fatal.[1, 2, 3] Studies have demonstrated decreased 30‐day and longer‐term mortality in AMI patients who receive evidence‐based treatment, including aspirin, ‐blockers, angiotensin‐converting enzyme (ACE) inhibitors or angiotensin receptor blockers (ARBs), anticoagulation therapy, and statins.[4, 5, 6, 7] Despite clinical practice guidelines (CPGs) outlining evidence‐based care and considerable efforts to implement processes that improve patient outcomes, delivery of effective therapy remains suboptimal.[8] For example, the Hospital Quality Alliance Program[9] found that in AMI patients, use of aspirin on admission was only 81% to 92%, ‐blocker on admission 75% to 85%, and ACE inhibitors for left ventricular dysfunction 71% to 74%.
Efforts to increase adherence to CPGs and improve patient outcomes in AMI have resulted in variable degrees of success. They include promotion of CPGs,[4, 5, 6, 7] physician education with feedback, report cards, care paths, registries,[10] Joint Commission standardized measures,[11] and paper checklists or order sets (OS).[12, 13]
In this report, we describe the association between use of an evidence‐based, electronic OS for AMI (AMI‐OS) and better adherence to CPGs. This AMI‐OS was implemented in the inpatient electronic medical records (EMRs) of a large integrated healthcare delivery system, Kaiser Permanente Northern California (KPNC). The purpose of our investigation was to determine (1) whether use of the AMI‐OS was associated with improved AMI processes and patient outcomes, and (2) whether these associations persisted after risk adjustment using a comprehensive severity of illness scoring system.
MATERIALS AND METHODS
This project was approved by the KPNC institutional review board.
Under a mutual exclusivity arrangement, salaried physicians of The Permanente Medical Group, Inc., care for 3.4 million Kaiser Foundation Health Plan, Inc. members at facilities owned by Kaiser Foundation Hospitals, Inc. All KPNC facilities employ the same information systems with a common medical record number and can track care covered by the plan but delivered elsewhere.[14] Our setting consisted of 21 KPNC hospitals described in previous reports,[15, 16, 17, 18] using the same commercially available EMR system that includes computerized physician order entry (CPOE). Deployment of the customized inpatient Epic EMR (
In this EMR's CPOE, physicians have options to select individual orders (a la carte) or they can utilize an OS, which is a collection of the most appropriate orders associated with specific diagnoses, procedures, or treatments. The evidence‐based AMI‐OS studied in this project was developed by a multidisciplinary team (for detailed components see Supporting Appendix 1Appendix 5 in the online version of this article).
Our study focused on the first set of hospital admission orders for patients with AMI. The study sample consisted of patients meeting these criteria: (1) age 18 years at admission; (2) admitted to a KPNC hospital for an overnight stay between September 28, 2008 and December 31, 2010; (3) principal diagnosis was AMI (International Classification of Diseases, 9th Revision [ICD‐9][19] codes 410.00, 01, 10, 11, 20, 21, 30, 31, 40, 41, 50, 51, 60, 61, 70, 71, 80, 90, and 91); and (4) KPHC had been operational at the hospital for at least 3 months to be included (for assembly descriptions see Supporting Appendices 15 in the online version of this article). At the study hospitals, troponin I was measured using the Beckman Access AccuTnI assay (Beckman Coulter, Inc., Brea, CA), whose upper reference limit (99th percentile) is 0.04 ng/mL. We excluded patients initially hospitalized for AMI at a non‐KPNC site and transferred into a study hospital.
The data processing methods we employed have been detailed elsewhere.[14, 15, 17, 20, 21, 22] The dependent outcome variables were total hospital length of stay, inpatient mortality, 30‐day mortality, and all‐cause rehospitalization within 30 days of discharge. Linked state mortality data were unavailable for the entire study period, so we ascertained 30‐day mortality based on the combination of KPNC patient demographic data and publicly available Social Security Administration decedent files. We ascertained rehospitalization by scanning KPNC hospitalization databases, which also track out‐of‐plan use.
The dependent process variables were use of aspirin within 24 hours of admission, ‐blockers, anticoagulation, ACE inhibitors or ARBs, and statins. The primary independent variable of interest was whether or not the admitting physician employed the AMI‐OS when admission orders were entered. Consequently, this variable is dichotomous (AMI‐OS vs a la carte).
We controlled for acute illness severity and chronic illness burden using a recent modification[22] of an externally validated risk‐adjustment system applicable to all hospitalized patients.[15, 16, 23, 24, 25] Our methodology included vital signs, neurological status checks, and laboratory test results obtained in the 72 hours preceding hospital admission; comorbidities were captured longitudinally using data from the year preceding hospitalization (for comparison purposes, we also assigned a Charlson Comorbidity Index score[26]).
End‐of‐life care directives are mandatory on admission at KPNC hospitals. Physicians have 4 options: full code, partial code, do not resuscitate, and comfort care only. Because of small numbers in some categories, we collapsed these 4 categories into full code and not full code. Because patients' care directives may change, we elected to capture the care directive in effect when a patient first entered a hospital unit other than the emergency department (ED).
Two authors (M.B., P.C.L.), one of whom is a board‐certified cardiologist, reviewed all admission electrocardiograms and made a consensus determination as to whether or not criteria for ST‐segment elevation myocardial infarction (STEMI) were present (ie, new ST‐segment elevation or left bundle branch block); we also reviewed the records of all patients with missing troponin I data to confirm the AMI diagnosis.
Statistical Methods
We performed unadjusted comparisons between AMI‐OS and nonAMI‐OS patients using the t test or the [2] test, as appropriate.
We hypothesized that the AMI‐OS plays a mediating role on patient outcomes through its effect on adherence to recommended treatment. We evaluated this hypothesis for inpatient mortality by first fitting a multivariable logistic regression model for inpatient mortality as the outcome and either the 5 evidence‐based therapies or the total number of evidence‐based therapies used (ranging from 02, 3, 4, or 5) as the dependent variable controlling for age, gender, presence of STEMI, troponin I, comorbidities, illness severity, ED length of stay (LOS), care directive status, and timing of cardiac catheterization referral as covariates to confirm the protective effect of these therapies on mortality. We then used the same model to estimate the effect of AMI‐OS on inpatient mortality, substituting the therapies with AMI‐OS as the dependent variable and using the same covariates. Last, we included both the therapies and the AMI‐OS in the model to evaluate their combined effects.[27]
We used 2 different methods to estimate the effects of AMI‐OS and number of therapies provided on the outcomes while adjusting for observed baseline differences between the 2 groups of patients: propensity risk score matching, which estimates the average treatment effect for the treated,[28, 29] and inverse probability of treatment weighting, which is used to estimate the average treatment effect.[30, 31, 32] The propensity score was defined as the probability of receiving the intervention for a patient with specific predictive factors.[33, 34] We computed a propensity score for each patient by using logistic regression, with the dependent variable being receipt of AMI‐OS and the independent variables being the covariates used for the multivariate logistic regression as well as ICD‐9 code for final diagnosis. We calculated the Mahalanobis distance between patients who received AMI‐OS (cases) and patients who did not received AMI‐OS (controls) using the same set of covariates. We matched each case to a single control within the same facility based on the nearest available Mahalanobis metric matching within calipers defied as the maximum width of 0.2 standard deviations of the logit of the estimated propensity score.[29, 35] We estimated the odds ratios for the binary dependent variables based on a conditional logistic regression model to account for the matched pairs design.[28] We used a generalized linear model with the log‐transformed LOS as the outcome to estimate the ratio of the LOS geometric mean of the cases to the controls. We calculated the relative risk for patients receiving AMI‐OS via the inverse probability weighting method by first defining a weight for each patient. [We assigned a weight of 1/psi to patients who received the AMI‐OS and a weight of 1/(1psi) to patients who did not receive the AMI‐OS, where psi denotes the propensity score for patient i]. We used a logistic regression model for the binary dependent variables with the same set of covariates described above to estimate the adjusted odds ratios while weighting each observation by its corresponding weight. Last, we used a weighted generalized linear model to estimate the AMI‐OS effect on the log‐transformed LOS.
RESULTS
Table 1 summarizes the characteristics of the 5879 patients. It shows that AMI‐OS patients were more likely to receive evidence‐based therapies for AMI (aspirin, ‐blockers, ACE inhibitors or ARBs, anticoagulation, and statins) and had a 46% lower mortality rate in hospital (3.51 % vs 6.52%) and 33% lower rate at 30 days (5.66% vs 8.48%). AMI‐OS patients were also found to be at lower risk for an adverse outcome than nonAMI‐OS patients. The AMI‐OS patients had lower peak troponin I values, severity of illness (lower Laboratory‐Based Acute Physiology Score, version 2 [LAPS2] scores), comorbidity burdens (lower Comorbidity Point Score, version 2 [COPS2] and Charlson scores), and global predicted mortality risk. AMI‐OS patients were also less likely to have required intensive care. AMI‐OS patients were at higher risk of death than nonAMI‐OS patients with respect to only 1 variable (being full code at the time of admission), but although this difference was statistically significant, it was of minor clinical impact (86% vs 88%).
| Patients Initially Managed Using | P Valuea | ||
|---|---|---|---|
| AMI Order Set, N=3,531b | A La Carte Orders, N=2,348b | ||
| |||
| Age, y, median (meanSD) | 70 (69.413.8) | 70 (69.213.8) | 0.5603 |
| Age (% >65 years) | 2,134 (60.4%) | 1,415 (60.3%) | 0.8949 |
| Sex (% male) | 2,202 (62.4%) | 1,451 (61.8%) | 0.6620 |
| STEMI (% with)c | 166 (4.7%) | 369 (15.7%) | <0.0001 |
| Troponin I (% missing) | 111 (3.1%) | 151 (6.4%) | <0.0001 |
| Troponin I median (meanSD) | 0.57 (3.08.2) | 0.27 (2.58.9) | 0.0651 |
| Charlson score median (meanSD)d | 2.0 (2.51.5) | 2.0 (2.71.6) | <0.0001 |
| COPS2, median (meanSD)e | 14.0 (29.831.7) | 17.0 (34.334.4) | <0.0001 |
| LAPS2, median (meanSD)e | 0.0 (35.643.5) | 27.0 (40.948.1) | <0.0001 |
| Length of stay in ED, h, median (meanSD) | 5.7 (5.93.0) | 5.7 (5.43.1) | <0.0001 |
| Patients receiving aspirin within 24 hoursf | 3,470 (98.3%) | 2,202 (93.8%) | <0.0001 |
| Patients receiving anticoagulation therapyf | 2,886 (81.7%) | 1,846 (78.6%) | 0.0032 |
| Patients receiving ‐blockersf | 3,196 (90.5%) | 1,926 (82.0%) | <0.0001 |
| Patients receiving ACE inhibitors or ARBsf | 2,395 (67.8%) | 1,244 (53.0%) | <0.0001 |
| Patients receiving statinsf | 3,337 (94.5%) | 1,975 (84.1%) | <0.0001 |
| Patient received 1 or more therapies | 3,531 (100.0%) | 2,330 (99.2%) | <0.0001 |
| Patient received 2 or more therapies | 3,521 (99.7%) | 2,266 (96.5%) | <0.0001 |
| Patient received 3 or more therapies | 3,440 (97.4%) | 2,085 (88.8%) | <0.0001 |
| Patient received 4 or more therapies | 3,015 (85.4%) | 1,646 (70.1%) | <0.0001 |
| Patient received all 5 therapies | 1,777 (50.3%) | 866 (35.9%) | <0.0001 |
| Predicted mortality risk, %, median, (meanSD)f | 0.86 (3.27.4) | 1.19 (4.810.8) | <0.0001 |
| Full code at time of hospital entry (%)g | 3,041 (86.1%) | 2,066 (88.0%) | 0.0379 |
| Admitted to ICU (%)i | |||
| Direct admit | 826 (23.4%) | 567 (24.2%) | 0.5047 |
| Unplanned transfer | 222 (6.3%) | 133 (5.7%) | 0.3262 |
| Ever | 1,283 (36.3%) | 1,169 (49.8%) | <0.0001 |
| Length of stay, h, median (meanSD) | 68.3 (109.4140.9) | 68.9 (113.8154.3) | 0.2615 |
| Inpatient mortality (%) | 124 (3.5%) | 153 (6.5%) | <0.0001 |
| 30‐day mortality (%) | 200 (5.7%) | 199 (8.5%) | <0.0001 |
| All‐cause rehospitalization within 30 days (%) | 576 (16.3%) | 401 (17.1%) | 0.4398 |
| Cardiac catheterization procedure referral timing | |||
| 1 day preadmission to discharge | 2,018 (57.2%) | 1,348 (57.4%) | 0.1638 |
| 2 days preadmission or earlier | 97 (2.8%) | 87 (3.7%) | |
| After discharge | 149 (4.2%) | 104 (4.4%) | |
| No referral | 1,267 (35.9%) | 809 (34.5%) | |
Table 2 shows the result of a logistic regression model in which the dependent variable was inpatient mortality and either the 5 evidence‐based therapies or the total number of evidence‐based therapies are the dependent variables. ‐blocker, statin, and ACE inhibitor or ARB therapies all had a protective effect on mortality, with odds ratios ranging from 0.48 (95% confidence interval [CI]: 0.36‐0.64), 0.63 (95% CI: 0.45‐0.89), and 0.40 (95% CI: 0.30‐0.53), respectively. An increased number of therapies also had a beneficial effect on inpatient mortality, with patients having 3 or more of the evidence‐based therapies showing an adjusted odds ratio (AOR) of 0.49 (95% CI: 0.33‐0.73), 4 or more therapies an AOR of 0.29 (95% CI: 0.20‐0.42), and 0.17 (95% CI: 0.11‐0.25) for 5 or more therapies.
| Multiple Therapies Effect | Individual Therapies Effect | |||
|---|---|---|---|---|
| Outcome | Death | Death | ||
| Number of outcomes | 277 | 277 | ||
| AORa | 95% CIb | AORa | 95% CIb | |
| ||||
| Age in years | ||||
| 1839 | Ref | Ref | ||
| 4064 | 1.02 | (0.147.73) | 1.01 | (0.137.66) |
| 6584 | 4.05 | (0.5529.72) | 3.89 | (0.5328.66) |
| 85+ | 4.99 | (0.6737.13) | 4.80 | (0.6435.84) |
| Sex | ||||
| Female | Ref | |||
| Male | 1.05 | (0.811.37) | 1.07 | (0.821.39) |
| STEMIc | ||||
| Absent | Ref | Ref | ||
| Present | 4.00 | (2.755.81) | 3.86 | (2.645.63) |
| Troponin I | ||||
| 0.1 ng/ml | Ref | Ref | ||
| >0.1 ng/ml | 1.01 | (0.721.42) | 1.02 | (0.731.43) |
| COPS2d (AOR per 10 points) | 1.05 | (1.011.08) | 1.04 | (1.011.08) |
| LAPS2d (AOR per 10 points) | 1.09 | (1.061.11) | 1.09 | (1.061.11) |
| ED LOSe (hours) | ||||
| <6 | Ref | Ref | ||
| 67 | 0.74 | (0.531.03) | 0.76 | (0.541.06) |
| >=12 | 0.82 | (0.391.74) | 0.83 | (0.391.78) |
| Code Statusf | ||||
| Full Code | Ref | |||
| Not Full Code | 1.08 | (0.781.49) | 1.09 | (0.791.51) |
| Cardiac procedure referral | ||||
| None during stay | Ref | |||
| 1 day pre adm until discharge | 0.40 | (0.290.54) | 0.39 | (0.280.53) |
| Number of therapies received | ||||
| 2 or less | Ref | |||
| 3 | 0.49 | (0.330.73) | ||
| 4 | 0.29 | (0.200.42) | ||
| 5 | 0.17 | (0.110.25) | ||
| Aspirin therapy | 0.80 | (0.491.32) | ||
| Anticoagulation therapy | 0.86 | (0.641.16) | ||
| Beta Blocker therapy | 0.48 | (0.360.64) | ||
| Statin therapy | 0.63 | (0.450.89) | ||
| ACE inhibitors or ARBs | 0.40 | (0.300.53) | ||
| C Statistic | 0.814 | 0.822 | ||
| Hosmer‐Lemeshow p value | 0.509 | 0.934 | ||
Table 3 shows that the use of the AMI‐OS is protective, with an AOR of 0.59 and a 95% CI of 0.45‐0.76. Table 3 also shows that the most potent predictors were comorbidity burden (AOR: 1.07, 95% CI: 1.03‐1.10 per 10 COPS2 points), severity of illness (AOR: 1.09, 95% CI: 1.07‐1.12 per 10 LAPS2 points), STEMI (AOR: 3.86, 95% CI: 2.68‐5.58), and timing of cardiac catheterization referral occurring immediately prior to or during the admission (AOR: 0.37, 95% CI: 0.27‐0.51). The statistical significance of the AMI‐OS effect disappears when both AMI‐OS and the individual therapies are included in the same model (see Supporting Information, Appendices 15, in the online version of this article).
| Outcome | Death | |
|---|---|---|
| Number of outcomes | 277 | |
| AORa | 95% CIb | |
| ||
| Age in years | ||
| 1839 | Ref | |
| 4064 | 1.16 | (0.158.78) |
| 6584 | 4.67 | (0.6334.46) |
| 85+ | 5.45 | (0.7340.86) |
| Sex | ||
| Female | Ref | |
| Male | 1.05 | (0.811.36) |
| STEMIc | ||
| Absent | Ref | |
| Present | 3.86 | (2.685.58) |
| Troponin I | ||
| 0.1 ng/ml | Ref | |
| >0.1 ng/ml | 1.16 | (0.831.62) |
| COPS2d (AOR per 10 points) | 1.07 | (1.031.10) |
| LAPS2d (AOR per 10 points) | 1.09 | (1.071.12) |
| ED LOSe (hours) | ||
| <6 | Ref | |
| 67 | 0.72 | (0.521.00) |
| >=12 | 0.70 | (0.331.48) |
| Code statusf | ||
| Full code | Ref | |
| Not full code | 1.22 | (0.891.68) |
| Cardiac procedure referral | ||
| None during stay | Ref | |
| 1 day pre adm until discharge | 0.37 | (0.270.51) |
| Order set employedg | ||
| No | Ref | |
| Yes | 0.59 | (0.450.76) |
| C Statistic | 0.792 | |
| Hosmer‐Lemeshow p value | 0.273 | |
Table 4 shows separately the average treatment effect (ATE) and average treatment effect for the treated (ATT) of AMI‐OS and of increasing number of therapies on other outcomes (30‐day mortality, LOS, and readmission). Both the ATE and ATT show that the use of the AMI‐OS was significantly protective with respect to mortality and total hospital LOS but not significant with respect to readmission. The effect of the number of therapies on mortality is significantly higher with increasing number of therapies. For example, patients who received 5 therapies had an average treatment effect on 30‐day inpatient mortality of 0.23 (95% CI: 0.15‐0.35) compared to 0.64 (95% CI: 0.43‐0.96) for 3 therapies, almost a 3‐fold difference. The effects of increasing number of therapies were not significant for LOS or readmission. A sensitivity analysis in which the 535 STEMI patients were removed showed essentially the same results, so it is not reported here.
| Outcome | Order Seta | 3 Therapiesb | 4 Therapiesb | 5 Therapiesb |
|---|---|---|---|---|
| ||||
| Average treatment effectc | ||||
| Inpatient mortality | 0.67 (0.520.86) | 0.64 (0.430.96) | 0.37 (0.250.54) | 0.23 (0.150.35) |
| 30‐day mortality | 0.77 (0.620.96) | 0.68 (0.480.98) | 0.34 (0.240.48) | 0.26 (0.180.37) |
| Readmission | 1.03 (0.901.19) | 1.20 (0.871.66) | 1.19 (0.881.60) | 1.30 (0.961.76) |
| LOS, ratio of the geometric means | 0.91 (0.870.95) | 1.16 (1.031.30) | 1.17 (1.051.30) | 1.12 (1.001.24) |
| Average treatment effect on the treatedd | ||||
| Inpatient mortality | 0.69 (0.520.92) | 0.35 (0.130.93) | 0.17 (0.070.43) | 0.08 (0.030.20) |
| 30‐day mortality | 0.84 (0.661.06) | 0.35 (0.150.79) | 0.17 (0.070.37) | 0.09 (0.040.20) |
| Readmission | 1.02 (0.871.20) | 1.39 (0.852.26) | 1.36 (0.882.12) | 1.23 (0.801.89) |
| LOS, ratio of the geometric meanse | 0.92 (0.870.97) | 1.18 (1.021.37) | 1.16 (1.011.33) | 1.04 (0.911.19) |
To further elucidate possible reasons why physicians did not use the AMI‐OS, the lead author reviewed 105 randomly selected records where the AMI‐OS was not used, 5 records from each of the 21 study hospitals. This review found that in 36% of patients, the AMI‐OS was not used because emergent catheterization or transfer to a facility with percutaneous coronary intervention capability occurred. Presence of other significant medical conditions, including critical illness, was the reason in 17% of these cases, patient or family refusal of treatments in 8%, issues around end‐of‐life care in 3%, and specific medical contraindications in 1%. In the remaining 34%, no reason for not using the AMI‐OS could be identified.
DISCUSSION
We evaluated the use of an evidence‐based electronic AMI‐OS embedded in a comprehensive EMR and found that it was beneficial. Its use was associated with increased adherence to evidence‐based therapies, which in turn were associated with improved outcomes. Using data from a large cohort of hospitalized AMI patients in 21 community hospitals, we were able to use risk adjustment that included physiologic illness severity to adjust for baseline mortality risk. Patients in whom the AMI‐OS was employed tended to be at lower risk; nonetheless, after controlling for confounding variables and adjusting for bias using propensity scores, the AMI‐OS was associated with increased use of evidence‐based therapies and decreased mortality. Most importantly, it appears that the benefits of the OS were not just due to increased receipt of individual recommended therapies, but to increased concurrent receipt of multiple recommended therapies.
Modern EMRs have great potential for significant improvements in the quality, efficiency, and safety of care provided,[36] and our study highlights this potential. However, a number of important limitations to our study must be considered. Although we had access to a very rich dataset, we could not control for all possible confounders, and our risk adjustment cannot match the level of information available to clinicians. In particular, the measurements available to us with respect to cardiac risk are limited. Thus, we have to recognize that the strength of our findings does not approximate that of a randomized trial, and one would expect that the magnitude of the beneficial association would fall under more controlled conditions. Resource limitations also did not permit us to gather more time course data (eg, sequential measurements of patient instability, cardiac damage, or use of recommended therapies), which could provide a better delineation of differences in both processes and outcomes.
Limitations also exist to the generalizability of the use of order sets in other settings that go beyond the availability of a comprehensive EMR. Our study population was cared for in a setting with an unusually high level of integration.[1] For example, KPNC has an elaborate administrative infrastructure for training in the use of the EMR as well as ensuring that order sets are not just evidence‐based, but that they are perceived by clinicians to be of significant value. This infrastructure, established to ensure physician buy‐in, may not be easy to replicate in smaller or less‐integrated settings. Thus, it is conceivable that factors other than the degree of support during the EMR deployments can affect rates of order set use.
Although our use of counterfactual methods included illness severity (LAPS2) and longitudinal comorbidity burden (COPS2), which are not yet available outside highly integrated delivery services employing comprehensive EMRs, it is possible they are insufficient. We cannot exclude the possibility that other biases or patient characteristics were present that led clinicians to preferentially employ the electronic order set in some patients but not in others. One could also argue that future studies should consider using overall adherence to recommended AMI treatment guidelines as a risk adjustment tool that would permit one to analyze what other factors may be playing a role in residual differences in patient outcomes. Last, one could object to our inclusion of STEMI patients; however, this was not a study on optimum treatment strategies for STEMI patients. Rather, it was a study on the impact on AMI outcomes of a specific component of computerized order entry outside the research setting.
Despite these limitations, we believe that our findings provide strong support for the continued use of electronic evidence‐based order sets in the inpatient medical setting. Once the initial implementation of a comprehensive EMR has occurred, deployment of these electronic order sets is a relatively inexpensive but effective method to foster compliance with evidence‐based care.
Future research in healthcare information technology can take a number of directions. One important area, of course, revolves around ways to promote enhanced physician adoption of EMRs. Our audit of records where the AMI‐OS was not used found that specific reasons for not using the order set (eg, treatment refusals, emergent intervention) were present in two‐thirds of the cases. This suggests that future analyses of adherence involving EMRs and CPOE implementation should take a more nuanced look at how order entry is actually enabled. It may be that understanding how order sets affect care enhances clinician acceptance and thus could serve as an incentive to EMR adoption. However, once an EMR is adopted, a need exists to continue evaluations such as this because, ultimately, the gold standard should be improved patient care processes and better outcomes for patients.
Acknowledgement
The authors give special thanks to Dr. Brian Hoberman for sponsoring this work, Dr. Alan S. Go for providing assistance with obtaining copies of electrocardiograms for review, Drs. Tracy Lieu and Vincent Liu for reviewing the manuscript, and Ms. Rachel Lesser for formatting the manuscript.
Disclosures: This work was supported by The Permanente Medical Group, Inc. and Kaiser Foundation Hospitals, Inc. The algorithms used to extract data and perform risk adjustment were developed with funding from the Sidney Garfield Memorial Fund (Early Detection of Impending Physiologic Deterioration in Hospitalized Patients, 1159518), the Agency for Healthcare Quality and Research (Rapid Clinical Snapshots From the EMR Among Pneumonia Patients, 1R01HS018480‐01), and the Gordon and Betty Moore Foundation (Early Detection of Impending Physiologic Deterioration: Electronic Early Warning System).
- , , , , , . Population trends in the incidence and outcomes of acute myocardial infarction. N Engl J Med. 2010;362(23):2155–2165.
- , , , et al. Twenty‐two‐year trends in incidence of myocardial infarction, coronary heart disease mortality, and case fatality in 4 US communities, 1987–2008. Circulation. 2012;125(15):1848–1857.
- , , , et al. Heart disease and stroke statistics—2012 update: a report from the American Heart Association. Circulation. 2012;125(1):e2–e220.
- , , , et al. ACC/AHA 2007 guidelines for the management of patients with unstable angina/non‐ST‐Elevation myocardial infarction: a report of the American College of Cardiology/American Heart Association Task Force on Practice Guidelines (Writing Committee to Revise the 2002 Guidelines for the Management of Patients With Unstable Angina/Non‐ST‐Elevation Myocardial Infarction) developed in collaboration with the American College of Emergency Physicians, the Society for Cardiovascular Angiography and Interventions, and the Society of Thoracic Surgeons endorsed by the American Association of Cardiovascular and Pulmonary Rehabilitation and the Society for Academic Emergency Medicine. J Am Coll Cardiol. 2007;50(7):e1–e157.
- , , , et al. 2007 focused update of the ACC/AHA 2004 guidelines for the management of patients with ST‐elevation myocardial infarction: a report of the American College of Cardiology/American Heart Association Task Force on Practice Guidelines. J Am Coll Cardiol. 2008;51(2):210–247.
- , , , , , . Association between adoption of evidence‐based treatment and survival for patients with ST‐elevation myocardial infarction. JAMA. 2011;305(16):1677–1684.
- , , , et al. Association of changes in clinical characteristics and management with improvement in survival among patients with ST‐elevation myocardial infarction. JAMA. 2012;308(10):998–1006.
- , , , et al. Changes in myocardial infarction guideline adherence as a function of patient risk: an end to paradoxical care? J Am Coll Cardiol. 2011;58(17):1760–1765.
- , , , . Care in U.S. hospitals—the Hospital Quality Alliance program. N Engl J Med. 2005;353(3):265–274.
- , , et al. Challenges in the treatment of NSTEMI patients at high risk for both ischemic and bleeding events: insights from the ACTION Registry‐GWTG. J Am Coll Cardiol. 2011;57:E913–E913.
- , , , , . Quality of care in U.S. hospitals as reflected by standardized measures, 2002–2004. N Engl J Med. 2005;353(3):255–264.
- , , . Guideline‐based standardized care is associated with substantially lower mortality in medicare patients with acute myocardial infarction. J Am Coll Cardiol. 2005;46(7):1242–1248.
- , , , et al. Impact of a standardized heart failure order set on mortality, readmission, and quality and costs of care. Int J Qual Health Care. 2010;22(6):437–444.
- . Linking automated databases for research in managed care settings. Ann Intern Med. 1997;127(8 pt 2):719–724.
- , , , , , . Risk adjusting hospital inpatient mortality using automated inpatient, outpatient, and laboratory databases. Med Care. 2008;46(3):232–239.
- , , , . Length of stay predictions: improvements through the use of automated laboratory and comorbidity variables. Med Care. 2010;48(8):739–744.
- , , , , , . Intra‐hospital transfers to a higher level of care: contribution to total hospital and intensive care unit (ICU) mortality and length of stay (LOS). J Hosp Med. 2011;6(2):74–80.
- , , , . Adverse outcomes associated with delayed intensive care unit transfers in an integrated healthcare system. J Hosp Med. 2012;7(3):224–230.
- International Classification of Diseases, 9th Revision‐Clinical Modification. 4th ed. 3 Vols. Los Angeles, CA: Practice Management Information Corporation; 2006.
- , , , et al. Anticoagulation therapy for stroke prevention in atrial fibrillation: how well do randomized trials translate into clinical practice? JAMA. 2003;290(20):2685–2692.
- , , , , , . Early detection of impending physiologic deterioration among patients who are not in intensive care: development of predictive models using data from an automated electronic medical record. J Hosp Med. 2012;7(5):388–395.
- , , , , . Risk‐adjusting hospital mortality using a comprehensive electronic record in an integrated healthcare delivery system. Med Care. 2013;51(5):446–453.
- , , . Effect of choice of estimation method on inter‐hospital mortality rate comparisons. Med Care. 2010;48(5):456–485.
- , , , . The Kaiser Permanente inpatient risk adjustment methodology was valid in an external patient population. J Clin Epidemiol. 2010;63(7):798–803.
- , , , , . Derivation and validation of a model to predict daily risk of death in hospital. Med Care. 2011;49(8):734–743.
- , , . Adapting a clinical comorbidity index for use with ICD‐9‐CM administrative databases. J Clin Epidemiol. 1992;45(6):613–619.
- . Introduction to Statistical Mediation Analysis. New York, NY: Lawrence Erlbaum Associates; 2008.
- . Nonparametric estimation of average treatment effects under exogenity: a review. Rev Econ Stat. 2004;86:25.
- . Design of Observational Studies. New York, NY: Springer Science+Business Media; 2010.
- . Balance diagnostics for comparing the distribution of baseline covariates between treatment groups in propensity‐score matched samples. Stat Med. 2009;28:24.
- , , . Estimation of regression coefficients when some regressors are not always observed. J Am Stat Assoc. 1994(89):846–866.
- , . Stratification and weighting via the propensity score in estimation of causal treatment effects: a comparative study. Stat Med. 2004;23(19):2937–2960.
- . Discussing hidden bias in observational studies. Ann Intern Med. 1991;115(11):901–905.
- . Propensity score methods for bias reduction in the comparison of a treatment to a non‐randomized control group. Stat Med. 1998;17(19):2265–2281.
- , , . A method/macro based on propensity score and Mahalanobis distance to reduce bias in treatment comparison in observational study, 2005. www.lexjansen.com/pharmasug/2006/publichealthresearch/pr05.pdf. Accessed on September 14, 2013.
- . Using health information technology to improve health care. Arch Intern Med. 2012;172(22):1728–1730.
© 2014 Society of Hospital Medicine