The plan-do-study-act cycle and data display

Article Type
Changed
Thu, 03/28/2019 - 14:59


This month’s column is the second in a series of three articles written by a group from Toronto and Houston. The series imagined that a community of gastroenterologists set out to improve the adenoma detection rates of physicians in their practice. The first article described the design and launch of the project. This month, Dr. Bollegala and her colleagues explain the plan-do-study-act (PDSA) cycle of improvement within a small practice. The PDSA cycle is a fundamental component of successful quality improvement initiatives; it allows a group to systematically analyze what works and what doesn’t. The focus of this article is squarely on small community practices (still the majority of gastrointestinal practices nationally), so its relevance is high. PDSA cycles are small, narrowly focused projects that can be accomplished by all as we strive to improve our care of the patients we serve. Next month, we will learn how to embed a quality initiative within our practices so sustained improvement can be seen.


John I. Allen, MD, MBA, AGAF

Editor in Chief


Article 1 of our series focused on the emergence of the adenoma detection rate (ADR) as a quality indicator for colonoscopy-based colorectal cancer screening programs.1 A target ADR of 25% has been established by several national gastroenterology societies and serves as a focus area for those seeking to develop quality improvement (QI) initiatives aimed at reducing the interval incidence of colorectal cancer.2 In this series, you are a community-based urban general gastroenterologist interested in improving your current group ADR of 19% to the established target of 25% for each individual endoscopist within the group over a 12-month period.

This article focuses on a clinician-friendly description of the plan-do-study-act (PDSA) cycle, a key construct within the Model for Improvement framework for QI initiatives. It also describes the importance and key elements of QI data reporting, including the run chart. All core concepts will be framed within the series example of the development of an institutional QI initiative for ADR improvement.
 

Plan-Do-Study-Act cycle

Conventional scientific research in health care generally is based on large-scale projects, performed over long periods of time and producing aggregate data analyzed through summary statistics. QI-related research, as it relates to PDSA, in contrast, is characterized by smaller-scale projects performed over shorter periods of time, with iterative protocols to accommodate local context and therefore optimize intervention success. As such, the framework for their development, implementation, and continual modification requires a conceptual and methodologic shift.

The PDSA cycle is characterized by four key steps. The first step is to plan. This step involves addressing the following questions: 1) what are we trying to accomplish? (aim); 2) how will we know that a change is an improvement? (measure); and 3) what changes can we make that will lead to improvement? (change). Additional considerations include ensuring that the stated goal is attainable, relevant, and that the timeline is feasible. An important aspect of the plan stage is gaining an understanding for the current local context, key participants and their roles, and areas in which performance is excelling or is challenged. This understanding is critical to conceptually linking the identified problem with its proposed solution. Formulating an impact prediction allows subsequent learning and adaptation.

The second step is to do. This step involves execution of the identified plan over a specified period of time. It also involves rigorous qualitative and quantitative data collection, allowing the research team to assess change and document unexpected events. The identification of an implementation leader or champion to ensure protocol adherence, effective communication among team members, and coordinate accurate data collection can be critical for overall success.

The third step is to study. This step requires evaluating whether a change in the outcome measure has occurred, which intervention was successful, and whether an identified change is sustained over time. It also requires interpretation of change within the local context, specifically with respect to unintended consequences, unanticipated events, and the sustainability of any gains. To interpret study findings appropriately, feedback with involved process members, endoscopists, and/or other stakeholder groups may be necessary. This can be important for explaining the results of each cycle, identifying protocol modifications for future cycles, and optimizing the opportunity for success. Studying the data generated by a QI initiative requires clear and accurate data display and rules for interpretation.

The fourth step is to act. This final step allows team members to reflect on the results generated and decide whether the same intervention should be continued, modified, or changed, thereby incorporating lessons learned from previous PDSA cycles (Figure 1).3

AGA Institute
Figure 1
Documentation of each PDSA cycle is an important component of the QI research process, allowing for learning that informs future cycles or initiatives, reflection, and knowledge capture.4 However, a recent systematic review published by Taylor et al.4 reported an “inconsistent approach to the application and reporting of PDSA cycles and a lack of adherence to key principles of the method.” Fewer than 20% (14 of 73) of articles reported each PDSA cycle, with 14% of articles reporting data continuously. Only 9% of articles explicitly documented a theory-based result prediction for each cycle of change. As such, caution was advised in the interpretation and implementation of studies with inadequate PDSA conduct and/or reporting. The Standards for Quality Improvement Reporting Excellence guidelines have proposed a QI-specific publication framework.5,6 However, no standardized criteria for the conduct or reporting of the PDSA framework currently exist. In addition, the PDSA cycle is limited in its reactive nature. It also may inadequately account for system/process complexity, which may lead to varying results for the same change over time.4 Finally, it does not clearly identify the most effective intervention in achieving the target, thereby preventing simplification of the overall intervention strategy.

Despite these challenges, the PDSA framework allows for small-scale and fast-paced initiative testing that reduces patient and institutional risk while minimizing the commitment of resources.4,7 Successful cycles improve stakeholder confidence in the probability for success with larger-scale implementation.

In our series example, step 1 of the PDSA cycle, plan, can be described as follows: Aim: increase the ADR of all group endoscopists to 25% over a 12-month period. Measure: Outcome: the proportion of endoscopists at your institution with an ADR greater than 25%; process – withdrawal time; balancing – staff satisfaction, patient satisfaction, and procedure time. Change: Successive cycles will institute the following: audible timers to ensure adequate withdrawal time, publication of an endoscopist-specific composite score, and training to improve inspection technique.8

In step 2 of the PDSA cycle, do, a physician member of the gastroenterology division incorporates QI into their job description and leads a change team charged with PDSA cycle 1. An administrative assistant calculates the endoscopist-specific ADRs for that month. Documentation of related events for this cycle such as unexpected physician absence, delays in polyp histology reporting, and so forth, is performed.

In step 3 of the PDSA cycle, study, the data generated will be represented on a run chart plotting the proportion of endoscopists with an ADR greater than 25% on the y-axis, and time (in monthly intervals) on the x-axis. This will be described in further detail in a later section.

In the final step of the PDSA cycle, act, continuation and modification of the tested changes can be represented as follows.


Displaying data

The documentation, analysis, and interpretation of data generated by multiple PDSA cycles must be displayed accurately and succinctly. The run chart has been developed as a simple technique for identifying nonrandom patterns (that is, signals), which allows QI researchers to determine the impact of each cycle of change and the stability of that change over a given time period.9 This often is contrasted with conventional statistical approaches that aggregate data and perform summary statistical comparisons at static time points. Instead, the run chart allows for an appreciation of the dynamic nature of PDSA-driven process manipulation and resulting outcome changes.

Correct interpretation of the presented data requires an understanding of common cause variation (CCV) and special cause variation (SCV). CCV occurs randomly and is present in all health care processes. It can never be eliminated completely. SCV, in contrast, is the result of external factors that are imposed on normal processes. For example, the introduction of audible timers within endoscopy rooms to ensure adequate withdrawal time may result in an increase in the ADR. The relatively stable ADR measured in both the pre-intervention and postintervention periods are subject to CCV. However, the postintervention increase in ADR is the result of SCV.10

As shown in Figure 2, the horizontal axis shows the time scale and spans the entire duration of the intervention period. The y-axis shows the outcome measure of interest. A horizontal line representing the median is shown.9 A goal line also may be depicted. Annotations to indicate the implementation of change or other important events (such as unintended consequences or unexpected events) also may be added to facilitate data interpretation.

AGA Institute
Figure 2
Specific rules based on standard statistics govern the objective interpretation of a run chart and allow the differentiation between random and cause-specific patterns of change.

Shift: at least six consecutive data points above or below the median line are needed (points on the median line are skipped).9 To assess a shift appropriately, at least 10 data points are required.

Trend: at least five consecutive data points all increasing in value or all decreasing in value are needed (numerically equivalent points are skipped).9

Runs: a run refers to a series of data points on one side of the median.9 If a random pattern of data points exists on the run chart, there should be an appropriate number of runs on either side of the median. Values outside of this indicate a higher probability of a nonrandom pattern.9,11

Astronomic point: this refers to a data point that subjectively is found to be obviously different from the rest and prompts consideration of the events that led to this.9

Although straightforward to construct and interpret for clinicians without statistical training, the run chart has specific limitations. It is ideal for the display of early data but cannot be used to determine its durability.9 In addition, a run chart does not reflect discrete data with no clear median.

The example run chart in Figure 2 shows that there is a shift in data points from below the median to above the median, ultimately achieving 100% group adherence to the ADR target of greater than 25%. There are only two runs for a total of 12 data points within the 12-month study period, indicating that there is a 5% or less probability that this is a random pattern.11 It appears that our interventions have resulted in incremental improvements in the ADR to exceed the target level in a nonrandom fashion. Although the cumulative effect of these interventions has been successful, it is difficult to predict the durability of this change moving forward. In addition, it would be difficult to select only a single intervention, of the many trialed, that would result in a sustained ADR of 25% or greater.

Summary and next steps

This article selectively reviews the process of change framed by the PDSA cycle. We also discuss the role of data display and interpretation using a run chart. The final article in this series will cover how to sustain change and support a culture of continuous improvement.

References

1. Corley, D.A., Jensen, C.D., Marks, A.R., et al. Adenoma detection rate and risk of colorectal cancer and death. N Engl J Med. 2014;370:1298-306.

2. Cohen, J., Schoenfeld, P., Park, W., et al. Quality indicators for colonoscopy. Gastrointest Endosc. 2015;81:31-53.

3. Module 5: Improvement Cycle. (2013). Available at: http://implementation.fpg.unc.edu/book/export/html/326. Accessed Feb. 1, 2016.

4. Taylor, M.J., McNicholas, C., Nicolay, C., et al. Systematic review of the application of the plan-do-study-act method to improve quality in healthcare. BMJ Qual Saf. 2014;23(4):290-8.

5. Davidoff, F., Batalden, P., Stevens, D. et al. Publication guidelines for quality improvement in health care: evolution of the SQUIRE project. Qual Saf Health Care. 2008;17:i3-9.

6. Ogrinc, G., Mooney, S., Estrada, C., et al. The SQUIRE (standards for Quality Improvement Reporting Excellence) guidelines for quality improvement reporting: explanation and elaboration. Qual Saf Health Care. 2008;17:i13-32.

7. Nelson, E.C., Batalden, B.P., Godfrey, M.M. Quality by design: a clinical microsystems approach. Jossey-Bass, San Francisco; 2007.

8. Coe, S.G.C.J., Diehl, N.N., Wallace, M.B. An endoscopic quality improvement program improves detection of colorectal adenomas. Am J Gastroenterol. 2013;108(2):219-26.

9. Perla, R.J., Provost, L.P., Murray, S.K. The run chart: a simple analytical tool for learning from variation in healthcare processes. BMJ Qual Saf. 2011;20:46-51.

10. Neuhauser, D., Provost, L., Bergman, B. The meaning of variation to healthcare managers, clinical and health-services researchers, and individual patients. BMJ Qual Saf. 2011;20:i36-40.

11. Swed, F.S. Eisenhart, C. Tables for testing randomness of grouping in a sequence of alternatives. Ann Math Statist. 1943;14:66-87

Dr. Bollegala is in the division of gastroenterology, department of medicine, Women’s College Hospital; Dr. Mosko is in the division of gastroenterology, department of medicine, St. Michael’s Hospital, and the Institute of Health Policy, Management, and Evaluation; Dr. Bernstein is in the division of gastroenterology, department of medicine, Sunnybrook Health Sciences Centre; Dr. Brahmania is in the Toronto Center for Liver Diseases, division of gastroenterology, department of medicine, University Health Network; Dr. Liu is in the division of gastroenterology, department of medicine, University Health Network; Dr. Steinhart is at Mount Sinai Hospital Centre for Inflammatory Bowel Disease, department of medicine and Institute of Health Policy, Management, and Evaluation; Dr. Silver is in the division of nephrology, St. Michael’s Hospital; Dr. Bell is in the division of internal medicine, department of medicine, Mount Sinai Hospital; Dr. Nguyen is at Mount Sinai Hospital Centre for Inflammatory Bowel Disease, department of medicine; Dr. Weizman is at the Mount Sinai Hospital Centre for Inflammatory Bowel Disease, department of medicine, and Institute of Health Policy, Management and Evaluation. All are at the University of Toronto. Dr. Patel is in the division of gastroenterology and hepatology, department of medicine, Baylor College of Medicine, Houston. The authors disclose no conflicts.

Publications
Topics
Sections


This month’s column is the second in a series of three articles written by a group from Toronto and Houston. The series imagined that a community of gastroenterologists set out to improve the adenoma detection rates of physicians in their practice. The first article described the design and launch of the project. This month, Dr. Bollegala and her colleagues explain the plan-do-study-act (PDSA) cycle of improvement within a small practice. The PDSA cycle is a fundamental component of successful quality improvement initiatives; it allows a group to systematically analyze what works and what doesn’t. The focus of this article is squarely on small community practices (still the majority of gastrointestinal practices nationally), so its relevance is high. PDSA cycles are small, narrowly focused projects that can be accomplished by all as we strive to improve our care of the patients we serve. Next month, we will learn how to embed a quality initiative within our practices so sustained improvement can be seen.


John I. Allen, MD, MBA, AGAF

Editor in Chief


Article 1 of our series focused on the emergence of the adenoma detection rate (ADR) as a quality indicator for colonoscopy-based colorectal cancer screening programs.1 A target ADR of 25% has been established by several national gastroenterology societies and serves as a focus area for those seeking to develop quality improvement (QI) initiatives aimed at reducing the interval incidence of colorectal cancer.2 In this series, you are a community-based urban general gastroenterologist interested in improving your current group ADR of 19% to the established target of 25% for each individual endoscopist within the group over a 12-month period.

This article focuses on a clinician-friendly description of the plan-do-study-act (PDSA) cycle, a key construct within the Model for Improvement framework for QI initiatives. It also describes the importance and key elements of QI data reporting, including the run chart. All core concepts will be framed within the series example of the development of an institutional QI initiative for ADR improvement.
 

Plan-Do-Study-Act cycle

Conventional scientific research in health care generally is based on large-scale projects, performed over long periods of time and producing aggregate data analyzed through summary statistics. QI-related research, as it relates to PDSA, in contrast, is characterized by smaller-scale projects performed over shorter periods of time, with iterative protocols to accommodate local context and therefore optimize intervention success. As such, the framework for their development, implementation, and continual modification requires a conceptual and methodologic shift.

The PDSA cycle is characterized by four key steps. The first step is to plan. This step involves addressing the following questions: 1) what are we trying to accomplish? (aim); 2) how will we know that a change is an improvement? (measure); and 3) what changes can we make that will lead to improvement? (change). Additional considerations include ensuring that the stated goal is attainable, relevant, and that the timeline is feasible. An important aspect of the plan stage is gaining an understanding for the current local context, key participants and their roles, and areas in which performance is excelling or is challenged. This understanding is critical to conceptually linking the identified problem with its proposed solution. Formulating an impact prediction allows subsequent learning and adaptation.

The second step is to do. This step involves execution of the identified plan over a specified period of time. It also involves rigorous qualitative and quantitative data collection, allowing the research team to assess change and document unexpected events. The identification of an implementation leader or champion to ensure protocol adherence, effective communication among team members, and coordinate accurate data collection can be critical for overall success.

The third step is to study. This step requires evaluating whether a change in the outcome measure has occurred, which intervention was successful, and whether an identified change is sustained over time. It also requires interpretation of change within the local context, specifically with respect to unintended consequences, unanticipated events, and the sustainability of any gains. To interpret study findings appropriately, feedback with involved process members, endoscopists, and/or other stakeholder groups may be necessary. This can be important for explaining the results of each cycle, identifying protocol modifications for future cycles, and optimizing the opportunity for success. Studying the data generated by a QI initiative requires clear and accurate data display and rules for interpretation.

The fourth step is to act. This final step allows team members to reflect on the results generated and decide whether the same intervention should be continued, modified, or changed, thereby incorporating lessons learned from previous PDSA cycles (Figure 1).3

AGA Institute
Figure 1
Documentation of each PDSA cycle is an important component of the QI research process, allowing for learning that informs future cycles or initiatives, reflection, and knowledge capture.4 However, a recent systematic review published by Taylor et al.4 reported an “inconsistent approach to the application and reporting of PDSA cycles and a lack of adherence to key principles of the method.” Fewer than 20% (14 of 73) of articles reported each PDSA cycle, with 14% of articles reporting data continuously. Only 9% of articles explicitly documented a theory-based result prediction for each cycle of change. As such, caution was advised in the interpretation and implementation of studies with inadequate PDSA conduct and/or reporting. The Standards for Quality Improvement Reporting Excellence guidelines have proposed a QI-specific publication framework.5,6 However, no standardized criteria for the conduct or reporting of the PDSA framework currently exist. In addition, the PDSA cycle is limited in its reactive nature. It also may inadequately account for system/process complexity, which may lead to varying results for the same change over time.4 Finally, it does not clearly identify the most effective intervention in achieving the target, thereby preventing simplification of the overall intervention strategy.

Despite these challenges, the PDSA framework allows for small-scale and fast-paced initiative testing that reduces patient and institutional risk while minimizing the commitment of resources.4,7 Successful cycles improve stakeholder confidence in the probability for success with larger-scale implementation.

In our series example, step 1 of the PDSA cycle, plan, can be described as follows: Aim: increase the ADR of all group endoscopists to 25% over a 12-month period. Measure: Outcome: the proportion of endoscopists at your institution with an ADR greater than 25%; process – withdrawal time; balancing – staff satisfaction, patient satisfaction, and procedure time. Change: Successive cycles will institute the following: audible timers to ensure adequate withdrawal time, publication of an endoscopist-specific composite score, and training to improve inspection technique.8

In step 2 of the PDSA cycle, do, a physician member of the gastroenterology division incorporates QI into their job description and leads a change team charged with PDSA cycle 1. An administrative assistant calculates the endoscopist-specific ADRs for that month. Documentation of related events for this cycle such as unexpected physician absence, delays in polyp histology reporting, and so forth, is performed.

In step 3 of the PDSA cycle, study, the data generated will be represented on a run chart plotting the proportion of endoscopists with an ADR greater than 25% on the y-axis, and time (in monthly intervals) on the x-axis. This will be described in further detail in a later section.

In the final step of the PDSA cycle, act, continuation and modification of the tested changes can be represented as follows.


Displaying data

The documentation, analysis, and interpretation of data generated by multiple PDSA cycles must be displayed accurately and succinctly. The run chart has been developed as a simple technique for identifying nonrandom patterns (that is, signals), which allows QI researchers to determine the impact of each cycle of change and the stability of that change over a given time period.9 This often is contrasted with conventional statistical approaches that aggregate data and perform summary statistical comparisons at static time points. Instead, the run chart allows for an appreciation of the dynamic nature of PDSA-driven process manipulation and resulting outcome changes.

Correct interpretation of the presented data requires an understanding of common cause variation (CCV) and special cause variation (SCV). CCV occurs randomly and is present in all health care processes. It can never be eliminated completely. SCV, in contrast, is the result of external factors that are imposed on normal processes. For example, the introduction of audible timers within endoscopy rooms to ensure adequate withdrawal time may result in an increase in the ADR. The relatively stable ADR measured in both the pre-intervention and postintervention periods are subject to CCV. However, the postintervention increase in ADR is the result of SCV.10

As shown in Figure 2, the horizontal axis shows the time scale and spans the entire duration of the intervention period. The y-axis shows the outcome measure of interest. A horizontal line representing the median is shown.9 A goal line also may be depicted. Annotations to indicate the implementation of change or other important events (such as unintended consequences or unexpected events) also may be added to facilitate data interpretation.

AGA Institute
Figure 2
Specific rules based on standard statistics govern the objective interpretation of a run chart and allow the differentiation between random and cause-specific patterns of change.

Shift: at least six consecutive data points above or below the median line are needed (points on the median line are skipped).9 To assess a shift appropriately, at least 10 data points are required.

Trend: at least five consecutive data points all increasing in value or all decreasing in value are needed (numerically equivalent points are skipped).9

Runs: a run refers to a series of data points on one side of the median.9 If a random pattern of data points exists on the run chart, there should be an appropriate number of runs on either side of the median. Values outside of this indicate a higher probability of a nonrandom pattern.9,11

Astronomic point: this refers to a data point that subjectively is found to be obviously different from the rest and prompts consideration of the events that led to this.9

Although straightforward to construct and interpret for clinicians without statistical training, the run chart has specific limitations. It is ideal for the display of early data but cannot be used to determine its durability.9 In addition, a run chart does not reflect discrete data with no clear median.

The example run chart in Figure 2 shows that there is a shift in data points from below the median to above the median, ultimately achieving 100% group adherence to the ADR target of greater than 25%. There are only two runs for a total of 12 data points within the 12-month study period, indicating that there is a 5% or less probability that this is a random pattern.11 It appears that our interventions have resulted in incremental improvements in the ADR to exceed the target level in a nonrandom fashion. Although the cumulative effect of these interventions has been successful, it is difficult to predict the durability of this change moving forward. In addition, it would be difficult to select only a single intervention, of the many trialed, that would result in a sustained ADR of 25% or greater.

Summary and next steps

This article selectively reviews the process of change framed by the PDSA cycle. We also discuss the role of data display and interpretation using a run chart. The final article in this series will cover how to sustain change and support a culture of continuous improvement.

References

1. Corley, D.A., Jensen, C.D., Marks, A.R., et al. Adenoma detection rate and risk of colorectal cancer and death. N Engl J Med. 2014;370:1298-306.

2. Cohen, J., Schoenfeld, P., Park, W., et al. Quality indicators for colonoscopy. Gastrointest Endosc. 2015;81:31-53.

3. Module 5: Improvement Cycle. (2013). Available at: http://implementation.fpg.unc.edu/book/export/html/326. Accessed Feb. 1, 2016.

4. Taylor, M.J., McNicholas, C., Nicolay, C., et al. Systematic review of the application of the plan-do-study-act method to improve quality in healthcare. BMJ Qual Saf. 2014;23(4):290-8.

5. Davidoff, F., Batalden, P., Stevens, D. et al. Publication guidelines for quality improvement in health care: evolution of the SQUIRE project. Qual Saf Health Care. 2008;17:i3-9.

6. Ogrinc, G., Mooney, S., Estrada, C., et al. The SQUIRE (standards for Quality Improvement Reporting Excellence) guidelines for quality improvement reporting: explanation and elaboration. Qual Saf Health Care. 2008;17:i13-32.

7. Nelson, E.C., Batalden, B.P., Godfrey, M.M. Quality by design: a clinical microsystems approach. Jossey-Bass, San Francisco; 2007.

8. Coe, S.G.C.J., Diehl, N.N., Wallace, M.B. An endoscopic quality improvement program improves detection of colorectal adenomas. Am J Gastroenterol. 2013;108(2):219-26.

9. Perla, R.J., Provost, L.P., Murray, S.K. The run chart: a simple analytical tool for learning from variation in healthcare processes. BMJ Qual Saf. 2011;20:46-51.

10. Neuhauser, D., Provost, L., Bergman, B. The meaning of variation to healthcare managers, clinical and health-services researchers, and individual patients. BMJ Qual Saf. 2011;20:i36-40.

11. Swed, F.S. Eisenhart, C. Tables for testing randomness of grouping in a sequence of alternatives. Ann Math Statist. 1943;14:66-87

Dr. Bollegala is in the division of gastroenterology, department of medicine, Women’s College Hospital; Dr. Mosko is in the division of gastroenterology, department of medicine, St. Michael’s Hospital, and the Institute of Health Policy, Management, and Evaluation; Dr. Bernstein is in the division of gastroenterology, department of medicine, Sunnybrook Health Sciences Centre; Dr. Brahmania is in the Toronto Center for Liver Diseases, division of gastroenterology, department of medicine, University Health Network; Dr. Liu is in the division of gastroenterology, department of medicine, University Health Network; Dr. Steinhart is at Mount Sinai Hospital Centre for Inflammatory Bowel Disease, department of medicine and Institute of Health Policy, Management, and Evaluation; Dr. Silver is in the division of nephrology, St. Michael’s Hospital; Dr. Bell is in the division of internal medicine, department of medicine, Mount Sinai Hospital; Dr. Nguyen is at Mount Sinai Hospital Centre for Inflammatory Bowel Disease, department of medicine; Dr. Weizman is at the Mount Sinai Hospital Centre for Inflammatory Bowel Disease, department of medicine, and Institute of Health Policy, Management and Evaluation. All are at the University of Toronto. Dr. Patel is in the division of gastroenterology and hepatology, department of medicine, Baylor College of Medicine, Houston. The authors disclose no conflicts.

Publications
Publications
Topics
Article Type
Sections
Disallow All Ads

Launching a quality improvement initiative

Article Type
Changed
Thu, 03/28/2019 - 15:01


This article by Adam Weizman and colleagues is the first of a three-part series that will provide practical advice for practices that wish to develop a quality initiative. The first article, “Launching a quality improvement initiative” describes the infrastructure, personnel, and structure needed to approach an identified problem within a practice (variability in adenoma detection rates). This case-based approach helps us understand the step-by-step approach needed to reduce variability and improve quality. The authors present a plan (road map) in a straightforward and practical way that seems simple, but if followed carefully, leads to success. These articles are rich in resources and link to state-of-the-art advice.

John I. Allen, MD, MBA, AGAF, Special Section Editor

There has been increasing focus on measuring quality indicators in gastroenterology over the past few years. The adenoma detection rate (ADR) has emerged as one of the most important quality indicators because it is supported by robust clinical evidence.1-3 With every 1% increase in ADR, a 3% reduction in interval colorectal cancer has been noted.3 As such, an ADR of 25% has been designated as an important quality target for all endoscopists who perform colorectal cancer screening.1

You work at a community hospital in a large, metropolitan area. Your colleagues in a number of other departments across your hospital have been increasingly interested in quality improvement (QI) and have launched QI interventions, although none in your department. Moreover, there have been reforms in how hospital endoscopy units are funded in your jurisdiction, with a move toward volume-based funding with a quality overlay. In an effort to improve efficiency and better characterize performance, the hospital has been auditing the performance of all endoscopists at your institution over the past year. Among the eight endoscopists who work at your hospital, the overall ADR has been found to be 19%, decreasing to less than the generally accepted benchmark.1

In response to the results of the audit in your unit, you decide that you would like to develop an initiative to improve your group’s ADR.

Forming a quality improvement team

The first step in any QI project is to establish an improvement team. This working group consists of individuals with specific roles who perform interdependent tasks and share a common goal.4 Usually, frontline health care workers who are impacted most by the quality-of-care problem form the foundation of the team. A team lead is identified who will oversee the project. Content experts are also helpful members of the team who may have particular expertise in the clinical domain that will be the focus of the project. In addition, an improvement adviser, an individual with some expertise in QI, is needed on the team. This adviser may be from within your department or from outside. Although they may not possess expertise in the clinical problem you are trying to tackle, they should have skills in QI methodology and process to aid the team. An executive sponsor also needs to be identified. This should be an influential and well-respected individual who holds a senior administrative position at your institution who can help the team overcome barriers and secure resources. Physician engagement is a critical, often-overlooked step in any improvement effort. Regardless of the initiative, physicians continue to have tremendous influence over hospital-based outcomes.5 Identifying a physician champion, a prominent and respected physician at your organization to help spread the importance of your efforts and create a burning platform for change, is helpful. It also is valuable to have a patient on the improvement team to provide unique perspectives that only the end user of health care can convey and to ensure that the project is patient centered, as all improvement efforts should be.6

Improvement framework

Before starting any improvement effort, there are several important considerations that need to be addressed when choosing a quality improvement target.7 It is important to have a good understanding of the burden and severity of the problem. This often requires audit and measuring. For example, although we may think there is a problem with ADR in our endoscopy unit based on a general impression, it is critical to have data to support this suspicion. This is part of a current state analysis (discussed later). It also is important to select a quality-of-care problem that is under you or your group’s direct control. For example, it would be difficult to initiate a quality improvement project aimed at changing the practice of radiology reporting as a gastroenterologist. It is important to pick a problem that is focused and within a narrow scope that is feasible to address and then improve. Consideration of the unintended consequences of an improvement initiative often is overlooked, but needs to be considered because not all that comes out of quality improvement efforts is good. Finally, the likelihood of success of a quality initiative is increased significantly if it can generate momentum and lead to other interventions both within your department and beyond.


There are several specific improvement frameworks that can be used by a team to address a quality-of-care problem and perform a quality improvement project. The framework chosen depends on the type of problem that is being targeted and the training of the individuals on the improvement team. Three of the most commonly used improvement frameworks include the following: 1) Six Sigma; 2) Lean; and 3) Model for Improvement.

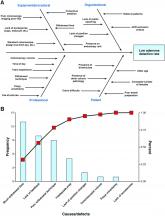
Figure 1. Common diagnostic tools used for root cause analyses. (A) Fishbone diagram and (B) Pareto chart. HD, high-definition; prep, preparation.
AGA Institute
Figure 1. Common diagnostic tools used for root cause analyses. (A) Fishbone diagram and (B) Pareto chart. HD, high-definition; prep, preparation.


Six Sigma

Six Sigma is focused on improvement by reducing variability.8 It is a highly analytic framework relying on statistical analysis and mathematical modeling. It is best suited for projects in which the root cause and contributors to the target problem remain unclear and the aim of the intervention is to reduce variation.

Lean

Lean emphasizes improvement through elimination of waste and classifies all parts of any process as value added and nonvalue added.9 It is estimated that 95% of activities in any health care process are nonvalue added and the objective of Lean is to identify opportunities to simplify and create efficiencies. It is best suited for target problems that directly can be observed and mapped out, for example, process of care, flow, and efficiency of an endoscopy unit.

Model for Improvement

The Model for Improvement has been popularized by the Institute for Healthcare Improvement.10,11 It is well suited for health care teams, and its advantages are its adaptability to many improvement targets and lack of extensive training, consultant support, or statistical training as required by the previous frameworks mentioned earlier. As a result, it is the most commonly used improvement framework.

Using the Model for Improvement

The Model for Improvement is organized around three main questions: 1) What are we trying to accomplish? 2) How will we know that a change is an improvement? and 3) What changes can result in improvement?

Question 1: What are we trying to accomplish?

The first stage using the Model for Improvement is developing a clear project aim. A good aim statement should be specific in defining what measures one is hoping to improve and setting a concrete deadline by which to achieve it.10,11 It should answer the questions of what the team is trying to improve, by how much, and by what date. It is more effective for the target to be an ambitious, stretch goal to ensure the effort is worth the resources and time that will be invested by the team. Not only does a good aim statement serve as the foundation for the project, but it can redirect the team if the improvement effort is getting off track. In the earlier example of improving ADR, an aim statement could be “to increase the ADR of all endoscopists who perform colonoscopy at your hospital to 25% over a 12-month period.”

Question 2: How will we know that a change is an improvement?

This step involves defining measures that will allow you to understand if changes implemented are impacting the system within which your target problem resides and if this represents an improvement. This usually involves continuous, real-time measurement. Outcome measures are clinically relevant outcomes and are the ultimate goal of what the project team is trying to accomplish. In the example of ADR, this could be the proportion of endoscopists at your institution with an ADR greater than 25%. Process measures are relevant to the system within which you are working and your target problem resides. Typically, the intervention that you implement will have impact that is measurable much earlier by process outcomes than outcomes measures, which are usually a downstream effect. As such, an improvement project still may be a success if it shows improvements in process measures only. For example, the proportion of endoscopists measuring withdrawal time would be a process measure in an intervention aimed at improving ADR. In time, improvement in process measures may translate to improvements in the outcome measure. Balancing measures are indicators of unintended consequences of the project. Not all that comes from an improvement effort is necessarily positive. If improvements in certain process measures come at the cost of harms shown by the balancing measures, such as deterioration in staff satisfaction or increase in time per procedure, the improvement project may not be worth continuing.

Importance of understanding the target problem: Current-state analysis


In contrast to classic enumerative research in which the clinical environment can be well controlled, quality improvement work focuses on sampling and intervening upon a less controlled and dynamic process or system with the intent of improving it.10 Just as treatment strategies in clinical medicine are based on diagnostic testing, so too in quality improvement work, the strategy of diagnosing the current state allows for linking the root cause of quality problems with solutions that can induce positive change.

Several common diagnostic tools are used to identify root causes of quality and safety issues. These include the following: 1) process mapping, 2) cause-and-effect diagrams, and 3) Pareto charts.

Process mapping

Process maps are tools used to understand the system that is being studied. A process map is a graphic depiction of the flow through a process, which creates a collaborative awareness of the current state and identifies opportunities for improvement. It is important that multiple individuals who have knowledge of the process in question are involved in its creation. Process maps are created by first establishing the start and end of the process. Second, the high-level steps are included. Third, a more detailed set of steps can be included within each of the high-level steps.

Cause-and-effect diagrams

Cause-and-effect diagrams, also known as Ishikawa or fishbone diagrams, are helpful brainstorming tools used to graphically display and explore potential causes of a target problem. They illustrate that there often are many contributing factors to one underlying problem and the relationship between contributing factors. Classic examples of categories include equipment, environment, materials, methods and process, people, and measurement.10 Figure 1 provides an example of these tools in an effort to improve ADR.
 

To identify the most important contributors to the target problem and thus where to focus improvement efforts, a Pareto chart, a bar graph that places all defects/causes in the order of the frequency in which they occur, is constructed. The x-axis is a list of possible defects (Figure 1). The y-axis is the frequency with which any one defect is occurring, and the third (x-2) axis is the cumulative frequency. In theory, it is expected that there will be a vital few defects that account for 80% of all occurrences (referred to by some as the 80:20 rule).10, 11 Populating this graph requires measurement, which, as discussed earlier, is the key to understanding any problem. Measurement can be accomplished through direct observation/audit, chart review, and/or multivoting.

Question 3: What changes can result in improvement?

Once the improvement team has defined an aim and established its family of measures, it is time to develop and implement an intervention. Rather than investing time and resources into one intervention that may or may not be successful, it is preferable to perform small change cycles in which the intervention is conducted on a small scale, refined, and either repeated or changed. As a result, most quality improvement projects consist of an iterative process. The Model for Improvement defines four steps that allow the improvement team to perform this: Plan, do, study, act (PDSA).4,10,11 The first two questions listed earlier allowed the improvement team to plan the intervention. The next step, do, involves implementing your project on a small scale, thereby testing your change while collecting continuous measurements. Study involves interpreting your data using both conventional methods and several improvement-specific methods (discussed later) that help answer the question of how will we know that a change is improvement? Finally, act involves making a conclusion about your first PDSA cycle, helping to inform subsequent cycles. This results in a series of small, rapid cycle changes, one building on the next, that lead to implementation of change(s) that ultimately serve to address your improvement problem and your project aim.

A change concept is an approach known to be useful in developing specific changes that result in improvement. Change concepts are used as a starting point to generate change ideas. A number of change concepts spanning nine main categories have been defined by the Associates for Process Improvement,10 including eliminating waste, improving work flow, managing variation, and designing systems to prevent error. For the purpose of improving ADR, your team may choose a few change concepts and ideas based on the diagnostic work-up. For example, the change concept of designing the system to prevent errors through standardizing withdrawal time for all physicians may lead to an improvement in ADR. This then is linked to the change idea of audible timers placed in endoscopy suites to ensure longer withdrawal times.12 The impact of this change would be measured and the next cycle would build on these results.


Summary and next steps

In this first article of the series, the QI team moved forward with their aim to increase ADR. A root cause analysis was undertaken using multiple diagnostic tools including a fishbone diagram and a Pareto chart. Finally, change ideas were generated based on the earlier-described root causes and established change concepts. The next steps involve undertaking PDSA cycles to test change ideas and monitor for improvement.

References

1. Rex, D.K., Schoenfeld, P.S., Cohen, J. et al. Quality indicators for colonoscopy. Gastrointest Endosc. 2015;81:31-53.

2. Rex, D.K., Bond, J.H., Winawer, S. et al. Quality in the technical performance of colonoscopy and the continuous quality improvement process for colonoscopy: recommendations of the U.S. Multi-Society Task Force on Colorectal Cancer. Am J Gastroenterol. 2002;97:1296-308.

3. Corley, D., Jensen, C.D., Marks, A.R. et al. Adenoma detection rate and risk of colorectal cancer and death. N Engl J Med. 2014;370:1298-306.
4. Kotter, J.P. Leading change. Harvard Business Review Press, Boston; 2012

5. Taitz, J.M., Lee, T.H., and Sequist, T.D. A framework for engaging physicians in quality and safety. BMJ Qual Saf. 2012;21:722-8.

6. Carman, K.L., Dardess, P., Maurer, M. et al. Patient and family engagement: a framework for understanding the elements and developing interventions and policies. Health Aff (Millwood). 2013;33:223-31.

7.Ranji, S.R. and Shojania, S.G. Implementing patient safety interventions in your hospital: what to try and what to avoid. Med Clin North Am. 2008;92:275-93.

8. Antony, J. Six Sigma vs Lean: some perspectives from leading academics and practitioners. Int J Product Perform Manage. 2011;60:185-90.

9. Bercaw, R. Taking improvement from the assembly line to healthcare: the application of lean within the healthcare industry. Taylor and Francis, Boca Raton, FL; 2012

10. Langley, G.J., Nolan, K.M., Nolan, T.W. et al. The improvement guide: a practical approach to enhancing organizational performance. Jossey-Bass, San Francisco; 2009

11. Berwick, D.M. A primer on leading the improvement of systems. BMJ. 1996;312:619-22.

12. Corley, D.A., Jensen, C.D., and Marks, A.R. Can we improve adenoma detection rates? A systematic review of intervention studies. Gastrointest Endosc. 2011;74:656-65.

Publications
Topics
Sections


This article by Adam Weizman and colleagues is the first of a three-part series that will provide practical advice for practices that wish to develop a quality initiative. The first article, “Launching a quality improvement initiative” describes the infrastructure, personnel, and structure needed to approach an identified problem within a practice (variability in adenoma detection rates). This case-based approach helps us understand the step-by-step approach needed to reduce variability and improve quality. The authors present a plan (road map) in a straightforward and practical way that seems simple, but if followed carefully, leads to success. These articles are rich in resources and link to state-of-the-art advice.

John I. Allen, MD, MBA, AGAF, Special Section Editor

There has been increasing focus on measuring quality indicators in gastroenterology over the past few years. The adenoma detection rate (ADR) has emerged as one of the most important quality indicators because it is supported by robust clinical evidence.1-3 With every 1% increase in ADR, a 3% reduction in interval colorectal cancer has been noted.3 As such, an ADR of 25% has been designated as an important quality target for all endoscopists who perform colorectal cancer screening.1

You work at a community hospital in a large, metropolitan area. Your colleagues in a number of other departments across your hospital have been increasingly interested in quality improvement (QI) and have launched QI interventions, although none in your department. Moreover, there have been reforms in how hospital endoscopy units are funded in your jurisdiction, with a move toward volume-based funding with a quality overlay. In an effort to improve efficiency and better characterize performance, the hospital has been auditing the performance of all endoscopists at your institution over the past year. Among the eight endoscopists who work at your hospital, the overall ADR has been found to be 19%, decreasing to less than the generally accepted benchmark.1

In response to the results of the audit in your unit, you decide that you would like to develop an initiative to improve your group’s ADR.

Forming a quality improvement team

The first step in any QI project is to establish an improvement team. This working group consists of individuals with specific roles who perform interdependent tasks and share a common goal.4 Usually, frontline health care workers who are impacted most by the quality-of-care problem form the foundation of the team. A team lead is identified who will oversee the project. Content experts are also helpful members of the team who may have particular expertise in the clinical domain that will be the focus of the project. In addition, an improvement adviser, an individual with some expertise in QI, is needed on the team. This adviser may be from within your department or from outside. Although they may not possess expertise in the clinical problem you are trying to tackle, they should have skills in QI methodology and process to aid the team. An executive sponsor also needs to be identified. This should be an influential and well-respected individual who holds a senior administrative position at your institution who can help the team overcome barriers and secure resources. Physician engagement is a critical, often-overlooked step in any improvement effort. Regardless of the initiative, physicians continue to have tremendous influence over hospital-based outcomes.5 Identifying a physician champion, a prominent and respected physician at your organization to help spread the importance of your efforts and create a burning platform for change, is helpful. It also is valuable to have a patient on the improvement team to provide unique perspectives that only the end user of health care can convey and to ensure that the project is patient centered, as all improvement efforts should be.6

Improvement framework

Before starting any improvement effort, there are several important considerations that need to be addressed when choosing a quality improvement target.7 It is important to have a good understanding of the burden and severity of the problem. This often requires audit and measuring. For example, although we may think there is a problem with ADR in our endoscopy unit based on a general impression, it is critical to have data to support this suspicion. This is part of a current state analysis (discussed later). It also is important to select a quality-of-care problem that is under you or your group’s direct control. For example, it would be difficult to initiate a quality improvement project aimed at changing the practice of radiology reporting as a gastroenterologist. It is important to pick a problem that is focused and within a narrow scope that is feasible to address and then improve. Consideration of the unintended consequences of an improvement initiative often is overlooked, but needs to be considered because not all that comes out of quality improvement efforts is good. Finally, the likelihood of success of a quality initiative is increased significantly if it can generate momentum and lead to other interventions both within your department and beyond.


There are several specific improvement frameworks that can be used by a team to address a quality-of-care problem and perform a quality improvement project. The framework chosen depends on the type of problem that is being targeted and the training of the individuals on the improvement team. Three of the most commonly used improvement frameworks include the following: 1) Six Sigma; 2) Lean; and 3) Model for Improvement.

Figure 1. Common diagnostic tools used for root cause analyses. (A) Fishbone diagram and (B) Pareto chart. HD, high-definition; prep, preparation.
AGA Institute
Figure 1. Common diagnostic tools used for root cause analyses. (A) Fishbone diagram and (B) Pareto chart. HD, high-definition; prep, preparation.


Six Sigma

Six Sigma is focused on improvement by reducing variability.8 It is a highly analytic framework relying on statistical analysis and mathematical modeling. It is best suited for projects in which the root cause and contributors to the target problem remain unclear and the aim of the intervention is to reduce variation.

Lean

Lean emphasizes improvement through elimination of waste and classifies all parts of any process as value added and nonvalue added.9 It is estimated that 95% of activities in any health care process are nonvalue added and the objective of Lean is to identify opportunities to simplify and create efficiencies. It is best suited for target problems that directly can be observed and mapped out, for example, process of care, flow, and efficiency of an endoscopy unit.

Model for Improvement

The Model for Improvement has been popularized by the Institute for Healthcare Improvement.10,11 It is well suited for health care teams, and its advantages are its adaptability to many improvement targets and lack of extensive training, consultant support, or statistical training as required by the previous frameworks mentioned earlier. As a result, it is the most commonly used improvement framework.

Using the Model for Improvement

The Model for Improvement is organized around three main questions: 1) What are we trying to accomplish? 2) How will we know that a change is an improvement? and 3) What changes can result in improvement?

Question 1: What are we trying to accomplish?

The first stage using the Model for Improvement is developing a clear project aim. A good aim statement should be specific in defining what measures one is hoping to improve and setting a concrete deadline by which to achieve it.10,11 It should answer the questions of what the team is trying to improve, by how much, and by what date. It is more effective for the target to be an ambitious, stretch goal to ensure the effort is worth the resources and time that will be invested by the team. Not only does a good aim statement serve as the foundation for the project, but it can redirect the team if the improvement effort is getting off track. In the earlier example of improving ADR, an aim statement could be “to increase the ADR of all endoscopists who perform colonoscopy at your hospital to 25% over a 12-month period.”

Question 2: How will we know that a change is an improvement?

This step involves defining measures that will allow you to understand if changes implemented are impacting the system within which your target problem resides and if this represents an improvement. This usually involves continuous, real-time measurement. Outcome measures are clinically relevant outcomes and are the ultimate goal of what the project team is trying to accomplish. In the example of ADR, this could be the proportion of endoscopists at your institution with an ADR greater than 25%. Process measures are relevant to the system within which you are working and your target problem resides. Typically, the intervention that you implement will have impact that is measurable much earlier by process outcomes than outcomes measures, which are usually a downstream effect. As such, an improvement project still may be a success if it shows improvements in process measures only. For example, the proportion of endoscopists measuring withdrawal time would be a process measure in an intervention aimed at improving ADR. In time, improvement in process measures may translate to improvements in the outcome measure. Balancing measures are indicators of unintended consequences of the project. Not all that comes from an improvement effort is necessarily positive. If improvements in certain process measures come at the cost of harms shown by the balancing measures, such as deterioration in staff satisfaction or increase in time per procedure, the improvement project may not be worth continuing.

Importance of understanding the target problem: Current-state analysis


In contrast to classic enumerative research in which the clinical environment can be well controlled, quality improvement work focuses on sampling and intervening upon a less controlled and dynamic process or system with the intent of improving it.10 Just as treatment strategies in clinical medicine are based on diagnostic testing, so too in quality improvement work, the strategy of diagnosing the current state allows for linking the root cause of quality problems with solutions that can induce positive change.

Several common diagnostic tools are used to identify root causes of quality and safety issues. These include the following: 1) process mapping, 2) cause-and-effect diagrams, and 3) Pareto charts.

Process mapping

Process maps are tools used to understand the system that is being studied. A process map is a graphic depiction of the flow through a process, which creates a collaborative awareness of the current state and identifies opportunities for improvement. It is important that multiple individuals who have knowledge of the process in question are involved in its creation. Process maps are created by first establishing the start and end of the process. Second, the high-level steps are included. Third, a more detailed set of steps can be included within each of the high-level steps.

Cause-and-effect diagrams

Cause-and-effect diagrams, also known as Ishikawa or fishbone diagrams, are helpful brainstorming tools used to graphically display and explore potential causes of a target problem. They illustrate that there often are many contributing factors to one underlying problem and the relationship between contributing factors. Classic examples of categories include equipment, environment, materials, methods and process, people, and measurement.10 Figure 1 provides an example of these tools in an effort to improve ADR.
 

To identify the most important contributors to the target problem and thus where to focus improvement efforts, a Pareto chart, a bar graph that places all defects/causes in the order of the frequency in which they occur, is constructed. The x-axis is a list of possible defects (Figure 1). The y-axis is the frequency with which any one defect is occurring, and the third (x-2) axis is the cumulative frequency. In theory, it is expected that there will be a vital few defects that account for 80% of all occurrences (referred to by some as the 80:20 rule).10, 11 Populating this graph requires measurement, which, as discussed earlier, is the key to understanding any problem. Measurement can be accomplished through direct observation/audit, chart review, and/or multivoting.

Question 3: What changes can result in improvement?

Once the improvement team has defined an aim and established its family of measures, it is time to develop and implement an intervention. Rather than investing time and resources into one intervention that may or may not be successful, it is preferable to perform small change cycles in which the intervention is conducted on a small scale, refined, and either repeated or changed. As a result, most quality improvement projects consist of an iterative process. The Model for Improvement defines four steps that allow the improvement team to perform this: Plan, do, study, act (PDSA).4,10,11 The first two questions listed earlier allowed the improvement team to plan the intervention. The next step, do, involves implementing your project on a small scale, thereby testing your change while collecting continuous measurements. Study involves interpreting your data using both conventional methods and several improvement-specific methods (discussed later) that help answer the question of how will we know that a change is improvement? Finally, act involves making a conclusion about your first PDSA cycle, helping to inform subsequent cycles. This results in a series of small, rapid cycle changes, one building on the next, that lead to implementation of change(s) that ultimately serve to address your improvement problem and your project aim.

A change concept is an approach known to be useful in developing specific changes that result in improvement. Change concepts are used as a starting point to generate change ideas. A number of change concepts spanning nine main categories have been defined by the Associates for Process Improvement,10 including eliminating waste, improving work flow, managing variation, and designing systems to prevent error. For the purpose of improving ADR, your team may choose a few change concepts and ideas based on the diagnostic work-up. For example, the change concept of designing the system to prevent errors through standardizing withdrawal time for all physicians may lead to an improvement in ADR. This then is linked to the change idea of audible timers placed in endoscopy suites to ensure longer withdrawal times.12 The impact of this change would be measured and the next cycle would build on these results.


Summary and next steps

In this first article of the series, the QI team moved forward with their aim to increase ADR. A root cause analysis was undertaken using multiple diagnostic tools including a fishbone diagram and a Pareto chart. Finally, change ideas were generated based on the earlier-described root causes and established change concepts. The next steps involve undertaking PDSA cycles to test change ideas and monitor for improvement.

References

1. Rex, D.K., Schoenfeld, P.S., Cohen, J. et al. Quality indicators for colonoscopy. Gastrointest Endosc. 2015;81:31-53.

2. Rex, D.K., Bond, J.H., Winawer, S. et al. Quality in the technical performance of colonoscopy and the continuous quality improvement process for colonoscopy: recommendations of the U.S. Multi-Society Task Force on Colorectal Cancer. Am J Gastroenterol. 2002;97:1296-308.

3. Corley, D., Jensen, C.D., Marks, A.R. et al. Adenoma detection rate and risk of colorectal cancer and death. N Engl J Med. 2014;370:1298-306.
4. Kotter, J.P. Leading change. Harvard Business Review Press, Boston; 2012

5. Taitz, J.M., Lee, T.H., and Sequist, T.D. A framework for engaging physicians in quality and safety. BMJ Qual Saf. 2012;21:722-8.

6. Carman, K.L., Dardess, P., Maurer, M. et al. Patient and family engagement: a framework for understanding the elements and developing interventions and policies. Health Aff (Millwood). 2013;33:223-31.

7.Ranji, S.R. and Shojania, S.G. Implementing patient safety interventions in your hospital: what to try and what to avoid. Med Clin North Am. 2008;92:275-93.

8. Antony, J. Six Sigma vs Lean: some perspectives from leading academics and practitioners. Int J Product Perform Manage. 2011;60:185-90.

9. Bercaw, R. Taking improvement from the assembly line to healthcare: the application of lean within the healthcare industry. Taylor and Francis, Boca Raton, FL; 2012

10. Langley, G.J., Nolan, K.M., Nolan, T.W. et al. The improvement guide: a practical approach to enhancing organizational performance. Jossey-Bass, San Francisco; 2009

11. Berwick, D.M. A primer on leading the improvement of systems. BMJ. 1996;312:619-22.

12. Corley, D.A., Jensen, C.D., and Marks, A.R. Can we improve adenoma detection rates? A systematic review of intervention studies. Gastrointest Endosc. 2011;74:656-65.

Publications
Publications
Topics
Article Type
Sections
Disallow All Ads