User login
What do you recommend for this patient with COPD?
“Janice Turner” (name changed to protect confidentiality) is a 66-year-old woman with a 40-pack per year history of smoking. She is very worried about having another COPD exacerbation and wants to know if there are additional medications she could try.
Over the past 2 weeks, her respiratory symptoms have improved and returned to her baseline. She has a daily cough with white phlegm on most days and dyspnea on exertion at one-half block on level ground. She reports using her medications as prescribed and is enrolled in a pulmonary rehabilitation program, which she attends twice per week. She uses 2 to 4 inhalations of albuterol each day.
She is on the following regimen for her COPD, which is unchanged compared with what she has been prescribed for the past 12 months: 1) combination inhaled fluticasone furoate, umeclidinium, and vilanterol via the Ellipta® device, one actuation once daily and 2) inhaled albuterol, two puffs as needed every 4 hours via metered dose inhaler. She demonstrates mastery of inhaler technique for both inhaled devices. Her vaccinations are current (pneumococcus, influenza, respiratory syncytial virus, and COVID-19).
On examination, she can complete sentences without respiratory difficulty, and her vital signs are normal. She has decreased breath sounds in all lung fields, with occasional rhonchi. Heart sounds are distant, but regular, at 92 beats per minute, and she has no peripheral edema. Arterial blood gas at rest on room air indicates a pH of 7.38, PaO2 of 63 mm Hg, and PaCO2 of 42 mm Hg. An electrocardiogram shows sinus rhythm and a QTc interval of 420 milliseconds.
Three months ago, when she was clinically stable, you obtained spirometry, a complete blood count with differential, and a chest radiograph to exclude alternate diagnoses for her ongoing respiratory symptoms. She had severe airflow limitation (post-bronchodilator FEV1 = 40% predicted, FVC = 61% predicted, FEV1/FVC = 65%). At the time, she also had peripheral eosinophilia (eosinophil count of 350 cells/μL) and hyperinflation without parenchymal infiltrates.
In summary, Ms. Turner has severe smoking-associated COPD Global Initiative for Chronic Obstructive Lung Disease (GOLD) stage 3E and chronic bronchitis with two severe exacerbations in the past 12 months.1 She is currently prescribed triple inhaled maintenance therapy with corticosteroids, long-acting β2-agonist, and long-acting muscarinic antagonist. She has a normal QTc interval.
So what would you recommend to reduce Ms. Turner’s risk of future exacerbations?
In 2011, the US Food and Drug Administration (FDA) approved roflumilast 500 mcg by mouth per day, a selective phosphodiesterase 4 (PDE4) inhibitor, as maintenance therapy to reduce the risk of COPD exacerbations in patients with severe COPD associated with chronic bronchitis.2 The FDA approval was based on a review of the efficacy and safety of roflumilast in eight randomized, double-blind, controlled clinical trials in 9,394 adults with COPD.
Two subsequently completed randomized clinical trials in 2015 (REACT, 1,945 adults) and 2016 (RE2SPOND, 2,354 adults) also found that maintenance oral treatment escalation with roflumilast significantly reduced the risk of COPD exacerbations compared with placebo.2 The most common adverse effects reported with long-term use of roflumilast are related to the gastrointestinal tract (diarrhea, nausea, decreased appetite), weight loss, and insomnia. Four weeks of roflumilast at 250 mcg per day prior to dose escalation to 500 mcg per day reduces the risk of treatment discontinuation and improves tolerability compared with initiating treatment with the maintenance dose.
In 2022, the FDA approved a generic version of roflumilast, providing an opportunity for patients to use roflumilast at a lower cost than was previously possible. Importantly, the FDA Prescribing Information includes a warning to avoid the use of roflumilast in patients being treated with strong cytochrome P450 enzyme inducers (eg, rifampin, phenytoin). The FDA Prescribing Information also recommends weighing the risks and benefits of roflumilast in patients with a history of depression or suicidal thoughts or behavior, or patients with unexplained or clinically significant weight loss.
In 2011 (the same year as the FDA approval of roflumilast), the National Institutes of Health/National Heart, Lung, and Blood Institute-funded COPD Clinical Research Network reported that maintenance treatment with azithromycin reduced the risk of COPD exacerbations compared with placebo in a randomized clinical trial of 1,142 adults with COPD (MACRO study).3 Subgroup analyses indicated that the reduction in the risk of COPD exacerbations with azithromycin was observed in participants with or without chronic bronchitis but not in participants who currently smoked.
Subsequently, two other smaller randomized clinical trials in 2014 (COLUMBUS, 92 participants) and in 2019 (BACE, 301 participants) also demonstrated a reduction in the risk of COPD exacerbations with maintenance azithromycin treatment compared with placebo. Azithromycin can prolong the QT interval and, in rare cases, cause cardiac arrythmias, especially when used with other medications that can prolong the QT interval. There are also concerns that maintenance azithromycin therapy could lead to decrements in hearing or promote the development of macrolide-resistant bacteria. Maintenance treatment with azithromycin to prevent COPD exacerbations is not an FDA-approved indication.4 The FDA approval for azithromycin is currently limited to treatment of patients with mild to moderate infections caused by susceptible bacteria, but it is often prescribed off-label as maintenance treatment for COPD.
On the basis of this body of evidence from clinical trials in COPD, the 2015 CHEST and Canadian Thoracic Society (CTS) guidelines,5 the 2017 European Respiratory Society/American Thoracic Society (ERS/ATS) guidelines,6 and the 2024 GOLD Strategy Report all include recommendations for treatment escalation with maintenance roflumilast or azithromycin to reduce the risk of COPD exacerbations. For example, the 2024 GOLD Strategy Report recommends roflumilast in patients with severe COPD and chronic bronchitis who continue to have exacerbations despite inhaled maintenance treatment with combination long-acting β2-agonist and long-acting muscarinic antagonist or with triple therapy with inhaled corticosteroids, long-acting β2-agonist, and long-acting muscarinic antagonist. An alternative, 2024 GOLD-recommended strategy in this population is maintenance therapy with azithromycin, “preferentially in former smokers.” GOLD’s preference for using azithromycin in patients with smoking history is based on post-hoc (ie, not part of the original study design) subgroup analyses “suggesting lesser benefit in active smokers” in the MACRO study. Results of such analyses have not been reported in other studies.
There are no results from clinical trials that have directly compared the harms and benefits of initiating maintenance therapy with roflumilast or azithromycin in patients with COPD. The roflumilast or azithromycin to prevent COPD exacerbations (RELIANCE; NCT04069312) multicenter clinical trial is addressing this evidence gap.7 The RELIANCE study is funded by the Patient-Centered Outcomes Research Institute and co-led by the COPD Foundation, a not-for-profit organization founded by John W. Walsh, a patient advocate with α1-related COPD. Also, results of two recently completed phase 3 clinical trials with nebulized ensifentrine (ENHANCE-1 and ENHANCE-2), a novel inhibitor of PDE3 and PDE4, were recently published. ENHANCE-1 and ENHANCE-2 studies indicate that twice daily nebulized ensifentrine reduces the risk of COPD exacerbations in patients with moderate or severe COPD.8 Ensifentrine is under review by the FDA, and a decision about its use in the US is expected in the summer of 2024.
Until the results from the RELIANCE clinical trial and the decision by the FDA about ensifentrine are available, we recommended a discussion with Ms. Turner about whether to initiate treatment with maintenance roflumilast or azithromycin. Both can reduce the risk of exacerbations, and the relative benefits and risks of these two evidence-based options are not yet known. Unless Ms. Turner has specific preferences (eg, concerns about specific adverse effects or differences in out-of-pocket cost) in favor of one over the other, she could flip a coin to decide between initiating maintenance roflumilast or azithromycin.
Dr. Krishnan is Professor of Medicine, Division of Pulmonary, Critical Care, Sleep & Allergy, and Professor of Public Health, Division of Epidemiology and Biostatistics, University of Illinois Chicago. Dr. Adrish is Associate Professor, Pulmonary, Critical Care and Sleep Medicine, Baylor College of Medicine, Houston.
References:
1. Global Initiative for Chronic Obstructive Lung Disease. Global strategy for the diagnosis, management, and prevention of chronic obstructive pulmonary disease: 2024 report. https://goldcopd.org/2024-gold-report-2/
2. US Food and Drug Administration (Daliresp®). https://www.accessdata.fda.gov/drugsatfda_docs/label/2013/022522s003lbl.pdf
3. Albert RK, Connett J, Bailey WC, et al; COPD Clinical Research Network. Azithromucin for prevention of exacerbations of COPD. N Engl J Med. 2011;365(8):689-98. PMID: 21864166. doi: 10.1056/NEJMoa1104623.
4. US Food and Drug Administration (Zithromyax®). https://www.accessdata.fda.gov/drugsatfda_docs/label/2013/050710s039,050711s036,050784s023lbl.pdf
5. Criner GJ, Bourbeau J, Diekemper RL, et al. Prevention of acure exacerbations of COPD: American College of Chest Physicians and Canadian Thoracic Society guideline. Chest. 2015;147(4)894-942. PMID: 25321320. doi: 10.1378/chest.14-1676.
6. Wedzicha JA, Calverley PMA, Albert RK, et al. Prevention of COPD exacerbations: a European Respiratory Society/American Thoracic Society guideline. Eur Respir J. 2017;50(3):1602265. PMID: 28889106. doi:10.1183/13993003.02265-2016.
7. Krishnan JA, Albert RK, Rennard SI; RELIANCE study. Waiting for actionable evidence: roflumilast or azithromycin? Chronic Obst Pulm Dis. 2022;9(1):1-3. PMID: 34783231. doi: 10.15326/jcopdf.2021.0272.
8. Anzueto A, Barjaktarevic IZ, Siler TM, et al. Ensifentrine, a novel phospodiesterase 3 and 4 inhibitor for the treatment of chronic obstructive pulmonary disease: randomized, double-blind, placebo-controlled, multicenter phase III trials (the ENHANCE trials). Am J Respir Crit Care Med. 2023;208(4):406-416. PMID: 37364283.
Dyspnea Assessment and Management Survey
Dyspnea, defined as a subjective experience of breathing discomfort,[1] is the seventh most frequent reason adult patients present to the emergency room and the most frequent cause for emergency room visits in patients 65 years or older.[2] Moreover, dyspnea is experienced by 49% of patients hospitalized with a medical condition[3, 4, 5] and by 70% of patients who are seriously ill.[6]
Based on evidence that patients are not treated consistently and effectively for relief of their shortness of breath, the American College of Chest Physicians (ACCP) statement on dyspnea management in patients with advanced lung or heart disease recommended that patients should be asked to rate their dyspnea, and the rating should be routinely documented in the medical record to guide management.[7] Although clinicians may question the utility of routine assessment of dyspnea using a standardized scale, studies have found that the prevalence of dyspnea reported from chart review is much lower than when patients are directly interviewed.[8] This may be the result of underrecognition of dyspnea or poor documentation by physicians, or that patients may not communicate their symptoms unless the physician specifically asks. As is the case with pain, routine assessment of dyspnea severity could lead to improved clinical management and greater patient‐centered care. However, unlike in the case of pain, regulatory bodies, such as the Joint Commission for Accreditation of Healthcare Organization, do not require routine dyspnea assessment.[9]
Currently, there are more than 40,000 hospitalists in the United States, and the vast majority of hospitals with >200 beds have a hospitalist group.[10] Hospitalists care for over 60% of inpatients[11] and play a major role in the management of patients with acute cardiopulmonary diseases. If standardized approaches for the assessment and documentation of dyspnea are to be implemented, hospitalists would be a key stakeholder group for utilizing enhanced clinical information about dyspnea. Therefore, we evaluated attitudes and practices of hospitalists in regard to the assessment and management of dyspnea, including the potential benefits and challenges related to the implementation of standardized assessment. We hypothesized that hospitalists would believe that a dyspnea scale for assessment of severity could improve their management of patients with cardiovascular diseases. Further, we hypothesized that physicians who agreed with the general statement that dyspnea is an important clinical problem would be more likely to believe that routine dyspnea assessment would be valuable.
METHODS
Study Sample
We invited 255 attending hospitalists from 9 geographically and structurally diverse hospitals to complete a survey about the assessment and management of dyspnea. The 9 hospitals represent range of practice environments including 4 academic medical centers, 2 community teaching and 3 nonteaching hospitals, 1 Veterans Administration hospital, and 2 staff‐model HMOs (see Supporting Table 1 in the online version of this article). The survey was distributed online using REDCap (Research Electronic Data Capture), a secure web‐based interface application.[12] A coinvestigator who was a pulmonary critical‐care physician at each site sent an initial email to their hospitalist groups that alerted them to expect a survey from the principal investigator. This notification was subsequently followed by an email invitation containing an informational cover letter and a link to the online survey. The cover letter stated that the completed surveys would not be stored at the local sites and that all the analyzed data would be deidentified. Nonrespondents were sent reminders at 2 and 4 weeks after the initial mailing. A $25 electronic gift card was provided as a gesture of appreciation for their time. The survey was conducted between September 2013 and December 2013.
The study was approved by the Baystate Health Institutional Review Board, Springfield, Massachusetts, with a waiver for written informed consent.
Questionnaire
We developed a 17‐item instrument based on a review of the dyspnea literature and a prior ACCP survey.[12] Questions were piloted with 4 hospitalists at a single institution and modified to improve face validity and clarity (see Supporting Information in the online version of this article for the full survey).
Hospitalists were asked to consider the care of patients admitted for acute cardiopulmonary disease, including heart failure, chronic obstructive pulmonary disease, and pneumonia. A series of 5‐point Likert scales were used to assess the respondents level of agreement with statements related to the following domains: the importance of dyspnea in clinical care, the potential benefits and challenges of routine dyspnea assessment (statements such as: Having a standardized assessment of dyspnea severity would be helpful in management of patients with cardiopulmonary diseases. Dyspnea assessment by a scale should be part of the vital signs for patients with cardiopulmonary diseases.), and management of dyspnea (questions regarding the use of opioids and other nonpharmacological therapies). Additional questions were asked about current assessment practices (questions such as: How often do you assess severity of dyspnea? What is your approach in assessing dyspnea? with options of choosing a categorical or numerical scale), if dyspnea is assessed in their institution by nurses and how often, and the influence of dyspnea severity assessment on their management. The survey had 1 question that solicited comments from the participants: If you don't think that it would be useful to have a standardized dyspnea assessment, please tell us why.
Data Analysis
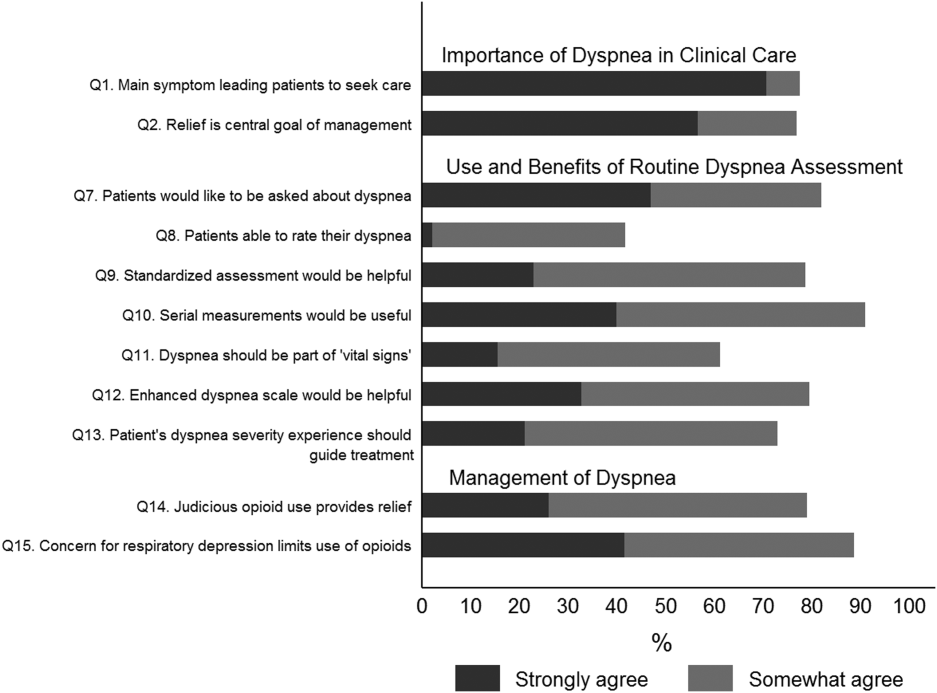
Responses to survey questions were summarized via counts and percentages in each response category. Adopting the methodology used in the ACCP consensus statement, strongly agree and somewhat agree were combined into a single category of agreement. We also presented percentage of responses in the 2 levels of agreement (strongly agree and somewhat agree) for each question in a bar graph.
Associations between tertiles of physicians' time in practice and attitude toward dyspnea were evaluated via 2 or Fisher exact test.
To examine how answers to the first 2 questions, which assessed attitude toward importance of dyspnea in clinical care, affect answers to the remaining questions, we grouped respondents in 3 categories (strongly agree, agree to these questions, do not agree) and tested the associations using 2 or Fisher exact test.
All analyses were performed using SAS version 9.3 (SAS institute, Inc., Cary, NC) and Stata release 13.1 (StataCorp, College Station, TX).
RESULTS
Overall, 178 (69.8%) of 255 identified hospitalists completed the survey, and all 9 participating hospitals had a response rate greater than 50%. The median number of years in practice was 6 (range, 038 years). A majority (77.5%) of respondents agreed with the statement that dyspnea is 1 of the major symptoms of patients with cardiopulmonary disease, and that its treatment is central to the management of these patients (77.0%) (Figure 1).
Attitude and Practices Surrounding Dyspnea Assessment
When asked about their current assessment of dyspnea, a majority (84.3%) of the hospitalists stated that they assess dyspnea on a daily basis; two‐thirds indicated that they use a categorical scale (ie, no shortness of breath, improved or worsened compared with a prior date), and one‐third indicated that they ask whether the patient is dyspneic or not. Fifty‐six percent of hospitalists stated that dyspnea is regularly assessed by nurses in their hospital.
The majority of respondents agreed (78.6%, 23.0% strongly and 55.6% somewhat agree) that standardized assessment of dyspnea severity, using a numeric scale and serial measurements as part of the vital signs, would benefit the management of patients with cardiopulmonary diseases. Furthermore, 79.6% (33.0% strongly and 46.6% somewhat agree) reported that using a dyspnea scale that included information to further characterize the patient‐reported experience, such as the level of distress associated with dyspnea, would be helpful in management.
Approximately 90% of the hospitalists indicated that awareness of dyspnea severity has an influence on clinical decision making, including whether to intensify treatment of underlying conditions, to pursue additional diagnostic testing, or to modify discharge timing. Additionally, two‐thirds of hospitalists agreed that awareness of dyspnea severity influences their decision to add opioids, whereas only one‐third prescribed nonpharmacologic symptom‐oriented treatment (Table 1).
| Frequency (%) | |
|---|---|
| |
| When caring for patients with acute cardiopulmonary diseases, how often do you assess severity of dyspnea?* | |
| At admission | 66 (37.1) |
| At discharge | 59 (33.2) |
| Daily until discharge | 150 (84.3) |
| More often than daily | 58 (32.6) |
| Which description best characterizes your approach to assessing dyspnea severity? | |
| I don't regularly ask about dyspnea severity | 3 (1.7) |
| I ask the patient whether or not they are having shortness of breath | 50 (28.3) |
| I ask the patient to rate the severity of shortness of breath using a numeric scale | 4 (2.3) |
| I ask the patient to rate the severity of shortness of breath using a categorical scale (eg, somewhat SOB, no SOB, improved or worsened compared with a prior date) | 120 (67.8) |
| When is dyspnea severity assessed and documented by nursing at your hospital?* | |
| Dyspnea is not routinely assessed | 60 (33.7) |
| At admission | 30 (16.9) |
| Daily | 43 (24.2) |
| Each shift | 64 (36.0) |
| Awareness of dyspnea severity affects my management by:* | |
| Influencing my decision to intensify treatment of the patient's underlying condition | 170 (95.5) |
| Influencing my decision to pursue additional diagnostic testing | 160 (89.9) |
| Influencing my decision to add pharmacologic‐based, symptom‐oriented treatment for dyspnea, such as opioids | 115 (64.6) |
| Influencing my decision to add nonpharmacologic‐based, symptom‐oriented treatment for dyspnea, such as fans or pursed lip breathing technique | 58 (32.6) |
| Influencing my decision regarding timing of discharge | 162 (91.0) |
| Which of the following nonpharmacologic therapies are effective for the relief of dyspnea?* | |
| Pursed lip breathing | 113 (63.5) |
| Relaxation techniques | 137 (77.0) |
| Noninvasive ventilation | 143 (80.3) |
| O2 for nonhypoxemic patients | 89 (50.0) |
| Cool air/fan | 125 (70.2) |
| Cognitive behavioral strategies | 101 (56.7) |
Forty‐two percent of the respondents agreed that patients are able to rate their dyspnea on a scale (2.3% strongly agree and 40.0% agree), and 73.0% indicated that patient experience of dyspnea should guide management independent of physiologic measures such as respiratory rate and oxygen saturation (Figure 1).
Several potential barriers were identified among the 18 participants who did not think that a standardized assessment of dyspnea would be beneficial, including concerns that (1) a dyspnea severity scale is too subjective and numerical scales are not useful for a subjective symptom (19.0%), (2) patients may overrate their symptom or will not be able to rate their dyspnea using a scale (31.0%), or (3) categorical description is sufficient (31.0%).
Practices in Dyspnea Management
Seventy‐nine percent of respondents agreed with the statement that judicious use of opioids can provide relief of dyspnea (26.1% strongly and 52.8% agreed), and 88.7% hospitalists identified the risk of respiratory depression as 1 of the barriers for the limited use of opioids. The majority of physicians (60%80%) considered nonpharmacologic therapies effective for symptomatic treatment of dyspnea, including in the order of agreement: noninvasive ventilation, relaxation techniques, cool air/fan, use of pursed lip breathing, and oxygen for nonhypoxemic patients (Table 1).
Physician Experience and Attitudes Toward Dyspnea Management
When we stratified hospitalists in tertiles of median years of time in practice (median [range]: 2 [04], 6 [58] and 15 [938]), we did not find an association with any of the responses to the questions.
Attitude Regarding the Importance of Dyspnea in Clinical Care and Responses to Subsequent Questions
Respondents who strongly agree or agree that dyspnea is the primary presenting symptom in patients with cardiovascular condition and that dyspnea relief is central to the management of these patients were more likely to believe that patients would like to be asked about their dyspnea (61.2% vs 30.2% vs 29.7%). They also had a more positive attitude about the usefulness of a standardized assessment of dyspnea and the inclusion of the assessment of dyspnea by a scale in the vital signs (Table 2).
| Description | Do Not Agree, n (%) | Somewhat Agree, n (%) | Strongly Agree, n (%) | P Value* |
|---|---|---|---|---|
| ||||
| 37 (20.9) | 43 (24.3) | 97 (54.8) | ||
| Which description best characterizes your approach to assessing dyspnea severity? | 0.552 | |||
| I don't regularly ask about dyspnea severity | 0 (0) | 0 (0) | 3 (3.1) | |
| I ask the patient whether or not they are having shortness of breath | 11 (29.7) | 14 (32.6) | 25 (25.8) | |
| I ask the patient to rate the severity of shortness of breath using a numeric scale | 2 (5.4) | 1 (2.3) | 1 (1.0) | |
| I ask the patient to rate the severity of shortness of breath using a categorical scale (e.g., somewhat shortness of breath, no shortness of breath, improved or worsened compared with a prior date) | 24 (64.9) | 28 (65.1) | 68 (70.1) | |
| Patients would like me to ask them about their dyspnea. | <0.0001 | |||
| Somewhat agree | 9 (24.3) | 21 (48.8) | 32 (32.7) | |
| Strongly agree | 11 (29.7) | 13 (30.2) | 60 (61.2) | |
| Patients are able to rate their own dyspnea intensity on a scale of 0‐10. | 0.432 | |||
| Somewhat agree | 12 (32.4) | 16 (37.2) | 42 (43.3) | |
| Strongly agree | 2 (5.4) | 0 (0) | 2 (2.1) | |
| Having a standardized assessment of dyspnea severity would be helpful to me in management of patients with cardiopulmonary diseases. | 0.026 | |||
| Somewhat agree | 17 (46.0) | 25 (58.1) | 57 (58.2) | |
| Strongly agree | 7 (18.9) | 6 (14.0) | 28 (28.6) | |
| Serial measurements of dyspnea would be useful for assessing response to therapy. | 0.042 | |||
| Somewhat agree | 14 (37.8) | 28 (65.1) | 48 (49.5) | |
| Strongly agree | 16 (43.2) | 12 (27.9) | 43 (44.3) | |
| Dyspnea assessment by a scale should be part of the vital signs for patients with cardiopulmonary diseases. | 0.042 | |||
| Somewhat agree | 13 (35.1) | 17 (39.5) | 51 (52.0) | |
| Strongly agree | 4 (10.8) | 5 (11.6) | 19 (19.4) | |
| Using an enhanced dyspnea scale that includes information about the following 4 features 1) Current dyspnea severity, 2) Worst dyspnea ever, 3) Improvement of dyspnea since admission, 4) Acceptability of current level of dyspnea, would be more helpful for my management than a single question focused on dyspnea severity. | 0.03 | |||
| Somewhat agree | 14 (40.0) | 24 (55.8) | 44 (44.9) | |
| Strongly agree | 9 (25.7) | 9 (20.9) | 40 (40.8) | |
| The patients experience of dyspnea should be used to guide treatment decisions independent of objective measures such as respiratory rate and oxygen saturation. | 0.10 | |||
| Somewhat agree | 20 (54.0) | 21 (48.8) | 51 (52.0) | |
| Strongly agree | 5 (13.5) | 6 (14.0) | 27 (27.6) | |
| Judicious use of oral and/or parenteral opioids can provide relief of dyspnea. | 0.21 | |||
| Somewhat agree | 20 (54.0) | 23 (54.8) | 50 (51.6) | |
| Strongly agree | 10 (27.0) | 6 (14.3) | 30 (30.9) | |
| Limited use of opioids for relief of dyspnea in patients with advanced cardiopulmonary disorders is often due to concerns of respiratory depression. | 0.71 | |||
| Somewhat agree | 17 (46.0) | 23 (54.8) | 43 (43.9) | |
| Strongly agree | 15 (40.5) | 14 (33.3) | 45 (45.9) | |
DISCUSSION
In this survey of 178 most hospitalists from a diverse group of 9 US hospitals, we found that most indicate that severity of dyspnea has a profound influence on their clinical practice (including their decision whether to intensify treatments such as diuretics or bronchodilators, to pursue additional diagnostic testing, add opioids or other nonpharmacological treatments) and ultimately their decision regarding the timing of hospital discharge. More importantly, whereas less than half reported experience with standardized assessment of dyspnea severity, most stated that such data would be very useful in their practice.
Despite being a highly prevalent symptom in diverse patient populations, several studies have shown that documentation of dyspnea is sporadic and evaluation of dyspnea quality of care is not routinely performed.[13, 14, 15] Statements from a number of professional societies, including the ACCP, the American Thoracic Society and the Canadian Respiratory Society, recommend that dyspnea management should rely on patient reporting, and that dyspnea severity should be recorded.[1, 4, 7] Assessment is an essential step to guide interventions; however, simply asking about the presence or absence of dyspnea is insufficient.
Several rating scales have been validated and might be implementable in the acute care setting, including the Numerical Rating Scale and the Visual Assessment Scale.[16, 17, 18, 19, 20] Our survey shows that standardized documentation of dyspnea severity in clinical practice is uncommon. However, most hospitalists in our study believed that assessment of dyspnea, using a standardized scale, would positively impact their management of patients with cardiopulmonary disease.
There are a number of potential benefits of routine assessment of dyspnea in hospitalized patients. Implementation of a standardized approach to dyspnea measurement would result in more uniform assessment and documentation practices, and in turn greater awareness among members of the patient‐care team. Though not sufficient to improve care, measurement is necessary because physicians do not always recognize the severity of patients' dyspnea or may not recognize its presence. A retrospective study that assessed the prevalence of symptoms in 410 ambulatory patients showed that one‐quarter of patients had dyspnea, but only half of them told their doctor about it.[21] Two other studies of patients with cancer diagnoses found that 30%70% of patients had dyspnea, but the symptom was recognized in only half of them; even when recognized, dyspnea severity was frequently underrated by physicians.[21, 22] Importantly, underestimation appears to correlate with underutilization of symptomatic management of dyspnea.[8]
Although the results of our survey are encouraging, they highlight a number of potential barriers and misconceptions among hospitalists. For example, although dyspnea can be characterized only by the person experiencing it, only 42% of our survey respondents believed that patients are able to rate their dyspnea intensity on a scale. Some of these responses may be influenced by the fact that dyspnea scales are not currently available to patients under their care. Another explanation is that similar to the case for pain, some hospitalists may believe that patients will exaggerate dyspnea severity. Almost one‐third of the respondents stated that objective measures, such as respiratory rate or oxygen saturation, are more important than a patient's experience of dyspnea in guiding the treatment, and that dyspnea is a subjective symptom and not a vital sign itself. Hospitalists who appreciated the importance of dyspnea in clinical practice were more likely to support the implementation of a standardized dyspnea scale for dyspnea assessment.
Although the potential benefits of including routine measurement of dyspnea in standard hospital practice may seem obvious, evidence that implementing routine assessment improves patient care or outcomes is lacking. Even if hospitalists see the value of dyspnea assessment, asking nurses to collect and document additional information would represent a substantial change in hospital workflow. Finally, without specific protocols to guide care, it is unclear whether physicians will be able to use new information about dyspnea severity effectively. Future studies need to evaluate the impact of implementing routine dyspnea assessment on the management of patients with cardiopulmonary diseases including the use of evidence‐based interventions and reducing the use of less valuable care.
Most hospitalists agreed with the basic principles of dyspnea treatment in patients with advanced cardiopulmonary disease after the primary disease had been stabilized. Effective measures are available, and several guidelines endorse opioids in dyspnea management.[1, 4, 7] However, many clinicians are uncomfortable with this approach for dyspnea, and opioids remain underused. In our study, almost 90% of physicians recognized that concerns about respiratory depression limits opioids use as a treatment. A qualitative study that explored the physicians' perspective toward opioids showed that most physicians were reluctant to prescribe opioids for refractory dyspnea, describing a lack of related knowledge and experience, and fears related to the potential adverse effects. The findings of our study also outline the need to better educate residents and hospitalists on the assessment and management of dyspnea, including prescribing opioids for refractory dyspnea.[23]
Study Strengths and Limitations
This study has several strengths. To our knowledge, it is the first to explore hospitalists' perspectives on incorporating dyspnea assessment in their clinical practice. Hospitalists are the attending physicians for a large majority of inpatients and would be the main users of a dyspnea severity scale. Our questionnaire survey included a large number of hospitalists, from 9 geographically and structurally diverse hospitals, which increased the generalizability of the findings to other hospitals around the country.
The study also has several limitations that need be kept in mind in interpreting the study results. First, desirability bias may have exaggerated some of the positive views expressed by hospitalists toward implementation of routine assessment of dyspnea. Second, because this was a survey, the estimates of dyspnea assessment and documentation practices of both physicians and nurses were based on the respondents' perception and not an objective review of medical records, and the results may be different from actual practice. Third, this was not a population‐based random sample of hospitalists, and it may not be entirely representative; however, those surveyed were from a diverse set of sites with different geographical location, size, academic affiliation, and practice environment, and their time in practice varied widely. Last, we do not have information on nonrespondents, and there is a possibility of nonresponse bias, although the high response rate lessens the risk.
CONCLUSIONS
The results of this survey suggest that most hospitalists believe that routine assessment of dyspnea severity would enhance their clinical decision making and improve patient care. Standardized assessment of dyspnea might result in better awareness of this symptom among providers, reduce undertreatment and mistreatment, and ultimately result in better outcomes for patients. However, implementation of the routine assessment of dyspnea would change current clinical practices and may have a significant effect on existing nursing and physician workflows. Additional research is needed to determine the feasibility and impact on outcomes of routine dyspnea assessment.
Acknowledgements
The authors wish to acknowledge Ms. Anu Joshi for her help with editing the manuscript and assisting with table preparations.
Disclosures
Dr. Stefan is supported by grant K01HL114631‐01A1 from the National Heart, Lung, and Blood Institute of the National Institutes of Health, and by the National Center for Research Resources and the National Center for Advancing Translational Sciences, National Institutes of Health, through grant UL1RR025752. The funder had no role in the design and conduct of the study; collection, management, analysis, and interpretation of the data; preparation, review, or approval of the manuscript; and decision to submit the manuscript for publication. M.S.S. and P.K.L. conceived of the study. M.S.S. acquired the data with the help of all collaborators. M.S.S., P.K.L., P.S.P., and A.P. analyzed and interpreted the data. M.S.S. drafted the manuscript. All authors critically reviewed the manuscript for intellectual content. M.S.S., P.K.L., and A.P. had full access to all of the data in the study and take responsibility for the integrity of the data and the accuracy of the data analysis. M.S.S. is the guarantor for this article, and is responsible for the content of the article, including data and analysis. The authors report no conflicts of interest.
- , , , et al. An Official American Thoracic Society Statement: Update on the Mechanisms, Assessment, and Management of Dyspnea. Am J Respir Crit Care Med. 2012;185(4):435–452.
- CDC/ National Center for Health Statistics. National Hospital Amulatory Medical Care Survey: 2011 Emergency Department Summary Tables. http://www.cdc.gov/nchs/data/ahcd/nhamcs_emergency/2011_ed_web_tables.pdf. Accessed May 15, 2015.
- , , , . Signs and symptoms of heart failure: are you asking the right questions? Am J Crit Care. 2010;19(5):443–452.
- , , , et al. Managing dyspnea in patients with advanced chronic obstructive pulmonary disease: a Canadian Thoracic Society clinical practice guideline. Can Respir J. 2011;18(2):69–78.
- , . Prevalence of distressing symptoms in hospitalised patients on medical wards: A cross‐sectional study. BMC Palliat Care. 2008;7:16.
- , . Dyspnea in terminally ill cancer patients. Chest. 1986;89(2):234–236.
- , , , et al. American College of Chest Physicians consensus statement on the management of dyspnea in patients with advanced lung or heart disease. Chest. 2010;137(3):674–691.
- , . Common symptoms in ambulatory care: incidence, evaluation, therapy, and outcome. Am J Med. 1989;86(3):262–266.
- The Joint Commission. Facts about Pain Management. http://www.jointcommission.org/pain_management/. Accessed May, 15, 2015.
- . Hospitalist programs in the age of healthcare reform. J Healthc Manag. 2010;55(6):378–380.
- , , , . The Use of Hospitalists by Small Rural Hospitals: Results of a National Survey. Med Care Res Rev. 2014;71(4):356–366.
- Tufts CTSI. REDCap [Internet]. Tufts Clinical and Translational Science Institute. http://www.tuftsctsi.org/Services-and-Consultation/REDCap.aspx. Accessed May, 15, 2015.
- , . Multi‐dimensional Assessment of Dyspnea. Dyspnoea in Advanced Disease: A guide to clinical management; 2005.
- , , , et al. Cancer care quality measures: symptoms and end‐of‐life care. Evid Rep Technol Assess (Full Rep). 2006(137):1–77.
- . Defining and measuring quality palliative and end‐of‐life care in the intensive care unit. Crit Care Med. 2006;34(11 Suppl):S309–316.
- . Validation of a vertical visual analogue scale as a measure of clinical dyspnea. Rehabil Nurs. 1989;14(6):323–325.
- . Can a self‐rating 0‐10 scale for dyspnea yield a common language that is understood by ED nurses, patients, and their families? J Emerg Nurs. 2000;26(3):233–234.
- , , . Measurement of dyspnea: word labeled visual analog scale vs. verbal ordinal scale. Respir Physiol Neurobiol. 2003;134(2):77–83.
- , , , , , . Verbal numerical scales are as reliable and sensitive as visual analog scales for rating dyspnea in young and older subjects. Respir Physiol Neurobiol. 2007;157(2‐3):360–365.
- , , , , . Validation of a three‐factor measurement model of dyspnea in hospitalized adults with heart failure. Heart Lung. 2011;41(1):44–56.
- , , . Patient reporting and doctor recognition of dyspnoea in a comprehensive cancer centre. Intern Med J. 2006;36(6):381–384.
- , , , . Lung cancer and dyspnea: the patient's perception. Oncol Nurs Forum. 1986;13(5):19–24.
- , , , . Opioids, respiratory function, and dyspnea. Am J Hosp Palliat Care. 2003;20(1):57–61.
Dyspnea, defined as a subjective experience of breathing discomfort,[1] is the seventh most frequent reason adult patients present to the emergency room and the most frequent cause for emergency room visits in patients 65 years or older.[2] Moreover, dyspnea is experienced by 49% of patients hospitalized with a medical condition[3, 4, 5] and by 70% of patients who are seriously ill.[6]
Based on evidence that patients are not treated consistently and effectively for relief of their shortness of breath, the American College of Chest Physicians (ACCP) statement on dyspnea management in patients with advanced lung or heart disease recommended that patients should be asked to rate their dyspnea, and the rating should be routinely documented in the medical record to guide management.[7] Although clinicians may question the utility of routine assessment of dyspnea using a standardized scale, studies have found that the prevalence of dyspnea reported from chart review is much lower than when patients are directly interviewed.[8] This may be the result of underrecognition of dyspnea or poor documentation by physicians, or that patients may not communicate their symptoms unless the physician specifically asks. As is the case with pain, routine assessment of dyspnea severity could lead to improved clinical management and greater patient‐centered care. However, unlike in the case of pain, regulatory bodies, such as the Joint Commission for Accreditation of Healthcare Organization, do not require routine dyspnea assessment.[9]
Currently, there are more than 40,000 hospitalists in the United States, and the vast majority of hospitals with >200 beds have a hospitalist group.[10] Hospitalists care for over 60% of inpatients[11] and play a major role in the management of patients with acute cardiopulmonary diseases. If standardized approaches for the assessment and documentation of dyspnea are to be implemented, hospitalists would be a key stakeholder group for utilizing enhanced clinical information about dyspnea. Therefore, we evaluated attitudes and practices of hospitalists in regard to the assessment and management of dyspnea, including the potential benefits and challenges related to the implementation of standardized assessment. We hypothesized that hospitalists would believe that a dyspnea scale for assessment of severity could improve their management of patients with cardiovascular diseases. Further, we hypothesized that physicians who agreed with the general statement that dyspnea is an important clinical problem would be more likely to believe that routine dyspnea assessment would be valuable.
METHODS
Study Sample
We invited 255 attending hospitalists from 9 geographically and structurally diverse hospitals to complete a survey about the assessment and management of dyspnea. The 9 hospitals represent range of practice environments including 4 academic medical centers, 2 community teaching and 3 nonteaching hospitals, 1 Veterans Administration hospital, and 2 staff‐model HMOs (see Supporting Table 1 in the online version of this article). The survey was distributed online using REDCap (Research Electronic Data Capture), a secure web‐based interface application.[12] A coinvestigator who was a pulmonary critical‐care physician at each site sent an initial email to their hospitalist groups that alerted them to expect a survey from the principal investigator. This notification was subsequently followed by an email invitation containing an informational cover letter and a link to the online survey. The cover letter stated that the completed surveys would not be stored at the local sites and that all the analyzed data would be deidentified. Nonrespondents were sent reminders at 2 and 4 weeks after the initial mailing. A $25 electronic gift card was provided as a gesture of appreciation for their time. The survey was conducted between September 2013 and December 2013.
The study was approved by the Baystate Health Institutional Review Board, Springfield, Massachusetts, with a waiver for written informed consent.
Questionnaire
We developed a 17‐item instrument based on a review of the dyspnea literature and a prior ACCP survey.[12] Questions were piloted with 4 hospitalists at a single institution and modified to improve face validity and clarity (see Supporting Information in the online version of this article for the full survey).
Hospitalists were asked to consider the care of patients admitted for acute cardiopulmonary disease, including heart failure, chronic obstructive pulmonary disease, and pneumonia. A series of 5‐point Likert scales were used to assess the respondents level of agreement with statements related to the following domains: the importance of dyspnea in clinical care, the potential benefits and challenges of routine dyspnea assessment (statements such as: Having a standardized assessment of dyspnea severity would be helpful in management of patients with cardiopulmonary diseases. Dyspnea assessment by a scale should be part of the vital signs for patients with cardiopulmonary diseases.), and management of dyspnea (questions regarding the use of opioids and other nonpharmacological therapies). Additional questions were asked about current assessment practices (questions such as: How often do you assess severity of dyspnea? What is your approach in assessing dyspnea? with options of choosing a categorical or numerical scale), if dyspnea is assessed in their institution by nurses and how often, and the influence of dyspnea severity assessment on their management. The survey had 1 question that solicited comments from the participants: If you don't think that it would be useful to have a standardized dyspnea assessment, please tell us why.
Data Analysis
Responses to survey questions were summarized via counts and percentages in each response category. Adopting the methodology used in the ACCP consensus statement, strongly agree and somewhat agree were combined into a single category of agreement. We also presented percentage of responses in the 2 levels of agreement (strongly agree and somewhat agree) for each question in a bar graph.
Associations between tertiles of physicians' time in practice and attitude toward dyspnea were evaluated via 2 or Fisher exact test.
To examine how answers to the first 2 questions, which assessed attitude toward importance of dyspnea in clinical care, affect answers to the remaining questions, we grouped respondents in 3 categories (strongly agree, agree to these questions, do not agree) and tested the associations using 2 or Fisher exact test.
All analyses were performed using SAS version 9.3 (SAS institute, Inc., Cary, NC) and Stata release 13.1 (StataCorp, College Station, TX).
RESULTS
Overall, 178 (69.8%) of 255 identified hospitalists completed the survey, and all 9 participating hospitals had a response rate greater than 50%. The median number of years in practice was 6 (range, 038 years). A majority (77.5%) of respondents agreed with the statement that dyspnea is 1 of the major symptoms of patients with cardiopulmonary disease, and that its treatment is central to the management of these patients (77.0%) (Figure 1).
Attitude and Practices Surrounding Dyspnea Assessment
When asked about their current assessment of dyspnea, a majority (84.3%) of the hospitalists stated that they assess dyspnea on a daily basis; two‐thirds indicated that they use a categorical scale (ie, no shortness of breath, improved or worsened compared with a prior date), and one‐third indicated that they ask whether the patient is dyspneic or not. Fifty‐six percent of hospitalists stated that dyspnea is regularly assessed by nurses in their hospital.
The majority of respondents agreed (78.6%, 23.0% strongly and 55.6% somewhat agree) that standardized assessment of dyspnea severity, using a numeric scale and serial measurements as part of the vital signs, would benefit the management of patients with cardiopulmonary diseases. Furthermore, 79.6% (33.0% strongly and 46.6% somewhat agree) reported that using a dyspnea scale that included information to further characterize the patient‐reported experience, such as the level of distress associated with dyspnea, would be helpful in management.
Approximately 90% of the hospitalists indicated that awareness of dyspnea severity has an influence on clinical decision making, including whether to intensify treatment of underlying conditions, to pursue additional diagnostic testing, or to modify discharge timing. Additionally, two‐thirds of hospitalists agreed that awareness of dyspnea severity influences their decision to add opioids, whereas only one‐third prescribed nonpharmacologic symptom‐oriented treatment (Table 1).
| Frequency (%) | |
|---|---|
| |
| When caring for patients with acute cardiopulmonary diseases, how often do you assess severity of dyspnea?* | |
| At admission | 66 (37.1) |
| At discharge | 59 (33.2) |
| Daily until discharge | 150 (84.3) |
| More often than daily | 58 (32.6) |
| Which description best characterizes your approach to assessing dyspnea severity? | |
| I don't regularly ask about dyspnea severity | 3 (1.7) |
| I ask the patient whether or not they are having shortness of breath | 50 (28.3) |
| I ask the patient to rate the severity of shortness of breath using a numeric scale | 4 (2.3) |
| I ask the patient to rate the severity of shortness of breath using a categorical scale (eg, somewhat SOB, no SOB, improved or worsened compared with a prior date) | 120 (67.8) |
| When is dyspnea severity assessed and documented by nursing at your hospital?* | |
| Dyspnea is not routinely assessed | 60 (33.7) |
| At admission | 30 (16.9) |
| Daily | 43 (24.2) |
| Each shift | 64 (36.0) |
| Awareness of dyspnea severity affects my management by:* | |
| Influencing my decision to intensify treatment of the patient's underlying condition | 170 (95.5) |
| Influencing my decision to pursue additional diagnostic testing | 160 (89.9) |
| Influencing my decision to add pharmacologic‐based, symptom‐oriented treatment for dyspnea, such as opioids | 115 (64.6) |
| Influencing my decision to add nonpharmacologic‐based, symptom‐oriented treatment for dyspnea, such as fans or pursed lip breathing technique | 58 (32.6) |
| Influencing my decision regarding timing of discharge | 162 (91.0) |
| Which of the following nonpharmacologic therapies are effective for the relief of dyspnea?* | |
| Pursed lip breathing | 113 (63.5) |
| Relaxation techniques | 137 (77.0) |
| Noninvasive ventilation | 143 (80.3) |
| O2 for nonhypoxemic patients | 89 (50.0) |
| Cool air/fan | 125 (70.2) |
| Cognitive behavioral strategies | 101 (56.7) |
Forty‐two percent of the respondents agreed that patients are able to rate their dyspnea on a scale (2.3% strongly agree and 40.0% agree), and 73.0% indicated that patient experience of dyspnea should guide management independent of physiologic measures such as respiratory rate and oxygen saturation (Figure 1).
Several potential barriers were identified among the 18 participants who did not think that a standardized assessment of dyspnea would be beneficial, including concerns that (1) a dyspnea severity scale is too subjective and numerical scales are not useful for a subjective symptom (19.0%), (2) patients may overrate their symptom or will not be able to rate their dyspnea using a scale (31.0%), or (3) categorical description is sufficient (31.0%).
Practices in Dyspnea Management
Seventy‐nine percent of respondents agreed with the statement that judicious use of opioids can provide relief of dyspnea (26.1% strongly and 52.8% agreed), and 88.7% hospitalists identified the risk of respiratory depression as 1 of the barriers for the limited use of opioids. The majority of physicians (60%80%) considered nonpharmacologic therapies effective for symptomatic treatment of dyspnea, including in the order of agreement: noninvasive ventilation, relaxation techniques, cool air/fan, use of pursed lip breathing, and oxygen for nonhypoxemic patients (Table 1).
Physician Experience and Attitudes Toward Dyspnea Management
When we stratified hospitalists in tertiles of median years of time in practice (median [range]: 2 [04], 6 [58] and 15 [938]), we did not find an association with any of the responses to the questions.
Attitude Regarding the Importance of Dyspnea in Clinical Care and Responses to Subsequent Questions
Respondents who strongly agree or agree that dyspnea is the primary presenting symptom in patients with cardiovascular condition and that dyspnea relief is central to the management of these patients were more likely to believe that patients would like to be asked about their dyspnea (61.2% vs 30.2% vs 29.7%). They also had a more positive attitude about the usefulness of a standardized assessment of dyspnea and the inclusion of the assessment of dyspnea by a scale in the vital signs (Table 2).
| Description | Do Not Agree, n (%) | Somewhat Agree, n (%) | Strongly Agree, n (%) | P Value* |
|---|---|---|---|---|
| ||||
| 37 (20.9) | 43 (24.3) | 97 (54.8) | ||
| Which description best characterizes your approach to assessing dyspnea severity? | 0.552 | |||
| I don't regularly ask about dyspnea severity | 0 (0) | 0 (0) | 3 (3.1) | |
| I ask the patient whether or not they are having shortness of breath | 11 (29.7) | 14 (32.6) | 25 (25.8) | |
| I ask the patient to rate the severity of shortness of breath using a numeric scale | 2 (5.4) | 1 (2.3) | 1 (1.0) | |
| I ask the patient to rate the severity of shortness of breath using a categorical scale (e.g., somewhat shortness of breath, no shortness of breath, improved or worsened compared with a prior date) | 24 (64.9) | 28 (65.1) | 68 (70.1) | |
| Patients would like me to ask them about their dyspnea. | <0.0001 | |||
| Somewhat agree | 9 (24.3) | 21 (48.8) | 32 (32.7) | |
| Strongly agree | 11 (29.7) | 13 (30.2) | 60 (61.2) | |
| Patients are able to rate their own dyspnea intensity on a scale of 0‐10. | 0.432 | |||
| Somewhat agree | 12 (32.4) | 16 (37.2) | 42 (43.3) | |
| Strongly agree | 2 (5.4) | 0 (0) | 2 (2.1) | |
| Having a standardized assessment of dyspnea severity would be helpful to me in management of patients with cardiopulmonary diseases. | 0.026 | |||
| Somewhat agree | 17 (46.0) | 25 (58.1) | 57 (58.2) | |
| Strongly agree | 7 (18.9) | 6 (14.0) | 28 (28.6) | |
| Serial measurements of dyspnea would be useful for assessing response to therapy. | 0.042 | |||
| Somewhat agree | 14 (37.8) | 28 (65.1) | 48 (49.5) | |
| Strongly agree | 16 (43.2) | 12 (27.9) | 43 (44.3) | |
| Dyspnea assessment by a scale should be part of the vital signs for patients with cardiopulmonary diseases. | 0.042 | |||
| Somewhat agree | 13 (35.1) | 17 (39.5) | 51 (52.0) | |
| Strongly agree | 4 (10.8) | 5 (11.6) | 19 (19.4) | |
| Using an enhanced dyspnea scale that includes information about the following 4 features 1) Current dyspnea severity, 2) Worst dyspnea ever, 3) Improvement of dyspnea since admission, 4) Acceptability of current level of dyspnea, would be more helpful for my management than a single question focused on dyspnea severity. | 0.03 | |||
| Somewhat agree | 14 (40.0) | 24 (55.8) | 44 (44.9) | |
| Strongly agree | 9 (25.7) | 9 (20.9) | 40 (40.8) | |
| The patients experience of dyspnea should be used to guide treatment decisions independent of objective measures such as respiratory rate and oxygen saturation. | 0.10 | |||
| Somewhat agree | 20 (54.0) | 21 (48.8) | 51 (52.0) | |
| Strongly agree | 5 (13.5) | 6 (14.0) | 27 (27.6) | |
| Judicious use of oral and/or parenteral opioids can provide relief of dyspnea. | 0.21 | |||
| Somewhat agree | 20 (54.0) | 23 (54.8) | 50 (51.6) | |
| Strongly agree | 10 (27.0) | 6 (14.3) | 30 (30.9) | |
| Limited use of opioids for relief of dyspnea in patients with advanced cardiopulmonary disorders is often due to concerns of respiratory depression. | 0.71 | |||
| Somewhat agree | 17 (46.0) | 23 (54.8) | 43 (43.9) | |
| Strongly agree | 15 (40.5) | 14 (33.3) | 45 (45.9) | |
DISCUSSION
In this survey of 178 most hospitalists from a diverse group of 9 US hospitals, we found that most indicate that severity of dyspnea has a profound influence on their clinical practice (including their decision whether to intensify treatments such as diuretics or bronchodilators, to pursue additional diagnostic testing, add opioids or other nonpharmacological treatments) and ultimately their decision regarding the timing of hospital discharge. More importantly, whereas less than half reported experience with standardized assessment of dyspnea severity, most stated that such data would be very useful in their practice.
Despite being a highly prevalent symptom in diverse patient populations, several studies have shown that documentation of dyspnea is sporadic and evaluation of dyspnea quality of care is not routinely performed.[13, 14, 15] Statements from a number of professional societies, including the ACCP, the American Thoracic Society and the Canadian Respiratory Society, recommend that dyspnea management should rely on patient reporting, and that dyspnea severity should be recorded.[1, 4, 7] Assessment is an essential step to guide interventions; however, simply asking about the presence or absence of dyspnea is insufficient.
Several rating scales have been validated and might be implementable in the acute care setting, including the Numerical Rating Scale and the Visual Assessment Scale.[16, 17, 18, 19, 20] Our survey shows that standardized documentation of dyspnea severity in clinical practice is uncommon. However, most hospitalists in our study believed that assessment of dyspnea, using a standardized scale, would positively impact their management of patients with cardiopulmonary disease.
There are a number of potential benefits of routine assessment of dyspnea in hospitalized patients. Implementation of a standardized approach to dyspnea measurement would result in more uniform assessment and documentation practices, and in turn greater awareness among members of the patient‐care team. Though not sufficient to improve care, measurement is necessary because physicians do not always recognize the severity of patients' dyspnea or may not recognize its presence. A retrospective study that assessed the prevalence of symptoms in 410 ambulatory patients showed that one‐quarter of patients had dyspnea, but only half of them told their doctor about it.[21] Two other studies of patients with cancer diagnoses found that 30%70% of patients had dyspnea, but the symptom was recognized in only half of them; even when recognized, dyspnea severity was frequently underrated by physicians.[21, 22] Importantly, underestimation appears to correlate with underutilization of symptomatic management of dyspnea.[8]
Although the results of our survey are encouraging, they highlight a number of potential barriers and misconceptions among hospitalists. For example, although dyspnea can be characterized only by the person experiencing it, only 42% of our survey respondents believed that patients are able to rate their dyspnea intensity on a scale. Some of these responses may be influenced by the fact that dyspnea scales are not currently available to patients under their care. Another explanation is that similar to the case for pain, some hospitalists may believe that patients will exaggerate dyspnea severity. Almost one‐third of the respondents stated that objective measures, such as respiratory rate or oxygen saturation, are more important than a patient's experience of dyspnea in guiding the treatment, and that dyspnea is a subjective symptom and not a vital sign itself. Hospitalists who appreciated the importance of dyspnea in clinical practice were more likely to support the implementation of a standardized dyspnea scale for dyspnea assessment.
Although the potential benefits of including routine measurement of dyspnea in standard hospital practice may seem obvious, evidence that implementing routine assessment improves patient care or outcomes is lacking. Even if hospitalists see the value of dyspnea assessment, asking nurses to collect and document additional information would represent a substantial change in hospital workflow. Finally, without specific protocols to guide care, it is unclear whether physicians will be able to use new information about dyspnea severity effectively. Future studies need to evaluate the impact of implementing routine dyspnea assessment on the management of patients with cardiopulmonary diseases including the use of evidence‐based interventions and reducing the use of less valuable care.
Most hospitalists agreed with the basic principles of dyspnea treatment in patients with advanced cardiopulmonary disease after the primary disease had been stabilized. Effective measures are available, and several guidelines endorse opioids in dyspnea management.[1, 4, 7] However, many clinicians are uncomfortable with this approach for dyspnea, and opioids remain underused. In our study, almost 90% of physicians recognized that concerns about respiratory depression limits opioids use as a treatment. A qualitative study that explored the physicians' perspective toward opioids showed that most physicians were reluctant to prescribe opioids for refractory dyspnea, describing a lack of related knowledge and experience, and fears related to the potential adverse effects. The findings of our study also outline the need to better educate residents and hospitalists on the assessment and management of dyspnea, including prescribing opioids for refractory dyspnea.[23]
Study Strengths and Limitations
This study has several strengths. To our knowledge, it is the first to explore hospitalists' perspectives on incorporating dyspnea assessment in their clinical practice. Hospitalists are the attending physicians for a large majority of inpatients and would be the main users of a dyspnea severity scale. Our questionnaire survey included a large number of hospitalists, from 9 geographically and structurally diverse hospitals, which increased the generalizability of the findings to other hospitals around the country.
The study also has several limitations that need be kept in mind in interpreting the study results. First, desirability bias may have exaggerated some of the positive views expressed by hospitalists toward implementation of routine assessment of dyspnea. Second, because this was a survey, the estimates of dyspnea assessment and documentation practices of both physicians and nurses were based on the respondents' perception and not an objective review of medical records, and the results may be different from actual practice. Third, this was not a population‐based random sample of hospitalists, and it may not be entirely representative; however, those surveyed were from a diverse set of sites with different geographical location, size, academic affiliation, and practice environment, and their time in practice varied widely. Last, we do not have information on nonrespondents, and there is a possibility of nonresponse bias, although the high response rate lessens the risk.
CONCLUSIONS
The results of this survey suggest that most hospitalists believe that routine assessment of dyspnea severity would enhance their clinical decision making and improve patient care. Standardized assessment of dyspnea might result in better awareness of this symptom among providers, reduce undertreatment and mistreatment, and ultimately result in better outcomes for patients. However, implementation of the routine assessment of dyspnea would change current clinical practices and may have a significant effect on existing nursing and physician workflows. Additional research is needed to determine the feasibility and impact on outcomes of routine dyspnea assessment.
Acknowledgements
The authors wish to acknowledge Ms. Anu Joshi for her help with editing the manuscript and assisting with table preparations.
Disclosures
Dr. Stefan is supported by grant K01HL114631‐01A1 from the National Heart, Lung, and Blood Institute of the National Institutes of Health, and by the National Center for Research Resources and the National Center for Advancing Translational Sciences, National Institutes of Health, through grant UL1RR025752. The funder had no role in the design and conduct of the study; collection, management, analysis, and interpretation of the data; preparation, review, or approval of the manuscript; and decision to submit the manuscript for publication. M.S.S. and P.K.L. conceived of the study. M.S.S. acquired the data with the help of all collaborators. M.S.S., P.K.L., P.S.P., and A.P. analyzed and interpreted the data. M.S.S. drafted the manuscript. All authors critically reviewed the manuscript for intellectual content. M.S.S., P.K.L., and A.P. had full access to all of the data in the study and take responsibility for the integrity of the data and the accuracy of the data analysis. M.S.S. is the guarantor for this article, and is responsible for the content of the article, including data and analysis. The authors report no conflicts of interest.
- , , , et al. An Official American Thoracic Society Statement: Update on the Mechanisms, Assessment, and Management of Dyspnea. Am J Respir Crit Care Med. 2012;185(4):435–452.
- CDC/ National Center for Health Statistics. National Hospital Amulatory Medical Care Survey: 2011 Emergency Department Summary Tables. http://www.cdc.gov/nchs/data/ahcd/nhamcs_emergency/2011_ed_web_tables.pdf. Accessed May 15, 2015.
- , , , . Signs and symptoms of heart failure: are you asking the right questions? Am J Crit Care. 2010;19(5):443–452.
- , , , et al. Managing dyspnea in patients with advanced chronic obstructive pulmonary disease: a Canadian Thoracic Society clinical practice guideline. Can Respir J. 2011;18(2):69–78.
- , . Prevalence of distressing symptoms in hospitalised patients on medical wards: A cross‐sectional study. BMC Palliat Care. 2008;7:16.
- , . Dyspnea in terminally ill cancer patients. Chest. 1986;89(2):234–236.
- , , , et al. American College of Chest Physicians consensus statement on the management of dyspnea in patients with advanced lung or heart disease. Chest. 2010;137(3):674–691.
- , . Common symptoms in ambulatory care: incidence, evaluation, therapy, and outcome. Am J Med. 1989;86(3):262–266.
- The Joint Commission. Facts about Pain Management. http://www.jointcommission.org/pain_management/. Accessed May, 15, 2015.
- . Hospitalist programs in the age of healthcare reform. J Healthc Manag. 2010;55(6):378–380.
- , , , . The Use of Hospitalists by Small Rural Hospitals: Results of a National Survey. Med Care Res Rev. 2014;71(4):356–366.
- Tufts CTSI. REDCap [Internet]. Tufts Clinical and Translational Science Institute. http://www.tuftsctsi.org/Services-and-Consultation/REDCap.aspx. Accessed May, 15, 2015.
- , . Multi‐dimensional Assessment of Dyspnea. Dyspnoea in Advanced Disease: A guide to clinical management; 2005.
- , , , et al. Cancer care quality measures: symptoms and end‐of‐life care. Evid Rep Technol Assess (Full Rep). 2006(137):1–77.
- . Defining and measuring quality palliative and end‐of‐life care in the intensive care unit. Crit Care Med. 2006;34(11 Suppl):S309–316.
- . Validation of a vertical visual analogue scale as a measure of clinical dyspnea. Rehabil Nurs. 1989;14(6):323–325.
- . Can a self‐rating 0‐10 scale for dyspnea yield a common language that is understood by ED nurses, patients, and their families? J Emerg Nurs. 2000;26(3):233–234.
- , , . Measurement of dyspnea: word labeled visual analog scale vs. verbal ordinal scale. Respir Physiol Neurobiol. 2003;134(2):77–83.
- , , , , , . Verbal numerical scales are as reliable and sensitive as visual analog scales for rating dyspnea in young and older subjects. Respir Physiol Neurobiol. 2007;157(2‐3):360–365.
- , , , , . Validation of a three‐factor measurement model of dyspnea in hospitalized adults with heart failure. Heart Lung. 2011;41(1):44–56.
- , , . Patient reporting and doctor recognition of dyspnoea in a comprehensive cancer centre. Intern Med J. 2006;36(6):381–384.
- , , , . Lung cancer and dyspnea: the patient's perception. Oncol Nurs Forum. 1986;13(5):19–24.
- , , , . Opioids, respiratory function, and dyspnea. Am J Hosp Palliat Care. 2003;20(1):57–61.
© 2015 Society of Hospital Medicine

Hospital Mortality Measure for COPD
Chronic obstructive pulmonary disease (COPD) affects as many as 24 million individuals in the United States, is responsible for more than 700,000 annual hospital admissions, and is currently the nation's third leading cause of death, accounting for nearly $49.9 billion in medical spending in 2010.[1, 2] Reported in‐hospital mortality rates for patients hospitalized for exacerbations of COPD range from 2% to 5%.[3, 4, 5, 6, 7] Information about 30‐day mortality rates following hospitalization for COPD is more limited; however, international studies suggest that rates range from 3% to 9%,[8, 9] and 90‐day mortality rates exceed 15%.[10]
Despite this significant clinical and economic impact, there have been no large‐scale, sustained efforts to measure the quality or outcomes of hospital care for patients with COPD in the United States. What little is known about the treatment of patients with COPD suggests widespread opportunities to increase adherence to guideline‐recommended therapies, to reduce the use of ineffective treatments and tests, and to address variation in care across institutions.[5, 11, 12]
Public reporting of hospital performance is a key strategy for improving the quality and safety of hospital care, both in the United States and internationally.[13] Since 2007, the Centers for Medicare and Medicaid Services (CMS) has reported hospital mortality rates on the Hospital Compare Web site, and COPD is 1 of the conditions highlighted in the Affordable Care Act for future consideration.[14] Such initiatives rely on validated, risk‐adjusted performance measures for comparisons across institutions and to enable outcomes to be tracked over time. We present the development, validation, and results of a model intended for public reporting of risk‐standardized mortality rates for patients hospitalized with exacerbations of COPD that has been endorsed by the National Quality Forum.[15]
METHODS
Approach to Measure Development
We developed this measure in accordance with guidelines described by the National Quality Forum,[16] CMS' Measure Management System,[17] and the American Heart Association scientific statement, Standards for Statistical Models Used for Public Reporting of Health Outcomes.[18] Throughout the process we obtained expert clinical and stakeholder input through meetings with a clinical advisory group and a national technical expert panel (see Acknowledgments). Last, we presented the proposed measure specifications and a summary of the technical expert panel discussions online and made a widely distributed call for public comments. We took the comments into consideration during the final stages of measure development (available at
Data Sources
We used claims data from Medicare inpatient, outpatient, and carrier (physician) Standard Analytic Files from 2008 to develop and validate the model, and examined model reliability using data from 2007 and 2009. The Medicare enrollment database was used to determine Medicare Fee‐for‐Service enrollment and mortality.
Study Cohort
Admissions were considered eligible for inclusion if the patient was 65 years or older, was admitted to a nonfederal acute care hospital in the United States, and had a principal diagnosis of COPD or a principal diagnosis of acute respiratory failure or respiratory arrest when paired with a secondary diagnosis of COPD with exacerbation (Table 1).
| ICD‐9‐CM | Description |
|---|---|
| |
| 491.21 | Obstructive chronic bronchitis; with (acute) exacerbation; acute exacerbation of COPD, decompensated COPD, decompensated COPD with exacerbation |
| 491.22 | Obstructive chronic bronchitis; with acute bronchitis |
| 491.8 | Other chronic bronchitis; chronic: tracheitis, tracheobronchitis |
| 491.9 | Unspecified chronic bronchitis |
| 492.8 | Other emphysema; emphysema (lung or pulmonary): NOS, centriacinar, centrilobular, obstructive, panacinar, panlobular, unilateral, vesicular; MacLeod's syndrome; Swyer‐James syndrome; unilateral hyperlucent lung |
| 493.20 | Chronic obstructive asthma; asthma with COPD, chronic asthmatic bronchitis, unspecified |
| 493.21 | Chronic obstructive asthma; asthma with COPD, chronic asthmatic bronchitis, with status asthmaticus |
| 493.22 | Chronic obstructive asthma; asthma with COPD, chronic asthmatic bronchitis, with (acute) exacerbation |
| 496 | Chronic: nonspecific lung disease, obstructive lung disease, obstructive pulmonary disease (COPD) NOS. (Note: This code is not to be used with any code from categories 491493.) |
| 518.81a | Other diseases of lung; acute respiratory failure; respiratory failure NOS |
| 518.82a | Other diseases of lung; acute respiratory failure; other pulmonary insufficiency, acute respiratory distress |
| 518.84a | Other diseases of lung; acute respiratory failure; acute and chronic respiratory failure |
| 799.1a | Other ill‐defined and unknown causes of morbidity and mortality; respiratory arrest, cardiorespiratory failure |
If a patient was discharged and readmitted to a second hospital on the same or the next day, we combined the 2 acute care admissions into a single episode of care and assigned the mortality outcome to the first admitting hospital. We excluded admissions for patients who were enrolled in Medicare Hospice in the 12 months prior to or on the first day of the index hospitalization. An index admission was any eligible admission assessed in the measure for the outcome. We also excluded admissions for patients who were discharged against medical advice, those for whom vital status at 30 days was unknown or recorded inconsistently, and patients with unreliable data (eg, age >115 years). For patients with multiple hospitalizations during a single year, we randomly selected 1 admission per patient to avoid survival bias. Finally, to assure adequate risk adjustment we limited the analysis to patients who had continuous enrollment in Medicare Fee‐for‐Service Parts A and B for the 12 months prior to their index admission so that we could identify comorbid conditions coded during all prior encounters.
Outcomes
The outcome of 30‐day mortality was defined as death from any cause within 30 days of the admission date for the index hospitalization. Mortality was assessed at 30 days to standardize the period of outcome ascertainment,[19] and because 30 days is a clinically meaningful time frame, during which differences in the quality of hospital care may be revealed.
Risk‐Adjustment Variables
We randomly selected half of all COPD admissions in 2008 that met the inclusion and exclusion criteria to create a model development sample. Candidate variables for inclusion in the risk‐standardized model were selected by a clinician team from diagnostic groups included in the Hierarchical Condition Category clinical classification system[20] and included age and comorbid conditions. Sleep apnea (International Classification of Diseases, 9th Revision, Clinical Modification [ICD‐9‐CM] condition codes 327.20, 327.21, 327.23, 327.27, 327.29, 780.51, 780.53, and 780.57) and mechanical ventilation (ICD‐9‐CM procedure codes 93.90, 96.70, 96.71, and 96.72) were also included as candidate variables.
We defined a condition as present for a given patient if it was coded in the inpatient, outpatient, or physician claims data sources in the preceding 12 months, including the index admission. Because a subset of the condition category variables can represent a complication of care, we did not consider them to be risk factors if they appeared only as secondary diagnosis codes for the index admission and not in claims submitted during the prior year.
We selected final variables for inclusion in the risk‐standardized model based on clinical considerations and a modified approach to stepwise logistic regression. The final patient‐level risk‐adjustment model included 42 variables (Table 2).
| Variable | Development Sample (150,035 Admissions at 4537 Hospitals) | Validation Sample (149,646 Admissions at 4535 Hospitals) | ||||
|---|---|---|---|---|---|---|
| Frequency, % | OR | 95% CI | Frequency, % | OR | 95% CI | |
| ||||||
| Demographics | ||||||
| Age 65 years (continuous) | 1.03 | 1.03‐1.04 | 1.03 | 1.03‐1.04 | ||
| Cardiovascular/respiratory | ||||||
| Sleep apnea (ICD‐9‐CM: 327.20, 327.21, 327.23, 327.27, 327.29, 780.51, 780.53, 780.57)a | 9.57 | 0.87 | 0.81‐0.94 | 9.72 | 0.84 | 0.78‐0.90 |
| History of mechanical ventilation (ICD‐9‐CM: 93.90, 96.70, 96.71, 96.72)a | 6.00 | 1.19 | 1.11‐1.27 | 6.00 | 1.15 | 1.08‐1.24 |
| Respirator dependence/respiratory failure (CC 7778)a | 1.15 | 0.89 | 0.77‐1.02 | 1.20 | 0.78 | 0.68‐0.91 |
| Cardiorespiratory failure and shock (CC 79) | 26.35 | 1.60 | 1.53‐1.68 | 26.34 | 1.59 | 1.52‐1.66 |
| Congestive heart failure (CC 80) | 41.50 | 1.34 | 1.28‐1.39 | 41.39 | 1.31 | 1.25‐1.36 |
| Chronic atherosclerosis (CC 8384)a | 50.44 | 0.87 | 0.83‐0.90 | 50.12 | 0.91 | 0.87‐0.94 |
| Arrhythmias (CC 9293) | 37.15 | 1.17 | 1.12‐1.22 | 37.06 | 1.15 | 1.10‐1.20 |
| Vascular or circulatory disease (CC 104106) | 38.20 | 1.09 | 1.05‐1.14 | 38.09 | 1.02 | 0.98‐1.06 |
| Fibrosis of lung and other chronic lung disorder (CC 109) | 16.96 | 1.08 | 1.03‐1.13 | 17.08 | 1.11 | 1.06‐1.17 |
| Asthma (CC 110) | 17.05 | 0.67 | 0.63‐0.70 | 16.90 | 0.67 | 0.63‐0.70 |
| Pneumonia (CC 111113) | 49.46 | 1.29 | 1.24‐1.35 | 49.41 | 1.27 | 1.22‐1.33 |
| Pleural effusion/pneumothorax (CC 114) | 11.78 | 1.17 | 1.11‐1.23 | 11.54 | 1.18 | 1.12‐1.25 |
| Other lung disorders (CC 115) | 53.07 | 0.80 | 0.77‐0.83 | 53.17 | 0.83 | 0.80‐0.87 |
| Other comorbid conditions | ||||||
| Metastatic cancer and acute leukemia (CC 7) | 2.76 | 2.34 | 2.14‐2.56 | 2.79 | 2.15 | 1.97‐2.35 |
| Lung, upper digestive tract, and other severe cancers (CC 8)a | 5.98 | 1.80 | 1.68‐1.92 | 6.02 | 1.98 | 1.85‐2.11 |
| Lymphatic, head and neck, brain, and other major cancers; breast, prostate, colorectal and other cancers and tumors; other respiratory and heart neoplasms (CC 911) | 14.13 | 1.03 | 0.97‐1.08 | 14.19 | 1.01 | 0.95‐1.06 |
| Other digestive and urinary neoplasms (CC 12) | 6.91 | 0.91 | 0.84‐0.98 | 7.05 | 0.85 | 0.79‐0.92 |
| Diabetes and DM complications (CC 1520, 119120) | 38.31 | 0.91 | 0.87‐0.94 | 38.29 | 0.91 | 0.87‐0.94 |
| Protein‐calorie malnutrition (CC 21) | 7.40 | 2.18 | 2.07‐2.30 | 7.44 | 2.09 | 1.98‐2.20 |
| Disorders of fluid/electrolyte/acid‐base (CC 2223) | 32.05 | 1.13 | 1.08‐1.18 | 32.16 | 1.24 | 1.19‐1.30 |
| Other endocrine/metabolic/nutritional disorders (CC 24) | 67.99 | 0.75 | 0.72‐0.78 | 67.88 | 0.76 | 0.73‐0.79 |
| Other gastrointestinal disorders (CC 36) | 56.21 | 0.81 | 0.78‐0.84 | 56.18 | 0.78 | 0.75‐0.81 |
| Osteoarthritis of hip or knee (CC 40) | 9.32 | 0.74 | 0.69‐0.79 | 9.33 | 0.80 | 0.74‐0.85 |
| Other musculoskeletal and connective tissue disorders (CC 43) | 64.14 | 0.83 | 0.80‐0.86 | 64.20 | 0.83 | 0.80‐0.87 |
| Iron deficiency and other/unspecified anemias and blood disease (CC 47) | 40.80 | 1.08 | 1.04‐1.12 | 40.72 | 1.08 | 1.04‐1.13 |
| Dementia and senility (CC 4950) | 17.06 | 1.09 | 1.04‐1.14 | 16.97 | 1.09 | 1.04‐1.15 |
| Drug/alcohol abuse, without dependence (CC 53)a | 23.51 | 0.78 | 0.75‐0.82 | 23.38 | 0.76 | 0.72‐0.80 |
| Other psychiatric disorders (CC 60)a | 16.49 | 1.12 | 1.07‐1.18 | 16.43 | 1.12 | 1.06‐1.17 |
| Quadriplegia, paraplegia, functional disability (CC 6769, 100102, 177178) | 4.92 | 1.03 | 0.95‐1.12 | 4.92 | 1.08 | 0.99‐1.17 |
| Mononeuropathy, other neurological conditions/emnjuries (CC 76) | 11.35 | 0.85 | 0.80‐0.91 | 11.28 | 0.88 | 0.83‐0.93 |
| Hypertension and hypertensive disease (CC 9091) | 80.40 | 0.78 | 0.75‐0.82 | 80.35 | 0.79 | 0.75‐0.83 |
| Stroke (CC 9596)a | 6.77 | 1.00 | 0.93‐1.08 | 6.73 | 0.98 | 0.91‐1.05 |
| Retinal disorders, except detachment and vascular retinopathies (CC 121) | 10.79 | 0.87 | 0.82‐0.93 | 10.69 | 0.90 | 0.85‐0.96 |
| Other eye disorders (CC 124)a | 19.05 | 0.90 | 0.86‐0.95 | 19.13 | 0.98 | 0.85‐0.93 |
| Other ear, nose, throat, and mouth disorders (CC 127) | 35.21 | 0.83 | 0.80‐0.87 | 35.02 | 0.80 | 0.77‐0.83 |
| Renal failure (CC 131)a | 17.92 | 1.12 | 1.07‐1.18 | 18.16 | 1.13 | 1.08‐1.19 |
| Decubitus ulcer or chronic skin ulcer (CC 148149) | 7.42 | 1.27 | 1.19‐1.35 | 7.42 | 1.33 | 1.25‐1.42 |
| Other dermatological disorders (CC 153) | 28.46 | 0.90 | 0.87‐0.94 | 28.32 | 0.89 | 0.86‐0.93 |
| Trauma (CC 154156, 158161) | 9.04 | 1.09 | 1.03‐1.16 | 8.99 | 1.15 | 1.08‐1.22 |
| Vertebral fractures (CC 157) | 5.01 | 1.33 | 1.24‐1.44 | 4.97 | 1.29 | 1.20‐1.39 |
| Major complications of medical care and trauma (CC 164) | 5.47 | 0.81 | 0.75‐0.88 | 5.55 | 0.82 | 0.76‐0.89 |
Model Derivation
We used hierarchical logistic regression models to model the log‐odds of mortality as a function of patient‐level clinical characteristics and a random hospital‐level intercept. At the patient level, each model adjusts the log‐odds of mortality for age and the selected clinical covariates. The second level models the hospital‐specific intercepts as arising from a normal distribution. The hospital intercept represents the underlying risk of mortality, after accounting for patient risk. If there were no differences among hospitals, then after adjusting for patient risk, the hospital intercepts should be identical across all hospitals.
Estimation of Hospital Risk‐Standardized Mortality Rate
We calculated a risk‐standardized mortality rate, defined as the ratio of predicted to expected deaths (similar to observed‐to‐expected), multiplied by the national unadjusted mortality rate.[21] The expected number of deaths for each hospital was estimated by applying the estimated regression coefficients to the characteristics of each hospital's patients, adding the average of the hospital‐specific intercepts, transforming the data by using an inverse logit function, and summing the data from all patients in the hospital to obtain the count. The predicted number of deaths was calculated in the same way, substituting the hospital‐specific intercept for the average hospital‐specific intercept.
Model Performance, Validation, and Reliability Testing
We used the remaining admissions in 2008 as the model validation sample. We computed several summary statistics to assess the patient‐level model performance in both the development and validation samples,[22] including over‐fitting indices, predictive ability, area under the receiver operating characteristic (ROC) curve, distribution of residuals, and model 2. In addition, we assessed face validity through a survey of members of the technical expert panel. To assess reliability of the model across data years, we repeated the modeling process using qualifying COPD admissions in both 2007 and 2009. Finally, to assess generalizability we evaluated the model's performance in an all‐payer sample of data from patients admitted to California hospitals in 2006.
Analyses were conducted using SAS version 9.1.3 (SAS Institute Inc., Cary, NC). We estimated the hierarchical models using the GLIMMIX procedure in SAS.
The Human Investigation Committee at the Yale University School of Medicine/Yale New Haven Hospital approved an exemption (HIC#0903004927) for the authors to use CMS claims and enrollment data for research analyses and publication.
RESULTS
Model Derivation
After exclusions were applied, the development sample included 150,035 admissions in 2008 at 4537 US hospitals (Figure 1). Factors that were most strongly associated with the risk of mortality included metastatic cancer (odds ratio [OR] 2.34), protein calorie malnutrition (OR 2.18), nonmetastatic cancers of the lung and upper digestive tract, (OR 1.80) cardiorespiratory failure and shock (OR 1.60), and congestive heart failure (OR 1.34) (Table 2).

Model Performance, Validation, and Reliability
The model had a C statistic of 0.72, indicating good discrimination, and predicted mortality in the development sample ranged from 1.52% in the lowest decile to 23.74% in the highest. The model validation sample, using the remaining cases from 2008, included 149,646 admissions from 4535 hospitals. Variable frequencies and ORs were similar in both samples (Table 2). Model performance was also similar in the validation samples, with good model discrimination and fit (Table 3). Ten of 12 technical expert panel members responded to the survey, of whom 90% at least somewhat agreed with the statement, the COPD mortality measure provides an accurate reflection of quality. When the model was applied to patients age 18 years and older in the 2006 California Patient Discharge Data, overall discrimination was good (C statistic, 0.74), including in those age 18 to 64 years (C statistic, 0.75; 65 and above C statistic, 0.70).
| Development | Validation | Data Years | ||
|---|---|---|---|---|
| Indices | Sample, 2008 | Sample, 2008 | 2007 | 2009 |
| ||||
| Number of admissions | 150,035 | 149,646 | 259,911 | 279,377 |
| Number of hospitals | 4537 | 4535 | 4636 | 4571 |
| Mean risk‐standardized mortality rate, % (SD) | 8.62 (0.94) | 8.64 (1.07) | 8.97 (1.12) | 8.08 (1.09) |
| Calibration, 0, 1 | 0.034, 0.985 | 0.009, 1.004 | 0.095, 1.022 | 0.120, 0.981 |
| Discriminationpredictive ability, lowest decile %highest decile % | 1.5223.74 | 1.6023.78 | 1.5424.64 | 1.4222.36 |
| Discriminationarea under the ROC curve, C statistic | 0.720 | 0.723 | 0.728 | 0.722 |
| Residuals lack of fit, Pearson residual fall % | ||||
| 2 | 0 | 0 | 0 | 0 |
| 2, 0 | 91.14 | 91.4 | 91.08 | 91.93 |
| 0, 2 | 1.66 | 1.7 | 1.96 | 1.42 |
| 2+ | 6.93 | 6.91 | 6.96 | 6.65 |
| Model Wald 2 (number of covariates) | 6982.11 (42) | 7051.50 (42) | 13042.35 (42) | 12542.15 (42) |
| P value | <0.0001 | <0.0001 | <0.0001 | <0.0001 |
| Between‐hospital variance, (standard error) | 0.067 (0.008) | 0.078 (0.009) | 0.067 (0.006) | 0.072 (0.006) |
Reliability testing demonstrated consistent performance over several years. The frequency and ORs of the variables included in the model showed only minor changes over time. The area under the ROC curve (C statistic) was 0.73 for the model in the 2007 sample and 0.72 for the model using 2009 data (Table 3).
Hospital Risk‐Standardized Mortality Rates
The mean unadjusted hospital 30‐day mortality rate was 8.6% and ranged from 0% to 100% (Figure 2a). Risk‐standardized mortality rates varied across hospitals (Figure 2b). The mean risk‐standardized mortality rate was 8.6% and ranged from 5.9% to 13.5%. The odds of mortality at a hospital 1 standard deviation above average was 1.20 times that of a hospital 1 standard deviation below average.
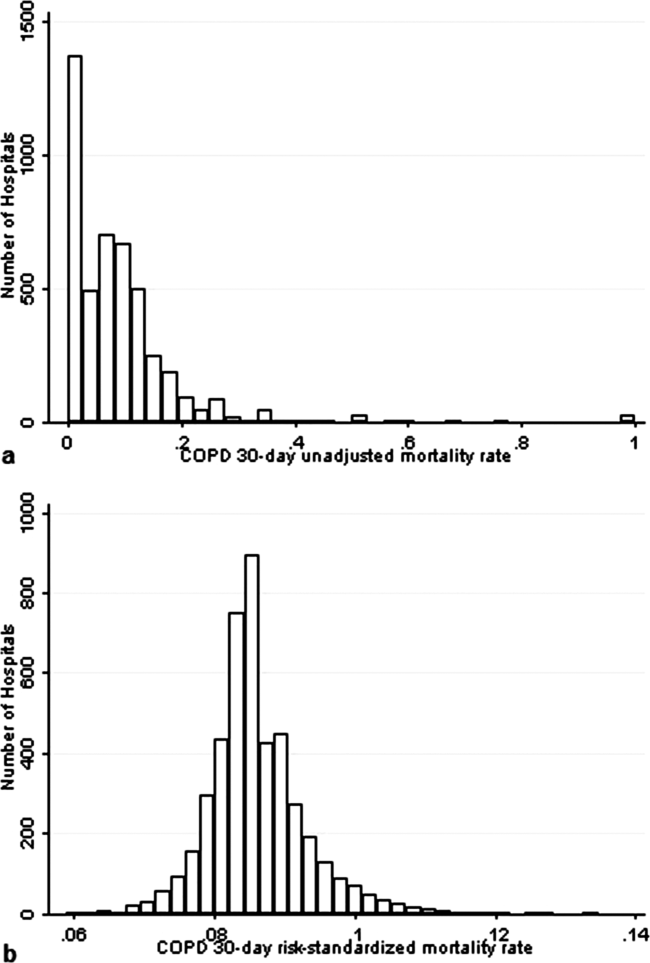
DISCUSSION
We present a hospital‐level risk‐standardized mortality measure for patients admitted with COPD based on administrative claims data that are intended for public reporting and that have achieved endorsement by the National Quality Forum, a voluntary consensus standards‐setting organization. Across more than 4500 US hospitals, the mean 30‐day risk‐standardized mortality rate in 2008 was 8.6%, and we observed considerable variation across institutions, despite adjustment for case mix, suggesting that improvement by lower‐performing institutions may be an achievable goal.
Although improving the delivery of evidence‐based care processes and outcomes of patients with acute myocardial infarction, heart failure, and pneumonia has been the focus of national quality improvement efforts for more than a decade, COPD has largely been overlooked.[23] Within this context, this analysis represents the first attempt to systematically measure, at the hospital level, 30‐day all‐cause mortality for patients admitted to US hospitals for exacerbation of COPD. The model we have developed and validated is intended to be used to compare the performance of hospitals while controlling for differences in the pretreatment risk of mortality of patients and accounting for the clustering of patients within hospitals, and will facilitate surveillance of hospital‐level risk‐adjusted outcomes over time.
In contrast to process‐based measures of quality, such as the percentage of patients with pneumonia who receive appropriate antibiotic therapy, performance measures based on patient outcomes provide a more comprehensive view of care and are more consistent with patients' goals.[24] Additionally, it is well established that hospital performance on individual and composite process measures explains only a small amount of the observed variation in patient outcomes between institutions.[25] In this regard, outcome measures incorporate important, but difficult to measure aspects of care, such as diagnostic accuracy and timing, communication and teamwork, the recognition and response to complications, care coordination at the time of transfers between levels of care, and care settings. Nevertheless, when used for making inferences about the quality of hospital care, individual measures such as the risk‐standardized hospital mortality rate should be interpreted in the context of other performance measures, including readmission, patient experience, and costs of care.
A number of prior investigators have described the outcomes of care for patients hospitalized with exacerbations of COPD, including identifying risk factors for mortality. Patil et al. carried out an analysis of the 1996 Nationwide Inpatient Sample and described an overall in‐hospital mortality rate of 2.5% among patients with COPD, and reported that a multivariable model containing sociodemographic characteristics about the patient and comorbidities had an area under the ROC curve of 0.70.[3] In contrast, this hospital‐level measure includes patients with a principal diagnosis of respiratory failure and focuses on 30‐day rather than inpatient mortality, accounting for the nearly 3‐fold higher mortality rate we observed. In a more recent study that used clinical from a large multistate database, Tabak et al. developed a prediction model for inpatient mortality for patients with COPD that contained only 4 factors: age, blood urea nitrogen, mental status, and pulse, and achieved an area under the ROC curve of 0.72.[4] The simplicity of such a model and its reliance on clinical measurements makes it particularly well suited for bedside application by clinicians, but less valuable for large‐scale public reporting programs that rely on administrative data. In the only other study identified that focused on the assessment of hospital mortality rates, Agabiti et al. analyzed the outcomes of 12,756 patients hospitalized for exacerbations of COPD, using similar ICD‐9‐CM diagnostic criteria as in this study, at 21 hospitals in Rome, Italy.[26] They reported an average crude 30‐day mortality rate of 3.8% among a group of 5 benchmark hospitals and an average mortality of 7.5% (range, 5.2%17.2%) among the remaining institutions.
To put the variation we observed in mortality rates into a broader context, the relative difference in the risk‐standardized hospital mortality rates across the 10th to 90th percentiles of hospital performance was 25% for acute myocardial infarction and 39% for heart failure, whereas rates varied 30% for COPD, from 7.6% to 9.9%.[27] Model discrimination in COPD (C statistic, 0.72) was also similar to that reported for models used for public reporting of hospital mortality in acute myocardial infarction (C statistic, 0.71) and pneumonia (C statistic, 0.72).
This study has a number of important strengths. First, the model was developed from a large sample of recent Medicare claims, achieved good discrimination, and was validated in samples not limited to Medicare beneficiaries. Second, by including patients with a principal diagnosis of COPD, as well as those with a principal diagnosis of acute respiratory failure when accompanied by a secondary diagnosis of COPD with acute exacerbation, this model can be used to assess hospital performance across the full spectrum of disease severity. This broad set of ICD‐9‐CM codes used to define the cohort also ensures that efforts to measure hospital performance will be less influenced by differences in documentation and coding practices across hospitals relating to the diagnosis or sequencing of acute respiratory failure diagnoses. Moreover, the inclusion of patients with respiratory failure is important because these patients have the greatest risk of mortality, and are those in whom efforts to improve the quality and safety of care may have the greatest impact. Third, rather than relying solely on information documented during the index admission, we used ambulatory and inpatient claims from the full year prior to the index admission to identify comorbidities and to distinguish them from potential complications of care. Finally, we did not include factors such as hospital characteristics (eg, number of beds, teaching status) in the model. Although they might have improved overall predictive ability, the goal of the hospital mortality measure is to enable comparisons of mortality rates among hospitals while controlling for differences in patient characteristics. To the extent that factors such as size or teaching status might be independently associated with hospital outcomes, it would be inappropriate to adjust away their effects, because mortality risk should not be influenced by hospital characteristics other than through their effects on quality.
These results should be viewed in light of several limitations. First, we used ICD‐9‐CM codes derived from claims files to define the patient populations included in the measure rather than collecting clinical or physiologic information prospectively or through manual review of medical records, such as the forced expiratory volume in 1 second or whether the patient required long‐term oxygen therapy. Nevertheless, we included a broad set of potential diagnosis codes to capture the full spectrum of COPD exacerbations and to minimize differences in coding across hospitals. Second, because the risk‐adjustment included diagnoses coded in the year prior to the index admission, it is potentially subject to bias due to regional differences in medical care utilization that are not driven by underlying differences in patient illness.[28] Third, using administrative claims data, we observed some paradoxical associations in the model that are difficult to explain on clinical grounds, such as a protective effect of substance and alcohol abuse or prior episodes of respiratory failure. Fourth, although we excluded patients from the analysis who were enrolled in hospice prior to, or on the day of, the index admission, we did not exclude those who choose to withdraw support, transition to comfort measures only, or enrolled in hospice care during a hospitalization. We do not seek to penalize hospitals for being sensitive to the preferences of patients at the end of life. At the same time, it is equally important that the measure is capable of detecting the outcomes of suboptimal care that may in some instances lead a patient or their family to withdraw support or choose hospice. Finally, we did not have the opportunity to validate the model against a clinical registry of patients with COPD, because such data do not currently exist. Nevertheless, the use of claims as a surrogate for chart data for risk adjustment has been validated for several conditions, including acute myocardial infarction, heart failure, and pneumonia.[29, 30]
CONCLUSIONS
Risk‐standardized 30‐day mortality rates for Medicare beneficiaries with COPD vary across hospitals in the US. Calculating and reporting hospital outcomes using validated performance measures may catalyze quality improvement activities and lead to better outcomes. Additional research would be helpful to confirm that hospitals with lower mortality rates achieve care that meets the goals of patients and their families better than at hospitals with higher mortality rates.
Acknowledgment
The authors thank the following members of the technical expert panel: Darlene Bainbridge, RN, MS, NHA, CPHQ, CPHRM, President/CEO, Darlene D. Bainbridge & Associates, Inc.; Robert A. Balk, MD, Director of Pulmonary and Critical Care Medicine, Rush University Medical Center; Dale Bratzler, DO, MPH, President and CEO, Oklahoma Foundation for Medical Quality; Scott Cerreta, RRT, Director of Education, COPD Foundation; Gerard J. Criner, MD, Director of Temple Lung Center and Divisions of Pulmonary and Critical Care Medicine, Temple University; Guy D'Andrea, MBA, President, Discern Consulting; Jonathan Fine, MD, Director of Pulmonary Fellowship, Research and Medical Education, Norwalk Hospital; David Hopkins, MS, PhD, Senior Advisor, Pacific Business Group on Health; Fred Martin Jacobs, MD, JD, FACP, FCCP, FCLM, Executive Vice President and Director, Saint Barnabas Quality Institute; Natalie Napolitano, MPH, RRT‐NPS, Respiratory Therapist, Inova Fairfax Hospital; Russell Robbins, MD, MBA, Principal and Senior Clinical Consultant, Mercer. In addition, the authors acknowledge and thank Angela Merrill, Sandi Nelson, Marian Wrobel, and Eric Schone from Mathematica Policy Research, Inc., Sharon‐Lise T. Normand from Harvard Medical School, and Lein Han and Michael Rapp at The Centers for Medicare & Medicaid Services for their contributions to this work.
Disclosures
Peter K. Lindenauer, MD, MSc, is the guarantor of this article, taking responsibility for the integrity of the work as a whole, from inception to published article, and takes responsibility for the content of the manuscript, including the data and data analysis. All authors have made substantial contributions to the conception and design, or acquisition of data, or analysis and interpretation of data; have drafted the submitted article or revised it critically for important intellectual content; and have provided final approval of the version to be published. Preparation of this manuscript was completed under Contract Number: HHSM‐5002008‐0025I/HHSM‐500‐T0001, Modification No. 000007, Option Year 2 Measure Instrument Development and Support (MIDS). Sponsors did not contribute to the development of the research or manuscript. Dr. Au reports being an unpaid research consultant for Bosch Inc. He receives research funding from the NIH, Department of Veterans Affairs, AHRQ, and Gilead Sciences. The views of the this manuscript represent the authors and do not necessarily represent those of the Department of Veterans Affairs. Drs. Drye and Bernheim report receiving contract funding from CMS to develop and maintain quality measures.
- FASTSTATS—chronic lower respiratory disease. Available at: http://www.cdc.gov/nchs/fastats/copd.htm. Accessed September 18, 2010.
- National Heart, Lung and Blood Institute. Morbidity and mortality chartbook. Available at: http://www.nhlbi.nih.gov/resources/docs/cht‐book.htm. Accessed April 27, 2010.
- , , , . In‐hospital mortality following acute exacerbations of chronic obstructive pulmonary disease. Arch Intern Med. 2003;163(10):1180–1186.
- , , , , . Mortality and need for mechanical ventilation in acute exacerbations of chronic obstructive pulmonary disease: development and validation of a simple risk score. Arch Intern Med. 2009;169(17):1595–1602.
- , , , , , . Quality of care for patients hospitalized for acute exacerbations of chronic obstructive pulmonary disease. Ann Intern Med. 2006;144(12):894–903.
- , , , , . Use of beta blockers and the risk of death in hospitalised patients with acute exacerbations of COPD. Thorax. 2008;63(4):301–305.
- , , , , . HCUP facts and figures: statistics on hospital‐based care in the United States, 2007. 2009. Available at: http://www.hcup‐us.ahrq.gov/reports.jsp. Accessed August 6, 2012.
- , . Predictors of long‐term survival in elderly patients hospitalized for acute exacerbations of chronic obstructive pulmonary disease. Respirology. 2008;13(6):851–855.
- , , , , , . The impact on risk‐factor analysis of different mortality outcomes in COPD patients. Eur Respir J 2008;32(3):629–636.
- , , , , , . Clinical audit indicators of outcome following admission to hospital with acute exacerbation of chronic obstructive pulmonary disease. Thorax. 2002;57(2):137–141.
- , , , et al. The quality of obstructive lung disease care for adults in the United States as measured by adherence to recommended processes. Chest. 2006;130(6):1844–1850.
- , , , , , . Management of acute exacerbations of chronic obstructive pulmonary disease in the elderly: physician practices in the community hospital setting. J Okla State Med Assoc. 2004;97(6):227–232.
- , , . Leadership by Example: Coordinating Government Roles in Improving Health Care Quality. Washington, DC: National Academies Press; 2002.
- Patient Protection and Affordable Care Act [H.R. 3590], Pub. L. No. 111–148, §2702, 124 Stat. 119, 318–319 (March 23, 2010). Available at: http://www.gpo.gov/fdsys/pkg/PLAW‐111publ148/html/PLAW‐111publ148.htm. Accessed July 15, 2012.
- National Quality Forum. NQF Endorses Additional Pulmonary Measure. 2013. Available at: http://www.qualityforum.org/News_And_Resources/Press_Releases/2013/NQF_Endorses_Additional_Pulmonary_Measure.aspx. Accessed January 11, 2013.
- National Quality Forum. National voluntary consensus standards for patient outcomes: a consensus report. Washington, DC: National Quality Forum; 2011.
- The Measures Management System. The Centers for Medicare and Medicaid Services. Available at: http://www.cms.gov/Medicare/Quality‐Initiatives‐Patient‐Assessment‐Instruments/MMS/index.html?redirect=/MMS/. Accessed August 6, 2012.
- , , , et al. Standards for statistical models used for public reporting of health outcomes: an American Heart Association Scientific Statement from the Quality of Care and Outcomes Research Interdisciplinary Writing Group: cosponsored by the Council on Epidemiology and Prevention and the Stroke Council. Endorsed by the American College of Cardiology Foundation. Circulation. 2006;113(3):456–462.
- , , , et al. Comparison of hospital risk‐standardized mortality rates calculated by using in‐hospital and 30‐day models: an observational study with implications for hospital profiling. Ann Intern Med. 2012;156(1 pt 1):19–26.
- , , , et al. Diagnostic cost group hierarchical condition category models for Medicare risk adjustment. Report prepared for the Health Care Financing Administration. Health Economics Research, Inc.; 2000. Available at: http://www.cms.gov/Research‐Statistics‐Data‐and‐Systems/Statistics‐Trends‐and‐Reports/Reports/downloads/pope_2000_2.pdf. Accessed November 7, 2009.
- , . Statistical and clinical aspects of hospital outcomes profiling. Stat Sci. 2007;22(2):206–226.
- , . Using full probability models to compute probabilities of actual interest to decision makers. Int J Technol Assess Health Care. 2001;17(1):17–26.
- , , . COPD performance measures: missing opportunities for improving care. Chest. 2010;137(5):1181–1189.
- , , , , . Measuring Performance For Treating Heart Attacks And Heart Failure: The Case For Outcomes Measurement. Health Aff. 2007;26(1):75–85.
- , , , et al. Hospital quality for acute myocardial infarction: correlation among process measures and relationship with short‐term mortality. JAMA. 2006;296(1):72–78.
- , , , et al. Profiling hospital performance to monitor the quality of care: the case of COPD. Eur Respir J. 2010;35(5):1031–1038.
- , , , et al. Patterns of hospital performance in acute myocardial infarction and heart failure 30‐day mortality and readmission. Circ Cardiovasc Qual Outcomes. 2009;2(5):407–413.
- , , , , . Geographic variation in diagnosis frequency and risk of death among Medicare beneficiaries. JAMA. 2011;305(11):1113–1118.
- , , , et al. An administrative claims model for profiling hospital 30‐day mortality rates for pneumonia patients. PLoS ONE. 2011;6(4):e17401.
- , , , et al. An Administrative Claims Model Suitable for Profiling Hospital Performance Based on 30‐Day Mortality Rates Among Patients With Heart Failure. Circulation. 2006;113(13):1693–1701.
Chronic obstructive pulmonary disease (COPD) affects as many as 24 million individuals in the United States, is responsible for more than 700,000 annual hospital admissions, and is currently the nation's third leading cause of death, accounting for nearly $49.9 billion in medical spending in 2010.[1, 2] Reported in‐hospital mortality rates for patients hospitalized for exacerbations of COPD range from 2% to 5%.[3, 4, 5, 6, 7] Information about 30‐day mortality rates following hospitalization for COPD is more limited; however, international studies suggest that rates range from 3% to 9%,[8, 9] and 90‐day mortality rates exceed 15%.[10]
Despite this significant clinical and economic impact, there have been no large‐scale, sustained efforts to measure the quality or outcomes of hospital care for patients with COPD in the United States. What little is known about the treatment of patients with COPD suggests widespread opportunities to increase adherence to guideline‐recommended therapies, to reduce the use of ineffective treatments and tests, and to address variation in care across institutions.[5, 11, 12]
Public reporting of hospital performance is a key strategy for improving the quality and safety of hospital care, both in the United States and internationally.[13] Since 2007, the Centers for Medicare and Medicaid Services (CMS) has reported hospital mortality rates on the Hospital Compare Web site, and COPD is 1 of the conditions highlighted in the Affordable Care Act for future consideration.[14] Such initiatives rely on validated, risk‐adjusted performance measures for comparisons across institutions and to enable outcomes to be tracked over time. We present the development, validation, and results of a model intended for public reporting of risk‐standardized mortality rates for patients hospitalized with exacerbations of COPD that has been endorsed by the National Quality Forum.[15]
METHODS
Approach to Measure Development
We developed this measure in accordance with guidelines described by the National Quality Forum,[16] CMS' Measure Management System,[17] and the American Heart Association scientific statement, Standards for Statistical Models Used for Public Reporting of Health Outcomes.[18] Throughout the process we obtained expert clinical and stakeholder input through meetings with a clinical advisory group and a national technical expert panel (see Acknowledgments). Last, we presented the proposed measure specifications and a summary of the technical expert panel discussions online and made a widely distributed call for public comments. We took the comments into consideration during the final stages of measure development (available at
Data Sources
We used claims data from Medicare inpatient, outpatient, and carrier (physician) Standard Analytic Files from 2008 to develop and validate the model, and examined model reliability using data from 2007 and 2009. The Medicare enrollment database was used to determine Medicare Fee‐for‐Service enrollment and mortality.
Study Cohort
Admissions were considered eligible for inclusion if the patient was 65 years or older, was admitted to a nonfederal acute care hospital in the United States, and had a principal diagnosis of COPD or a principal diagnosis of acute respiratory failure or respiratory arrest when paired with a secondary diagnosis of COPD with exacerbation (Table 1).
| ICD‐9‐CM | Description |
|---|---|
| |
| 491.21 | Obstructive chronic bronchitis; with (acute) exacerbation; acute exacerbation of COPD, decompensated COPD, decompensated COPD with exacerbation |
| 491.22 | Obstructive chronic bronchitis; with acute bronchitis |
| 491.8 | Other chronic bronchitis; chronic: tracheitis, tracheobronchitis |
| 491.9 | Unspecified chronic bronchitis |
| 492.8 | Other emphysema; emphysema (lung or pulmonary): NOS, centriacinar, centrilobular, obstructive, panacinar, panlobular, unilateral, vesicular; MacLeod's syndrome; Swyer‐James syndrome; unilateral hyperlucent lung |
| 493.20 | Chronic obstructive asthma; asthma with COPD, chronic asthmatic bronchitis, unspecified |
| 493.21 | Chronic obstructive asthma; asthma with COPD, chronic asthmatic bronchitis, with status asthmaticus |
| 493.22 | Chronic obstructive asthma; asthma with COPD, chronic asthmatic bronchitis, with (acute) exacerbation |
| 496 | Chronic: nonspecific lung disease, obstructive lung disease, obstructive pulmonary disease (COPD) NOS. (Note: This code is not to be used with any code from categories 491493.) |
| 518.81a | Other diseases of lung; acute respiratory failure; respiratory failure NOS |
| 518.82a | Other diseases of lung; acute respiratory failure; other pulmonary insufficiency, acute respiratory distress |
| 518.84a | Other diseases of lung; acute respiratory failure; acute and chronic respiratory failure |
| 799.1a | Other ill‐defined and unknown causes of morbidity and mortality; respiratory arrest, cardiorespiratory failure |
If a patient was discharged and readmitted to a second hospital on the same or the next day, we combined the 2 acute care admissions into a single episode of care and assigned the mortality outcome to the first admitting hospital. We excluded admissions for patients who were enrolled in Medicare Hospice in the 12 months prior to or on the first day of the index hospitalization. An index admission was any eligible admission assessed in the measure for the outcome. We also excluded admissions for patients who were discharged against medical advice, those for whom vital status at 30 days was unknown or recorded inconsistently, and patients with unreliable data (eg, age >115 years). For patients with multiple hospitalizations during a single year, we randomly selected 1 admission per patient to avoid survival bias. Finally, to assure adequate risk adjustment we limited the analysis to patients who had continuous enrollment in Medicare Fee‐for‐Service Parts A and B for the 12 months prior to their index admission so that we could identify comorbid conditions coded during all prior encounters.
Outcomes
The outcome of 30‐day mortality was defined as death from any cause within 30 days of the admission date for the index hospitalization. Mortality was assessed at 30 days to standardize the period of outcome ascertainment,[19] and because 30 days is a clinically meaningful time frame, during which differences in the quality of hospital care may be revealed.
Risk‐Adjustment Variables
We randomly selected half of all COPD admissions in 2008 that met the inclusion and exclusion criteria to create a model development sample. Candidate variables for inclusion in the risk‐standardized model were selected by a clinician team from diagnostic groups included in the Hierarchical Condition Category clinical classification system[20] and included age and comorbid conditions. Sleep apnea (International Classification of Diseases, 9th Revision, Clinical Modification [ICD‐9‐CM] condition codes 327.20, 327.21, 327.23, 327.27, 327.29, 780.51, 780.53, and 780.57) and mechanical ventilation (ICD‐9‐CM procedure codes 93.90, 96.70, 96.71, and 96.72) were also included as candidate variables.
We defined a condition as present for a given patient if it was coded in the inpatient, outpatient, or physician claims data sources in the preceding 12 months, including the index admission. Because a subset of the condition category variables can represent a complication of care, we did not consider them to be risk factors if they appeared only as secondary diagnosis codes for the index admission and not in claims submitted during the prior year.
We selected final variables for inclusion in the risk‐standardized model based on clinical considerations and a modified approach to stepwise logistic regression. The final patient‐level risk‐adjustment model included 42 variables (Table 2).
| Variable | Development Sample (150,035 Admissions at 4537 Hospitals) | Validation Sample (149,646 Admissions at 4535 Hospitals) | ||||
|---|---|---|---|---|---|---|
| Frequency, % | OR | 95% CI | Frequency, % | OR | 95% CI | |
| ||||||
| Demographics | ||||||
| Age 65 years (continuous) | 1.03 | 1.03‐1.04 | 1.03 | 1.03‐1.04 | ||
| Cardiovascular/respiratory | ||||||
| Sleep apnea (ICD‐9‐CM: 327.20, 327.21, 327.23, 327.27, 327.29, 780.51, 780.53, 780.57)a | 9.57 | 0.87 | 0.81‐0.94 | 9.72 | 0.84 | 0.78‐0.90 |
| History of mechanical ventilation (ICD‐9‐CM: 93.90, 96.70, 96.71, 96.72)a | 6.00 | 1.19 | 1.11‐1.27 | 6.00 | 1.15 | 1.08‐1.24 |
| Respirator dependence/respiratory failure (CC 7778)a | 1.15 | 0.89 | 0.77‐1.02 | 1.20 | 0.78 | 0.68‐0.91 |
| Cardiorespiratory failure and shock (CC 79) | 26.35 | 1.60 | 1.53‐1.68 | 26.34 | 1.59 | 1.52‐1.66 |
| Congestive heart failure (CC 80) | 41.50 | 1.34 | 1.28‐1.39 | 41.39 | 1.31 | 1.25‐1.36 |
| Chronic atherosclerosis (CC 8384)a | 50.44 | 0.87 | 0.83‐0.90 | 50.12 | 0.91 | 0.87‐0.94 |
| Arrhythmias (CC 9293) | 37.15 | 1.17 | 1.12‐1.22 | 37.06 | 1.15 | 1.10‐1.20 |
| Vascular or circulatory disease (CC 104106) | 38.20 | 1.09 | 1.05‐1.14 | 38.09 | 1.02 | 0.98‐1.06 |
| Fibrosis of lung and other chronic lung disorder (CC 109) | 16.96 | 1.08 | 1.03‐1.13 | 17.08 | 1.11 | 1.06‐1.17 |
| Asthma (CC 110) | 17.05 | 0.67 | 0.63‐0.70 | 16.90 | 0.67 | 0.63‐0.70 |
| Pneumonia (CC 111113) | 49.46 | 1.29 | 1.24‐1.35 | 49.41 | 1.27 | 1.22‐1.33 |
| Pleural effusion/pneumothorax (CC 114) | 11.78 | 1.17 | 1.11‐1.23 | 11.54 | 1.18 | 1.12‐1.25 |
| Other lung disorders (CC 115) | 53.07 | 0.80 | 0.77‐0.83 | 53.17 | 0.83 | 0.80‐0.87 |
| Other comorbid conditions | ||||||
| Metastatic cancer and acute leukemia (CC 7) | 2.76 | 2.34 | 2.14‐2.56 | 2.79 | 2.15 | 1.97‐2.35 |
| Lung, upper digestive tract, and other severe cancers (CC 8)a | 5.98 | 1.80 | 1.68‐1.92 | 6.02 | 1.98 | 1.85‐2.11 |
| Lymphatic, head and neck, brain, and other major cancers; breast, prostate, colorectal and other cancers and tumors; other respiratory and heart neoplasms (CC 911) | 14.13 | 1.03 | 0.97‐1.08 | 14.19 | 1.01 | 0.95‐1.06 |
| Other digestive and urinary neoplasms (CC 12) | 6.91 | 0.91 | 0.84‐0.98 | 7.05 | 0.85 | 0.79‐0.92 |
| Diabetes and DM complications (CC 1520, 119120) | 38.31 | 0.91 | 0.87‐0.94 | 38.29 | 0.91 | 0.87‐0.94 |
| Protein‐calorie malnutrition (CC 21) | 7.40 | 2.18 | 2.07‐2.30 | 7.44 | 2.09 | 1.98‐2.20 |
| Disorders of fluid/electrolyte/acid‐base (CC 2223) | 32.05 | 1.13 | 1.08‐1.18 | 32.16 | 1.24 | 1.19‐1.30 |
| Other endocrine/metabolic/nutritional disorders (CC 24) | 67.99 | 0.75 | 0.72‐0.78 | 67.88 | 0.76 | 0.73‐0.79 |
| Other gastrointestinal disorders (CC 36) | 56.21 | 0.81 | 0.78‐0.84 | 56.18 | 0.78 | 0.75‐0.81 |
| Osteoarthritis of hip or knee (CC 40) | 9.32 | 0.74 | 0.69‐0.79 | 9.33 | 0.80 | 0.74‐0.85 |
| Other musculoskeletal and connective tissue disorders (CC 43) | 64.14 | 0.83 | 0.80‐0.86 | 64.20 | 0.83 | 0.80‐0.87 |
| Iron deficiency and other/unspecified anemias and blood disease (CC 47) | 40.80 | 1.08 | 1.04‐1.12 | 40.72 | 1.08 | 1.04‐1.13 |
| Dementia and senility (CC 4950) | 17.06 | 1.09 | 1.04‐1.14 | 16.97 | 1.09 | 1.04‐1.15 |
| Drug/alcohol abuse, without dependence (CC 53)a | 23.51 | 0.78 | 0.75‐0.82 | 23.38 | 0.76 | 0.72‐0.80 |
| Other psychiatric disorders (CC 60)a | 16.49 | 1.12 | 1.07‐1.18 | 16.43 | 1.12 | 1.06‐1.17 |
| Quadriplegia, paraplegia, functional disability (CC 6769, 100102, 177178) | 4.92 | 1.03 | 0.95‐1.12 | 4.92 | 1.08 | 0.99‐1.17 |
| Mononeuropathy, other neurological conditions/emnjuries (CC 76) | 11.35 | 0.85 | 0.80‐0.91 | 11.28 | 0.88 | 0.83‐0.93 |
| Hypertension and hypertensive disease (CC 9091) | 80.40 | 0.78 | 0.75‐0.82 | 80.35 | 0.79 | 0.75‐0.83 |
| Stroke (CC 9596)a | 6.77 | 1.00 | 0.93‐1.08 | 6.73 | 0.98 | 0.91‐1.05 |
| Retinal disorders, except detachment and vascular retinopathies (CC 121) | 10.79 | 0.87 | 0.82‐0.93 | 10.69 | 0.90 | 0.85‐0.96 |
| Other eye disorders (CC 124)a | 19.05 | 0.90 | 0.86‐0.95 | 19.13 | 0.98 | 0.85‐0.93 |
| Other ear, nose, throat, and mouth disorders (CC 127) | 35.21 | 0.83 | 0.80‐0.87 | 35.02 | 0.80 | 0.77‐0.83 |
| Renal failure (CC 131)a | 17.92 | 1.12 | 1.07‐1.18 | 18.16 | 1.13 | 1.08‐1.19 |
| Decubitus ulcer or chronic skin ulcer (CC 148149) | 7.42 | 1.27 | 1.19‐1.35 | 7.42 | 1.33 | 1.25‐1.42 |
| Other dermatological disorders (CC 153) | 28.46 | 0.90 | 0.87‐0.94 | 28.32 | 0.89 | 0.86‐0.93 |
| Trauma (CC 154156, 158161) | 9.04 | 1.09 | 1.03‐1.16 | 8.99 | 1.15 | 1.08‐1.22 |
| Vertebral fractures (CC 157) | 5.01 | 1.33 | 1.24‐1.44 | 4.97 | 1.29 | 1.20‐1.39 |
| Major complications of medical care and trauma (CC 164) | 5.47 | 0.81 | 0.75‐0.88 | 5.55 | 0.82 | 0.76‐0.89 |
Model Derivation
We used hierarchical logistic regression models to model the log‐odds of mortality as a function of patient‐level clinical characteristics and a random hospital‐level intercept. At the patient level, each model adjusts the log‐odds of mortality for age and the selected clinical covariates. The second level models the hospital‐specific intercepts as arising from a normal distribution. The hospital intercept represents the underlying risk of mortality, after accounting for patient risk. If there were no differences among hospitals, then after adjusting for patient risk, the hospital intercepts should be identical across all hospitals.
Estimation of Hospital Risk‐Standardized Mortality Rate
We calculated a risk‐standardized mortality rate, defined as the ratio of predicted to expected deaths (similar to observed‐to‐expected), multiplied by the national unadjusted mortality rate.[21] The expected number of deaths for each hospital was estimated by applying the estimated regression coefficients to the characteristics of each hospital's patients, adding the average of the hospital‐specific intercepts, transforming the data by using an inverse logit function, and summing the data from all patients in the hospital to obtain the count. The predicted number of deaths was calculated in the same way, substituting the hospital‐specific intercept for the average hospital‐specific intercept.
Model Performance, Validation, and Reliability Testing
We used the remaining admissions in 2008 as the model validation sample. We computed several summary statistics to assess the patient‐level model performance in both the development and validation samples,[22] including over‐fitting indices, predictive ability, area under the receiver operating characteristic (ROC) curve, distribution of residuals, and model 2. In addition, we assessed face validity through a survey of members of the technical expert panel. To assess reliability of the model across data years, we repeated the modeling process using qualifying COPD admissions in both 2007 and 2009. Finally, to assess generalizability we evaluated the model's performance in an all‐payer sample of data from patients admitted to California hospitals in 2006.
Analyses were conducted using SAS version 9.1.3 (SAS Institute Inc., Cary, NC). We estimated the hierarchical models using the GLIMMIX procedure in SAS.
The Human Investigation Committee at the Yale University School of Medicine/Yale New Haven Hospital approved an exemption (HIC#0903004927) for the authors to use CMS claims and enrollment data for research analyses and publication.
RESULTS
Model Derivation
After exclusions were applied, the development sample included 150,035 admissions in 2008 at 4537 US hospitals (Figure 1). Factors that were most strongly associated with the risk of mortality included metastatic cancer (odds ratio [OR] 2.34), protein calorie malnutrition (OR 2.18), nonmetastatic cancers of the lung and upper digestive tract, (OR 1.80) cardiorespiratory failure and shock (OR 1.60), and congestive heart failure (OR 1.34) (Table 2).
Model Performance, Validation, and Reliability
The model had a C statistic of 0.72, indicating good discrimination, and predicted mortality in the development sample ranged from 1.52% in the lowest decile to 23.74% in the highest. The model validation sample, using the remaining cases from 2008, included 149,646 admissions from 4535 hospitals. Variable frequencies and ORs were similar in both samples (Table 2). Model performance was also similar in the validation samples, with good model discrimination and fit (Table 3). Ten of 12 technical expert panel members responded to the survey, of whom 90% at least somewhat agreed with the statement, the COPD mortality measure provides an accurate reflection of quality. When the model was applied to patients age 18 years and older in the 2006 California Patient Discharge Data, overall discrimination was good (C statistic, 0.74), including in those age 18 to 64 years (C statistic, 0.75; 65 and above C statistic, 0.70).
| Development | Validation | Data Years | ||
|---|---|---|---|---|
| Indices | Sample, 2008 | Sample, 2008 | 2007 | 2009 |
| ||||
| Number of admissions | 150,035 | 149,646 | 259,911 | 279,377 |
| Number of hospitals | 4537 | 4535 | 4636 | 4571 |
| Mean risk‐standardized mortality rate, % (SD) | 8.62 (0.94) | 8.64 (1.07) | 8.97 (1.12) | 8.08 (1.09) |
| Calibration, 0, 1 | 0.034, 0.985 | 0.009, 1.004 | 0.095, 1.022 | 0.120, 0.981 |
| Discriminationpredictive ability, lowest decile %highest decile % | 1.5223.74 | 1.6023.78 | 1.5424.64 | 1.4222.36 |
| Discriminationarea under the ROC curve, C statistic | 0.720 | 0.723 | 0.728 | 0.722 |
| Residuals lack of fit, Pearson residual fall % | ||||
| 2 | 0 | 0 | 0 | 0 |
| 2, 0 | 91.14 | 91.4 | 91.08 | 91.93 |
| 0, 2 | 1.66 | 1.7 | 1.96 | 1.42 |
| 2+ | 6.93 | 6.91 | 6.96 | 6.65 |
| Model Wald 2 (number of covariates) | 6982.11 (42) | 7051.50 (42) | 13042.35 (42) | 12542.15 (42) |
| P value | <0.0001 | <0.0001 | <0.0001 | <0.0001 |
| Between‐hospital variance, (standard error) | 0.067 (0.008) | 0.078 (0.009) | 0.067 (0.006) | 0.072 (0.006) |
Reliability testing demonstrated consistent performance over several years. The frequency and ORs of the variables included in the model showed only minor changes over time. The area under the ROC curve (C statistic) was 0.73 for the model in the 2007 sample and 0.72 for the model using 2009 data (Table 3).
Hospital Risk‐Standardized Mortality Rates
The mean unadjusted hospital 30‐day mortality rate was 8.6% and ranged from 0% to 100% (Figure 2a). Risk‐standardized mortality rates varied across hospitals (Figure 2b). The mean risk‐standardized mortality rate was 8.6% and ranged from 5.9% to 13.5%. The odds of mortality at a hospital 1 standard deviation above average was 1.20 times that of a hospital 1 standard deviation below average.
DISCUSSION
We present a hospital‐level risk‐standardized mortality measure for patients admitted with COPD based on administrative claims data that are intended for public reporting and that have achieved endorsement by the National Quality Forum, a voluntary consensus standards‐setting organization. Across more than 4500 US hospitals, the mean 30‐day risk‐standardized mortality rate in 2008 was 8.6%, and we observed considerable variation across institutions, despite adjustment for case mix, suggesting that improvement by lower‐performing institutions may be an achievable goal.
Although improving the delivery of evidence‐based care processes and outcomes of patients with acute myocardial infarction, heart failure, and pneumonia has been the focus of national quality improvement efforts for more than a decade, COPD has largely been overlooked.[23] Within this context, this analysis represents the first attempt to systematically measure, at the hospital level, 30‐day all‐cause mortality for patients admitted to US hospitals for exacerbation of COPD. The model we have developed and validated is intended to be used to compare the performance of hospitals while controlling for differences in the pretreatment risk of mortality of patients and accounting for the clustering of patients within hospitals, and will facilitate surveillance of hospital‐level risk‐adjusted outcomes over time.
In contrast to process‐based measures of quality, such as the percentage of patients with pneumonia who receive appropriate antibiotic therapy, performance measures based on patient outcomes provide a more comprehensive view of care and are more consistent with patients' goals.[24] Additionally, it is well established that hospital performance on individual and composite process measures explains only a small amount of the observed variation in patient outcomes between institutions.[25] In this regard, outcome measures incorporate important, but difficult to measure aspects of care, such as diagnostic accuracy and timing, communication and teamwork, the recognition and response to complications, care coordination at the time of transfers between levels of care, and care settings. Nevertheless, when used for making inferences about the quality of hospital care, individual measures such as the risk‐standardized hospital mortality rate should be interpreted in the context of other performance measures, including readmission, patient experience, and costs of care.
A number of prior investigators have described the outcomes of care for patients hospitalized with exacerbations of COPD, including identifying risk factors for mortality. Patil et al. carried out an analysis of the 1996 Nationwide Inpatient Sample and described an overall in‐hospital mortality rate of 2.5% among patients with COPD, and reported that a multivariable model containing sociodemographic characteristics about the patient and comorbidities had an area under the ROC curve of 0.70.[3] In contrast, this hospital‐level measure includes patients with a principal diagnosis of respiratory failure and focuses on 30‐day rather than inpatient mortality, accounting for the nearly 3‐fold higher mortality rate we observed. In a more recent study that used clinical from a large multistate database, Tabak et al. developed a prediction model for inpatient mortality for patients with COPD that contained only 4 factors: age, blood urea nitrogen, mental status, and pulse, and achieved an area under the ROC curve of 0.72.[4] The simplicity of such a model and its reliance on clinical measurements makes it particularly well suited for bedside application by clinicians, but less valuable for large‐scale public reporting programs that rely on administrative data. In the only other study identified that focused on the assessment of hospital mortality rates, Agabiti et al. analyzed the outcomes of 12,756 patients hospitalized for exacerbations of COPD, using similar ICD‐9‐CM diagnostic criteria as in this study, at 21 hospitals in Rome, Italy.[26] They reported an average crude 30‐day mortality rate of 3.8% among a group of 5 benchmark hospitals and an average mortality of 7.5% (range, 5.2%17.2%) among the remaining institutions.
To put the variation we observed in mortality rates into a broader context, the relative difference in the risk‐standardized hospital mortality rates across the 10th to 90th percentiles of hospital performance was 25% for acute myocardial infarction and 39% for heart failure, whereas rates varied 30% for COPD, from 7.6% to 9.9%.[27] Model discrimination in COPD (C statistic, 0.72) was also similar to that reported for models used for public reporting of hospital mortality in acute myocardial infarction (C statistic, 0.71) and pneumonia (C statistic, 0.72).
This study has a number of important strengths. First, the model was developed from a large sample of recent Medicare claims, achieved good discrimination, and was validated in samples not limited to Medicare beneficiaries. Second, by including patients with a principal diagnosis of COPD, as well as those with a principal diagnosis of acute respiratory failure when accompanied by a secondary diagnosis of COPD with acute exacerbation, this model can be used to assess hospital performance across the full spectrum of disease severity. This broad set of ICD‐9‐CM codes used to define the cohort also ensures that efforts to measure hospital performance will be less influenced by differences in documentation and coding practices across hospitals relating to the diagnosis or sequencing of acute respiratory failure diagnoses. Moreover, the inclusion of patients with respiratory failure is important because these patients have the greatest risk of mortality, and are those in whom efforts to improve the quality and safety of care may have the greatest impact. Third, rather than relying solely on information documented during the index admission, we used ambulatory and inpatient claims from the full year prior to the index admission to identify comorbidities and to distinguish them from potential complications of care. Finally, we did not include factors such as hospital characteristics (eg, number of beds, teaching status) in the model. Although they might have improved overall predictive ability, the goal of the hospital mortality measure is to enable comparisons of mortality rates among hospitals while controlling for differences in patient characteristics. To the extent that factors such as size or teaching status might be independently associated with hospital outcomes, it would be inappropriate to adjust away their effects, because mortality risk should not be influenced by hospital characteristics other than through their effects on quality.
These results should be viewed in light of several limitations. First, we used ICD‐9‐CM codes derived from claims files to define the patient populations included in the measure rather than collecting clinical or physiologic information prospectively or through manual review of medical records, such as the forced expiratory volume in 1 second or whether the patient required long‐term oxygen therapy. Nevertheless, we included a broad set of potential diagnosis codes to capture the full spectrum of COPD exacerbations and to minimize differences in coding across hospitals. Second, because the risk‐adjustment included diagnoses coded in the year prior to the index admission, it is potentially subject to bias due to regional differences in medical care utilization that are not driven by underlying differences in patient illness.[28] Third, using administrative claims data, we observed some paradoxical associations in the model that are difficult to explain on clinical grounds, such as a protective effect of substance and alcohol abuse or prior episodes of respiratory failure. Fourth, although we excluded patients from the analysis who were enrolled in hospice prior to, or on the day of, the index admission, we did not exclude those who choose to withdraw support, transition to comfort measures only, or enrolled in hospice care during a hospitalization. We do not seek to penalize hospitals for being sensitive to the preferences of patients at the end of life. At the same time, it is equally important that the measure is capable of detecting the outcomes of suboptimal care that may in some instances lead a patient or their family to withdraw support or choose hospice. Finally, we did not have the opportunity to validate the model against a clinical registry of patients with COPD, because such data do not currently exist. Nevertheless, the use of claims as a surrogate for chart data for risk adjustment has been validated for several conditions, including acute myocardial infarction, heart failure, and pneumonia.[29, 30]
CONCLUSIONS
Risk‐standardized 30‐day mortality rates for Medicare beneficiaries with COPD vary across hospitals in the US. Calculating and reporting hospital outcomes using validated performance measures may catalyze quality improvement activities and lead to better outcomes. Additional research would be helpful to confirm that hospitals with lower mortality rates achieve care that meets the goals of patients and their families better than at hospitals with higher mortality rates.
Acknowledgment
The authors thank the following members of the technical expert panel: Darlene Bainbridge, RN, MS, NHA, CPHQ, CPHRM, President/CEO, Darlene D. Bainbridge & Associates, Inc.; Robert A. Balk, MD, Director of Pulmonary and Critical Care Medicine, Rush University Medical Center; Dale Bratzler, DO, MPH, President and CEO, Oklahoma Foundation for Medical Quality; Scott Cerreta, RRT, Director of Education, COPD Foundation; Gerard J. Criner, MD, Director of Temple Lung Center and Divisions of Pulmonary and Critical Care Medicine, Temple University; Guy D'Andrea, MBA, President, Discern Consulting; Jonathan Fine, MD, Director of Pulmonary Fellowship, Research and Medical Education, Norwalk Hospital; David Hopkins, MS, PhD, Senior Advisor, Pacific Business Group on Health; Fred Martin Jacobs, MD, JD, FACP, FCCP, FCLM, Executive Vice President and Director, Saint Barnabas Quality Institute; Natalie Napolitano, MPH, RRT‐NPS, Respiratory Therapist, Inova Fairfax Hospital; Russell Robbins, MD, MBA, Principal and Senior Clinical Consultant, Mercer. In addition, the authors acknowledge and thank Angela Merrill, Sandi Nelson, Marian Wrobel, and Eric Schone from Mathematica Policy Research, Inc., Sharon‐Lise T. Normand from Harvard Medical School, and Lein Han and Michael Rapp at The Centers for Medicare & Medicaid Services for their contributions to this work.
Disclosures
Peter K. Lindenauer, MD, MSc, is the guarantor of this article, taking responsibility for the integrity of the work as a whole, from inception to published article, and takes responsibility for the content of the manuscript, including the data and data analysis. All authors have made substantial contributions to the conception and design, or acquisition of data, or analysis and interpretation of data; have drafted the submitted article or revised it critically for important intellectual content; and have provided final approval of the version to be published. Preparation of this manuscript was completed under Contract Number: HHSM‐5002008‐0025I/HHSM‐500‐T0001, Modification No. 000007, Option Year 2 Measure Instrument Development and Support (MIDS). Sponsors did not contribute to the development of the research or manuscript. Dr. Au reports being an unpaid research consultant for Bosch Inc. He receives research funding from the NIH, Department of Veterans Affairs, AHRQ, and Gilead Sciences. The views of the this manuscript represent the authors and do not necessarily represent those of the Department of Veterans Affairs. Drs. Drye and Bernheim report receiving contract funding from CMS to develop and maintain quality measures.
- FASTSTATS—chronic lower respiratory disease. Available at: http://www.cdc.gov/nchs/fastats/copd.htm. Accessed September 18, 2010.
- National Heart, Lung and Blood Institute. Morbidity and mortality chartbook. Available at: http://www.nhlbi.nih.gov/resources/docs/cht‐book.htm. Accessed April 27, 2010.
- , , , . In‐hospital mortality following acute exacerbations of chronic obstructive pulmonary disease. Arch Intern Med. 2003;163(10):1180–1186.
- , , , , . Mortality and need for mechanical ventilation in acute exacerbations of chronic obstructive pulmonary disease: development and validation of a simple risk score. Arch Intern Med. 2009;169(17):1595–1602.
- , , , , , . Quality of care for patients hospitalized for acute exacerbations of chronic obstructive pulmonary disease. Ann Intern Med. 2006;144(12):894–903.
- , , , , . Use of beta blockers and the risk of death in hospitalised patients with acute exacerbations of COPD. Thorax. 2008;63(4):301–305.
- , , , , . HCUP facts and figures: statistics on hospital‐based care in the United States, 2007. 2009. Available at: http://www.hcup‐us.ahrq.gov/reports.jsp. Accessed August 6, 2012.
- , . Predictors of long‐term survival in elderly patients hospitalized for acute exacerbations of chronic obstructive pulmonary disease. Respirology. 2008;13(6):851–855.
- , , , , , . The impact on risk‐factor analysis of different mortality outcomes in COPD patients. Eur Respir J 2008;32(3):629–636.
- , , , , , . Clinical audit indicators of outcome following admission to hospital with acute exacerbation of chronic obstructive pulmonary disease. Thorax. 2002;57(2):137–141.
- , , , et al. The quality of obstructive lung disease care for adults in the United States as measured by adherence to recommended processes. Chest. 2006;130(6):1844–1850.
- , , , , , . Management of acute exacerbations of chronic obstructive pulmonary disease in the elderly: physician practices in the community hospital setting. J Okla State Med Assoc. 2004;97(6):227–232.
- , , . Leadership by Example: Coordinating Government Roles in Improving Health Care Quality. Washington, DC: National Academies Press; 2002.
- Patient Protection and Affordable Care Act [H.R. 3590], Pub. L. No. 111–148, §2702, 124 Stat. 119, 318–319 (March 23, 2010). Available at: http://www.gpo.gov/fdsys/pkg/PLAW‐111publ148/html/PLAW‐111publ148.htm. Accessed July 15, 2012.
- National Quality Forum. NQF Endorses Additional Pulmonary Measure. 2013. Available at: http://www.qualityforum.org/News_And_Resources/Press_Releases/2013/NQF_Endorses_Additional_Pulmonary_Measure.aspx. Accessed January 11, 2013.
- National Quality Forum. National voluntary consensus standards for patient outcomes: a consensus report. Washington, DC: National Quality Forum; 2011.
- The Measures Management System. The Centers for Medicare and Medicaid Services. Available at: http://www.cms.gov/Medicare/Quality‐Initiatives‐Patient‐Assessment‐Instruments/MMS/index.html?redirect=/MMS/. Accessed August 6, 2012.
- , , , et al. Standards for statistical models used for public reporting of health outcomes: an American Heart Association Scientific Statement from the Quality of Care and Outcomes Research Interdisciplinary Writing Group: cosponsored by the Council on Epidemiology and Prevention and the Stroke Council. Endorsed by the American College of Cardiology Foundation. Circulation. 2006;113(3):456–462.
- , , , et al. Comparison of hospital risk‐standardized mortality rates calculated by using in‐hospital and 30‐day models: an observational study with implications for hospital profiling. Ann Intern Med. 2012;156(1 pt 1):19–26.
- , , , et al. Diagnostic cost group hierarchical condition category models for Medicare risk adjustment. Report prepared for the Health Care Financing Administration. Health Economics Research, Inc.; 2000. Available at: http://www.cms.gov/Research‐Statistics‐Data‐and‐Systems/Statistics‐Trends‐and‐Reports/Reports/downloads/pope_2000_2.pdf. Accessed November 7, 2009.
- , . Statistical and clinical aspects of hospital outcomes profiling. Stat Sci. 2007;22(2):206–226.
- , . Using full probability models to compute probabilities of actual interest to decision makers. Int J Technol Assess Health Care. 2001;17(1):17–26.
- , , . COPD performance measures: missing opportunities for improving care. Chest. 2010;137(5):1181–1189.
- , , , , . Measuring Performance For Treating Heart Attacks And Heart Failure: The Case For Outcomes Measurement. Health Aff. 2007;26(1):75–85.
- , , , et al. Hospital quality for acute myocardial infarction: correlation among process measures and relationship with short‐term mortality. JAMA. 2006;296(1):72–78.
- , , , et al. Profiling hospital performance to monitor the quality of care: the case of COPD. Eur Respir J. 2010;35(5):1031–1038.
- , , , et al. Patterns of hospital performance in acute myocardial infarction and heart failure 30‐day mortality and readmission. Circ Cardiovasc Qual Outcomes. 2009;2(5):407–413.
- , , , , . Geographic variation in diagnosis frequency and risk of death among Medicare beneficiaries. JAMA. 2011;305(11):1113–1118.
- , , , et al. An administrative claims model for profiling hospital 30‐day mortality rates for pneumonia patients. PLoS ONE. 2011;6(4):e17401.
- , , , et al. An Administrative Claims Model Suitable for Profiling Hospital Performance Based on 30‐Day Mortality Rates Among Patients With Heart Failure. Circulation. 2006;113(13):1693–1701.
Copyright © 2013 Society of Hospital Medicine
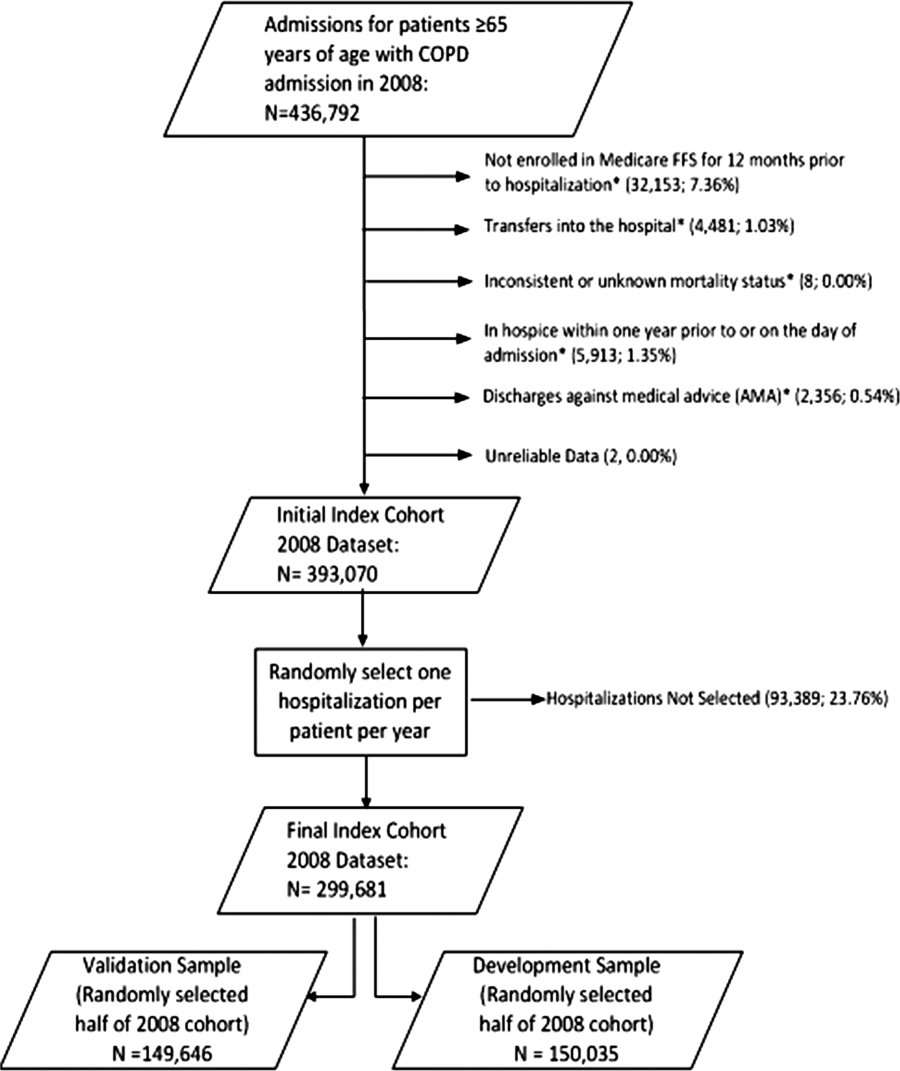
Advice and Preparedness to Quit Smoking
Hospitalization may offer a natural opportunity to screen and advise patients on the advantages of quitting smoking due to a variety of reasons, such as the smoke‐free environment, availability of medical personnel, suitability of tailoring information, and the potential to catch a teachable moment.1, 2 Additionally, a recent meta‐analysis suggested that hospital‐based cessation programs and referrals to cardiac rehabilitation result in significantly higher rates of cessation among discharged smokers.3 In 2008, the U.S. Public Health Service Task Force on Clinical Practice Guidelines for Treating Tobacco Use and Dependence in hospitalized smokers recommended listing smoking status on problem lists, evaluating a smoker's preparedness to quit, providing counseling and medications to treat in‐hospital withdrawal symptoms, and arranging discharge follow‐up to help smokers remain abstinent.4 To promote these practices, the Center for Medicaid and Medicare Services (CMS) has made smoking cessation counseling a quality of care indicator for patients hospitalized with congestive heart failure (CHF), acute myocardial infarction (AMI), or pneumonia. This indicator is a critical step in recognizing the importance of smoking cessation counseling in improving mortality and morbidity for these patients.
Despite the importance of promoting smoking cessation among hospitalized patients, few studies have looked at whether or not hospitalized patients are prepared to quit smoking. Ascertaining patients' preparedness to quit smoking is an important first step in understanding a patient's readiness to change their health behaviors because smoking cessation is the culmination of a lengthy process of behavior change.5 Studies of healthy factory workers suggest that smokers who were more prepared to quit smoking had a higher number of previous quit attempts and perceived coworker encouragement.6
Understanding patient preparedness to quit smoking is especially important among African American smokers, who face a disproportionate health burden due to smoking‐related illness. Studies show that African Americans are less likely than other racial groups to engage in formal tobacco cessation interventions and have lower long‐term quit rates, despite a higher desire to quit smoking.5, 79 Understanding preparedness to quit among this particular group of hospitalized patients may be an important first step in identifying those most likely to quit and benefit from tailored, intensive interventions, such as using medications to assist in combination with postdischarge tobacco cessation counseling.
The aim of this study was to characterize the preparedness to quit smoking and to assess quit attempts made, methods used for quitting, and the success of such quit attempts at 1‐month follow‐up in a group comprised of a high proportion of underserved African American hospitalized smokers. In addition, the relationship of hospitalized patients' preparedness to quit and the effect of inpatient advice on the likelihood of subsequent tobacco cessation were examined.
Patients and Methods
The data used for this study were collected for the Cardiology Quality of Care Study, an ongoing prospective study of patients hospitalized on the inpatient cardiology service at the University of Chicago Medical Center. Newly admitted patients were approached by research assistants and consented to the study using a previously described protocol for enrolling hospitalized patients.10 Patients that lacked decisional capacity (score of <17 on the telephone version of the Mini‐Mental Status Exam)11 were excluded. Patients did not receive any scripted intervention during this admission to assist with cessation. The study left cessation counseling and advice to quit up to the discretion of the individual physician caring for the patient in the hospital. The Institutional Review Board at the University of Chicago approved this study.
Inpatient Interview
The inpatient interview is a 60‐item questionnaire taking approximately 15 minutes to administer by trained research assistants. The questionnaire is designed to assess demographic characteristics (race, socioeconomic status, education, sex, and age), smoking habits, and preparedness to quit. Demographics were collected on all consented patients. Seven items focused on cigarette smoking, consistent with questions in the National Health Information Survey.12 Patients were classified as lifetime smokers if they smoked at least 100 cigarettes in their lifetime. To identify current smokers on admission, patients were asked if they now smoke cigarettes some days or everyday. Additionally, smokers were asked if they had made any quit attempts in the past 12 months.
Patients rated their level of preparedness using a modified version of the Biener Abrams Contemplation Ladder. The Contemplation Ladder is an easily‐administered tool represented by a ladder image of rungs with anchor statements developed as an alternative method to the Prochaska and DiClemente Stages of Change.13 The 10‐point scale ranges from 1 (I enjoy smoking and have decided not to quit smoking for my lifetime; I have no interest in quitting) to 10 (I have quit smoking and will never smoke again.) Tobacco users may rank their current level of motivation to quit. A level of 6 (I definitely plan to quit smoking in the next 6 months) or higher is consistent with preparedness to quit. The Contemplation Ladder was validated by Biener and Abrams6 in a work site study which demonstrated that subjects with higher Ladder scores (score 6) were more likely than those with lower Ladder scores (scores < 6) to participate in awareness activities (eg, educational session) and make a quit attempt in 6 months. This instrument is easier to administer than the more well known Transtheoretical Model of Change, given that it is an ordinal scale with clear steps that may be more user‐friendly for both clinicians and patients.6 In a prior study of emergency room patients, an individual's Ladder score was shown to be significantly associated with a patient's reported intention to quit, number of previous quit attempts, perceived coworker encouragement, and socioeconomic status.14
Admission Diagnoses
Chart audit was performed by trained research assistants at the time of the inpatient interview (within 24 hours of admission) to assess whether patients were admitted with the potential diagnoses of AMI, CHF, neither, or both. All were based on the chart documentation of the patients' clinical presentation. This information was used to assess which CMS Quality Indicators applied to cardiology patients, given that smoking cessation is now a quality indicator for patients with AMI or CHF.
Thirty‐day Follow‐up Telephone Survey
Trained research assistants interviewed patients by telephone at approximately 1 month postdischarge. The follow‐up telephone survey included routine questions concerning follow‐up appointments, readmissions, emergency room visits, and patient satisfaction.15, 10 An additional 5 questions related to smoking cessation were added for this study. Questions were developed using the CMS quality indicators16 or were taken from the National Health Information Survey.12 Patients were asked to self‐report quit attempts made postdischarge, whether or not these quit attempts were associated with success (self‐reported abstinence at the time of follow‐up), and what methods were used to quit (ie, nicotine replacement therapy [NRT], other pharmacotherapy, quit line, pamphlet, counseling group, or cold turkey.) Patients were also asked if they recalled receiving advice to quit during their hospitalization from either a nurse or physician.
Data Analysis
Descriptive statistics were used to summarize Contemplation Ladder scores and types of quit methods used. Chi square tests were used to assess the effect of preparedness (Ladder score 6) on quit behaviors. The main quit behavior was any self‐reported quit attempt made within 1 month after discharge. Additionally, the relationship between preparedness and making a successful quit attempt (defined as a self‐report of not smoking as a result of this quit attempt in the last month) was examined. Multivariate logistic regression, controlling for demographic characteristics, was performed to test the effect of preparedness on quit behaviors (any quit attempt after discharge, or successful quit attempt). While not a primary aim of this study, the association between recall of in‐hospital advice and quit behaviors after discharge was also examined using chi square tests and multivariate logistic regression models, controlling for the demographic characteristics as above. Models also tested the effect of preparedness and recall of in‐hospital advice as independent predictors on quit behaviors and whether or not an interaction between preparedness and advice existed. A linear test of trend was also performed on preparedness and advice. All statistical tests were performed using Intercooled Stata 9.0 (Stata Corporation, College Station, TX), with statistical significance defined as P < 0.05.
Results
From February 2006 through July 2007, 86% (2906/3364) of all cardiology inpatients approached were interviewed. Fifteen percent (436/2906) of patients enrolled in the study indicated that they were current smokers. Contemplation Ladder scores were obtained on 95% (415/436) of the current smokers, and 1‐month postdischarge follow‐up telephone surveys were completed in 67% (276/415) of the current smokers. Three attempts were made to contact patients who were lost to follow‐up (Figure 1). The major reasons for inability to contact patients included wrong telephone numbers, disconnected phone lines, or no method to leave a message for the patient (ie, no answering machine). Given that we were only able to complete follow‐up interviews on 276 patients, we conducted our analyses on only this group of patients.
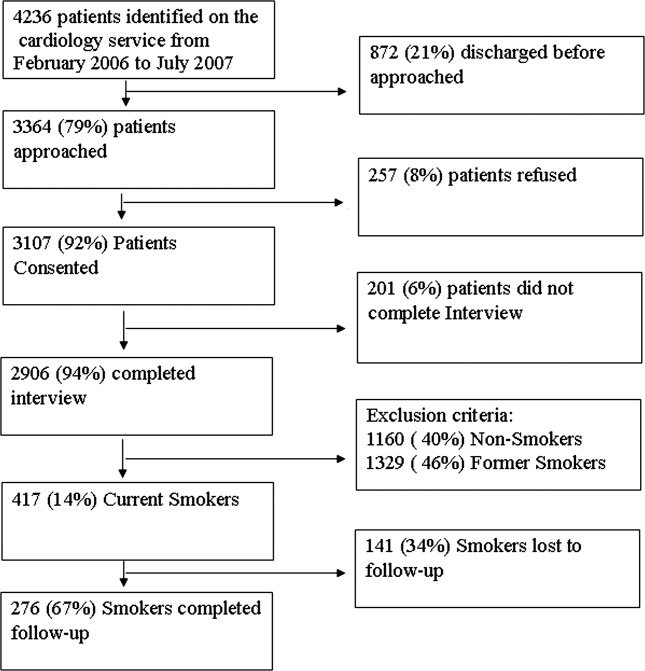
The average age of current smokers in the sample was 55 years (95% confidence interval [CI], 54‐58). Most current smokers were of the African American race (83%; 224/276). More than 65% of smokers had completed high school or higher, and nearly one‐half (46%) had an average household income of $25,000 or less before taxes. The most common admitting diagnoses per chart audit among current inpatient smokers were AMI (31%) and CHF (27%). The vast majority (95%) of hospitalized smokers in this sample were first‐time admissions to the University of Chicago. Table 1 shows the demographic data for current smokers compared to former smokers (those who have quit smoking prior to admission). Current smokers were more likely to be African American, had lower income levels, and were less likely to have completed high school. Additionally, current smokers were more likely to carry a potential diagnosis of AMI or CHF and to be a first‐time admission (Table 1).
| Demographic Variables | Current Smokers (n = 276)* | Nonsmoker (n = 1329)* | P Value |
|---|---|---|---|
| |||
| Male sex | 156 (57) | 705 (53) | 0.22 |
| African American race | 224 (83) | 886 (67) | <0.001 |
| Age (years) | 55.3 | 64.0 | <0.001 |
| Highest completed level of education | 0.02 | ||
| Junior high school or less | 15 (6) | 98 (7) | |
| Some high school | 67 (25) | 230 (17) | |
| High school graduate | 81 (30) | 403 (31) | |
| Some college education | 68 (25) | 313 (24) | |
| College graduate | 19 (7) | 135 (10) | |
| Graduate level education | 11 (4) | 96 (7) | |
| Household income before taxes | 0.001 | ||
| <$2500 | 33 (12) | 79 (6) | |
| $2501‐$15,000 | 66 (24) | 334 (26) | |
| $15,001‐$50,000 | 51 (19) | 311 (24) | |
| 50,001‐$100,000 | 22 (8) | 126 (9) | |
| >$100,001 | 11 (4) | 50 (4) | |
| Did not answer | 88 (33) | 422 (32) | |
| Diagnosis on admission | 0.02 | ||
| AMI | 66 (31) | 269 (24) | |
| CHF | 58 (27) | 287 (25) | |
| Both | 49 (23) | 273 (24) | |
| Neither | 42 (19) | 305 (27) | |
| Admission status | |||
| New admission | 258 (95) | 1,154 (87) | 0.051 |
| Readmission | 14 (5) | 175 (13) | |
Approximately three‐quarters (76%; 210/276) of current smokers were identified as prepared to quit, with a Ladder score 6. There was a wide distribution of Ladder scores, with one‐third (31%; 86/276) of smokers reporting a Ladder score of 8, indicating that they still smoke, but are ready to set a quit date and another 34% (95/276 patients) with Ladder scores of either 6 or 7 also indicating they were planning to quit smoking (Figure 2). A significant portion of smokers (71%; 195/276) reported making a quit attempt after discharge, and 38% of smokers (106/276) self‐reported that their quit attempt was successful (ie, no longer smoking at 1 month post discharge). Note that the quit rate is reduced to 26% (106/415) at 1 month if one conservatively assumes that those who did not take part in follow‐up were relapsers. Among those who did participate in follow‐up, as shown in Figure 3, the most frequently reported (53%; 145/276) method used to quit smoking was cold turkey. Thirteen percent (37/276) of patients reported making a quit attempt using pharmacological therapy (ie, NRT or bupropion) and only 4% (12/276) of patients reported making a quit attempt using the help of a smoking cessation program (Figure 3).
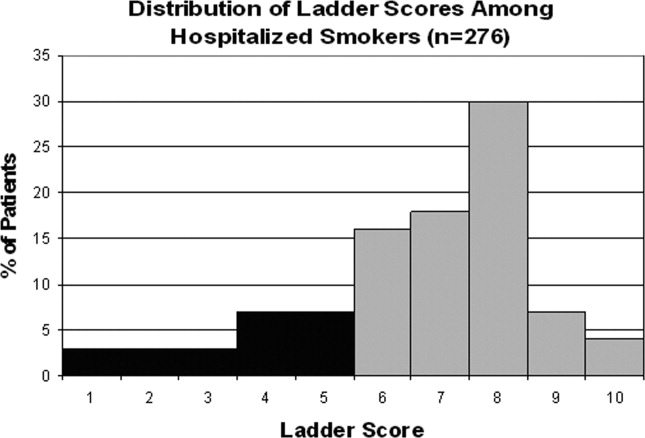

Preparedness was an important predictor of making a quit attempt. Prepared patients (ie, Ladder score 6) were significantly more likely than patients who were less prepared to report making a quit attempt after discharge (163/212 [77%] vs. 32/64 [50%], respectively; P < 0.001). This result remained significant after adjusting for sociodemographic characteristics with a similar effect size (adjusted estimates 76% [95% CI, 75.7‐76.7] prepared vs. 49% [95% CI, 48.5‐49.8]; P < 0.001). These results also remained significant with a similar effect size in analyses using multivariate logistic regression (Table 2). Of those patients who made quit attempts, prepared patients were slightly more likely to report a successful quit attempt (90/163; 55%) than were less‐prepared patients (16/32; 50%), though this was not significant (P = 0.205).
| Statistical test | Quit Behavior | Prepared % (95% CI) | Unprepared % (95% CI) | P Value |
|---|---|---|---|---|
| ||||
| Chi square tests | Any quit attempt made after discharge | 76.9 (71.2‐82.6) | 50.0 (37.8‐62.2) | <0.001 |
| Successful quit attempt at time of follow‐up | 55.0 (45.9‐60.2) | 50.0 (25.4‐58.2) | 0.20 | |
| Multivariate logistic regression* | Any quit attempt made after discharge | 76.2 (75.7‐76.7) | 49.2 (48.5‐49.9) | <0.001 |
In the follow‐up sample, 17% could not remember if they received advice to quit smoking. Among those who were able to recall receiving advice, the majority (78%; 180/230) reported that they received advice from a nurse or physician during hospitalization, compared to 22% who did not recall ever being advised to quit by any healthcare provider during the admission. Patients who reported receiving advice to quit were more likely to report making a quit attempt postdischarge as compared to those that did not recall receiving advice (70% vs. 46%, respectively; P = 0.002). In a multivariate logistic regression, controlling for demographic factors and admitting diagnosis, both preparedness and receipt of in‐hospital advice were independent predictors of making a future quit attempt (odds ratio [OR] = 4.05; 95% CI, 1.91‐8.60; P < 0.001 for preparedness; OR = 3.96; 95% CI, 1.84‐8.54; P < 0.001 for advice). Additionally, there was no significant interaction or synergistic effect between being prepared to quit smoking and receiving in‐hospital advice to quit (OR = 1.24; 95% CI, 0.17‐9.21; P = 0.836) (Figure 4). When analyzing the effects of preparedness and advice on quit attempts, only preparedness to quit remained a significant predictor of a successful quit attempt (OR = 2.93; 95% CI, 1.13‐7.60; P = 0.027 for preparedness; OR = 2.16; 95% CI, 0.85‐5.49; P = 0.10 for advice to quit). As demonstrated in Table 2, a higher percentage of prepared patients made a quit attempt after discharge (76.9% vs. 50%) and had a successful quit attempt and short‐term abstinence (55% prepared patients vs. 50% less prepared patients).
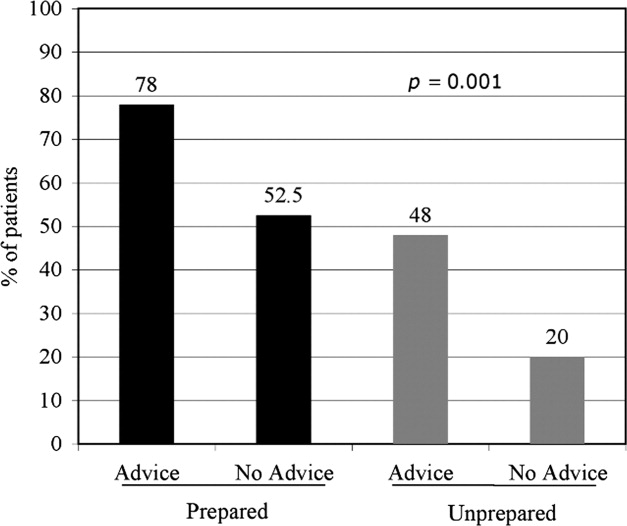
Discussion
This study demonstrated that in a group of hospitalized underserved, and predominantly African American smokers, the majority of patients reported being prepared to quit smoking at the time of hospitalization. Prepared patients were more likely to report making a quit attempt after discharge and more likely to report being successful in their quit attempt than patients who reported being less prepared to quit during their hospitalization. Nevertheless, approximately one‐half of unprepared patients did make a quit attempt 1 month after discharge, demonstrating a desire to quit smoking after hospitalization among this population. However, short‐term success rates in this group were lower than in patients prepared to quit. In addition, preparedness to quit and receipt of in‐hospital advice to quit smoking were both found to be independent predictors of making a quit attempt, with nearly identical ORs; however, only preparedness remained significant after controlling for advice to quit. Last, although the majority of hospitalized cardiac patients were making quit attempts after discharge, most patients reported using the least effective quit methods (ie, cold turkey) rather than more effective and intensive interventions such as counseling in combination with pharmacotherapy.
These findings have important implications for current quality initiatives targeted at promoting smoking cessation among cardiac patients. First, these results highlight the need for evidence‐based methods to be made available to hospitalized smokers who are prepared to quit. Our results are consistent with other studies reporting rare use (5.2%) of NRT in the hospital setting, despite the proven benefit in treating nicotine withdrawal symptoms.17 This is also consistent with data reporting that among nonhospitalized smokers, quitting cold turkey was the most commonly used and least effective cessation method.18 Second, the rate of recall of in‐hospital advice among patients (78%) was generally consistent with those reported to CMS (most recent quarter 95% for AMI and 88% for CHF).19
In addition to receiving advice, preparedness to quit was associated with higher quit attempts, therefore highlighting the importance of assessing level of preparedness in addition to giving advice. The fact that most quit attempts were made using cold turkey and resulted in low short‐term success rates underscores the need to reevaluate the current CMS quality indicator of advice alone for hospitalized smokers. Furthermore, the recently updated 2008 U.S. Public Health guidelines recently recommend, in addition to advice, that all hospitalized smokers be assessed for readiness to change, be assisted in quitting with pharmacotherapy, and be arranged follow‐up for tobacco cessation postdischarge, highlighting the inadequacy of advice alone.4 While it is important to continue to advise all hospitalized smokers to quit, the study findings demonstrate that assessing preparedness may result in targeting more prepared patients with more intensive interventions. Further policy implications include that less prepared patients may need motivational techniques to increase their level of preparedness to quit during hospitalization.
Several limitations are worth mentioning. First, the study included a relatively small sample size drawn from a single urban medical center. The prevalence of current smokers in our sample was 15%, which is lower than many studies looking at cardiology inpatient smokers.3, 20 This limitation of our study may be attributed to the advanced age of the majority of our patients, as compared with other studies, as well as the possibility of socially desirable response bias that many low‐income African American smokers may experience, leaving them less likely to admit to smoking at the time of hospitalization. Second, there was a low follow‐up rate, with 66% of patients undergoing follow‐up postdischarge. While this may raise the concerns of differences between ladder scores in those patients that participated in follow‐up and those that did not, analyses show no significant difference between level of preparedness in these 2 groups (68% prepared in patients who received follow‐up vs. 63% prepared patients in those who did not participate in follow‐up; P = 0.36). Third, follow‐up of quit attempts and receipt of advice were all assessed using self‐report, and, therefore, were limited by lack of verification and lack of assessment for potential recall bias. Fourth, in this pilot study, the follow‐up period was relatively short at 1 month postdischarge. It is likely that rates of successful quit attempts would be lower with longer‐term follow‐up periods, given previous literature demonstrating the difficulty with long‐term abstinence.21 Last, the study was not able to account for potential effects that hospitalization itself may have on preparedness, as patients may be more likely to report being prepared to quit when in the face of a health shock,22 as well as the fact that some patients may demonstrate a socially desirable response bias influenced by hospitalization.
In conclusion, the majority of underserved smokers with cardiac disease reported being prepared to quit smoking and were more likely to self‐report making a quit attempt after discharge. However, the majority of these quit attempts were made via cold turkey, without the support of available evidence‐based methods to quit. It is possible that by directly providing education, access to pharmacotherapy, and counseling options, the utilization rates for more efficacious treatments would increase in cardiac patients who are prepared to quit. While recall of in‐hospital advice was associated with future quit attempts, prepared patients who recalled receiving advice were more likely to make a quit attempt than prepared patients who did not recall receiving advice, as well as unprepared patients. Together, these findings highlight the need to consider a patient's level of preparedness to quit in understanding the success of in‐hospital advice and the importance of making evidence‐based cessation methods available to hospitalized smokers who are prepared to quit. Additionally, identifying patients not prepared to quit may help in providing them with appropriate motivational therapy, to move them along the stages of change, as well as educational information on how to quit once they have decided to do so.
- ,,.Helping hospitalized smokers quit: new directions for treatment and research.J Consult Clin Psychol.1993;61:778–789.
- ,.Smokers who are hospitalized: a window of opportunity for cessation interventions.Prev Med.1992;21:262–269.
- ,,, et al.Predictors of smoking cessation after a myocardial infarction: the role of institutional smoking cessation programs in improving success.Arch Intern Med.2008;168(18):1961–1967.
- Guideline Panel.Clinical Practice Guidelines: Treating Tobacco Use and Dependence.Washington, DC:Public Health Service, U.S. Department of Health and Human Services;2008.
- ,.Stages and processes of self‐change in smoking: toward an integrative model of change.J Consult Clin Psychol.1983;51:390–395.
- ,.The Contemplation Ladder: validation of a measure of readiness to consider smoking cessation.Health Psychol.1991;10(5):360–365.
- ,,,,.Smoking cessation factors among African Americans and Whites.Am J Public Health.1993;83(2):220–226.
- U.S. Department of Health and Human Services.The Health Benefits of Smoking Cessation.Rockville, MD:Office on Smoking and Health, Centers for Chronic Disease Prevention and Health Promotion, Public Health Service,U.S. Department of Health and Human Services,Washington, DC;2000.
- ,,,,.Trends in cigarette smoking in the United States. the changing influence of gender and race.JAMA.1989;261(1):49–55.
- ,,, et al.Effects of physician experience on costs and outcomes on an academic general medicine service: results of a trial of hospitalists.Ann Intern Med.2002;137(11):866–874.
- ,,,.Validation of a telephone version of the Mini‐Mental State Examination.J Am Geriatr Soc.1992;40(7):697–702.
- National Health Information Survey Questionnaire, Sample Adult,Adult Health Behaviors;2004.
- ,,, et al.The Marijuana Ladder: measuring motivation to change marijuana use in incarcerated adolescents.Drug Alcohol Depend.2006;83:42–48.
- ,,,,.Motivation for stopping tobacco use among emergency department patients.Acad Emerg Med.2005;12:568–571.
- Picker‐Commonwealth Survey of Patient‐Centered Care.Health Aff.1991.
- Hospital Quality Initiatives. Centers for Medicare and Medicaid Services (CMS). Available at: http://www.cms.hhs.gov/HospitalQualtiyInits. Accessed April2009.
- ,,, et al.The use of nicotine replacement therapy by hospitalized smokers.Am J Prev Med.1999;17(4):255–259.
- ,,,,.Methods used to quit smoking in the United States: do cessation programs help?JAMA.1990;263(20):2795–2796.
- U.S. Department of Health and Human Services.Hospital Compare.2006 Data Graphs. Available at: http://www.hospitalcompare.hhs.gov. Accessed April2009.
- ,,, et al.Office on Smoking and Health, National Center for Chronic Disease Prevention and Health Promotion, CDC. Cigarette smoking among adults—United States, 2006.MMWR Morb Mortal Wkly Rep.2007;56:1157–1161.
- ,,.Smoking cessation interventions for hospitalized smokers.Arch Intern Med.2008;168(18):1950–1960.
- ,.Health beliefs and smoking patterns in heart patients and their wives: a longitudinal study.Am J Public Health.1977;67:921–930.
Hospitalization may offer a natural opportunity to screen and advise patients on the advantages of quitting smoking due to a variety of reasons, such as the smoke‐free environment, availability of medical personnel, suitability of tailoring information, and the potential to catch a teachable moment.1, 2 Additionally, a recent meta‐analysis suggested that hospital‐based cessation programs and referrals to cardiac rehabilitation result in significantly higher rates of cessation among discharged smokers.3 In 2008, the U.S. Public Health Service Task Force on Clinical Practice Guidelines for Treating Tobacco Use and Dependence in hospitalized smokers recommended listing smoking status on problem lists, evaluating a smoker's preparedness to quit, providing counseling and medications to treat in‐hospital withdrawal symptoms, and arranging discharge follow‐up to help smokers remain abstinent.4 To promote these practices, the Center for Medicaid and Medicare Services (CMS) has made smoking cessation counseling a quality of care indicator for patients hospitalized with congestive heart failure (CHF), acute myocardial infarction (AMI), or pneumonia. This indicator is a critical step in recognizing the importance of smoking cessation counseling in improving mortality and morbidity for these patients.
Despite the importance of promoting smoking cessation among hospitalized patients, few studies have looked at whether or not hospitalized patients are prepared to quit smoking. Ascertaining patients' preparedness to quit smoking is an important first step in understanding a patient's readiness to change their health behaviors because smoking cessation is the culmination of a lengthy process of behavior change.5 Studies of healthy factory workers suggest that smokers who were more prepared to quit smoking had a higher number of previous quit attempts and perceived coworker encouragement.6
Understanding patient preparedness to quit smoking is especially important among African American smokers, who face a disproportionate health burden due to smoking‐related illness. Studies show that African Americans are less likely than other racial groups to engage in formal tobacco cessation interventions and have lower long‐term quit rates, despite a higher desire to quit smoking.5, 79 Understanding preparedness to quit among this particular group of hospitalized patients may be an important first step in identifying those most likely to quit and benefit from tailored, intensive interventions, such as using medications to assist in combination with postdischarge tobacco cessation counseling.
The aim of this study was to characterize the preparedness to quit smoking and to assess quit attempts made, methods used for quitting, and the success of such quit attempts at 1‐month follow‐up in a group comprised of a high proportion of underserved African American hospitalized smokers. In addition, the relationship of hospitalized patients' preparedness to quit and the effect of inpatient advice on the likelihood of subsequent tobacco cessation were examined.
Patients and Methods
The data used for this study were collected for the Cardiology Quality of Care Study, an ongoing prospective study of patients hospitalized on the inpatient cardiology service at the University of Chicago Medical Center. Newly admitted patients were approached by research assistants and consented to the study using a previously described protocol for enrolling hospitalized patients.10 Patients that lacked decisional capacity (score of <17 on the telephone version of the Mini‐Mental Status Exam)11 were excluded. Patients did not receive any scripted intervention during this admission to assist with cessation. The study left cessation counseling and advice to quit up to the discretion of the individual physician caring for the patient in the hospital. The Institutional Review Board at the University of Chicago approved this study.
Inpatient Interview
The inpatient interview is a 60‐item questionnaire taking approximately 15 minutes to administer by trained research assistants. The questionnaire is designed to assess demographic characteristics (race, socioeconomic status, education, sex, and age), smoking habits, and preparedness to quit. Demographics were collected on all consented patients. Seven items focused on cigarette smoking, consistent with questions in the National Health Information Survey.12 Patients were classified as lifetime smokers if they smoked at least 100 cigarettes in their lifetime. To identify current smokers on admission, patients were asked if they now smoke cigarettes some days or everyday. Additionally, smokers were asked if they had made any quit attempts in the past 12 months.
Patients rated their level of preparedness using a modified version of the Biener Abrams Contemplation Ladder. The Contemplation Ladder is an easily‐administered tool represented by a ladder image of rungs with anchor statements developed as an alternative method to the Prochaska and DiClemente Stages of Change.13 The 10‐point scale ranges from 1 (I enjoy smoking and have decided not to quit smoking for my lifetime; I have no interest in quitting) to 10 (I have quit smoking and will never smoke again.) Tobacco users may rank their current level of motivation to quit. A level of 6 (I definitely plan to quit smoking in the next 6 months) or higher is consistent with preparedness to quit. The Contemplation Ladder was validated by Biener and Abrams6 in a work site study which demonstrated that subjects with higher Ladder scores (score 6) were more likely than those with lower Ladder scores (scores < 6) to participate in awareness activities (eg, educational session) and make a quit attempt in 6 months. This instrument is easier to administer than the more well known Transtheoretical Model of Change, given that it is an ordinal scale with clear steps that may be more user‐friendly for both clinicians and patients.6 In a prior study of emergency room patients, an individual's Ladder score was shown to be significantly associated with a patient's reported intention to quit, number of previous quit attempts, perceived coworker encouragement, and socioeconomic status.14
Admission Diagnoses
Chart audit was performed by trained research assistants at the time of the inpatient interview (within 24 hours of admission) to assess whether patients were admitted with the potential diagnoses of AMI, CHF, neither, or both. All were based on the chart documentation of the patients' clinical presentation. This information was used to assess which CMS Quality Indicators applied to cardiology patients, given that smoking cessation is now a quality indicator for patients with AMI or CHF.
Thirty‐day Follow‐up Telephone Survey
Trained research assistants interviewed patients by telephone at approximately 1 month postdischarge. The follow‐up telephone survey included routine questions concerning follow‐up appointments, readmissions, emergency room visits, and patient satisfaction.15, 10 An additional 5 questions related to smoking cessation were added for this study. Questions were developed using the CMS quality indicators16 or were taken from the National Health Information Survey.12 Patients were asked to self‐report quit attempts made postdischarge, whether or not these quit attempts were associated with success (self‐reported abstinence at the time of follow‐up), and what methods were used to quit (ie, nicotine replacement therapy [NRT], other pharmacotherapy, quit line, pamphlet, counseling group, or cold turkey.) Patients were also asked if they recalled receiving advice to quit during their hospitalization from either a nurse or physician.
Data Analysis
Descriptive statistics were used to summarize Contemplation Ladder scores and types of quit methods used. Chi square tests were used to assess the effect of preparedness (Ladder score 6) on quit behaviors. The main quit behavior was any self‐reported quit attempt made within 1 month after discharge. Additionally, the relationship between preparedness and making a successful quit attempt (defined as a self‐report of not smoking as a result of this quit attempt in the last month) was examined. Multivariate logistic regression, controlling for demographic characteristics, was performed to test the effect of preparedness on quit behaviors (any quit attempt after discharge, or successful quit attempt). While not a primary aim of this study, the association between recall of in‐hospital advice and quit behaviors after discharge was also examined using chi square tests and multivariate logistic regression models, controlling for the demographic characteristics as above. Models also tested the effect of preparedness and recall of in‐hospital advice as independent predictors on quit behaviors and whether or not an interaction between preparedness and advice existed. A linear test of trend was also performed on preparedness and advice. All statistical tests were performed using Intercooled Stata 9.0 (Stata Corporation, College Station, TX), with statistical significance defined as P < 0.05.
Results
From February 2006 through July 2007, 86% (2906/3364) of all cardiology inpatients approached were interviewed. Fifteen percent (436/2906) of patients enrolled in the study indicated that they were current smokers. Contemplation Ladder scores were obtained on 95% (415/436) of the current smokers, and 1‐month postdischarge follow‐up telephone surveys were completed in 67% (276/415) of the current smokers. Three attempts were made to contact patients who were lost to follow‐up (Figure 1). The major reasons for inability to contact patients included wrong telephone numbers, disconnected phone lines, or no method to leave a message for the patient (ie, no answering machine). Given that we were only able to complete follow‐up interviews on 276 patients, we conducted our analyses on only this group of patients.
The average age of current smokers in the sample was 55 years (95% confidence interval [CI], 54‐58). Most current smokers were of the African American race (83%; 224/276). More than 65% of smokers had completed high school or higher, and nearly one‐half (46%) had an average household income of $25,000 or less before taxes. The most common admitting diagnoses per chart audit among current inpatient smokers were AMI (31%) and CHF (27%). The vast majority (95%) of hospitalized smokers in this sample were first‐time admissions to the University of Chicago. Table 1 shows the demographic data for current smokers compared to former smokers (those who have quit smoking prior to admission). Current smokers were more likely to be African American, had lower income levels, and were less likely to have completed high school. Additionally, current smokers were more likely to carry a potential diagnosis of AMI or CHF and to be a first‐time admission (Table 1).
| Demographic Variables | Current Smokers (n = 276)* | Nonsmoker (n = 1329)* | P Value |
|---|---|---|---|
| |||
| Male sex | 156 (57) | 705 (53) | 0.22 |
| African American race | 224 (83) | 886 (67) | <0.001 |
| Age (years) | 55.3 | 64.0 | <0.001 |
| Highest completed level of education | 0.02 | ||
| Junior high school or less | 15 (6) | 98 (7) | |
| Some high school | 67 (25) | 230 (17) | |
| High school graduate | 81 (30) | 403 (31) | |
| Some college education | 68 (25) | 313 (24) | |
| College graduate | 19 (7) | 135 (10) | |
| Graduate level education | 11 (4) | 96 (7) | |
| Household income before taxes | 0.001 | ||
| <$2500 | 33 (12) | 79 (6) | |
| $2501‐$15,000 | 66 (24) | 334 (26) | |
| $15,001‐$50,000 | 51 (19) | 311 (24) | |
| 50,001‐$100,000 | 22 (8) | 126 (9) | |
| >$100,001 | 11 (4) | 50 (4) | |
| Did not answer | 88 (33) | 422 (32) | |
| Diagnosis on admission | 0.02 | ||
| AMI | 66 (31) | 269 (24) | |
| CHF | 58 (27) | 287 (25) | |
| Both | 49 (23) | 273 (24) | |
| Neither | 42 (19) | 305 (27) | |
| Admission status | |||
| New admission | 258 (95) | 1,154 (87) | 0.051 |
| Readmission | 14 (5) | 175 (13) | |
Approximately three‐quarters (76%; 210/276) of current smokers were identified as prepared to quit, with a Ladder score 6. There was a wide distribution of Ladder scores, with one‐third (31%; 86/276) of smokers reporting a Ladder score of 8, indicating that they still smoke, but are ready to set a quit date and another 34% (95/276 patients) with Ladder scores of either 6 or 7 also indicating they were planning to quit smoking (Figure 2). A significant portion of smokers (71%; 195/276) reported making a quit attempt after discharge, and 38% of smokers (106/276) self‐reported that their quit attempt was successful (ie, no longer smoking at 1 month post discharge). Note that the quit rate is reduced to 26% (106/415) at 1 month if one conservatively assumes that those who did not take part in follow‐up were relapsers. Among those who did participate in follow‐up, as shown in Figure 3, the most frequently reported (53%; 145/276) method used to quit smoking was cold turkey. Thirteen percent (37/276) of patients reported making a quit attempt using pharmacological therapy (ie, NRT or bupropion) and only 4% (12/276) of patients reported making a quit attempt using the help of a smoking cessation program (Figure 3).
Preparedness was an important predictor of making a quit attempt. Prepared patients (ie, Ladder score 6) were significantly more likely than patients who were less prepared to report making a quit attempt after discharge (163/212 [77%] vs. 32/64 [50%], respectively; P < 0.001). This result remained significant after adjusting for sociodemographic characteristics with a similar effect size (adjusted estimates 76% [95% CI, 75.7‐76.7] prepared vs. 49% [95% CI, 48.5‐49.8]; P < 0.001). These results also remained significant with a similar effect size in analyses using multivariate logistic regression (Table 2). Of those patients who made quit attempts, prepared patients were slightly more likely to report a successful quit attempt (90/163; 55%) than were less‐prepared patients (16/32; 50%), though this was not significant (P = 0.205).
| Statistical test | Quit Behavior | Prepared % (95% CI) | Unprepared % (95% CI) | P Value |
|---|---|---|---|---|
| ||||
| Chi square tests | Any quit attempt made after discharge | 76.9 (71.2‐82.6) | 50.0 (37.8‐62.2) | <0.001 |
| Successful quit attempt at time of follow‐up | 55.0 (45.9‐60.2) | 50.0 (25.4‐58.2) | 0.20 | |
| Multivariate logistic regression* | Any quit attempt made after discharge | 76.2 (75.7‐76.7) | 49.2 (48.5‐49.9) | <0.001 |
In the follow‐up sample, 17% could not remember if they received advice to quit smoking. Among those who were able to recall receiving advice, the majority (78%; 180/230) reported that they received advice from a nurse or physician during hospitalization, compared to 22% who did not recall ever being advised to quit by any healthcare provider during the admission. Patients who reported receiving advice to quit were more likely to report making a quit attempt postdischarge as compared to those that did not recall receiving advice (70% vs. 46%, respectively; P = 0.002). In a multivariate logistic regression, controlling for demographic factors and admitting diagnosis, both preparedness and receipt of in‐hospital advice were independent predictors of making a future quit attempt (odds ratio [OR] = 4.05; 95% CI, 1.91‐8.60; P < 0.001 for preparedness; OR = 3.96; 95% CI, 1.84‐8.54; P < 0.001 for advice). Additionally, there was no significant interaction or synergistic effect between being prepared to quit smoking and receiving in‐hospital advice to quit (OR = 1.24; 95% CI, 0.17‐9.21; P = 0.836) (Figure 4). When analyzing the effects of preparedness and advice on quit attempts, only preparedness to quit remained a significant predictor of a successful quit attempt (OR = 2.93; 95% CI, 1.13‐7.60; P = 0.027 for preparedness; OR = 2.16; 95% CI, 0.85‐5.49; P = 0.10 for advice to quit). As demonstrated in Table 2, a higher percentage of prepared patients made a quit attempt after discharge (76.9% vs. 50%) and had a successful quit attempt and short‐term abstinence (55% prepared patients vs. 50% less prepared patients).
Discussion
This study demonstrated that in a group of hospitalized underserved, and predominantly African American smokers, the majority of patients reported being prepared to quit smoking at the time of hospitalization. Prepared patients were more likely to report making a quit attempt after discharge and more likely to report being successful in their quit attempt than patients who reported being less prepared to quit during their hospitalization. Nevertheless, approximately one‐half of unprepared patients did make a quit attempt 1 month after discharge, demonstrating a desire to quit smoking after hospitalization among this population. However, short‐term success rates in this group were lower than in patients prepared to quit. In addition, preparedness to quit and receipt of in‐hospital advice to quit smoking were both found to be independent predictors of making a quit attempt, with nearly identical ORs; however, only preparedness remained significant after controlling for advice to quit. Last, although the majority of hospitalized cardiac patients were making quit attempts after discharge, most patients reported using the least effective quit methods (ie, cold turkey) rather than more effective and intensive interventions such as counseling in combination with pharmacotherapy.
These findings have important implications for current quality initiatives targeted at promoting smoking cessation among cardiac patients. First, these results highlight the need for evidence‐based methods to be made available to hospitalized smokers who are prepared to quit. Our results are consistent with other studies reporting rare use (5.2%) of NRT in the hospital setting, despite the proven benefit in treating nicotine withdrawal symptoms.17 This is also consistent with data reporting that among nonhospitalized smokers, quitting cold turkey was the most commonly used and least effective cessation method.18 Second, the rate of recall of in‐hospital advice among patients (78%) was generally consistent with those reported to CMS (most recent quarter 95% for AMI and 88% for CHF).19
In addition to receiving advice, preparedness to quit was associated with higher quit attempts, therefore highlighting the importance of assessing level of preparedness in addition to giving advice. The fact that most quit attempts were made using cold turkey and resulted in low short‐term success rates underscores the need to reevaluate the current CMS quality indicator of advice alone for hospitalized smokers. Furthermore, the recently updated 2008 U.S. Public Health guidelines recently recommend, in addition to advice, that all hospitalized smokers be assessed for readiness to change, be assisted in quitting with pharmacotherapy, and be arranged follow‐up for tobacco cessation postdischarge, highlighting the inadequacy of advice alone.4 While it is important to continue to advise all hospitalized smokers to quit, the study findings demonstrate that assessing preparedness may result in targeting more prepared patients with more intensive interventions. Further policy implications include that less prepared patients may need motivational techniques to increase their level of preparedness to quit during hospitalization.
Several limitations are worth mentioning. First, the study included a relatively small sample size drawn from a single urban medical center. The prevalence of current smokers in our sample was 15%, which is lower than many studies looking at cardiology inpatient smokers.3, 20 This limitation of our study may be attributed to the advanced age of the majority of our patients, as compared with other studies, as well as the possibility of socially desirable response bias that many low‐income African American smokers may experience, leaving them less likely to admit to smoking at the time of hospitalization. Second, there was a low follow‐up rate, with 66% of patients undergoing follow‐up postdischarge. While this may raise the concerns of differences between ladder scores in those patients that participated in follow‐up and those that did not, analyses show no significant difference between level of preparedness in these 2 groups (68% prepared in patients who received follow‐up vs. 63% prepared patients in those who did not participate in follow‐up; P = 0.36). Third, follow‐up of quit attempts and receipt of advice were all assessed using self‐report, and, therefore, were limited by lack of verification and lack of assessment for potential recall bias. Fourth, in this pilot study, the follow‐up period was relatively short at 1 month postdischarge. It is likely that rates of successful quit attempts would be lower with longer‐term follow‐up periods, given previous literature demonstrating the difficulty with long‐term abstinence.21 Last, the study was not able to account for potential effects that hospitalization itself may have on preparedness, as patients may be more likely to report being prepared to quit when in the face of a health shock,22 as well as the fact that some patients may demonstrate a socially desirable response bias influenced by hospitalization.
In conclusion, the majority of underserved smokers with cardiac disease reported being prepared to quit smoking and were more likely to self‐report making a quit attempt after discharge. However, the majority of these quit attempts were made via cold turkey, without the support of available evidence‐based methods to quit. It is possible that by directly providing education, access to pharmacotherapy, and counseling options, the utilization rates for more efficacious treatments would increase in cardiac patients who are prepared to quit. While recall of in‐hospital advice was associated with future quit attempts, prepared patients who recalled receiving advice were more likely to make a quit attempt than prepared patients who did not recall receiving advice, as well as unprepared patients. Together, these findings highlight the need to consider a patient's level of preparedness to quit in understanding the success of in‐hospital advice and the importance of making evidence‐based cessation methods available to hospitalized smokers who are prepared to quit. Additionally, identifying patients not prepared to quit may help in providing them with appropriate motivational therapy, to move them along the stages of change, as well as educational information on how to quit once they have decided to do so.
- ,,.Helping hospitalized smokers quit: new directions for treatment and research.J Consult Clin Psychol.1993;61:778–789.
- ,.Smokers who are hospitalized: a window of opportunity for cessation interventions.Prev Med.1992;21:262–269.
- ,,, et al.Predictors of smoking cessation after a myocardial infarction: the role of institutional smoking cessation programs in improving success.Arch Intern Med.2008;168(18):1961–1967.
- Guideline Panel.Clinical Practice Guidelines: Treating Tobacco Use and Dependence.Washington, DC:Public Health Service, U.S. Department of Health and Human Services;2008.
- ,.Stages and processes of self‐change in smoking: toward an integrative model of change.J Consult Clin Psychol.1983;51:390–395.
- ,.The Contemplation Ladder: validation of a measure of readiness to consider smoking cessation.Health Psychol.1991;10(5):360–365.
- ,,,,.Smoking cessation factors among African Americans and Whites.Am J Public Health.1993;83(2):220–226.
- U.S. Department of Health and Human Services.The Health Benefits of Smoking Cessation.Rockville, MD:Office on Smoking and Health, Centers for Chronic Disease Prevention and Health Promotion, Public Health Service,U.S. Department of Health and Human Services,Washington, DC;2000.
- ,,,,.Trends in cigarette smoking in the United States. the changing influence of gender and race.JAMA.1989;261(1):49–55.
- ,,, et al.Effects of physician experience on costs and outcomes on an academic general medicine service: results of a trial of hospitalists.Ann Intern Med.2002;137(11):866–874.
- ,,,.Validation of a telephone version of the Mini‐Mental State Examination.J Am Geriatr Soc.1992;40(7):697–702.
- National Health Information Survey Questionnaire, Sample Adult,Adult Health Behaviors;2004.
- ,,, et al.The Marijuana Ladder: measuring motivation to change marijuana use in incarcerated adolescents.Drug Alcohol Depend.2006;83:42–48.
- ,,,,.Motivation for stopping tobacco use among emergency department patients.Acad Emerg Med.2005;12:568–571.
- Picker‐Commonwealth Survey of Patient‐Centered Care.Health Aff.1991.
- Hospital Quality Initiatives. Centers for Medicare and Medicaid Services (CMS). Available at: http://www.cms.hhs.gov/HospitalQualtiyInits. Accessed April2009.
- ,,, et al.The use of nicotine replacement therapy by hospitalized smokers.Am J Prev Med.1999;17(4):255–259.
- ,,,,.Methods used to quit smoking in the United States: do cessation programs help?JAMA.1990;263(20):2795–2796.
- U.S. Department of Health and Human Services.Hospital Compare.2006 Data Graphs. Available at: http://www.hospitalcompare.hhs.gov. Accessed April2009.
- ,,, et al.Office on Smoking and Health, National Center for Chronic Disease Prevention and Health Promotion, CDC. Cigarette smoking among adults—United States, 2006.MMWR Morb Mortal Wkly Rep.2007;56:1157–1161.
- ,,.Smoking cessation interventions for hospitalized smokers.Arch Intern Med.2008;168(18):1950–1960.
- ,.Health beliefs and smoking patterns in heart patients and their wives: a longitudinal study.Am J Public Health.1977;67:921–930.
Copyright © 2010 Society of Hospital Medicine
