User login
Association Between Postdischarge Emergency Department Visitation and Readmission Rates
Hospital readmissions for acute myocardial infarction (AMI), heart failure, and pneumonia have become central to quality-measurement efforts by the Centers for Medicare & Medicaid Services (CMS), which seek to improve hospital care transitions through public reporting and payment programs.1 Most current measures are limited to readmissions that require inpatient hospitalization and do not capture return visits to the emergency department (ED) that do not result in readmission but rather ED discharge. These visits may reflect important needs for acute, unscheduled care during the vulnerable posthospitalization period.2-5 While previous research has suggested that nearly 10% of patients may return to the ED following hospital discharge without readmission, the characteristics of these visits among Medicare beneficiaries and the implications for national care-coordination quality-measurement initiatives have not been explored.6,7
As the locus of acute outpatient care and the primary portal of hospital admissions and readmissions, ED visits following hospital discharge may convey meaningful information about posthospitalization care transitions.8,9 In addition, recent reviews and perspectives have highlighted the role of ED care-coordination services as interventions to reduce inpatient hospitalizations and improve care transitions,10,11 yet no empirical studies have evaluated the relationship between these unique care-coordination opportunities in the ED and care-coordination outcomes, such as hospital readmissions. As policymakers seek to develop accountability measures that capture the totality of acute, unscheduled visits following hospital discharge, describing the relationship between ED visits and readmissions will be essential to providers for benchmarking and to policymakers and payers seeking to reduce the total cost of care.12,13
Accordingly, we sought to characterize the frequency, diagnoses, and hospital-level variation in treat-and-discharge ED visitation following hospital discharge for 3 conditions for which hospital readmission is publicly reported by the CMS: AMI, heart failure, and pneumonia. We also sought to evaluate the relationship between hospital-level ED visitation following hospital discharge and publicly reported, risk-standardized readmission rates (RSRRs).
METHODS
Study Design
This study was a cross-sectional analysis of Medicare beneficiaries discharged alive following hospitalization for AMI, heart failure, and pneumonia between July 2011 and June 2012.
Selection of Participants
We used Medicare Standard Analytic Files to identify inpatient hospitalizations for each disease cohort based on principal discharge diagnoses. Each condition-specific cohort was constructed to be consistent with the CMS’s readmission measures using International Classification of Diseases, 9th Revision-Clinical Modification codes to identify AMI, heart failure, and pneumonia discharges.1 We included only patients who were enrolled in fee-for-service (FFS) Medicare parts A and B for 12 months prior to their index hospitalization to maximize the capture of diagnoses for risk adjustment. Each cohort included only patients who were discharged alive while maintaining FFS coverage for at least 30 days following hospital discharge to minimize bias in outcome ascertainment. We excluded patients who were discharged against medical advice. All contiguous admissions that were identified in a transfer chain were considered to be a single admission. Hospitals with fewer than 25 condition-specific index hospital admissions were excluded from this analysis for consistency with publicly reported measures.1
Measurements
Outcomes
We describe hospital-level, postdischarge ED visitation as the risk-standardized postdischarge ED visit rate. The general construct of this measure is consistent with those of prior studies that define postdischarge ED visitation as the proportion of index admissions followed by a treat-and-discharge ED visit without hospital readmission2,3; however, this outcome also incorporates a risk-standardization model with covariates that are identical to the risk-standardization approach that is used for readmission measurement.
We describe hospital-level readmission by calculating RSRRs consistent with CMS readmission measures, which are endorsed by the National Quality Forum and used for public reporting.15-17 Detailed technical documentation, including the SAS code used to replicate hospital-level measures of readmission, are available publicly through the CMS QualityNet portal.18
We calculated risk-standardized postdischarge ED visit rates and RSRRs as the ratio of the predicted number of postdischarge ED visits or readmissions for a hospital given its observed case mix to the expected number of postdischarge ED visits or readmissions based on the nation’s performance with that hospital’s case mix, respectively. This approach estimates a distinct risk-standardized postdischarge ED visit rate and RSRR for each hospital using hierarchical generalized linear models (HGLMs) and using a logit link with a first-level adjustment for age, sex, 29 clinical covariates for AMI, 35 clinical covariates for heart failure, and 38 clinical covariates for pneumonia. Each clinical covariate is identified based on inpatient and outpatient claims during the 12 months prior to the index hospitalization. The second level of the HGLM includes a random hospital-level intercept. This approach to measuring hospital readmissions accounts for the correlated nature of observed readmission rates within a hospital and reflects the assumption that after adjustment for patient characteristics and sampling variability, the remaining variation in postdischarge ED visit rates or readmission rates reflects hospital quality.
Analysis
In order to characterize treat-and-discharge postdischarge ED visits, we first described the clinical conditions that were evaluated during the first postdischarge ED visit. Based on the principal discharge diagnosis, ED visits were grouped into clinically meaningful categories using the Agency for Healthcare Research and Quality Clinical Classifications Software (CCS).19 We also report hospital-level variation in risk-standardized postdischarge ED visit rates for AMI, heart failure, and pneumonia.
Next, we examined the relationship between hospital characteristics and risk-standardized postdischarge ED visit rates. We linked hospital characteristics from the American Hospital Association (AHA) Annual Survey to the study dataset, including the following: safety-net status, teaching status, and urban or rural status. Consistent with prior work, hospital safety-net status was defined as a hospital Medicaid caseload greater than 1 standard deviation above the mean Medicaid caseload in the hospital’s state. Approximately 94% of the hospitals included in the 3 condition cohorts in the dataset had complete data in the 2011 AHA Annual Survey to be included in this analysis.
We evaluated the relationship between postdischarge ED visit rates and hospital readmission rates in 2 ways. First, we calculated Spearman rank correlation coefficients between hospital-level, risk-standardized postdischarge ED visit rates and RSRRs. Second, we calculated hospital-level variation in RSRRs based on the strata of risk-standardized postdischarge ED visit rates. Given the normal distribution of postdischarge ED visit rates, we grouped hospitals by quartile of postdischarge ED visit rates and 1 group for hospitals with no postdischarge ED visits.
Based on preliminary analyses indicating a relationship between hospital size, measured by condition-specific index hospitalization volume, and postdischarge treat-and-discharge ED visit rates, all descriptive statistics and correlations reported are weighted by the volume of condition-specific index hospitalizations. The study was approved by the Yale University Human Research Protection Program. All analyses were conducted using SAS 9.1 (SAS Institute Inc, Cary, NC). The analytic plan and results reported in this work are in compliance with the Strengthening the Reporting of Observational Studies in Epidemiology checklist.20
RESULTS
During the 1-year study period, we included a total of 157,035 patients who were hospitalized at 1656 hospitals for AMI, 391,209 at 3044 hospitals for heart failure, and 342,376 at 3484 hospitals for pneumonia. Details of study cohort creation are available in supplementary Table 1. After hospitalization for AMI, 14,714 patients experienced a postdischarge ED visit (8.4%) and 27,214 an inpatient readmissions (17.3%) within 30 days of discharge; 31,621 (7.6%) and 88,106 (22.5%) patients after hospitalization for heart failure and 26,681 (7.4%) and 59,352 (17.3%) patients after hospitalization for pneumonia experienced a postdischarge ED visit and an inpatient readmission within 30 days of discharge, respectively.
Postdischarge ED visits were for a wide variety of conditions, with the top 10 CCS categories comprising 44% of postdischarge ED visits following AMI hospitalizations, 44% of following heart failure hospitalizations, and 41% following pneumonia hospitalizations (supplementary Table 2). The first postdischarge ED visit was rarely for the same condition as the index hospitalization in the AMI cohort (224 visits; 1.5%) as well as the pneumonia cohort (1401 visits; 5.3%). Among patients who were originally admitted for heart failure, 10.6% of the first postdischarge ED visits were also for congestive heart failure.
We found wide hospital-level variation in postdischarge ED visit rates for each condition: AMI (median: 8.3%; 5th and 95th percentile: 2.8%-14.3%), heart failure (median: 7.3%; 5th and 95th percentile: 3.0%-13.3%), and pneumonia (median: 7.1%; 5th and 95th percentile: 2.4%-13.2%; supplementary Table 3). The variation persisted after accounting for hospital case mix, as evidenced in the supplementary Figure, which describes hospital variation in risk-standardized postdischarge ED visit rates. This variation was statistically significant (P < .001), as demonstrated by the isolated relationship between the random effect and the outcome (AMI: random effect estimate 0.0849 [95% confidence interval (CI), 0.0832 to 0.0866]; heart failure: random effect estimate 0.0796 [95% CI, 0.0784 to 0.0809]; pneumonia: random effect estimate 0.0753 [95% CI, 0.0741 to 0.0764]).
Across all 3 conditions, hospitals located in rural areas had significantly higher risk-standardized postdischarge ED visit rates than hospitals located in urban areas (10.1% vs 8.6% for AMI, 8.4% vs 7.5% for heart failure, and 8.0% vs 7.4% for pneumonia). In comparison to teaching hospitals, nonteaching hospitals had significantly higher risk-standardized postdischarge ED visit rates following hospital discharge for pneumonia (7.6% vs 7.1%). Safety-net hospitals also had higher risk-standardized postdischarge ED visitation rates following discharge for heart failure (8.4% vs 7.7%) and pneumonia (7.7% vs 7.3%). Risk-standardized postdischarge ED visit rates were higher in publicly owned hospitals than in nonprofit or privately owned hospitals for heart failure (8.0% vs 7.5% in nonprofit hospitals or 7.5% in private hospitals) and pneumonia (7.7% vs 7.4% in nonprofit hospitals and 7.3% in private hospitals; Table).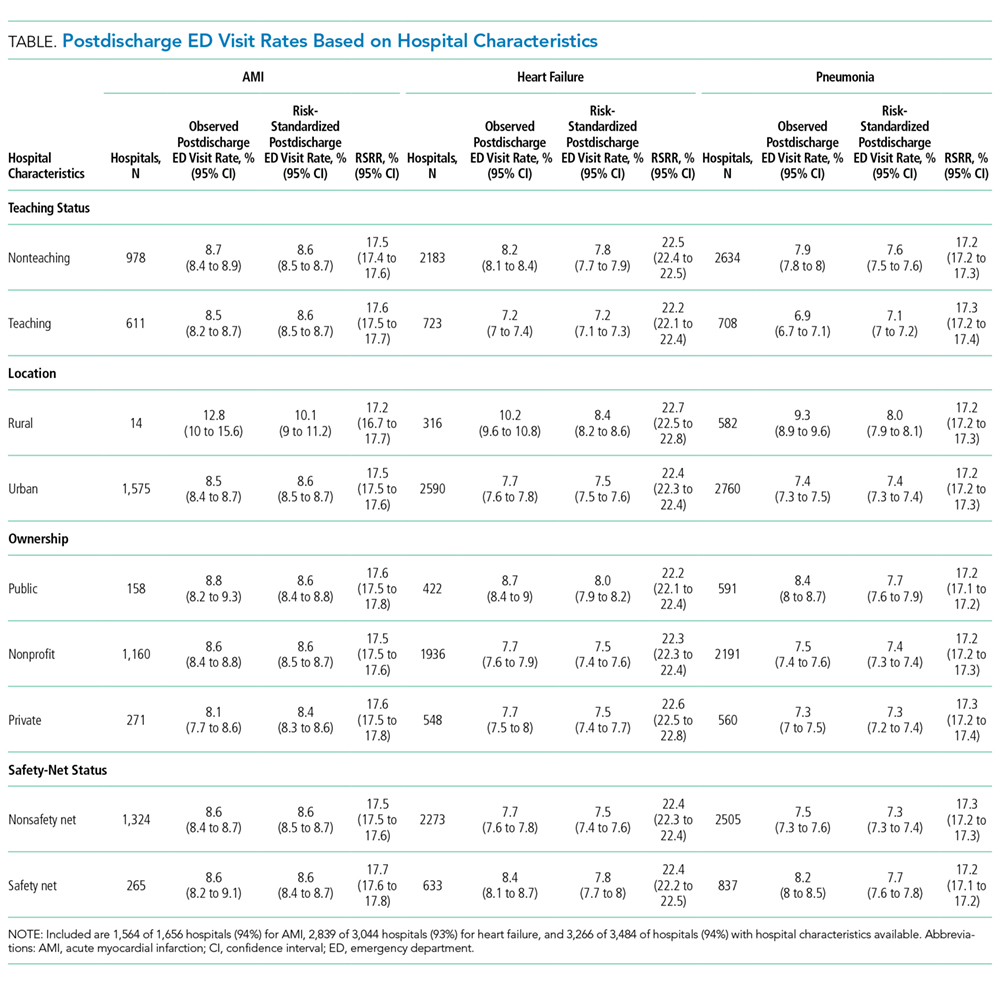
Among hospitals with RSRRs that were publicly reported by CMS, we found a moderate inverse correlation between risk-standardized postdischarge ED visit rates and hospital RSRRs for each condition: AMI (r = −0.23; 95% CI, −0.29 to −0.19), heart failure (r = −0.29; 95% CI, −0.34 to −0.27), and pneumonia (r = −0.18; 95% CI, −0.22 to −0.15; Figure).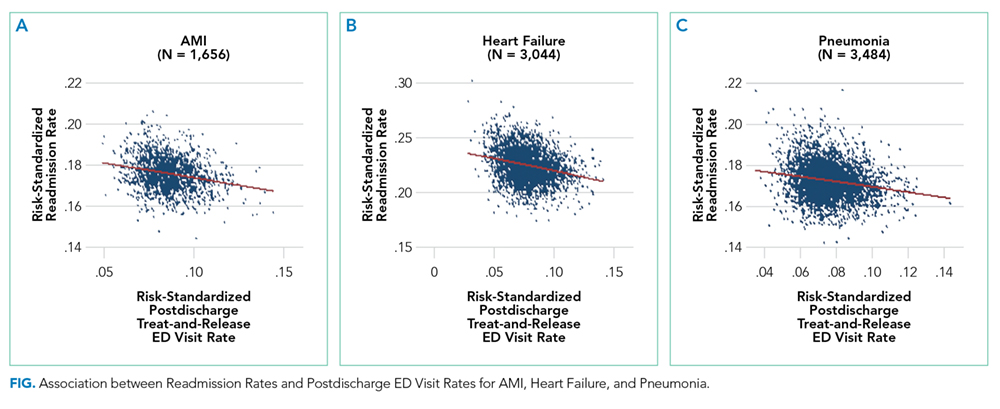
DISCUSSION
Across a national cohort of Medicare beneficiaries, we found frequent treat-and-discharge ED utilization following hospital discharge for AMI, heart failure, and pneumonia, suggesting that publicly reported readmission measures are capturing only a portion of postdischarge acute-care use. Our findings confirm prior work describing a 30-day postdischarge ED visit rate of 8% to 9% among Medicare beneficiaries for all hospitalizations in several states.3,6
We also described substantial hospital-level variation in risk-standardized ED postdischarge rates. Prior work by Vashi et al.3 demonstrated substantial variation in observed postdischarge ED visit rates and inpatient readmissions following hospital discharge between clinical conditions in a population-level study. Our work extends upon this by demonstrating hospital-level variation for 3 conditions of high volume and substantial policy importance after accounting for differences in hospital case mix. Interestingly, our work also found similar rates of postdischarge ED treat-and-discharge visitation as recent work by Sabbatini et al.23 analyzing an all-payer, adult population with any clinical condition. Taken together, these studies show the substantial volume of postdischarge acute-care utilization in the ED not captured by existing readmission measures.
We found several hospital characteristics of importance in describing variation in postdischarge ED visitation rates. Notably, hospitals located in rural areas and safety-net hospitals demonstrated higher postdischarge ED visitation rates. This may reflect a higher use of the ED as an acute, unscheduled care access point in rural communities without access to alternative acute diagnostic and treatment services.24 Similarly, safety-net hospitals may be more likely to provide unscheduled care for patients with poor access to primary care in the ED setting. Yet, consistent with prior work, our results also indicate that these differences do not result in different readmission rates.25 Regarding hospital teaching status, unlike prior work suggesting that teaching hospitals care for more safety-net Medicare beneficiaries,26 our work found opposite patterns of postdischarge ED visitation between hospital teaching and safety-net status following pneumonia hospitalization. This may reflect differences in the organization of acute care as patients with limited access to unscheduled primary and specialty care in safety-net communities utilize the ED, whereas patients in teaching-hospital communities may be able to access hospital-based clinics for care.
Contrary to the expectations of many clinicians and policymakers, we found an inverse relationship between postdischarge ED visit rates and readmission rates. While the cross-sectional design of our study cannot provide a causal explanation, these findings merit policy attention and future exploration of several hypotheses. One possible explanation for this finding is that hospitals with high postdischarge ED visit rates provide care in communities in which acute, unscheduled care is consolidated to the ED setting and thereby permits the ED to serve a gatekeeper function for scarce inpatient resources. This hypothesis may also be supported by recent interventions demonstrating that the use of ED care coordination and geriatric ED services at higher-volume EDs can reduce hospitalizations. Also, hospitals with greater ED capacity may have easier ED access and may be able to see patients earlier in their disease courses post discharge or more frequently in the ED for follow-up, therefore increasing ED visits but avoiding rehospitalization. Another possible explanation is that hospitals with lower postdischarge ED visit rates may also have a lower propensity to admit patients. Because our definition of postdischarge ED visitation did not include ED visits that result in hospitalization, hospitals with a lower propensity to admit from the ED may therefore appear to have higher ED visit rates. This explanation may be further supported by our finding that many postdischarge ED visits are for conditions that are associated with discretionary hospitalization in the ED.27 A third explanation for this finding may be that poor access to outpatient care outside the hospital setting results in higher postdischarge ED visit rates without increasing the acuity of these revisits or increasing readmission rates28; however, given the validated, risk-standardized approach to readmission measurement, this is unlikely. This is also unlikely given recent work by Sabbatini et al.23 demonstrating substantial acuity among patients who return to the ED following hospital discharge. Future work should seek to evaluate the relationship between the availability of ED care-coordination services and the specific ED, hospital, and community care-coordination activities undertaken in the ED following hospital discharge to reduce readmission rates.
This work should be interpreted within the confines of its design. First, it is possible that some of the variation detected in postdischarge ED visit rates is mediated by hospital-level variation in postdischarge observation visits that are not captured in this outcome. However, in previous work, we have demonstrated that almost one-third of hospitals have no postdischarge observation stays and that most postdischarge observation stays are for more than 24 hours, which is unlikely to reflect the intensity of care of postdischarge ED visits.27 Second, our analyses were limited to Medicare FFS beneficiaries, which may limit the generalizability of this work to other patient populations. However, this dataset did include a national cohort of Medicare beneficiaries that is identical to those included in publicly reported CMS readmission measures; therefore, these results have substantial policy relevance. Third, this work was limited to 3 conditions of high illness severity of policy focus, and future work applying similar analyses to less severe conditions may find different degrees of hospital-level variation in postdischarge outcomes that are amenable to quality improvement. Finally, we assessed the rate of treat-and-discharge ED visits only after hospital discharge; this understates the frequency of ED visits since repeat ED visits and ED visits resulting in rehospitalization are not included. However, our definition was designed to mirror the definition used to assess hospital readmissions for policy purposes and is a conservative approach.
In summary, ED visits following hospital discharge are common, as Medicare beneficiaries have 1 treat-and-discharge ED visit for every 2 readmissions within 30 days of hospital discharge. Postdischarge ED visits occur for a wide variety of conditions, with wide risk-standardized, hospital-level variation. Hospitals with the highest risk-standardized postdischarge ED visitation rates demonstrated lower RSRRs, suggesting that policymakers and researchers should further examine the role of the hospital-based ED in providing access to acute care and supporting care transitions for the vulnerable Medicare population.
Disclosure
Dr. Venkatesh received contract support from the CMS, an agency of the U.S. Department of Health & Human Services, and grant support from the Emergency Medicine Foundation’s Health Policy Research Scholar Award during the conduct of the study; and Dr. Wang, Mr. Wang, Ms. Altaf, Dr. Bernheim, and Dr. Horwitz received contract support from the CMS, an agency of the U.S. Department of Health & Human Services, during the conduct of the study.
1. Dorsey KB GJ, Desai N, Lindenauer P, et al. 2015 Condition-Specific Measures Updates and Specifications Report Hospital-Level 30-Day Risk-Standardized Readmission Measures: AMI-Version 8.0, HF-Version 8.0, Pneumonia-Version 8.0, COPD-Version 4.0, and Stroke-Version 4.0. 2015. https://www.qualitynet.org/dcs/BlobServer?blobkey=id&blobnocache=true&blobwhere=1228890435217&blobheader=multipart%2Foctet-stream&blobheadername1=Content-Disposition&blobheadervalue1=attachment%3Bfilename%3DRdmn_AMIHFPNCOPDSTK_Msr_UpdtRpt.pdf&blobcol=urldata&blobtable=MungoBlobs. Accessed on July 8, 2015.
2. Rising KL, White LF, Fernandez WG, Boutwell AE. Emergency department visits after hospital discharge: a missing part of the equation. Ann Emerg Med. 2013;62(2):145-150. PubMed
3. Vashi AA, Fox JP, Carr BG, et al. Use of hospital-based acute care among patients recently discharged from the hospital. JAMA. 2013;309(4):364-371. PubMed
4. Kocher KE, Nallamothu BK, Birkmeyer JD, Dimick JB. Emergency department visits after surgery are common for Medicare patients, suggesting opportunities to improve care. Health Aff (Millwood). 2013;32(9):1600-1607. PubMed
5. Krumholz HM. Post-hospital syndrome–an acquired, transient condition of generalized risk. N Engl J Med. 2013;368(2):100-102. PubMed
6. Baier RR, Gardner RL, Coleman EA, Jencks SF, Mor V, Gravenstein S. Shifting the dialogue from hospital readmissions to unplanned care. Am J Manag Care. 2013;19(6):450-453. PubMed
7. Schuur JD, Venkatesh AK. The growing role of emergency departments in hospital admissions. N Engl J Med. 2012;367(5):391-393. PubMed
8. Kocher KE, Dimick JB, Nallamothu BK. Changes in the source of unscheduled hospitalizations in the United States. Med Care. 2013;51(8):689-698. PubMed
9. Morganti KG, Bauhoff S, Blanchard JC, Abir M, Iyer N. The evolving role of emergency departments in the United States. Santa Monica, CA: Rand Corporation; 2013. PubMed
10. Katz EB, Carrier ER, Umscheid CA, Pines JM. Comparative effectiveness of care coordination interventions in the emergency department: a systematic review. Ann Emerg Med. 2012;60(1):12.e1-23.e1. PubMed
11. Jaquis WP, Kaplan JA, Carpenter C, et al. Transitions of Care Task Force Report. 2012. http://www.acep.org/workarea/DownloadAsset.aspx?id=91206. Accessed on January 2, 2016.
12. Horwitz LI, Wang C, Altaf FK, et al. Excess Days in Acute Care after Hospitalization for Heart Failure (Version 1.0) Final Measure Methodology Report. 2015. https://www.cms.gov/Medicare/Quality-Initiatives-Patient-Assessment-Instruments/HospitalQualityInits/Measure-Methodology.html. Accessed on January 2, 2016.
13. Horwitz LI, Wang C, Altaf FK, et al. Excess Days in Acute Care after Hospitalization for Acute Myocardial Infarction (Version 1.0) Final Measure Methodology Report. 2015. https://www.cms.gov/Medicare/Quality-Initiatives-Patient-Assessment-Instruments/HospitalQualityInits/Measure-Methodology.html. Accessed on January 2, 2016.
14. Hennessy S, Leonard CE, Freeman CP, et al. Validation of diagnostic codes for outpatient-originating sudden cardiac death and ventricular arrhythmia in Medicaid and Medicare claims data. Pharmacoepidemiol Drug Saf. 2010;19(6):555-562. PubMed
15. Krumholz H, Normand S, Keenan P, et al. Hospital 30-Day Acute Myocardial Infarction Readmission Measure Methodology. 2008. http://www.qualitynet.org/dcs/BlobServer?blobkey=id&blobnocache=true&blobwhere=1228873653724&blobheader=multipart%2Foctet-stream&blobheadername1=Content-Disposition&blobheadervalue1=attachment%3Bfilename%3DAMI_ReadmMeasMethod.pdf&blobcol=urldata&blobtable=MungoBlobs. Accessed on February 22, 2016.
16. Krumholz H, Normand S, Keenan P, et al. Hospital 30-Day Heart Failure Readmission Measure Methodology. 2008. http://69.28.93.62/wp-content/uploads/2017/01/2007-Baseline-info-on-Readmissions-krumholz.pdf. Accessed on February 22, 2016.
17. Krumholz H, Normand S, Keenan P, et al. Hospital 30-Day Pneumonia Readmission Measure Methodology. 2008. http://www.qualitynet.org/dcs/BlobServer?blobkey=id&blobnocache=true&blobwhere=1228873654295&blobheader=multipart%2Foctet-stream&blobheadername1=Content-Disposition&blobheadervalue1=attachment%3Bfilename%3DPneumo_ReadmMeasMethod.pdf&blobcol=urldata&blobtable=MungoBlobs. Accessed on February 22, 2016.
18. QualityNet. Claims-based measures: readmission measures. 2016. http://www.qualitynet.org/dcs/ContentServer?cid=1219069855273&pagename=QnetPublic%2FPage%2FQnetTier3. Accessed on December 14, 2017.
19. Agency for Healthcare Research and Quality. Clinical classifications software (CCS) for ICD-9-CM. Healthcare Cost and Utilization Project 2013; https://www.hcup-us.ahrq.gov/toolssoftware/ccs/ccs.jsp. Accessed December 14, 2017.
20. Von Elm E, Altman DG, Egger M, et al. The Strengthening the Reporting of Observational Studies in Epidemiology (STROBE) statement: guidelines for reporting observational studies. Prev Med. 2007;45(4):247-251. PubMed
21. Dharmarajan K, Hsieh AF, Lin Z, et al. Diagnoses and timing of 30-day readmissions after hospitalization for heart failure, acute myocardial infarction, or pneumonia. JAMA. 2013;309(4):355-363. PubMed
22. Venkatesh AK, Wang C, Ross JS, et al. Hospital Use of Observation Stays: Cross-Sectional Study of the Impact on Readmission Rates. Med Care. 2016;54(12):1070-1077. PubMed
23. Sabbatini AK, Kocher KE, Basu A, Hsia RY. In-hospital outcomes and costs among patients hospitalized during a return visit to the emergency department. JAMA. 2016;315(7):663-671. PubMed
24. Pitts SR, Carrier ER, Rich EC, Kellermann AL. Where Americans get acute care: increasingly, it’s not at their doctor’s office. Health Aff (Millwood). 2010;29(9):1620-1629. PubMed
25. Ross JS, Bernheim SM, Lin Z, et al. Based on key measures, care quality for Medicare enrollees at safety-net and non-safety-net hospitals was almost equal. Health Aff (Millwood). 2012;31(8):1739-1748. PubMed
26. Joynt KE, Orav EJ, Jha AK. Thirty-day readmission rates for Medicare beneficiaries by race and site of care. JAMA. 2011;305(7):675-681. PubMed
27. Venkatesh A, Wang C, Suter LG, et al. Hospital Use of Observation Stays: Cross-Sectional Study of the Impact on Readmission Rates. In: Academy Health Annual Research Meeting. San Diego, CA; 2014. PubMed
28. Pittsenbarger ZE, Thurm CW, Neuman MI, et al. Hospital-level factors associated with pediatric emergency department return visits. J Hosp Med. 2017;12(7):536-543. PubMed
Hospital readmissions for acute myocardial infarction (AMI), heart failure, and pneumonia have become central to quality-measurement efforts by the Centers for Medicare & Medicaid Services (CMS), which seek to improve hospital care transitions through public reporting and payment programs.1 Most current measures are limited to readmissions that require inpatient hospitalization and do not capture return visits to the emergency department (ED) that do not result in readmission but rather ED discharge. These visits may reflect important needs for acute, unscheduled care during the vulnerable posthospitalization period.2-5 While previous research has suggested that nearly 10% of patients may return to the ED following hospital discharge without readmission, the characteristics of these visits among Medicare beneficiaries and the implications for national care-coordination quality-measurement initiatives have not been explored.6,7
As the locus of acute outpatient care and the primary portal of hospital admissions and readmissions, ED visits following hospital discharge may convey meaningful information about posthospitalization care transitions.8,9 In addition, recent reviews and perspectives have highlighted the role of ED care-coordination services as interventions to reduce inpatient hospitalizations and improve care transitions,10,11 yet no empirical studies have evaluated the relationship between these unique care-coordination opportunities in the ED and care-coordination outcomes, such as hospital readmissions. As policymakers seek to develop accountability measures that capture the totality of acute, unscheduled visits following hospital discharge, describing the relationship between ED visits and readmissions will be essential to providers for benchmarking and to policymakers and payers seeking to reduce the total cost of care.12,13
Accordingly, we sought to characterize the frequency, diagnoses, and hospital-level variation in treat-and-discharge ED visitation following hospital discharge for 3 conditions for which hospital readmission is publicly reported by the CMS: AMI, heart failure, and pneumonia. We also sought to evaluate the relationship between hospital-level ED visitation following hospital discharge and publicly reported, risk-standardized readmission rates (RSRRs).
METHODS
Study Design
This study was a cross-sectional analysis of Medicare beneficiaries discharged alive following hospitalization for AMI, heart failure, and pneumonia between July 2011 and June 2012.
Selection of Participants
We used Medicare Standard Analytic Files to identify inpatient hospitalizations for each disease cohort based on principal discharge diagnoses. Each condition-specific cohort was constructed to be consistent with the CMS’s readmission measures using International Classification of Diseases, 9th Revision-Clinical Modification codes to identify AMI, heart failure, and pneumonia discharges.1 We included only patients who were enrolled in fee-for-service (FFS) Medicare parts A and B for 12 months prior to their index hospitalization to maximize the capture of diagnoses for risk adjustment. Each cohort included only patients who were discharged alive while maintaining FFS coverage for at least 30 days following hospital discharge to minimize bias in outcome ascertainment. We excluded patients who were discharged against medical advice. All contiguous admissions that were identified in a transfer chain were considered to be a single admission. Hospitals with fewer than 25 condition-specific index hospital admissions were excluded from this analysis for consistency with publicly reported measures.1
Measurements
Outcomes
We describe hospital-level, postdischarge ED visitation as the risk-standardized postdischarge ED visit rate. The general construct of this measure is consistent with those of prior studies that define postdischarge ED visitation as the proportion of index admissions followed by a treat-and-discharge ED visit without hospital readmission2,3; however, this outcome also incorporates a risk-standardization model with covariates that are identical to the risk-standardization approach that is used for readmission measurement.
We describe hospital-level readmission by calculating RSRRs consistent with CMS readmission measures, which are endorsed by the National Quality Forum and used for public reporting.15-17 Detailed technical documentation, including the SAS code used to replicate hospital-level measures of readmission, are available publicly through the CMS QualityNet portal.18
We calculated risk-standardized postdischarge ED visit rates and RSRRs as the ratio of the predicted number of postdischarge ED visits or readmissions for a hospital given its observed case mix to the expected number of postdischarge ED visits or readmissions based on the nation’s performance with that hospital’s case mix, respectively. This approach estimates a distinct risk-standardized postdischarge ED visit rate and RSRR for each hospital using hierarchical generalized linear models (HGLMs) and using a logit link with a first-level adjustment for age, sex, 29 clinical covariates for AMI, 35 clinical covariates for heart failure, and 38 clinical covariates for pneumonia. Each clinical covariate is identified based on inpatient and outpatient claims during the 12 months prior to the index hospitalization. The second level of the HGLM includes a random hospital-level intercept. This approach to measuring hospital readmissions accounts for the correlated nature of observed readmission rates within a hospital and reflects the assumption that after adjustment for patient characteristics and sampling variability, the remaining variation in postdischarge ED visit rates or readmission rates reflects hospital quality.
Analysis
In order to characterize treat-and-discharge postdischarge ED visits, we first described the clinical conditions that were evaluated during the first postdischarge ED visit. Based on the principal discharge diagnosis, ED visits were grouped into clinically meaningful categories using the Agency for Healthcare Research and Quality Clinical Classifications Software (CCS).19 We also report hospital-level variation in risk-standardized postdischarge ED visit rates for AMI, heart failure, and pneumonia.
Next, we examined the relationship between hospital characteristics and risk-standardized postdischarge ED visit rates. We linked hospital characteristics from the American Hospital Association (AHA) Annual Survey to the study dataset, including the following: safety-net status, teaching status, and urban or rural status. Consistent with prior work, hospital safety-net status was defined as a hospital Medicaid caseload greater than 1 standard deviation above the mean Medicaid caseload in the hospital’s state. Approximately 94% of the hospitals included in the 3 condition cohorts in the dataset had complete data in the 2011 AHA Annual Survey to be included in this analysis.
We evaluated the relationship between postdischarge ED visit rates and hospital readmission rates in 2 ways. First, we calculated Spearman rank correlation coefficients between hospital-level, risk-standardized postdischarge ED visit rates and RSRRs. Second, we calculated hospital-level variation in RSRRs based on the strata of risk-standardized postdischarge ED visit rates. Given the normal distribution of postdischarge ED visit rates, we grouped hospitals by quartile of postdischarge ED visit rates and 1 group for hospitals with no postdischarge ED visits.
Based on preliminary analyses indicating a relationship between hospital size, measured by condition-specific index hospitalization volume, and postdischarge treat-and-discharge ED visit rates, all descriptive statistics and correlations reported are weighted by the volume of condition-specific index hospitalizations. The study was approved by the Yale University Human Research Protection Program. All analyses were conducted using SAS 9.1 (SAS Institute Inc, Cary, NC). The analytic plan and results reported in this work are in compliance with the Strengthening the Reporting of Observational Studies in Epidemiology checklist.20
RESULTS
During the 1-year study period, we included a total of 157,035 patients who were hospitalized at 1656 hospitals for AMI, 391,209 at 3044 hospitals for heart failure, and 342,376 at 3484 hospitals for pneumonia. Details of study cohort creation are available in supplementary Table 1. After hospitalization for AMI, 14,714 patients experienced a postdischarge ED visit (8.4%) and 27,214 an inpatient readmissions (17.3%) within 30 days of discharge; 31,621 (7.6%) and 88,106 (22.5%) patients after hospitalization for heart failure and 26,681 (7.4%) and 59,352 (17.3%) patients after hospitalization for pneumonia experienced a postdischarge ED visit and an inpatient readmission within 30 days of discharge, respectively.
Postdischarge ED visits were for a wide variety of conditions, with the top 10 CCS categories comprising 44% of postdischarge ED visits following AMI hospitalizations, 44% of following heart failure hospitalizations, and 41% following pneumonia hospitalizations (supplementary Table 2). The first postdischarge ED visit was rarely for the same condition as the index hospitalization in the AMI cohort (224 visits; 1.5%) as well as the pneumonia cohort (1401 visits; 5.3%). Among patients who were originally admitted for heart failure, 10.6% of the first postdischarge ED visits were also for congestive heart failure.
We found wide hospital-level variation in postdischarge ED visit rates for each condition: AMI (median: 8.3%; 5th and 95th percentile: 2.8%-14.3%), heart failure (median: 7.3%; 5th and 95th percentile: 3.0%-13.3%), and pneumonia (median: 7.1%; 5th and 95th percentile: 2.4%-13.2%; supplementary Table 3). The variation persisted after accounting for hospital case mix, as evidenced in the supplementary Figure, which describes hospital variation in risk-standardized postdischarge ED visit rates. This variation was statistically significant (P < .001), as demonstrated by the isolated relationship between the random effect and the outcome (AMI: random effect estimate 0.0849 [95% confidence interval (CI), 0.0832 to 0.0866]; heart failure: random effect estimate 0.0796 [95% CI, 0.0784 to 0.0809]; pneumonia: random effect estimate 0.0753 [95% CI, 0.0741 to 0.0764]).
Across all 3 conditions, hospitals located in rural areas had significantly higher risk-standardized postdischarge ED visit rates than hospitals located in urban areas (10.1% vs 8.6% for AMI, 8.4% vs 7.5% for heart failure, and 8.0% vs 7.4% for pneumonia). In comparison to teaching hospitals, nonteaching hospitals had significantly higher risk-standardized postdischarge ED visit rates following hospital discharge for pneumonia (7.6% vs 7.1%). Safety-net hospitals also had higher risk-standardized postdischarge ED visitation rates following discharge for heart failure (8.4% vs 7.7%) and pneumonia (7.7% vs 7.3%). Risk-standardized postdischarge ED visit rates were higher in publicly owned hospitals than in nonprofit or privately owned hospitals for heart failure (8.0% vs 7.5% in nonprofit hospitals or 7.5% in private hospitals) and pneumonia (7.7% vs 7.4% in nonprofit hospitals and 7.3% in private hospitals; Table).
Among hospitals with RSRRs that were publicly reported by CMS, we found a moderate inverse correlation between risk-standardized postdischarge ED visit rates and hospital RSRRs for each condition: AMI (r = −0.23; 95% CI, −0.29 to −0.19), heart failure (r = −0.29; 95% CI, −0.34 to −0.27), and pneumonia (r = −0.18; 95% CI, −0.22 to −0.15; Figure).
DISCUSSION
Across a national cohort of Medicare beneficiaries, we found frequent treat-and-discharge ED utilization following hospital discharge for AMI, heart failure, and pneumonia, suggesting that publicly reported readmission measures are capturing only a portion of postdischarge acute-care use. Our findings confirm prior work describing a 30-day postdischarge ED visit rate of 8% to 9% among Medicare beneficiaries for all hospitalizations in several states.3,6
We also described substantial hospital-level variation in risk-standardized ED postdischarge rates. Prior work by Vashi et al.3 demonstrated substantial variation in observed postdischarge ED visit rates and inpatient readmissions following hospital discharge between clinical conditions in a population-level study. Our work extends upon this by demonstrating hospital-level variation for 3 conditions of high volume and substantial policy importance after accounting for differences in hospital case mix. Interestingly, our work also found similar rates of postdischarge ED treat-and-discharge visitation as recent work by Sabbatini et al.23 analyzing an all-payer, adult population with any clinical condition. Taken together, these studies show the substantial volume of postdischarge acute-care utilization in the ED not captured by existing readmission measures.
We found several hospital characteristics of importance in describing variation in postdischarge ED visitation rates. Notably, hospitals located in rural areas and safety-net hospitals demonstrated higher postdischarge ED visitation rates. This may reflect a higher use of the ED as an acute, unscheduled care access point in rural communities without access to alternative acute diagnostic and treatment services.24 Similarly, safety-net hospitals may be more likely to provide unscheduled care for patients with poor access to primary care in the ED setting. Yet, consistent with prior work, our results also indicate that these differences do not result in different readmission rates.25 Regarding hospital teaching status, unlike prior work suggesting that teaching hospitals care for more safety-net Medicare beneficiaries,26 our work found opposite patterns of postdischarge ED visitation between hospital teaching and safety-net status following pneumonia hospitalization. This may reflect differences in the organization of acute care as patients with limited access to unscheduled primary and specialty care in safety-net communities utilize the ED, whereas patients in teaching-hospital communities may be able to access hospital-based clinics for care.
Contrary to the expectations of many clinicians and policymakers, we found an inverse relationship between postdischarge ED visit rates and readmission rates. While the cross-sectional design of our study cannot provide a causal explanation, these findings merit policy attention and future exploration of several hypotheses. One possible explanation for this finding is that hospitals with high postdischarge ED visit rates provide care in communities in which acute, unscheduled care is consolidated to the ED setting and thereby permits the ED to serve a gatekeeper function for scarce inpatient resources. This hypothesis may also be supported by recent interventions demonstrating that the use of ED care coordination and geriatric ED services at higher-volume EDs can reduce hospitalizations. Also, hospitals with greater ED capacity may have easier ED access and may be able to see patients earlier in their disease courses post discharge or more frequently in the ED for follow-up, therefore increasing ED visits but avoiding rehospitalization. Another possible explanation is that hospitals with lower postdischarge ED visit rates may also have a lower propensity to admit patients. Because our definition of postdischarge ED visitation did not include ED visits that result in hospitalization, hospitals with a lower propensity to admit from the ED may therefore appear to have higher ED visit rates. This explanation may be further supported by our finding that many postdischarge ED visits are for conditions that are associated with discretionary hospitalization in the ED.27 A third explanation for this finding may be that poor access to outpatient care outside the hospital setting results in higher postdischarge ED visit rates without increasing the acuity of these revisits or increasing readmission rates28; however, given the validated, risk-standardized approach to readmission measurement, this is unlikely. This is also unlikely given recent work by Sabbatini et al.23 demonstrating substantial acuity among patients who return to the ED following hospital discharge. Future work should seek to evaluate the relationship between the availability of ED care-coordination services and the specific ED, hospital, and community care-coordination activities undertaken in the ED following hospital discharge to reduce readmission rates.
This work should be interpreted within the confines of its design. First, it is possible that some of the variation detected in postdischarge ED visit rates is mediated by hospital-level variation in postdischarge observation visits that are not captured in this outcome. However, in previous work, we have demonstrated that almost one-third of hospitals have no postdischarge observation stays and that most postdischarge observation stays are for more than 24 hours, which is unlikely to reflect the intensity of care of postdischarge ED visits.27 Second, our analyses were limited to Medicare FFS beneficiaries, which may limit the generalizability of this work to other patient populations. However, this dataset did include a national cohort of Medicare beneficiaries that is identical to those included in publicly reported CMS readmission measures; therefore, these results have substantial policy relevance. Third, this work was limited to 3 conditions of high illness severity of policy focus, and future work applying similar analyses to less severe conditions may find different degrees of hospital-level variation in postdischarge outcomes that are amenable to quality improvement. Finally, we assessed the rate of treat-and-discharge ED visits only after hospital discharge; this understates the frequency of ED visits since repeat ED visits and ED visits resulting in rehospitalization are not included. However, our definition was designed to mirror the definition used to assess hospital readmissions for policy purposes and is a conservative approach.
In summary, ED visits following hospital discharge are common, as Medicare beneficiaries have 1 treat-and-discharge ED visit for every 2 readmissions within 30 days of hospital discharge. Postdischarge ED visits occur for a wide variety of conditions, with wide risk-standardized, hospital-level variation. Hospitals with the highest risk-standardized postdischarge ED visitation rates demonstrated lower RSRRs, suggesting that policymakers and researchers should further examine the role of the hospital-based ED in providing access to acute care and supporting care transitions for the vulnerable Medicare population.
Disclosure
Dr. Venkatesh received contract support from the CMS, an agency of the U.S. Department of Health & Human Services, and grant support from the Emergency Medicine Foundation’s Health Policy Research Scholar Award during the conduct of the study; and Dr. Wang, Mr. Wang, Ms. Altaf, Dr. Bernheim, and Dr. Horwitz received contract support from the CMS, an agency of the U.S. Department of Health & Human Services, during the conduct of the study.
1. Dorsey KB GJ, Desai N, Lindenauer P, et al. 2015 Condition-Specific Measures Updates and Specifications Report Hospital-Level 30-Day Risk-Standardized Readmission Measures: AMI-Version 8.0, HF-Version 8.0, Pneumonia-Version 8.0, COPD-Version 4.0, and Stroke-Version 4.0. 2015. https://www.qualitynet.org/dcs/BlobServer?blobkey=id&blobnocache=true&blobwhere=1228890435217&blobheader=multipart%2Foctet-stream&blobheadername1=Content-Disposition&blobheadervalue1=attachment%3Bfilename%3DRdmn_AMIHFPNCOPDSTK_Msr_UpdtRpt.pdf&blobcol=urldata&blobtable=MungoBlobs. Accessed on July 8, 2015.
2. Rising KL, White LF, Fernandez WG, Boutwell AE. Emergency department visits after hospital discharge: a missing part of the equation. Ann Emerg Med. 2013;62(2):145-150. PubMed
3. Vashi AA, Fox JP, Carr BG, et al. Use of hospital-based acute care among patients recently discharged from the hospital. JAMA. 2013;309(4):364-371. PubMed
4. Kocher KE, Nallamothu BK, Birkmeyer JD, Dimick JB. Emergency department visits after surgery are common for Medicare patients, suggesting opportunities to improve care. Health Aff (Millwood). 2013;32(9):1600-1607. PubMed
5. Krumholz HM. Post-hospital syndrome–an acquired, transient condition of generalized risk. N Engl J Med. 2013;368(2):100-102. PubMed
6. Baier RR, Gardner RL, Coleman EA, Jencks SF, Mor V, Gravenstein S. Shifting the dialogue from hospital readmissions to unplanned care. Am J Manag Care. 2013;19(6):450-453. PubMed
7. Schuur JD, Venkatesh AK. The growing role of emergency departments in hospital admissions. N Engl J Med. 2012;367(5):391-393. PubMed
8. Kocher KE, Dimick JB, Nallamothu BK. Changes in the source of unscheduled hospitalizations in the United States. Med Care. 2013;51(8):689-698. PubMed
9. Morganti KG, Bauhoff S, Blanchard JC, Abir M, Iyer N. The evolving role of emergency departments in the United States. Santa Monica, CA: Rand Corporation; 2013. PubMed
10. Katz EB, Carrier ER, Umscheid CA, Pines JM. Comparative effectiveness of care coordination interventions in the emergency department: a systematic review. Ann Emerg Med. 2012;60(1):12.e1-23.e1. PubMed
11. Jaquis WP, Kaplan JA, Carpenter C, et al. Transitions of Care Task Force Report. 2012. http://www.acep.org/workarea/DownloadAsset.aspx?id=91206. Accessed on January 2, 2016.
12. Horwitz LI, Wang C, Altaf FK, et al. Excess Days in Acute Care after Hospitalization for Heart Failure (Version 1.0) Final Measure Methodology Report. 2015. https://www.cms.gov/Medicare/Quality-Initiatives-Patient-Assessment-Instruments/HospitalQualityInits/Measure-Methodology.html. Accessed on January 2, 2016.
13. Horwitz LI, Wang C, Altaf FK, et al. Excess Days in Acute Care after Hospitalization for Acute Myocardial Infarction (Version 1.0) Final Measure Methodology Report. 2015. https://www.cms.gov/Medicare/Quality-Initiatives-Patient-Assessment-Instruments/HospitalQualityInits/Measure-Methodology.html. Accessed on January 2, 2016.
14. Hennessy S, Leonard CE, Freeman CP, et al. Validation of diagnostic codes for outpatient-originating sudden cardiac death and ventricular arrhythmia in Medicaid and Medicare claims data. Pharmacoepidemiol Drug Saf. 2010;19(6):555-562. PubMed
15. Krumholz H, Normand S, Keenan P, et al. Hospital 30-Day Acute Myocardial Infarction Readmission Measure Methodology. 2008. http://www.qualitynet.org/dcs/BlobServer?blobkey=id&blobnocache=true&blobwhere=1228873653724&blobheader=multipart%2Foctet-stream&blobheadername1=Content-Disposition&blobheadervalue1=attachment%3Bfilename%3DAMI_ReadmMeasMethod.pdf&blobcol=urldata&blobtable=MungoBlobs. Accessed on February 22, 2016.
16. Krumholz H, Normand S, Keenan P, et al. Hospital 30-Day Heart Failure Readmission Measure Methodology. 2008. http://69.28.93.62/wp-content/uploads/2017/01/2007-Baseline-info-on-Readmissions-krumholz.pdf. Accessed on February 22, 2016.
17. Krumholz H, Normand S, Keenan P, et al. Hospital 30-Day Pneumonia Readmission Measure Methodology. 2008. http://www.qualitynet.org/dcs/BlobServer?blobkey=id&blobnocache=true&blobwhere=1228873654295&blobheader=multipart%2Foctet-stream&blobheadername1=Content-Disposition&blobheadervalue1=attachment%3Bfilename%3DPneumo_ReadmMeasMethod.pdf&blobcol=urldata&blobtable=MungoBlobs. Accessed on February 22, 2016.
18. QualityNet. Claims-based measures: readmission measures. 2016. http://www.qualitynet.org/dcs/ContentServer?cid=1219069855273&pagename=QnetPublic%2FPage%2FQnetTier3. Accessed on December 14, 2017.
19. Agency for Healthcare Research and Quality. Clinical classifications software (CCS) for ICD-9-CM. Healthcare Cost and Utilization Project 2013; https://www.hcup-us.ahrq.gov/toolssoftware/ccs/ccs.jsp. Accessed December 14, 2017.
20. Von Elm E, Altman DG, Egger M, et al. The Strengthening the Reporting of Observational Studies in Epidemiology (STROBE) statement: guidelines for reporting observational studies. Prev Med. 2007;45(4):247-251. PubMed
21. Dharmarajan K, Hsieh AF, Lin Z, et al. Diagnoses and timing of 30-day readmissions after hospitalization for heart failure, acute myocardial infarction, or pneumonia. JAMA. 2013;309(4):355-363. PubMed
22. Venkatesh AK, Wang C, Ross JS, et al. Hospital Use of Observation Stays: Cross-Sectional Study of the Impact on Readmission Rates. Med Care. 2016;54(12):1070-1077. PubMed
23. Sabbatini AK, Kocher KE, Basu A, Hsia RY. In-hospital outcomes and costs among patients hospitalized during a return visit to the emergency department. JAMA. 2016;315(7):663-671. PubMed
24. Pitts SR, Carrier ER, Rich EC, Kellermann AL. Where Americans get acute care: increasingly, it’s not at their doctor’s office. Health Aff (Millwood). 2010;29(9):1620-1629. PubMed
25. Ross JS, Bernheim SM, Lin Z, et al. Based on key measures, care quality for Medicare enrollees at safety-net and non-safety-net hospitals was almost equal. Health Aff (Millwood). 2012;31(8):1739-1748. PubMed
26. Joynt KE, Orav EJ, Jha AK. Thirty-day readmission rates for Medicare beneficiaries by race and site of care. JAMA. 2011;305(7):675-681. PubMed
27. Venkatesh A, Wang C, Suter LG, et al. Hospital Use of Observation Stays: Cross-Sectional Study of the Impact on Readmission Rates. In: Academy Health Annual Research Meeting. San Diego, CA; 2014. PubMed
28. Pittsenbarger ZE, Thurm CW, Neuman MI, et al. Hospital-level factors associated with pediatric emergency department return visits. J Hosp Med. 2017;12(7):536-543. PubMed
© 2018 Society of Hospital Medicine
Planned Readmission Algorithm
The Centers for Medicare & Medicaid Services (CMS) publicly reports all‐cause risk‐standardized readmission rates after acute‐care hospitalization for acute myocardial infarction, pneumonia, heart failure, total hip and knee arthroplasty, chronic obstructive pulmonary disease, stroke, and for patients hospital‐wide.[1, 2, 3, 4, 5] Ideally, these measures should capture unplanned readmissions that arise from acute clinical events requiring urgent rehospitalization. Planned readmissions, which are scheduled admissions usually involving nonurgent procedures, may not be a signal of quality of care. Including planned readmissions in readmission quality measures could create a disincentive to provide appropriate care to patients who are scheduled for elective or necessary procedures unrelated to the quality of the prior admission. Accordingly, under contract to the CMS, we were asked to develop an algorithm to identify planned readmissions. A version of this algorithm is now incorporated into all publicly reported readmission measures.
Given the widespread use of the planned readmission algorithm in public reporting and its implications for hospital quality measurement and evaluation, the objective of this study was to describe the development process, and to validate and refine the algorithm by reviewing charts of readmitted patients.
METHODS
Algorithm Development
To create a planned readmission algorithm, we first defined planned. We determined that readmissions for obstetrical delivery, maintenance chemotherapy, major organ transplant, and rehabilitation should always be considered planned in the sense that they are desired and/or inevitable, even if not specifically planned on a certain date. Apart from these specific types of readmissions, we defined planned readmissions as nonacute readmissions for scheduled procedures, because the vast majority of planned admissions are related to procedures. We also defined readmissions for acute illness or for complications of care as unplanned for the purposes of a quality measure. Even if such readmissions included a potentially planned procedure, because complications of care represent an important dimension of quality that should not be excluded from outcome measurement, these admissions should not be removed from the measure outcome. This definition of planned readmissions does not imply that all unplanned readmissions are unexpected or avoidable. However, it has proven very difficult to reliably define avoidable readmissions, even by expert review of charts, and we did not attempt to do so here.[6, 7]
In the second stage, we operationalized this definition into an algorithm. We used the Agency for Healthcare Research and Quality's Clinical Classification Software (CCS) codes to group thousands of individual procedure and diagnosis International Classification of Disease, Ninth Revision, Clinical Modification (ICD‐9‐CM) codes into clinically coherent, mutually exclusive procedure CCS categories and mutually exclusive diagnosis CCS categories, respectively. Clinicians on the investigative team reviewed the procedure categories to identify those that are commonly planned and that would require inpatient admission. We also reviewed the diagnosis categories to identify acute diagnoses unlikely to accompany elective procedures. We then created a flow diagram through which every readmission could be run to determine whether it was planned or unplanned based on our categorizations of procedures and diagnoses (Figure 1, and Supporting Information, Appendix A, in the online version of this article). This version of the algorithm (v1.0) was submitted to the National Quality Forum (NQF) as part of the hospital‐wide readmission measure. The measure (NQR #1789) received endorsement in April 2012.

In the third stage of development, we posted the algorithm for 2 public comment periods and recruited 27 outside experts to review and refine the algorithm following a standardized, structured process (see Supporting Information, Appendix B, in the online version of this article). Because the measures publicly report and hold hospitals accountable for unplanned readmission rates, we felt it most important that the algorithm include as few planned readmissions in the reported, unplanned outcome as possible (ie, have high negative predictive value). Therefore, in equivocal situations in which experts felt procedure categories were equally often planned or unplanned, we added those procedures to the potentially planned list. We also solicited feedback from hospitals on algorithm performance during a confidential test run of the hospital‐wide readmission measure in the fall of 2012. Based on all of this feedback, we made a number of changes to the algorithm, which was then identified as v2.1. Version 2.1 of the algorithm was submitted to the NQF as part of the endorsement process for the acute myocardial infarction and heart failure readmission measures and was endorsed by the NQF in January 2013. The algorithm (v2.1) is now applied, adapted if necessary, to all publicly reported readmission measures.[8]
Algorithm Validation: Study Cohort
We recruited 2 hospital systems to participate in a chart validation study of the accuracy of the planned readmission algorithm (v2.1). Within these 2 health systems, we selected 7 hospitals with varying bed size, teaching status, and safety‐net status. Each included 1 large academic teaching hospital that serves as a regional referral center. For each hospital's index admissions, we applied the inclusion and exclusion criteria from the hospital‐wide readmission measure. Index admissions were included for patients age 65 years or older; enrolled in Medicare fee‐for‐service (FFS); discharged from a nonfederal, short‐stay, acute‐care hospital or critical access hospital; without an in‐hospital death; not transferred to another acute‐care facility; and enrolled in Part A Medicare for 1 year prior to discharge. We excluded index admissions for patients without at least 30 days postdischarge enrollment in FFS Medicare, discharged against medical advice, admitted for medical treatment of cancer or primary psychiatric disease, admitted to a Prospective Payment System‐exempt cancer hospital, or who died during the index hospitalization. In addition, for this study, we included only index admissions that were followed by a readmission to a hospital within the participating health system between July 1, 2011 and June 30, 2012. Institutional review board approval was obtained from each of the participating health systems, which granted waivers of signed informed consent and Health Insurance Portability and Accountability Act waivers.
Algorithm Validation: Sample Size Calculation
We determined a priori that the minimum acceptable positive predictive value, or proportion of all readmissions the algorithm labels planned that are truly planned, would be 60%, and the minimum acceptable negative predictive value, or proportion of all readmissions the algorithm labels as unplanned that are truly unplanned, would be 80%. We calculated the sample size required to be confident of these values 10% and determined we would need a total of 291 planned charts and 162 unplanned charts. We inflated these numbers by 20% to account for missing or unobtainable charts for a total of 550 charts. To achieve this sample size, we included all eligible readmissions from all participating hospitals that were categorized as planned. At the 5 smaller hospitals, we randomly selected an equal number of unplanned readmissions occurring at any hospital in its healthcare system. At the 2 largest hospitals, we randomly selected 50 unplanned readmissions occurring at any hospital in its healthcare system.
Algorithm Validation: Data Abstraction
We developed an abstraction tool, tested and refined it using sample charts, and built the final the tool into a secure, password‐protected Microsoft Access 2007 (Microsoft Corp., Redmond, WA) database (see Supporting Information, Appendix C, in the online version of this article). Experienced chart abstractors with RN or MD degrees from each hospital site participated in a 1‐hour training session to become familiar with reviewing medical charts, defining planned/unplanned readmissions, and the data abstraction process. For each readmission, we asked abstractors to review as needed: emergency department triage and physician notes, admission history and physical, operative report, discharge summary, and/or discharge summary from a prior admission. The abstractors verified the accuracy of the administrative billing data, including procedures and principal diagnosis. In addition, they abstracted the source of admission and dates of all major procedures. Then the abstractors provided their opinion and supporting rationale as to whether a readmission was planned or unplanned. They were not asked to determine whether the readmission was preventable. To determine the inter‐rater reliability of data abstraction, an independent abstractor at each health system recoded a random sample of 10% of the charts.
Statistical Analysis
To ensure that we had obtained a representative sample of charts, we identified the 10 most commonly planned procedures among cases identified as planned by the algorithm in the validation cohort and then compared this with planned cases nationally. To confirm the reliability of the abstraction process, we used the kappa statistic to determine the inter‐rater reliability of the determination of planned or unplanned status. Additionally, the full study team, including 5 practicing clinicians, reviewed the details of every chart abstraction in which the algorithm was found to have misclassified the readmission as planned or unplanned. In 11 cases we determined that the abstractor had misunderstood the definition of planned readmission (ie, not all direct admissions are necessarily planned) and we reclassified the chart review assignment accordingly.
We calculated sensitivity, specificity, positive predictive value, and negative predictive value of the algorithm for the validation cohort as a whole, weighted to account for the prevalence of planned readmissions as defined by the algorithm in the national data (7.8%). Weighting is necessary because we did not obtain a pure random sample, but rather selected a stratified sample that oversampled algorithm‐identified planned readmissions.[9] We also calculated these rates separately for large hospitals (>600 beds) and for small hospitals (600 beds).
Finally, we examined performance of the algorithm for individual procedures and diagnoses to determine whether any procedures or diagnoses should be added or removed from the algorithm. First, we reviewed the diagnoses, procedures, and brief narratives provided by the abstractors for all cases in which the algorithm misclassified the readmission as either planned or unplanned. Second, we calculated the positive predictive value for each procedure that had been flagged as planned by the algorithm, and reviewed all readmissions (correctly and incorrectly classified) in which procedures with low positive predictive value took place. We also calculated the frequency with which the procedure was the only qualifying procedure resulting in an accurate or inaccurate classification. Third, to identify changes that should be made to the lists of acute and nonacute diagnoses, we reviewed the principal diagnosis for all readmissions misclassified by the algorithm as either planned or unplanned, and examined the specific ICD‐9‐CM codes within each CCS group that were most commonly associated with misclassifications.
After determining the changes that should be made to the algorithm based on these analyses, we recalculated the sensitivity, specificity, positive predictive value, and negative predictive value of the proposed revised algorithm (v3.0). All analyses used SAS version 9.3 (SAS Institute, Cary, NC).
RESULTS
Study Cohort
Characteristics of participating hospitals are shown in Table 1. Hospitals represented in this sample ranged in size, teaching status, and safety net status, although all were nonprofit. We selected 663 readmissions for review, 363 planned and 300 unplanned. Overall we were able to select 80% of hospitals planned cases for review; the remainder occurred at hospitals outside the participating hospital system. Abstractors were able to locate and review 634 (96%) of the eligible charts (range, 86%100% per hospital). The kappa statistic for inter‐rater reliability was 0.83.
| Description | Hospitals, N | Readmissions Selected for Review, N* | Readmissions Reviewed, N (% of Eligible) | Unplanned Readmissions Reviewed, N | Planned Readmissions Reviewed, N | % of Hospital's Planned Readmissions Reviewed* | |
|---|---|---|---|---|---|---|---|
| |||||||
| All hospitals | 7 | 663 | 634 (95.6) | 283 | 351 | 77.3 | |
| No. of beds | >600 | 2 | 346 | 339 (98.0) | 116 | 223 | 84.5 |
| >300600 | 2 | 190 | 173 (91.1) | 85 | 88 | 87.1 | |
| <300 | 3 | 127 | 122 (96.0) | 82 | 40 | 44.9 | |
| Ownership | Government | 0 | |||||
| For profit | 0 | ||||||
| Not for profit | 7 | 663 | 634 (95.6) | 283 | 351 | 77.3 | |
| Teaching status | Teaching | 2 | 346 | 339 (98.0) | 116 | 223 | 84.5 |
| Nonteaching | 5 | 317 | 295 (93.1) | 167 | 128 | 67.4 | |
| Safety net status | Safety net | 2 | 346 | 339 (98.0) | 116 | 223 | 84.5 |
| Nonsafety net | 5 | 317 | 295 (93.1) | 167 | 128 | 67.4 | |
| Region | New England | 3 | 409 | 392 (95.8) | 155 | 237 | 85.9 |
| South Central | 4 | 254 | 242 (95.3) | 128 | 114 | 64.0 | |
The study sample included 57/67 (85%) of the procedure or condition categories on the potentially planned list. The most common procedure CCS categories among planned readmissions (v2.1) in the validation cohort were very similar to those in the national dataset (see Supporting Information, Appendix D, in the online version of this article). Of the top 20 most commonly planned procedure CCS categories in the validation set, all but 2, therapeutic radiology for cancer treatment (CCS 211) and peripheral vascular bypass (CCS 55), were among the top 20 most commonly planned procedure CCS categories in the national data.
Test Characteristics of Algorithm
The weighted test characteristics of the current algorithm (v2.1) are shown in Table 2. Overall, the algorithm correctly identified 266 readmissions as unplanned and 181 readmissions as planned, and misidentified 170 readmissions as planned and 15 as unplanned. Once weighted to account for the stratified sampling design, the overall prevalence of true planned readmissions was 8.9% of readmissions. The weighted sensitivity was 45.1% overall and was higher in large teaching centers than in smaller community hospitals. The weighted specificity was 95.9%. The positive predictive value was 51.6%, and the negative predictive value was 94.7%.
| Cohort | Sensitivity | Specificity | Positive Predictive Value | Negative Predictive Value |
|---|---|---|---|---|
| Algorithm v2.1 | ||||
| Full cohort | 45.1% | 95.9% | 51.6% | 94.7% |
| Large hospitals | 50.9% | 96.1% | 53.8% | 95.6% |
| Small hospitals | 40.2% | 95.5% | 47.7% | 94.0% |
| Revised algorithm v3.0 | ||||
| Full cohort | 49.8% | 96.5% | 58.7% | 94.5% |
| Large hospitals | 57.1% | 96.8% | 63.0% | 95.9% |
| Small hospitals | 42.6% | 95.9% | 52.6% | 93.9% |
Accuracy of Individual Diagnoses and Procedures
The positive predictive value of the algorithm for individual procedure categories varied widely, from 0% to 100% among procedures with at least 10 cases (Table 3). The procedure for which the algorithm was least accurate was CCS 211, therapeutic radiology for cancer treatment (0% positive predictive value). By contrast, maintenance chemotherapy (90%) and other therapeutic procedures, hemic and lymphatic system (100%) were most accurate. Common procedures with less than 50% positive predictive value (ie, that the algorithm commonly misclassified as planned) were diagnostic cardiac catheterization (25%); debridement of wound, infection, or burn (25%); amputation of lower extremity (29%); insertion, revision, replacement, removal of cardiac pacemaker or cardioverter/defibrillator (33%); and other hernia repair (43%). Of these, diagnostic cardiac catheterization and cardiac devices are the first and second most common procedures nationally, respectively.
| Readmission Procedure CCS Code | Total Categorized as Planned by Algorithm, N | Verified as Planned by Chart Review, N | Positive Predictive Value |
|---|---|---|---|
| |||
| 47 Diagnostic cardiac catheterization; coronary arteriography | 44 | 11 | 25% |
| 224 Cancer chemotherapy | 40 | 22 | 55% |
| 157 Amputation of lower extremity | 31 | 9 | 29% |
| 49 Other operating room heart procedures | 27 | 16 | 59% |
| 48 Insertion, revision, replacement, removal of cardiac pacemaker or cardioverter/defibrillator | 24 | 8 | 33% |
| 43 Heart valve procedures | 20 | 16 | 80% |
| Maintenance chemotherapy (diagnosis CCS 45) | 20 | 18 | 90% |
| 78 Colorectal resection | 18 | 9 | 50% |
| 169 Debridement of wound, infection or burn | 16 | 4 | 25% |
| 84 Cholecystectomy and common duct exploration | 16 | 5 | 31% |
| 99 Other OR gastrointestinal therapeutic procedures | 16 | 8 | 50% |
| 158 Spinal fusion | 15 | 11 | 73% |
| 142 Partial excision bone | 14 | 10 | 71% |
| 86 Other hernia repair | 14 | 6 | 42% |
| 44 Coronary artery bypass graft | 13 | 10 | 77% |
| 67 Other therapeutic procedures, hemic and lymphatic system | 13 | 13 | 100% |
| 211 Therapeutic radiology for cancer treatment | 12 | 0 | 0% |
| 45 Percutaneous transluminal coronary angioplasty | 11 | 7 | 64% |
| Total | 497 | 272 | 54.7% |
The readmissions with least abstractor agreement were those involving CCS 157 (amputation of lower extremity) and CCS 169 (debridement of wound, infection or burn). Readmissions for these procedures were nearly always performed as a consequence of acute worsening of chronic conditions such as osteomyelitis or ulceration. Abstractors were divided over whether these readmissions were appropriate to call planned.
Changes to the Algorithm
We determined that the accuracy of the algorithm would be improved by removing 2 procedure categories from the planned procedure list (therapeutic radiation [CCS 211] and cancer chemotherapy [CCS 224]), adding 1 diagnosis category to the acute diagnosis list (hypertension with complications [CCS 99]), and splitting 2 diagnosis condition categories into acute and nonacute ICD‐9‐CM codes (pancreatic disorders [CCS 149] and biliary tract disease [CCS 152]). Detailed rationales for each modification to the planned readmission algorithm are described in Table 4. We felt further examination of diagnostic cardiac catheterization and cardiac devices was warranted given their high frequency, despite low positive predictive value. We also elected not to alter the categorization of amputation or debridement because it was not easy to determine whether these admissions were planned or unplanned even with chart review. We plan further analyses of these procedure categories.
| Action | Diagnosis or Procedure Category | Algorithm | Chart | N | Rationale for Change |
|---|---|---|---|---|---|
| |||||
| Remove from planned procedure list | Therapeutic radiation (CCS 211) | Accurate | The algorithm was inaccurate in every case. All therapeutic radiology during readmissions was performed because of acute illness (pain crisis, neurologic crisis) or because scheduled treatment occurred during an unplanned readmission. In national data, this ranks as the 25th most common planned procedure identified by the algorithm v2.1. | ||
| Planned | Planned | 0 | |||
| Unplanned | Unplanned | 0 | |||
| Inaccurate | |||||
| Unplanned | Planned | 0 | |||
| Planned | Unplanned | 12 | |||
| Cancer chemotherapy (CCS 224) | Accurate | Of the 22 correctly identified as planned, 18 (82%) would already have been categorized as planned because of a principal diagnosis of maintenance chemotherapy. Therefore, removing CCS 224 from the planned procedure list would only miss a small fraction of planned readmissions but would avoid a large number of misclassifications. In national data, this ranks as the 8th most common planned procedure identified by the algorithm v2.1. | |||
| Planned | Planned | 22 | |||
| Unplanned | Unplanned | 0 | |||
| Inaccurate | |||||
| Unplanned | Planned | 0 | |||
| Planned | Unplanned | 18 | |||
| Add to planned procedure list | None | The abstractors felt a planned readmission was missed by the algorithm in 15 cases. A handful of these cases were missed because the planned procedure was not on the current planned procedure list; however, those procedures (eg, abdominal paracentesis, colonoscopy, endoscopy) were nearly always unplanned overall and should therefore not be added as procedures that potentially qualify as an admission as planned. | |||
| Remove from acute diagnosis list | None | The abstractors felt a planned readmission was missed by the algorithm in 15 cases. The relevant disqualifying acute diagnoses were much more often associated with unplanned readmissions in our dataset. | |||
| Add to acute diagnosis list | Hypertension with complications (CCS 99) | Accurate | This CCS was associated with only 1 planned readmission (for elective nephrectomy, a very rare procedure). Every other time this CCS appeared in the dataset, it was associated with an unplanned readmission (12/13, 92%); 10 of those, however, were misclassified by the algorithm as planned because they were not excluded by diagnosis (91% error rate). Consequently, adding this CCS to the acute diagnosis list is likely to miss only a very small fraction of planned readmissions, while making the overall algorithm much more accurate. | ||
| Planned | Planned | 1 | |||
| Unplanned | Unplanned | 2 | |||
| Inaccurate | |||||
| Unplanned | Planned | 0 | |||
| Planned | Unplanned | 10 | |||
| Split diagnosis condition category into component ICD‐9 codes | Pancreatic disorders (CCS 152) | Accurate | ICD‐9 code 577.0 (acute pancreatitis) is the only acute code in this CCS. Acute pancreatitis was present in 2 cases that were misclassified as planned. Clinically, there is no situation in which a planned procedure would reasonably be performed in the setting of acute pancreatitis. Moving ICD‐9 code 577.0 to the acute list and leaving the rest of the ICD‐9 codes in CCS 152 on the nonacute list will enable the algorithm to continue to identify planned procedures for chronic pancreatitis. | ||
| Planned | Planned | 0 | |||
| Unplanned | Unplanned | 1 | |||
| Inaccurate | |||||
| Unplanned | Planned | 0 | |||
| Planned | Unplanned | 2 | |||
| Biliary tract disease (CCS 149) | Accurate | This CCS is a mix of acute and chronic diagnoses. Of 14 charts classified as planned with CCS 149 in the principal diagnosis field, 12 were misclassified (of which 10 were associated with cholecystectomy). Separating out the acute and nonacute diagnoses will increase the accuracy of the algorithm while still ensuring that planned cholecystectomies and other procedures can be identified. Of the ICD‐9 codes in CCS 149, the following will be added to the acute diagnosis list: 574.0, 574.3, 574.6, 574.8, 575.0, 575.12, 576.1. | |||
| Planned | Planned | 2 | |||
| Unplanned | Unplanned | 3 | |||
| Inaccurate | |||||
| Unplanned | Planned | 0 | |||
| Planned | Unplanned | 12 | |||
| Consider for change after additional study | Diagnostic cardiac catheterization (CCS 47) | Accurate | The algorithm misclassified as planned 25/38 (66%) unplanned readmissions in which diagnostic catheterizations were the only qualifying planned procedure. It also correctly identified 3/3 (100%) planned readmissions in which diagnostic cardiac catheterizations were the only qualifying planned procedure. This is the highest volume procedure in national data. | ||
| Planned | Planned | 3* | |||
| Unplanned | Unplanned | 13* | |||
| Inaccurate | |||||
| Unplanned | Planned | 0* | |||
| Planned | Unplanned | 25* | |||
| Insertion, revision, replacement, removal of cardiac pacemaker or cardioverter/defibrillator (CCS 48) | Accurate | The algorithm misclassified as planned 4/5 (80%) unplanned readmissions in which cardiac devices were the only qualifying procedure. However, it also correctly identified 7/8 (87.5%) planned readmissions in which cardiac devices were the only qualifying planned procedure. CCS 48 is the second most common planned procedure category nationally. | |||
| Planned | Planned | 7 | |||
| Unplanned | Unplanned | 1 | |||
| Inaccurate | |||||
| Unplanned | Planned | 1 | |||
| Planned | Unplanned | 4 | |||
The revised algorithm (v3.0) had a weighted sensitivity of 49.8%, weighted specificity of 96.5%, positive predictive value of 58.7%, and negative predictive value of 94.5% (Table 2). In aggregate, these changes would increase the reported unplanned readmission rate from 16.0% to 16.1% in the hospital‐wide readmission measure, using 2011 to 2012 data, and would decrease the fraction of all readmissions considered planned from 7.8% to 7.2%.
DISCUSSION
We developed an algorithm based on administrative data that in its currently implemented form is very accurate at identifying unplanned readmissions, ensuring that readmissions included in publicly reported readmission measures are likely to be truly unplanned. However, nearly half of readmissions the algorithm classifies as planned are actually unplanned. That is, the algorithm is overcautious in excluding unplanned readmissions that could have counted as outcomes, particularly among admissions that include diagnostic cardiac catheterization or placement of cardiac devices (pacemakers, defibrillators). However, these errors only occur within the 7.8% of readmissions that are classified as planned and therefore do not affect overall readmission rates dramatically. A perfect algorithm would reclassify approximately half of these planned readmissions as unplanned, increasing the overall readmission rate by 0.6 percentage points.
On the other hand, the algorithm also only identifies approximately half of true planned readmissions as planned. Because the true prevalence of planned readmissions is low (approximately 9% of readmissions based on weighted chart review prevalence, or an absolute rate of 1.4%), this low sensitivity has a small effect on algorithm performance. Removing all true planned readmissions from the measure outcome would decrease the overall readmission rate by 0.8 percentage points, similar to the expected 0.6 percentage point increase that would result from better identifying unplanned readmissions; thus, a perfect algorithm would likely decrease the reported unplanned readmission rate by a net 0.2%. Overall, the existing algorithm appears to come close to the true prevalence of planned readmissions, despite inaccuracy on an individual‐case basis. The algorithm performed best at large hospitals, which are at greatest risk of being statistical outliers and of accruing penalties under the Hospital Readmissions Reduction Program.[10]
We identified several changes that marginally improved the performance of the algorithm by reducing the number of unplanned readmissions that are incorrectly removed from the measure, while avoiding the inappropriate inclusion of planned readmissions in the outcome. This revised algorithm, v3.0, was applied to public reporting of readmission rates at the end of 2014. Overall, implementing these changes increases the reported readmission rate very slightly. We also identified other procedures associated with high inaccuracy rates, removal of which would have larger impact on reporting rates, and which therefore merit further evaluation.
There are other potential methods of identifying planned readmissions. For instance, as of October 1, 2013, new administrative billing codes were created to allow hospitals to indicate that a patient was discharged with a planned acute‐care hospital inpatient readmission, without limitation as to when it will take place.[11] This code must be used at the time of the index admission to indicate that a future planned admission is expected, and was specified only to be used for neonates and patients with acute myocardial infarction. This approach, however, would omit planned readmissions that are not known to the initial discharging team, potentially missing planned readmissions. Conversely, some patients discharged with a plan for readmission may be unexpectedly readmitted for an unplanned reason. Given that the new codes were not available at the time we conducted the validation study, we were not able to determine how often the billing codes accurately identified planned readmissions. This would be an important area to consider for future study.
An alternative approach would be to create indicator codes to be applied at the time of readmission that would indicate whether that admission was planned or unplanned. Such a code would have the advantage of allowing each planned readmission to be flagged by the admitting clinicians at the time of admission rather than by an algorithm that inherently cannot be perfect. However, identifying planned readmissions at the time of readmission would also create opportunity for gaming and inconsistent application of definitions between hospitals; additional checks would need to be put in place to guard against these possibilities.
Our study has some limitations. We relied on the opinion of chart abstractors to determine whether a readmission was planned or unplanned; in a few cases, such as smoldering wounds that ultimately require surgical intervention, that determination is debatable. Abstractions were done at local institutions to minimize risks to patient privacy, and therefore we could not centrally verify determinations of planned status except by reviewing source of admission, dates of procedures, and narrative comments reported by the abstractors. Finally, we did not have sufficient volume of planned procedures to determine accuracy of the algorithm for less common procedure categories or individual procedures within categories.
In summary, we developed an algorithm to identify planned readmissions from administrative data that had high specificity and moderate sensitivity, and refined it based on chart validation. This algorithm is in use in public reporting of readmission measures to maximize the probability that the reported readmission rates represent truly unplanned readmissions.[12]
Disclosures: Financial supportThis work was performed under contract HHSM‐500‐2008‐0025I/HHSM‐500‐T0001, Modification No. 000008, titled Measure Instrument Development and Support, funded by the Centers for Medicare and Medicaid Services (CMS), an agency of the US Department of Health and Human Services. Drs. Horwitz and Ross are supported by the National Institute on Aging (K08 AG038336 and K08 AG032886, respectively) and by the American Federation for Aging Research through the Paul B. Beeson Career Development Award Program. Dr. Krumholz is supported by grant U01 HL105270‐05 (Center for Cardiovascular Outcomes Research at Yale University) from the National Heart, Lung, and Blood Institute. No funding source had any role in the study design; in the collection, analysis, and interpretation of data; or in the writing of the article. The CMS reviewed and approved the use of its data for this work and approved submission of the manuscript. All authors have completed the Unified Competing Interest form at
- , , , et al. Development, validation, and results of a measure of 30‐day readmission following hospitalization for pneumonia. J Hosp Med. 2011;6(3):142–150.
- , , , et al. An administrative claims measure suitable for profiling hospital performance based on 30‐day all‐cause readmission rates among patients with acute myocardial infarction. Circ Cardiovasc Qual Outcomes. 2011;4(2):243–252.
- , , , et al. An administrative claims measure suitable for profiling hospital performance on the basis of 30‐day all‐cause readmission rates among patients with heart failure. Circ Cardiovasc Qual Outcomes. 2008;1:29–37.
- , , , et al. Hospital‐level 30‐day all‐cause risk‐standardized readmission rate following elective primary total hip arthroplasty (THA) and/or total knee arthroplasty (TKA). Available at: http://www.qualitynet.org/dcs/ContentServer?c=Page161(supp10 l):S66–S75.
- , , A meta‐analysis of hospital 30‐day avoidable readmission rates. J Eval Clin Pract. 2011;18(6):1211–1218.
- , , , , Proportion of hospital readmissions deemed avoidable: a systematic review. CMAJ. 2011;183(7):E391–E402.
- , , , et al. Centers for Medicare 3(4):477–492.
- , Characteristics of hospitals receiving penalties under the Hospital Readmissions Reduction Program. JAMA. 2013;309(4):342–343.
- Centers for Medicare and Medicaid Services. Inpatient Prospective Payment System/Long‐Term Care Hospital (IPPS/LTCH) final rule. Fed Regist. 2013;78:50533–50534.
- , , Massachusetts health reforms: uninsurance remains low, self‐reported health status improves as state prepares to tackle costs. Health Aff (Millwood). 2012;31(2):444–451.
The Centers for Medicare & Medicaid Services (CMS) publicly reports all‐cause risk‐standardized readmission rates after acute‐care hospitalization for acute myocardial infarction, pneumonia, heart failure, total hip and knee arthroplasty, chronic obstructive pulmonary disease, stroke, and for patients hospital‐wide.[1, 2, 3, 4, 5] Ideally, these measures should capture unplanned readmissions that arise from acute clinical events requiring urgent rehospitalization. Planned readmissions, which are scheduled admissions usually involving nonurgent procedures, may not be a signal of quality of care. Including planned readmissions in readmission quality measures could create a disincentive to provide appropriate care to patients who are scheduled for elective or necessary procedures unrelated to the quality of the prior admission. Accordingly, under contract to the CMS, we were asked to develop an algorithm to identify planned readmissions. A version of this algorithm is now incorporated into all publicly reported readmission measures.
Given the widespread use of the planned readmission algorithm in public reporting and its implications for hospital quality measurement and evaluation, the objective of this study was to describe the development process, and to validate and refine the algorithm by reviewing charts of readmitted patients.
METHODS
Algorithm Development
To create a planned readmission algorithm, we first defined planned. We determined that readmissions for obstetrical delivery, maintenance chemotherapy, major organ transplant, and rehabilitation should always be considered planned in the sense that they are desired and/or inevitable, even if not specifically planned on a certain date. Apart from these specific types of readmissions, we defined planned readmissions as nonacute readmissions for scheduled procedures, because the vast majority of planned admissions are related to procedures. We also defined readmissions for acute illness or for complications of care as unplanned for the purposes of a quality measure. Even if such readmissions included a potentially planned procedure, because complications of care represent an important dimension of quality that should not be excluded from outcome measurement, these admissions should not be removed from the measure outcome. This definition of planned readmissions does not imply that all unplanned readmissions are unexpected or avoidable. However, it has proven very difficult to reliably define avoidable readmissions, even by expert review of charts, and we did not attempt to do so here.[6, 7]
In the second stage, we operationalized this definition into an algorithm. We used the Agency for Healthcare Research and Quality's Clinical Classification Software (CCS) codes to group thousands of individual procedure and diagnosis International Classification of Disease, Ninth Revision, Clinical Modification (ICD‐9‐CM) codes into clinically coherent, mutually exclusive procedure CCS categories and mutually exclusive diagnosis CCS categories, respectively. Clinicians on the investigative team reviewed the procedure categories to identify those that are commonly planned and that would require inpatient admission. We also reviewed the diagnosis categories to identify acute diagnoses unlikely to accompany elective procedures. We then created a flow diagram through which every readmission could be run to determine whether it was planned or unplanned based on our categorizations of procedures and diagnoses (Figure 1, and Supporting Information, Appendix A, in the online version of this article). This version of the algorithm (v1.0) was submitted to the National Quality Forum (NQF) as part of the hospital‐wide readmission measure. The measure (NQR #1789) received endorsement in April 2012.
In the third stage of development, we posted the algorithm for 2 public comment periods and recruited 27 outside experts to review and refine the algorithm following a standardized, structured process (see Supporting Information, Appendix B, in the online version of this article). Because the measures publicly report and hold hospitals accountable for unplanned readmission rates, we felt it most important that the algorithm include as few planned readmissions in the reported, unplanned outcome as possible (ie, have high negative predictive value). Therefore, in equivocal situations in which experts felt procedure categories were equally often planned or unplanned, we added those procedures to the potentially planned list. We also solicited feedback from hospitals on algorithm performance during a confidential test run of the hospital‐wide readmission measure in the fall of 2012. Based on all of this feedback, we made a number of changes to the algorithm, which was then identified as v2.1. Version 2.1 of the algorithm was submitted to the NQF as part of the endorsement process for the acute myocardial infarction and heart failure readmission measures and was endorsed by the NQF in January 2013. The algorithm (v2.1) is now applied, adapted if necessary, to all publicly reported readmission measures.[8]
Algorithm Validation: Study Cohort
We recruited 2 hospital systems to participate in a chart validation study of the accuracy of the planned readmission algorithm (v2.1). Within these 2 health systems, we selected 7 hospitals with varying bed size, teaching status, and safety‐net status. Each included 1 large academic teaching hospital that serves as a regional referral center. For each hospital's index admissions, we applied the inclusion and exclusion criteria from the hospital‐wide readmission measure. Index admissions were included for patients age 65 years or older; enrolled in Medicare fee‐for‐service (FFS); discharged from a nonfederal, short‐stay, acute‐care hospital or critical access hospital; without an in‐hospital death; not transferred to another acute‐care facility; and enrolled in Part A Medicare for 1 year prior to discharge. We excluded index admissions for patients without at least 30 days postdischarge enrollment in FFS Medicare, discharged against medical advice, admitted for medical treatment of cancer or primary psychiatric disease, admitted to a Prospective Payment System‐exempt cancer hospital, or who died during the index hospitalization. In addition, for this study, we included only index admissions that were followed by a readmission to a hospital within the participating health system between July 1, 2011 and June 30, 2012. Institutional review board approval was obtained from each of the participating health systems, which granted waivers of signed informed consent and Health Insurance Portability and Accountability Act waivers.
Algorithm Validation: Sample Size Calculation
We determined a priori that the minimum acceptable positive predictive value, or proportion of all readmissions the algorithm labels planned that are truly planned, would be 60%, and the minimum acceptable negative predictive value, or proportion of all readmissions the algorithm labels as unplanned that are truly unplanned, would be 80%. We calculated the sample size required to be confident of these values 10% and determined we would need a total of 291 planned charts and 162 unplanned charts. We inflated these numbers by 20% to account for missing or unobtainable charts for a total of 550 charts. To achieve this sample size, we included all eligible readmissions from all participating hospitals that were categorized as planned. At the 5 smaller hospitals, we randomly selected an equal number of unplanned readmissions occurring at any hospital in its healthcare system. At the 2 largest hospitals, we randomly selected 50 unplanned readmissions occurring at any hospital in its healthcare system.
Algorithm Validation: Data Abstraction
We developed an abstraction tool, tested and refined it using sample charts, and built the final the tool into a secure, password‐protected Microsoft Access 2007 (Microsoft Corp., Redmond, WA) database (see Supporting Information, Appendix C, in the online version of this article). Experienced chart abstractors with RN or MD degrees from each hospital site participated in a 1‐hour training session to become familiar with reviewing medical charts, defining planned/unplanned readmissions, and the data abstraction process. For each readmission, we asked abstractors to review as needed: emergency department triage and physician notes, admission history and physical, operative report, discharge summary, and/or discharge summary from a prior admission. The abstractors verified the accuracy of the administrative billing data, including procedures and principal diagnosis. In addition, they abstracted the source of admission and dates of all major procedures. Then the abstractors provided their opinion and supporting rationale as to whether a readmission was planned or unplanned. They were not asked to determine whether the readmission was preventable. To determine the inter‐rater reliability of data abstraction, an independent abstractor at each health system recoded a random sample of 10% of the charts.
Statistical Analysis
To ensure that we had obtained a representative sample of charts, we identified the 10 most commonly planned procedures among cases identified as planned by the algorithm in the validation cohort and then compared this with planned cases nationally. To confirm the reliability of the abstraction process, we used the kappa statistic to determine the inter‐rater reliability of the determination of planned or unplanned status. Additionally, the full study team, including 5 practicing clinicians, reviewed the details of every chart abstraction in which the algorithm was found to have misclassified the readmission as planned or unplanned. In 11 cases we determined that the abstractor had misunderstood the definition of planned readmission (ie, not all direct admissions are necessarily planned) and we reclassified the chart review assignment accordingly.
We calculated sensitivity, specificity, positive predictive value, and negative predictive value of the algorithm for the validation cohort as a whole, weighted to account for the prevalence of planned readmissions as defined by the algorithm in the national data (7.8%). Weighting is necessary because we did not obtain a pure random sample, but rather selected a stratified sample that oversampled algorithm‐identified planned readmissions.[9] We also calculated these rates separately for large hospitals (>600 beds) and for small hospitals (600 beds).
Finally, we examined performance of the algorithm for individual procedures and diagnoses to determine whether any procedures or diagnoses should be added or removed from the algorithm. First, we reviewed the diagnoses, procedures, and brief narratives provided by the abstractors for all cases in which the algorithm misclassified the readmission as either planned or unplanned. Second, we calculated the positive predictive value for each procedure that had been flagged as planned by the algorithm, and reviewed all readmissions (correctly and incorrectly classified) in which procedures with low positive predictive value took place. We also calculated the frequency with which the procedure was the only qualifying procedure resulting in an accurate or inaccurate classification. Third, to identify changes that should be made to the lists of acute and nonacute diagnoses, we reviewed the principal diagnosis for all readmissions misclassified by the algorithm as either planned or unplanned, and examined the specific ICD‐9‐CM codes within each CCS group that were most commonly associated with misclassifications.
After determining the changes that should be made to the algorithm based on these analyses, we recalculated the sensitivity, specificity, positive predictive value, and negative predictive value of the proposed revised algorithm (v3.0). All analyses used SAS version 9.3 (SAS Institute, Cary, NC).
RESULTS
Study Cohort
Characteristics of participating hospitals are shown in Table 1. Hospitals represented in this sample ranged in size, teaching status, and safety net status, although all were nonprofit. We selected 663 readmissions for review, 363 planned and 300 unplanned. Overall we were able to select 80% of hospitals planned cases for review; the remainder occurred at hospitals outside the participating hospital system. Abstractors were able to locate and review 634 (96%) of the eligible charts (range, 86%100% per hospital). The kappa statistic for inter‐rater reliability was 0.83.
| Description | Hospitals, N | Readmissions Selected for Review, N* | Readmissions Reviewed, N (% of Eligible) | Unplanned Readmissions Reviewed, N | Planned Readmissions Reviewed, N | % of Hospital's Planned Readmissions Reviewed* | |
|---|---|---|---|---|---|---|---|
| |||||||
| All hospitals | 7 | 663 | 634 (95.6) | 283 | 351 | 77.3 | |
| No. of beds | >600 | 2 | 346 | 339 (98.0) | 116 | 223 | 84.5 |
| >300600 | 2 | 190 | 173 (91.1) | 85 | 88 | 87.1 | |
| <300 | 3 | 127 | 122 (96.0) | 82 | 40 | 44.9 | |
| Ownership | Government | 0 | |||||
| For profit | 0 | ||||||
| Not for profit | 7 | 663 | 634 (95.6) | 283 | 351 | 77.3 | |
| Teaching status | Teaching | 2 | 346 | 339 (98.0) | 116 | 223 | 84.5 |
| Nonteaching | 5 | 317 | 295 (93.1) | 167 | 128 | 67.4 | |
| Safety net status | Safety net | 2 | 346 | 339 (98.0) | 116 | 223 | 84.5 |
| Nonsafety net | 5 | 317 | 295 (93.1) | 167 | 128 | 67.4 | |
| Region | New England | 3 | 409 | 392 (95.8) | 155 | 237 | 85.9 |
| South Central | 4 | 254 | 242 (95.3) | 128 | 114 | 64.0 | |
The study sample included 57/67 (85%) of the procedure or condition categories on the potentially planned list. The most common procedure CCS categories among planned readmissions (v2.1) in the validation cohort were very similar to those in the national dataset (see Supporting Information, Appendix D, in the online version of this article). Of the top 20 most commonly planned procedure CCS categories in the validation set, all but 2, therapeutic radiology for cancer treatment (CCS 211) and peripheral vascular bypass (CCS 55), were among the top 20 most commonly planned procedure CCS categories in the national data.
Test Characteristics of Algorithm
The weighted test characteristics of the current algorithm (v2.1) are shown in Table 2. Overall, the algorithm correctly identified 266 readmissions as unplanned and 181 readmissions as planned, and misidentified 170 readmissions as planned and 15 as unplanned. Once weighted to account for the stratified sampling design, the overall prevalence of true planned readmissions was 8.9% of readmissions. The weighted sensitivity was 45.1% overall and was higher in large teaching centers than in smaller community hospitals. The weighted specificity was 95.9%. The positive predictive value was 51.6%, and the negative predictive value was 94.7%.
| Cohort | Sensitivity | Specificity | Positive Predictive Value | Negative Predictive Value |
|---|---|---|---|---|
| Algorithm v2.1 | ||||
| Full cohort | 45.1% | 95.9% | 51.6% | 94.7% |
| Large hospitals | 50.9% | 96.1% | 53.8% | 95.6% |
| Small hospitals | 40.2% | 95.5% | 47.7% | 94.0% |
| Revised algorithm v3.0 | ||||
| Full cohort | 49.8% | 96.5% | 58.7% | 94.5% |
| Large hospitals | 57.1% | 96.8% | 63.0% | 95.9% |
| Small hospitals | 42.6% | 95.9% | 52.6% | 93.9% |
Accuracy of Individual Diagnoses and Procedures
The positive predictive value of the algorithm for individual procedure categories varied widely, from 0% to 100% among procedures with at least 10 cases (Table 3). The procedure for which the algorithm was least accurate was CCS 211, therapeutic radiology for cancer treatment (0% positive predictive value). By contrast, maintenance chemotherapy (90%) and other therapeutic procedures, hemic and lymphatic system (100%) were most accurate. Common procedures with less than 50% positive predictive value (ie, that the algorithm commonly misclassified as planned) were diagnostic cardiac catheterization (25%); debridement of wound, infection, or burn (25%); amputation of lower extremity (29%); insertion, revision, replacement, removal of cardiac pacemaker or cardioverter/defibrillator (33%); and other hernia repair (43%). Of these, diagnostic cardiac catheterization and cardiac devices are the first and second most common procedures nationally, respectively.
| Readmission Procedure CCS Code | Total Categorized as Planned by Algorithm, N | Verified as Planned by Chart Review, N | Positive Predictive Value |
|---|---|---|---|
| |||
| 47 Diagnostic cardiac catheterization; coronary arteriography | 44 | 11 | 25% |
| 224 Cancer chemotherapy | 40 | 22 | 55% |
| 157 Amputation of lower extremity | 31 | 9 | 29% |
| 49 Other operating room heart procedures | 27 | 16 | 59% |
| 48 Insertion, revision, replacement, removal of cardiac pacemaker or cardioverter/defibrillator | 24 | 8 | 33% |
| 43 Heart valve procedures | 20 | 16 | 80% |
| Maintenance chemotherapy (diagnosis CCS 45) | 20 | 18 | 90% |
| 78 Colorectal resection | 18 | 9 | 50% |
| 169 Debridement of wound, infection or burn | 16 | 4 | 25% |
| 84 Cholecystectomy and common duct exploration | 16 | 5 | 31% |
| 99 Other OR gastrointestinal therapeutic procedures | 16 | 8 | 50% |
| 158 Spinal fusion | 15 | 11 | 73% |
| 142 Partial excision bone | 14 | 10 | 71% |
| 86 Other hernia repair | 14 | 6 | 42% |
| 44 Coronary artery bypass graft | 13 | 10 | 77% |
| 67 Other therapeutic procedures, hemic and lymphatic system | 13 | 13 | 100% |
| 211 Therapeutic radiology for cancer treatment | 12 | 0 | 0% |
| 45 Percutaneous transluminal coronary angioplasty | 11 | 7 | 64% |
| Total | 497 | 272 | 54.7% |
The readmissions with least abstractor agreement were those involving CCS 157 (amputation of lower extremity) and CCS 169 (debridement of wound, infection or burn). Readmissions for these procedures were nearly always performed as a consequence of acute worsening of chronic conditions such as osteomyelitis or ulceration. Abstractors were divided over whether these readmissions were appropriate to call planned.
Changes to the Algorithm
We determined that the accuracy of the algorithm would be improved by removing 2 procedure categories from the planned procedure list (therapeutic radiation [CCS 211] and cancer chemotherapy [CCS 224]), adding 1 diagnosis category to the acute diagnosis list (hypertension with complications [CCS 99]), and splitting 2 diagnosis condition categories into acute and nonacute ICD‐9‐CM codes (pancreatic disorders [CCS 149] and biliary tract disease [CCS 152]). Detailed rationales for each modification to the planned readmission algorithm are described in Table 4. We felt further examination of diagnostic cardiac catheterization and cardiac devices was warranted given their high frequency, despite low positive predictive value. We also elected not to alter the categorization of amputation or debridement because it was not easy to determine whether these admissions were planned or unplanned even with chart review. We plan further analyses of these procedure categories.
| Action | Diagnosis or Procedure Category | Algorithm | Chart | N | Rationale for Change |
|---|---|---|---|---|---|
| |||||
| Remove from planned procedure list | Therapeutic radiation (CCS 211) | Accurate | The algorithm was inaccurate in every case. All therapeutic radiology during readmissions was performed because of acute illness (pain crisis, neurologic crisis) or because scheduled treatment occurred during an unplanned readmission. In national data, this ranks as the 25th most common planned procedure identified by the algorithm v2.1. | ||
| Planned | Planned | 0 | |||
| Unplanned | Unplanned | 0 | |||
| Inaccurate | |||||
| Unplanned | Planned | 0 | |||
| Planned | Unplanned | 12 | |||
| Cancer chemotherapy (CCS 224) | Accurate | Of the 22 correctly identified as planned, 18 (82%) would already have been categorized as planned because of a principal diagnosis of maintenance chemotherapy. Therefore, removing CCS 224 from the planned procedure list would only miss a small fraction of planned readmissions but would avoid a large number of misclassifications. In national data, this ranks as the 8th most common planned procedure identified by the algorithm v2.1. | |||
| Planned | Planned | 22 | |||
| Unplanned | Unplanned | 0 | |||
| Inaccurate | |||||
| Unplanned | Planned | 0 | |||
| Planned | Unplanned | 18 | |||
| Add to planned procedure list | None | The abstractors felt a planned readmission was missed by the algorithm in 15 cases. A handful of these cases were missed because the planned procedure was not on the current planned procedure list; however, those procedures (eg, abdominal paracentesis, colonoscopy, endoscopy) were nearly always unplanned overall and should therefore not be added as procedures that potentially qualify as an admission as planned. | |||
| Remove from acute diagnosis list | None | The abstractors felt a planned readmission was missed by the algorithm in 15 cases. The relevant disqualifying acute diagnoses were much more often associated with unplanned readmissions in our dataset. | |||
| Add to acute diagnosis list | Hypertension with complications (CCS 99) | Accurate | This CCS was associated with only 1 planned readmission (for elective nephrectomy, a very rare procedure). Every other time this CCS appeared in the dataset, it was associated with an unplanned readmission (12/13, 92%); 10 of those, however, were misclassified by the algorithm as planned because they were not excluded by diagnosis (91% error rate). Consequently, adding this CCS to the acute diagnosis list is likely to miss only a very small fraction of planned readmissions, while making the overall algorithm much more accurate. | ||
| Planned | Planned | 1 | |||
| Unplanned | Unplanned | 2 | |||
| Inaccurate | |||||
| Unplanned | Planned | 0 | |||
| Planned | Unplanned | 10 | |||
| Split diagnosis condition category into component ICD‐9 codes | Pancreatic disorders (CCS 152) | Accurate | ICD‐9 code 577.0 (acute pancreatitis) is the only acute code in this CCS. Acute pancreatitis was present in 2 cases that were misclassified as planned. Clinically, there is no situation in which a planned procedure would reasonably be performed in the setting of acute pancreatitis. Moving ICD‐9 code 577.0 to the acute list and leaving the rest of the ICD‐9 codes in CCS 152 on the nonacute list will enable the algorithm to continue to identify planned procedures for chronic pancreatitis. | ||
| Planned | Planned | 0 | |||
| Unplanned | Unplanned | 1 | |||
| Inaccurate | |||||
| Unplanned | Planned | 0 | |||
| Planned | Unplanned | 2 | |||
| Biliary tract disease (CCS 149) | Accurate | This CCS is a mix of acute and chronic diagnoses. Of 14 charts classified as planned with CCS 149 in the principal diagnosis field, 12 were misclassified (of which 10 were associated with cholecystectomy). Separating out the acute and nonacute diagnoses will increase the accuracy of the algorithm while still ensuring that planned cholecystectomies and other procedures can be identified. Of the ICD‐9 codes in CCS 149, the following will be added to the acute diagnosis list: 574.0, 574.3, 574.6, 574.8, 575.0, 575.12, 576.1. | |||
| Planned | Planned | 2 | |||
| Unplanned | Unplanned | 3 | |||
| Inaccurate | |||||
| Unplanned | Planned | 0 | |||
| Planned | Unplanned | 12 | |||
| Consider for change after additional study | Diagnostic cardiac catheterization (CCS 47) | Accurate | The algorithm misclassified as planned 25/38 (66%) unplanned readmissions in which diagnostic catheterizations were the only qualifying planned procedure. It also correctly identified 3/3 (100%) planned readmissions in which diagnostic cardiac catheterizations were the only qualifying planned procedure. This is the highest volume procedure in national data. | ||
| Planned | Planned | 3* | |||
| Unplanned | Unplanned | 13* | |||
| Inaccurate | |||||
| Unplanned | Planned | 0* | |||
| Planned | Unplanned | 25* | |||
| Insertion, revision, replacement, removal of cardiac pacemaker or cardioverter/defibrillator (CCS 48) | Accurate | The algorithm misclassified as planned 4/5 (80%) unplanned readmissions in which cardiac devices were the only qualifying procedure. However, it also correctly identified 7/8 (87.5%) planned readmissions in which cardiac devices were the only qualifying planned procedure. CCS 48 is the second most common planned procedure category nationally. | |||
| Planned | Planned | 7 | |||
| Unplanned | Unplanned | 1 | |||
| Inaccurate | |||||
| Unplanned | Planned | 1 | |||
| Planned | Unplanned | 4 | |||
The revised algorithm (v3.0) had a weighted sensitivity of 49.8%, weighted specificity of 96.5%, positive predictive value of 58.7%, and negative predictive value of 94.5% (Table 2). In aggregate, these changes would increase the reported unplanned readmission rate from 16.0% to 16.1% in the hospital‐wide readmission measure, using 2011 to 2012 data, and would decrease the fraction of all readmissions considered planned from 7.8% to 7.2%.
DISCUSSION
We developed an algorithm based on administrative data that in its currently implemented form is very accurate at identifying unplanned readmissions, ensuring that readmissions included in publicly reported readmission measures are likely to be truly unplanned. However, nearly half of readmissions the algorithm classifies as planned are actually unplanned. That is, the algorithm is overcautious in excluding unplanned readmissions that could have counted as outcomes, particularly among admissions that include diagnostic cardiac catheterization or placement of cardiac devices (pacemakers, defibrillators). However, these errors only occur within the 7.8% of readmissions that are classified as planned and therefore do not affect overall readmission rates dramatically. A perfect algorithm would reclassify approximately half of these planned readmissions as unplanned, increasing the overall readmission rate by 0.6 percentage points.
On the other hand, the algorithm also only identifies approximately half of true planned readmissions as planned. Because the true prevalence of planned readmissions is low (approximately 9% of readmissions based on weighted chart review prevalence, or an absolute rate of 1.4%), this low sensitivity has a small effect on algorithm performance. Removing all true planned readmissions from the measure outcome would decrease the overall readmission rate by 0.8 percentage points, similar to the expected 0.6 percentage point increase that would result from better identifying unplanned readmissions; thus, a perfect algorithm would likely decrease the reported unplanned readmission rate by a net 0.2%. Overall, the existing algorithm appears to come close to the true prevalence of planned readmissions, despite inaccuracy on an individual‐case basis. The algorithm performed best at large hospitals, which are at greatest risk of being statistical outliers and of accruing penalties under the Hospital Readmissions Reduction Program.[10]
We identified several changes that marginally improved the performance of the algorithm by reducing the number of unplanned readmissions that are incorrectly removed from the measure, while avoiding the inappropriate inclusion of planned readmissions in the outcome. This revised algorithm, v3.0, was applied to public reporting of readmission rates at the end of 2014. Overall, implementing these changes increases the reported readmission rate very slightly. We also identified other procedures associated with high inaccuracy rates, removal of which would have larger impact on reporting rates, and which therefore merit further evaluation.
There are other potential methods of identifying planned readmissions. For instance, as of October 1, 2013, new administrative billing codes were created to allow hospitals to indicate that a patient was discharged with a planned acute‐care hospital inpatient readmission, without limitation as to when it will take place.[11] This code must be used at the time of the index admission to indicate that a future planned admission is expected, and was specified only to be used for neonates and patients with acute myocardial infarction. This approach, however, would omit planned readmissions that are not known to the initial discharging team, potentially missing planned readmissions. Conversely, some patients discharged with a plan for readmission may be unexpectedly readmitted for an unplanned reason. Given that the new codes were not available at the time we conducted the validation study, we were not able to determine how often the billing codes accurately identified planned readmissions. This would be an important area to consider for future study.
An alternative approach would be to create indicator codes to be applied at the time of readmission that would indicate whether that admission was planned or unplanned. Such a code would have the advantage of allowing each planned readmission to be flagged by the admitting clinicians at the time of admission rather than by an algorithm that inherently cannot be perfect. However, identifying planned readmissions at the time of readmission would also create opportunity for gaming and inconsistent application of definitions between hospitals; additional checks would need to be put in place to guard against these possibilities.
Our study has some limitations. We relied on the opinion of chart abstractors to determine whether a readmission was planned or unplanned; in a few cases, such as smoldering wounds that ultimately require surgical intervention, that determination is debatable. Abstractions were done at local institutions to minimize risks to patient privacy, and therefore we could not centrally verify determinations of planned status except by reviewing source of admission, dates of procedures, and narrative comments reported by the abstractors. Finally, we did not have sufficient volume of planned procedures to determine accuracy of the algorithm for less common procedure categories or individual procedures within categories.
In summary, we developed an algorithm to identify planned readmissions from administrative data that had high specificity and moderate sensitivity, and refined it based on chart validation. This algorithm is in use in public reporting of readmission measures to maximize the probability that the reported readmission rates represent truly unplanned readmissions.[12]
Disclosures: Financial supportThis work was performed under contract HHSM‐500‐2008‐0025I/HHSM‐500‐T0001, Modification No. 000008, titled Measure Instrument Development and Support, funded by the Centers for Medicare and Medicaid Services (CMS), an agency of the US Department of Health and Human Services. Drs. Horwitz and Ross are supported by the National Institute on Aging (K08 AG038336 and K08 AG032886, respectively) and by the American Federation for Aging Research through the Paul B. Beeson Career Development Award Program. Dr. Krumholz is supported by grant U01 HL105270‐05 (Center for Cardiovascular Outcomes Research at Yale University) from the National Heart, Lung, and Blood Institute. No funding source had any role in the study design; in the collection, analysis, and interpretation of data; or in the writing of the article. The CMS reviewed and approved the use of its data for this work and approved submission of the manuscript. All authors have completed the Unified Competing Interest form at
- , , , et al. Development, validation, and results of a measure of 30‐day readmission following hospitalization for pneumonia. J Hosp Med. 2011;6(3):142–150.
- , , , et al. An administrative claims measure suitable for profiling hospital performance based on 30‐day all‐cause readmission rates among patients with acute myocardial infarction. Circ Cardiovasc Qual Outcomes. 2011;4(2):243–252.
- , , , et al. An administrative claims measure suitable for profiling hospital performance on the basis of 30‐day all‐cause readmission rates among patients with heart failure. Circ Cardiovasc Qual Outcomes. 2008;1:29–37.
- , , , et al. Hospital‐level 30‐day all‐cause risk‐standardized readmission rate following elective primary total hip arthroplasty (THA) and/or total knee arthroplasty (TKA). Available at: http://www.qualitynet.org/dcs/ContentServer?c=Page161(supp10 l):S66–S75.
- , , A meta‐analysis of hospital 30‐day avoidable readmission rates. J Eval Clin Pract. 2011;18(6):1211–1218.
- , , , , Proportion of hospital readmissions deemed avoidable: a systematic review. CMAJ. 2011;183(7):E391–E402.
- , , , et al. Centers for Medicare 3(4):477–492.
- , Characteristics of hospitals receiving penalties under the Hospital Readmissions Reduction Program. JAMA. 2013;309(4):342–343.
- Centers for Medicare and Medicaid Services. Inpatient Prospective Payment System/Long‐Term Care Hospital (IPPS/LTCH) final rule. Fed Regist. 2013;78:50533–50534.
- , , Massachusetts health reforms: uninsurance remains low, self‐reported health status improves as state prepares to tackle costs. Health Aff (Millwood). 2012;31(2):444–451.
© 2015 Society of Hospital Medicine
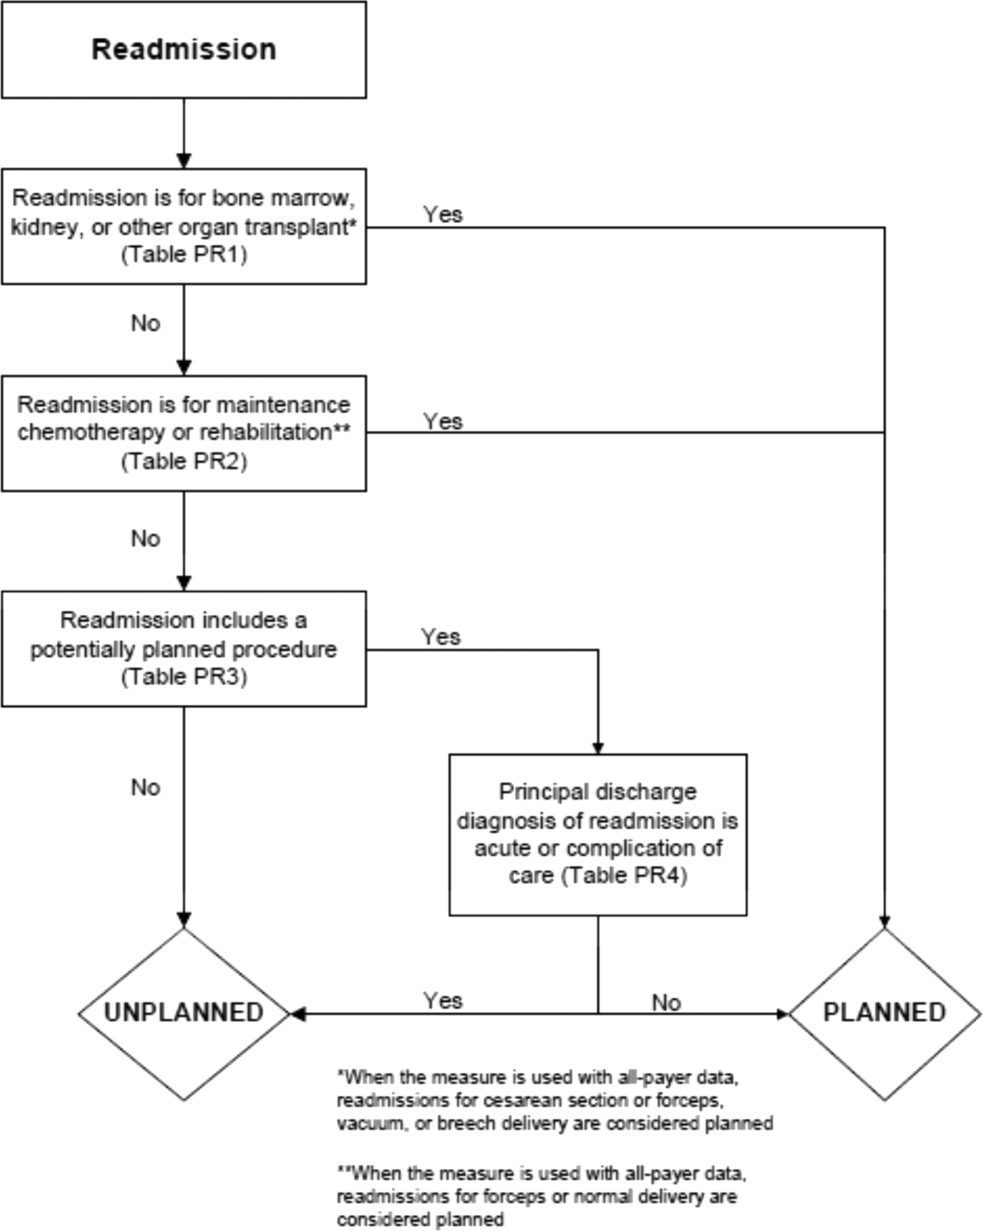
Hospital Mortality Measure for COPD
Chronic obstructive pulmonary disease (COPD) affects as many as 24 million individuals in the United States, is responsible for more than 700,000 annual hospital admissions, and is currently the nation's third leading cause of death, accounting for nearly $49.9 billion in medical spending in 2010.[1, 2] Reported in‐hospital mortality rates for patients hospitalized for exacerbations of COPD range from 2% to 5%.[3, 4, 5, 6, 7] Information about 30‐day mortality rates following hospitalization for COPD is more limited; however, international studies suggest that rates range from 3% to 9%,[8, 9] and 90‐day mortality rates exceed 15%.[10]
Despite this significant clinical and economic impact, there have been no large‐scale, sustained efforts to measure the quality or outcomes of hospital care for patients with COPD in the United States. What little is known about the treatment of patients with COPD suggests widespread opportunities to increase adherence to guideline‐recommended therapies, to reduce the use of ineffective treatments and tests, and to address variation in care across institutions.[5, 11, 12]
Public reporting of hospital performance is a key strategy for improving the quality and safety of hospital care, both in the United States and internationally.[13] Since 2007, the Centers for Medicare and Medicaid Services (CMS) has reported hospital mortality rates on the Hospital Compare Web site, and COPD is 1 of the conditions highlighted in the Affordable Care Act for future consideration.[14] Such initiatives rely on validated, risk‐adjusted performance measures for comparisons across institutions and to enable outcomes to be tracked over time. We present the development, validation, and results of a model intended for public reporting of risk‐standardized mortality rates for patients hospitalized with exacerbations of COPD that has been endorsed by the National Quality Forum.[15]
METHODS
Approach to Measure Development
We developed this measure in accordance with guidelines described by the National Quality Forum,[16] CMS' Measure Management System,[17] and the American Heart Association scientific statement, Standards for Statistical Models Used for Public Reporting of Health Outcomes.[18] Throughout the process we obtained expert clinical and stakeholder input through meetings with a clinical advisory group and a national technical expert panel (see Acknowledgments). Last, we presented the proposed measure specifications and a summary of the technical expert panel discussions online and made a widely distributed call for public comments. We took the comments into consideration during the final stages of measure development (available at
Data Sources
We used claims data from Medicare inpatient, outpatient, and carrier (physician) Standard Analytic Files from 2008 to develop and validate the model, and examined model reliability using data from 2007 and 2009. The Medicare enrollment database was used to determine Medicare Fee‐for‐Service enrollment and mortality.
Study Cohort
Admissions were considered eligible for inclusion if the patient was 65 years or older, was admitted to a nonfederal acute care hospital in the United States, and had a principal diagnosis of COPD or a principal diagnosis of acute respiratory failure or respiratory arrest when paired with a secondary diagnosis of COPD with exacerbation (Table 1).
| ICD‐9‐CM | Description |
|---|---|
| |
| 491.21 | Obstructive chronic bronchitis; with (acute) exacerbation; acute exacerbation of COPD, decompensated COPD, decompensated COPD with exacerbation |
| 491.22 | Obstructive chronic bronchitis; with acute bronchitis |
| 491.8 | Other chronic bronchitis; chronic: tracheitis, tracheobronchitis |
| 491.9 | Unspecified chronic bronchitis |
| 492.8 | Other emphysema; emphysema (lung or pulmonary): NOS, centriacinar, centrilobular, obstructive, panacinar, panlobular, unilateral, vesicular; MacLeod's syndrome; Swyer‐James syndrome; unilateral hyperlucent lung |
| 493.20 | Chronic obstructive asthma; asthma with COPD, chronic asthmatic bronchitis, unspecified |
| 493.21 | Chronic obstructive asthma; asthma with COPD, chronic asthmatic bronchitis, with status asthmaticus |
| 493.22 | Chronic obstructive asthma; asthma with COPD, chronic asthmatic bronchitis, with (acute) exacerbation |
| 496 | Chronic: nonspecific lung disease, obstructive lung disease, obstructive pulmonary disease (COPD) NOS. (Note: This code is not to be used with any code from categories 491493.) |
| 518.81a | Other diseases of lung; acute respiratory failure; respiratory failure NOS |
| 518.82a | Other diseases of lung; acute respiratory failure; other pulmonary insufficiency, acute respiratory distress |
| 518.84a | Other diseases of lung; acute respiratory failure; acute and chronic respiratory failure |
| 799.1a | Other ill‐defined and unknown causes of morbidity and mortality; respiratory arrest, cardiorespiratory failure |
If a patient was discharged and readmitted to a second hospital on the same or the next day, we combined the 2 acute care admissions into a single episode of care and assigned the mortality outcome to the first admitting hospital. We excluded admissions for patients who were enrolled in Medicare Hospice in the 12 months prior to or on the first day of the index hospitalization. An index admission was any eligible admission assessed in the measure for the outcome. We also excluded admissions for patients who were discharged against medical advice, those for whom vital status at 30 days was unknown or recorded inconsistently, and patients with unreliable data (eg, age >115 years). For patients with multiple hospitalizations during a single year, we randomly selected 1 admission per patient to avoid survival bias. Finally, to assure adequate risk adjustment we limited the analysis to patients who had continuous enrollment in Medicare Fee‐for‐Service Parts A and B for the 12 months prior to their index admission so that we could identify comorbid conditions coded during all prior encounters.
Outcomes
The outcome of 30‐day mortality was defined as death from any cause within 30 days of the admission date for the index hospitalization. Mortality was assessed at 30 days to standardize the period of outcome ascertainment,[19] and because 30 days is a clinically meaningful time frame, during which differences in the quality of hospital care may be revealed.
Risk‐Adjustment Variables
We randomly selected half of all COPD admissions in 2008 that met the inclusion and exclusion criteria to create a model development sample. Candidate variables for inclusion in the risk‐standardized model were selected by a clinician team from diagnostic groups included in the Hierarchical Condition Category clinical classification system[20] and included age and comorbid conditions. Sleep apnea (International Classification of Diseases, 9th Revision, Clinical Modification [ICD‐9‐CM] condition codes 327.20, 327.21, 327.23, 327.27, 327.29, 780.51, 780.53, and 780.57) and mechanical ventilation (ICD‐9‐CM procedure codes 93.90, 96.70, 96.71, and 96.72) were also included as candidate variables.
We defined a condition as present for a given patient if it was coded in the inpatient, outpatient, or physician claims data sources in the preceding 12 months, including the index admission. Because a subset of the condition category variables can represent a complication of care, we did not consider them to be risk factors if they appeared only as secondary diagnosis codes for the index admission and not in claims submitted during the prior year.
We selected final variables for inclusion in the risk‐standardized model based on clinical considerations and a modified approach to stepwise logistic regression. The final patient‐level risk‐adjustment model included 42 variables (Table 2).
| Variable | Development Sample (150,035 Admissions at 4537 Hospitals) | Validation Sample (149,646 Admissions at 4535 Hospitals) | ||||
|---|---|---|---|---|---|---|
| Frequency, % | OR | 95% CI | Frequency, % | OR | 95% CI | |
| ||||||
| Demographics | ||||||
| Age 65 years (continuous) | 1.03 | 1.03‐1.04 | 1.03 | 1.03‐1.04 | ||
| Cardiovascular/respiratory | ||||||
| Sleep apnea (ICD‐9‐CM: 327.20, 327.21, 327.23, 327.27, 327.29, 780.51, 780.53, 780.57)a | 9.57 | 0.87 | 0.81‐0.94 | 9.72 | 0.84 | 0.78‐0.90 |
| History of mechanical ventilation (ICD‐9‐CM: 93.90, 96.70, 96.71, 96.72)a | 6.00 | 1.19 | 1.11‐1.27 | 6.00 | 1.15 | 1.08‐1.24 |
| Respirator dependence/respiratory failure (CC 7778)a | 1.15 | 0.89 | 0.77‐1.02 | 1.20 | 0.78 | 0.68‐0.91 |
| Cardiorespiratory failure and shock (CC 79) | 26.35 | 1.60 | 1.53‐1.68 | 26.34 | 1.59 | 1.52‐1.66 |
| Congestive heart failure (CC 80) | 41.50 | 1.34 | 1.28‐1.39 | 41.39 | 1.31 | 1.25‐1.36 |
| Chronic atherosclerosis (CC 8384)a | 50.44 | 0.87 | 0.83‐0.90 | 50.12 | 0.91 | 0.87‐0.94 |
| Arrhythmias (CC 9293) | 37.15 | 1.17 | 1.12‐1.22 | 37.06 | 1.15 | 1.10‐1.20 |
| Vascular or circulatory disease (CC 104106) | 38.20 | 1.09 | 1.05‐1.14 | 38.09 | 1.02 | 0.98‐1.06 |
| Fibrosis of lung and other chronic lung disorder (CC 109) | 16.96 | 1.08 | 1.03‐1.13 | 17.08 | 1.11 | 1.06‐1.17 |
| Asthma (CC 110) | 17.05 | 0.67 | 0.63‐0.70 | 16.90 | 0.67 | 0.63‐0.70 |
| Pneumonia (CC 111113) | 49.46 | 1.29 | 1.24‐1.35 | 49.41 | 1.27 | 1.22‐1.33 |
| Pleural effusion/pneumothorax (CC 114) | 11.78 | 1.17 | 1.11‐1.23 | 11.54 | 1.18 | 1.12‐1.25 |
| Other lung disorders (CC 115) | 53.07 | 0.80 | 0.77‐0.83 | 53.17 | 0.83 | 0.80‐0.87 |
| Other comorbid conditions | ||||||
| Metastatic cancer and acute leukemia (CC 7) | 2.76 | 2.34 | 2.14‐2.56 | 2.79 | 2.15 | 1.97‐2.35 |
| Lung, upper digestive tract, and other severe cancers (CC 8)a | 5.98 | 1.80 | 1.68‐1.92 | 6.02 | 1.98 | 1.85‐2.11 |
| Lymphatic, head and neck, brain, and other major cancers; breast, prostate, colorectal and other cancers and tumors; other respiratory and heart neoplasms (CC 911) | 14.13 | 1.03 | 0.97‐1.08 | 14.19 | 1.01 | 0.95‐1.06 |
| Other digestive and urinary neoplasms (CC 12) | 6.91 | 0.91 | 0.84‐0.98 | 7.05 | 0.85 | 0.79‐0.92 |
| Diabetes and DM complications (CC 1520, 119120) | 38.31 | 0.91 | 0.87‐0.94 | 38.29 | 0.91 | 0.87‐0.94 |
| Protein‐calorie malnutrition (CC 21) | 7.40 | 2.18 | 2.07‐2.30 | 7.44 | 2.09 | 1.98‐2.20 |
| Disorders of fluid/electrolyte/acid‐base (CC 2223) | 32.05 | 1.13 | 1.08‐1.18 | 32.16 | 1.24 | 1.19‐1.30 |
| Other endocrine/metabolic/nutritional disorders (CC 24) | 67.99 | 0.75 | 0.72‐0.78 | 67.88 | 0.76 | 0.73‐0.79 |
| Other gastrointestinal disorders (CC 36) | 56.21 | 0.81 | 0.78‐0.84 | 56.18 | 0.78 | 0.75‐0.81 |
| Osteoarthritis of hip or knee (CC 40) | 9.32 | 0.74 | 0.69‐0.79 | 9.33 | 0.80 | 0.74‐0.85 |
| Other musculoskeletal and connective tissue disorders (CC 43) | 64.14 | 0.83 | 0.80‐0.86 | 64.20 | 0.83 | 0.80‐0.87 |
| Iron deficiency and other/unspecified anemias and blood disease (CC 47) | 40.80 | 1.08 | 1.04‐1.12 | 40.72 | 1.08 | 1.04‐1.13 |
| Dementia and senility (CC 4950) | 17.06 | 1.09 | 1.04‐1.14 | 16.97 | 1.09 | 1.04‐1.15 |
| Drug/alcohol abuse, without dependence (CC 53)a | 23.51 | 0.78 | 0.75‐0.82 | 23.38 | 0.76 | 0.72‐0.80 |
| Other psychiatric disorders (CC 60)a | 16.49 | 1.12 | 1.07‐1.18 | 16.43 | 1.12 | 1.06‐1.17 |
| Quadriplegia, paraplegia, functional disability (CC 6769, 100102, 177178) | 4.92 | 1.03 | 0.95‐1.12 | 4.92 | 1.08 | 0.99‐1.17 |
| Mononeuropathy, other neurological conditions/emnjuries (CC 76) | 11.35 | 0.85 | 0.80‐0.91 | 11.28 | 0.88 | 0.83‐0.93 |
| Hypertension and hypertensive disease (CC 9091) | 80.40 | 0.78 | 0.75‐0.82 | 80.35 | 0.79 | 0.75‐0.83 |
| Stroke (CC 9596)a | 6.77 | 1.00 | 0.93‐1.08 | 6.73 | 0.98 | 0.91‐1.05 |
| Retinal disorders, except detachment and vascular retinopathies (CC 121) | 10.79 | 0.87 | 0.82‐0.93 | 10.69 | 0.90 | 0.85‐0.96 |
| Other eye disorders (CC 124)a | 19.05 | 0.90 | 0.86‐0.95 | 19.13 | 0.98 | 0.85‐0.93 |
| Other ear, nose, throat, and mouth disorders (CC 127) | 35.21 | 0.83 | 0.80‐0.87 | 35.02 | 0.80 | 0.77‐0.83 |
| Renal failure (CC 131)a | 17.92 | 1.12 | 1.07‐1.18 | 18.16 | 1.13 | 1.08‐1.19 |
| Decubitus ulcer or chronic skin ulcer (CC 148149) | 7.42 | 1.27 | 1.19‐1.35 | 7.42 | 1.33 | 1.25‐1.42 |
| Other dermatological disorders (CC 153) | 28.46 | 0.90 | 0.87‐0.94 | 28.32 | 0.89 | 0.86‐0.93 |
| Trauma (CC 154156, 158161) | 9.04 | 1.09 | 1.03‐1.16 | 8.99 | 1.15 | 1.08‐1.22 |
| Vertebral fractures (CC 157) | 5.01 | 1.33 | 1.24‐1.44 | 4.97 | 1.29 | 1.20‐1.39 |
| Major complications of medical care and trauma (CC 164) | 5.47 | 0.81 | 0.75‐0.88 | 5.55 | 0.82 | 0.76‐0.89 |
Model Derivation
We used hierarchical logistic regression models to model the log‐odds of mortality as a function of patient‐level clinical characteristics and a random hospital‐level intercept. At the patient level, each model adjusts the log‐odds of mortality for age and the selected clinical covariates. The second level models the hospital‐specific intercepts as arising from a normal distribution. The hospital intercept represents the underlying risk of mortality, after accounting for patient risk. If there were no differences among hospitals, then after adjusting for patient risk, the hospital intercepts should be identical across all hospitals.
Estimation of Hospital Risk‐Standardized Mortality Rate
We calculated a risk‐standardized mortality rate, defined as the ratio of predicted to expected deaths (similar to observed‐to‐expected), multiplied by the national unadjusted mortality rate.[21] The expected number of deaths for each hospital was estimated by applying the estimated regression coefficients to the characteristics of each hospital's patients, adding the average of the hospital‐specific intercepts, transforming the data by using an inverse logit function, and summing the data from all patients in the hospital to obtain the count. The predicted number of deaths was calculated in the same way, substituting the hospital‐specific intercept for the average hospital‐specific intercept.
Model Performance, Validation, and Reliability Testing
We used the remaining admissions in 2008 as the model validation sample. We computed several summary statistics to assess the patient‐level model performance in both the development and validation samples,[22] including over‐fitting indices, predictive ability, area under the receiver operating characteristic (ROC) curve, distribution of residuals, and model 2. In addition, we assessed face validity through a survey of members of the technical expert panel. To assess reliability of the model across data years, we repeated the modeling process using qualifying COPD admissions in both 2007 and 2009. Finally, to assess generalizability we evaluated the model's performance in an all‐payer sample of data from patients admitted to California hospitals in 2006.
Analyses were conducted using SAS version 9.1.3 (SAS Institute Inc., Cary, NC). We estimated the hierarchical models using the GLIMMIX procedure in SAS.
The Human Investigation Committee at the Yale University School of Medicine/Yale New Haven Hospital approved an exemption (HIC#0903004927) for the authors to use CMS claims and enrollment data for research analyses and publication.
RESULTS
Model Derivation
After exclusions were applied, the development sample included 150,035 admissions in 2008 at 4537 US hospitals (Figure 1). Factors that were most strongly associated with the risk of mortality included metastatic cancer (odds ratio [OR] 2.34), protein calorie malnutrition (OR 2.18), nonmetastatic cancers of the lung and upper digestive tract, (OR 1.80) cardiorespiratory failure and shock (OR 1.60), and congestive heart failure (OR 1.34) (Table 2).

Model Performance, Validation, and Reliability
The model had a C statistic of 0.72, indicating good discrimination, and predicted mortality in the development sample ranged from 1.52% in the lowest decile to 23.74% in the highest. The model validation sample, using the remaining cases from 2008, included 149,646 admissions from 4535 hospitals. Variable frequencies and ORs were similar in both samples (Table 2). Model performance was also similar in the validation samples, with good model discrimination and fit (Table 3). Ten of 12 technical expert panel members responded to the survey, of whom 90% at least somewhat agreed with the statement, the COPD mortality measure provides an accurate reflection of quality. When the model was applied to patients age 18 years and older in the 2006 California Patient Discharge Data, overall discrimination was good (C statistic, 0.74), including in those age 18 to 64 years (C statistic, 0.75; 65 and above C statistic, 0.70).
| Development | Validation | Data Years | ||
|---|---|---|---|---|
| Indices | Sample, 2008 | Sample, 2008 | 2007 | 2009 |
| ||||
| Number of admissions | 150,035 | 149,646 | 259,911 | 279,377 |
| Number of hospitals | 4537 | 4535 | 4636 | 4571 |
| Mean risk‐standardized mortality rate, % (SD) | 8.62 (0.94) | 8.64 (1.07) | 8.97 (1.12) | 8.08 (1.09) |
| Calibration, 0, 1 | 0.034, 0.985 | 0.009, 1.004 | 0.095, 1.022 | 0.120, 0.981 |
| Discriminationpredictive ability, lowest decile %highest decile % | 1.5223.74 | 1.6023.78 | 1.5424.64 | 1.4222.36 |
| Discriminationarea under the ROC curve, C statistic | 0.720 | 0.723 | 0.728 | 0.722 |
| Residuals lack of fit, Pearson residual fall % | ||||
| 2 | 0 | 0 | 0 | 0 |
| 2, 0 | 91.14 | 91.4 | 91.08 | 91.93 |
| 0, 2 | 1.66 | 1.7 | 1.96 | 1.42 |
| 2+ | 6.93 | 6.91 | 6.96 | 6.65 |
| Model Wald 2 (number of covariates) | 6982.11 (42) | 7051.50 (42) | 13042.35 (42) | 12542.15 (42) |
| P value | <0.0001 | <0.0001 | <0.0001 | <0.0001 |
| Between‐hospital variance, (standard error) | 0.067 (0.008) | 0.078 (0.009) | 0.067 (0.006) | 0.072 (0.006) |
Reliability testing demonstrated consistent performance over several years. The frequency and ORs of the variables included in the model showed only minor changes over time. The area under the ROC curve (C statistic) was 0.73 for the model in the 2007 sample and 0.72 for the model using 2009 data (Table 3).
Hospital Risk‐Standardized Mortality Rates
The mean unadjusted hospital 30‐day mortality rate was 8.6% and ranged from 0% to 100% (Figure 2a). Risk‐standardized mortality rates varied across hospitals (Figure 2b). The mean risk‐standardized mortality rate was 8.6% and ranged from 5.9% to 13.5%. The odds of mortality at a hospital 1 standard deviation above average was 1.20 times that of a hospital 1 standard deviation below average.
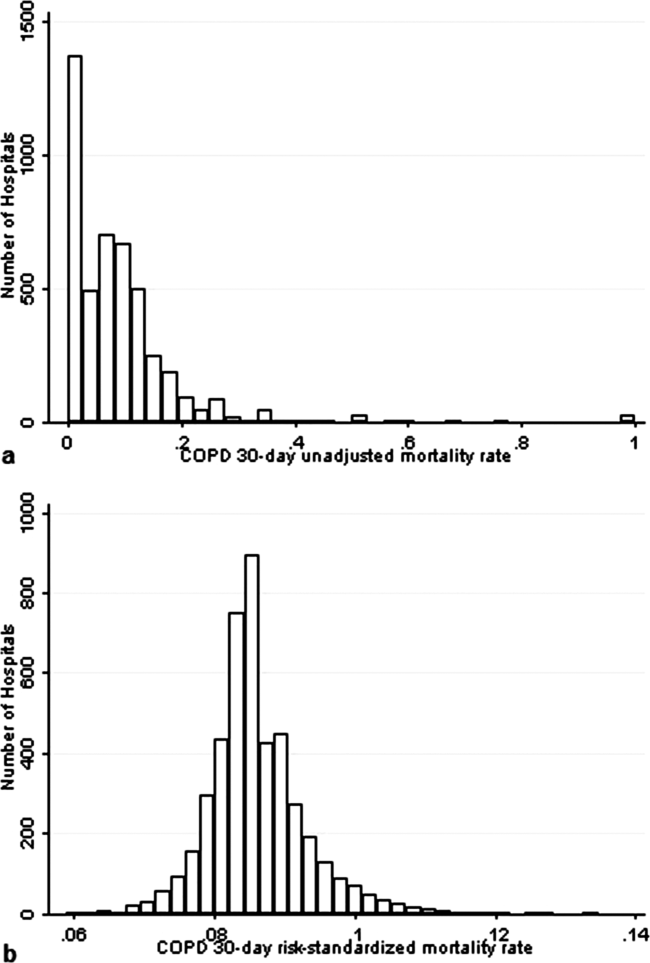
DISCUSSION
We present a hospital‐level risk‐standardized mortality measure for patients admitted with COPD based on administrative claims data that are intended for public reporting and that have achieved endorsement by the National Quality Forum, a voluntary consensus standards‐setting organization. Across more than 4500 US hospitals, the mean 30‐day risk‐standardized mortality rate in 2008 was 8.6%, and we observed considerable variation across institutions, despite adjustment for case mix, suggesting that improvement by lower‐performing institutions may be an achievable goal.
Although improving the delivery of evidence‐based care processes and outcomes of patients with acute myocardial infarction, heart failure, and pneumonia has been the focus of national quality improvement efforts for more than a decade, COPD has largely been overlooked.[23] Within this context, this analysis represents the first attempt to systematically measure, at the hospital level, 30‐day all‐cause mortality for patients admitted to US hospitals for exacerbation of COPD. The model we have developed and validated is intended to be used to compare the performance of hospitals while controlling for differences in the pretreatment risk of mortality of patients and accounting for the clustering of patients within hospitals, and will facilitate surveillance of hospital‐level risk‐adjusted outcomes over time.
In contrast to process‐based measures of quality, such as the percentage of patients with pneumonia who receive appropriate antibiotic therapy, performance measures based on patient outcomes provide a more comprehensive view of care and are more consistent with patients' goals.[24] Additionally, it is well established that hospital performance on individual and composite process measures explains only a small amount of the observed variation in patient outcomes between institutions.[25] In this regard, outcome measures incorporate important, but difficult to measure aspects of care, such as diagnostic accuracy and timing, communication and teamwork, the recognition and response to complications, care coordination at the time of transfers between levels of care, and care settings. Nevertheless, when used for making inferences about the quality of hospital care, individual measures such as the risk‐standardized hospital mortality rate should be interpreted in the context of other performance measures, including readmission, patient experience, and costs of care.
A number of prior investigators have described the outcomes of care for patients hospitalized with exacerbations of COPD, including identifying risk factors for mortality. Patil et al. carried out an analysis of the 1996 Nationwide Inpatient Sample and described an overall in‐hospital mortality rate of 2.5% among patients with COPD, and reported that a multivariable model containing sociodemographic characteristics about the patient and comorbidities had an area under the ROC curve of 0.70.[3] In contrast, this hospital‐level measure includes patients with a principal diagnosis of respiratory failure and focuses on 30‐day rather than inpatient mortality, accounting for the nearly 3‐fold higher mortality rate we observed. In a more recent study that used clinical from a large multistate database, Tabak et al. developed a prediction model for inpatient mortality for patients with COPD that contained only 4 factors: age, blood urea nitrogen, mental status, and pulse, and achieved an area under the ROC curve of 0.72.[4] The simplicity of such a model and its reliance on clinical measurements makes it particularly well suited for bedside application by clinicians, but less valuable for large‐scale public reporting programs that rely on administrative data. In the only other study identified that focused on the assessment of hospital mortality rates, Agabiti et al. analyzed the outcomes of 12,756 patients hospitalized for exacerbations of COPD, using similar ICD‐9‐CM diagnostic criteria as in this study, at 21 hospitals in Rome, Italy.[26] They reported an average crude 30‐day mortality rate of 3.8% among a group of 5 benchmark hospitals and an average mortality of 7.5% (range, 5.2%17.2%) among the remaining institutions.
To put the variation we observed in mortality rates into a broader context, the relative difference in the risk‐standardized hospital mortality rates across the 10th to 90th percentiles of hospital performance was 25% for acute myocardial infarction and 39% for heart failure, whereas rates varied 30% for COPD, from 7.6% to 9.9%.[27] Model discrimination in COPD (C statistic, 0.72) was also similar to that reported for models used for public reporting of hospital mortality in acute myocardial infarction (C statistic, 0.71) and pneumonia (C statistic, 0.72).
This study has a number of important strengths. First, the model was developed from a large sample of recent Medicare claims, achieved good discrimination, and was validated in samples not limited to Medicare beneficiaries. Second, by including patients with a principal diagnosis of COPD, as well as those with a principal diagnosis of acute respiratory failure when accompanied by a secondary diagnosis of COPD with acute exacerbation, this model can be used to assess hospital performance across the full spectrum of disease severity. This broad set of ICD‐9‐CM codes used to define the cohort also ensures that efforts to measure hospital performance will be less influenced by differences in documentation and coding practices across hospitals relating to the diagnosis or sequencing of acute respiratory failure diagnoses. Moreover, the inclusion of patients with respiratory failure is important because these patients have the greatest risk of mortality, and are those in whom efforts to improve the quality and safety of care may have the greatest impact. Third, rather than relying solely on information documented during the index admission, we used ambulatory and inpatient claims from the full year prior to the index admission to identify comorbidities and to distinguish them from potential complications of care. Finally, we did not include factors such as hospital characteristics (eg, number of beds, teaching status) in the model. Although they might have improved overall predictive ability, the goal of the hospital mortality measure is to enable comparisons of mortality rates among hospitals while controlling for differences in patient characteristics. To the extent that factors such as size or teaching status might be independently associated with hospital outcomes, it would be inappropriate to adjust away their effects, because mortality risk should not be influenced by hospital characteristics other than through their effects on quality.
These results should be viewed in light of several limitations. First, we used ICD‐9‐CM codes derived from claims files to define the patient populations included in the measure rather than collecting clinical or physiologic information prospectively or through manual review of medical records, such as the forced expiratory volume in 1 second or whether the patient required long‐term oxygen therapy. Nevertheless, we included a broad set of potential diagnosis codes to capture the full spectrum of COPD exacerbations and to minimize differences in coding across hospitals. Second, because the risk‐adjustment included diagnoses coded in the year prior to the index admission, it is potentially subject to bias due to regional differences in medical care utilization that are not driven by underlying differences in patient illness.[28] Third, using administrative claims data, we observed some paradoxical associations in the model that are difficult to explain on clinical grounds, such as a protective effect of substance and alcohol abuse or prior episodes of respiratory failure. Fourth, although we excluded patients from the analysis who were enrolled in hospice prior to, or on the day of, the index admission, we did not exclude those who choose to withdraw support, transition to comfort measures only, or enrolled in hospice care during a hospitalization. We do not seek to penalize hospitals for being sensitive to the preferences of patients at the end of life. At the same time, it is equally important that the measure is capable of detecting the outcomes of suboptimal care that may in some instances lead a patient or their family to withdraw support or choose hospice. Finally, we did not have the opportunity to validate the model against a clinical registry of patients with COPD, because such data do not currently exist. Nevertheless, the use of claims as a surrogate for chart data for risk adjustment has been validated for several conditions, including acute myocardial infarction, heart failure, and pneumonia.[29, 30]
CONCLUSIONS
Risk‐standardized 30‐day mortality rates for Medicare beneficiaries with COPD vary across hospitals in the US. Calculating and reporting hospital outcomes using validated performance measures may catalyze quality improvement activities and lead to better outcomes. Additional research would be helpful to confirm that hospitals with lower mortality rates achieve care that meets the goals of patients and their families better than at hospitals with higher mortality rates.
Acknowledgment
The authors thank the following members of the technical expert panel: Darlene Bainbridge, RN, MS, NHA, CPHQ, CPHRM, President/CEO, Darlene D. Bainbridge & Associates, Inc.; Robert A. Balk, MD, Director of Pulmonary and Critical Care Medicine, Rush University Medical Center; Dale Bratzler, DO, MPH, President and CEO, Oklahoma Foundation for Medical Quality; Scott Cerreta, RRT, Director of Education, COPD Foundation; Gerard J. Criner, MD, Director of Temple Lung Center and Divisions of Pulmonary and Critical Care Medicine, Temple University; Guy D'Andrea, MBA, President, Discern Consulting; Jonathan Fine, MD, Director of Pulmonary Fellowship, Research and Medical Education, Norwalk Hospital; David Hopkins, MS, PhD, Senior Advisor, Pacific Business Group on Health; Fred Martin Jacobs, MD, JD, FACP, FCCP, FCLM, Executive Vice President and Director, Saint Barnabas Quality Institute; Natalie Napolitano, MPH, RRT‐NPS, Respiratory Therapist, Inova Fairfax Hospital; Russell Robbins, MD, MBA, Principal and Senior Clinical Consultant, Mercer. In addition, the authors acknowledge and thank Angela Merrill, Sandi Nelson, Marian Wrobel, and Eric Schone from Mathematica Policy Research, Inc., Sharon‐Lise T. Normand from Harvard Medical School, and Lein Han and Michael Rapp at The Centers for Medicare & Medicaid Services for their contributions to this work.
Disclosures
Peter K. Lindenauer, MD, MSc, is the guarantor of this article, taking responsibility for the integrity of the work as a whole, from inception to published article, and takes responsibility for the content of the manuscript, including the data and data analysis. All authors have made substantial contributions to the conception and design, or acquisition of data, or analysis and interpretation of data; have drafted the submitted article or revised it critically for important intellectual content; and have provided final approval of the version to be published. Preparation of this manuscript was completed under Contract Number: HHSM‐5002008‐0025I/HHSM‐500‐T0001, Modification No. 000007, Option Year 2 Measure Instrument Development and Support (MIDS). Sponsors did not contribute to the development of the research or manuscript. Dr. Au reports being an unpaid research consultant for Bosch Inc. He receives research funding from the NIH, Department of Veterans Affairs, AHRQ, and Gilead Sciences. The views of the this manuscript represent the authors and do not necessarily represent those of the Department of Veterans Affairs. Drs. Drye and Bernheim report receiving contract funding from CMS to develop and maintain quality measures.
- FASTSTATS—chronic lower respiratory disease. Available at: http://www.cdc.gov/nchs/fastats/copd.htm. Accessed September 18, 2010.
- National Heart, Lung and Blood Institute. Morbidity and mortality chartbook. Available at: http://www.nhlbi.nih.gov/resources/docs/cht‐book.htm. Accessed April 27, 2010.
- , , , . In‐hospital mortality following acute exacerbations of chronic obstructive pulmonary disease. Arch Intern Med. 2003;163(10):1180–1186.
- , , , , . Mortality and need for mechanical ventilation in acute exacerbations of chronic obstructive pulmonary disease: development and validation of a simple risk score. Arch Intern Med. 2009;169(17):1595–1602.
- , , , , , . Quality of care for patients hospitalized for acute exacerbations of chronic obstructive pulmonary disease. Ann Intern Med. 2006;144(12):894–903.
- , , , , . Use of beta blockers and the risk of death in hospitalised patients with acute exacerbations of COPD. Thorax. 2008;63(4):301–305.
- , , , , . HCUP facts and figures: statistics on hospital‐based care in the United States, 2007. 2009. Available at: http://www.hcup‐us.ahrq.gov/reports.jsp. Accessed August 6, 2012.
- , . Predictors of long‐term survival in elderly patients hospitalized for acute exacerbations of chronic obstructive pulmonary disease. Respirology. 2008;13(6):851–855.
- , , , , , . The impact on risk‐factor analysis of different mortality outcomes in COPD patients. Eur Respir J 2008;32(3):629–636.
- , , , , , . Clinical audit indicators of outcome following admission to hospital with acute exacerbation of chronic obstructive pulmonary disease. Thorax. 2002;57(2):137–141.
- , , , et al. The quality of obstructive lung disease care for adults in the United States as measured by adherence to recommended processes. Chest. 2006;130(6):1844–1850.
- , , , , , . Management of acute exacerbations of chronic obstructive pulmonary disease in the elderly: physician practices in the community hospital setting. J Okla State Med Assoc. 2004;97(6):227–232.
- , , . Leadership by Example: Coordinating Government Roles in Improving Health Care Quality. Washington, DC: National Academies Press; 2002.
- Patient Protection and Affordable Care Act [H.R. 3590], Pub. L. No. 111–148, §2702, 124 Stat. 119, 318–319 (March 23, 2010). Available at: http://www.gpo.gov/fdsys/pkg/PLAW‐111publ148/html/PLAW‐111publ148.htm. Accessed July 15, 2012.
- National Quality Forum. NQF Endorses Additional Pulmonary Measure. 2013. Available at: http://www.qualityforum.org/News_And_Resources/Press_Releases/2013/NQF_Endorses_Additional_Pulmonary_Measure.aspx. Accessed January 11, 2013.
- National Quality Forum. National voluntary consensus standards for patient outcomes: a consensus report. Washington, DC: National Quality Forum; 2011.
- The Measures Management System. The Centers for Medicare and Medicaid Services. Available at: http://www.cms.gov/Medicare/Quality‐Initiatives‐Patient‐Assessment‐Instruments/MMS/index.html?redirect=/MMS/. Accessed August 6, 2012.
- , , , et al. Standards for statistical models used for public reporting of health outcomes: an American Heart Association Scientific Statement from the Quality of Care and Outcomes Research Interdisciplinary Writing Group: cosponsored by the Council on Epidemiology and Prevention and the Stroke Council. Endorsed by the American College of Cardiology Foundation. Circulation. 2006;113(3):456–462.
- , , , et al. Comparison of hospital risk‐standardized mortality rates calculated by using in‐hospital and 30‐day models: an observational study with implications for hospital profiling. Ann Intern Med. 2012;156(1 pt 1):19–26.
- , , , et al. Diagnostic cost group hierarchical condition category models for Medicare risk adjustment. Report prepared for the Health Care Financing Administration. Health Economics Research, Inc.; 2000. Available at: http://www.cms.gov/Research‐Statistics‐Data‐and‐Systems/Statistics‐Trends‐and‐Reports/Reports/downloads/pope_2000_2.pdf. Accessed November 7, 2009.
- , . Statistical and clinical aspects of hospital outcomes profiling. Stat Sci. 2007;22(2):206–226.
- , . Using full probability models to compute probabilities of actual interest to decision makers. Int J Technol Assess Health Care. 2001;17(1):17–26.
- , , . COPD performance measures: missing opportunities for improving care. Chest. 2010;137(5):1181–1189.
- , , , , . Measuring Performance For Treating Heart Attacks And Heart Failure: The Case For Outcomes Measurement. Health Aff. 2007;26(1):75–85.
- , , , et al. Hospital quality for acute myocardial infarction: correlation among process measures and relationship with short‐term mortality. JAMA. 2006;296(1):72–78.
- , , , et al. Profiling hospital performance to monitor the quality of care: the case of COPD. Eur Respir J. 2010;35(5):1031–1038.
- , , , et al. Patterns of hospital performance in acute myocardial infarction and heart failure 30‐day mortality and readmission. Circ Cardiovasc Qual Outcomes. 2009;2(5):407–413.
- , , , , . Geographic variation in diagnosis frequency and risk of death among Medicare beneficiaries. JAMA. 2011;305(11):1113–1118.
- , , , et al. An administrative claims model for profiling hospital 30‐day mortality rates for pneumonia patients. PLoS ONE. 2011;6(4):e17401.
- , , , et al. An Administrative Claims Model Suitable for Profiling Hospital Performance Based on 30‐Day Mortality Rates Among Patients With Heart Failure. Circulation. 2006;113(13):1693–1701.
Chronic obstructive pulmonary disease (COPD) affects as many as 24 million individuals in the United States, is responsible for more than 700,000 annual hospital admissions, and is currently the nation's third leading cause of death, accounting for nearly $49.9 billion in medical spending in 2010.[1, 2] Reported in‐hospital mortality rates for patients hospitalized for exacerbations of COPD range from 2% to 5%.[3, 4, 5, 6, 7] Information about 30‐day mortality rates following hospitalization for COPD is more limited; however, international studies suggest that rates range from 3% to 9%,[8, 9] and 90‐day mortality rates exceed 15%.[10]
Despite this significant clinical and economic impact, there have been no large‐scale, sustained efforts to measure the quality or outcomes of hospital care for patients with COPD in the United States. What little is known about the treatment of patients with COPD suggests widespread opportunities to increase adherence to guideline‐recommended therapies, to reduce the use of ineffective treatments and tests, and to address variation in care across institutions.[5, 11, 12]
Public reporting of hospital performance is a key strategy for improving the quality and safety of hospital care, both in the United States and internationally.[13] Since 2007, the Centers for Medicare and Medicaid Services (CMS) has reported hospital mortality rates on the Hospital Compare Web site, and COPD is 1 of the conditions highlighted in the Affordable Care Act for future consideration.[14] Such initiatives rely on validated, risk‐adjusted performance measures for comparisons across institutions and to enable outcomes to be tracked over time. We present the development, validation, and results of a model intended for public reporting of risk‐standardized mortality rates for patients hospitalized with exacerbations of COPD that has been endorsed by the National Quality Forum.[15]
METHODS
Approach to Measure Development
We developed this measure in accordance with guidelines described by the National Quality Forum,[16] CMS' Measure Management System,[17] and the American Heart Association scientific statement, Standards for Statistical Models Used for Public Reporting of Health Outcomes.[18] Throughout the process we obtained expert clinical and stakeholder input through meetings with a clinical advisory group and a national technical expert panel (see Acknowledgments). Last, we presented the proposed measure specifications and a summary of the technical expert panel discussions online and made a widely distributed call for public comments. We took the comments into consideration during the final stages of measure development (available at
Data Sources
We used claims data from Medicare inpatient, outpatient, and carrier (physician) Standard Analytic Files from 2008 to develop and validate the model, and examined model reliability using data from 2007 and 2009. The Medicare enrollment database was used to determine Medicare Fee‐for‐Service enrollment and mortality.
Study Cohort
Admissions were considered eligible for inclusion if the patient was 65 years or older, was admitted to a nonfederal acute care hospital in the United States, and had a principal diagnosis of COPD or a principal diagnosis of acute respiratory failure or respiratory arrest when paired with a secondary diagnosis of COPD with exacerbation (Table 1).
| ICD‐9‐CM | Description |
|---|---|
| |
| 491.21 | Obstructive chronic bronchitis; with (acute) exacerbation; acute exacerbation of COPD, decompensated COPD, decompensated COPD with exacerbation |
| 491.22 | Obstructive chronic bronchitis; with acute bronchitis |
| 491.8 | Other chronic bronchitis; chronic: tracheitis, tracheobronchitis |
| 491.9 | Unspecified chronic bronchitis |
| 492.8 | Other emphysema; emphysema (lung or pulmonary): NOS, centriacinar, centrilobular, obstructive, panacinar, panlobular, unilateral, vesicular; MacLeod's syndrome; Swyer‐James syndrome; unilateral hyperlucent lung |
| 493.20 | Chronic obstructive asthma; asthma with COPD, chronic asthmatic bronchitis, unspecified |
| 493.21 | Chronic obstructive asthma; asthma with COPD, chronic asthmatic bronchitis, with status asthmaticus |
| 493.22 | Chronic obstructive asthma; asthma with COPD, chronic asthmatic bronchitis, with (acute) exacerbation |
| 496 | Chronic: nonspecific lung disease, obstructive lung disease, obstructive pulmonary disease (COPD) NOS. (Note: This code is not to be used with any code from categories 491493.) |
| 518.81a | Other diseases of lung; acute respiratory failure; respiratory failure NOS |
| 518.82a | Other diseases of lung; acute respiratory failure; other pulmonary insufficiency, acute respiratory distress |
| 518.84a | Other diseases of lung; acute respiratory failure; acute and chronic respiratory failure |
| 799.1a | Other ill‐defined and unknown causes of morbidity and mortality; respiratory arrest, cardiorespiratory failure |
If a patient was discharged and readmitted to a second hospital on the same or the next day, we combined the 2 acute care admissions into a single episode of care and assigned the mortality outcome to the first admitting hospital. We excluded admissions for patients who were enrolled in Medicare Hospice in the 12 months prior to or on the first day of the index hospitalization. An index admission was any eligible admission assessed in the measure for the outcome. We also excluded admissions for patients who were discharged against medical advice, those for whom vital status at 30 days was unknown or recorded inconsistently, and patients with unreliable data (eg, age >115 years). For patients with multiple hospitalizations during a single year, we randomly selected 1 admission per patient to avoid survival bias. Finally, to assure adequate risk adjustment we limited the analysis to patients who had continuous enrollment in Medicare Fee‐for‐Service Parts A and B for the 12 months prior to their index admission so that we could identify comorbid conditions coded during all prior encounters.
Outcomes
The outcome of 30‐day mortality was defined as death from any cause within 30 days of the admission date for the index hospitalization. Mortality was assessed at 30 days to standardize the period of outcome ascertainment,[19] and because 30 days is a clinically meaningful time frame, during which differences in the quality of hospital care may be revealed.
Risk‐Adjustment Variables
We randomly selected half of all COPD admissions in 2008 that met the inclusion and exclusion criteria to create a model development sample. Candidate variables for inclusion in the risk‐standardized model were selected by a clinician team from diagnostic groups included in the Hierarchical Condition Category clinical classification system[20] and included age and comorbid conditions. Sleep apnea (International Classification of Diseases, 9th Revision, Clinical Modification [ICD‐9‐CM] condition codes 327.20, 327.21, 327.23, 327.27, 327.29, 780.51, 780.53, and 780.57) and mechanical ventilation (ICD‐9‐CM procedure codes 93.90, 96.70, 96.71, and 96.72) were also included as candidate variables.
We defined a condition as present for a given patient if it was coded in the inpatient, outpatient, or physician claims data sources in the preceding 12 months, including the index admission. Because a subset of the condition category variables can represent a complication of care, we did not consider them to be risk factors if they appeared only as secondary diagnosis codes for the index admission and not in claims submitted during the prior year.
We selected final variables for inclusion in the risk‐standardized model based on clinical considerations and a modified approach to stepwise logistic regression. The final patient‐level risk‐adjustment model included 42 variables (Table 2).
| Variable | Development Sample (150,035 Admissions at 4537 Hospitals) | Validation Sample (149,646 Admissions at 4535 Hospitals) | ||||
|---|---|---|---|---|---|---|
| Frequency, % | OR | 95% CI | Frequency, % | OR | 95% CI | |
| ||||||
| Demographics | ||||||
| Age 65 years (continuous) | 1.03 | 1.03‐1.04 | 1.03 | 1.03‐1.04 | ||
| Cardiovascular/respiratory | ||||||
| Sleep apnea (ICD‐9‐CM: 327.20, 327.21, 327.23, 327.27, 327.29, 780.51, 780.53, 780.57)a | 9.57 | 0.87 | 0.81‐0.94 | 9.72 | 0.84 | 0.78‐0.90 |
| History of mechanical ventilation (ICD‐9‐CM: 93.90, 96.70, 96.71, 96.72)a | 6.00 | 1.19 | 1.11‐1.27 | 6.00 | 1.15 | 1.08‐1.24 |
| Respirator dependence/respiratory failure (CC 7778)a | 1.15 | 0.89 | 0.77‐1.02 | 1.20 | 0.78 | 0.68‐0.91 |
| Cardiorespiratory failure and shock (CC 79) | 26.35 | 1.60 | 1.53‐1.68 | 26.34 | 1.59 | 1.52‐1.66 |
| Congestive heart failure (CC 80) | 41.50 | 1.34 | 1.28‐1.39 | 41.39 | 1.31 | 1.25‐1.36 |
| Chronic atherosclerosis (CC 8384)a | 50.44 | 0.87 | 0.83‐0.90 | 50.12 | 0.91 | 0.87‐0.94 |
| Arrhythmias (CC 9293) | 37.15 | 1.17 | 1.12‐1.22 | 37.06 | 1.15 | 1.10‐1.20 |
| Vascular or circulatory disease (CC 104106) | 38.20 | 1.09 | 1.05‐1.14 | 38.09 | 1.02 | 0.98‐1.06 |
| Fibrosis of lung and other chronic lung disorder (CC 109) | 16.96 | 1.08 | 1.03‐1.13 | 17.08 | 1.11 | 1.06‐1.17 |
| Asthma (CC 110) | 17.05 | 0.67 | 0.63‐0.70 | 16.90 | 0.67 | 0.63‐0.70 |
| Pneumonia (CC 111113) | 49.46 | 1.29 | 1.24‐1.35 | 49.41 | 1.27 | 1.22‐1.33 |
| Pleural effusion/pneumothorax (CC 114) | 11.78 | 1.17 | 1.11‐1.23 | 11.54 | 1.18 | 1.12‐1.25 |
| Other lung disorders (CC 115) | 53.07 | 0.80 | 0.77‐0.83 | 53.17 | 0.83 | 0.80‐0.87 |
| Other comorbid conditions | ||||||
| Metastatic cancer and acute leukemia (CC 7) | 2.76 | 2.34 | 2.14‐2.56 | 2.79 | 2.15 | 1.97‐2.35 |
| Lung, upper digestive tract, and other severe cancers (CC 8)a | 5.98 | 1.80 | 1.68‐1.92 | 6.02 | 1.98 | 1.85‐2.11 |
| Lymphatic, head and neck, brain, and other major cancers; breast, prostate, colorectal and other cancers and tumors; other respiratory and heart neoplasms (CC 911) | 14.13 | 1.03 | 0.97‐1.08 | 14.19 | 1.01 | 0.95‐1.06 |
| Other digestive and urinary neoplasms (CC 12) | 6.91 | 0.91 | 0.84‐0.98 | 7.05 | 0.85 | 0.79‐0.92 |
| Diabetes and DM complications (CC 1520, 119120) | 38.31 | 0.91 | 0.87‐0.94 | 38.29 | 0.91 | 0.87‐0.94 |
| Protein‐calorie malnutrition (CC 21) | 7.40 | 2.18 | 2.07‐2.30 | 7.44 | 2.09 | 1.98‐2.20 |
| Disorders of fluid/electrolyte/acid‐base (CC 2223) | 32.05 | 1.13 | 1.08‐1.18 | 32.16 | 1.24 | 1.19‐1.30 |
| Other endocrine/metabolic/nutritional disorders (CC 24) | 67.99 | 0.75 | 0.72‐0.78 | 67.88 | 0.76 | 0.73‐0.79 |
| Other gastrointestinal disorders (CC 36) | 56.21 | 0.81 | 0.78‐0.84 | 56.18 | 0.78 | 0.75‐0.81 |
| Osteoarthritis of hip or knee (CC 40) | 9.32 | 0.74 | 0.69‐0.79 | 9.33 | 0.80 | 0.74‐0.85 |
| Other musculoskeletal and connective tissue disorders (CC 43) | 64.14 | 0.83 | 0.80‐0.86 | 64.20 | 0.83 | 0.80‐0.87 |
| Iron deficiency and other/unspecified anemias and blood disease (CC 47) | 40.80 | 1.08 | 1.04‐1.12 | 40.72 | 1.08 | 1.04‐1.13 |
| Dementia and senility (CC 4950) | 17.06 | 1.09 | 1.04‐1.14 | 16.97 | 1.09 | 1.04‐1.15 |
| Drug/alcohol abuse, without dependence (CC 53)a | 23.51 | 0.78 | 0.75‐0.82 | 23.38 | 0.76 | 0.72‐0.80 |
| Other psychiatric disorders (CC 60)a | 16.49 | 1.12 | 1.07‐1.18 | 16.43 | 1.12 | 1.06‐1.17 |
| Quadriplegia, paraplegia, functional disability (CC 6769, 100102, 177178) | 4.92 | 1.03 | 0.95‐1.12 | 4.92 | 1.08 | 0.99‐1.17 |
| Mononeuropathy, other neurological conditions/emnjuries (CC 76) | 11.35 | 0.85 | 0.80‐0.91 | 11.28 | 0.88 | 0.83‐0.93 |
| Hypertension and hypertensive disease (CC 9091) | 80.40 | 0.78 | 0.75‐0.82 | 80.35 | 0.79 | 0.75‐0.83 |
| Stroke (CC 9596)a | 6.77 | 1.00 | 0.93‐1.08 | 6.73 | 0.98 | 0.91‐1.05 |
| Retinal disorders, except detachment and vascular retinopathies (CC 121) | 10.79 | 0.87 | 0.82‐0.93 | 10.69 | 0.90 | 0.85‐0.96 |
| Other eye disorders (CC 124)a | 19.05 | 0.90 | 0.86‐0.95 | 19.13 | 0.98 | 0.85‐0.93 |
| Other ear, nose, throat, and mouth disorders (CC 127) | 35.21 | 0.83 | 0.80‐0.87 | 35.02 | 0.80 | 0.77‐0.83 |
| Renal failure (CC 131)a | 17.92 | 1.12 | 1.07‐1.18 | 18.16 | 1.13 | 1.08‐1.19 |
| Decubitus ulcer or chronic skin ulcer (CC 148149) | 7.42 | 1.27 | 1.19‐1.35 | 7.42 | 1.33 | 1.25‐1.42 |
| Other dermatological disorders (CC 153) | 28.46 | 0.90 | 0.87‐0.94 | 28.32 | 0.89 | 0.86‐0.93 |
| Trauma (CC 154156, 158161) | 9.04 | 1.09 | 1.03‐1.16 | 8.99 | 1.15 | 1.08‐1.22 |
| Vertebral fractures (CC 157) | 5.01 | 1.33 | 1.24‐1.44 | 4.97 | 1.29 | 1.20‐1.39 |
| Major complications of medical care and trauma (CC 164) | 5.47 | 0.81 | 0.75‐0.88 | 5.55 | 0.82 | 0.76‐0.89 |
Model Derivation
We used hierarchical logistic regression models to model the log‐odds of mortality as a function of patient‐level clinical characteristics and a random hospital‐level intercept. At the patient level, each model adjusts the log‐odds of mortality for age and the selected clinical covariates. The second level models the hospital‐specific intercepts as arising from a normal distribution. The hospital intercept represents the underlying risk of mortality, after accounting for patient risk. If there were no differences among hospitals, then after adjusting for patient risk, the hospital intercepts should be identical across all hospitals.
Estimation of Hospital Risk‐Standardized Mortality Rate
We calculated a risk‐standardized mortality rate, defined as the ratio of predicted to expected deaths (similar to observed‐to‐expected), multiplied by the national unadjusted mortality rate.[21] The expected number of deaths for each hospital was estimated by applying the estimated regression coefficients to the characteristics of each hospital's patients, adding the average of the hospital‐specific intercepts, transforming the data by using an inverse logit function, and summing the data from all patients in the hospital to obtain the count. The predicted number of deaths was calculated in the same way, substituting the hospital‐specific intercept for the average hospital‐specific intercept.
Model Performance, Validation, and Reliability Testing
We used the remaining admissions in 2008 as the model validation sample. We computed several summary statistics to assess the patient‐level model performance in both the development and validation samples,[22] including over‐fitting indices, predictive ability, area under the receiver operating characteristic (ROC) curve, distribution of residuals, and model 2. In addition, we assessed face validity through a survey of members of the technical expert panel. To assess reliability of the model across data years, we repeated the modeling process using qualifying COPD admissions in both 2007 and 2009. Finally, to assess generalizability we evaluated the model's performance in an all‐payer sample of data from patients admitted to California hospitals in 2006.
Analyses were conducted using SAS version 9.1.3 (SAS Institute Inc., Cary, NC). We estimated the hierarchical models using the GLIMMIX procedure in SAS.
The Human Investigation Committee at the Yale University School of Medicine/Yale New Haven Hospital approved an exemption (HIC#0903004927) for the authors to use CMS claims and enrollment data for research analyses and publication.
RESULTS
Model Derivation
After exclusions were applied, the development sample included 150,035 admissions in 2008 at 4537 US hospitals (Figure 1). Factors that were most strongly associated with the risk of mortality included metastatic cancer (odds ratio [OR] 2.34), protein calorie malnutrition (OR 2.18), nonmetastatic cancers of the lung and upper digestive tract, (OR 1.80) cardiorespiratory failure and shock (OR 1.60), and congestive heart failure (OR 1.34) (Table 2).
Model Performance, Validation, and Reliability
The model had a C statistic of 0.72, indicating good discrimination, and predicted mortality in the development sample ranged from 1.52% in the lowest decile to 23.74% in the highest. The model validation sample, using the remaining cases from 2008, included 149,646 admissions from 4535 hospitals. Variable frequencies and ORs were similar in both samples (Table 2). Model performance was also similar in the validation samples, with good model discrimination and fit (Table 3). Ten of 12 technical expert panel members responded to the survey, of whom 90% at least somewhat agreed with the statement, the COPD mortality measure provides an accurate reflection of quality. When the model was applied to patients age 18 years and older in the 2006 California Patient Discharge Data, overall discrimination was good (C statistic, 0.74), including in those age 18 to 64 years (C statistic, 0.75; 65 and above C statistic, 0.70).
| Development | Validation | Data Years | ||
|---|---|---|---|---|
| Indices | Sample, 2008 | Sample, 2008 | 2007 | 2009 |
| ||||
| Number of admissions | 150,035 | 149,646 | 259,911 | 279,377 |
| Number of hospitals | 4537 | 4535 | 4636 | 4571 |
| Mean risk‐standardized mortality rate, % (SD) | 8.62 (0.94) | 8.64 (1.07) | 8.97 (1.12) | 8.08 (1.09) |
| Calibration, 0, 1 | 0.034, 0.985 | 0.009, 1.004 | 0.095, 1.022 | 0.120, 0.981 |
| Discriminationpredictive ability, lowest decile %highest decile % | 1.5223.74 | 1.6023.78 | 1.5424.64 | 1.4222.36 |
| Discriminationarea under the ROC curve, C statistic | 0.720 | 0.723 | 0.728 | 0.722 |
| Residuals lack of fit, Pearson residual fall % | ||||
| 2 | 0 | 0 | 0 | 0 |
| 2, 0 | 91.14 | 91.4 | 91.08 | 91.93 |
| 0, 2 | 1.66 | 1.7 | 1.96 | 1.42 |
| 2+ | 6.93 | 6.91 | 6.96 | 6.65 |
| Model Wald 2 (number of covariates) | 6982.11 (42) | 7051.50 (42) | 13042.35 (42) | 12542.15 (42) |
| P value | <0.0001 | <0.0001 | <0.0001 | <0.0001 |
| Between‐hospital variance, (standard error) | 0.067 (0.008) | 0.078 (0.009) | 0.067 (0.006) | 0.072 (0.006) |
Reliability testing demonstrated consistent performance over several years. The frequency and ORs of the variables included in the model showed only minor changes over time. The area under the ROC curve (C statistic) was 0.73 for the model in the 2007 sample and 0.72 for the model using 2009 data (Table 3).
Hospital Risk‐Standardized Mortality Rates
The mean unadjusted hospital 30‐day mortality rate was 8.6% and ranged from 0% to 100% (Figure 2a). Risk‐standardized mortality rates varied across hospitals (Figure 2b). The mean risk‐standardized mortality rate was 8.6% and ranged from 5.9% to 13.5%. The odds of mortality at a hospital 1 standard deviation above average was 1.20 times that of a hospital 1 standard deviation below average.
DISCUSSION
We present a hospital‐level risk‐standardized mortality measure for patients admitted with COPD based on administrative claims data that are intended for public reporting and that have achieved endorsement by the National Quality Forum, a voluntary consensus standards‐setting organization. Across more than 4500 US hospitals, the mean 30‐day risk‐standardized mortality rate in 2008 was 8.6%, and we observed considerable variation across institutions, despite adjustment for case mix, suggesting that improvement by lower‐performing institutions may be an achievable goal.
Although improving the delivery of evidence‐based care processes and outcomes of patients with acute myocardial infarction, heart failure, and pneumonia has been the focus of national quality improvement efforts for more than a decade, COPD has largely been overlooked.[23] Within this context, this analysis represents the first attempt to systematically measure, at the hospital level, 30‐day all‐cause mortality for patients admitted to US hospitals for exacerbation of COPD. The model we have developed and validated is intended to be used to compare the performance of hospitals while controlling for differences in the pretreatment risk of mortality of patients and accounting for the clustering of patients within hospitals, and will facilitate surveillance of hospital‐level risk‐adjusted outcomes over time.
In contrast to process‐based measures of quality, such as the percentage of patients with pneumonia who receive appropriate antibiotic therapy, performance measures based on patient outcomes provide a more comprehensive view of care and are more consistent with patients' goals.[24] Additionally, it is well established that hospital performance on individual and composite process measures explains only a small amount of the observed variation in patient outcomes between institutions.[25] In this regard, outcome measures incorporate important, but difficult to measure aspects of care, such as diagnostic accuracy and timing, communication and teamwork, the recognition and response to complications, care coordination at the time of transfers between levels of care, and care settings. Nevertheless, when used for making inferences about the quality of hospital care, individual measures such as the risk‐standardized hospital mortality rate should be interpreted in the context of other performance measures, including readmission, patient experience, and costs of care.
A number of prior investigators have described the outcomes of care for patients hospitalized with exacerbations of COPD, including identifying risk factors for mortality. Patil et al. carried out an analysis of the 1996 Nationwide Inpatient Sample and described an overall in‐hospital mortality rate of 2.5% among patients with COPD, and reported that a multivariable model containing sociodemographic characteristics about the patient and comorbidities had an area under the ROC curve of 0.70.[3] In contrast, this hospital‐level measure includes patients with a principal diagnosis of respiratory failure and focuses on 30‐day rather than inpatient mortality, accounting for the nearly 3‐fold higher mortality rate we observed. In a more recent study that used clinical from a large multistate database, Tabak et al. developed a prediction model for inpatient mortality for patients with COPD that contained only 4 factors: age, blood urea nitrogen, mental status, and pulse, and achieved an area under the ROC curve of 0.72.[4] The simplicity of such a model and its reliance on clinical measurements makes it particularly well suited for bedside application by clinicians, but less valuable for large‐scale public reporting programs that rely on administrative data. In the only other study identified that focused on the assessment of hospital mortality rates, Agabiti et al. analyzed the outcomes of 12,756 patients hospitalized for exacerbations of COPD, using similar ICD‐9‐CM diagnostic criteria as in this study, at 21 hospitals in Rome, Italy.[26] They reported an average crude 30‐day mortality rate of 3.8% among a group of 5 benchmark hospitals and an average mortality of 7.5% (range, 5.2%17.2%) among the remaining institutions.
To put the variation we observed in mortality rates into a broader context, the relative difference in the risk‐standardized hospital mortality rates across the 10th to 90th percentiles of hospital performance was 25% for acute myocardial infarction and 39% for heart failure, whereas rates varied 30% for COPD, from 7.6% to 9.9%.[27] Model discrimination in COPD (C statistic, 0.72) was also similar to that reported for models used for public reporting of hospital mortality in acute myocardial infarction (C statistic, 0.71) and pneumonia (C statistic, 0.72).
This study has a number of important strengths. First, the model was developed from a large sample of recent Medicare claims, achieved good discrimination, and was validated in samples not limited to Medicare beneficiaries. Second, by including patients with a principal diagnosis of COPD, as well as those with a principal diagnosis of acute respiratory failure when accompanied by a secondary diagnosis of COPD with acute exacerbation, this model can be used to assess hospital performance across the full spectrum of disease severity. This broad set of ICD‐9‐CM codes used to define the cohort also ensures that efforts to measure hospital performance will be less influenced by differences in documentation and coding practices across hospitals relating to the diagnosis or sequencing of acute respiratory failure diagnoses. Moreover, the inclusion of patients with respiratory failure is important because these patients have the greatest risk of mortality, and are those in whom efforts to improve the quality and safety of care may have the greatest impact. Third, rather than relying solely on information documented during the index admission, we used ambulatory and inpatient claims from the full year prior to the index admission to identify comorbidities and to distinguish them from potential complications of care. Finally, we did not include factors such as hospital characteristics (eg, number of beds, teaching status) in the model. Although they might have improved overall predictive ability, the goal of the hospital mortality measure is to enable comparisons of mortality rates among hospitals while controlling for differences in patient characteristics. To the extent that factors such as size or teaching status might be independently associated with hospital outcomes, it would be inappropriate to adjust away their effects, because mortality risk should not be influenced by hospital characteristics other than through their effects on quality.
These results should be viewed in light of several limitations. First, we used ICD‐9‐CM codes derived from claims files to define the patient populations included in the measure rather than collecting clinical or physiologic information prospectively or through manual review of medical records, such as the forced expiratory volume in 1 second or whether the patient required long‐term oxygen therapy. Nevertheless, we included a broad set of potential diagnosis codes to capture the full spectrum of COPD exacerbations and to minimize differences in coding across hospitals. Second, because the risk‐adjustment included diagnoses coded in the year prior to the index admission, it is potentially subject to bias due to regional differences in medical care utilization that are not driven by underlying differences in patient illness.[28] Third, using administrative claims data, we observed some paradoxical associations in the model that are difficult to explain on clinical grounds, such as a protective effect of substance and alcohol abuse or prior episodes of respiratory failure. Fourth, although we excluded patients from the analysis who were enrolled in hospice prior to, or on the day of, the index admission, we did not exclude those who choose to withdraw support, transition to comfort measures only, or enrolled in hospice care during a hospitalization. We do not seek to penalize hospitals for being sensitive to the preferences of patients at the end of life. At the same time, it is equally important that the measure is capable of detecting the outcomes of suboptimal care that may in some instances lead a patient or their family to withdraw support or choose hospice. Finally, we did not have the opportunity to validate the model against a clinical registry of patients with COPD, because such data do not currently exist. Nevertheless, the use of claims as a surrogate for chart data for risk adjustment has been validated for several conditions, including acute myocardial infarction, heart failure, and pneumonia.[29, 30]
CONCLUSIONS
Risk‐standardized 30‐day mortality rates for Medicare beneficiaries with COPD vary across hospitals in the US. Calculating and reporting hospital outcomes using validated performance measures may catalyze quality improvement activities and lead to better outcomes. Additional research would be helpful to confirm that hospitals with lower mortality rates achieve care that meets the goals of patients and their families better than at hospitals with higher mortality rates.
Acknowledgment
The authors thank the following members of the technical expert panel: Darlene Bainbridge, RN, MS, NHA, CPHQ, CPHRM, President/CEO, Darlene D. Bainbridge & Associates, Inc.; Robert A. Balk, MD, Director of Pulmonary and Critical Care Medicine, Rush University Medical Center; Dale Bratzler, DO, MPH, President and CEO, Oklahoma Foundation for Medical Quality; Scott Cerreta, RRT, Director of Education, COPD Foundation; Gerard J. Criner, MD, Director of Temple Lung Center and Divisions of Pulmonary and Critical Care Medicine, Temple University; Guy D'Andrea, MBA, President, Discern Consulting; Jonathan Fine, MD, Director of Pulmonary Fellowship, Research and Medical Education, Norwalk Hospital; David Hopkins, MS, PhD, Senior Advisor, Pacific Business Group on Health; Fred Martin Jacobs, MD, JD, FACP, FCCP, FCLM, Executive Vice President and Director, Saint Barnabas Quality Institute; Natalie Napolitano, MPH, RRT‐NPS, Respiratory Therapist, Inova Fairfax Hospital; Russell Robbins, MD, MBA, Principal and Senior Clinical Consultant, Mercer. In addition, the authors acknowledge and thank Angela Merrill, Sandi Nelson, Marian Wrobel, and Eric Schone from Mathematica Policy Research, Inc., Sharon‐Lise T. Normand from Harvard Medical School, and Lein Han and Michael Rapp at The Centers for Medicare & Medicaid Services for their contributions to this work.
Disclosures
Peter K. Lindenauer, MD, MSc, is the guarantor of this article, taking responsibility for the integrity of the work as a whole, from inception to published article, and takes responsibility for the content of the manuscript, including the data and data analysis. All authors have made substantial contributions to the conception and design, or acquisition of data, or analysis and interpretation of data; have drafted the submitted article or revised it critically for important intellectual content; and have provided final approval of the version to be published. Preparation of this manuscript was completed under Contract Number: HHSM‐5002008‐0025I/HHSM‐500‐T0001, Modification No. 000007, Option Year 2 Measure Instrument Development and Support (MIDS). Sponsors did not contribute to the development of the research or manuscript. Dr. Au reports being an unpaid research consultant for Bosch Inc. He receives research funding from the NIH, Department of Veterans Affairs, AHRQ, and Gilead Sciences. The views of the this manuscript represent the authors and do not necessarily represent those of the Department of Veterans Affairs. Drs. Drye and Bernheim report receiving contract funding from CMS to develop and maintain quality measures.
- FASTSTATS—chronic lower respiratory disease. Available at: http://www.cdc.gov/nchs/fastats/copd.htm. Accessed September 18, 2010.
- National Heart, Lung and Blood Institute. Morbidity and mortality chartbook. Available at: http://www.nhlbi.nih.gov/resources/docs/cht‐book.htm. Accessed April 27, 2010.
- , , , . In‐hospital mortality following acute exacerbations of chronic obstructive pulmonary disease. Arch Intern Med. 2003;163(10):1180–1186.
- , , , , . Mortality and need for mechanical ventilation in acute exacerbations of chronic obstructive pulmonary disease: development and validation of a simple risk score. Arch Intern Med. 2009;169(17):1595–1602.
- , , , , , . Quality of care for patients hospitalized for acute exacerbations of chronic obstructive pulmonary disease. Ann Intern Med. 2006;144(12):894–903.
- , , , , . Use of beta blockers and the risk of death in hospitalised patients with acute exacerbations of COPD. Thorax. 2008;63(4):301–305.
- , , , , . HCUP facts and figures: statistics on hospital‐based care in the United States, 2007. 2009. Available at: http://www.hcup‐us.ahrq.gov/reports.jsp. Accessed August 6, 2012.
- , . Predictors of long‐term survival in elderly patients hospitalized for acute exacerbations of chronic obstructive pulmonary disease. Respirology. 2008;13(6):851–855.
- , , , , , . The impact on risk‐factor analysis of different mortality outcomes in COPD patients. Eur Respir J 2008;32(3):629–636.
- , , , , , . Clinical audit indicators of outcome following admission to hospital with acute exacerbation of chronic obstructive pulmonary disease. Thorax. 2002;57(2):137–141.
- , , , et al. The quality of obstructive lung disease care for adults in the United States as measured by adherence to recommended processes. Chest. 2006;130(6):1844–1850.
- , , , , , . Management of acute exacerbations of chronic obstructive pulmonary disease in the elderly: physician practices in the community hospital setting. J Okla State Med Assoc. 2004;97(6):227–232.
- , , . Leadership by Example: Coordinating Government Roles in Improving Health Care Quality. Washington, DC: National Academies Press; 2002.
- Patient Protection and Affordable Care Act [H.R. 3590], Pub. L. No. 111–148, §2702, 124 Stat. 119, 318–319 (March 23, 2010). Available at: http://www.gpo.gov/fdsys/pkg/PLAW‐111publ148/html/PLAW‐111publ148.htm. Accessed July 15, 2012.
- National Quality Forum. NQF Endorses Additional Pulmonary Measure. 2013. Available at: http://www.qualityforum.org/News_And_Resources/Press_Releases/2013/NQF_Endorses_Additional_Pulmonary_Measure.aspx. Accessed January 11, 2013.
- National Quality Forum. National voluntary consensus standards for patient outcomes: a consensus report. Washington, DC: National Quality Forum; 2011.
- The Measures Management System. The Centers for Medicare and Medicaid Services. Available at: http://www.cms.gov/Medicare/Quality‐Initiatives‐Patient‐Assessment‐Instruments/MMS/index.html?redirect=/MMS/. Accessed August 6, 2012.
- , , , et al. Standards for statistical models used for public reporting of health outcomes: an American Heart Association Scientific Statement from the Quality of Care and Outcomes Research Interdisciplinary Writing Group: cosponsored by the Council on Epidemiology and Prevention and the Stroke Council. Endorsed by the American College of Cardiology Foundation. Circulation. 2006;113(3):456–462.
- , , , et al. Comparison of hospital risk‐standardized mortality rates calculated by using in‐hospital and 30‐day models: an observational study with implications for hospital profiling. Ann Intern Med. 2012;156(1 pt 1):19–26.
- , , , et al. Diagnostic cost group hierarchical condition category models for Medicare risk adjustment. Report prepared for the Health Care Financing Administration. Health Economics Research, Inc.; 2000. Available at: http://www.cms.gov/Research‐Statistics‐Data‐and‐Systems/Statistics‐Trends‐and‐Reports/Reports/downloads/pope_2000_2.pdf. Accessed November 7, 2009.
- , . Statistical and clinical aspects of hospital outcomes profiling. Stat Sci. 2007;22(2):206–226.
- , . Using full probability models to compute probabilities of actual interest to decision makers. Int J Technol Assess Health Care. 2001;17(1):17–26.
- , , . COPD performance measures: missing opportunities for improving care. Chest. 2010;137(5):1181–1189.
- , , , , . Measuring Performance For Treating Heart Attacks And Heart Failure: The Case For Outcomes Measurement. Health Aff. 2007;26(1):75–85.
- , , , et al. Hospital quality for acute myocardial infarction: correlation among process measures and relationship with short‐term mortality. JAMA. 2006;296(1):72–78.
- , , , et al. Profiling hospital performance to monitor the quality of care: the case of COPD. Eur Respir J. 2010;35(5):1031–1038.
- , , , et al. Patterns of hospital performance in acute myocardial infarction and heart failure 30‐day mortality and readmission. Circ Cardiovasc Qual Outcomes. 2009;2(5):407–413.
- , , , , . Geographic variation in diagnosis frequency and risk of death among Medicare beneficiaries. JAMA. 2011;305(11):1113–1118.
- , , , et al. An administrative claims model for profiling hospital 30‐day mortality rates for pneumonia patients. PLoS ONE. 2011;6(4):e17401.
- , , , et al. An Administrative Claims Model Suitable for Profiling Hospital Performance Based on 30‐Day Mortality Rates Among Patients With Heart Failure. Circulation. 2006;113(13):1693–1701.
Copyright © 2013 Society of Hospital Medicine
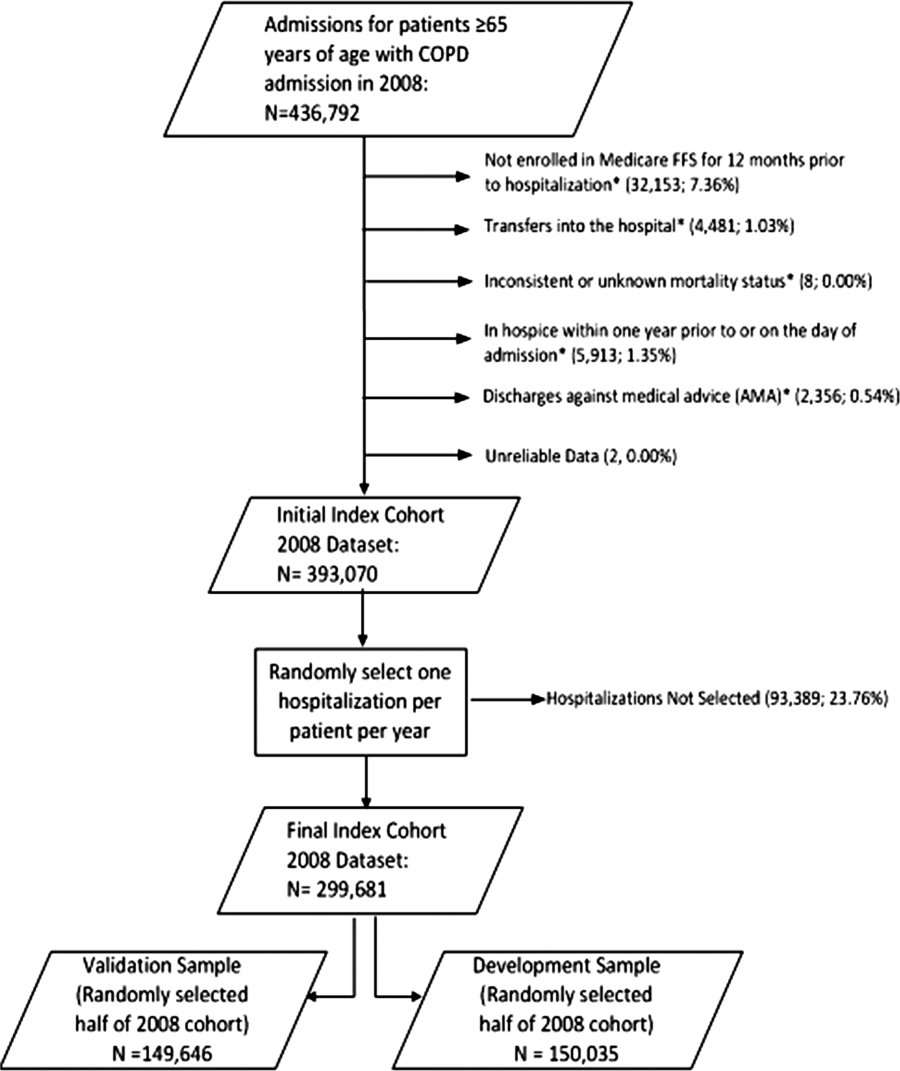
Readmission and Mortality [Rates] in Pneumonia
Pneumonia results in some 1.2 million hospital admissions each year in the United States, is the second leading cause of hospitalization among patients over 65, and accounts for more than $10 billion annually in hospital expenditures.1, 2 As a result of complex demographic and clinical forces, including an aging population, increasing prevalence of comorbidities, and changes in antimicrobial resistance patterns, between the periods 1988 to 1990 and 2000 to 2002 the number of patients hospitalized for pneumonia grew by 20%, and pneumonia was the leading infectious cause of death.3, 4
Given its public health significance, pneumonia has been the subject of intensive quality measurement and improvement efforts for well over a decade. Two of the largest initiatives are the Centers for Medicare & Medicaid Services (CMS) National Pneumonia Project and The Joint Commission ORYX program.5, 6 These efforts have largely entailed measuring hospital performance on pneumonia‐specific processes of care, such as whether blood oxygen levels were assessed, whether blood cultures were drawn before antibiotic treatment was initiated, the choice and timing of antibiotics, and smoking cessation counseling and vaccination at the time of discharge. While measuring processes of care (especially when they are based on sound evidence), can provide insights about quality, and can help guide hospital improvement efforts, these measures necessarily focus on a narrow spectrum of the overall care provided. Outcomes can complement process measures by directing attention to the results of care, which are influenced by both measured and unmeasured factors, and which may be more relevant from the patient's perspective.79
In 2008 CMS expanded its public reporting initiatives by adding risk‐standardized hospital mortality rates for pneumonia to the Hospital Compare website (
Methods
Design, Setting, Subjects
We conducted a cross‐sectional study at the hospital level of the outcomes of care of fee‐for‐service patients hospitalized for pneumonia between July 2006 and June 2009. Patients are eligible to be included in the measures if they are 65 years or older, have a principal diagnosis of pneumonia (International Classification of Diseases, Ninth Revision, Clinical Modification codes 480.X, 481, 482.XX, 483.X, 485, 486, and 487.0), and are cared for at a nonfederal acute care hospital in the US and its organized territories, including Puerto Rico, Guam, the US Virgin Islands, and the Northern Mariana Islands.
The mortality measure excludes patients enrolled in the Medicare hospice program in the year prior to, or on the day of admission, those in whom pneumonia is listed as a secondary diagnosis (to eliminate cases resulting from complications of hospitalization), those discharged against medical advice, and patients who are discharged alive but whose length of stay in the hospital is less than 1 day (because of concerns about the accuracy of the pneumonia diagnosis). Patients are also excluded if their administrative records for the period of analysis (1 year prior to hospitalization and 30 days following discharge) were not available or were incomplete, because these are needed to assess comorbid illness and outcomes. The readmission measure is similar, but does not exclude patients on the basis of hospice program enrollment (because these patients have been admitted and readmissions for hospice patients are likely unplanned events that can be measured and reduced), nor on the basis of hospital length of stay (because patients discharged within 24 hours may be at a heightened risk of readmission).11, 12
Information about patient comorbidities is derived from diagnoses recorded in the year prior to the index hospitalization as found in Medicare inpatient, outpatient, and carrier (physician) standard analytic files. Comorbidities are identified using the Condition Categories of the Hierarchical Condition Category grouper, which sorts the more than 15,000 possible diagnostic codes into 189 clinically‐coherent conditions and which was originally developed to support risk‐adjusted payments within Medicare managed care.13
Outcomes
The patient outcomes assessed include death from any cause within 30 days of admission and readmission for any cause within 30 days of discharge. All‐cause, rather than disease‐specific, readmission was chosen because hospital readmission as a consequence of suboptimal inpatient care or discharge coordination may manifest in many different diagnoses, and no validated method is available to distinguish related from unrelated readmissions. The measures use the Medicare Enrollment Database to determine mortality status, and acute care hospital inpatient claims are used to identify readmission events. For patients with multiple hospitalizations during the study period, the mortality measure randomly selects one hospitalization to use for determination of mortality. Admissions that are counted as readmissions (i.e., those that occurred within 30 days of discharge following hospitalization for pneumonia) are not also treated as index hospitalizations. In the case of patients who are transferred to or from another acute care facility, responsibility for deaths is assigned to the hospital that initially admitted the patient, while responsibility for readmissions is assigned to the hospital that ultimately discharges the patient to a nonacute setting (e.g., home, skilled nursing facilities).
Risk‐Standardization Methods
Hierarchical logistic regression is used to model the log‐odds of mortality or readmission within 30 days of admission or discharge from an index pneumonia admission as a function of patient demographic and clinical characteristics and a random hospital‐specific intercept. This strategy accounts for within‐hospital correlation of the observed outcomes, and reflects the assumption that underlying differences in quality among the hospitals being evaluated lead to systematic differences in outcomes. In contrast to nonhierarchical models which ignore hospital effects, this method attempts to measure the influence of the hospital on patient outcome after adjusting for patient characteristics. Comorbidities from the index admission that could represent potential complications of care are not included in the model unless they are also documented in the 12 months prior to admission. Hospital‐specific mortality and readmission rates are calculated as the ratio of predicted‐to‐expected events (similar to the observed/expected ratio), multiplied by the national unadjusted rate, a form of indirect standardization.
The model for mortality has a c‐statistic of 0.72 whereas a model based on medical record review that was developed for validation purposes had a c‐statistic of 0.77. The model for readmission has a c‐statistic of 0.63 whereas a model based on medical review had a c‐statistic of 0.59. The mortality and readmission models produce similar state‐level mortality and readmission rate estimates as the models derived from medical record review, and can therefore serve as reasonable surrogates. These methods, including their development and validation, have been described fully elsewhere,14, 15 and have been evaluated and subsequently endorsed by the National Quality Forum.16
Identification of Geographic Regions
To characterize patterns of performance geographically we identified the 306 hospital referral regions for each hospital in our analysis using definitions provided by the Dartmouth Atlas of Health Care project. Unlike a hospital‐level analysis, the hospital referral regions represent regional markets for tertiary care and are widely used to summarize variation in medical care inputs, utilization patterns, and health outcomes and provide a more detailed look at variation in outcomes than results at the state level.17
Analyses
Summary statistics were constructed using frequencies and proportions for categorical data, and means, medians and interquartile ranges for continuous variables. To characterize 30‐day risk‐standardized mortality and readmission rates at the hospital‐referral region level, we calculated means and percentiles by weighting each hospital's value by the inverse of the variance of the hospital's estimated rate. Hospitals with larger sample sizes, and therefore more precise estimates, lend more weight to the average. Hierarchical models were estimated using the SAS GLIMMIX procedure. Bayesian shrinkage was used to estimate rates in order to take into account the greater uncertainty in the true rates of hospitals with small caseloads. Using this technique, estimated rates at low volume institutions are shrunken toward the population mean, while hospitals with large caseloads have a relatively smaller amount of shrinkage and the estimate is closer to the hospital's observed rate.18
To determine whether a hospital's performance is significantly different than the national rate we measured whether the 95% interval estimate for the risk‐standardized rate overlapped with the national crude mortality or readmission rate. This information is used to categorize hospitals on Hospital Compare as better than the US national rate, worse than the US national rate, or no different than the US national rate. Hospitals with fewer than 25 cases in the 3‐year period, are excluded from this categorization on Hospital Compare.
Analyses were conducted with the use of SAS 9.1.3 (SAS Institute Inc, Cary, NC). We created the hospital referral region maps using ArcGIS version 9.3 (ESRI, Redlands, CA). The Human Investigation Committee at the Yale School of Medicine approved an exemption for the authors to use CMS claims and enrollment data for research analyses and publication.
Results
Hospital‐Specific Risk‐Standardized 30‐Day Mortality and Readmission Rates
Of the 1,118,583 patients included in the mortality analysis 129,444 (11.6%) died within 30 days of hospital admission. The median (Q1, Q3) hospital 30‐day risk‐standardized mortality rate was 11.1% (10.0%, 12.3%), and ranged from 6.7% to 20.9% (Table 1, Figure 1). Hospitals at the 10th percentile had 30‐day risk‐standardized mortality rates of 9.0% while for those at the 90th percentile of performance the rate was 13.5%. The odds of all‐cause mortality for a patient treated at a hospital that was one standard deviation above the national average was 1.68 times higher than that of a patient treated at a hospital that was one standard deviation below the national average.
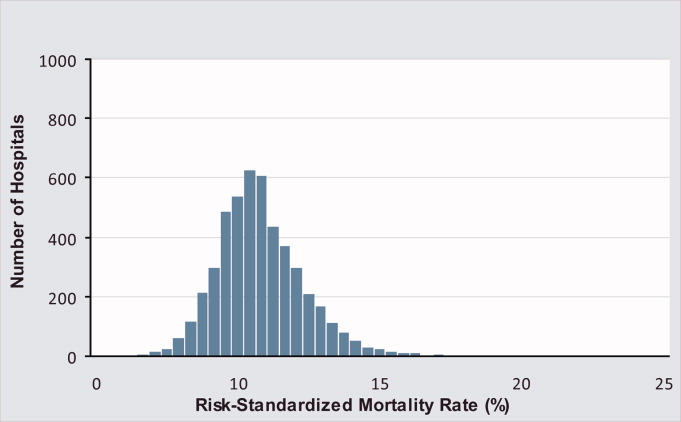
| Mortality | Readmission | |
|---|---|---|
| ||
| Patients (n) | 1118583 | 1161817 |
| Hospitals (n) | 4788 | 4813 |
| Patient age, years, median (Q1, Q3) | 81 (74,86) | 80 (74,86) |
| Nonwhite, % | 11.1 | 11.1 |
| Hospital case volume, median (Q1, Q3) | 168 (77,323) | 174 (79,334) |
| Risk‐standardized hospital rate, mean (SD) | 11.2 (1.2) | 18.3 (0.9) |
| Minimum | 6.7 | 13.6 |
| 1st percentile | 7.5 | 14.9 |
| 5th percentile | 8.5 | 15.8 |
| 10th percentile | 9.0 | 16.4 |
| 25th percentile | 10.0 | 17.2 |
| Median | 11.1 | 18.2 |
| 75th percentile | 12.3 | 19.2 |
| 90th percentile | 13.5 | 20.4 |
| 95th percentile | 14.4 | 21.1 |
| 99th percentile | 16.1 | 22.8 |
| Maximum | 20.9 | 26.7 |
| Model fit statistics | ||
| c‐Statistic | 0.72 | 0.63 |
| Intrahospital Correlation | 0.07 | 0.03 |
For the 3‐year period 2006 to 2009, 222 (4.7%) hospitals were categorized as having a mortality rate that was better than the national average, 3968 (83.7%) were no different than the national average, 221 (4.6%) were worse and 332 (7.0%) did not meet the minimum case threshold.
Among the 1,161,817 patients included in the readmission analysis 212,638 (18.3%) were readmitted within 30 days of hospital discharge. The median (Q1,Q3) 30‐day risk‐standardized readmission rate was 18.2% (17.2%, 19.2%) and ranged from 13.6% to 26.7% (Table 1, Figure 2). Hospitals at the 10th percentile had 30‐day risk‐standardized readmission rates of 16.4% while for those at the 90th percentile of performance the rate was 20.4%. The odds of all‐cause readmission for a patient treated at a hospital that was one standard deviation above the national average was 1.40 times higher than the odds of all‐cause readmission if treated at a hospital that was one standard deviation below the national average.
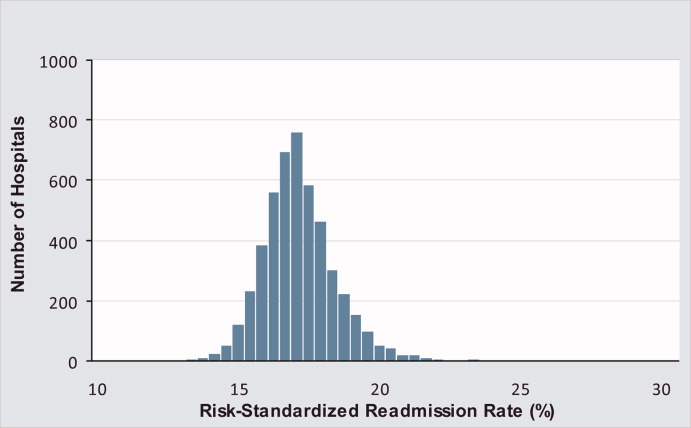
For the 3‐year period 2006 to 2009, 64 (1.3%) hospitals were categorized as having a readmission rate that was better than the national average, 4203 (88.2%) were no different than the national average, 163 (3.4%) were worse and 333 (7.0%) had less than 25 cases and were therefore not categorized.
While risk‐standardized readmission rates were substantially higher than risk‐standardized mortality rates, mortality rates varied more. For example, the top 10% of hospitals had a relative mortality rate that was 33% lower than those in the bottom 10%, as compared with just a 20% relative difference for readmission rates. The coefficient of variation, a normalized measure of dispersion that unlike the standard deviation is independent of the population mean, was 10.7 for risk‐standardized mortality rates and 4.9 for readmission rates.
Regional Risk‐Standardized 30‐Day Mortality and Readmission Rates
Figures 3 and 4 show the distribution of 30‐day risk‐standardized mortality and readmission rates among hospital referral regions by quintile. Highest mortality regions were found across the entire country, including parts of Northern New England, the Mid and South Atlantic, East and the West South Central, East and West North Central, and the Mountain and Pacific regions of the West. The lowest mortality rates were observed in Southern New England, parts of the Mid and South Atlantic, East and West South Central, and parts of the Mountain and Pacific regions of the West (Figure 3).
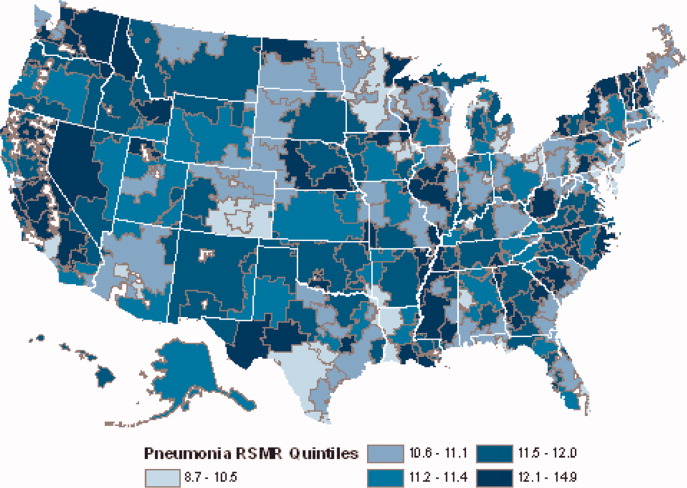
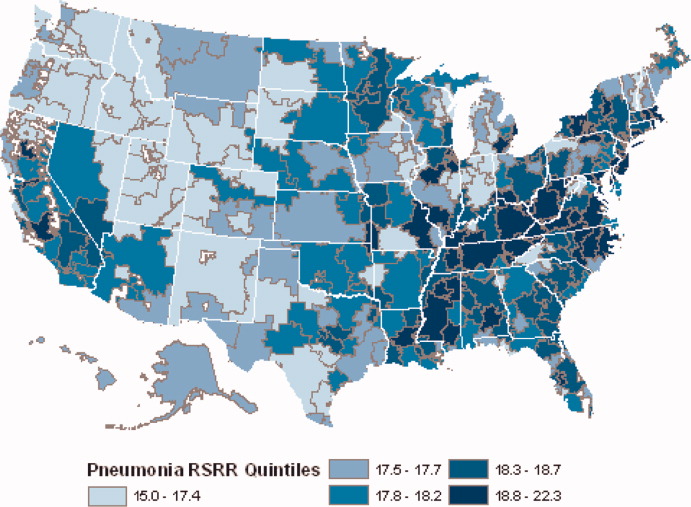
Readmission rates were higher in the eastern portions of the US (including the Northeast, Mid and South Atlantic, East South Central) as well as the East North Central, and small parts of the West North Central portions of the Midwest and in Central California. The lowest readmission rates were observed in the West (Mountain and Pacific regions), parts of the Midwest (East and West North Central) and small pockets within the South and Northeast (Figure 4).
Discussion
In this 3‐year analysis of patient, hospital, and regional outcomes we observed that pneumonia in the elderly remains a highly morbid illness, with a 30‐day mortality rate of approximately 11.6%. More notably we observed that risk‐standardized mortality rates, and to a lesser extent readmission rates, vary significantly across hospitals and regions. Finally, we observed that readmission rates, but not mortality rates, show strong geographic concentration.
These findings suggest possible opportunities to save or extend the lives of a substantial number of Americans, and to reduce the burden of rehospitalization on patients and families, if low performing institutions were able to achieve the performance of those with better outcomes. Additionally, because readmission is so common (nearly 1 in 5 patients), efforts to reduce overall health care spending should focus on this large potential source of savings.19 In this regard, impending changes in payment to hospitals around readmissions will change incentives for hospitals and physicians that may ultimately lead to lower readmission rates.20
Previous analyses of the quality of hospital care for patients with pneumonia have focused on the percentage of eligible patients who received guideline‐recommended antibiotics within a specified time frame (4 or 8 hours), and vaccination prior to hospital discharge.21, 22 These studies have highlighted large differences across hospitals and states in the percentage receiving recommended care. In contrast, the focus of this study was to compare risk‐standardized outcomes of care at the nation's hospitals and across its regions. This effort was guided by the notion that the measurement of care outcomes is an important complement to process measurement because outcomes represent a more holistic assessment of care, that an outcomes focus offers hospitals greater autonomy in terms of what processes to improve, and that outcomes are ultimately more meaningful to patients than the technical aspects of how the outcomes were achieved. In contrast to these earlier process‐oriented efforts, the magnitude of the differences we observed in mortality and readmission rates across hospitals was not nearly as large.
A recent analysis of the outcomes of care for patients with heart failure and acute myocardial infarction also found significant variation in both hospital and regional mortality and readmission rates.23 The relative differences in risk‐standardized hospital mortality rates across the 10th to 90th percentiles of hospital performance was 25% for acute myocardial infarction, and 39% for heart failure. By contrast, we found that the difference in risk‐standardized hospital mortality rates across the 10th to 90th percentiles in pneumonia was an even greater 50% (13.5% vs. 9.0%). Similar to the findings in acute myocardial infarction and heart failure, we observed that risk‐standardized mortality rates varied more so than did readmission rates.
Our study has a number of limitations. First, the analysis was restricted to Medicare patients only, and our findings may not be generalizable to younger patients. Second, our risk‐adjustment methods relied on claims data, not clinical information abstracted from charts. Nevertheless, we assessed comorbidities using all physician and hospital claims from the year prior to the index admission. Additionally our mortality and readmission models were validated against those based on medical record data and the outputs of the 2 approaches were highly correlated.15, 24, 25 Our study was restricted to patients with a principal diagnosis of pneumonia, and we therefore did not include those whose principal diagnosis was sepsis or respiratory failure and who had a secondary diagnosis of pneumonia. While this decision was made to reduce the risk of misclassifying complications of care as the reason for admission, we acknowledge that this is likely to have limited our study to patients with less severe disease, and may have introduced bias related to differences in hospital coding practices regarding the use of sepsis and respiratory failure codes. While we excluded patients with 1 day length of stay from the mortality analysis to reduce the risk of including patients in the measure who did not actually have pneumonia, we did not exclude them from the readmission analysis because very short length of stay may be a risk factor for readmission. An additional limitation of our study is that our findings are primarily descriptive, and we did not attempt to explain the sources of the variation we observed. For example, we did not examine the extent to which these differences might be explained by differences in adherence to process measures across hospitals or regions. However, if the experience in acute myocardial infarction can serve as a guide, then it is unlikely that more than a small fraction of the observed variation in outcomes can be attributed to factors such as antibiotic timing or selection.26 Additionally, we cannot explain why readmission rates were more geographically distributed than mortality rates, however it is possible that this may be related to the supply of physicians or hospital beds.27 Finally, some have argued that mortality and readmission rates do not necessarily reflect the very quality they intend to measure.2830
The outcomes of patients with pneumonia appear to be significantly influenced by both the hospital and region where they receive care. Efforts to improve population level outcomes might be informed by studying the practices of hospitals and regions that consistently achieve high levels of performance.31
Acknowledgements
The authors thank Sandi Nelson, Eric Schone, and Marian Wrobel at Mathematicia Policy Research and Changquin Wang and Jinghong Gao at YNHHS/Yale CORE for analytic support. They also acknowledge Shantal Savage, Kanchana Bhat, and Mayur M. Desai at Yale, Joseph S. Ross at the Mount Sinai School of Medicine, and Shaheen Halim at the Centers for Medicare and Medicaid Services.
- , , , , . HCUP Facts and Figures: Statistics on Hospital‐based Care in the United States, 2007 [Internet]. 2009 [cited 2009 Nov 7]. Available at: http://www.hcup‐us.ahrq.gov/reports.jsp. Accessed June2010.
- Agency for Healthcare Research and Quality. HCUP Nationwide Inpatient Sample (NIS). Healthcare Cost and Utilization Project (HCUP). [Internet]. 2007 [cited 2010 May 13]. Available at: http://www.hcup‐us.ahrq.gov/nisoverview.jsp. Accessed June2010.
- , , , , .Trends in hospitalizations for pneumonia among persons aged 65 years or older in the United States, 1988‐2002.JAMA.20057;294(21):2712–2719.
- . Deaths: Leading Causes for 2006. NVSS [Internet]. 2010 Mar 31;58(14). Available at: http://www.cdc.gov/nchs/data/nvsr/nvsr58/nvsr58_ 14.pdf. Accessed June2010.
- Centers for Medicare and Medicaid Services. Pneumonia [Internet]. [cited 2010 May 13]. Available at: http://www.qualitynet.org/dcs/ContentServer?cid= 108981596702326(1):75–85.
- , , .Performance measures for pneumonia: are they valuable, and are process measures adequate?Curr Opin Infect Dis.2007;20(2):182–189.
- , .Relationship Between Medicare's Hospital Compare Performance Measures and Mortality Rates.JAMA.2006;296(22):2694–2702.
- Medicare.gov ‐ Hospital Compare [Internet]. [cited 2009 Nov 6]. Available at: http://www.hospitalcompare.hhs.gov/Hospital/Search/Welcome.asp? version=default 2010. Available at: http://www.qualitynet.org/dcs/ContentServer? c=Page 2010. Available at: http://www.qualitynet.org/dcs/ContentServer? c=Page 2000 [cited 2009 Nov 7]. Available at: http://www.cms.hhs.gov/Reports/Reports/ItemDetail.asp?ItemID=CMS023176. Accessed June2010.
- , , , et al. Risk‐Adjustment Methodology for Hospital Monitoring/Surveillance and Public Reporting Supplement #1: 30‐Day Mortality Model for Pneumonia [Internet]. Yale University; 2006. Available at: http://www.qualitynet.org/dcs/ContentServer?c= Page 2008. Available at: http://www.qualitynet.org/dcs/ContentServer?c= Page1999.
- , .Statistical and clinical aspects of hospital outcomes profiling.Stat Sci.2007;22(2):206–226.
- Medicare Payment Advisory Commission. Report to the Congress: Promoting Greater Efficiency in Medicare.2007 June.
- Patient Protection and Affordable Care Act [Internet]. 2010. Available at: http://thomas.loc.gov. Accessed June2010.
- , , , et al.Quality of medical care delivered to medicare beneficiaries: a profile at state and national levels.JAMA.2000;284(13):1670–1676.
- , , , .Care in U.S. hospitals — the hospital quality alliance program.N Engl J Med.2005;353(3):265–274.
- , , , et al.Patterns of hospital performance in acute myocardial infarction and heart failure 30‐day mortality and readmission.Circ Cardiovasc Qual Outcomes.2009;2(5):407–413.
- , , , et al.An administrative claims model suitable for profiling hospital performance based on 30‐day mortality rates among patients with heart failure.Circulation.2006;113(13):1693–1701.
- , , , et al.An administrative claims model suitable for profiling hospital performance based on 30‐day mortality rates among patients with an acute myocardial infarction.Circulation.2006;113(13):1683–1692.
- , , , et al.Hospital quality for acute myocardial infarction: correlation among process measures and relationship with short‐term mortality.JAMA.2006;296(1):72–78.
- , , , .Hospital readmission rates for cohorts of medicare beneficiaries in Boston and New Haven.N Engl J Med.1994;331(15):989–995.
- , .Research evidence on the validity of risk‐adjusted mortality rate as a measure of hospital quality of care.Med Care Res Rev.1998;55(4):371–404.
- , .Hospital readmissions as a measure of quality of health care: advantages and limitations.Arch Intern Med.2000;160(8):1074–1081.
- , .Hospital mortality: when failure is not a good measure of success.CMAJ.2008;179(2):153–157.
- , , , , , .Research in action: using positive deviance to improve quality of health care.Implement Sci.2009;4:25.
Pneumonia results in some 1.2 million hospital admissions each year in the United States, is the second leading cause of hospitalization among patients over 65, and accounts for more than $10 billion annually in hospital expenditures.1, 2 As a result of complex demographic and clinical forces, including an aging population, increasing prevalence of comorbidities, and changes in antimicrobial resistance patterns, between the periods 1988 to 1990 and 2000 to 2002 the number of patients hospitalized for pneumonia grew by 20%, and pneumonia was the leading infectious cause of death.3, 4
Given its public health significance, pneumonia has been the subject of intensive quality measurement and improvement efforts for well over a decade. Two of the largest initiatives are the Centers for Medicare & Medicaid Services (CMS) National Pneumonia Project and The Joint Commission ORYX program.5, 6 These efforts have largely entailed measuring hospital performance on pneumonia‐specific processes of care, such as whether blood oxygen levels were assessed, whether blood cultures were drawn before antibiotic treatment was initiated, the choice and timing of antibiotics, and smoking cessation counseling and vaccination at the time of discharge. While measuring processes of care (especially when they are based on sound evidence), can provide insights about quality, and can help guide hospital improvement efforts, these measures necessarily focus on a narrow spectrum of the overall care provided. Outcomes can complement process measures by directing attention to the results of care, which are influenced by both measured and unmeasured factors, and which may be more relevant from the patient's perspective.79
In 2008 CMS expanded its public reporting initiatives by adding risk‐standardized hospital mortality rates for pneumonia to the Hospital Compare website (
Methods
Design, Setting, Subjects
We conducted a cross‐sectional study at the hospital level of the outcomes of care of fee‐for‐service patients hospitalized for pneumonia between July 2006 and June 2009. Patients are eligible to be included in the measures if they are 65 years or older, have a principal diagnosis of pneumonia (International Classification of Diseases, Ninth Revision, Clinical Modification codes 480.X, 481, 482.XX, 483.X, 485, 486, and 487.0), and are cared for at a nonfederal acute care hospital in the US and its organized territories, including Puerto Rico, Guam, the US Virgin Islands, and the Northern Mariana Islands.
The mortality measure excludes patients enrolled in the Medicare hospice program in the year prior to, or on the day of admission, those in whom pneumonia is listed as a secondary diagnosis (to eliminate cases resulting from complications of hospitalization), those discharged against medical advice, and patients who are discharged alive but whose length of stay in the hospital is less than 1 day (because of concerns about the accuracy of the pneumonia diagnosis). Patients are also excluded if their administrative records for the period of analysis (1 year prior to hospitalization and 30 days following discharge) were not available or were incomplete, because these are needed to assess comorbid illness and outcomes. The readmission measure is similar, but does not exclude patients on the basis of hospice program enrollment (because these patients have been admitted and readmissions for hospice patients are likely unplanned events that can be measured and reduced), nor on the basis of hospital length of stay (because patients discharged within 24 hours may be at a heightened risk of readmission).11, 12
Information about patient comorbidities is derived from diagnoses recorded in the year prior to the index hospitalization as found in Medicare inpatient, outpatient, and carrier (physician) standard analytic files. Comorbidities are identified using the Condition Categories of the Hierarchical Condition Category grouper, which sorts the more than 15,000 possible diagnostic codes into 189 clinically‐coherent conditions and which was originally developed to support risk‐adjusted payments within Medicare managed care.13
Outcomes
The patient outcomes assessed include death from any cause within 30 days of admission and readmission for any cause within 30 days of discharge. All‐cause, rather than disease‐specific, readmission was chosen because hospital readmission as a consequence of suboptimal inpatient care or discharge coordination may manifest in many different diagnoses, and no validated method is available to distinguish related from unrelated readmissions. The measures use the Medicare Enrollment Database to determine mortality status, and acute care hospital inpatient claims are used to identify readmission events. For patients with multiple hospitalizations during the study period, the mortality measure randomly selects one hospitalization to use for determination of mortality. Admissions that are counted as readmissions (i.e., those that occurred within 30 days of discharge following hospitalization for pneumonia) are not also treated as index hospitalizations. In the case of patients who are transferred to or from another acute care facility, responsibility for deaths is assigned to the hospital that initially admitted the patient, while responsibility for readmissions is assigned to the hospital that ultimately discharges the patient to a nonacute setting (e.g., home, skilled nursing facilities).
Risk‐Standardization Methods
Hierarchical logistic regression is used to model the log‐odds of mortality or readmission within 30 days of admission or discharge from an index pneumonia admission as a function of patient demographic and clinical characteristics and a random hospital‐specific intercept. This strategy accounts for within‐hospital correlation of the observed outcomes, and reflects the assumption that underlying differences in quality among the hospitals being evaluated lead to systematic differences in outcomes. In contrast to nonhierarchical models which ignore hospital effects, this method attempts to measure the influence of the hospital on patient outcome after adjusting for patient characteristics. Comorbidities from the index admission that could represent potential complications of care are not included in the model unless they are also documented in the 12 months prior to admission. Hospital‐specific mortality and readmission rates are calculated as the ratio of predicted‐to‐expected events (similar to the observed/expected ratio), multiplied by the national unadjusted rate, a form of indirect standardization.
The model for mortality has a c‐statistic of 0.72 whereas a model based on medical record review that was developed for validation purposes had a c‐statistic of 0.77. The model for readmission has a c‐statistic of 0.63 whereas a model based on medical review had a c‐statistic of 0.59. The mortality and readmission models produce similar state‐level mortality and readmission rate estimates as the models derived from medical record review, and can therefore serve as reasonable surrogates. These methods, including their development and validation, have been described fully elsewhere,14, 15 and have been evaluated and subsequently endorsed by the National Quality Forum.16
Identification of Geographic Regions
To characterize patterns of performance geographically we identified the 306 hospital referral regions for each hospital in our analysis using definitions provided by the Dartmouth Atlas of Health Care project. Unlike a hospital‐level analysis, the hospital referral regions represent regional markets for tertiary care and are widely used to summarize variation in medical care inputs, utilization patterns, and health outcomes and provide a more detailed look at variation in outcomes than results at the state level.17
Analyses
Summary statistics were constructed using frequencies and proportions for categorical data, and means, medians and interquartile ranges for continuous variables. To characterize 30‐day risk‐standardized mortality and readmission rates at the hospital‐referral region level, we calculated means and percentiles by weighting each hospital's value by the inverse of the variance of the hospital's estimated rate. Hospitals with larger sample sizes, and therefore more precise estimates, lend more weight to the average. Hierarchical models were estimated using the SAS GLIMMIX procedure. Bayesian shrinkage was used to estimate rates in order to take into account the greater uncertainty in the true rates of hospitals with small caseloads. Using this technique, estimated rates at low volume institutions are shrunken toward the population mean, while hospitals with large caseloads have a relatively smaller amount of shrinkage and the estimate is closer to the hospital's observed rate.18
To determine whether a hospital's performance is significantly different than the national rate we measured whether the 95% interval estimate for the risk‐standardized rate overlapped with the national crude mortality or readmission rate. This information is used to categorize hospitals on Hospital Compare as better than the US national rate, worse than the US national rate, or no different than the US national rate. Hospitals with fewer than 25 cases in the 3‐year period, are excluded from this categorization on Hospital Compare.
Analyses were conducted with the use of SAS 9.1.3 (SAS Institute Inc, Cary, NC). We created the hospital referral region maps using ArcGIS version 9.3 (ESRI, Redlands, CA). The Human Investigation Committee at the Yale School of Medicine approved an exemption for the authors to use CMS claims and enrollment data for research analyses and publication.
Results
Hospital‐Specific Risk‐Standardized 30‐Day Mortality and Readmission Rates
Of the 1,118,583 patients included in the mortality analysis 129,444 (11.6%) died within 30 days of hospital admission. The median (Q1, Q3) hospital 30‐day risk‐standardized mortality rate was 11.1% (10.0%, 12.3%), and ranged from 6.7% to 20.9% (Table 1, Figure 1). Hospitals at the 10th percentile had 30‐day risk‐standardized mortality rates of 9.0% while for those at the 90th percentile of performance the rate was 13.5%. The odds of all‐cause mortality for a patient treated at a hospital that was one standard deviation above the national average was 1.68 times higher than that of a patient treated at a hospital that was one standard deviation below the national average.
| Mortality | Readmission | |
|---|---|---|
| ||
| Patients (n) | 1118583 | 1161817 |
| Hospitals (n) | 4788 | 4813 |
| Patient age, years, median (Q1, Q3) | 81 (74,86) | 80 (74,86) |
| Nonwhite, % | 11.1 | 11.1 |
| Hospital case volume, median (Q1, Q3) | 168 (77,323) | 174 (79,334) |
| Risk‐standardized hospital rate, mean (SD) | 11.2 (1.2) | 18.3 (0.9) |
| Minimum | 6.7 | 13.6 |
| 1st percentile | 7.5 | 14.9 |
| 5th percentile | 8.5 | 15.8 |
| 10th percentile | 9.0 | 16.4 |
| 25th percentile | 10.0 | 17.2 |
| Median | 11.1 | 18.2 |
| 75th percentile | 12.3 | 19.2 |
| 90th percentile | 13.5 | 20.4 |
| 95th percentile | 14.4 | 21.1 |
| 99th percentile | 16.1 | 22.8 |
| Maximum | 20.9 | 26.7 |
| Model fit statistics | ||
| c‐Statistic | 0.72 | 0.63 |
| Intrahospital Correlation | 0.07 | 0.03 |
For the 3‐year period 2006 to 2009, 222 (4.7%) hospitals were categorized as having a mortality rate that was better than the national average, 3968 (83.7%) were no different than the national average, 221 (4.6%) were worse and 332 (7.0%) did not meet the minimum case threshold.
Among the 1,161,817 patients included in the readmission analysis 212,638 (18.3%) were readmitted within 30 days of hospital discharge. The median (Q1,Q3) 30‐day risk‐standardized readmission rate was 18.2% (17.2%, 19.2%) and ranged from 13.6% to 26.7% (Table 1, Figure 2). Hospitals at the 10th percentile had 30‐day risk‐standardized readmission rates of 16.4% while for those at the 90th percentile of performance the rate was 20.4%. The odds of all‐cause readmission for a patient treated at a hospital that was one standard deviation above the national average was 1.40 times higher than the odds of all‐cause readmission if treated at a hospital that was one standard deviation below the national average.
For the 3‐year period 2006 to 2009, 64 (1.3%) hospitals were categorized as having a readmission rate that was better than the national average, 4203 (88.2%) were no different than the national average, 163 (3.4%) were worse and 333 (7.0%) had less than 25 cases and were therefore not categorized.
While risk‐standardized readmission rates were substantially higher than risk‐standardized mortality rates, mortality rates varied more. For example, the top 10% of hospitals had a relative mortality rate that was 33% lower than those in the bottom 10%, as compared with just a 20% relative difference for readmission rates. The coefficient of variation, a normalized measure of dispersion that unlike the standard deviation is independent of the population mean, was 10.7 for risk‐standardized mortality rates and 4.9 for readmission rates.
Regional Risk‐Standardized 30‐Day Mortality and Readmission Rates
Figures 3 and 4 show the distribution of 30‐day risk‐standardized mortality and readmission rates among hospital referral regions by quintile. Highest mortality regions were found across the entire country, including parts of Northern New England, the Mid and South Atlantic, East and the West South Central, East and West North Central, and the Mountain and Pacific regions of the West. The lowest mortality rates were observed in Southern New England, parts of the Mid and South Atlantic, East and West South Central, and parts of the Mountain and Pacific regions of the West (Figure 3).
Readmission rates were higher in the eastern portions of the US (including the Northeast, Mid and South Atlantic, East South Central) as well as the East North Central, and small parts of the West North Central portions of the Midwest and in Central California. The lowest readmission rates were observed in the West (Mountain and Pacific regions), parts of the Midwest (East and West North Central) and small pockets within the South and Northeast (Figure 4).
Discussion
In this 3‐year analysis of patient, hospital, and regional outcomes we observed that pneumonia in the elderly remains a highly morbid illness, with a 30‐day mortality rate of approximately 11.6%. More notably we observed that risk‐standardized mortality rates, and to a lesser extent readmission rates, vary significantly across hospitals and regions. Finally, we observed that readmission rates, but not mortality rates, show strong geographic concentration.
These findings suggest possible opportunities to save or extend the lives of a substantial number of Americans, and to reduce the burden of rehospitalization on patients and families, if low performing institutions were able to achieve the performance of those with better outcomes. Additionally, because readmission is so common (nearly 1 in 5 patients), efforts to reduce overall health care spending should focus on this large potential source of savings.19 In this regard, impending changes in payment to hospitals around readmissions will change incentives for hospitals and physicians that may ultimately lead to lower readmission rates.20
Previous analyses of the quality of hospital care for patients with pneumonia have focused on the percentage of eligible patients who received guideline‐recommended antibiotics within a specified time frame (4 or 8 hours), and vaccination prior to hospital discharge.21, 22 These studies have highlighted large differences across hospitals and states in the percentage receiving recommended care. In contrast, the focus of this study was to compare risk‐standardized outcomes of care at the nation's hospitals and across its regions. This effort was guided by the notion that the measurement of care outcomes is an important complement to process measurement because outcomes represent a more holistic assessment of care, that an outcomes focus offers hospitals greater autonomy in terms of what processes to improve, and that outcomes are ultimately more meaningful to patients than the technical aspects of how the outcomes were achieved. In contrast to these earlier process‐oriented efforts, the magnitude of the differences we observed in mortality and readmission rates across hospitals was not nearly as large.
A recent analysis of the outcomes of care for patients with heart failure and acute myocardial infarction also found significant variation in both hospital and regional mortality and readmission rates.23 The relative differences in risk‐standardized hospital mortality rates across the 10th to 90th percentiles of hospital performance was 25% for acute myocardial infarction, and 39% for heart failure. By contrast, we found that the difference in risk‐standardized hospital mortality rates across the 10th to 90th percentiles in pneumonia was an even greater 50% (13.5% vs. 9.0%). Similar to the findings in acute myocardial infarction and heart failure, we observed that risk‐standardized mortality rates varied more so than did readmission rates.
Our study has a number of limitations. First, the analysis was restricted to Medicare patients only, and our findings may not be generalizable to younger patients. Second, our risk‐adjustment methods relied on claims data, not clinical information abstracted from charts. Nevertheless, we assessed comorbidities using all physician and hospital claims from the year prior to the index admission. Additionally our mortality and readmission models were validated against those based on medical record data and the outputs of the 2 approaches were highly correlated.15, 24, 25 Our study was restricted to patients with a principal diagnosis of pneumonia, and we therefore did not include those whose principal diagnosis was sepsis or respiratory failure and who had a secondary diagnosis of pneumonia. While this decision was made to reduce the risk of misclassifying complications of care as the reason for admission, we acknowledge that this is likely to have limited our study to patients with less severe disease, and may have introduced bias related to differences in hospital coding practices regarding the use of sepsis and respiratory failure codes. While we excluded patients with 1 day length of stay from the mortality analysis to reduce the risk of including patients in the measure who did not actually have pneumonia, we did not exclude them from the readmission analysis because very short length of stay may be a risk factor for readmission. An additional limitation of our study is that our findings are primarily descriptive, and we did not attempt to explain the sources of the variation we observed. For example, we did not examine the extent to which these differences might be explained by differences in adherence to process measures across hospitals or regions. However, if the experience in acute myocardial infarction can serve as a guide, then it is unlikely that more than a small fraction of the observed variation in outcomes can be attributed to factors such as antibiotic timing or selection.26 Additionally, we cannot explain why readmission rates were more geographically distributed than mortality rates, however it is possible that this may be related to the supply of physicians or hospital beds.27 Finally, some have argued that mortality and readmission rates do not necessarily reflect the very quality they intend to measure.2830
The outcomes of patients with pneumonia appear to be significantly influenced by both the hospital and region where they receive care. Efforts to improve population level outcomes might be informed by studying the practices of hospitals and regions that consistently achieve high levels of performance.31
Acknowledgements
The authors thank Sandi Nelson, Eric Schone, and Marian Wrobel at Mathematicia Policy Research and Changquin Wang and Jinghong Gao at YNHHS/Yale CORE for analytic support. They also acknowledge Shantal Savage, Kanchana Bhat, and Mayur M. Desai at Yale, Joseph S. Ross at the Mount Sinai School of Medicine, and Shaheen Halim at the Centers for Medicare and Medicaid Services.
- , , , , . HCUP Facts and Figures: Statistics on Hospital‐based Care in the United States, 2007 [Internet]. 2009 [cited 2009 Nov 7]. Available at: http://www.hcup‐us.ahrq.gov/reports.jsp. Accessed June2010.
- Agency for Healthcare Research and Quality. HCUP Nationwide Inpatient Sample (NIS). Healthcare Cost and Utilization Project (HCUP). [Internet]. 2007 [cited 2010 May 13]. Available at: http://www.hcup‐us.ahrq.gov/nisoverview.jsp. Accessed June2010.
- , , , , .Trends in hospitalizations for pneumonia among persons aged 65 years or older in the United States, 1988‐2002.JAMA.20057;294(21):2712–2719.
- . Deaths: Leading Causes for 2006. NVSS [Internet]. 2010 Mar 31;58(14). Available at: http://www.cdc.gov/nchs/data/nvsr/nvsr58/nvsr58_ 14.pdf. Accessed June2010.
- Centers for Medicare and Medicaid Services. Pneumonia [Internet]. [cited 2010 May 13]. Available at: http://www.qualitynet.org/dcs/ContentServer?cid= 108981596702326(1):75–85.
- , , .Performance measures for pneumonia: are they valuable, and are process measures adequate?Curr Opin Infect Dis.2007;20(2):182–189.
- , .Relationship Between Medicare's Hospital Compare Performance Measures and Mortality Rates.JAMA.2006;296(22):2694–2702.
- Medicare.gov ‐ Hospital Compare [Internet]. [cited 2009 Nov 6]. Available at: http://www.hospitalcompare.hhs.gov/Hospital/Search/Welcome.asp? version=default 2010. Available at: http://www.qualitynet.org/dcs/ContentServer? c=Page 2010. Available at: http://www.qualitynet.org/dcs/ContentServer? c=Page 2000 [cited 2009 Nov 7]. Available at: http://www.cms.hhs.gov/Reports/Reports/ItemDetail.asp?ItemID=CMS023176. Accessed June2010.
- , , , et al. Risk‐Adjustment Methodology for Hospital Monitoring/Surveillance and Public Reporting Supplement #1: 30‐Day Mortality Model for Pneumonia [Internet]. Yale University; 2006. Available at: http://www.qualitynet.org/dcs/ContentServer?c= Page 2008. Available at: http://www.qualitynet.org/dcs/ContentServer?c= Page1999.
- , .Statistical and clinical aspects of hospital outcomes profiling.Stat Sci.2007;22(2):206–226.
- Medicare Payment Advisory Commission. Report to the Congress: Promoting Greater Efficiency in Medicare.2007 June.
- Patient Protection and Affordable Care Act [Internet]. 2010. Available at: http://thomas.loc.gov. Accessed June2010.
- , , , et al.Quality of medical care delivered to medicare beneficiaries: a profile at state and national levels.JAMA.2000;284(13):1670–1676.
- , , , .Care in U.S. hospitals — the hospital quality alliance program.N Engl J Med.2005;353(3):265–274.
- , , , et al.Patterns of hospital performance in acute myocardial infarction and heart failure 30‐day mortality and readmission.Circ Cardiovasc Qual Outcomes.2009;2(5):407–413.
- , , , et al.An administrative claims model suitable for profiling hospital performance based on 30‐day mortality rates among patients with heart failure.Circulation.2006;113(13):1693–1701.
- , , , et al.An administrative claims model suitable for profiling hospital performance based on 30‐day mortality rates among patients with an acute myocardial infarction.Circulation.2006;113(13):1683–1692.
- , , , et al.Hospital quality for acute myocardial infarction: correlation among process measures and relationship with short‐term mortality.JAMA.2006;296(1):72–78.
- , , , .Hospital readmission rates for cohorts of medicare beneficiaries in Boston and New Haven.N Engl J Med.1994;331(15):989–995.
- , .Research evidence on the validity of risk‐adjusted mortality rate as a measure of hospital quality of care.Med Care Res Rev.1998;55(4):371–404.
- , .Hospital readmissions as a measure of quality of health care: advantages and limitations.Arch Intern Med.2000;160(8):1074–1081.
- , .Hospital mortality: when failure is not a good measure of success.CMAJ.2008;179(2):153–157.
- , , , , , .Research in action: using positive deviance to improve quality of health care.Implement Sci.2009;4:25.
Copyright © 2010 Society of Hospital Medicine
