User login
Planned Readmission Algorithm
The Centers for Medicare & Medicaid Services (CMS) publicly reports all‐cause risk‐standardized readmission rates after acute‐care hospitalization for acute myocardial infarction, pneumonia, heart failure, total hip and knee arthroplasty, chronic obstructive pulmonary disease, stroke, and for patients hospital‐wide.[1, 2, 3, 4, 5] Ideally, these measures should capture unplanned readmissions that arise from acute clinical events requiring urgent rehospitalization. Planned readmissions, which are scheduled admissions usually involving nonurgent procedures, may not be a signal of quality of care. Including planned readmissions in readmission quality measures could create a disincentive to provide appropriate care to patients who are scheduled for elective or necessary procedures unrelated to the quality of the prior admission. Accordingly, under contract to the CMS, we were asked to develop an algorithm to identify planned readmissions. A version of this algorithm is now incorporated into all publicly reported readmission measures.
Given the widespread use of the planned readmission algorithm in public reporting and its implications for hospital quality measurement and evaluation, the objective of this study was to describe the development process, and to validate and refine the algorithm by reviewing charts of readmitted patients.
METHODS
Algorithm Development
To create a planned readmission algorithm, we first defined planned. We determined that readmissions for obstetrical delivery, maintenance chemotherapy, major organ transplant, and rehabilitation should always be considered planned in the sense that they are desired and/or inevitable, even if not specifically planned on a certain date. Apart from these specific types of readmissions, we defined planned readmissions as nonacute readmissions for scheduled procedures, because the vast majority of planned admissions are related to procedures. We also defined readmissions for acute illness or for complications of care as unplanned for the purposes of a quality measure. Even if such readmissions included a potentially planned procedure, because complications of care represent an important dimension of quality that should not be excluded from outcome measurement, these admissions should not be removed from the measure outcome. This definition of planned readmissions does not imply that all unplanned readmissions are unexpected or avoidable. However, it has proven very difficult to reliably define avoidable readmissions, even by expert review of charts, and we did not attempt to do so here.[6, 7]
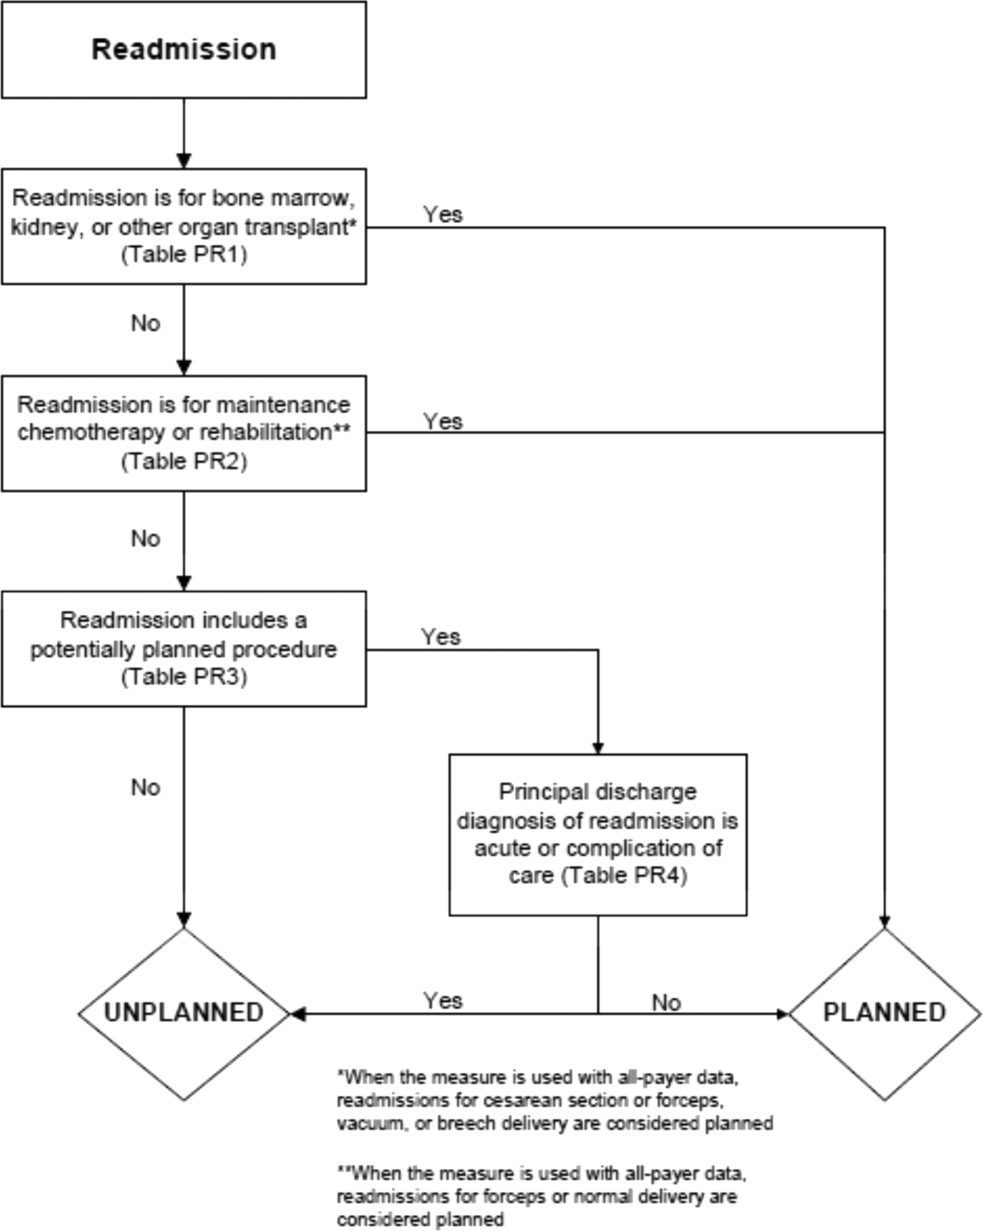
In the second stage, we operationalized this definition into an algorithm. We used the Agency for Healthcare Research and Quality's Clinical Classification Software (CCS) codes to group thousands of individual procedure and diagnosis International Classification of Disease, Ninth Revision, Clinical Modification (ICD‐9‐CM) codes into clinically coherent, mutually exclusive procedure CCS categories and mutually exclusive diagnosis CCS categories, respectively. Clinicians on the investigative team reviewed the procedure categories to identify those that are commonly planned and that would require inpatient admission. We also reviewed the diagnosis categories to identify acute diagnoses unlikely to accompany elective procedures. We then created a flow diagram through which every readmission could be run to determine whether it was planned or unplanned based on our categorizations of procedures and diagnoses (Figure 1, and Supporting Information, Appendix A, in the online version of this article). This version of the algorithm (v1.0) was submitted to the National Quality Forum (NQF) as part of the hospital‐wide readmission measure. The measure (NQR #1789) received endorsement in April 2012.

In the third stage of development, we posted the algorithm for 2 public comment periods and recruited 27 outside experts to review and refine the algorithm following a standardized, structured process (see Supporting Information, Appendix B, in the online version of this article). Because the measures publicly report and hold hospitals accountable for unplanned readmission rates, we felt it most important that the algorithm include as few planned readmissions in the reported, unplanned outcome as possible (ie, have high negative predictive value). Therefore, in equivocal situations in which experts felt procedure categories were equally often planned or unplanned, we added those procedures to the potentially planned list. We also solicited feedback from hospitals on algorithm performance during a confidential test run of the hospital‐wide readmission measure in the fall of 2012. Based on all of this feedback, we made a number of changes to the algorithm, which was then identified as v2.1. Version 2.1 of the algorithm was submitted to the NQF as part of the endorsement process for the acute myocardial infarction and heart failure readmission measures and was endorsed by the NQF in January 2013. The algorithm (v2.1) is now applied, adapted if necessary, to all publicly reported readmission measures.[8]
Algorithm Validation: Study Cohort
We recruited 2 hospital systems to participate in a chart validation study of the accuracy of the planned readmission algorithm (v2.1). Within these 2 health systems, we selected 7 hospitals with varying bed size, teaching status, and safety‐net status. Each included 1 large academic teaching hospital that serves as a regional referral center. For each hospital's index admissions, we applied the inclusion and exclusion criteria from the hospital‐wide readmission measure. Index admissions were included for patients age 65 years or older; enrolled in Medicare fee‐for‐service (FFS); discharged from a nonfederal, short‐stay, acute‐care hospital or critical access hospital; without an in‐hospital death; not transferred to another acute‐care facility; and enrolled in Part A Medicare for 1 year prior to discharge. We excluded index admissions for patients without at least 30 days postdischarge enrollment in FFS Medicare, discharged against medical advice, admitted for medical treatment of cancer or primary psychiatric disease, admitted to a Prospective Payment System‐exempt cancer hospital, or who died during the index hospitalization. In addition, for this study, we included only index admissions that were followed by a readmission to a hospital within the participating health system between July 1, 2011 and June 30, 2012. Institutional review board approval was obtained from each of the participating health systems, which granted waivers of signed informed consent and Health Insurance Portability and Accountability Act waivers.
Algorithm Validation: Sample Size Calculation
We determined a priori that the minimum acceptable positive predictive value, or proportion of all readmissions the algorithm labels planned that are truly planned, would be 60%, and the minimum acceptable negative predictive value, or proportion of all readmissions the algorithm labels as unplanned that are truly unplanned, would be 80%. We calculated the sample size required to be confident of these values 10% and determined we would need a total of 291 planned charts and 162 unplanned charts. We inflated these numbers by 20% to account for missing or unobtainable charts for a total of 550 charts. To achieve this sample size, we included all eligible readmissions from all participating hospitals that were categorized as planned. At the 5 smaller hospitals, we randomly selected an equal number of unplanned readmissions occurring at any hospital in its healthcare system. At the 2 largest hospitals, we randomly selected 50 unplanned readmissions occurring at any hospital in its healthcare system.
Algorithm Validation: Data Abstraction
We developed an abstraction tool, tested and refined it using sample charts, and built the final the tool into a secure, password‐protected Microsoft Access 2007 (Microsoft Corp., Redmond, WA) database (see Supporting Information, Appendix C, in the online version of this article). Experienced chart abstractors with RN or MD degrees from each hospital site participated in a 1‐hour training session to become familiar with reviewing medical charts, defining planned/unplanned readmissions, and the data abstraction process. For each readmission, we asked abstractors to review as needed: emergency department triage and physician notes, admission history and physical, operative report, discharge summary, and/or discharge summary from a prior admission. The abstractors verified the accuracy of the administrative billing data, including procedures and principal diagnosis. In addition, they abstracted the source of admission and dates of all major procedures. Then the abstractors provided their opinion and supporting rationale as to whether a readmission was planned or unplanned. They were not asked to determine whether the readmission was preventable. To determine the inter‐rater reliability of data abstraction, an independent abstractor at each health system recoded a random sample of 10% of the charts.
Statistical Analysis
To ensure that we had obtained a representative sample of charts, we identified the 10 most commonly planned procedures among cases identified as planned by the algorithm in the validation cohort and then compared this with planned cases nationally. To confirm the reliability of the abstraction process, we used the kappa statistic to determine the inter‐rater reliability of the determination of planned or unplanned status. Additionally, the full study team, including 5 practicing clinicians, reviewed the details of every chart abstraction in which the algorithm was found to have misclassified the readmission as planned or unplanned. In 11 cases we determined that the abstractor had misunderstood the definition of planned readmission (ie, not all direct admissions are necessarily planned) and we reclassified the chart review assignment accordingly.
We calculated sensitivity, specificity, positive predictive value, and negative predictive value of the algorithm for the validation cohort as a whole, weighted to account for the prevalence of planned readmissions as defined by the algorithm in the national data (7.8%). Weighting is necessary because we did not obtain a pure random sample, but rather selected a stratified sample that oversampled algorithm‐identified planned readmissions.[9] We also calculated these rates separately for large hospitals (>600 beds) and for small hospitals (600 beds).
Finally, we examined performance of the algorithm for individual procedures and diagnoses to determine whether any procedures or diagnoses should be added or removed from the algorithm. First, we reviewed the diagnoses, procedures, and brief narratives provided by the abstractors for all cases in which the algorithm misclassified the readmission as either planned or unplanned. Second, we calculated the positive predictive value for each procedure that had been flagged as planned by the algorithm, and reviewed all readmissions (correctly and incorrectly classified) in which procedures with low positive predictive value took place. We also calculated the frequency with which the procedure was the only qualifying procedure resulting in an accurate or inaccurate classification. Third, to identify changes that should be made to the lists of acute and nonacute diagnoses, we reviewed the principal diagnosis for all readmissions misclassified by the algorithm as either planned or unplanned, and examined the specific ICD‐9‐CM codes within each CCS group that were most commonly associated with misclassifications.
After determining the changes that should be made to the algorithm based on these analyses, we recalculated the sensitivity, specificity, positive predictive value, and negative predictive value of the proposed revised algorithm (v3.0). All analyses used SAS version 9.3 (SAS Institute, Cary, NC).
RESULTS
Study Cohort
Characteristics of participating hospitals are shown in Table 1. Hospitals represented in this sample ranged in size, teaching status, and safety net status, although all were nonprofit. We selected 663 readmissions for review, 363 planned and 300 unplanned. Overall we were able to select 80% of hospitals planned cases for review; the remainder occurred at hospitals outside the participating hospital system. Abstractors were able to locate and review 634 (96%) of the eligible charts (range, 86%100% per hospital). The kappa statistic for inter‐rater reliability was 0.83.
| Description | Hospitals, N | Readmissions Selected for Review, N* | Readmissions Reviewed, N (% of Eligible) | Unplanned Readmissions Reviewed, N | Planned Readmissions Reviewed, N | % of Hospital's Planned Readmissions Reviewed* | |
|---|---|---|---|---|---|---|---|
| |||||||
| All hospitals | 7 | 663 | 634 (95.6) | 283 | 351 | 77.3 | |
| No. of beds | >600 | 2 | 346 | 339 (98.0) | 116 | 223 | 84.5 |
| >300600 | 2 | 190 | 173 (91.1) | 85 | 88 | 87.1 | |
| <300 | 3 | 127 | 122 (96.0) | 82 | 40 | 44.9 | |
| Ownership | Government | 0 | |||||
| For profit | 0 | ||||||
| Not for profit | 7 | 663 | 634 (95.6) | 283 | 351 | 77.3 | |
| Teaching status | Teaching | 2 | 346 | 339 (98.0) | 116 | 223 | 84.5 |
| Nonteaching | 5 | 317 | 295 (93.1) | 167 | 128 | 67.4 | |
| Safety net status | Safety net | 2 | 346 | 339 (98.0) | 116 | 223 | 84.5 |
| Nonsafety net | 5 | 317 | 295 (93.1) | 167 | 128 | 67.4 | |
| Region | New England | 3 | 409 | 392 (95.8) | 155 | 237 | 85.9 |
| South Central | 4 | 254 | 242 (95.3) | 128 | 114 | 64.0 | |
The study sample included 57/67 (85%) of the procedure or condition categories on the potentially planned list. The most common procedure CCS categories among planned readmissions (v2.1) in the validation cohort were very similar to those in the national dataset (see Supporting Information, Appendix D, in the online version of this article). Of the top 20 most commonly planned procedure CCS categories in the validation set, all but 2, therapeutic radiology for cancer treatment (CCS 211) and peripheral vascular bypass (CCS 55), were among the top 20 most commonly planned procedure CCS categories in the national data.
Test Characteristics of Algorithm
The weighted test characteristics of the current algorithm (v2.1) are shown in Table 2. Overall, the algorithm correctly identified 266 readmissions as unplanned and 181 readmissions as planned, and misidentified 170 readmissions as planned and 15 as unplanned. Once weighted to account for the stratified sampling design, the overall prevalence of true planned readmissions was 8.9% of readmissions. The weighted sensitivity was 45.1% overall and was higher in large teaching centers than in smaller community hospitals. The weighted specificity was 95.9%. The positive predictive value was 51.6%, and the negative predictive value was 94.7%.
| Cohort | Sensitivity | Specificity | Positive Predictive Value | Negative Predictive Value |
|---|---|---|---|---|
| Algorithm v2.1 | ||||
| Full cohort | 45.1% | 95.9% | 51.6% | 94.7% |
| Large hospitals | 50.9% | 96.1% | 53.8% | 95.6% |
| Small hospitals | 40.2% | 95.5% | 47.7% | 94.0% |
| Revised algorithm v3.0 | ||||
| Full cohort | 49.8% | 96.5% | 58.7% | 94.5% |
| Large hospitals | 57.1% | 96.8% | 63.0% | 95.9% |
| Small hospitals | 42.6% | 95.9% | 52.6% | 93.9% |
Accuracy of Individual Diagnoses and Procedures
The positive predictive value of the algorithm for individual procedure categories varied widely, from 0% to 100% among procedures with at least 10 cases (Table 3). The procedure for which the algorithm was least accurate was CCS 211, therapeutic radiology for cancer treatment (0% positive predictive value). By contrast, maintenance chemotherapy (90%) and other therapeutic procedures, hemic and lymphatic system (100%) were most accurate. Common procedures with less than 50% positive predictive value (ie, that the algorithm commonly misclassified as planned) were diagnostic cardiac catheterization (25%); debridement of wound, infection, or burn (25%); amputation of lower extremity (29%); insertion, revision, replacement, removal of cardiac pacemaker or cardioverter/defibrillator (33%); and other hernia repair (43%). Of these, diagnostic cardiac catheterization and cardiac devices are the first and second most common procedures nationally, respectively.
| Readmission Procedure CCS Code | Total Categorized as Planned by Algorithm, N | Verified as Planned by Chart Review, N | Positive Predictive Value |
|---|---|---|---|
| |||
| 47 Diagnostic cardiac catheterization; coronary arteriography | 44 | 11 | 25% |
| 224 Cancer chemotherapy | 40 | 22 | 55% |
| 157 Amputation of lower extremity | 31 | 9 | 29% |
| 49 Other operating room heart procedures | 27 | 16 | 59% |
| 48 Insertion, revision, replacement, removal of cardiac pacemaker or cardioverter/defibrillator | 24 | 8 | 33% |
| 43 Heart valve procedures | 20 | 16 | 80% |
| Maintenance chemotherapy (diagnosis CCS 45) | 20 | 18 | 90% |
| 78 Colorectal resection | 18 | 9 | 50% |
| 169 Debridement of wound, infection or burn | 16 | 4 | 25% |
| 84 Cholecystectomy and common duct exploration | 16 | 5 | 31% |
| 99 Other OR gastrointestinal therapeutic procedures | 16 | 8 | 50% |
| 158 Spinal fusion | 15 | 11 | 73% |
| 142 Partial excision bone | 14 | 10 | 71% |
| 86 Other hernia repair | 14 | 6 | 42% |
| 44 Coronary artery bypass graft | 13 | 10 | 77% |
| 67 Other therapeutic procedures, hemic and lymphatic system | 13 | 13 | 100% |
| 211 Therapeutic radiology for cancer treatment | 12 | 0 | 0% |
| 45 Percutaneous transluminal coronary angioplasty | 11 | 7 | 64% |
| Total | 497 | 272 | 54.7% |
The readmissions with least abstractor agreement were those involving CCS 157 (amputation of lower extremity) and CCS 169 (debridement of wound, infection or burn). Readmissions for these procedures were nearly always performed as a consequence of acute worsening of chronic conditions such as osteomyelitis or ulceration. Abstractors were divided over whether these readmissions were appropriate to call planned.
Changes to the Algorithm
We determined that the accuracy of the algorithm would be improved by removing 2 procedure categories from the planned procedure list (therapeutic radiation [CCS 211] and cancer chemotherapy [CCS 224]), adding 1 diagnosis category to the acute diagnosis list (hypertension with complications [CCS 99]), and splitting 2 diagnosis condition categories into acute and nonacute ICD‐9‐CM codes (pancreatic disorders [CCS 149] and biliary tract disease [CCS 152]). Detailed rationales for each modification to the planned readmission algorithm are described in Table 4. We felt further examination of diagnostic cardiac catheterization and cardiac devices was warranted given their high frequency, despite low positive predictive value. We also elected not to alter the categorization of amputation or debridement because it was not easy to determine whether these admissions were planned or unplanned even with chart review. We plan further analyses of these procedure categories.
| Action | Diagnosis or Procedure Category | Algorithm | Chart | N | Rationale for Change |
|---|---|---|---|---|---|
| |||||
| Remove from planned procedure list | Therapeutic radiation (CCS 211) | Accurate | The algorithm was inaccurate in every case. All therapeutic radiology during readmissions was performed because of acute illness (pain crisis, neurologic crisis) or because scheduled treatment occurred during an unplanned readmission. In national data, this ranks as the 25th most common planned procedure identified by the algorithm v2.1. | ||
| Planned | Planned | 0 | |||
| Unplanned | Unplanned | 0 | |||
| Inaccurate | |||||
| Unplanned | Planned | 0 | |||
| Planned | Unplanned | 12 | |||
| Cancer chemotherapy (CCS 224) | Accurate | Of the 22 correctly identified as planned, 18 (82%) would already have been categorized as planned because of a principal diagnosis of maintenance chemotherapy. Therefore, removing CCS 224 from the planned procedure list would only miss a small fraction of planned readmissions but would avoid a large number of misclassifications. In national data, this ranks as the 8th most common planned procedure identified by the algorithm v2.1. | |||
| Planned | Planned | 22 | |||
| Unplanned | Unplanned | 0 | |||
| Inaccurate | |||||
| Unplanned | Planned | 0 | |||
| Planned | Unplanned | 18 | |||
| Add to planned procedure list | None | The abstractors felt a planned readmission was missed by the algorithm in 15 cases. A handful of these cases were missed because the planned procedure was not on the current planned procedure list; however, those procedures (eg, abdominal paracentesis, colonoscopy, endoscopy) were nearly always unplanned overall and should therefore not be added as procedures that potentially qualify as an admission as planned. | |||
| Remove from acute diagnosis list | None | The abstractors felt a planned readmission was missed by the algorithm in 15 cases. The relevant disqualifying acute diagnoses were much more often associated with unplanned readmissions in our dataset. | |||
| Add to acute diagnosis list | Hypertension with complications (CCS 99) | Accurate | This CCS was associated with only 1 planned readmission (for elective nephrectomy, a very rare procedure). Every other time this CCS appeared in the dataset, it was associated with an unplanned readmission (12/13, 92%); 10 of those, however, were misclassified by the algorithm as planned because they were not excluded by diagnosis (91% error rate). Consequently, adding this CCS to the acute diagnosis list is likely to miss only a very small fraction of planned readmissions, while making the overall algorithm much more accurate. | ||
| Planned | Planned | 1 | |||
| Unplanned | Unplanned | 2 | |||
| Inaccurate | |||||
| Unplanned | Planned | 0 | |||
| Planned | Unplanned | 10 | |||
| Split diagnosis condition category into component ICD‐9 codes | Pancreatic disorders (CCS 152) | Accurate | ICD‐9 code 577.0 (acute pancreatitis) is the only acute code in this CCS. Acute pancreatitis was present in 2 cases that were misclassified as planned. Clinically, there is no situation in which a planned procedure would reasonably be performed in the setting of acute pancreatitis. Moving ICD‐9 code 577.0 to the acute list and leaving the rest of the ICD‐9 codes in CCS 152 on the nonacute list will enable the algorithm to continue to identify planned procedures for chronic pancreatitis. | ||
| Planned | Planned | 0 | |||
| Unplanned | Unplanned | 1 | |||
| Inaccurate | |||||
| Unplanned | Planned | 0 | |||
| Planned | Unplanned | 2 | |||
| Biliary tract disease (CCS 149) | Accurate | This CCS is a mix of acute and chronic diagnoses. Of 14 charts classified as planned with CCS 149 in the principal diagnosis field, 12 were misclassified (of which 10 were associated with cholecystectomy). Separating out the acute and nonacute diagnoses will increase the accuracy of the algorithm while still ensuring that planned cholecystectomies and other procedures can be identified. Of the ICD‐9 codes in CCS 149, the following will be added to the acute diagnosis list: 574.0, 574.3, 574.6, 574.8, 575.0, 575.12, 576.1. | |||
| Planned | Planned | 2 | |||
| Unplanned | Unplanned | 3 | |||
| Inaccurate | |||||
| Unplanned | Planned | 0 | |||
| Planned | Unplanned | 12 | |||
| Consider for change after additional study | Diagnostic cardiac catheterization (CCS 47) | Accurate | The algorithm misclassified as planned 25/38 (66%) unplanned readmissions in which diagnostic catheterizations were the only qualifying planned procedure. It also correctly identified 3/3 (100%) planned readmissions in which diagnostic cardiac catheterizations were the only qualifying planned procedure. This is the highest volume procedure in national data. | ||
| Planned | Planned | 3* | |||
| Unplanned | Unplanned | 13* | |||
| Inaccurate | |||||
| Unplanned | Planned | 0* | |||
| Planned | Unplanned | 25* | |||
| Insertion, revision, replacement, removal of cardiac pacemaker or cardioverter/defibrillator (CCS 48) | Accurate | The algorithm misclassified as planned 4/5 (80%) unplanned readmissions in which cardiac devices were the only qualifying procedure. However, it also correctly identified 7/8 (87.5%) planned readmissions in which cardiac devices were the only qualifying planned procedure. CCS 48 is the second most common planned procedure category nationally. | |||
| Planned | Planned | 7 | |||
| Unplanned | Unplanned | 1 | |||
| Inaccurate | |||||
| Unplanned | Planned | 1 | |||
| Planned | Unplanned | 4 | |||
The revised algorithm (v3.0) had a weighted sensitivity of 49.8%, weighted specificity of 96.5%, positive predictive value of 58.7%, and negative predictive value of 94.5% (Table 2). In aggregate, these changes would increase the reported unplanned readmission rate from 16.0% to 16.1% in the hospital‐wide readmission measure, using 2011 to 2012 data, and would decrease the fraction of all readmissions considered planned from 7.8% to 7.2%.
DISCUSSION
We developed an algorithm based on administrative data that in its currently implemented form is very accurate at identifying unplanned readmissions, ensuring that readmissions included in publicly reported readmission measures are likely to be truly unplanned. However, nearly half of readmissions the algorithm classifies as planned are actually unplanned. That is, the algorithm is overcautious in excluding unplanned readmissions that could have counted as outcomes, particularly among admissions that include diagnostic cardiac catheterization or placement of cardiac devices (pacemakers, defibrillators). However, these errors only occur within the 7.8% of readmissions that are classified as planned and therefore do not affect overall readmission rates dramatically. A perfect algorithm would reclassify approximately half of these planned readmissions as unplanned, increasing the overall readmission rate by 0.6 percentage points.
On the other hand, the algorithm also only identifies approximately half of true planned readmissions as planned. Because the true prevalence of planned readmissions is low (approximately 9% of readmissions based on weighted chart review prevalence, or an absolute rate of 1.4%), this low sensitivity has a small effect on algorithm performance. Removing all true planned readmissions from the measure outcome would decrease the overall readmission rate by 0.8 percentage points, similar to the expected 0.6 percentage point increase that would result from better identifying unplanned readmissions; thus, a perfect algorithm would likely decrease the reported unplanned readmission rate by a net 0.2%. Overall, the existing algorithm appears to come close to the true prevalence of planned readmissions, despite inaccuracy on an individual‐case basis. The algorithm performed best at large hospitals, which are at greatest risk of being statistical outliers and of accruing penalties under the Hospital Readmissions Reduction Program.[10]
We identified several changes that marginally improved the performance of the algorithm by reducing the number of unplanned readmissions that are incorrectly removed from the measure, while avoiding the inappropriate inclusion of planned readmissions in the outcome. This revised algorithm, v3.0, was applied to public reporting of readmission rates at the end of 2014. Overall, implementing these changes increases the reported readmission rate very slightly. We also identified other procedures associated with high inaccuracy rates, removal of which would have larger impact on reporting rates, and which therefore merit further evaluation.
There are other potential methods of identifying planned readmissions. For instance, as of October 1, 2013, new administrative billing codes were created to allow hospitals to indicate that a patient was discharged with a planned acute‐care hospital inpatient readmission, without limitation as to when it will take place.[11] This code must be used at the time of the index admission to indicate that a future planned admission is expected, and was specified only to be used for neonates and patients with acute myocardial infarction. This approach, however, would omit planned readmissions that are not known to the initial discharging team, potentially missing planned readmissions. Conversely, some patients discharged with a plan for readmission may be unexpectedly readmitted for an unplanned reason. Given that the new codes were not available at the time we conducted the validation study, we were not able to determine how often the billing codes accurately identified planned readmissions. This would be an important area to consider for future study.
An alternative approach would be to create indicator codes to be applied at the time of readmission that would indicate whether that admission was planned or unplanned. Such a code would have the advantage of allowing each planned readmission to be flagged by the admitting clinicians at the time of admission rather than by an algorithm that inherently cannot be perfect. However, identifying planned readmissions at the time of readmission would also create opportunity for gaming and inconsistent application of definitions between hospitals; additional checks would need to be put in place to guard against these possibilities.
Our study has some limitations. We relied on the opinion of chart abstractors to determine whether a readmission was planned or unplanned; in a few cases, such as smoldering wounds that ultimately require surgical intervention, that determination is debatable. Abstractions were done at local institutions to minimize risks to patient privacy, and therefore we could not centrally verify determinations of planned status except by reviewing source of admission, dates of procedures, and narrative comments reported by the abstractors. Finally, we did not have sufficient volume of planned procedures to determine accuracy of the algorithm for less common procedure categories or individual procedures within categories.
In summary, we developed an algorithm to identify planned readmissions from administrative data that had high specificity and moderate sensitivity, and refined it based on chart validation. This algorithm is in use in public reporting of readmission measures to maximize the probability that the reported readmission rates represent truly unplanned readmissions.[12]
Disclosures: Financial supportThis work was performed under contract HHSM‐500‐2008‐0025I/HHSM‐500‐T0001, Modification No. 000008, titled Measure Instrument Development and Support, funded by the Centers for Medicare and Medicaid Services (CMS), an agency of the US Department of Health and Human Services. Drs. Horwitz and Ross are supported by the National Institute on Aging (K08 AG038336 and K08 AG032886, respectively) and by the American Federation for Aging Research through the Paul B. Beeson Career Development Award Program. Dr. Krumholz is supported by grant U01 HL105270‐05 (Center for Cardiovascular Outcomes Research at Yale University) from the National Heart, Lung, and Blood Institute. No funding source had any role in the study design; in the collection, analysis, and interpretation of data; or in the writing of the article. The CMS reviewed and approved the use of its data for this work and approved submission of the manuscript. All authors have completed the Unified Competing Interest form at
- , , , et al. Development, validation, and results of a measure of 30‐day readmission following hospitalization for pneumonia. J Hosp Med. 2011;6(3):142–150.
- , , , et al. An administrative claims measure suitable for profiling hospital performance based on 30‐day all‐cause readmission rates among patients with acute myocardial infarction. Circ Cardiovasc Qual Outcomes. 2011;4(2):243–252.
- , , , et al. An administrative claims measure suitable for profiling hospital performance on the basis of 30‐day all‐cause readmission rates among patients with heart failure. Circ Cardiovasc Qual Outcomes. 2008;1:29–37.
- , , , et al. Hospital‐level 30‐day all‐cause risk‐standardized readmission rate following elective primary total hip arthroplasty (THA) and/or total knee arthroplasty (TKA). Available at: http://www.qualitynet.org/dcs/ContentServer?c=Page161(supp10 l):S66–S75.
- , , A meta‐analysis of hospital 30‐day avoidable readmission rates. J Eval Clin Pract. 2011;18(6):1211–1218.
- , , , , Proportion of hospital readmissions deemed avoidable: a systematic review. CMAJ. 2011;183(7):E391–E402.
- , , , et al. Centers for Medicare 3(4):477–492.
- , Characteristics of hospitals receiving penalties under the Hospital Readmissions Reduction Program. JAMA. 2013;309(4):342–343.
- Centers for Medicare and Medicaid Services. Inpatient Prospective Payment System/Long‐Term Care Hospital (IPPS/LTCH) final rule. Fed Regist. 2013;78:50533–50534.
- , , Massachusetts health reforms: uninsurance remains low, self‐reported health status improves as state prepares to tackle costs. Health Aff (Millwood). 2012;31(2):444–451.
The Centers for Medicare & Medicaid Services (CMS) publicly reports all‐cause risk‐standardized readmission rates after acute‐care hospitalization for acute myocardial infarction, pneumonia, heart failure, total hip and knee arthroplasty, chronic obstructive pulmonary disease, stroke, and for patients hospital‐wide.[1, 2, 3, 4, 5] Ideally, these measures should capture unplanned readmissions that arise from acute clinical events requiring urgent rehospitalization. Planned readmissions, which are scheduled admissions usually involving nonurgent procedures, may not be a signal of quality of care. Including planned readmissions in readmission quality measures could create a disincentive to provide appropriate care to patients who are scheduled for elective or necessary procedures unrelated to the quality of the prior admission. Accordingly, under contract to the CMS, we were asked to develop an algorithm to identify planned readmissions. A version of this algorithm is now incorporated into all publicly reported readmission measures.
Given the widespread use of the planned readmission algorithm in public reporting and its implications for hospital quality measurement and evaluation, the objective of this study was to describe the development process, and to validate and refine the algorithm by reviewing charts of readmitted patients.
METHODS
Algorithm Development
To create a planned readmission algorithm, we first defined planned. We determined that readmissions for obstetrical delivery, maintenance chemotherapy, major organ transplant, and rehabilitation should always be considered planned in the sense that they are desired and/or inevitable, even if not specifically planned on a certain date. Apart from these specific types of readmissions, we defined planned readmissions as nonacute readmissions for scheduled procedures, because the vast majority of planned admissions are related to procedures. We also defined readmissions for acute illness or for complications of care as unplanned for the purposes of a quality measure. Even if such readmissions included a potentially planned procedure, because complications of care represent an important dimension of quality that should not be excluded from outcome measurement, these admissions should not be removed from the measure outcome. This definition of planned readmissions does not imply that all unplanned readmissions are unexpected or avoidable. However, it has proven very difficult to reliably define avoidable readmissions, even by expert review of charts, and we did not attempt to do so here.[6, 7]
In the second stage, we operationalized this definition into an algorithm. We used the Agency for Healthcare Research and Quality's Clinical Classification Software (CCS) codes to group thousands of individual procedure and diagnosis International Classification of Disease, Ninth Revision, Clinical Modification (ICD‐9‐CM) codes into clinically coherent, mutually exclusive procedure CCS categories and mutually exclusive diagnosis CCS categories, respectively. Clinicians on the investigative team reviewed the procedure categories to identify those that are commonly planned and that would require inpatient admission. We also reviewed the diagnosis categories to identify acute diagnoses unlikely to accompany elective procedures. We then created a flow diagram through which every readmission could be run to determine whether it was planned or unplanned based on our categorizations of procedures and diagnoses (Figure 1, and Supporting Information, Appendix A, in the online version of this article). This version of the algorithm (v1.0) was submitted to the National Quality Forum (NQF) as part of the hospital‐wide readmission measure. The measure (NQR #1789) received endorsement in April 2012.
In the third stage of development, we posted the algorithm for 2 public comment periods and recruited 27 outside experts to review and refine the algorithm following a standardized, structured process (see Supporting Information, Appendix B, in the online version of this article). Because the measures publicly report and hold hospitals accountable for unplanned readmission rates, we felt it most important that the algorithm include as few planned readmissions in the reported, unplanned outcome as possible (ie, have high negative predictive value). Therefore, in equivocal situations in which experts felt procedure categories were equally often planned or unplanned, we added those procedures to the potentially planned list. We also solicited feedback from hospitals on algorithm performance during a confidential test run of the hospital‐wide readmission measure in the fall of 2012. Based on all of this feedback, we made a number of changes to the algorithm, which was then identified as v2.1. Version 2.1 of the algorithm was submitted to the NQF as part of the endorsement process for the acute myocardial infarction and heart failure readmission measures and was endorsed by the NQF in January 2013. The algorithm (v2.1) is now applied, adapted if necessary, to all publicly reported readmission measures.[8]
Algorithm Validation: Study Cohort
We recruited 2 hospital systems to participate in a chart validation study of the accuracy of the planned readmission algorithm (v2.1). Within these 2 health systems, we selected 7 hospitals with varying bed size, teaching status, and safety‐net status. Each included 1 large academic teaching hospital that serves as a regional referral center. For each hospital's index admissions, we applied the inclusion and exclusion criteria from the hospital‐wide readmission measure. Index admissions were included for patients age 65 years or older; enrolled in Medicare fee‐for‐service (FFS); discharged from a nonfederal, short‐stay, acute‐care hospital or critical access hospital; without an in‐hospital death; not transferred to another acute‐care facility; and enrolled in Part A Medicare for 1 year prior to discharge. We excluded index admissions for patients without at least 30 days postdischarge enrollment in FFS Medicare, discharged against medical advice, admitted for medical treatment of cancer or primary psychiatric disease, admitted to a Prospective Payment System‐exempt cancer hospital, or who died during the index hospitalization. In addition, for this study, we included only index admissions that were followed by a readmission to a hospital within the participating health system between July 1, 2011 and June 30, 2012. Institutional review board approval was obtained from each of the participating health systems, which granted waivers of signed informed consent and Health Insurance Portability and Accountability Act waivers.
Algorithm Validation: Sample Size Calculation
We determined a priori that the minimum acceptable positive predictive value, or proportion of all readmissions the algorithm labels planned that are truly planned, would be 60%, and the minimum acceptable negative predictive value, or proportion of all readmissions the algorithm labels as unplanned that are truly unplanned, would be 80%. We calculated the sample size required to be confident of these values 10% and determined we would need a total of 291 planned charts and 162 unplanned charts. We inflated these numbers by 20% to account for missing or unobtainable charts for a total of 550 charts. To achieve this sample size, we included all eligible readmissions from all participating hospitals that were categorized as planned. At the 5 smaller hospitals, we randomly selected an equal number of unplanned readmissions occurring at any hospital in its healthcare system. At the 2 largest hospitals, we randomly selected 50 unplanned readmissions occurring at any hospital in its healthcare system.
Algorithm Validation: Data Abstraction
We developed an abstraction tool, tested and refined it using sample charts, and built the final the tool into a secure, password‐protected Microsoft Access 2007 (Microsoft Corp., Redmond, WA) database (see Supporting Information, Appendix C, in the online version of this article). Experienced chart abstractors with RN or MD degrees from each hospital site participated in a 1‐hour training session to become familiar with reviewing medical charts, defining planned/unplanned readmissions, and the data abstraction process. For each readmission, we asked abstractors to review as needed: emergency department triage and physician notes, admission history and physical, operative report, discharge summary, and/or discharge summary from a prior admission. The abstractors verified the accuracy of the administrative billing data, including procedures and principal diagnosis. In addition, they abstracted the source of admission and dates of all major procedures. Then the abstractors provided their opinion and supporting rationale as to whether a readmission was planned or unplanned. They were not asked to determine whether the readmission was preventable. To determine the inter‐rater reliability of data abstraction, an independent abstractor at each health system recoded a random sample of 10% of the charts.
Statistical Analysis
To ensure that we had obtained a representative sample of charts, we identified the 10 most commonly planned procedures among cases identified as planned by the algorithm in the validation cohort and then compared this with planned cases nationally. To confirm the reliability of the abstraction process, we used the kappa statistic to determine the inter‐rater reliability of the determination of planned or unplanned status. Additionally, the full study team, including 5 practicing clinicians, reviewed the details of every chart abstraction in which the algorithm was found to have misclassified the readmission as planned or unplanned. In 11 cases we determined that the abstractor had misunderstood the definition of planned readmission (ie, not all direct admissions are necessarily planned) and we reclassified the chart review assignment accordingly.
We calculated sensitivity, specificity, positive predictive value, and negative predictive value of the algorithm for the validation cohort as a whole, weighted to account for the prevalence of planned readmissions as defined by the algorithm in the national data (7.8%). Weighting is necessary because we did not obtain a pure random sample, but rather selected a stratified sample that oversampled algorithm‐identified planned readmissions.[9] We also calculated these rates separately for large hospitals (>600 beds) and for small hospitals (600 beds).
Finally, we examined performance of the algorithm for individual procedures and diagnoses to determine whether any procedures or diagnoses should be added or removed from the algorithm. First, we reviewed the diagnoses, procedures, and brief narratives provided by the abstractors for all cases in which the algorithm misclassified the readmission as either planned or unplanned. Second, we calculated the positive predictive value for each procedure that had been flagged as planned by the algorithm, and reviewed all readmissions (correctly and incorrectly classified) in which procedures with low positive predictive value took place. We also calculated the frequency with which the procedure was the only qualifying procedure resulting in an accurate or inaccurate classification. Third, to identify changes that should be made to the lists of acute and nonacute diagnoses, we reviewed the principal diagnosis for all readmissions misclassified by the algorithm as either planned or unplanned, and examined the specific ICD‐9‐CM codes within each CCS group that were most commonly associated with misclassifications.
After determining the changes that should be made to the algorithm based on these analyses, we recalculated the sensitivity, specificity, positive predictive value, and negative predictive value of the proposed revised algorithm (v3.0). All analyses used SAS version 9.3 (SAS Institute, Cary, NC).
RESULTS
Study Cohort
Characteristics of participating hospitals are shown in Table 1. Hospitals represented in this sample ranged in size, teaching status, and safety net status, although all were nonprofit. We selected 663 readmissions for review, 363 planned and 300 unplanned. Overall we were able to select 80% of hospitals planned cases for review; the remainder occurred at hospitals outside the participating hospital system. Abstractors were able to locate and review 634 (96%) of the eligible charts (range, 86%100% per hospital). The kappa statistic for inter‐rater reliability was 0.83.
| Description | Hospitals, N | Readmissions Selected for Review, N* | Readmissions Reviewed, N (% of Eligible) | Unplanned Readmissions Reviewed, N | Planned Readmissions Reviewed, N | % of Hospital's Planned Readmissions Reviewed* | |
|---|---|---|---|---|---|---|---|
| |||||||
| All hospitals | 7 | 663 | 634 (95.6) | 283 | 351 | 77.3 | |
| No. of beds | >600 | 2 | 346 | 339 (98.0) | 116 | 223 | 84.5 |
| >300600 | 2 | 190 | 173 (91.1) | 85 | 88 | 87.1 | |
| <300 | 3 | 127 | 122 (96.0) | 82 | 40 | 44.9 | |
| Ownership | Government | 0 | |||||
| For profit | 0 | ||||||
| Not for profit | 7 | 663 | 634 (95.6) | 283 | 351 | 77.3 | |
| Teaching status | Teaching | 2 | 346 | 339 (98.0) | 116 | 223 | 84.5 |
| Nonteaching | 5 | 317 | 295 (93.1) | 167 | 128 | 67.4 | |
| Safety net status | Safety net | 2 | 346 | 339 (98.0) | 116 | 223 | 84.5 |
| Nonsafety net | 5 | 317 | 295 (93.1) | 167 | 128 | 67.4 | |
| Region | New England | 3 | 409 | 392 (95.8) | 155 | 237 | 85.9 |
| South Central | 4 | 254 | 242 (95.3) | 128 | 114 | 64.0 | |
The study sample included 57/67 (85%) of the procedure or condition categories on the potentially planned list. The most common procedure CCS categories among planned readmissions (v2.1) in the validation cohort were very similar to those in the national dataset (see Supporting Information, Appendix D, in the online version of this article). Of the top 20 most commonly planned procedure CCS categories in the validation set, all but 2, therapeutic radiology for cancer treatment (CCS 211) and peripheral vascular bypass (CCS 55), were among the top 20 most commonly planned procedure CCS categories in the national data.
Test Characteristics of Algorithm
The weighted test characteristics of the current algorithm (v2.1) are shown in Table 2. Overall, the algorithm correctly identified 266 readmissions as unplanned and 181 readmissions as planned, and misidentified 170 readmissions as planned and 15 as unplanned. Once weighted to account for the stratified sampling design, the overall prevalence of true planned readmissions was 8.9% of readmissions. The weighted sensitivity was 45.1% overall and was higher in large teaching centers than in smaller community hospitals. The weighted specificity was 95.9%. The positive predictive value was 51.6%, and the negative predictive value was 94.7%.
| Cohort | Sensitivity | Specificity | Positive Predictive Value | Negative Predictive Value |
|---|---|---|---|---|
| Algorithm v2.1 | ||||
| Full cohort | 45.1% | 95.9% | 51.6% | 94.7% |
| Large hospitals | 50.9% | 96.1% | 53.8% | 95.6% |
| Small hospitals | 40.2% | 95.5% | 47.7% | 94.0% |
| Revised algorithm v3.0 | ||||
| Full cohort | 49.8% | 96.5% | 58.7% | 94.5% |
| Large hospitals | 57.1% | 96.8% | 63.0% | 95.9% |
| Small hospitals | 42.6% | 95.9% | 52.6% | 93.9% |
Accuracy of Individual Diagnoses and Procedures
The positive predictive value of the algorithm for individual procedure categories varied widely, from 0% to 100% among procedures with at least 10 cases (Table 3). The procedure for which the algorithm was least accurate was CCS 211, therapeutic radiology for cancer treatment (0% positive predictive value). By contrast, maintenance chemotherapy (90%) and other therapeutic procedures, hemic and lymphatic system (100%) were most accurate. Common procedures with less than 50% positive predictive value (ie, that the algorithm commonly misclassified as planned) were diagnostic cardiac catheterization (25%); debridement of wound, infection, or burn (25%); amputation of lower extremity (29%); insertion, revision, replacement, removal of cardiac pacemaker or cardioverter/defibrillator (33%); and other hernia repair (43%). Of these, diagnostic cardiac catheterization and cardiac devices are the first and second most common procedures nationally, respectively.
| Readmission Procedure CCS Code | Total Categorized as Planned by Algorithm, N | Verified as Planned by Chart Review, N | Positive Predictive Value |
|---|---|---|---|
| |||
| 47 Diagnostic cardiac catheterization; coronary arteriography | 44 | 11 | 25% |
| 224 Cancer chemotherapy | 40 | 22 | 55% |
| 157 Amputation of lower extremity | 31 | 9 | 29% |
| 49 Other operating room heart procedures | 27 | 16 | 59% |
| 48 Insertion, revision, replacement, removal of cardiac pacemaker or cardioverter/defibrillator | 24 | 8 | 33% |
| 43 Heart valve procedures | 20 | 16 | 80% |
| Maintenance chemotherapy (diagnosis CCS 45) | 20 | 18 | 90% |
| 78 Colorectal resection | 18 | 9 | 50% |
| 169 Debridement of wound, infection or burn | 16 | 4 | 25% |
| 84 Cholecystectomy and common duct exploration | 16 | 5 | 31% |
| 99 Other OR gastrointestinal therapeutic procedures | 16 | 8 | 50% |
| 158 Spinal fusion | 15 | 11 | 73% |
| 142 Partial excision bone | 14 | 10 | 71% |
| 86 Other hernia repair | 14 | 6 | 42% |
| 44 Coronary artery bypass graft | 13 | 10 | 77% |
| 67 Other therapeutic procedures, hemic and lymphatic system | 13 | 13 | 100% |
| 211 Therapeutic radiology for cancer treatment | 12 | 0 | 0% |
| 45 Percutaneous transluminal coronary angioplasty | 11 | 7 | 64% |
| Total | 497 | 272 | 54.7% |
The readmissions with least abstractor agreement were those involving CCS 157 (amputation of lower extremity) and CCS 169 (debridement of wound, infection or burn). Readmissions for these procedures were nearly always performed as a consequence of acute worsening of chronic conditions such as osteomyelitis or ulceration. Abstractors were divided over whether these readmissions were appropriate to call planned.
Changes to the Algorithm
We determined that the accuracy of the algorithm would be improved by removing 2 procedure categories from the planned procedure list (therapeutic radiation [CCS 211] and cancer chemotherapy [CCS 224]), adding 1 diagnosis category to the acute diagnosis list (hypertension with complications [CCS 99]), and splitting 2 diagnosis condition categories into acute and nonacute ICD‐9‐CM codes (pancreatic disorders [CCS 149] and biliary tract disease [CCS 152]). Detailed rationales for each modification to the planned readmission algorithm are described in Table 4. We felt further examination of diagnostic cardiac catheterization and cardiac devices was warranted given their high frequency, despite low positive predictive value. We also elected not to alter the categorization of amputation or debridement because it was not easy to determine whether these admissions were planned or unplanned even with chart review. We plan further analyses of these procedure categories.
| Action | Diagnosis or Procedure Category | Algorithm | Chart | N | Rationale for Change |
|---|---|---|---|---|---|
| |||||
| Remove from planned procedure list | Therapeutic radiation (CCS 211) | Accurate | The algorithm was inaccurate in every case. All therapeutic radiology during readmissions was performed because of acute illness (pain crisis, neurologic crisis) or because scheduled treatment occurred during an unplanned readmission. In national data, this ranks as the 25th most common planned procedure identified by the algorithm v2.1. | ||
| Planned | Planned | 0 | |||
| Unplanned | Unplanned | 0 | |||
| Inaccurate | |||||
| Unplanned | Planned | 0 | |||
| Planned | Unplanned | 12 | |||
| Cancer chemotherapy (CCS 224) | Accurate | Of the 22 correctly identified as planned, 18 (82%) would already have been categorized as planned because of a principal diagnosis of maintenance chemotherapy. Therefore, removing CCS 224 from the planned procedure list would only miss a small fraction of planned readmissions but would avoid a large number of misclassifications. In national data, this ranks as the 8th most common planned procedure identified by the algorithm v2.1. | |||
| Planned | Planned | 22 | |||
| Unplanned | Unplanned | 0 | |||
| Inaccurate | |||||
| Unplanned | Planned | 0 | |||
| Planned | Unplanned | 18 | |||
| Add to planned procedure list | None | The abstractors felt a planned readmission was missed by the algorithm in 15 cases. A handful of these cases were missed because the planned procedure was not on the current planned procedure list; however, those procedures (eg, abdominal paracentesis, colonoscopy, endoscopy) were nearly always unplanned overall and should therefore not be added as procedures that potentially qualify as an admission as planned. | |||
| Remove from acute diagnosis list | None | The abstractors felt a planned readmission was missed by the algorithm in 15 cases. The relevant disqualifying acute diagnoses were much more often associated with unplanned readmissions in our dataset. | |||
| Add to acute diagnosis list | Hypertension with complications (CCS 99) | Accurate | This CCS was associated with only 1 planned readmission (for elective nephrectomy, a very rare procedure). Every other time this CCS appeared in the dataset, it was associated with an unplanned readmission (12/13, 92%); 10 of those, however, were misclassified by the algorithm as planned because they were not excluded by diagnosis (91% error rate). Consequently, adding this CCS to the acute diagnosis list is likely to miss only a very small fraction of planned readmissions, while making the overall algorithm much more accurate. | ||
| Planned | Planned | 1 | |||
| Unplanned | Unplanned | 2 | |||
| Inaccurate | |||||
| Unplanned | Planned | 0 | |||
| Planned | Unplanned | 10 | |||
| Split diagnosis condition category into component ICD‐9 codes | Pancreatic disorders (CCS 152) | Accurate | ICD‐9 code 577.0 (acute pancreatitis) is the only acute code in this CCS. Acute pancreatitis was present in 2 cases that were misclassified as planned. Clinically, there is no situation in which a planned procedure would reasonably be performed in the setting of acute pancreatitis. Moving ICD‐9 code 577.0 to the acute list and leaving the rest of the ICD‐9 codes in CCS 152 on the nonacute list will enable the algorithm to continue to identify planned procedures for chronic pancreatitis. | ||
| Planned | Planned | 0 | |||
| Unplanned | Unplanned | 1 | |||
| Inaccurate | |||||
| Unplanned | Planned | 0 | |||
| Planned | Unplanned | 2 | |||
| Biliary tract disease (CCS 149) | Accurate | This CCS is a mix of acute and chronic diagnoses. Of 14 charts classified as planned with CCS 149 in the principal diagnosis field, 12 were misclassified (of which 10 were associated with cholecystectomy). Separating out the acute and nonacute diagnoses will increase the accuracy of the algorithm while still ensuring that planned cholecystectomies and other procedures can be identified. Of the ICD‐9 codes in CCS 149, the following will be added to the acute diagnosis list: 574.0, 574.3, 574.6, 574.8, 575.0, 575.12, 576.1. | |||
| Planned | Planned | 2 | |||
| Unplanned | Unplanned | 3 | |||
| Inaccurate | |||||
| Unplanned | Planned | 0 | |||
| Planned | Unplanned | 12 | |||
| Consider for change after additional study | Diagnostic cardiac catheterization (CCS 47) | Accurate | The algorithm misclassified as planned 25/38 (66%) unplanned readmissions in which diagnostic catheterizations were the only qualifying planned procedure. It also correctly identified 3/3 (100%) planned readmissions in which diagnostic cardiac catheterizations were the only qualifying planned procedure. This is the highest volume procedure in national data. | ||
| Planned | Planned | 3* | |||
| Unplanned | Unplanned | 13* | |||
| Inaccurate | |||||
| Unplanned | Planned | 0* | |||
| Planned | Unplanned | 25* | |||
| Insertion, revision, replacement, removal of cardiac pacemaker or cardioverter/defibrillator (CCS 48) | Accurate | The algorithm misclassified as planned 4/5 (80%) unplanned readmissions in which cardiac devices were the only qualifying procedure. However, it also correctly identified 7/8 (87.5%) planned readmissions in which cardiac devices were the only qualifying planned procedure. CCS 48 is the second most common planned procedure category nationally. | |||
| Planned | Planned | 7 | |||
| Unplanned | Unplanned | 1 | |||
| Inaccurate | |||||
| Unplanned | Planned | 1 | |||
| Planned | Unplanned | 4 | |||
The revised algorithm (v3.0) had a weighted sensitivity of 49.8%, weighted specificity of 96.5%, positive predictive value of 58.7%, and negative predictive value of 94.5% (Table 2). In aggregate, these changes would increase the reported unplanned readmission rate from 16.0% to 16.1% in the hospital‐wide readmission measure, using 2011 to 2012 data, and would decrease the fraction of all readmissions considered planned from 7.8% to 7.2%.
DISCUSSION
We developed an algorithm based on administrative data that in its currently implemented form is very accurate at identifying unplanned readmissions, ensuring that readmissions included in publicly reported readmission measures are likely to be truly unplanned. However, nearly half of readmissions the algorithm classifies as planned are actually unplanned. That is, the algorithm is overcautious in excluding unplanned readmissions that could have counted as outcomes, particularly among admissions that include diagnostic cardiac catheterization or placement of cardiac devices (pacemakers, defibrillators). However, these errors only occur within the 7.8% of readmissions that are classified as planned and therefore do not affect overall readmission rates dramatically. A perfect algorithm would reclassify approximately half of these planned readmissions as unplanned, increasing the overall readmission rate by 0.6 percentage points.
On the other hand, the algorithm also only identifies approximately half of true planned readmissions as planned. Because the true prevalence of planned readmissions is low (approximately 9% of readmissions based on weighted chart review prevalence, or an absolute rate of 1.4%), this low sensitivity has a small effect on algorithm performance. Removing all true planned readmissions from the measure outcome would decrease the overall readmission rate by 0.8 percentage points, similar to the expected 0.6 percentage point increase that would result from better identifying unplanned readmissions; thus, a perfect algorithm would likely decrease the reported unplanned readmission rate by a net 0.2%. Overall, the existing algorithm appears to come close to the true prevalence of planned readmissions, despite inaccuracy on an individual‐case basis. The algorithm performed best at large hospitals, which are at greatest risk of being statistical outliers and of accruing penalties under the Hospital Readmissions Reduction Program.[10]
We identified several changes that marginally improved the performance of the algorithm by reducing the number of unplanned readmissions that are incorrectly removed from the measure, while avoiding the inappropriate inclusion of planned readmissions in the outcome. This revised algorithm, v3.0, was applied to public reporting of readmission rates at the end of 2014. Overall, implementing these changes increases the reported readmission rate very slightly. We also identified other procedures associated with high inaccuracy rates, removal of which would have larger impact on reporting rates, and which therefore merit further evaluation.
There are other potential methods of identifying planned readmissions. For instance, as of October 1, 2013, new administrative billing codes were created to allow hospitals to indicate that a patient was discharged with a planned acute‐care hospital inpatient readmission, without limitation as to when it will take place.[11] This code must be used at the time of the index admission to indicate that a future planned admission is expected, and was specified only to be used for neonates and patients with acute myocardial infarction. This approach, however, would omit planned readmissions that are not known to the initial discharging team, potentially missing planned readmissions. Conversely, some patients discharged with a plan for readmission may be unexpectedly readmitted for an unplanned reason. Given that the new codes were not available at the time we conducted the validation study, we were not able to determine how often the billing codes accurately identified planned readmissions. This would be an important area to consider for future study.
An alternative approach would be to create indicator codes to be applied at the time of readmission that would indicate whether that admission was planned or unplanned. Such a code would have the advantage of allowing each planned readmission to be flagged by the admitting clinicians at the time of admission rather than by an algorithm that inherently cannot be perfect. However, identifying planned readmissions at the time of readmission would also create opportunity for gaming and inconsistent application of definitions between hospitals; additional checks would need to be put in place to guard against these possibilities.
Our study has some limitations. We relied on the opinion of chart abstractors to determine whether a readmission was planned or unplanned; in a few cases, such as smoldering wounds that ultimately require surgical intervention, that determination is debatable. Abstractions were done at local institutions to minimize risks to patient privacy, and therefore we could not centrally verify determinations of planned status except by reviewing source of admission, dates of procedures, and narrative comments reported by the abstractors. Finally, we did not have sufficient volume of planned procedures to determine accuracy of the algorithm for less common procedure categories or individual procedures within categories.
In summary, we developed an algorithm to identify planned readmissions from administrative data that had high specificity and moderate sensitivity, and refined it based on chart validation. This algorithm is in use in public reporting of readmission measures to maximize the probability that the reported readmission rates represent truly unplanned readmissions.[12]
Disclosures: Financial supportThis work was performed under contract HHSM‐500‐2008‐0025I/HHSM‐500‐T0001, Modification No. 000008, titled Measure Instrument Development and Support, funded by the Centers for Medicare and Medicaid Services (CMS), an agency of the US Department of Health and Human Services. Drs. Horwitz and Ross are supported by the National Institute on Aging (K08 AG038336 and K08 AG032886, respectively) and by the American Federation for Aging Research through the Paul B. Beeson Career Development Award Program. Dr. Krumholz is supported by grant U01 HL105270‐05 (Center for Cardiovascular Outcomes Research at Yale University) from the National Heart, Lung, and Blood Institute. No funding source had any role in the study design; in the collection, analysis, and interpretation of data; or in the writing of the article. The CMS reviewed and approved the use of its data for this work and approved submission of the manuscript. All authors have completed the Unified Competing Interest form at
- , , , et al. Development, validation, and results of a measure of 30‐day readmission following hospitalization for pneumonia. J Hosp Med. 2011;6(3):142–150.
- , , , et al. An administrative claims measure suitable for profiling hospital performance based on 30‐day all‐cause readmission rates among patients with acute myocardial infarction. Circ Cardiovasc Qual Outcomes. 2011;4(2):243–252.
- , , , et al. An administrative claims measure suitable for profiling hospital performance on the basis of 30‐day all‐cause readmission rates among patients with heart failure. Circ Cardiovasc Qual Outcomes. 2008;1:29–37.
- , , , et al. Hospital‐level 30‐day all‐cause risk‐standardized readmission rate following elective primary total hip arthroplasty (THA) and/or total knee arthroplasty (TKA). Available at: http://www.qualitynet.org/dcs/ContentServer?c=Page161(supp10 l):S66–S75.
- , , A meta‐analysis of hospital 30‐day avoidable readmission rates. J Eval Clin Pract. 2011;18(6):1211–1218.
- , , , , Proportion of hospital readmissions deemed avoidable: a systematic review. CMAJ. 2011;183(7):E391–E402.
- , , , et al. Centers for Medicare 3(4):477–492.
- , Characteristics of hospitals receiving penalties under the Hospital Readmissions Reduction Program. JAMA. 2013;309(4):342–343.
- Centers for Medicare and Medicaid Services. Inpatient Prospective Payment System/Long‐Term Care Hospital (IPPS/LTCH) final rule. Fed Regist. 2013;78:50533–50534.
- , , Massachusetts health reforms: uninsurance remains low, self‐reported health status improves as state prepares to tackle costs. Health Aff (Millwood). 2012;31(2):444–451.
© 2015 Society of Hospital Medicine