User login
Is Posthospital Syndrome a Result of Hospitalization-Induced Allostatic Overload?
After discharge from the hospital, patients have a significantly elevated risk for adverse events, including emergency department use, hospital readmission, and death. More than 1 in 3 patients discharged from the hospital require acute care in the month after hospital discharge, and more than 1 in 6 require readmission, with readmission diagnoses frequently differing from those of the preceding hospitalization.1-4 This heightened susceptibility to adverse events persists beyond 30 days but levels off by 7 weeks after discharge, suggesting that the period of increased risk is transient and dynamic.5
The term posthospital syndrome (PHS) describes this period of vulnerability to major adverse events following hospitalization.6 In addition to increased risk for readmission and mortality, patients in this period often show evidence of generalized dysfunction with new cognitive impairment, mobility disability, or functional decline.7-12 To date, the etiology of this vulnerability is neither well understood nor effectively addressed by transitional care interventions.13
One hypothesis to explain PHS is that stressors associated with the experience of hospitalization contribute to transient multisystem dysfunction that induces susceptibility to a broad range of medical maladies. These stressors include frequent sleep disruption, noxious sounds, painful stimuli, mobility restrictions, and poor nutrition.12 The stress hypothesis as a cause of PHS is therefore based, in large part, on evidence about allostasis and the deleterious effects of allostatic overload.
Allostasis defines a system functioning within normal stress-response parameters to promote adaptation and survival.14 In allostasis, the hypothalamic-pituitary-adrenal (HPA) axis and the sympathetic and parasympathetic branches of the autonomic nervous system (ANS) exist in homeostatic balance and respond to environmental stimuli within a range of healthy physiologic parameters. The hallmark of a system in allostasis is the ability to rapidly activate, then successfully deactivate, a stress response once the stressor (ie, threat) has resolved.14,15 To promote survival and potentiate “fight or flight” mechanisms, an appropriate stress response necessarily impacts multiple physiologic systems that result in hemodynamic augmentation and gluconeogenesis to support the anticipated action of large muscle groups, heightened vigilance and memory capabilities to improve rapid decision-making, and enhancement of innate and adaptive immune capabilities to prepare for wound repair and infection defense.14-16 The stress response is subsequently terminated by negative feedback mechanisms of glucocorticoids as well as a shift of the ANS from sympathetic to parasympathetic tone.17,18
Extended or repetitive stress exposure, however, leads to dysregulation of allostatic mechanisms responsible for stress adaptation and hinders an efficient and effective stress response. After extended stress exposure, baseline (ie, resting) HPA activity resets, causing a disruption of normal diurnal cortisol rhythm and an increase in total cortisol concentration. Moreover, in response to stress, HPA and ANS system excitation becomes impaired, and negative feedback properties are undermined.14,15 This maladaptive state, known as allostatic overload, disrupts the finely tuned mechanisms that are the foundation of mind-body balance and yields pathophysiologic consequences to multiple organ systems. Downstream ramifications of allostatic overload include cognitive deterioration, cardiovascular and immune system dysfunction, and functional decline.14,15,19
Although a stress response is an expected and necessary aspect of acute illness that promotes survival, the central thesis of this work is that additional environmental and social stressors inherent in hospitalization may unnecessarily compound stress and increase the risk of HPA axis dysfunction, allostatic overload, and subsequent multisystem dysfunction, predisposing individuals to adverse outcomes after hospital discharge. Based on data from both human subjects and animal models, we present a possible pathophysiologic mechanism for the postdischarge vulnerability of PHS, encourage critical contemplation of traditional hospitalization, and suggest interventions that might improve outcomes.
POSTHOSPITAL SYNDROME
Posthospital syndrome (PHS) describes a transient period of vulnerability after hospitalization during which patients are at elevated risk for adverse events from a broad range of conditions. In support of this characterization, epidemiologic data have demonstrated high rates of adverse outcomes following hospitalization. For example, data have shown that more than 1 in 6 older adults is readmitted to the hospital within 30 days of discharge.20 Death is also common in this first month, during which rates of postdischarge mortality may exceed initial inpatient mortality.21,22 Elevated vulnerability after hospitalization is not restricted to older adults, as readmission risk among younger patients 18 to 64 years of age may be even higher for selected conditions, such as heart failure.3,23
Vulnerability after hospitalization is broad. In patients over age 65 initially admitted for heart failure or acute myocardial infarction, only 35% and 10% of readmissions are for recurrent heart failure or reinfarction, respectively.1 Nearly half of readmissions are for noncardiovascular causes.1 Similarly, following hospitalization for pneumonia, more than 60 percent of readmissions are for nonpulmonary etiologies. Moreover, the risk for all these causes of readmission is much higher than baseline risk, indicating an extended period of lack of resilience to many types of illness.24 These patterns of broad susceptibility also extend to younger adults hospitalized with common medical conditions.3
Accumulating evidence suggests that hospitalized patients face functional decline, debility, and risk for adverse events despite resolution of the presenting illness, implying perhaps that the hospital environment itself is hazardous to patients’ health. In 1993, Creditor hypothesized that the “hazards of hospitalization,” including enforced bed-rest, sensory deprivation, social isolation, and malnutrition lead to a “cascade of dependency” in which a collection of small insults to multiple organ systems precipitates loss of function and debility despite cure or resolution of presenting illness.12 Covinsky (2011) later defined hospitalization-associated disability as an iatrogenic hospital-related “disorder” characterized by new impairments in abilities to perform basic activities of daily living such as bathing, feeding, toileting, dressing, transferring, and walking at the time of hospital discharge.11 Others have described a postintensive-care syndrome (PICS),25 characterized by cognitive, psychiatric, and physical impairments acquired during hospitalization for critical illness that persist postdischarge and increase the long-term risk for adverse outcomes, including elevated mortality rates,26,27 readmission rates,28 and physical disabilities.29 Similar to the “hazards of hospitalization,” PICS is thought to be related to common experiences of ICU stays, including mobility restriction, sensory deprivation, sleep disruption, sedation, malnutrition, and polypharmacy.30-33
Taken together, these data suggest that adverse health consequences attributable to hospitalization extend across the spectrum of age, presenting disease severity, and hospital treatment location. As detailed below, the PHS hypothesis is rooted in a mechanistic understanding of the role of exogenous stressors in producing physiologic dysregulation and subsequent adverse health effects across multiple organ systems.
Nature of Stress in the Hospital
Compounding the stress of acute illness, hospitalized patients are routinely and repetitively exposed to a wide variety of environmental stressors that may have downstream adverse consequences (Table 1). In the absence of overt clinical manifestations of harm, the possible subclinical physiologic dysfunction generated by the following stress exposures may increase patients’ susceptibility to the manifestations of PHS.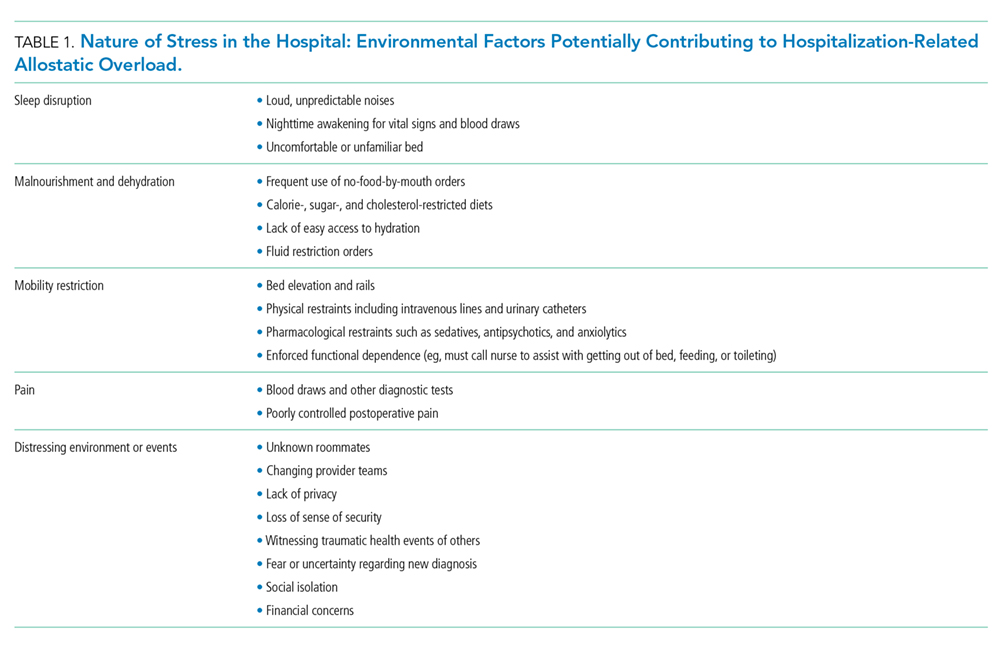
Sleep Disruption
Sleep disruptions trigger potent stress responses,34,35 yet they are common occurrences during hospitalization. In surveys, about half of patients report poor sleep quality during hospitalization that persists for many months after discharge.36 In a simulated hospital setting, test subjects exposed to typical hospital sounds (paging system, machine alarms, etc.) experienced significant sleep-wake cycle abnormalities.37 Although no work has yet focused specifically on the physiologic consequences of sleep disruption and stress in hospitalized patients, in healthy humans, mild sleep disruption has clear effects on allostasis by disrupting HPA activity, raising cortisol levels, diminishing parasympathetic tone, and impairing cognitive performance.18,34,35,38,39
Malnourishment
Malnourishment in hospitalized patients is common, with one-fifth of hospitalized patients receiving nothing per mouth or clear liquid diets for more than 3 continuous days,40 and one-fifth of hospitalized elderly patients receiving less than half of their calculated nutrition requirements.41 Although the relationship between food restriction, cortisol levels, and postdischarge outcomes has not been fully explored, in healthy humans, meal anticipation, meal withdrawal (withholding an expected meal), and self-reported dietary restraint are known to generate stress responses.42,43 Furthermore, malnourishment during hospitalization is associated with increased 90-day and 1-year mortality after discharge,44 adding malnourishment to the list of plausible components of hospital-related stress.
Mobility Restriction
Physical activity counterbalances stress responses and minimizes downstream consequences of allostatic load,15 yet mobility limitations via physical and chemical restraints are common in hospitalized patients, particularly among the elderly.45-47 Many patients are tethered to devices that make ambulation hazardous, such as urinary catheters and infusion pumps. Even without physical or chemical restraints or a limited mobility order, patients may be hesitant to leave the room so as not to miss transport to a diagnostic study or an unscheduled physician’s visit. Indeed, mobility limitations of hospitalized patients increase the risk for adverse events after discharge, while interventions designed to encourage mobility are associated with improved postdischarge outcomes.47,48
Other Stressors
Other hospital-related aversive stimuli are less commonly quantified, but clearly exist. According to surveys of hospitalized patients, sources of emotional stress include social isolation; loss of autonomy and privacy; fear of serious illness; lack of control over activities of daily living; lack of clear communication between treatment team and patients; and death of a patient roommate.49,50 Furthermore, consider the physical discomfort and emotional distress of patients with urinary incontinence awaiting assistance for a diaper or bedding change or the pain of repetitive blood draws or other invasive testing. Although individualized, the subjective discomfort and emotional distress associated with these experiences undoubtedly contribute to the stress of hospitalization.
IMPACT OF ALLOSTATIC OVERLOAD ON PHYSIOLOGIC FUNCTION
Animal Models of Stress
Laboratory techniques reminiscent of the numerous environmental stressors associated with hospitalization have been used to reliably trigger allostatic overload in healthy young animals.51 These techniques include sequential exposure to aversive stimuli, including food and water deprivation, continuous overnight illumination, paired housing with known and unknown cagemates, mobility restriction, soiled cage conditions, and continuous noise. All of these techniques have been shown to cause HPA axis and ANS dysfunction, allostatic overload, and subsequent stress-mediated consequences to multiple organ systems.19,52-54 Given the remarkable similarity of these protocols to common experiences during hospitalization, animal models of stress may be useful in understanding the spectrum of maladaptive consequences experienced by patients within the hospital (Figure 1).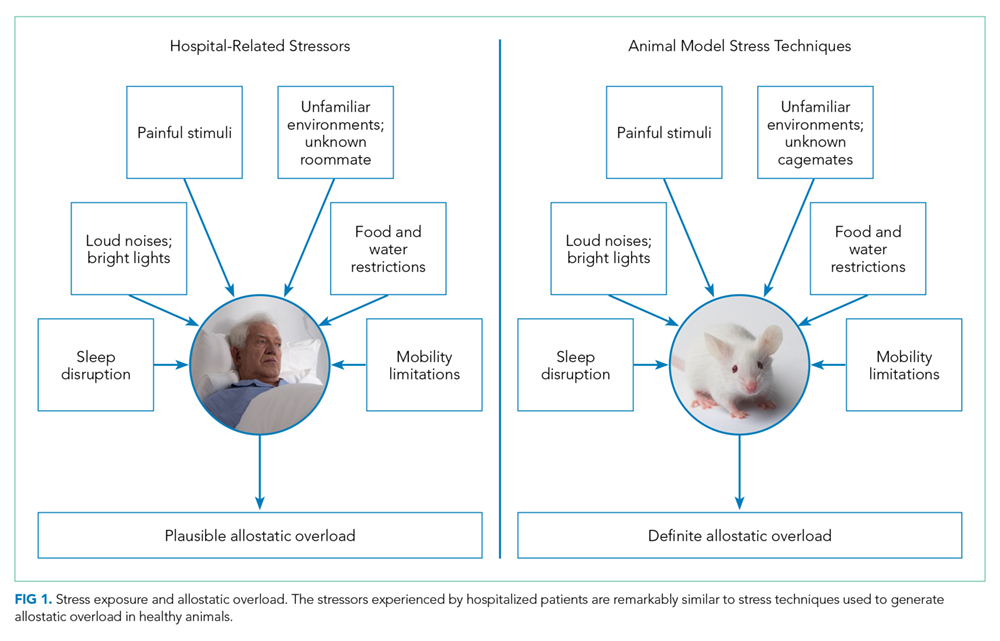
These animal models of stress have resulted in a number of instructive findings. For example, in rodents, extended stress exposure induces structural and functional remodeling of neuronal networks that precipitate learning and memory, working memory, and attention impairments.55-57 These exposures also result in cardiovascular abnormalities, including dyslipidemia, progressive atherosclerosis,58,59 and enhanced inflammatory cytokine expression,60 all of which increase both atherosclerotic burden and susceptibility to plaque rupture, leading to elevated risk for major cardiovascular adverse events. Moreover, these extended stress exposures in animals increase susceptibility to both bacterial and viral infections and increase their severity.16,61 This outcome appears to be driven by a stress-induced elevation of glucocorticoid levels, decreased leukocyte proliferation, altered leukocyte trafficking, and a transition to a proinflammatory cytokine environment.16, 61 Allostatic overload has also been shown to contribute to metabolic dysregulation involving insulin resistance, persistence of hyperglycemia, dyslipidemia, catabolism of lean muscle, and visceral adipose tissue deposition.62-64 In addition to cardiovascular, immune, and metabolic consequences of allostatic overload, the spectrum of physiologic dysfunction in animal models is broad and includes mood disorder symptoms,65 intestinal barrier abnormalities,66 airway reactivity exacerbation,67 and enhanced tumor growth.68
Although the majority of this research highlights the multisystem effects of variable stress exposure in healthy animals, preliminary evidence suggests that aged or diseased animals subjected to additional stressors display a heightened inflammatory cytokine response that contributes to exaggerated sickness behavior and greater and prolonged cognitive deficits.69 Future studies exploring the consequences of extended stress exposure in animals with existing disease or debility may therefore more closely simulate the experience of hospitalized patients and perhaps further our understanding of PHS.
Hospitalized Patients
While no intervention studies have examined the effects of potential hospital stressors on the development of allostatic overload, there is evidence from small studies that dysregulated stress responses during hospitalization are associated with adverse events. For example, high serum cortisol, catecholamine, and proinflammatory cytokine levels during hospitalization have individually been associated with the development of cognitive dysfunction,70-72 increased risk of cardiovascular events such as myocardial infarction and stroke in the year following discharge,73-76 and the development of wound infections after discharge.77 Moreover, elevated plasma glucose during admission for myocardial infarction in patients with or without diabetes has been associated with greater in-hospital and 1-year mortality,78 with a similar relationship seen between elevated plasma glucose and survival after admission for stroke79 and pneumonia.80 Furthermore, in addition to atherothrombosis, stress may contribute to the risk for venous thromboembolism,81 resulting in readmissions for deep vein thrombosis or pulmonary embolism posthospitalization. Although potentially surrogate markers of illness acuity, a handful of studies have shown that these stress biomarkers are actually only weakly correlated with,82 or independent of,72,76 disease severity. As discussed in detail below, future studies utilizing a summative measure of multisystem physiologic dysfunction as opposed to individual biomarkers may more accurately reflect the cumulative stress effects of hospitalization and subsequent risk for adverse events.
Additional Considerations
Elderly patients, in particular, may have heightened susceptibility to the consequences of allostatic overload due to common geriatric issues such as multimorbidity and frailty. Patients with chronic diseases display both baseline HPA axis abnormalities as well as dysregulated stress responses and may therefore be more vulnerable to hospitalization-related stress. For example, when subjected to psychosocial stress, patients with chronic conditions such as diabetes, heart failure, or atherosclerosis demonstrate elevated cortisol levels, increased circulating markers of inflammation, as well as prolonged hemodynamic recovery after stress resolution compared with normal controls.83-85 Additionally, frailty may affect an individual’s susceptibility to exogenous stress. Indeed, frailty identified on hospital admission increases the risk for adverse outcomes during hospitalization and postdischarge.86 Although the specific etiology of this relationship is unclear, persons with frailty are known to have elevated levels of cortisol and other inflammatory markers,87,88 which may contribute to adverse outcomes in the face of additional stressors.
IMPLICATIONS AND NEXT STEPS
A large body of evidence stretching from bench to bedside suggests that environmental stressors associated with hospitalization are toxic. Understanding PHS within the context of hospital-induced allostatic overload presents a unifying theory for the interrelated multisystem dysfunction and increased susceptibility to adverse events that patients experience after discharge (Figure 2). Furthermore, it defines a potential pathophysiological mechanism for the cognitive impairment, elevated cardiovascular risk, immune system dysfunction, metabolic derangements, and functional decline associated with PHS. Additionally, this theory highlights environmental interventions to limit PHS development and suggests mechanisms to promote stress resilience. Although it is difficult to disentangle the consequences of the endogenous stress triggered by an acute illness from the exogenous stressors related to hospitalization, it is likely that the 2 simultaneous exposures compound risk for stress system dysregulation and allostatic overload. Moreover, hospitalized patients with preexisting HPA axis dysfunction at baseline from chronic disease or advancing age may be even more susceptible to these adverse outcomes. If this hypothesis is true, a reduction in PHS would require mitigation of the modifiable environmental stressors encountered by patients during hospitalization. Directed efforts to diminish ambient noise, limit nighttime disruptions, thoughtfully plan procedures, consider ongoing nutritional status, and promote opportunities for patients to exert some control over their environment may diminish the burden of extrinsic stressors encountered by all patients in the hospital and improve outcomes after discharge.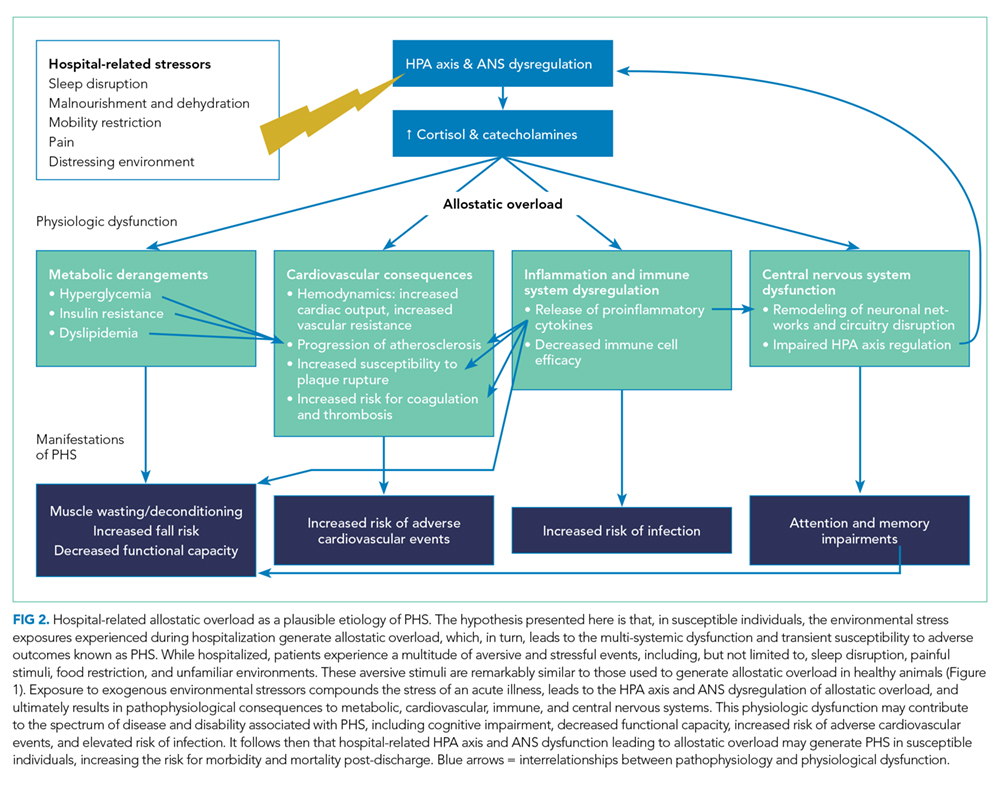
Hospitals are increasingly recognizing the importance of improving patients’ experience of hospitalization by reducing exposure to potential toxicities. For example, many hospitals are now attempting to reduce sleep disturbances and sleep latency through reduced nighttime noise and light levels, fewer nighttime interruptions for vital signs checks and medication administration, and commonsensical interventions like massages, herbal teas, and warm milk prior to bedtime.89 Likewise, intensive care units are targeting environmental and physical stressors with a multifaceted approach to decrease sedative use, promote healthy sleep cycles, and encourage exercise and ambulation even in those patients who are mechanically ventilated.30 Another promising development has been the increase of Hospital at Home programs. In these programs, patients who meet the criteria for inpatient admission are instead comprehensively managed at home for their acute illness through a multidisciplinary effort between physicians, nurses, social workers, physical therapists, and others. Patients hospitalized at home report higher levels of satisfaction and have modest functional gains, improved health-related quality of life, and decreased risk of mortality at 6 months compared with hospitalized patients.90,91 With some admitting diagnoses (eg, heart failure), hospitalization at home may be associated with decreased readmission risk.92 Although not yet investigated on a physiologic level, perhaps the benefits of hospital at home are partially due to the dramatic difference in exposure to environmental stressors.
A tool that quantifies hospital-associated stress may help health providers appreciate the experience of patients and better target interventions to aspects of their structure and process that contribute to allostatic overload. Importantly, allostatic overload cannot be identified by one biomarker of stress but instead requires evidence of dysregulation across inflammatory, neuroendocrine, hormonal, and cardiometabolic systems. Future studies to address the burden of stress faced by hospitalized patients should consider a summative measure of multisystem dysregulation as opposed to isolated assessments of individual biomarkers. Allostatic load has previously been operationalized as the summation of a variety of hemodynamic, hormonal, and metabolic factors, including blood pressure, lipid profile, glycosylated hemoglobin, cortisol, catecholamine levels, and inflammatory markers.93 To develop a hospital-associated allostatic load index, models should ideally be adjusted for acute illness severity, patient-reported stress, and capacity for stress resilience. This tool could then be used to quantify hospitalization-related allostatic load and identify those at greatest risk for adverse events after discharge, as well as measure the effectiveness of strategic environmental interventions (Table 2). A natural first experiment may be a comparison of the allostatic load of hospitalized patients versus those hospitalized at home.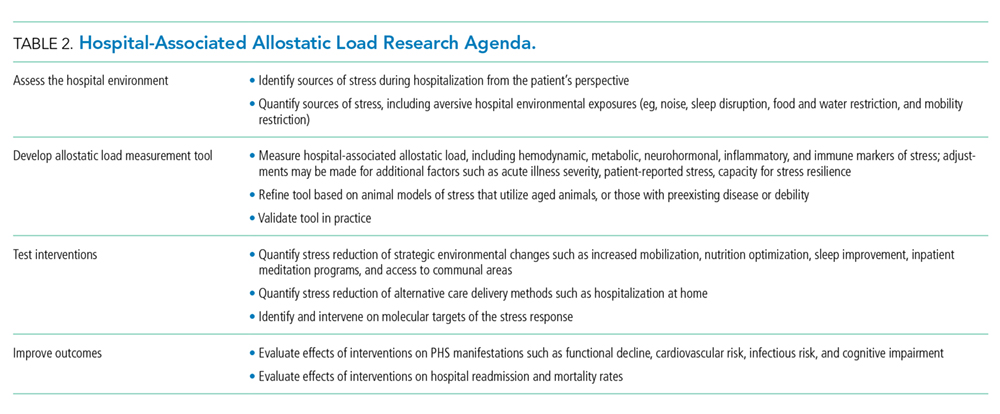
The risk of adverse outcomes after discharge is likely a function of the vulnerability of the patient and the degree to which the patient’s healthcare team and social support network mitigates this vulnerability. That is, there is a risk that a person struggles in the postdischarge period and, in many circumstances, a strong healthcare team and social network can identify health problems early and prevent them from progressing to the point that they require hospitalization.13,94-96 There are also hospital occurrences, outside of allostatic load, that can lead to complications that lengthen the stay, weaken the patient, and directly contribute to subsequent vulnerability.94,97 Our contention is that the allostatic load of hospitalization, which may also vary by patient depending on the circumstances of hospitalization, is just one contributor, albeit potentially an important one, to vulnerability to medical problems after discharge.
In conclusion, a plausible etiology of PHS is the maladaptive mind-body consequences of common stressors during hospitalization that compound the stress of acute illness and produce allostatic overload. This stress-induced dysfunction potentially contributes to a spectrum of generalized disease susceptibility and risk of adverse outcomes after discharge. Focused efforts to diminish patient exposure to hospital-related stressors during and after hospitalization might diminish the presence or severity of PHS. Viewing PHS from this perspective enables the development of hypothesis-driven risk-prediction models, encourages critical contemplation of traditional hospitalization, and suggests that targeted environmental interventions may significantly reduce adverse outcomes.
1. Dharmarajan K, Hsieh AF, Lin Z, et al. Diagnoses and timing of 30-day readmissions after hospitalization for heart failure, acute myocardial infarction, or pneumonia. JAMA. 2013;309(4):355-363. http://dx.doi.org/10.1001/jama.2012.216476.
2. Jencks SF, Williams MV, Coleman EA. Rehospitalizations among patients in the Medicare fee-for-service program. N Engl J Med. 2009;360(14):1418-1428. http://dx.doi.org/10.1056/NEJMsa0803563.
3. Ranasinghe I, Wang Y, Dharmarajan K, Hsieh AF, Bernheim SM, Krumholz HM. Readmissions after hospitalization for heart failure, acute myocardial infarction, or pneumonia among young and middle-aged adults: a retrospective observational cohort study. PLoS Med. 2014;11(9):e1001737. http://dx.doi.org/10.1371/journal.pmed.1001737.
4. Vashi AA, Fox JP, Carr BG, et al. Use of hospital-based acute care among patients recently discharged from the hospital. JAMA. 2013;309(4):364-371. http://dx.doi.org/10.1001/jama.2012.216219.
5. Dharmarajan K, Hsieh AF, Kulkarni VT, et al. Trajectories of risk after hospitalization for heart failure, acute myocardial infarction, or pneumonia: retrospective cohort study. BMJ. 2015;350:h411. http://dx.doi.org/10.1136/bmj.h411.
6. Krumholz HM. Post-hospital syndrome--an acquired, transient condition of generalized risk. N Engl J Med. 2013;368(2):100-102. http://dx.doi.org/10.1056/NEJMp1212324.
7. Ferrante LE, Pisani MA, Murphy TE, Gahbauer EA, Leo-Summers LS, Gill TM. Functional trajectories among older persons before and after critical illness. JAMA Intern Med. 2015;175(4):523-529. http://dx.doi.org/10.1001/jamainternmed.2014.7889.
8. Gill TM, Allore HG, Holford TR, Guo Z. Hospitalization, restricted activity, and the development of disability among older persons. JAMA. 2004;292(17):2115-2124. http://dx.doi.org/10.1001/jama.292.17.2115.
9. Inouye SK, Zhang Y, Han L, Leo-Summers L, Jones R, Marcantonio E. Recoverable cognitive dysfunction at hospital admission in older persons during acute illness. J Gen Intern Med. 2006;21(12):1276-1281. http://dx.doi.org/10.1111/j.1525-1497.2006.00613.x.
10. Lindquist LA, Go L, Fleisher J, Jain N, Baker D. Improvements in cognition following hospital discharge of community dwelling seniors. J Gen Intern Med. 2011;26(7):765-770. http://dx.doi.org/10.1007/s11606-011-1681-1.
11. Covinsky KE, Pierluissi E, Johnston CB. Hospitalization-associated disability: “She was probably able to ambulate, but I’m not sure.” JAMA. 2011;306(16):1782-1793. http://dx.doi.org/10.1001/jama.2011.1556.
12. Creditor MC. Hazards of hospitalization of the elderly. Ann Intern Med. 1993;118(3):219-223. http://dx.doi.org/10.7326/0003-4819-118-3-199302010-00011.
13. Dharmarajan K, Krumholz HM. Strategies to reduce 30-day readmissions in older patients hospitalized with heart failure and acute myocardial infarction. Curr Geriatr Rep. 2014;3(4):306-315. http://dx.doi.org/10.1007/s13670-014-0103-8.
14. McEwen BS. Protective and damaging effects of stress mediators. N Engl J Med. 1998;338(3):171-179. http://dx.doi.org/10.1056/NEJM199801153380307.
15. McEwen BS, Gianaros PJ. Stress- and allostasis-induced brain plasticity. Annu Rev Med. 2011;62:431-445. http://dx.doi.org/10.1146/annurev-med-052209-100430.
16. Dhabhar FS. Enhancing versus suppressive effects of stress on immune function: implications for immunoprotection and immunopathology. Neuroimmunomodulation. 2009;16(5):300-317. http://dx.doi.org/10.1159/000216188.
17. Thayer JF, Sternberg E. Beyond heart rate variability: vagal regulation of allostatic systems. Ann N Y Acad Sci. 2006;1088:361-372. http://dx.doi.org/10.1196/annals.1366.014.
18. Jacobson L, Akana SF, Cascio CS, Shinsako J, Dallman MF. Circadian variations in plasma corticosterone permit normal termination of adrenocorticotropin responses to stress. Endocrinology. 1988;122(4):1343-1348. http://dx.doi.org/10.1210/endo-122-4-1343.
19. McEwen BS. Physiology and neurobiology of stress and adaptation: central role of the brain. Physiol Rev. 2007;87(3):873-904. http://dx.doi.org/10.1152/physrev.00041.2006.
20. Medicare Hospital Quality Chartbook 2014: Performance Report on Outcome Measures. Prepared by Yale New Haven Health Services Corporation Center for Outcomes Research and Evaluation for Centers for Medicare & Medicaid Services. https://www.cms.gov/medicare/quality-initiatives-patient-assessment-instruments/hospitalqualityinits/downloads/medicare-hospital-quality-chartbook-2014.pdf. Accessed February 26, 2018.
21. Bueno H, Ross JS, Wang Y, et al. Trends in length of stay and short-term outcomes among Medicare patients hospitalized for heart failure, 1993-2006. JAMA. 2010;303(21):2141-2147. http://dx.doi.org/10.1001/jama.2010.748.
22. Drye EE, Normand SL, Wang Y, et al. Comparison of hospital risk-standardized mortality rates calculated by using in-hospital and 30-day models: an observational study with implications for hospital profiling. Ann Intern Med. 2012;156(1 Pt 1):19-26. http://dx.doi.org/10.7326/0003-4819-156-1-201201030-00004.
23. Dharmarajan K, Hsieh A, Dreyer RP, Welsh J, Qin L, Krumholz HM. Relationship between age and trajectories of rehospitalization risk in older adults. J Am Geriatr Soc. 2017;65(2):421-426. http://dx.doi.org/10.1111/jgs.14583.
24. Krumholz HM, Hsieh A, Dreyer RP, Welsh J, Desai NR, Dharmarajan K. Trajectories of risk for specific readmission diagnoses after hospitalization for heart failure, acute myocardial infarction, or pneumonia. PLoS One. 2016;11(10):e0160492. http://dx.doi.org/10.1371/journal.pone.0160492.
25. Needham DM, Davidson J, Cohen H, et al. Improving long-term outcomes after discharge from intensive care unit: report from a stakeholders’ conference. Crit Care Med. 2012;40(2):502-509. http://dx.doi.org/10.1097/CCM.0b013e318232da75.
26. Brinkman S, de Jonge E, Abu-Hanna A, Arbous MS, de Lange DW, de Keizer NF. Mortality after hospital discharge in ICU patients. Crit Care Med. 2013;41(5):1229-1236. http://dx.doi.org/10.1097/CCM.0b013e31827ca4e1.
27. Steenbergen S, Rijkenberg S, Adonis T, Kroeze G, van Stijn I, Endeman H. Long-term treated intensive care patients outcomes: the one-year mortality rate, quality of life, health care use and long-term complications as reported by general practitioners. BMC Anesthesiol. 2015;15:142. http://dx.doi.org/10.1186/s12871-015-0121-x.
28. Hill AD, Fowler RA, Pinto R, Herridge MS, Cuthbertson BH, Scales DC. Long-term outcomes and healthcare utilization following critical illness--a population-based study. Crit Care. 2016;20:76. http://dx.doi.org/10.1186/s13054-016-1248-y.
29. Jackson JC, Pandharipande PP, Girard TD, et al. Depression, post-traumatic stress disorder, and functional disability in survivors of critical illness in the BRAIN-ICU study: a longitudinal cohort study. Lancet Respir Med. 2014;2(5):369-379. http://dx.doi.org/10.1016/S2213-2600(14)70051-7.
30. Balas MC, Vasilevskis EE, Olsen KM, et al. Effectiveness and safety of the awakening and breathing coordination, delirium monitoring/management, and early exercise/mobility bundle. Crit Care Med. 2014;42(5):1024-1036. http://dx.doi.org/10.1097/CCM.0000000000000129.
31. Kress JP, Hall JB. ICU-acquired weakness and recovery from critical illness. N Engl J Med. 2014;370(17):1626-1635. http://dx.doi.org/10.1056/NEJMra1209390.
32. Mendez-Tellez PA, Needham DM. Early physical rehabilitation in the ICU and ventilator liberation. Respir Care. 2012;57(10):1663-1669. http://dx.doi.org/10.4187/respcare.01931.
33. Schweickert WD, Hall J. ICU-acquired weakness. Chest. 2007;131(5):1541-1549. http://dx.doi.org/10.1378/chest.06-2065.
34. Balbo M, Leproult R, Van Cauter E. Impact of sleep and its disturbances on hypothalamo-pituitary-adrenal axis activity. Int J Endocrinol. 2010;2010:759234. http://dx.doi.org/10.1155/2010/759234.
35. Spiegel K, Leproult R, Van Cauter E. Impact of sleep debt on metabolic and endocrine function. Lancet. 1999;354(9188):1435-1439. http://dx.doi.org/10.1016/S0140-6736(99)01376-8.
36. Orwelius L, Nordlund A, Nordlund P, Edell-Gustafsson U, Sjoberg F. Prevalence of sleep disturbances and long-term reduced health-related quality of life after critical care: a prospective multicenter cohort study. Crit Care. 2008;12(4):R97. http://dx.doi.org/10.1186/cc6973.
37. Buxton OM, Ellenbogen JM, Wang W, et al. Sleep disruption due to hospital noises: a prospective evaluation. Ann Intern Med. 2012;157(3):170-179. http://dx.doi.org/10.7326/0003-4819-157-3-201208070-00472.
38. Sunbul M, Kanar BG, Durmus E, Kivrak T, Sari I. Acute sleep deprivation is associated with increased arterial stiffness in healthy young adults. Sleep Breath. 2014;18(1):215-220. http://dx.doi.org/10.1007/s11325-013-0873-9.
39. Van Dongen HP, Maislin G, Mullington JM, Dinges DF. The cumulative cost of additional wakefulness: dose-response effects on neurobehavioral functions and sleep physiology from chronic sleep restriction and total sleep deprivation. Sleep. 2003;26(2):117-126. http://dx.doi.org/10.1093/sleep/26.2.117.
40. Franklin GA, McClave SA, Hurt RT, et al. Physician-delivered malnutrition: why do patients receive nothing by mouth or a clear liquid diet in a university hospital setting? JPEN J Parenter Enteral Nutr. 2011;35(3):337-342. http://dx.doi.org/10.1177/0148607110374060.
41. Sullivan DH, Sun S, Walls RC. Protein-energy undernutrition among elderly hospitalized patients: a prospective study. JAMA. 1999;281(21):2013-2019. http://dx.doi.org/10.1001/jama.281.21.2013.
42. Anderson DA, Shapiro JR, Lundgren JD, Spataro LE, Frye CA. Self-reported dietary restraint is associated with elevated levels of salivary cortisol. Appetite. 2002;38(1):13-17. http://dx.doi.org/10.1006/appe.2001.0459.
43. Ott V, Friedrich M, Prilop S, et al. Food anticipation and subsequent food withdrawal increase serum cortisol in healthy men. Physiol Behav. 2011;103(5):594-599. http://dx.doi.org/10.1016/j.physbeh.2011.04.020.
44. Covinsky KE, Martin GE, Beyth RJ, Justice AC, Sehgal AR, Landefeld CS. The relationship between clinical assessments of nutritional status and adverse outcomes in older hospitalized medical patients. J Am Geriatr Soc. 1999;47(5):532-538. http://dx.doi.org/10.1111/j.1532-5415.1999.tb02566.x.
45. Lazarus BA, Murphy JB, Coletta EM, McQuade WH, Culpepper L. The provision of physical activity to hospitalized elderly patients. Arch Intern Med. 1991;151(12):2452-2456.
46. Minnick AF, Mion LC, Johnson ME, Catrambone C, Leipzig R. Prevalence and variation of physical restraint use in acute care settings in the US. J Nurs Scholarsh. 2007;39(1):30-37. http://dx.doi.org/10.1111/j.1547-5069.2007.00140.x.
47. Zisberg A, Shadmi E, Sinoff G, Gur-Yaish N, Srulovici E, Admi H. Low mobility during hospitalization and functional decline in older adults. J Am Geriatr Soc. 2011;59(2):266-273. http://dx.doi.org/10.1111/j.1532-5415.2010.03276.x.
48. Landefeld CS, Palmer RM, Kresevic DM, Fortinsky RH, Kowal J. A randomized trial of care in a hospital medical unit especially designed to improve the functional outcomes of acutely ill older patients. N Engl J Med. 1995;332(20):1338-1344. http://dx.doi.org/10.1056/NEJM199505183322006.
49. Douglas CH, Douglas MR. Patient-friendly hospital environments: exploring the patients’ perspective. Health Expectations: an international journal of public participation in health care and health policy. 2004;7(1):61-73. http://dx.doi.org/10.1046/j.1369-6513.2003.00251.x.
50. Volicer BJ. Hospital stress and patient reports of pain and physical status. Journal Human Stress. 1978;4(2):28-37. http://dx.doi.org/10.1080/0097840X.1978.9934984.
51. Willner P, Towell A, Sampson D, Sophokleous S, Muscat R. Reduction of sucrose preference by chronic unpredictable mild stress, and its restoration by a tricyclic antidepressant. Psychopharmacology (Berl). 1987;93(3):358-364. http://dx.doi.org/10.1007/BF00187257.
52. Grippo AJ, Francis J, Beltz TG, Felder RB, Johnson AK. Neuroendocrine and cytokine profile of chronic mild stress-induced anhedonia. Physiol Behav. 2005;84(5):697-706. http://dx.doi.org/10.1016/j.physbeh.2005.02.011.
53. Krishnan V, Nestler EJ. Animal models of depression: molecular perspectives. Curr Top Behav Neurosci. 2011;7:121-147. http://dx.doi.org/10.1007/7854_2010_108.
54. Magarinos AM, McEwen BS. Stress-induced atrophy of apical dendrites of hippocampal CA3c neurons: comparison of stressors. Neuroscience. 1995;69(1):83-88. http://dx.doi.org/10.1016/0306-4522(95)00256-I.
55. McEwen BS. Plasticity of the hippocampus: adaptation to chronic stress and allostatic load. Ann N Y Acad Sci. 2001;933:265-277. http://dx.doi.org/10.1111/j.1749-6632.2001.tb05830.x.
56. McEwen BS. The brain on stress: toward an integrative approach to brain, body, and behavior. Perspect Psychol Sci. 2013;8(6):673-675. http://dx.doi.org/10.1177/1745691613506907.
57. McEwen BS, Morrison JH. The brain on stress: vulnerability and plasticity of the prefrontal cortex over the life course. Neuron. 2013;79(1):16-29. http://dx.doi.org/10.1016/j.neuron.2013.06.028.
58. Dutta P, Courties G, Wei Y, et al. Myocardial infarction accelerates atherosclerosis. Nature. 2012;487(7407):325-329. http://dx.doi.org/10.1038/nature11260.
59. Lu XT, Liu YF, Zhang L, et al. Unpredictable chronic mild stress promotes atherosclerosis in high cholesterol-fed rabbits. Psychosom Med. 2012;74(6):604-611. http://dx.doi.org/10.1097/PSY.0b013e31825d0b71.
60. Heidt T, Sager HB, Courties G, et al. Chronic variable stress activates hematopoietic stem cells. Nat Med. 2014;20(7):754-758. http://dx.doi.org/10.1038/nm.3589.
61. Sheridan JF, Feng NG, Bonneau RH, Allen CM, Huneycutt BS, Glaser R. Restraint stress differentially affects anti-viral cellular and humoral immune responses in mice. J Neuroimmunol. 1991;31(3):245-255. http://dx.doi.org/10.1016/0165-5728(91)90046-A.
62. Kyrou I, Tsigos C. Stress hormones: physiological stress and regulation of metabolism. Curr Opin Pharmacol. 2009;9(6):787-793. http://dx.doi.org/10.1016/j.coph.2009.08.007.
63. Rosmond R. Role of stress in the pathogenesis of the metabolic syndrome. Psychoneuroendocrinology. 2005;30(1):1-10. http://dx.doi.org/10.1016/j.psyneuen.2004.05.007.
64. Tamashiro KL, Sakai RR, Shively CA, Karatsoreos IN, Reagan LP. Chronic stress, metabolism, and metabolic syndrome. Stress. 2011;14(5):468-474. http://dx.doi.org/10.3109/10253890.2011.606341.
65. McEwen BS. Mood disorders and allostatic load. Biol Psychiatry. 2003;54(3):200-207. http://dx.doi.org/10.1016/S0006-3223(03)00177-X.
66. Zareie M, Johnson-Henry K, Jury J, et al. Probiotics prevent bacterial translocation and improve intestinal barrier function in rats following chronic psychological stress. Gut. 2006;55(11):1553-1560. http://dx.doi.org/10.1136/gut.2005.080739.
67. Joachim RA, Quarcoo D, Arck PC, Herz U, Renz H, Klapp BF. Stress enhances airway reactivity and airway inflammation in an animal model of allergic bronchial asthma. Psychosom Med. 2003;65(5):811-815. http://dx.doi.org/10.1097/01.PSY.0000088582.50468.A3.
68. Thaker PH, Han LY, Kamat AA, et al. Chronic stress promotes tumor growth and angiogenesis in a mouse model of ovarian carcinoma. Nat Med. 2006;12(8):939-944. http://dx.doi.org/10.1038/nm1447.
69. Schreuder L, Eggen BJ, Biber K, Schoemaker RG, Laman JD, de Rooij SE. Pathophysiological and behavioral effects of systemic inflammation in aged and diseased rodents with relevance to delirium: A systematic review. Brain Behav Immun. 2017;62:362-381. http://dx.doi.org/10.1016/j.bbi.2017.01.010.
70. Mu DL, Li LH, Wang DX, et al. High postoperative serum cortisol level is associated with increased risk of cognitive dysfunction early after coronary artery bypass graft surgery: a prospective cohort study. PLoS One. 2013;8(10):e77637. http://dx.doi.org/10.1371/journal.pone.0077637.
71. Mu DL, Wang DX, Li LH, et al. High serum cortisol level is associated with increased risk of delirium after coronary artery bypass graft surgery: a prospective cohort study. Crit Care. 2010;14(6):R238. http://dx.doi.org/10.1186/cc9393.
72. Nguyen DN, Huyghens L, Zhang H, Schiettecatte J, Smitz J, Vincent JL. Cortisol is an associated-risk factor of brain dysfunction in patients with severe sepsis and septic shock. Biomed Res Int. 2014;2014:712742. http://dx.doi.org/10.1155/2014/712742.
73. Elkind MS, Carty CL, O’Meara ES, et al. Hospitalization for infection and risk of acute ischemic stroke: the Cardiovascular Health Study. Stroke. 2011;42(7):1851-1856. http://dx.doi.org/10.1161/STROKEAHA.110.608588.
74. Feibel JH, Hardy PM, Campbell RG, Goldstein MN, Joynt RJ. Prognostic value of the stress response following stroke. JAMA. 1977;238(13):1374-1376.
75. Jutla SK, Yuyun MF, Quinn PA, Ng LL. Plasma cortisol and prognosis of patients with acute myocardial infarction. J Cardiovasc Med (Hagerstown). 2014;15(1):33-41. http://dx.doi.org/10.2459/JCM.0b013e328364100b.
76. Yende S, D’Angelo G, Kellum JA, et al. Inflammatory markers at hospital discharge predict subsequent mortality after pneumonia and sepsis. Am J Respir Crit Care Med. 2008;177(11):1242-1247. http://dx.doi.org/10.1164/rccm.200712-1777OC.
77. Gouin JP, Kiecolt-Glaser JK. The impact of psychological stress on wound healing: methods and mechanisms. Immunol Allergy Clin North Am. 2011;31(1):81-93. http://dx.doi.org/10.1016/j.iac.2010.09.010.
78. Capes SE, Hunt D, Malmberg K, Gerstein HC. Stress hyperglycaemia and increased risk of death after myocardial infarction in patients with and without diabetes: a systematic overview. Lancet. 2000;355(9206):773-778. http://dx.doi.org/10.1016/S0140-6736(99)08415-9.
79. O’Neill PA, Davies I, Fullerton KJ, Bennett D. Stress hormone and blood glucose response following acute stroke in the elderly. Stroke. 1991;22(7):842-847. http://dx.doi.org/10.1161/01.STR.22.7.842.
80. Waterer GW, Kessler LA, Wunderink RG. Medium-term survival after hospitalization with community-acquired pneumonia. Am J Respir Crit Care Med. 2004;169(8):910-914. http://dx.doi.org/10.1164/rccm.200310-1448OC.
81. Rosengren A, Freden M, Hansson PO, Wilhelmsen L, Wedel H, Eriksson H. Psychosocial factors and venous thromboembolism: a long-term follow-up study of Swedish men. J Thrombosis Haemostasis. 2008;6(4):558-564. http://dx.doi.org/10.1111/j.1538-7836.2007.02857.x.
82. Oswald GA, Smith CC, Betteridge DJ, Yudkin JS. Determinants and importance of stress hyperglycaemia in non-diabetic patients with myocardial infarction. BMJ. 1986;293(6552):917-922. http://dx.doi.org/10.1136/bmj.293.6552.917.
83. Middlekauff HR, Nguyen AH, Negrao CE, et al. Impact of acute mental stress on sympathetic nerve activity and regional blood flow in advanced heart failure: implications for ‘triggering’ adverse cardiac events. Circulation. 1997;96(6):1835-1842. http://dx.doi.org/10.1161/01.CIR.96.6.1835.
84. Nijm J, Jonasson L. Inflammation and cortisol response in coronary artery disease. Ann Med. 2009;41(3):224-233. http://dx.doi.org/10.1080/07853890802508934.
85. Steptoe A, Hackett RA, Lazzarino AI, et al. Disruption of multisystem responses to stress in type 2 diabetes: investigating the dynamics of allostatic load. Proc Natl Acad Sci U S A. 2014;111(44):15693-15698. http://dx.doi.org/10.1073/pnas.1410401111.
86. Sepehri A, Beggs T, Hassan A, et al. The impact of frailty on outcomes after cardiac surgery: a systematic review. J Thorac Cardiovasc Surg. 2014;148(6):3110-3117. http://dx.doi.org/10.1016/j.jtcvs.2014.07.087.
87. Johar H, Emeny RT, Bidlingmaier M, et al. Blunted diurnal cortisol pattern is associated with frailty: a cross-sectional study of 745 participants aged 65 to 90 years. J Clin Endocrinol Metab. 2014;99(3):E464-468. http://dx.doi.org/10.1210/jc.2013-3079.
88. Yao X, Li H, Leng SX. Inflammation and immune system alterations in frailty. Clin Geriatr Med. 2011;27(1):79-87. http://dx.doi.org/10.1016/j.cger.2010.08.002.
89. Hospital Elder Life Program (HELP) for Prevention of Delirium. 2017; http://www.hospitalelderlifeprogram.org/. Accessed February 16, 2018.
90. Shepperd S, Doll H, Angus RM, et al. Admission avoidance hospital at home. Cochrane Database of System Rev. 2008;(4):CD007491. http://dx.doi.org/10.1002/14651858.CD007491.pub2’
91. Leff B, Burton L, Mader SL, et al. Comparison of functional outcomes associated with hospital at home care and traditional acute hospital care. J Am Geriatrics Soc. 2009;57(2):273-278. http://dx.doi.org/10.1111/j.1532-5415.2008.02103.x.
92. Qaddoura A, Yazdan-Ashoori P, Kabali C, et al. Efficacy of hospital at home in patients with heart failure: a systematic review and meta-analysis. PloS One. 2015;10(6):e0129282. http://dx.doi.org/10.1371/journal.pone.0129282.
93. Seeman T, Gruenewald T, Karlamangla A, et al. Modeling multisystem biological risk in young adults: The Coronary Artery Risk Development in Young Adults Study. Am J Hum Biol. 2010;22(4):463-472. http://dx.doi.org/10.1002/ajhb.21018.
94. Auerbach AD, Kripalani S, Vasilevskis EE, et al. Preventability and causes of readmissions in a national cohort of general medicine patients. JAMA Intern Med. 2016;176(4):484-493. http://dx.doi.org/10.1001/jamainternmed.2015.7863.
95. Hansen LO, Young RS, Hinami K, Leung A, Williams MV. Interventions to reduce 30-day rehospitalization: a systematic review. Ann Intern Med. 2011;155(8):520-528. http://dx.doi.org/10.7326/0003-4819-155-8-201110180-00008.
96. Takahashi PY, Naessens JM, Peterson SM, et al. Short-term and long-term effectiveness of a post-hospital care transitions program in an older, medically complex population. Healthcare. 2016;4(1):30-35. http://dx.doi.org/10.1016/j.hjdsi.2015.06.006.
 97. Dharmarajan K, Swami S, Gou RY, Jones RN, Inouye SK. Pathway from delirium to death: potential in-hospital mediators of excess mortality. J Am Geriatr Soc. 2017;65(5):1026-1033. http://dx.doi.org/10.1111/jgs.14743.
After discharge from the hospital, patients have a significantly elevated risk for adverse events, including emergency department use, hospital readmission, and death. More than 1 in 3 patients discharged from the hospital require acute care in the month after hospital discharge, and more than 1 in 6 require readmission, with readmission diagnoses frequently differing from those of the preceding hospitalization.1-4 This heightened susceptibility to adverse events persists beyond 30 days but levels off by 7 weeks after discharge, suggesting that the period of increased risk is transient and dynamic.5
The term posthospital syndrome (PHS) describes this period of vulnerability to major adverse events following hospitalization.6 In addition to increased risk for readmission and mortality, patients in this period often show evidence of generalized dysfunction with new cognitive impairment, mobility disability, or functional decline.7-12 To date, the etiology of this vulnerability is neither well understood nor effectively addressed by transitional care interventions.13
One hypothesis to explain PHS is that stressors associated with the experience of hospitalization contribute to transient multisystem dysfunction that induces susceptibility to a broad range of medical maladies. These stressors include frequent sleep disruption, noxious sounds, painful stimuli, mobility restrictions, and poor nutrition.12 The stress hypothesis as a cause of PHS is therefore based, in large part, on evidence about allostasis and the deleterious effects of allostatic overload.
Allostasis defines a system functioning within normal stress-response parameters to promote adaptation and survival.14 In allostasis, the hypothalamic-pituitary-adrenal (HPA) axis and the sympathetic and parasympathetic branches of the autonomic nervous system (ANS) exist in homeostatic balance and respond to environmental stimuli within a range of healthy physiologic parameters. The hallmark of a system in allostasis is the ability to rapidly activate, then successfully deactivate, a stress response once the stressor (ie, threat) has resolved.14,15 To promote survival and potentiate “fight or flight” mechanisms, an appropriate stress response necessarily impacts multiple physiologic systems that result in hemodynamic augmentation and gluconeogenesis to support the anticipated action of large muscle groups, heightened vigilance and memory capabilities to improve rapid decision-making, and enhancement of innate and adaptive immune capabilities to prepare for wound repair and infection defense.14-16 The stress response is subsequently terminated by negative feedback mechanisms of glucocorticoids as well as a shift of the ANS from sympathetic to parasympathetic tone.17,18
Extended or repetitive stress exposure, however, leads to dysregulation of allostatic mechanisms responsible for stress adaptation and hinders an efficient and effective stress response. After extended stress exposure, baseline (ie, resting) HPA activity resets, causing a disruption of normal diurnal cortisol rhythm and an increase in total cortisol concentration. Moreover, in response to stress, HPA and ANS system excitation becomes impaired, and negative feedback properties are undermined.14,15 This maladaptive state, known as allostatic overload, disrupts the finely tuned mechanisms that are the foundation of mind-body balance and yields pathophysiologic consequences to multiple organ systems. Downstream ramifications of allostatic overload include cognitive deterioration, cardiovascular and immune system dysfunction, and functional decline.14,15,19
Although a stress response is an expected and necessary aspect of acute illness that promotes survival, the central thesis of this work is that additional environmental and social stressors inherent in hospitalization may unnecessarily compound stress and increase the risk of HPA axis dysfunction, allostatic overload, and subsequent multisystem dysfunction, predisposing individuals to adverse outcomes after hospital discharge. Based on data from both human subjects and animal models, we present a possible pathophysiologic mechanism for the postdischarge vulnerability of PHS, encourage critical contemplation of traditional hospitalization, and suggest interventions that might improve outcomes.
POSTHOSPITAL SYNDROME
Posthospital syndrome (PHS) describes a transient period of vulnerability after hospitalization during which patients are at elevated risk for adverse events from a broad range of conditions. In support of this characterization, epidemiologic data have demonstrated high rates of adverse outcomes following hospitalization. For example, data have shown that more than 1 in 6 older adults is readmitted to the hospital within 30 days of discharge.20 Death is also common in this first month, during which rates of postdischarge mortality may exceed initial inpatient mortality.21,22 Elevated vulnerability after hospitalization is not restricted to older adults, as readmission risk among younger patients 18 to 64 years of age may be even higher for selected conditions, such as heart failure.3,23
Vulnerability after hospitalization is broad. In patients over age 65 initially admitted for heart failure or acute myocardial infarction, only 35% and 10% of readmissions are for recurrent heart failure or reinfarction, respectively.1 Nearly half of readmissions are for noncardiovascular causes.1 Similarly, following hospitalization for pneumonia, more than 60 percent of readmissions are for nonpulmonary etiologies. Moreover, the risk for all these causes of readmission is much higher than baseline risk, indicating an extended period of lack of resilience to many types of illness.24 These patterns of broad susceptibility also extend to younger adults hospitalized with common medical conditions.3
Accumulating evidence suggests that hospitalized patients face functional decline, debility, and risk for adverse events despite resolution of the presenting illness, implying perhaps that the hospital environment itself is hazardous to patients’ health. In 1993, Creditor hypothesized that the “hazards of hospitalization,” including enforced bed-rest, sensory deprivation, social isolation, and malnutrition lead to a “cascade of dependency” in which a collection of small insults to multiple organ systems precipitates loss of function and debility despite cure or resolution of presenting illness.12 Covinsky (2011) later defined hospitalization-associated disability as an iatrogenic hospital-related “disorder” characterized by new impairments in abilities to perform basic activities of daily living such as bathing, feeding, toileting, dressing, transferring, and walking at the time of hospital discharge.11 Others have described a postintensive-care syndrome (PICS),25 characterized by cognitive, psychiatric, and physical impairments acquired during hospitalization for critical illness that persist postdischarge and increase the long-term risk for adverse outcomes, including elevated mortality rates,26,27 readmission rates,28 and physical disabilities.29 Similar to the “hazards of hospitalization,” PICS is thought to be related to common experiences of ICU stays, including mobility restriction, sensory deprivation, sleep disruption, sedation, malnutrition, and polypharmacy.30-33
Taken together, these data suggest that adverse health consequences attributable to hospitalization extend across the spectrum of age, presenting disease severity, and hospital treatment location. As detailed below, the PHS hypothesis is rooted in a mechanistic understanding of the role of exogenous stressors in producing physiologic dysregulation and subsequent adverse health effects across multiple organ systems.
Nature of Stress in the Hospital
Compounding the stress of acute illness, hospitalized patients are routinely and repetitively exposed to a wide variety of environmental stressors that may have downstream adverse consequences (Table 1). In the absence of overt clinical manifestations of harm, the possible subclinical physiologic dysfunction generated by the following stress exposures may increase patients’ susceptibility to the manifestations of PHS.
Sleep Disruption
Sleep disruptions trigger potent stress responses,34,35 yet they are common occurrences during hospitalization. In surveys, about half of patients report poor sleep quality during hospitalization that persists for many months after discharge.36 In a simulated hospital setting, test subjects exposed to typical hospital sounds (paging system, machine alarms, etc.) experienced significant sleep-wake cycle abnormalities.37 Although no work has yet focused specifically on the physiologic consequences of sleep disruption and stress in hospitalized patients, in healthy humans, mild sleep disruption has clear effects on allostasis by disrupting HPA activity, raising cortisol levels, diminishing parasympathetic tone, and impairing cognitive performance.18,34,35,38,39
Malnourishment
Malnourishment in hospitalized patients is common, with one-fifth of hospitalized patients receiving nothing per mouth or clear liquid diets for more than 3 continuous days,40 and one-fifth of hospitalized elderly patients receiving less than half of their calculated nutrition requirements.41 Although the relationship between food restriction, cortisol levels, and postdischarge outcomes has not been fully explored, in healthy humans, meal anticipation, meal withdrawal (withholding an expected meal), and self-reported dietary restraint are known to generate stress responses.42,43 Furthermore, malnourishment during hospitalization is associated with increased 90-day and 1-year mortality after discharge,44 adding malnourishment to the list of plausible components of hospital-related stress.
Mobility Restriction
Physical activity counterbalances stress responses and minimizes downstream consequences of allostatic load,15 yet mobility limitations via physical and chemical restraints are common in hospitalized patients, particularly among the elderly.45-47 Many patients are tethered to devices that make ambulation hazardous, such as urinary catheters and infusion pumps. Even without physical or chemical restraints or a limited mobility order, patients may be hesitant to leave the room so as not to miss transport to a diagnostic study or an unscheduled physician’s visit. Indeed, mobility limitations of hospitalized patients increase the risk for adverse events after discharge, while interventions designed to encourage mobility are associated with improved postdischarge outcomes.47,48
Other Stressors
Other hospital-related aversive stimuli are less commonly quantified, but clearly exist. According to surveys of hospitalized patients, sources of emotional stress include social isolation; loss of autonomy and privacy; fear of serious illness; lack of control over activities of daily living; lack of clear communication between treatment team and patients; and death of a patient roommate.49,50 Furthermore, consider the physical discomfort and emotional distress of patients with urinary incontinence awaiting assistance for a diaper or bedding change or the pain of repetitive blood draws or other invasive testing. Although individualized, the subjective discomfort and emotional distress associated with these experiences undoubtedly contribute to the stress of hospitalization.
IMPACT OF ALLOSTATIC OVERLOAD ON PHYSIOLOGIC FUNCTION
Animal Models of Stress
Laboratory techniques reminiscent of the numerous environmental stressors associated with hospitalization have been used to reliably trigger allostatic overload in healthy young animals.51 These techniques include sequential exposure to aversive stimuli, including food and water deprivation, continuous overnight illumination, paired housing with known and unknown cagemates, mobility restriction, soiled cage conditions, and continuous noise. All of these techniques have been shown to cause HPA axis and ANS dysfunction, allostatic overload, and subsequent stress-mediated consequences to multiple organ systems.19,52-54 Given the remarkable similarity of these protocols to common experiences during hospitalization, animal models of stress may be useful in understanding the spectrum of maladaptive consequences experienced by patients within the hospital (Figure 1).
These animal models of stress have resulted in a number of instructive findings. For example, in rodents, extended stress exposure induces structural and functional remodeling of neuronal networks that precipitate learning and memory, working memory, and attention impairments.55-57 These exposures also result in cardiovascular abnormalities, including dyslipidemia, progressive atherosclerosis,58,59 and enhanced inflammatory cytokine expression,60 all of which increase both atherosclerotic burden and susceptibility to plaque rupture, leading to elevated risk for major cardiovascular adverse events. Moreover, these extended stress exposures in animals increase susceptibility to both bacterial and viral infections and increase their severity.16,61 This outcome appears to be driven by a stress-induced elevation of glucocorticoid levels, decreased leukocyte proliferation, altered leukocyte trafficking, and a transition to a proinflammatory cytokine environment.16, 61 Allostatic overload has also been shown to contribute to metabolic dysregulation involving insulin resistance, persistence of hyperglycemia, dyslipidemia, catabolism of lean muscle, and visceral adipose tissue deposition.62-64 In addition to cardiovascular, immune, and metabolic consequences of allostatic overload, the spectrum of physiologic dysfunction in animal models is broad and includes mood disorder symptoms,65 intestinal barrier abnormalities,66 airway reactivity exacerbation,67 and enhanced tumor growth.68
Although the majority of this research highlights the multisystem effects of variable stress exposure in healthy animals, preliminary evidence suggests that aged or diseased animals subjected to additional stressors display a heightened inflammatory cytokine response that contributes to exaggerated sickness behavior and greater and prolonged cognitive deficits.69 Future studies exploring the consequences of extended stress exposure in animals with existing disease or debility may therefore more closely simulate the experience of hospitalized patients and perhaps further our understanding of PHS.
Hospitalized Patients
While no intervention studies have examined the effects of potential hospital stressors on the development of allostatic overload, there is evidence from small studies that dysregulated stress responses during hospitalization are associated with adverse events. For example, high serum cortisol, catecholamine, and proinflammatory cytokine levels during hospitalization have individually been associated with the development of cognitive dysfunction,70-72 increased risk of cardiovascular events such as myocardial infarction and stroke in the year following discharge,73-76 and the development of wound infections after discharge.77 Moreover, elevated plasma glucose during admission for myocardial infarction in patients with or without diabetes has been associated with greater in-hospital and 1-year mortality,78 with a similar relationship seen between elevated plasma glucose and survival after admission for stroke79 and pneumonia.80 Furthermore, in addition to atherothrombosis, stress may contribute to the risk for venous thromboembolism,81 resulting in readmissions for deep vein thrombosis or pulmonary embolism posthospitalization. Although potentially surrogate markers of illness acuity, a handful of studies have shown that these stress biomarkers are actually only weakly correlated with,82 or independent of,72,76 disease severity. As discussed in detail below, future studies utilizing a summative measure of multisystem physiologic dysfunction as opposed to individual biomarkers may more accurately reflect the cumulative stress effects of hospitalization and subsequent risk for adverse events.
Additional Considerations
Elderly patients, in particular, may have heightened susceptibility to the consequences of allostatic overload due to common geriatric issues such as multimorbidity and frailty. Patients with chronic diseases display both baseline HPA axis abnormalities as well as dysregulated stress responses and may therefore be more vulnerable to hospitalization-related stress. For example, when subjected to psychosocial stress, patients with chronic conditions such as diabetes, heart failure, or atherosclerosis demonstrate elevated cortisol levels, increased circulating markers of inflammation, as well as prolonged hemodynamic recovery after stress resolution compared with normal controls.83-85 Additionally, frailty may affect an individual’s susceptibility to exogenous stress. Indeed, frailty identified on hospital admission increases the risk for adverse outcomes during hospitalization and postdischarge.86 Although the specific etiology of this relationship is unclear, persons with frailty are known to have elevated levels of cortisol and other inflammatory markers,87,88 which may contribute to adverse outcomes in the face of additional stressors.
IMPLICATIONS AND NEXT STEPS
A large body of evidence stretching from bench to bedside suggests that environmental stressors associated with hospitalization are toxic. Understanding PHS within the context of hospital-induced allostatic overload presents a unifying theory for the interrelated multisystem dysfunction and increased susceptibility to adverse events that patients experience after discharge (Figure 2). Furthermore, it defines a potential pathophysiological mechanism for the cognitive impairment, elevated cardiovascular risk, immune system dysfunction, metabolic derangements, and functional decline associated with PHS. Additionally, this theory highlights environmental interventions to limit PHS development and suggests mechanisms to promote stress resilience. Although it is difficult to disentangle the consequences of the endogenous stress triggered by an acute illness from the exogenous stressors related to hospitalization, it is likely that the 2 simultaneous exposures compound risk for stress system dysregulation and allostatic overload. Moreover, hospitalized patients with preexisting HPA axis dysfunction at baseline from chronic disease or advancing age may be even more susceptible to these adverse outcomes. If this hypothesis is true, a reduction in PHS would require mitigation of the modifiable environmental stressors encountered by patients during hospitalization. Directed efforts to diminish ambient noise, limit nighttime disruptions, thoughtfully plan procedures, consider ongoing nutritional status, and promote opportunities for patients to exert some control over their environment may diminish the burden of extrinsic stressors encountered by all patients in the hospital and improve outcomes after discharge.
Hospitals are increasingly recognizing the importance of improving patients’ experience of hospitalization by reducing exposure to potential toxicities. For example, many hospitals are now attempting to reduce sleep disturbances and sleep latency through reduced nighttime noise and light levels, fewer nighttime interruptions for vital signs checks and medication administration, and commonsensical interventions like massages, herbal teas, and warm milk prior to bedtime.89 Likewise, intensive care units are targeting environmental and physical stressors with a multifaceted approach to decrease sedative use, promote healthy sleep cycles, and encourage exercise and ambulation even in those patients who are mechanically ventilated.30 Another promising development has been the increase of Hospital at Home programs. In these programs, patients who meet the criteria for inpatient admission are instead comprehensively managed at home for their acute illness through a multidisciplinary effort between physicians, nurses, social workers, physical therapists, and others. Patients hospitalized at home report higher levels of satisfaction and have modest functional gains, improved health-related quality of life, and decreased risk of mortality at 6 months compared with hospitalized patients.90,91 With some admitting diagnoses (eg, heart failure), hospitalization at home may be associated with decreased readmission risk.92 Although not yet investigated on a physiologic level, perhaps the benefits of hospital at home are partially due to the dramatic difference in exposure to environmental stressors.
A tool that quantifies hospital-associated stress may help health providers appreciate the experience of patients and better target interventions to aspects of their structure and process that contribute to allostatic overload. Importantly, allostatic overload cannot be identified by one biomarker of stress but instead requires evidence of dysregulation across inflammatory, neuroendocrine, hormonal, and cardiometabolic systems. Future studies to address the burden of stress faced by hospitalized patients should consider a summative measure of multisystem dysregulation as opposed to isolated assessments of individual biomarkers. Allostatic load has previously been operationalized as the summation of a variety of hemodynamic, hormonal, and metabolic factors, including blood pressure, lipid profile, glycosylated hemoglobin, cortisol, catecholamine levels, and inflammatory markers.93 To develop a hospital-associated allostatic load index, models should ideally be adjusted for acute illness severity, patient-reported stress, and capacity for stress resilience. This tool could then be used to quantify hospitalization-related allostatic load and identify those at greatest risk for adverse events after discharge, as well as measure the effectiveness of strategic environmental interventions (Table 2). A natural first experiment may be a comparison of the allostatic load of hospitalized patients versus those hospitalized at home.
The risk of adverse outcomes after discharge is likely a function of the vulnerability of the patient and the degree to which the patient’s healthcare team and social support network mitigates this vulnerability. That is, there is a risk that a person struggles in the postdischarge period and, in many circumstances, a strong healthcare team and social network can identify health problems early and prevent them from progressing to the point that they require hospitalization.13,94-96 There are also hospital occurrences, outside of allostatic load, that can lead to complications that lengthen the stay, weaken the patient, and directly contribute to subsequent vulnerability.94,97 Our contention is that the allostatic load of hospitalization, which may also vary by patient depending on the circumstances of hospitalization, is just one contributor, albeit potentially an important one, to vulnerability to medical problems after discharge.
In conclusion, a plausible etiology of PHS is the maladaptive mind-body consequences of common stressors during hospitalization that compound the stress of acute illness and produce allostatic overload. This stress-induced dysfunction potentially contributes to a spectrum of generalized disease susceptibility and risk of adverse outcomes after discharge. Focused efforts to diminish patient exposure to hospital-related stressors during and after hospitalization might diminish the presence or severity of PHS. Viewing PHS from this perspective enables the development of hypothesis-driven risk-prediction models, encourages critical contemplation of traditional hospitalization, and suggests that targeted environmental interventions may significantly reduce adverse outcomes.
1. Dharmarajan K, Hsieh AF, Lin Z, et al. Diagnoses and timing of 30-day readmissions after hospitalization for heart failure, acute myocardial infarction, or pneumonia. JAMA. 2013;309(4):355-363. http://dx.doi.org/10.1001/jama.2012.216476.
2. Jencks SF, Williams MV, Coleman EA. Rehospitalizations among patients in the Medicare fee-for-service program. N Engl J Med. 2009;360(14):1418-1428. http://dx.doi.org/10.1056/NEJMsa0803563.
3. Ranasinghe I, Wang Y, Dharmarajan K, Hsieh AF, Bernheim SM, Krumholz HM. Readmissions after hospitalization for heart failure, acute myocardial infarction, or pneumonia among young and middle-aged adults: a retrospective observational cohort study. PLoS Med. 2014;11(9):e1001737. http://dx.doi.org/10.1371/journal.pmed.1001737.
4. Vashi AA, Fox JP, Carr BG, et al. Use of hospital-based acute care among patients recently discharged from the hospital. JAMA. 2013;309(4):364-371. http://dx.doi.org/10.1001/jama.2012.216219.
5. Dharmarajan K, Hsieh AF, Kulkarni VT, et al. Trajectories of risk after hospitalization for heart failure, acute myocardial infarction, or pneumonia: retrospective cohort study. BMJ. 2015;350:h411. http://dx.doi.org/10.1136/bmj.h411.
6. Krumholz HM. Post-hospital syndrome--an acquired, transient condition of generalized risk. N Engl J Med. 2013;368(2):100-102. http://dx.doi.org/10.1056/NEJMp1212324.
7. Ferrante LE, Pisani MA, Murphy TE, Gahbauer EA, Leo-Summers LS, Gill TM. Functional trajectories among older persons before and after critical illness. JAMA Intern Med. 2015;175(4):523-529. http://dx.doi.org/10.1001/jamainternmed.2014.7889.
8. Gill TM, Allore HG, Holford TR, Guo Z. Hospitalization, restricted activity, and the development of disability among older persons. JAMA. 2004;292(17):2115-2124. http://dx.doi.org/10.1001/jama.292.17.2115.
9. Inouye SK, Zhang Y, Han L, Leo-Summers L, Jones R, Marcantonio E. Recoverable cognitive dysfunction at hospital admission in older persons during acute illness. J Gen Intern Med. 2006;21(12):1276-1281. http://dx.doi.org/10.1111/j.1525-1497.2006.00613.x.
10. Lindquist LA, Go L, Fleisher J, Jain N, Baker D. Improvements in cognition following hospital discharge of community dwelling seniors. J Gen Intern Med. 2011;26(7):765-770. http://dx.doi.org/10.1007/s11606-011-1681-1.
11. Covinsky KE, Pierluissi E, Johnston CB. Hospitalization-associated disability: “She was probably able to ambulate, but I’m not sure.” JAMA. 2011;306(16):1782-1793. http://dx.doi.org/10.1001/jama.2011.1556.
12. Creditor MC. Hazards of hospitalization of the elderly. Ann Intern Med. 1993;118(3):219-223. http://dx.doi.org/10.7326/0003-4819-118-3-199302010-00011.
13. Dharmarajan K, Krumholz HM. Strategies to reduce 30-day readmissions in older patients hospitalized with heart failure and acute myocardial infarction. Curr Geriatr Rep. 2014;3(4):306-315. http://dx.doi.org/10.1007/s13670-014-0103-8.
14. McEwen BS. Protective and damaging effects of stress mediators. N Engl J Med. 1998;338(3):171-179. http://dx.doi.org/10.1056/NEJM199801153380307.
15. McEwen BS, Gianaros PJ. Stress- and allostasis-induced brain plasticity. Annu Rev Med. 2011;62:431-445. http://dx.doi.org/10.1146/annurev-med-052209-100430.
16. Dhabhar FS. Enhancing versus suppressive effects of stress on immune function: implications for immunoprotection and immunopathology. Neuroimmunomodulation. 2009;16(5):300-317. http://dx.doi.org/10.1159/000216188.
17. Thayer JF, Sternberg E. Beyond heart rate variability: vagal regulation of allostatic systems. Ann N Y Acad Sci. 2006;1088:361-372. http://dx.doi.org/10.1196/annals.1366.014.
18. Jacobson L, Akana SF, Cascio CS, Shinsako J, Dallman MF. Circadian variations in plasma corticosterone permit normal termination of adrenocorticotropin responses to stress. Endocrinology. 1988;122(4):1343-1348. http://dx.doi.org/10.1210/endo-122-4-1343.
19. McEwen BS. Physiology and neurobiology of stress and adaptation: central role of the brain. Physiol Rev. 2007;87(3):873-904. http://dx.doi.org/10.1152/physrev.00041.2006.
20. Medicare Hospital Quality Chartbook 2014: Performance Report on Outcome Measures. Prepared by Yale New Haven Health Services Corporation Center for Outcomes Research and Evaluation for Centers for Medicare & Medicaid Services. https://www.cms.gov/medicare/quality-initiatives-patient-assessment-instruments/hospitalqualityinits/downloads/medicare-hospital-quality-chartbook-2014.pdf. Accessed February 26, 2018.
21. Bueno H, Ross JS, Wang Y, et al. Trends in length of stay and short-term outcomes among Medicare patients hospitalized for heart failure, 1993-2006. JAMA. 2010;303(21):2141-2147. http://dx.doi.org/10.1001/jama.2010.748.
22. Drye EE, Normand SL, Wang Y, et al. Comparison of hospital risk-standardized mortality rates calculated by using in-hospital and 30-day models: an observational study with implications for hospital profiling. Ann Intern Med. 2012;156(1 Pt 1):19-26. http://dx.doi.org/10.7326/0003-4819-156-1-201201030-00004.
23. Dharmarajan K, Hsieh A, Dreyer RP, Welsh J, Qin L, Krumholz HM. Relationship between age and trajectories of rehospitalization risk in older adults. J Am Geriatr Soc. 2017;65(2):421-426. http://dx.doi.org/10.1111/jgs.14583.
24. Krumholz HM, Hsieh A, Dreyer RP, Welsh J, Desai NR, Dharmarajan K. Trajectories of risk for specific readmission diagnoses after hospitalization for heart failure, acute myocardial infarction, or pneumonia. PLoS One. 2016;11(10):e0160492. http://dx.doi.org/10.1371/journal.pone.0160492.
25. Needham DM, Davidson J, Cohen H, et al. Improving long-term outcomes after discharge from intensive care unit: report from a stakeholders’ conference. Crit Care Med. 2012;40(2):502-509. http://dx.doi.org/10.1097/CCM.0b013e318232da75.
26. Brinkman S, de Jonge E, Abu-Hanna A, Arbous MS, de Lange DW, de Keizer NF. Mortality after hospital discharge in ICU patients. Crit Care Med. 2013;41(5):1229-1236. http://dx.doi.org/10.1097/CCM.0b013e31827ca4e1.
27. Steenbergen S, Rijkenberg S, Adonis T, Kroeze G, van Stijn I, Endeman H. Long-term treated intensive care patients outcomes: the one-year mortality rate, quality of life, health care use and long-term complications as reported by general practitioners. BMC Anesthesiol. 2015;15:142. http://dx.doi.org/10.1186/s12871-015-0121-x.
28. Hill AD, Fowler RA, Pinto R, Herridge MS, Cuthbertson BH, Scales DC. Long-term outcomes and healthcare utilization following critical illness--a population-based study. Crit Care. 2016;20:76. http://dx.doi.org/10.1186/s13054-016-1248-y.
29. Jackson JC, Pandharipande PP, Girard TD, et al. Depression, post-traumatic stress disorder, and functional disability in survivors of critical illness in the BRAIN-ICU study: a longitudinal cohort study. Lancet Respir Med. 2014;2(5):369-379. http://dx.doi.org/10.1016/S2213-2600(14)70051-7.
30. Balas MC, Vasilevskis EE, Olsen KM, et al. Effectiveness and safety of the awakening and breathing coordination, delirium monitoring/management, and early exercise/mobility bundle. Crit Care Med. 2014;42(5):1024-1036. http://dx.doi.org/10.1097/CCM.0000000000000129.
31. Kress JP, Hall JB. ICU-acquired weakness and recovery from critical illness. N Engl J Med. 2014;370(17):1626-1635. http://dx.doi.org/10.1056/NEJMra1209390.
32. Mendez-Tellez PA, Needham DM. Early physical rehabilitation in the ICU and ventilator liberation. Respir Care. 2012;57(10):1663-1669. http://dx.doi.org/10.4187/respcare.01931.
33. Schweickert WD, Hall J. ICU-acquired weakness. Chest. 2007;131(5):1541-1549. http://dx.doi.org/10.1378/chest.06-2065.
34. Balbo M, Leproult R, Van Cauter E. Impact of sleep and its disturbances on hypothalamo-pituitary-adrenal axis activity. Int J Endocrinol. 2010;2010:759234. http://dx.doi.org/10.1155/2010/759234.
35. Spiegel K, Leproult R, Van Cauter E. Impact of sleep debt on metabolic and endocrine function. Lancet. 1999;354(9188):1435-1439. http://dx.doi.org/10.1016/S0140-6736(99)01376-8.
36. Orwelius L, Nordlund A, Nordlund P, Edell-Gustafsson U, Sjoberg F. Prevalence of sleep disturbances and long-term reduced health-related quality of life after critical care: a prospective multicenter cohort study. Crit Care. 2008;12(4):R97. http://dx.doi.org/10.1186/cc6973.
37. Buxton OM, Ellenbogen JM, Wang W, et al. Sleep disruption due to hospital noises: a prospective evaluation. Ann Intern Med. 2012;157(3):170-179. http://dx.doi.org/10.7326/0003-4819-157-3-201208070-00472.
38. Sunbul M, Kanar BG, Durmus E, Kivrak T, Sari I. Acute sleep deprivation is associated with increased arterial stiffness in healthy young adults. Sleep Breath. 2014;18(1):215-220. http://dx.doi.org/10.1007/s11325-013-0873-9.
39. Van Dongen HP, Maislin G, Mullington JM, Dinges DF. The cumulative cost of additional wakefulness: dose-response effects on neurobehavioral functions and sleep physiology from chronic sleep restriction and total sleep deprivation. Sleep. 2003;26(2):117-126. http://dx.doi.org/10.1093/sleep/26.2.117.
40. Franklin GA, McClave SA, Hurt RT, et al. Physician-delivered malnutrition: why do patients receive nothing by mouth or a clear liquid diet in a university hospital setting? JPEN J Parenter Enteral Nutr. 2011;35(3):337-342. http://dx.doi.org/10.1177/0148607110374060.
41. Sullivan DH, Sun S, Walls RC. Protein-energy undernutrition among elderly hospitalized patients: a prospective study. JAMA. 1999;281(21):2013-2019. http://dx.doi.org/10.1001/jama.281.21.2013.
42. Anderson DA, Shapiro JR, Lundgren JD, Spataro LE, Frye CA. Self-reported dietary restraint is associated with elevated levels of salivary cortisol. Appetite. 2002;38(1):13-17. http://dx.doi.org/10.1006/appe.2001.0459.
43. Ott V, Friedrich M, Prilop S, et al. Food anticipation and subsequent food withdrawal increase serum cortisol in healthy men. Physiol Behav. 2011;103(5):594-599. http://dx.doi.org/10.1016/j.physbeh.2011.04.020.
44. Covinsky KE, Martin GE, Beyth RJ, Justice AC, Sehgal AR, Landefeld CS. The relationship between clinical assessments of nutritional status and adverse outcomes in older hospitalized medical patients. J Am Geriatr Soc. 1999;47(5):532-538. http://dx.doi.org/10.1111/j.1532-5415.1999.tb02566.x.
45. Lazarus BA, Murphy JB, Coletta EM, McQuade WH, Culpepper L. The provision of physical activity to hospitalized elderly patients. Arch Intern Med. 1991;151(12):2452-2456.
46. Minnick AF, Mion LC, Johnson ME, Catrambone C, Leipzig R. Prevalence and variation of physical restraint use in acute care settings in the US. J Nurs Scholarsh. 2007;39(1):30-37. http://dx.doi.org/10.1111/j.1547-5069.2007.00140.x.
47. Zisberg A, Shadmi E, Sinoff G, Gur-Yaish N, Srulovici E, Admi H. Low mobility during hospitalization and functional decline in older adults. J Am Geriatr Soc. 2011;59(2):266-273. http://dx.doi.org/10.1111/j.1532-5415.2010.03276.x.
48. Landefeld CS, Palmer RM, Kresevic DM, Fortinsky RH, Kowal J. A randomized trial of care in a hospital medical unit especially designed to improve the functional outcomes of acutely ill older patients. N Engl J Med. 1995;332(20):1338-1344. http://dx.doi.org/10.1056/NEJM199505183322006.
49. Douglas CH, Douglas MR. Patient-friendly hospital environments: exploring the patients’ perspective. Health Expectations: an international journal of public participation in health care and health policy. 2004;7(1):61-73. http://dx.doi.org/10.1046/j.1369-6513.2003.00251.x.
50. Volicer BJ. Hospital stress and patient reports of pain and physical status. Journal Human Stress. 1978;4(2):28-37. http://dx.doi.org/10.1080/0097840X.1978.9934984.
51. Willner P, Towell A, Sampson D, Sophokleous S, Muscat R. Reduction of sucrose preference by chronic unpredictable mild stress, and its restoration by a tricyclic antidepressant. Psychopharmacology (Berl). 1987;93(3):358-364. http://dx.doi.org/10.1007/BF00187257.
52. Grippo AJ, Francis J, Beltz TG, Felder RB, Johnson AK. Neuroendocrine and cytokine profile of chronic mild stress-induced anhedonia. Physiol Behav. 2005;84(5):697-706. http://dx.doi.org/10.1016/j.physbeh.2005.02.011.
53. Krishnan V, Nestler EJ. Animal models of depression: molecular perspectives. Curr Top Behav Neurosci. 2011;7:121-147. http://dx.doi.org/10.1007/7854_2010_108.
54. Magarinos AM, McEwen BS. Stress-induced atrophy of apical dendrites of hippocampal CA3c neurons: comparison of stressors. Neuroscience. 1995;69(1):83-88. http://dx.doi.org/10.1016/0306-4522(95)00256-I.
55. McEwen BS. Plasticity of the hippocampus: adaptation to chronic stress and allostatic load. Ann N Y Acad Sci. 2001;933:265-277. http://dx.doi.org/10.1111/j.1749-6632.2001.tb05830.x.
56. McEwen BS. The brain on stress: toward an integrative approach to brain, body, and behavior. Perspect Psychol Sci. 2013;8(6):673-675. http://dx.doi.org/10.1177/1745691613506907.
57. McEwen BS, Morrison JH. The brain on stress: vulnerability and plasticity of the prefrontal cortex over the life course. Neuron. 2013;79(1):16-29. http://dx.doi.org/10.1016/j.neuron.2013.06.028.
58. Dutta P, Courties G, Wei Y, et al. Myocardial infarction accelerates atherosclerosis. Nature. 2012;487(7407):325-329. http://dx.doi.org/10.1038/nature11260.
59. Lu XT, Liu YF, Zhang L, et al. Unpredictable chronic mild stress promotes atherosclerosis in high cholesterol-fed rabbits. Psychosom Med. 2012;74(6):604-611. http://dx.doi.org/10.1097/PSY.0b013e31825d0b71.
60. Heidt T, Sager HB, Courties G, et al. Chronic variable stress activates hematopoietic stem cells. Nat Med. 2014;20(7):754-758. http://dx.doi.org/10.1038/nm.3589.
61. Sheridan JF, Feng NG, Bonneau RH, Allen CM, Huneycutt BS, Glaser R. Restraint stress differentially affects anti-viral cellular and humoral immune responses in mice. J Neuroimmunol. 1991;31(3):245-255. http://dx.doi.org/10.1016/0165-5728(91)90046-A.
62. Kyrou I, Tsigos C. Stress hormones: physiological stress and regulation of metabolism. Curr Opin Pharmacol. 2009;9(6):787-793. http://dx.doi.org/10.1016/j.coph.2009.08.007.
63. Rosmond R. Role of stress in the pathogenesis of the metabolic syndrome. Psychoneuroendocrinology. 2005;30(1):1-10. http://dx.doi.org/10.1016/j.psyneuen.2004.05.007.
64. Tamashiro KL, Sakai RR, Shively CA, Karatsoreos IN, Reagan LP. Chronic stress, metabolism, and metabolic syndrome. Stress. 2011;14(5):468-474. http://dx.doi.org/10.3109/10253890.2011.606341.
65. McEwen BS. Mood disorders and allostatic load. Biol Psychiatry. 2003;54(3):200-207. http://dx.doi.org/10.1016/S0006-3223(03)00177-X.
66. Zareie M, Johnson-Henry K, Jury J, et al. Probiotics prevent bacterial translocation and improve intestinal barrier function in rats following chronic psychological stress. Gut. 2006;55(11):1553-1560. http://dx.doi.org/10.1136/gut.2005.080739.
67. Joachim RA, Quarcoo D, Arck PC, Herz U, Renz H, Klapp BF. Stress enhances airway reactivity and airway inflammation in an animal model of allergic bronchial asthma. Psychosom Med. 2003;65(5):811-815. http://dx.doi.org/10.1097/01.PSY.0000088582.50468.A3.
68. Thaker PH, Han LY, Kamat AA, et al. Chronic stress promotes tumor growth and angiogenesis in a mouse model of ovarian carcinoma. Nat Med. 2006;12(8):939-944. http://dx.doi.org/10.1038/nm1447.
69. Schreuder L, Eggen BJ, Biber K, Schoemaker RG, Laman JD, de Rooij SE. Pathophysiological and behavioral effects of systemic inflammation in aged and diseased rodents with relevance to delirium: A systematic review. Brain Behav Immun. 2017;62:362-381. http://dx.doi.org/10.1016/j.bbi.2017.01.010.
70. Mu DL, Li LH, Wang DX, et al. High postoperative serum cortisol level is associated with increased risk of cognitive dysfunction early after coronary artery bypass graft surgery: a prospective cohort study. PLoS One. 2013;8(10):e77637. http://dx.doi.org/10.1371/journal.pone.0077637.
71. Mu DL, Wang DX, Li LH, et al. High serum cortisol level is associated with increased risk of delirium after coronary artery bypass graft surgery: a prospective cohort study. Crit Care. 2010;14(6):R238. http://dx.doi.org/10.1186/cc9393.
72. Nguyen DN, Huyghens L, Zhang H, Schiettecatte J, Smitz J, Vincent JL. Cortisol is an associated-risk factor of brain dysfunction in patients with severe sepsis and septic shock. Biomed Res Int. 2014;2014:712742. http://dx.doi.org/10.1155/2014/712742.
73. Elkind MS, Carty CL, O’Meara ES, et al. Hospitalization for infection and risk of acute ischemic stroke: the Cardiovascular Health Study. Stroke. 2011;42(7):1851-1856. http://dx.doi.org/10.1161/STROKEAHA.110.608588.
74. Feibel JH, Hardy PM, Campbell RG, Goldstein MN, Joynt RJ. Prognostic value of the stress response following stroke. JAMA. 1977;238(13):1374-1376.
75. Jutla SK, Yuyun MF, Quinn PA, Ng LL. Plasma cortisol and prognosis of patients with acute myocardial infarction. J Cardiovasc Med (Hagerstown). 2014;15(1):33-41. http://dx.doi.org/10.2459/JCM.0b013e328364100b.
76. Yende S, D’Angelo G, Kellum JA, et al. Inflammatory markers at hospital discharge predict subsequent mortality after pneumonia and sepsis. Am J Respir Crit Care Med. 2008;177(11):1242-1247. http://dx.doi.org/10.1164/rccm.200712-1777OC.
77. Gouin JP, Kiecolt-Glaser JK. The impact of psychological stress on wound healing: methods and mechanisms. Immunol Allergy Clin North Am. 2011;31(1):81-93. http://dx.doi.org/10.1016/j.iac.2010.09.010.
78. Capes SE, Hunt D, Malmberg K, Gerstein HC. Stress hyperglycaemia and increased risk of death after myocardial infarction in patients with and without diabetes: a systematic overview. Lancet. 2000;355(9206):773-778. http://dx.doi.org/10.1016/S0140-6736(99)08415-9.
79. O’Neill PA, Davies I, Fullerton KJ, Bennett D. Stress hormone and blood glucose response following acute stroke in the elderly. Stroke. 1991;22(7):842-847. http://dx.doi.org/10.1161/01.STR.22.7.842.
80. Waterer GW, Kessler LA, Wunderink RG. Medium-term survival after hospitalization with community-acquired pneumonia. Am J Respir Crit Care Med. 2004;169(8):910-914. http://dx.doi.org/10.1164/rccm.200310-1448OC.
81. Rosengren A, Freden M, Hansson PO, Wilhelmsen L, Wedel H, Eriksson H. Psychosocial factors and venous thromboembolism: a long-term follow-up study of Swedish men. J Thrombosis Haemostasis. 2008;6(4):558-564. http://dx.doi.org/10.1111/j.1538-7836.2007.02857.x.
82. Oswald GA, Smith CC, Betteridge DJ, Yudkin JS. Determinants and importance of stress hyperglycaemia in non-diabetic patients with myocardial infarction. BMJ. 1986;293(6552):917-922. http://dx.doi.org/10.1136/bmj.293.6552.917.
83. Middlekauff HR, Nguyen AH, Negrao CE, et al. Impact of acute mental stress on sympathetic nerve activity and regional blood flow in advanced heart failure: implications for ‘triggering’ adverse cardiac events. Circulation. 1997;96(6):1835-1842. http://dx.doi.org/10.1161/01.CIR.96.6.1835.
84. Nijm J, Jonasson L. Inflammation and cortisol response in coronary artery disease. Ann Med. 2009;41(3):224-233. http://dx.doi.org/10.1080/07853890802508934.
85. Steptoe A, Hackett RA, Lazzarino AI, et al. Disruption of multisystem responses to stress in type 2 diabetes: investigating the dynamics of allostatic load. Proc Natl Acad Sci U S A. 2014;111(44):15693-15698. http://dx.doi.org/10.1073/pnas.1410401111.
86. Sepehri A, Beggs T, Hassan A, et al. The impact of frailty on outcomes after cardiac surgery: a systematic review. J Thorac Cardiovasc Surg. 2014;148(6):3110-3117. http://dx.doi.org/10.1016/j.jtcvs.2014.07.087.
87. Johar H, Emeny RT, Bidlingmaier M, et al. Blunted diurnal cortisol pattern is associated with frailty: a cross-sectional study of 745 participants aged 65 to 90 years. J Clin Endocrinol Metab. 2014;99(3):E464-468. http://dx.doi.org/10.1210/jc.2013-3079.
88. Yao X, Li H, Leng SX. Inflammation and immune system alterations in frailty. Clin Geriatr Med. 2011;27(1):79-87. http://dx.doi.org/10.1016/j.cger.2010.08.002.
89. Hospital Elder Life Program (HELP) for Prevention of Delirium. 2017; http://www.hospitalelderlifeprogram.org/. Accessed February 16, 2018.
90. Shepperd S, Doll H, Angus RM, et al. Admission avoidance hospital at home. Cochrane Database of System Rev. 2008;(4):CD007491. http://dx.doi.org/10.1002/14651858.CD007491.pub2’
91. Leff B, Burton L, Mader SL, et al. Comparison of functional outcomes associated with hospital at home care and traditional acute hospital care. J Am Geriatrics Soc. 2009;57(2):273-278. http://dx.doi.org/10.1111/j.1532-5415.2008.02103.x.
92. Qaddoura A, Yazdan-Ashoori P, Kabali C, et al. Efficacy of hospital at home in patients with heart failure: a systematic review and meta-analysis. PloS One. 2015;10(6):e0129282. http://dx.doi.org/10.1371/journal.pone.0129282.
93. Seeman T, Gruenewald T, Karlamangla A, et al. Modeling multisystem biological risk in young adults: The Coronary Artery Risk Development in Young Adults Study. Am J Hum Biol. 2010;22(4):463-472. http://dx.doi.org/10.1002/ajhb.21018.
94. Auerbach AD, Kripalani S, Vasilevskis EE, et al. Preventability and causes of readmissions in a national cohort of general medicine patients. JAMA Intern Med. 2016;176(4):484-493. http://dx.doi.org/10.1001/jamainternmed.2015.7863.
95. Hansen LO, Young RS, Hinami K, Leung A, Williams MV. Interventions to reduce 30-day rehospitalization: a systematic review. Ann Intern Med. 2011;155(8):520-528. http://dx.doi.org/10.7326/0003-4819-155-8-201110180-00008.
96. Takahashi PY, Naessens JM, Peterson SM, et al. Short-term and long-term effectiveness of a post-hospital care transitions program in an older, medically complex population. Healthcare. 2016;4(1):30-35. http://dx.doi.org/10.1016/j.hjdsi.2015.06.006.
97. Dharmarajan K, Swami S, Gou RY, Jones RN, Inouye SK. Pathway from delirium to death: potential in-hospital mediators of excess mortality. J Am Geriatr Soc. 2017;65(5):1026-1033. http://dx.doi.org/10.1111/jgs.14743.
© 2018 Society of Hospital Medicine
Warfarin‐Associated Adverse Events
Warfarin is 1 of the most common causes of adverse drug events, with hospitalized patients being particularly at risk compared to outpatients.[1] Despite the availability of new oral anticoagulants (NOACs), physicians commonly prescribe warfarin to hospitalized patients,[2] likely in part due to the greater difficulty in reversing NOACs compared to warfarin. Furthermore, uptake of the NOACs is likely to be slow in resource‐poor countries due to the lower cost of warfarin.[3] However, the narrow therapeutic index, frequent drug‐drug interactions, and patient variability in metabolism of warfarin makes management challenging.[4] Thus, warfarin remains a significant cause of adverse events in hospitalized patients, occurring in approximately 3% to 8% of exposed patients, depending on underlying condition.[2, 5]
An elevated international normalized ratio (INR) is a strong predictor of drug‐associated adverse events (patient harm). In a study employing 21 different electronic triggers to identify potential adverse events, an elevated INR had the highest yield for events associated with harm (96% of INRs >5.0 associated with harm).[6] Although pharmacist‐managed inpatient anticoagulation services have been shown to improve warfarin management,[7, 8] there are evidence gaps regarding the causes of warfarin‐related adverse events and practice changes that could decrease their frequency. Although overanticoagulation is a well‐known risk factor for warfarin‐related adverse events,[9, 10] there are few evidence‐based warfarin monitoring and dosing recommendations for hospitalized patients.[10] For example, the 2012 American College of Chest Physicians Antithrombotic Guidelines[11] provide a weak recommendation on initial dosing of warfarin, but no recommendations on how frequently to monitor the INR, or appropriate dosing responses to INR levels. Although many hospitals employ protocols that suggest daily INR monitoring until stable, there are no evidence‐based guidelines to support this practice.[12] Conversely, there are reports of flags to order an INR level that are not activated unless greater than 2[13] or 3 days[14] pass since the prior INR. Protocols from some major academic medical centers suggest that after a therapeutic INR is reached, INR levels can be measured intermittently, as infrequently as twice a week.[15, 16]
The 2015 Joint Commission anticoagulant‐focused National Patient Safety Goal[17] (initially issued in 2008) mandates the assessment of baseline coagulation status before starting warfarin, and warfarin dosing based on a current INR; however, current is not defined. Neither the extent to which the mandate for assessing baseline coagulation status is adhered to nor the relationship between this process of care and patient outcomes is known. The importance of adverse drug events associated with anticoagulants, included warfarin, was also recently highlighted in the 2014 federal National Action Plan for Adverse Drug Event Prevention. In this document, the prevention of adverse drug events associated with anticoagulants was 1 of the 3 areas selected for special national attention and action.[18]
The Medicare Patient Safety Monitoring System (MPSMS) is a national chart abstraction‐based system that includes 21 in‐hospital adverse event measures, including warfarin‐associated adverse drug events.[2] Because of the importance of warfarin‐associated bleeding in hospitalized patients, we analyzed MPSMS data to determine what factors related to INR monitoring practices place patients at risk for these events. We were particularly interested in determining if we could detect potentially modifiable predictors of overanticoagulation and warfarin‐associated adverse events.
METHODS
Study Sample
We combined 2009 to 2013 MPSMS all payer data from the Centers for Medicare & Medicaid Services Hospital Inpatient Quality Reporting program for 4 common medical conditions: (1) acute myocardial infarction, (2) heart failure, (3) pneumonia, and (4) major surgery (as defined by the national Surgical Care Improvement Project).[19] To increase the sample size for cardiac patients, we combined myocardial infarction patients and heart failure patients into 1 group: acute cardiovascular disease. Patients under 18 years of age are excluded from the MPSMS sample, and we excluded patients whose INR never exceeded 1.5 after the initiation of warfarin therapy.
Patient Characteristics
Patient characteristics included demographics (age, sex, race [white, black, and other race]) and comorbidities. Comorbidities abstracted from medical records included: histories at the time of hospital admission of heart failure, obesity, coronary artery disease, renal disease, cerebrovascular disease, chronic obstructive pulmonary disease, cancer, diabetes, and smoking. The use of anticoagulants other than warfarin was also captured.
INRs
The INR measurement period for each patient started from the initial date of warfarin administration and ended on the date the maximum INR occurred. If a patient had more than 1 INR value on any day, the higher INR value was selected. A day without an INR measurement was defined as no INR value documented for a calendar day within the INR measurement period, starting on the third day of warfarin and ending on the day of the maximum INR level.
Outcomes
The study was performed to assess the association between the number of days on which a patient did not have an INR measured while receiving warfarin and the occurrence of (1) an INR 6.0[20, 21] (intermediate outcome) and (2) a warfarin‐associated adverse event. A description of the MPSMS measure of warfarin‐associated adverse events has been previously published.[2] Warfarin‐associated adverse events must have occurred within 48 hours of predefined triggers: an INR 4.0, cessation of warfarin therapy, administration of vitamin K or fresh frozen plasma, or transfusion of packed red blood cells other than in the setting of a surgical procedure. Warfarin‐associated adverse events were divided into minor and major events for this analysis. Minor events were defined as bleeding, drop in hematocrit of 3 points (occurring more than 48 hours after admission and not associated with surgery), or development of a hematoma. Major events were death, intracranial bleeding, or cardiac arrest. A patient who had both a major and a minor event was considered as having had a major event.
To assess the relationship between a rapidly rising INR and a subsequent INR 5.0 or 6.0, we determined the increase in INR between the measurement done 2 days prior to the maximum INR and 1 day prior to the maximum INR. This analysis was performed only on patients whose INR was 2.0 and 3.5 on the day prior to the maximum INR. In doing so, we sought to determine if the INR rise could predict the occurrence of a subsequent severely elevated INR in patients whose INR was within or near the therapeutic range.
Statistical Analysis
We conducted bivariate analysis to quantify the associations between lapses in measurement of the INR and subsequent warfarin‐associated adverse events, using the Mantel‐Haenszel 2 test for categorical variables. We fitted a generalized linear model with a logit link function to estimate the association of days on which an INR was not measured and the occurrence of the composite adverse event measure or the occurrence of an INR 6.0, adjusting for baseline patient characteristics, the number of days on warfarin, and receipt of heparin and low‐molecular‐weight heparin (LMWH). To account for potential imbalances in baseline patient characteristics and warfarin use prior to admission, we conducted a second analysis using the stabilized inverse probability weights approach. Specifically, we weighted each patient by the patient's inverse propensity scores of having only 1 day, at least 1 day, and at least 2 days without an INR measurement while receiving warfarin.[22, 23, 24, 25] To obtain the propensity scores, we fitted 3 logistic models with all variables included in the above primary mixed models except receipt of LMWH, heparin, and the number of days on warfarin as predictors, but 3 different outcomes, 1 day without an INR measurement, 1 or more days without an INR measurement, and 2 or more days without an INR measurement. Analyses were conducted using SAS version 9.2 (SAS Institute Inc., Cary, NC). All statistical testing was 2‐sided, at a significance level of 0.05. The institutional review board at Solutions IRB (Little Rock, AR) determined that the requirement for informed consent could be waived based on the nature of the study.
RESULTS
There were 130,828 patients included in the 2009 to 2013 MPSMS sample, of whom 19,445 (14.9%) received warfarin during their hospital stay and had at least 1 INR measurement. Among these patients, 5228 (26.9%) had no INR level above 1.5 and were excluded from further analysis, leaving 14,217 included patients. Of these patients, 1055 (7.4%) developed a warfarin‐associated adverse event. Table 1 demonstrates the baseline demographics and comorbidities of the included patients.
| Characteristics | Acute Cardiovascular Disease, No. (%), N = 6,394 | Pneumonia, No. (%), N = 3,668 | Major Surgery, No. (%), N = 4,155 | All, No. (%), N = 14,217 |
|---|---|---|---|---|
| ||||
| Age, mean [SD] | 75.3 [12.4] | 74.5 [13.3] | 69.4 [11.8] | 73.4 [12.7] |
| Sex, female | 3,175 (49.7) | 1,741 (47.5) | 2,639 (63.5) | 7,555 (53.1) |
| Race | ||||
| White | 5,388 (84.3) | 3,268 (89.1) | 3,760 (90.5) | 12,416 (87.3) |
| Other | 1,006 (15.7) | 400 (10.9) | 395 (9.5) | 1,801 (12.7) |
| Comorbidities | ||||
| Cancer | 1,186 (18.6) | 939 (25.6) | 708 (17.0) | 2,833 (19.9) |
| Diabetes | 3,043 (47.6) | 1,536 (41.9) | 1,080 (26.0) | 5,659 (39.8) |
| Obesity | 1,938 (30.3) | 896 (24.4) | 1,260 (30.3) | 4,094 (28.8) |
| Cerebrovascular disease | 1,664 (26.0) | 910 (24.8) | 498 (12.0) | 3,072 (21.6) |
| Heart failure/pulmonary edema | 5,882 (92.0) | 2,052 (55.9) | 607 (14.6) | 8,541 (60.1) |
| Chronic obstructive pulmonary disease | 2,636 (41.2) | 1,929 (52.6) | 672 (16.2) | 5,237 (36.8) |
| Smoking | 895 (14.0) | 662 (18.1) | 623 (15.0) | 2,180 (15.3) |
| Corticosteroids | 490 (7.7) | 568 (15.5) | 147 (3.5) | 1,205 (8.5) |
| Coronary artery disease | 4,628 (72.4) | 1,875 (51.1) | 1,228 (29.6) | 7,731 (54.4) |
| Renal disease | 3,000 (46.9) | 1,320 (36.0) | 565 (13.6) | 4,885 (34.4) |
| Warfarin prior to arrival | 5,074 (79.4) | 3,020 (82.3) | 898 (21.6) | 8,992 (63.3) |
| Heparin given during hospitalization | 850 (13.3) | 282 (7.7) | 314 (7.6) | 1,446 (10.7) |
| LMWH given during hospitalization | 1,591 (24.9) | 1,070 (29.2) | 1,431 (34.4) | 4,092 (28.8) |
Warfarin was started on hospital day 1 for 6825 (48.0%) of 14,217 patients. Among these patients, 6539 (95.8%) had an INR measured within 1 calendar day. We were unable to determine how many patients who started warfarin later in their hospital stay had a baseline INR, as we did not capture INRs performed prior to the day that warfarin was initiated.
Supporting Table 1 in the online version of this article demonstrates the association between an INR 6.0 and the occurrence of warfarin‐associated adverse events. A maximum INR 6.0 occurred in 469 (3.3%) of the patients included in the study, and among those patients, 133 (28.4%) experienced a warfarin‐associated adverse event compared to 922 (6.7%) adverse events in the 13,748 patients who did not develop an INR 6.0 (P < 0.001).
Among 8529 patients who received warfarin for at least 3 days, beginning on the third day of warfarin, 1549 patients (18.2%) did not have INR measured at least once each day that they received warfarin. Table 2 demonstrates that patients who had 2 or more days on which the INR was not measured had higher rates of INR 6.0 than patients for whom the INR was measured daily. A similar association was seen for warfarin‐associated adverse events (Table 2).
| No. of Patients, No. (%), N = 8,529 | Patients With INR on All Days, No. (%), N = 6,980 | Patients With 1 Day Without an INR, No. (%), N = 968 | Patients With 2 or More Days Without an INR, No. (%), N = 581 | P Value | |
|---|---|---|---|---|---|
| |||||
| Maximum INR | <0.01* | ||||
| 1.515.99 | 8,183 | 6,748 (96.7) | 911 (94.1) | 524 (90.2) | |
| 6.0 | 346 | 232 (3.3) | 57 (5.9) | 57 (9.8) | |
| Warfarin‐associated adverse events | <0.01* | ||||
| No adverse events | 7,689 (90.2) | 6,331 (90.7) | 872 (90.1) | 486 (83.6) | |
| Minor adverse events | 792 (9.3) | 617 (8.8) | 86 (8.9) | 89 (15.3) | |
| Major adverse events | 48 (0.6) | 32 (0.5) | 10 (1.0) | 6 (1.0) | |
Figure 1A demonstrates the association between the number of days without an INR measurement and the subsequent development of an INR 6.0 or a warfarin‐associated adverse event, adjusted for baseline patient characteristics, receipt of heparin and LMWH, and number of days on warfarin. Patients with 1 or more days without an INR measurement had higher risk‐adjusted ORs of a subsequent INR 6.0, although the difference was not statistically significant for surgical patients. The analysis results based on inverse propensity scoring are seen in Figure 1B. Cardiac and surgical patients with 2 or more days without an INR measurement were at higher risk of having a warfarin‐associated adverse event, whereas cardiac and pneumonia patients with 1 or more days without an INR measurement were at higher risk of developing an INR 6.0.
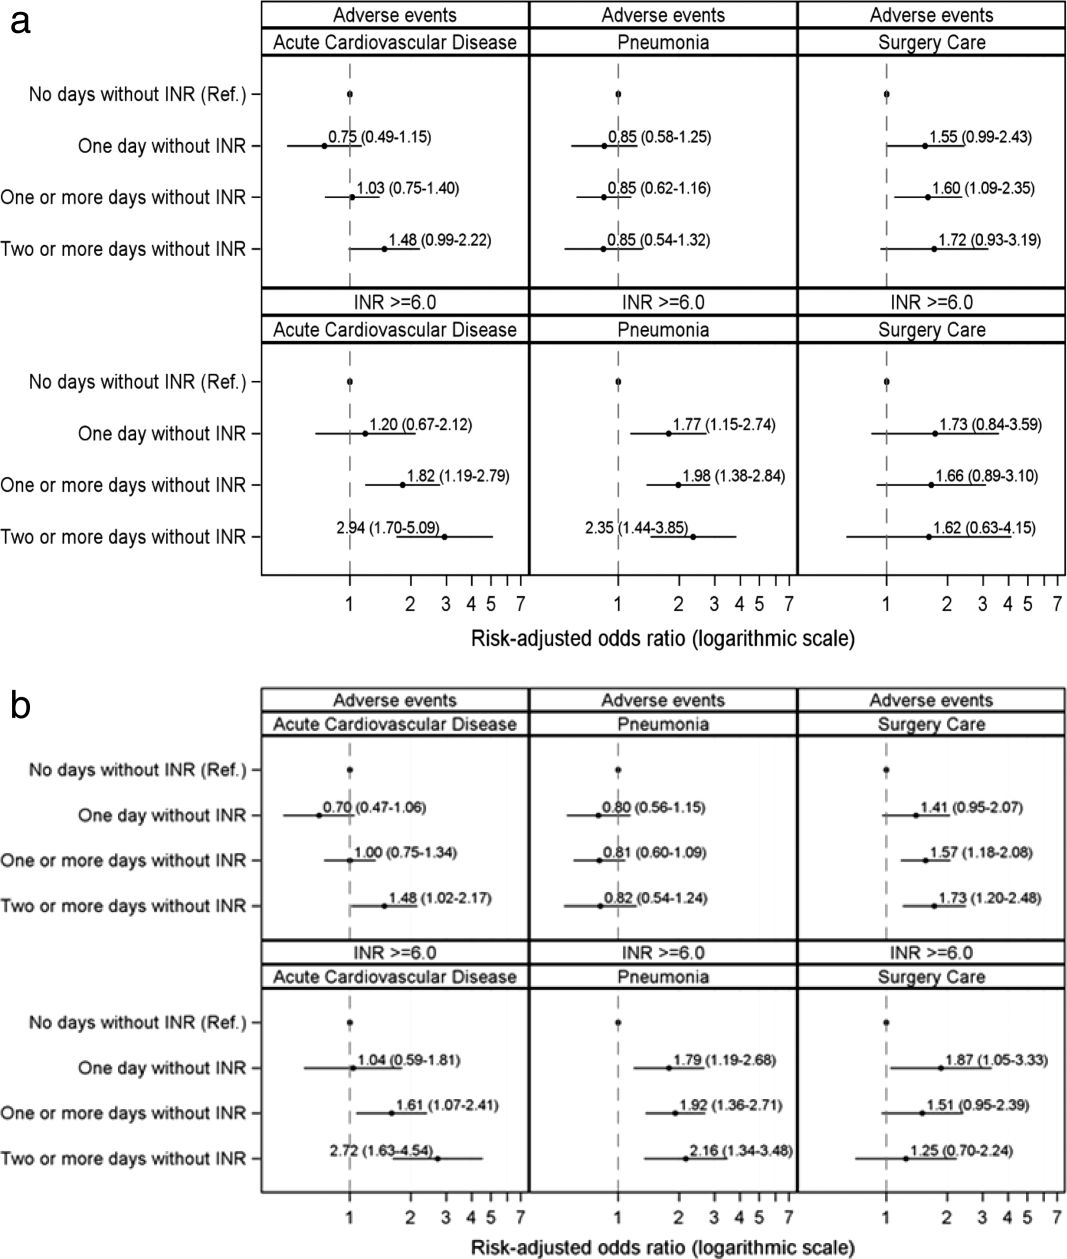
Supporting Table 2 in the online version of this article demonstrates the relationship between patient characteristics and the occurrence of an INR 6.0 or a warfarin‐related adverse event. The only characteristic that was associated with either of these outcomes for all 3 patient conditions was renal disease, which was positively associated with a warfarin‐associated adverse event. Warfarin use prior to arrival was associated with lower risks of both an INR 6.0 and a warfarin‐associated adverse event, except for among surgical patients. Supporting Table 3 in the online version of this article demonstrates the differences in patient characteristics between patients who had daily INR measurement and those who had at least 1 day without an INR measurement.
Figure 2 illustrates the relationship of the maximum INR to the prior 1‐day change in INR in 4963 patients whose INR on the day prior to the maximum INR was 2.0 to 3.5. When the increase in INR was <0.9, the risk of the next day's INR being 6.0 was 0.7%, and if the increase was 0.9, the risk was 5.2%. The risk of developing an INR 5.0 was 1.9% if the preceding day's INR increase was <0.9 and 15.3% if the prior day's INR rise was 0.9. Overall, 51% of INRs 6.0 and 55% of INRs 5.0 were immediately preceded by an INR increase of 0.9. The positive likelihood ratio (LR) for a 0.9 rise in INR predicting an INR of 6.0 was 4.2, and the positive LR was 4.9 for predicting an INR 5.0.
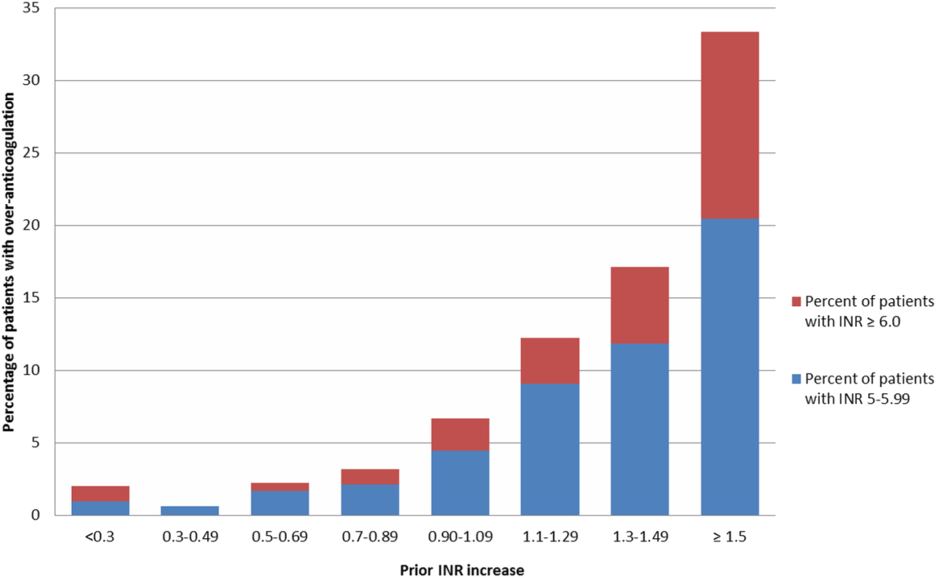
There was no decline in the frequency of warfarin use among the patients in the MPSMS sample during the study period (16.7% in 2009 and 17.3% in 2013).
DISCUSSION
We studied warfarin‐associated adverse events in a nationally representative study of patients who received warfarin while in an acute care hospital for a primary diagnosis of cardiac disease, pneumonia, or major surgery. Several findings resulted from our analysis. First, warfarin is still commonly prescribed to hospitalized patients and remains a frequent cause of adverse events; 7.4% of the 2009 to 2013 MPSMS population who received warfarin and had at least 1 INR >1.5 developed a warfarin‐associated adverse event.
Over 95% of patients who received warfarin on the day of hospital admission had an INR performed within 1 day. This is similar to the results from a 2006 single center study in which 95% of patients had an INR measured prior to their first dose of warfarin.[10] Since 2008, The Joint Commission's National Patient Safety Goal has required the assessment of coagulation status before starting warfarin.[17] The high level of adherence to this standard suggests that further attention to this process of care is unlikely to significantly improve patient safety.
We also found that the lack of daily INR measurements was associated with an increased risk of an INR 6.0 and warfarin‐associated adverse events in some patient populations. There is limited evidence addressing the appropriate frequency of INR measurement in hospitalized patients receiving warfarin. The Joint Commission National Patient Safety Goal requires use of a current INR to adjust this therapy, but provides no specifics.[17] Although some experts believe that INRs should be monitored daily in hospitalized patients, this does not appear to be uniformly accepted. In some reports, 2[13] or 3[14] consecutive days without the performance of an INR was required to activate a reminder. Protocols from some major teaching hospitals specify intermittent monitoring once the INR is therapeutic.[15, 16] Because our results suggest that lapses in INR measurement lead to overanticoagulation and warfarin‐related adverse events, it may be appropriate to measure INRs daily in most hospitalized patients receiving warfarin. This would be consistent with the many known causes of INR instability in patients admitted to the hospital, including drug‐drug interactions, hepatic dysfunction, and changes in volume of distribution, such that truly stable hospitalized patients are likely rare. Indeed, hospital admission is a well‐known predictor of instability of warfarin effect. [9] Although our results suggest that daily INR measurement is associated with a lower rate of overanticoagulation, future studies might better define lower risk patients for whom daily INR measurement would not be necessary.
A prior INR increase 0.9 in 1 day was associated with an increased risk of subsequent overanticoagulation. Although a rapidly rising INR is known to predict overanticoagulation[10, 14] we could find no evidence as to what specific rate of rise confers this risk. Our results suggest that use of a warfarin dosing protocol that considers both the absolute value of the INR and the rate of rise could reduce warfarin‐related adverse events.
There are important limitations of our study. We did not abstract warfarin dosages, which precluded study of the appropriateness of both initial warfarin dosing and adjustment of the warfarin dose based on INR results. MPSMS does not reliably capture antiplatelet agents or other agents that result in drug‐drug interactions with warfarin, such as antibiotics, so this factor could theoretically have confounded our results. Antibiotic use seems unlikely to be a major confounder, because patients with acute cardiovascular disease demonstrated a similar relationship between INR measurement and an INR 6.0 to that seen with pneumonia and surgical patients, despite the latter patients likely having greater antibiotics exposure. Furthermore, MPSMS does not capture indices of severity of illness, so other unmeasured confounders could have influenced our results. Although we have data for patients admitted to the hospital for only 4 conditions, these are conditions that represent approximately 22% of hospital admissions in the United States.[2] Strengths of our study include the nationally representative and randomly selected cases and use of data that were obtained from chart abstraction as opposed to administrative data. Through the use of centralized data abstraction, we avoided the potential bias introduced when hospitals self‐report adverse events.
In summary, in a national sample of patients admitted to the hospital for 4 common conditions, warfarin‐associated adverse events were detected in 7.4% of patients who received warfarin. Lack of daily INR measurement was associated with an increased risk of overanticoagulation and warfarin‐associated adverse events in certain patient populations. A 1‐day increase in the INR of 0.9 predicted subsequent overanticoagulation. These results provide actionable opportunities to improve safety in some hospitalized patients receiving warfarin.
Acknowledgements
The authors express their appreciation to Dan Budnitz, MD, MPH, for his advice regarding study design and his review and comments on a draft of this manuscript.
Disclosures: This work was supported by contract HHSA290201200003C from the Agency for Healthcare Research and Quality, United States Department of Health and Human Services, Rockville, Maryland. Qualidigm was the contractor. The authors assume full responsibility for the accuracy and completeness of the ideas. Dr. Metersky has worked on various quality improvement and patient safety projects with Qualidigm, Centers for Medicare & Medicaid Services, and the Agency for Healthcare Research and Quality. His employer has received remuneration for this work. Dr. Krumholz works under contract with the Centers for Medicare & Medicaid Services to develop and maintain performance measures. Dr. Krumholz is the chair of a cardiac scientific advisory board for UnitedHealth and the recipient of a research grant from Medtronic, Inc. through Yale University. The other authors report no conflicts of interest.
- , , , , , . Delivery of optimized inpatient anticoagulation therapy: consensus statement from the anticoagulation forum. Ann Pharmacother. 2013;47:714–724.
- , , , et al. National trends in patient safety for four common conditions, 2005–2011. N Engl J Med. 2014;370:341–351.
- , . Update on antithrombotic therapy: new anticoagulants. Circulation. 2010;121:1523–1532
- , , , . The pharmacogenetics of coumarin therapy. Pharmacogenomics. 2005;6:503–513.
- , , . Adverse drug events among hospitalized Medicare patients: epidemiology and national estimates from a new approach to surveillance. Jt Comm J Qual Patient Saf. 2010;36:12–21.
- , , , et al. Active surveillance using electronic triggers to detect adverse events in hospitalized patients. Qual Saf Health Care. 2006;15:184–190.
- , , , et al. Inpatient warfarin management: pharmacist management using a detailed dosing protocol. J Thromb Thrombolysis. 2012;33:178–184.
- , , , , . Efficacy and safety of a pharmacist‐managed inpatient anticoagulation service for warfarin initiation and titration. J Clin Pharm Ther. 2011;36:585–591.
- , , , et al. Bleeding complications of oral anticoagulant treatment: an inception‐cohort, prospective collaborative study (ISCOAT). Italian Study on Complications of Oral Anticoagulant Therapy. Lancet. 1996;348:423–428.
- , , , , , . Oral anticoagulation in the hospital: analysis of patients at risk. J Thromb Thrombolysis. 2011;31:22–26.
- , , , et al. Evidence‐based management of anticoagulant therapy: Antithrombotic Therapy and Prevention of Thrombosis, 9th ed: American College of Chest Physicians Evidence‐Based Clinical Practice Guidelines. Chest. 2012;141:e152S–e184S.
- Agency for Healthcare Research and Quality. National Guideline Clearinghouse. Available at: http://www.guideline.gov. Accessed April 30, 2015.
- , . Reduction in anticoagulation‐related adverse drug events using a trigger‐based methodology. Jt Comm J Qual Patient Saf. 2005;31:313–318.
- , , . Use of specific indicators to detect warfarin‐related adverse events. Am J Health Syst Pharm. 2005;62:1683–1688.
- University of Wisconsin Health. Warfarin management– adult–inpatient clinical practice guideline. Available at: http://www.uwhealth.org/files/uwhealth/docs/pdf3/Inpatient_Warfarin_Guideline.pdf. Accessed April 30, 2015
- Anticoagulation Guidelines ‐ LSU Health Shreveport. Available at: http://myhsc.lsuhscshreveport.edu/pharmacy/PT%20Policies/Anticoagulation_Safety.pdf. Accessed November 29, 2015.
- The Joint Commission. National patient safety goals effective January 1, 2015. Available at: http://www.jointcommission.org/assets/1/6/2015_NPSG_HAP.pdf. Accessed November 29, 2015.
- U.S. Department of Health and Human Services. Office of Disease Prevention and Health Promotion. Available at: http://health.gov/hcq/pdfs/ade-action-plan-508c.pdf. Accessed November 29, 2015.
- The Joint Commission. Surgical care improvement project. Available at: http://www.jointcommission.org/surgical_care_improvement_project. Accessed May 5, 2015.
- , , , et al. Optimization of inpatient warfarin therapy: Impact of daily consultation by a pharmacist‐managed anticoagulation service. Ann Pharmacother. 2000;34:567–572.
- , , . Effects of requiring a baseline International Normalized Ratio for inpatients treated with warfarin. Am J Health Syst Pharm. 2010;67:17–22.
- , . Weighting regressions by propensity scores. Eval Rev. 2008;32:392–409.
- . An introduction to propensity score methods for reducing the effects of confounding in observational studies. Multivar Behav Res. 2011;46:399–424.
- . Propensity score methods for bias reduction in the comparison of a treatment to a non‐randomized control group. Stat Med. 1998;17:2265–2281.
- , . The central role of the propensity score in observational studies for causal effects. Biometrika. 1983;70:41–55.
Warfarin is 1 of the most common causes of adverse drug events, with hospitalized patients being particularly at risk compared to outpatients.[1] Despite the availability of new oral anticoagulants (NOACs), physicians commonly prescribe warfarin to hospitalized patients,[2] likely in part due to the greater difficulty in reversing NOACs compared to warfarin. Furthermore, uptake of the NOACs is likely to be slow in resource‐poor countries due to the lower cost of warfarin.[3] However, the narrow therapeutic index, frequent drug‐drug interactions, and patient variability in metabolism of warfarin makes management challenging.[4] Thus, warfarin remains a significant cause of adverse events in hospitalized patients, occurring in approximately 3% to 8% of exposed patients, depending on underlying condition.[2, 5]
An elevated international normalized ratio (INR) is a strong predictor of drug‐associated adverse events (patient harm). In a study employing 21 different electronic triggers to identify potential adverse events, an elevated INR had the highest yield for events associated with harm (96% of INRs >5.0 associated with harm).[6] Although pharmacist‐managed inpatient anticoagulation services have been shown to improve warfarin management,[7, 8] there are evidence gaps regarding the causes of warfarin‐related adverse events and practice changes that could decrease their frequency. Although overanticoagulation is a well‐known risk factor for warfarin‐related adverse events,[9, 10] there are few evidence‐based warfarin monitoring and dosing recommendations for hospitalized patients.[10] For example, the 2012 American College of Chest Physicians Antithrombotic Guidelines[11] provide a weak recommendation on initial dosing of warfarin, but no recommendations on how frequently to monitor the INR, or appropriate dosing responses to INR levels. Although many hospitals employ protocols that suggest daily INR monitoring until stable, there are no evidence‐based guidelines to support this practice.[12] Conversely, there are reports of flags to order an INR level that are not activated unless greater than 2[13] or 3 days[14] pass since the prior INR. Protocols from some major academic medical centers suggest that after a therapeutic INR is reached, INR levels can be measured intermittently, as infrequently as twice a week.[15, 16]
The 2015 Joint Commission anticoagulant‐focused National Patient Safety Goal[17] (initially issued in 2008) mandates the assessment of baseline coagulation status before starting warfarin, and warfarin dosing based on a current INR; however, current is not defined. Neither the extent to which the mandate for assessing baseline coagulation status is adhered to nor the relationship between this process of care and patient outcomes is known. The importance of adverse drug events associated with anticoagulants, included warfarin, was also recently highlighted in the 2014 federal National Action Plan for Adverse Drug Event Prevention. In this document, the prevention of adverse drug events associated with anticoagulants was 1 of the 3 areas selected for special national attention and action.[18]
The Medicare Patient Safety Monitoring System (MPSMS) is a national chart abstraction‐based system that includes 21 in‐hospital adverse event measures, including warfarin‐associated adverse drug events.[2] Because of the importance of warfarin‐associated bleeding in hospitalized patients, we analyzed MPSMS data to determine what factors related to INR monitoring practices place patients at risk for these events. We were particularly interested in determining if we could detect potentially modifiable predictors of overanticoagulation and warfarin‐associated adverse events.
METHODS
Study Sample
We combined 2009 to 2013 MPSMS all payer data from the Centers for Medicare & Medicaid Services Hospital Inpatient Quality Reporting program for 4 common medical conditions: (1) acute myocardial infarction, (2) heart failure, (3) pneumonia, and (4) major surgery (as defined by the national Surgical Care Improvement Project).[19] To increase the sample size for cardiac patients, we combined myocardial infarction patients and heart failure patients into 1 group: acute cardiovascular disease. Patients under 18 years of age are excluded from the MPSMS sample, and we excluded patients whose INR never exceeded 1.5 after the initiation of warfarin therapy.
Patient Characteristics
Patient characteristics included demographics (age, sex, race [white, black, and other race]) and comorbidities. Comorbidities abstracted from medical records included: histories at the time of hospital admission of heart failure, obesity, coronary artery disease, renal disease, cerebrovascular disease, chronic obstructive pulmonary disease, cancer, diabetes, and smoking. The use of anticoagulants other than warfarin was also captured.
INRs
The INR measurement period for each patient started from the initial date of warfarin administration and ended on the date the maximum INR occurred. If a patient had more than 1 INR value on any day, the higher INR value was selected. A day without an INR measurement was defined as no INR value documented for a calendar day within the INR measurement period, starting on the third day of warfarin and ending on the day of the maximum INR level.
Outcomes
The study was performed to assess the association between the number of days on which a patient did not have an INR measured while receiving warfarin and the occurrence of (1) an INR 6.0[20, 21] (intermediate outcome) and (2) a warfarin‐associated adverse event. A description of the MPSMS measure of warfarin‐associated adverse events has been previously published.[2] Warfarin‐associated adverse events must have occurred within 48 hours of predefined triggers: an INR 4.0, cessation of warfarin therapy, administration of vitamin K or fresh frozen plasma, or transfusion of packed red blood cells other than in the setting of a surgical procedure. Warfarin‐associated adverse events were divided into minor and major events for this analysis. Minor events were defined as bleeding, drop in hematocrit of 3 points (occurring more than 48 hours after admission and not associated with surgery), or development of a hematoma. Major events were death, intracranial bleeding, or cardiac arrest. A patient who had both a major and a minor event was considered as having had a major event.
To assess the relationship between a rapidly rising INR and a subsequent INR 5.0 or 6.0, we determined the increase in INR between the measurement done 2 days prior to the maximum INR and 1 day prior to the maximum INR. This analysis was performed only on patients whose INR was 2.0 and 3.5 on the day prior to the maximum INR. In doing so, we sought to determine if the INR rise could predict the occurrence of a subsequent severely elevated INR in patients whose INR was within or near the therapeutic range.
Statistical Analysis
We conducted bivariate analysis to quantify the associations between lapses in measurement of the INR and subsequent warfarin‐associated adverse events, using the Mantel‐Haenszel 2 test for categorical variables. We fitted a generalized linear model with a logit link function to estimate the association of days on which an INR was not measured and the occurrence of the composite adverse event measure or the occurrence of an INR 6.0, adjusting for baseline patient characteristics, the number of days on warfarin, and receipt of heparin and low‐molecular‐weight heparin (LMWH). To account for potential imbalances in baseline patient characteristics and warfarin use prior to admission, we conducted a second analysis using the stabilized inverse probability weights approach. Specifically, we weighted each patient by the patient's inverse propensity scores of having only 1 day, at least 1 day, and at least 2 days without an INR measurement while receiving warfarin.[22, 23, 24, 25] To obtain the propensity scores, we fitted 3 logistic models with all variables included in the above primary mixed models except receipt of LMWH, heparin, and the number of days on warfarin as predictors, but 3 different outcomes, 1 day without an INR measurement, 1 or more days without an INR measurement, and 2 or more days without an INR measurement. Analyses were conducted using SAS version 9.2 (SAS Institute Inc., Cary, NC). All statistical testing was 2‐sided, at a significance level of 0.05. The institutional review board at Solutions IRB (Little Rock, AR) determined that the requirement for informed consent could be waived based on the nature of the study.
RESULTS
There were 130,828 patients included in the 2009 to 2013 MPSMS sample, of whom 19,445 (14.9%) received warfarin during their hospital stay and had at least 1 INR measurement. Among these patients, 5228 (26.9%) had no INR level above 1.5 and were excluded from further analysis, leaving 14,217 included patients. Of these patients, 1055 (7.4%) developed a warfarin‐associated adverse event. Table 1 demonstrates the baseline demographics and comorbidities of the included patients.
| Characteristics | Acute Cardiovascular Disease, No. (%), N = 6,394 | Pneumonia, No. (%), N = 3,668 | Major Surgery, No. (%), N = 4,155 | All, No. (%), N = 14,217 |
|---|---|---|---|---|
| ||||
| Age, mean [SD] | 75.3 [12.4] | 74.5 [13.3] | 69.4 [11.8] | 73.4 [12.7] |
| Sex, female | 3,175 (49.7) | 1,741 (47.5) | 2,639 (63.5) | 7,555 (53.1) |
| Race | ||||
| White | 5,388 (84.3) | 3,268 (89.1) | 3,760 (90.5) | 12,416 (87.3) |
| Other | 1,006 (15.7) | 400 (10.9) | 395 (9.5) | 1,801 (12.7) |
| Comorbidities | ||||
| Cancer | 1,186 (18.6) | 939 (25.6) | 708 (17.0) | 2,833 (19.9) |
| Diabetes | 3,043 (47.6) | 1,536 (41.9) | 1,080 (26.0) | 5,659 (39.8) |
| Obesity | 1,938 (30.3) | 896 (24.4) | 1,260 (30.3) | 4,094 (28.8) |
| Cerebrovascular disease | 1,664 (26.0) | 910 (24.8) | 498 (12.0) | 3,072 (21.6) |
| Heart failure/pulmonary edema | 5,882 (92.0) | 2,052 (55.9) | 607 (14.6) | 8,541 (60.1) |
| Chronic obstructive pulmonary disease | 2,636 (41.2) | 1,929 (52.6) | 672 (16.2) | 5,237 (36.8) |
| Smoking | 895 (14.0) | 662 (18.1) | 623 (15.0) | 2,180 (15.3) |
| Corticosteroids | 490 (7.7) | 568 (15.5) | 147 (3.5) | 1,205 (8.5) |
| Coronary artery disease | 4,628 (72.4) | 1,875 (51.1) | 1,228 (29.6) | 7,731 (54.4) |
| Renal disease | 3,000 (46.9) | 1,320 (36.0) | 565 (13.6) | 4,885 (34.4) |
| Warfarin prior to arrival | 5,074 (79.4) | 3,020 (82.3) | 898 (21.6) | 8,992 (63.3) |
| Heparin given during hospitalization | 850 (13.3) | 282 (7.7) | 314 (7.6) | 1,446 (10.7) |
| LMWH given during hospitalization | 1,591 (24.9) | 1,070 (29.2) | 1,431 (34.4) | 4,092 (28.8) |
Warfarin was started on hospital day 1 for 6825 (48.0%) of 14,217 patients. Among these patients, 6539 (95.8%) had an INR measured within 1 calendar day. We were unable to determine how many patients who started warfarin later in their hospital stay had a baseline INR, as we did not capture INRs performed prior to the day that warfarin was initiated.
Supporting Table 1 in the online version of this article demonstrates the association between an INR 6.0 and the occurrence of warfarin‐associated adverse events. A maximum INR 6.0 occurred in 469 (3.3%) of the patients included in the study, and among those patients, 133 (28.4%) experienced a warfarin‐associated adverse event compared to 922 (6.7%) adverse events in the 13,748 patients who did not develop an INR 6.0 (P < 0.001).
Among 8529 patients who received warfarin for at least 3 days, beginning on the third day of warfarin, 1549 patients (18.2%) did not have INR measured at least once each day that they received warfarin. Table 2 demonstrates that patients who had 2 or more days on which the INR was not measured had higher rates of INR 6.0 than patients for whom the INR was measured daily. A similar association was seen for warfarin‐associated adverse events (Table 2).
| No. of Patients, No. (%), N = 8,529 | Patients With INR on All Days, No. (%), N = 6,980 | Patients With 1 Day Without an INR, No. (%), N = 968 | Patients With 2 or More Days Without an INR, No. (%), N = 581 | P Value | |
|---|---|---|---|---|---|
| |||||
| Maximum INR | <0.01* | ||||
| 1.515.99 | 8,183 | 6,748 (96.7) | 911 (94.1) | 524 (90.2) | |
| 6.0 | 346 | 232 (3.3) | 57 (5.9) | 57 (9.8) | |
| Warfarin‐associated adverse events | <0.01* | ||||
| No adverse events | 7,689 (90.2) | 6,331 (90.7) | 872 (90.1) | 486 (83.6) | |
| Minor adverse events | 792 (9.3) | 617 (8.8) | 86 (8.9) | 89 (15.3) | |
| Major adverse events | 48 (0.6) | 32 (0.5) | 10 (1.0) | 6 (1.0) | |
Figure 1A demonstrates the association between the number of days without an INR measurement and the subsequent development of an INR 6.0 or a warfarin‐associated adverse event, adjusted for baseline patient characteristics, receipt of heparin and LMWH, and number of days on warfarin. Patients with 1 or more days without an INR measurement had higher risk‐adjusted ORs of a subsequent INR 6.0, although the difference was not statistically significant for surgical patients. The analysis results based on inverse propensity scoring are seen in Figure 1B. Cardiac and surgical patients with 2 or more days without an INR measurement were at higher risk of having a warfarin‐associated adverse event, whereas cardiac and pneumonia patients with 1 or more days without an INR measurement were at higher risk of developing an INR 6.0.
Supporting Table 2 in the online version of this article demonstrates the relationship between patient characteristics and the occurrence of an INR 6.0 or a warfarin‐related adverse event. The only characteristic that was associated with either of these outcomes for all 3 patient conditions was renal disease, which was positively associated with a warfarin‐associated adverse event. Warfarin use prior to arrival was associated with lower risks of both an INR 6.0 and a warfarin‐associated adverse event, except for among surgical patients. Supporting Table 3 in the online version of this article demonstrates the differences in patient characteristics between patients who had daily INR measurement and those who had at least 1 day without an INR measurement.
Figure 2 illustrates the relationship of the maximum INR to the prior 1‐day change in INR in 4963 patients whose INR on the day prior to the maximum INR was 2.0 to 3.5. When the increase in INR was <0.9, the risk of the next day's INR being 6.0 was 0.7%, and if the increase was 0.9, the risk was 5.2%. The risk of developing an INR 5.0 was 1.9% if the preceding day's INR increase was <0.9 and 15.3% if the prior day's INR rise was 0.9. Overall, 51% of INRs 6.0 and 55% of INRs 5.0 were immediately preceded by an INR increase of 0.9. The positive likelihood ratio (LR) for a 0.9 rise in INR predicting an INR of 6.0 was 4.2, and the positive LR was 4.9 for predicting an INR 5.0.
There was no decline in the frequency of warfarin use among the patients in the MPSMS sample during the study period (16.7% in 2009 and 17.3% in 2013).
DISCUSSION
We studied warfarin‐associated adverse events in a nationally representative study of patients who received warfarin while in an acute care hospital for a primary diagnosis of cardiac disease, pneumonia, or major surgery. Several findings resulted from our analysis. First, warfarin is still commonly prescribed to hospitalized patients and remains a frequent cause of adverse events; 7.4% of the 2009 to 2013 MPSMS population who received warfarin and had at least 1 INR >1.5 developed a warfarin‐associated adverse event.
Over 95% of patients who received warfarin on the day of hospital admission had an INR performed within 1 day. This is similar to the results from a 2006 single center study in which 95% of patients had an INR measured prior to their first dose of warfarin.[10] Since 2008, The Joint Commission's National Patient Safety Goal has required the assessment of coagulation status before starting warfarin.[17] The high level of adherence to this standard suggests that further attention to this process of care is unlikely to significantly improve patient safety.
We also found that the lack of daily INR measurements was associated with an increased risk of an INR 6.0 and warfarin‐associated adverse events in some patient populations. There is limited evidence addressing the appropriate frequency of INR measurement in hospitalized patients receiving warfarin. The Joint Commission National Patient Safety Goal requires use of a current INR to adjust this therapy, but provides no specifics.[17] Although some experts believe that INRs should be monitored daily in hospitalized patients, this does not appear to be uniformly accepted. In some reports, 2[13] or 3[14] consecutive days without the performance of an INR was required to activate a reminder. Protocols from some major teaching hospitals specify intermittent monitoring once the INR is therapeutic.[15, 16] Because our results suggest that lapses in INR measurement lead to overanticoagulation and warfarin‐related adverse events, it may be appropriate to measure INRs daily in most hospitalized patients receiving warfarin. This would be consistent with the many known causes of INR instability in patients admitted to the hospital, including drug‐drug interactions, hepatic dysfunction, and changes in volume of distribution, such that truly stable hospitalized patients are likely rare. Indeed, hospital admission is a well‐known predictor of instability of warfarin effect. [9] Although our results suggest that daily INR measurement is associated with a lower rate of overanticoagulation, future studies might better define lower risk patients for whom daily INR measurement would not be necessary.
A prior INR increase 0.9 in 1 day was associated with an increased risk of subsequent overanticoagulation. Although a rapidly rising INR is known to predict overanticoagulation[10, 14] we could find no evidence as to what specific rate of rise confers this risk. Our results suggest that use of a warfarin dosing protocol that considers both the absolute value of the INR and the rate of rise could reduce warfarin‐related adverse events.
There are important limitations of our study. We did not abstract warfarin dosages, which precluded study of the appropriateness of both initial warfarin dosing and adjustment of the warfarin dose based on INR results. MPSMS does not reliably capture antiplatelet agents or other agents that result in drug‐drug interactions with warfarin, such as antibiotics, so this factor could theoretically have confounded our results. Antibiotic use seems unlikely to be a major confounder, because patients with acute cardiovascular disease demonstrated a similar relationship between INR measurement and an INR 6.0 to that seen with pneumonia and surgical patients, despite the latter patients likely having greater antibiotics exposure. Furthermore, MPSMS does not capture indices of severity of illness, so other unmeasured confounders could have influenced our results. Although we have data for patients admitted to the hospital for only 4 conditions, these are conditions that represent approximately 22% of hospital admissions in the United States.[2] Strengths of our study include the nationally representative and randomly selected cases and use of data that were obtained from chart abstraction as opposed to administrative data. Through the use of centralized data abstraction, we avoided the potential bias introduced when hospitals self‐report adverse events.
In summary, in a national sample of patients admitted to the hospital for 4 common conditions, warfarin‐associated adverse events were detected in 7.4% of patients who received warfarin. Lack of daily INR measurement was associated with an increased risk of overanticoagulation and warfarin‐associated adverse events in certain patient populations. A 1‐day increase in the INR of 0.9 predicted subsequent overanticoagulation. These results provide actionable opportunities to improve safety in some hospitalized patients receiving warfarin.
Acknowledgements
The authors express their appreciation to Dan Budnitz, MD, MPH, for his advice regarding study design and his review and comments on a draft of this manuscript.
Disclosures: This work was supported by contract HHSA290201200003C from the Agency for Healthcare Research and Quality, United States Department of Health and Human Services, Rockville, Maryland. Qualidigm was the contractor. The authors assume full responsibility for the accuracy and completeness of the ideas. Dr. Metersky has worked on various quality improvement and patient safety projects with Qualidigm, Centers for Medicare & Medicaid Services, and the Agency for Healthcare Research and Quality. His employer has received remuneration for this work. Dr. Krumholz works under contract with the Centers for Medicare & Medicaid Services to develop and maintain performance measures. Dr. Krumholz is the chair of a cardiac scientific advisory board for UnitedHealth and the recipient of a research grant from Medtronic, Inc. through Yale University. The other authors report no conflicts of interest.
- , , , , , . Delivery of optimized inpatient anticoagulation therapy: consensus statement from the anticoagulation forum. Ann Pharmacother. 2013;47:714–724.
- , , , et al. National trends in patient safety for four common conditions, 2005–2011. N Engl J Med. 2014;370:341–351.
- , . Update on antithrombotic therapy: new anticoagulants. Circulation. 2010;121:1523–1532
- , , , . The pharmacogenetics of coumarin therapy. Pharmacogenomics. 2005;6:503–513.
- , , . Adverse drug events among hospitalized Medicare patients: epidemiology and national estimates from a new approach to surveillance. Jt Comm J Qual Patient Saf. 2010;36:12–21.
- , , , et al. Active surveillance using electronic triggers to detect adverse events in hospitalized patients. Qual Saf Health Care. 2006;15:184–190.
- , , , et al. Inpatient warfarin management: pharmacist management using a detailed dosing protocol. J Thromb Thrombolysis. 2012;33:178–184.
- , , , , . Efficacy and safety of a pharmacist‐managed inpatient anticoagulation service for warfarin initiation and titration. J Clin Pharm Ther. 2011;36:585–591.
- , , , et al. Bleeding complications of oral anticoagulant treatment: an inception‐cohort, prospective collaborative study (ISCOAT). Italian Study on Complications of Oral Anticoagulant Therapy. Lancet. 1996;348:423–428.
- , , , , , . Oral anticoagulation in the hospital: analysis of patients at risk. J Thromb Thrombolysis. 2011;31:22–26.
- , , , et al. Evidence‐based management of anticoagulant therapy: Antithrombotic Therapy and Prevention of Thrombosis, 9th ed: American College of Chest Physicians Evidence‐Based Clinical Practice Guidelines. Chest. 2012;141:e152S–e184S.
- Agency for Healthcare Research and Quality. National Guideline Clearinghouse. Available at: http://www.guideline.gov. Accessed April 30, 2015.
- , . Reduction in anticoagulation‐related adverse drug events using a trigger‐based methodology. Jt Comm J Qual Patient Saf. 2005;31:313–318.
- , , . Use of specific indicators to detect warfarin‐related adverse events. Am J Health Syst Pharm. 2005;62:1683–1688.
- University of Wisconsin Health. Warfarin management– adult–inpatient clinical practice guideline. Available at: http://www.uwhealth.org/files/uwhealth/docs/pdf3/Inpatient_Warfarin_Guideline.pdf. Accessed April 30, 2015
- Anticoagulation Guidelines ‐ LSU Health Shreveport. Available at: http://myhsc.lsuhscshreveport.edu/pharmacy/PT%20Policies/Anticoagulation_Safety.pdf. Accessed November 29, 2015.
- The Joint Commission. National patient safety goals effective January 1, 2015. Available at: http://www.jointcommission.org/assets/1/6/2015_NPSG_HAP.pdf. Accessed November 29, 2015.
- U.S. Department of Health and Human Services. Office of Disease Prevention and Health Promotion. Available at: http://health.gov/hcq/pdfs/ade-action-plan-508c.pdf. Accessed November 29, 2015.
- The Joint Commission. Surgical care improvement project. Available at: http://www.jointcommission.org/surgical_care_improvement_project. Accessed May 5, 2015.
- , , , et al. Optimization of inpatient warfarin therapy: Impact of daily consultation by a pharmacist‐managed anticoagulation service. Ann Pharmacother. 2000;34:567–572.
- , , . Effects of requiring a baseline International Normalized Ratio for inpatients treated with warfarin. Am J Health Syst Pharm. 2010;67:17–22.
- , . Weighting regressions by propensity scores. Eval Rev. 2008;32:392–409.
- . An introduction to propensity score methods for reducing the effects of confounding in observational studies. Multivar Behav Res. 2011;46:399–424.
- . Propensity score methods for bias reduction in the comparison of a treatment to a non‐randomized control group. Stat Med. 1998;17:2265–2281.
- , . The central role of the propensity score in observational studies for causal effects. Biometrika. 1983;70:41–55.
© 2015 Society of Hospital Medicine

Planned Readmission Algorithm
The Centers for Medicare & Medicaid Services (CMS) publicly reports all‐cause risk‐standardized readmission rates after acute‐care hospitalization for acute myocardial infarction, pneumonia, heart failure, total hip and knee arthroplasty, chronic obstructive pulmonary disease, stroke, and for patients hospital‐wide.[1, 2, 3, 4, 5] Ideally, these measures should capture unplanned readmissions that arise from acute clinical events requiring urgent rehospitalization. Planned readmissions, which are scheduled admissions usually involving nonurgent procedures, may not be a signal of quality of care. Including planned readmissions in readmission quality measures could create a disincentive to provide appropriate care to patients who are scheduled for elective or necessary procedures unrelated to the quality of the prior admission. Accordingly, under contract to the CMS, we were asked to develop an algorithm to identify planned readmissions. A version of this algorithm is now incorporated into all publicly reported readmission measures.
Given the widespread use of the planned readmission algorithm in public reporting and its implications for hospital quality measurement and evaluation, the objective of this study was to describe the development process, and to validate and refine the algorithm by reviewing charts of readmitted patients.
METHODS
Algorithm Development
To create a planned readmission algorithm, we first defined planned. We determined that readmissions for obstetrical delivery, maintenance chemotherapy, major organ transplant, and rehabilitation should always be considered planned in the sense that they are desired and/or inevitable, even if not specifically planned on a certain date. Apart from these specific types of readmissions, we defined planned readmissions as nonacute readmissions for scheduled procedures, because the vast majority of planned admissions are related to procedures. We also defined readmissions for acute illness or for complications of care as unplanned for the purposes of a quality measure. Even if such readmissions included a potentially planned procedure, because complications of care represent an important dimension of quality that should not be excluded from outcome measurement, these admissions should not be removed from the measure outcome. This definition of planned readmissions does not imply that all unplanned readmissions are unexpected or avoidable. However, it has proven very difficult to reliably define avoidable readmissions, even by expert review of charts, and we did not attempt to do so here.[6, 7]
In the second stage, we operationalized this definition into an algorithm. We used the Agency for Healthcare Research and Quality's Clinical Classification Software (CCS) codes to group thousands of individual procedure and diagnosis International Classification of Disease, Ninth Revision, Clinical Modification (ICD‐9‐CM) codes into clinically coherent, mutually exclusive procedure CCS categories and mutually exclusive diagnosis CCS categories, respectively. Clinicians on the investigative team reviewed the procedure categories to identify those that are commonly planned and that would require inpatient admission. We also reviewed the diagnosis categories to identify acute diagnoses unlikely to accompany elective procedures. We then created a flow diagram through which every readmission could be run to determine whether it was planned or unplanned based on our categorizations of procedures and diagnoses (Figure 1, and Supporting Information, Appendix A, in the online version of this article). This version of the algorithm (v1.0) was submitted to the National Quality Forum (NQF) as part of the hospital‐wide readmission measure. The measure (NQR #1789) received endorsement in April 2012.

In the third stage of development, we posted the algorithm for 2 public comment periods and recruited 27 outside experts to review and refine the algorithm following a standardized, structured process (see Supporting Information, Appendix B, in the online version of this article). Because the measures publicly report and hold hospitals accountable for unplanned readmission rates, we felt it most important that the algorithm include as few planned readmissions in the reported, unplanned outcome as possible (ie, have high negative predictive value). Therefore, in equivocal situations in which experts felt procedure categories were equally often planned or unplanned, we added those procedures to the potentially planned list. We also solicited feedback from hospitals on algorithm performance during a confidential test run of the hospital‐wide readmission measure in the fall of 2012. Based on all of this feedback, we made a number of changes to the algorithm, which was then identified as v2.1. Version 2.1 of the algorithm was submitted to the NQF as part of the endorsement process for the acute myocardial infarction and heart failure readmission measures and was endorsed by the NQF in January 2013. The algorithm (v2.1) is now applied, adapted if necessary, to all publicly reported readmission measures.[8]
Algorithm Validation: Study Cohort
We recruited 2 hospital systems to participate in a chart validation study of the accuracy of the planned readmission algorithm (v2.1). Within these 2 health systems, we selected 7 hospitals with varying bed size, teaching status, and safety‐net status. Each included 1 large academic teaching hospital that serves as a regional referral center. For each hospital's index admissions, we applied the inclusion and exclusion criteria from the hospital‐wide readmission measure. Index admissions were included for patients age 65 years or older; enrolled in Medicare fee‐for‐service (FFS); discharged from a nonfederal, short‐stay, acute‐care hospital or critical access hospital; without an in‐hospital death; not transferred to another acute‐care facility; and enrolled in Part A Medicare for 1 year prior to discharge. We excluded index admissions for patients without at least 30 days postdischarge enrollment in FFS Medicare, discharged against medical advice, admitted for medical treatment of cancer or primary psychiatric disease, admitted to a Prospective Payment System‐exempt cancer hospital, or who died during the index hospitalization. In addition, for this study, we included only index admissions that were followed by a readmission to a hospital within the participating health system between July 1, 2011 and June 30, 2012. Institutional review board approval was obtained from each of the participating health systems, which granted waivers of signed informed consent and Health Insurance Portability and Accountability Act waivers.
Algorithm Validation: Sample Size Calculation
We determined a priori that the minimum acceptable positive predictive value, or proportion of all readmissions the algorithm labels planned that are truly planned, would be 60%, and the minimum acceptable negative predictive value, or proportion of all readmissions the algorithm labels as unplanned that are truly unplanned, would be 80%. We calculated the sample size required to be confident of these values 10% and determined we would need a total of 291 planned charts and 162 unplanned charts. We inflated these numbers by 20% to account for missing or unobtainable charts for a total of 550 charts. To achieve this sample size, we included all eligible readmissions from all participating hospitals that were categorized as planned. At the 5 smaller hospitals, we randomly selected an equal number of unplanned readmissions occurring at any hospital in its healthcare system. At the 2 largest hospitals, we randomly selected 50 unplanned readmissions occurring at any hospital in its healthcare system.
Algorithm Validation: Data Abstraction
We developed an abstraction tool, tested and refined it using sample charts, and built the final the tool into a secure, password‐protected Microsoft Access 2007 (Microsoft Corp., Redmond, WA) database (see Supporting Information, Appendix C, in the online version of this article). Experienced chart abstractors with RN or MD degrees from each hospital site participated in a 1‐hour training session to become familiar with reviewing medical charts, defining planned/unplanned readmissions, and the data abstraction process. For each readmission, we asked abstractors to review as needed: emergency department triage and physician notes, admission history and physical, operative report, discharge summary, and/or discharge summary from a prior admission. The abstractors verified the accuracy of the administrative billing data, including procedures and principal diagnosis. In addition, they abstracted the source of admission and dates of all major procedures. Then the abstractors provided their opinion and supporting rationale as to whether a readmission was planned or unplanned. They were not asked to determine whether the readmission was preventable. To determine the inter‐rater reliability of data abstraction, an independent abstractor at each health system recoded a random sample of 10% of the charts.
Statistical Analysis
To ensure that we had obtained a representative sample of charts, we identified the 10 most commonly planned procedures among cases identified as planned by the algorithm in the validation cohort and then compared this with planned cases nationally. To confirm the reliability of the abstraction process, we used the kappa statistic to determine the inter‐rater reliability of the determination of planned or unplanned status. Additionally, the full study team, including 5 practicing clinicians, reviewed the details of every chart abstraction in which the algorithm was found to have misclassified the readmission as planned or unplanned. In 11 cases we determined that the abstractor had misunderstood the definition of planned readmission (ie, not all direct admissions are necessarily planned) and we reclassified the chart review assignment accordingly.
We calculated sensitivity, specificity, positive predictive value, and negative predictive value of the algorithm for the validation cohort as a whole, weighted to account for the prevalence of planned readmissions as defined by the algorithm in the national data (7.8%). Weighting is necessary because we did not obtain a pure random sample, but rather selected a stratified sample that oversampled algorithm‐identified planned readmissions.[9] We also calculated these rates separately for large hospitals (>600 beds) and for small hospitals (600 beds).
Finally, we examined performance of the algorithm for individual procedures and diagnoses to determine whether any procedures or diagnoses should be added or removed from the algorithm. First, we reviewed the diagnoses, procedures, and brief narratives provided by the abstractors for all cases in which the algorithm misclassified the readmission as either planned or unplanned. Second, we calculated the positive predictive value for each procedure that had been flagged as planned by the algorithm, and reviewed all readmissions (correctly and incorrectly classified) in which procedures with low positive predictive value took place. We also calculated the frequency with which the procedure was the only qualifying procedure resulting in an accurate or inaccurate classification. Third, to identify changes that should be made to the lists of acute and nonacute diagnoses, we reviewed the principal diagnosis for all readmissions misclassified by the algorithm as either planned or unplanned, and examined the specific ICD‐9‐CM codes within each CCS group that were most commonly associated with misclassifications.
After determining the changes that should be made to the algorithm based on these analyses, we recalculated the sensitivity, specificity, positive predictive value, and negative predictive value of the proposed revised algorithm (v3.0). All analyses used SAS version 9.3 (SAS Institute, Cary, NC).
RESULTS
Study Cohort
Characteristics of participating hospitals are shown in Table 1. Hospitals represented in this sample ranged in size, teaching status, and safety net status, although all were nonprofit. We selected 663 readmissions for review, 363 planned and 300 unplanned. Overall we were able to select 80% of hospitals planned cases for review; the remainder occurred at hospitals outside the participating hospital system. Abstractors were able to locate and review 634 (96%) of the eligible charts (range, 86%100% per hospital). The kappa statistic for inter‐rater reliability was 0.83.
| Description | Hospitals, N | Readmissions Selected for Review, N* | Readmissions Reviewed, N (% of Eligible) | Unplanned Readmissions Reviewed, N | Planned Readmissions Reviewed, N | % of Hospital's Planned Readmissions Reviewed* | |
|---|---|---|---|---|---|---|---|
| |||||||
| All hospitals | 7 | 663 | 634 (95.6) | 283 | 351 | 77.3 | |
| No. of beds | >600 | 2 | 346 | 339 (98.0) | 116 | 223 | 84.5 |
| >300600 | 2 | 190 | 173 (91.1) | 85 | 88 | 87.1 | |
| <300 | 3 | 127 | 122 (96.0) | 82 | 40 | 44.9 | |
| Ownership | Government | 0 | |||||
| For profit | 0 | ||||||
| Not for profit | 7 | 663 | 634 (95.6) | 283 | 351 | 77.3 | |
| Teaching status | Teaching | 2 | 346 | 339 (98.0) | 116 | 223 | 84.5 |
| Nonteaching | 5 | 317 | 295 (93.1) | 167 | 128 | 67.4 | |
| Safety net status | Safety net | 2 | 346 | 339 (98.0) | 116 | 223 | 84.5 |
| Nonsafety net | 5 | 317 | 295 (93.1) | 167 | 128 | 67.4 | |
| Region | New England | 3 | 409 | 392 (95.8) | 155 | 237 | 85.9 |
| South Central | 4 | 254 | 242 (95.3) | 128 | 114 | 64.0 | |
The study sample included 57/67 (85%) of the procedure or condition categories on the potentially planned list. The most common procedure CCS categories among planned readmissions (v2.1) in the validation cohort were very similar to those in the national dataset (see Supporting Information, Appendix D, in the online version of this article). Of the top 20 most commonly planned procedure CCS categories in the validation set, all but 2, therapeutic radiology for cancer treatment (CCS 211) and peripheral vascular bypass (CCS 55), were among the top 20 most commonly planned procedure CCS categories in the national data.
Test Characteristics of Algorithm
The weighted test characteristics of the current algorithm (v2.1) are shown in Table 2. Overall, the algorithm correctly identified 266 readmissions as unplanned and 181 readmissions as planned, and misidentified 170 readmissions as planned and 15 as unplanned. Once weighted to account for the stratified sampling design, the overall prevalence of true planned readmissions was 8.9% of readmissions. The weighted sensitivity was 45.1% overall and was higher in large teaching centers than in smaller community hospitals. The weighted specificity was 95.9%. The positive predictive value was 51.6%, and the negative predictive value was 94.7%.
| Cohort | Sensitivity | Specificity | Positive Predictive Value | Negative Predictive Value |
|---|---|---|---|---|
| Algorithm v2.1 | ||||
| Full cohort | 45.1% | 95.9% | 51.6% | 94.7% |
| Large hospitals | 50.9% | 96.1% | 53.8% | 95.6% |
| Small hospitals | 40.2% | 95.5% | 47.7% | 94.0% |
| Revised algorithm v3.0 | ||||
| Full cohort | 49.8% | 96.5% | 58.7% | 94.5% |
| Large hospitals | 57.1% | 96.8% | 63.0% | 95.9% |
| Small hospitals | 42.6% | 95.9% | 52.6% | 93.9% |
Accuracy of Individual Diagnoses and Procedures
The positive predictive value of the algorithm for individual procedure categories varied widely, from 0% to 100% among procedures with at least 10 cases (Table 3). The procedure for which the algorithm was least accurate was CCS 211, therapeutic radiology for cancer treatment (0% positive predictive value). By contrast, maintenance chemotherapy (90%) and other therapeutic procedures, hemic and lymphatic system (100%) were most accurate. Common procedures with less than 50% positive predictive value (ie, that the algorithm commonly misclassified as planned) were diagnostic cardiac catheterization (25%); debridement of wound, infection, or burn (25%); amputation of lower extremity (29%); insertion, revision, replacement, removal of cardiac pacemaker or cardioverter/defibrillator (33%); and other hernia repair (43%). Of these, diagnostic cardiac catheterization and cardiac devices are the first and second most common procedures nationally, respectively.
| Readmission Procedure CCS Code | Total Categorized as Planned by Algorithm, N | Verified as Planned by Chart Review, N | Positive Predictive Value |
|---|---|---|---|
| |||
| 47 Diagnostic cardiac catheterization; coronary arteriography | 44 | 11 | 25% |
| 224 Cancer chemotherapy | 40 | 22 | 55% |
| 157 Amputation of lower extremity | 31 | 9 | 29% |
| 49 Other operating room heart procedures | 27 | 16 | 59% |
| 48 Insertion, revision, replacement, removal of cardiac pacemaker or cardioverter/defibrillator | 24 | 8 | 33% |
| 43 Heart valve procedures | 20 | 16 | 80% |
| Maintenance chemotherapy (diagnosis CCS 45) | 20 | 18 | 90% |
| 78 Colorectal resection | 18 | 9 | 50% |
| 169 Debridement of wound, infection or burn | 16 | 4 | 25% |
| 84 Cholecystectomy and common duct exploration | 16 | 5 | 31% |
| 99 Other OR gastrointestinal therapeutic procedures | 16 | 8 | 50% |
| 158 Spinal fusion | 15 | 11 | 73% |
| 142 Partial excision bone | 14 | 10 | 71% |
| 86 Other hernia repair | 14 | 6 | 42% |
| 44 Coronary artery bypass graft | 13 | 10 | 77% |
| 67 Other therapeutic procedures, hemic and lymphatic system | 13 | 13 | 100% |
| 211 Therapeutic radiology for cancer treatment | 12 | 0 | 0% |
| 45 Percutaneous transluminal coronary angioplasty | 11 | 7 | 64% |
| Total | 497 | 272 | 54.7% |
The readmissions with least abstractor agreement were those involving CCS 157 (amputation of lower extremity) and CCS 169 (debridement of wound, infection or burn). Readmissions for these procedures were nearly always performed as a consequence of acute worsening of chronic conditions such as osteomyelitis or ulceration. Abstractors were divided over whether these readmissions were appropriate to call planned.
Changes to the Algorithm
We determined that the accuracy of the algorithm would be improved by removing 2 procedure categories from the planned procedure list (therapeutic radiation [CCS 211] and cancer chemotherapy [CCS 224]), adding 1 diagnosis category to the acute diagnosis list (hypertension with complications [CCS 99]), and splitting 2 diagnosis condition categories into acute and nonacute ICD‐9‐CM codes (pancreatic disorders [CCS 149] and biliary tract disease [CCS 152]). Detailed rationales for each modification to the planned readmission algorithm are described in Table 4. We felt further examination of diagnostic cardiac catheterization and cardiac devices was warranted given their high frequency, despite low positive predictive value. We also elected not to alter the categorization of amputation or debridement because it was not easy to determine whether these admissions were planned or unplanned even with chart review. We plan further analyses of these procedure categories.
| Action | Diagnosis or Procedure Category | Algorithm | Chart | N | Rationale for Change |
|---|---|---|---|---|---|
| |||||
| Remove from planned procedure list | Therapeutic radiation (CCS 211) | Accurate | The algorithm was inaccurate in every case. All therapeutic radiology during readmissions was performed because of acute illness (pain crisis, neurologic crisis) or because scheduled treatment occurred during an unplanned readmission. In national data, this ranks as the 25th most common planned procedure identified by the algorithm v2.1. | ||
| Planned | Planned | 0 | |||
| Unplanned | Unplanned | 0 | |||
| Inaccurate | |||||
| Unplanned | Planned | 0 | |||
| Planned | Unplanned | 12 | |||
| Cancer chemotherapy (CCS 224) | Accurate | Of the 22 correctly identified as planned, 18 (82%) would already have been categorized as planned because of a principal diagnosis of maintenance chemotherapy. Therefore, removing CCS 224 from the planned procedure list would only miss a small fraction of planned readmissions but would avoid a large number of misclassifications. In national data, this ranks as the 8th most common planned procedure identified by the algorithm v2.1. | |||
| Planned | Planned | 22 | |||
| Unplanned | Unplanned | 0 | |||
| Inaccurate | |||||
| Unplanned | Planned | 0 | |||
| Planned | Unplanned | 18 | |||
| Add to planned procedure list | None | The abstractors felt a planned readmission was missed by the algorithm in 15 cases. A handful of these cases were missed because the planned procedure was not on the current planned procedure list; however, those procedures (eg, abdominal paracentesis, colonoscopy, endoscopy) were nearly always unplanned overall and should therefore not be added as procedures that potentially qualify as an admission as planned. | |||
| Remove from acute diagnosis list | None | The abstractors felt a planned readmission was missed by the algorithm in 15 cases. The relevant disqualifying acute diagnoses were much more often associated with unplanned readmissions in our dataset. | |||
| Add to acute diagnosis list | Hypertension with complications (CCS 99) | Accurate | This CCS was associated with only 1 planned readmission (for elective nephrectomy, a very rare procedure). Every other time this CCS appeared in the dataset, it was associated with an unplanned readmission (12/13, 92%); 10 of those, however, were misclassified by the algorithm as planned because they were not excluded by diagnosis (91% error rate). Consequently, adding this CCS to the acute diagnosis list is likely to miss only a very small fraction of planned readmissions, while making the overall algorithm much more accurate. | ||
| Planned | Planned | 1 | |||
| Unplanned | Unplanned | 2 | |||
| Inaccurate | |||||
| Unplanned | Planned | 0 | |||
| Planned | Unplanned | 10 | |||
| Split diagnosis condition category into component ICD‐9 codes | Pancreatic disorders (CCS 152) | Accurate | ICD‐9 code 577.0 (acute pancreatitis) is the only acute code in this CCS. Acute pancreatitis was present in 2 cases that were misclassified as planned. Clinically, there is no situation in which a planned procedure would reasonably be performed in the setting of acute pancreatitis. Moving ICD‐9 code 577.0 to the acute list and leaving the rest of the ICD‐9 codes in CCS 152 on the nonacute list will enable the algorithm to continue to identify planned procedures for chronic pancreatitis. | ||
| Planned | Planned | 0 | |||
| Unplanned | Unplanned | 1 | |||
| Inaccurate | |||||
| Unplanned | Planned | 0 | |||
| Planned | Unplanned | 2 | |||
| Biliary tract disease (CCS 149) | Accurate | This CCS is a mix of acute and chronic diagnoses. Of 14 charts classified as planned with CCS 149 in the principal diagnosis field, 12 were misclassified (of which 10 were associated with cholecystectomy). Separating out the acute and nonacute diagnoses will increase the accuracy of the algorithm while still ensuring that planned cholecystectomies and other procedures can be identified. Of the ICD‐9 codes in CCS 149, the following will be added to the acute diagnosis list: 574.0, 574.3, 574.6, 574.8, 575.0, 575.12, 576.1. | |||
| Planned | Planned | 2 | |||
| Unplanned | Unplanned | 3 | |||
| Inaccurate | |||||
| Unplanned | Planned | 0 | |||
| Planned | Unplanned | 12 | |||
| Consider for change after additional study | Diagnostic cardiac catheterization (CCS 47) | Accurate | The algorithm misclassified as planned 25/38 (66%) unplanned readmissions in which diagnostic catheterizations were the only qualifying planned procedure. It also correctly identified 3/3 (100%) planned readmissions in which diagnostic cardiac catheterizations were the only qualifying planned procedure. This is the highest volume procedure in national data. | ||
| Planned | Planned | 3* | |||
| Unplanned | Unplanned | 13* | |||
| Inaccurate | |||||
| Unplanned | Planned | 0* | |||
| Planned | Unplanned | 25* | |||
| Insertion, revision, replacement, removal of cardiac pacemaker or cardioverter/defibrillator (CCS 48) | Accurate | The algorithm misclassified as planned 4/5 (80%) unplanned readmissions in which cardiac devices were the only qualifying procedure. However, it also correctly identified 7/8 (87.5%) planned readmissions in which cardiac devices were the only qualifying planned procedure. CCS 48 is the second most common planned procedure category nationally. | |||
| Planned | Planned | 7 | |||
| Unplanned | Unplanned | 1 | |||
| Inaccurate | |||||
| Unplanned | Planned | 1 | |||
| Planned | Unplanned | 4 | |||
The revised algorithm (v3.0) had a weighted sensitivity of 49.8%, weighted specificity of 96.5%, positive predictive value of 58.7%, and negative predictive value of 94.5% (Table 2). In aggregate, these changes would increase the reported unplanned readmission rate from 16.0% to 16.1% in the hospital‐wide readmission measure, using 2011 to 2012 data, and would decrease the fraction of all readmissions considered planned from 7.8% to 7.2%.
DISCUSSION
We developed an algorithm based on administrative data that in its currently implemented form is very accurate at identifying unplanned readmissions, ensuring that readmissions included in publicly reported readmission measures are likely to be truly unplanned. However, nearly half of readmissions the algorithm classifies as planned are actually unplanned. That is, the algorithm is overcautious in excluding unplanned readmissions that could have counted as outcomes, particularly among admissions that include diagnostic cardiac catheterization or placement of cardiac devices (pacemakers, defibrillators). However, these errors only occur within the 7.8% of readmissions that are classified as planned and therefore do not affect overall readmission rates dramatically. A perfect algorithm would reclassify approximately half of these planned readmissions as unplanned, increasing the overall readmission rate by 0.6 percentage points.
On the other hand, the algorithm also only identifies approximately half of true planned readmissions as planned. Because the true prevalence of planned readmissions is low (approximately 9% of readmissions based on weighted chart review prevalence, or an absolute rate of 1.4%), this low sensitivity has a small effect on algorithm performance. Removing all true planned readmissions from the measure outcome would decrease the overall readmission rate by 0.8 percentage points, similar to the expected 0.6 percentage point increase that would result from better identifying unplanned readmissions; thus, a perfect algorithm would likely decrease the reported unplanned readmission rate by a net 0.2%. Overall, the existing algorithm appears to come close to the true prevalence of planned readmissions, despite inaccuracy on an individual‐case basis. The algorithm performed best at large hospitals, which are at greatest risk of being statistical outliers and of accruing penalties under the Hospital Readmissions Reduction Program.[10]
We identified several changes that marginally improved the performance of the algorithm by reducing the number of unplanned readmissions that are incorrectly removed from the measure, while avoiding the inappropriate inclusion of planned readmissions in the outcome. This revised algorithm, v3.0, was applied to public reporting of readmission rates at the end of 2014. Overall, implementing these changes increases the reported readmission rate very slightly. We also identified other procedures associated with high inaccuracy rates, removal of which would have larger impact on reporting rates, and which therefore merit further evaluation.
There are other potential methods of identifying planned readmissions. For instance, as of October 1, 2013, new administrative billing codes were created to allow hospitals to indicate that a patient was discharged with a planned acute‐care hospital inpatient readmission, without limitation as to when it will take place.[11] This code must be used at the time of the index admission to indicate that a future planned admission is expected, and was specified only to be used for neonates and patients with acute myocardial infarction. This approach, however, would omit planned readmissions that are not known to the initial discharging team, potentially missing planned readmissions. Conversely, some patients discharged with a plan for readmission may be unexpectedly readmitted for an unplanned reason. Given that the new codes were not available at the time we conducted the validation study, we were not able to determine how often the billing codes accurately identified planned readmissions. This would be an important area to consider for future study.
An alternative approach would be to create indicator codes to be applied at the time of readmission that would indicate whether that admission was planned or unplanned. Such a code would have the advantage of allowing each planned readmission to be flagged by the admitting clinicians at the time of admission rather than by an algorithm that inherently cannot be perfect. However, identifying planned readmissions at the time of readmission would also create opportunity for gaming and inconsistent application of definitions between hospitals; additional checks would need to be put in place to guard against these possibilities.
Our study has some limitations. We relied on the opinion of chart abstractors to determine whether a readmission was planned or unplanned; in a few cases, such as smoldering wounds that ultimately require surgical intervention, that determination is debatable. Abstractions were done at local institutions to minimize risks to patient privacy, and therefore we could not centrally verify determinations of planned status except by reviewing source of admission, dates of procedures, and narrative comments reported by the abstractors. Finally, we did not have sufficient volume of planned procedures to determine accuracy of the algorithm for less common procedure categories or individual procedures within categories.
In summary, we developed an algorithm to identify planned readmissions from administrative data that had high specificity and moderate sensitivity, and refined it based on chart validation. This algorithm is in use in public reporting of readmission measures to maximize the probability that the reported readmission rates represent truly unplanned readmissions.[12]
Disclosures: Financial supportThis work was performed under contract HHSM‐500‐2008‐0025I/HHSM‐500‐T0001, Modification No. 000008, titled Measure Instrument Development and Support, funded by the Centers for Medicare and Medicaid Services (CMS), an agency of the US Department of Health and Human Services. Drs. Horwitz and Ross are supported by the National Institute on Aging (K08 AG038336 and K08 AG032886, respectively) and by the American Federation for Aging Research through the Paul B. Beeson Career Development Award Program. Dr. Krumholz is supported by grant U01 HL105270‐05 (Center for Cardiovascular Outcomes Research at Yale University) from the National Heart, Lung, and Blood Institute. No funding source had any role in the study design; in the collection, analysis, and interpretation of data; or in the writing of the article. The CMS reviewed and approved the use of its data for this work and approved submission of the manuscript. All authors have completed the Unified Competing Interest form at
- , , , et al. Development, validation, and results of a measure of 30‐day readmission following hospitalization for pneumonia. J Hosp Med. 2011;6(3):142–150.
- , , , et al. An administrative claims measure suitable for profiling hospital performance based on 30‐day all‐cause readmission rates among patients with acute myocardial infarction. Circ Cardiovasc Qual Outcomes. 2011;4(2):243–252.
- , , , et al. An administrative claims measure suitable for profiling hospital performance on the basis of 30‐day all‐cause readmission rates among patients with heart failure. Circ Cardiovasc Qual Outcomes. 2008;1:29–37.
- , , , et al. Hospital‐level 30‐day all‐cause risk‐standardized readmission rate following elective primary total hip arthroplasty (THA) and/or total knee arthroplasty (TKA). Available at: http://www.qualitynet.org/dcs/ContentServer?c=Page161(supp10 l):S66–S75.
- , , A meta‐analysis of hospital 30‐day avoidable readmission rates. J Eval Clin Pract. 2011;18(6):1211–1218.
- , , , , Proportion of hospital readmissions deemed avoidable: a systematic review. CMAJ. 2011;183(7):E391–E402.
- , , , et al. Centers for Medicare 3(4):477–492.
- , Characteristics of hospitals receiving penalties under the Hospital Readmissions Reduction Program. JAMA. 2013;309(4):342–343.
- Centers for Medicare and Medicaid Services. Inpatient Prospective Payment System/Long‐Term Care Hospital (IPPS/LTCH) final rule. Fed Regist. 2013;78:50533–50534.
- , , Massachusetts health reforms: uninsurance remains low, self‐reported health status improves as state prepares to tackle costs. Health Aff (Millwood). 2012;31(2):444–451.
The Centers for Medicare & Medicaid Services (CMS) publicly reports all‐cause risk‐standardized readmission rates after acute‐care hospitalization for acute myocardial infarction, pneumonia, heart failure, total hip and knee arthroplasty, chronic obstructive pulmonary disease, stroke, and for patients hospital‐wide.[1, 2, 3, 4, 5] Ideally, these measures should capture unplanned readmissions that arise from acute clinical events requiring urgent rehospitalization. Planned readmissions, which are scheduled admissions usually involving nonurgent procedures, may not be a signal of quality of care. Including planned readmissions in readmission quality measures could create a disincentive to provide appropriate care to patients who are scheduled for elective or necessary procedures unrelated to the quality of the prior admission. Accordingly, under contract to the CMS, we were asked to develop an algorithm to identify planned readmissions. A version of this algorithm is now incorporated into all publicly reported readmission measures.
Given the widespread use of the planned readmission algorithm in public reporting and its implications for hospital quality measurement and evaluation, the objective of this study was to describe the development process, and to validate and refine the algorithm by reviewing charts of readmitted patients.
METHODS
Algorithm Development
To create a planned readmission algorithm, we first defined planned. We determined that readmissions for obstetrical delivery, maintenance chemotherapy, major organ transplant, and rehabilitation should always be considered planned in the sense that they are desired and/or inevitable, even if not specifically planned on a certain date. Apart from these specific types of readmissions, we defined planned readmissions as nonacute readmissions for scheduled procedures, because the vast majority of planned admissions are related to procedures. We also defined readmissions for acute illness or for complications of care as unplanned for the purposes of a quality measure. Even if such readmissions included a potentially planned procedure, because complications of care represent an important dimension of quality that should not be excluded from outcome measurement, these admissions should not be removed from the measure outcome. This definition of planned readmissions does not imply that all unplanned readmissions are unexpected or avoidable. However, it has proven very difficult to reliably define avoidable readmissions, even by expert review of charts, and we did not attempt to do so here.[6, 7]
In the second stage, we operationalized this definition into an algorithm. We used the Agency for Healthcare Research and Quality's Clinical Classification Software (CCS) codes to group thousands of individual procedure and diagnosis International Classification of Disease, Ninth Revision, Clinical Modification (ICD‐9‐CM) codes into clinically coherent, mutually exclusive procedure CCS categories and mutually exclusive diagnosis CCS categories, respectively. Clinicians on the investigative team reviewed the procedure categories to identify those that are commonly planned and that would require inpatient admission. We also reviewed the diagnosis categories to identify acute diagnoses unlikely to accompany elective procedures. We then created a flow diagram through which every readmission could be run to determine whether it was planned or unplanned based on our categorizations of procedures and diagnoses (Figure 1, and Supporting Information, Appendix A, in the online version of this article). This version of the algorithm (v1.0) was submitted to the National Quality Forum (NQF) as part of the hospital‐wide readmission measure. The measure (NQR #1789) received endorsement in April 2012.
In the third stage of development, we posted the algorithm for 2 public comment periods and recruited 27 outside experts to review and refine the algorithm following a standardized, structured process (see Supporting Information, Appendix B, in the online version of this article). Because the measures publicly report and hold hospitals accountable for unplanned readmission rates, we felt it most important that the algorithm include as few planned readmissions in the reported, unplanned outcome as possible (ie, have high negative predictive value). Therefore, in equivocal situations in which experts felt procedure categories were equally often planned or unplanned, we added those procedures to the potentially planned list. We also solicited feedback from hospitals on algorithm performance during a confidential test run of the hospital‐wide readmission measure in the fall of 2012. Based on all of this feedback, we made a number of changes to the algorithm, which was then identified as v2.1. Version 2.1 of the algorithm was submitted to the NQF as part of the endorsement process for the acute myocardial infarction and heart failure readmission measures and was endorsed by the NQF in January 2013. The algorithm (v2.1) is now applied, adapted if necessary, to all publicly reported readmission measures.[8]
Algorithm Validation: Study Cohort
We recruited 2 hospital systems to participate in a chart validation study of the accuracy of the planned readmission algorithm (v2.1). Within these 2 health systems, we selected 7 hospitals with varying bed size, teaching status, and safety‐net status. Each included 1 large academic teaching hospital that serves as a regional referral center. For each hospital's index admissions, we applied the inclusion and exclusion criteria from the hospital‐wide readmission measure. Index admissions were included for patients age 65 years or older; enrolled in Medicare fee‐for‐service (FFS); discharged from a nonfederal, short‐stay, acute‐care hospital or critical access hospital; without an in‐hospital death; not transferred to another acute‐care facility; and enrolled in Part A Medicare for 1 year prior to discharge. We excluded index admissions for patients without at least 30 days postdischarge enrollment in FFS Medicare, discharged against medical advice, admitted for medical treatment of cancer or primary psychiatric disease, admitted to a Prospective Payment System‐exempt cancer hospital, or who died during the index hospitalization. In addition, for this study, we included only index admissions that were followed by a readmission to a hospital within the participating health system between July 1, 2011 and June 30, 2012. Institutional review board approval was obtained from each of the participating health systems, which granted waivers of signed informed consent and Health Insurance Portability and Accountability Act waivers.
Algorithm Validation: Sample Size Calculation
We determined a priori that the minimum acceptable positive predictive value, or proportion of all readmissions the algorithm labels planned that are truly planned, would be 60%, and the minimum acceptable negative predictive value, or proportion of all readmissions the algorithm labels as unplanned that are truly unplanned, would be 80%. We calculated the sample size required to be confident of these values 10% and determined we would need a total of 291 planned charts and 162 unplanned charts. We inflated these numbers by 20% to account for missing or unobtainable charts for a total of 550 charts. To achieve this sample size, we included all eligible readmissions from all participating hospitals that were categorized as planned. At the 5 smaller hospitals, we randomly selected an equal number of unplanned readmissions occurring at any hospital in its healthcare system. At the 2 largest hospitals, we randomly selected 50 unplanned readmissions occurring at any hospital in its healthcare system.
Algorithm Validation: Data Abstraction
We developed an abstraction tool, tested and refined it using sample charts, and built the final the tool into a secure, password‐protected Microsoft Access 2007 (Microsoft Corp., Redmond, WA) database (see Supporting Information, Appendix C, in the online version of this article). Experienced chart abstractors with RN or MD degrees from each hospital site participated in a 1‐hour training session to become familiar with reviewing medical charts, defining planned/unplanned readmissions, and the data abstraction process. For each readmission, we asked abstractors to review as needed: emergency department triage and physician notes, admission history and physical, operative report, discharge summary, and/or discharge summary from a prior admission. The abstractors verified the accuracy of the administrative billing data, including procedures and principal diagnosis. In addition, they abstracted the source of admission and dates of all major procedures. Then the abstractors provided their opinion and supporting rationale as to whether a readmission was planned or unplanned. They were not asked to determine whether the readmission was preventable. To determine the inter‐rater reliability of data abstraction, an independent abstractor at each health system recoded a random sample of 10% of the charts.
Statistical Analysis
To ensure that we had obtained a representative sample of charts, we identified the 10 most commonly planned procedures among cases identified as planned by the algorithm in the validation cohort and then compared this with planned cases nationally. To confirm the reliability of the abstraction process, we used the kappa statistic to determine the inter‐rater reliability of the determination of planned or unplanned status. Additionally, the full study team, including 5 practicing clinicians, reviewed the details of every chart abstraction in which the algorithm was found to have misclassified the readmission as planned or unplanned. In 11 cases we determined that the abstractor had misunderstood the definition of planned readmission (ie, not all direct admissions are necessarily planned) and we reclassified the chart review assignment accordingly.
We calculated sensitivity, specificity, positive predictive value, and negative predictive value of the algorithm for the validation cohort as a whole, weighted to account for the prevalence of planned readmissions as defined by the algorithm in the national data (7.8%). Weighting is necessary because we did not obtain a pure random sample, but rather selected a stratified sample that oversampled algorithm‐identified planned readmissions.[9] We also calculated these rates separately for large hospitals (>600 beds) and for small hospitals (600 beds).
Finally, we examined performance of the algorithm for individual procedures and diagnoses to determine whether any procedures or diagnoses should be added or removed from the algorithm. First, we reviewed the diagnoses, procedures, and brief narratives provided by the abstractors for all cases in which the algorithm misclassified the readmission as either planned or unplanned. Second, we calculated the positive predictive value for each procedure that had been flagged as planned by the algorithm, and reviewed all readmissions (correctly and incorrectly classified) in which procedures with low positive predictive value took place. We also calculated the frequency with which the procedure was the only qualifying procedure resulting in an accurate or inaccurate classification. Third, to identify changes that should be made to the lists of acute and nonacute diagnoses, we reviewed the principal diagnosis for all readmissions misclassified by the algorithm as either planned or unplanned, and examined the specific ICD‐9‐CM codes within each CCS group that were most commonly associated with misclassifications.
After determining the changes that should be made to the algorithm based on these analyses, we recalculated the sensitivity, specificity, positive predictive value, and negative predictive value of the proposed revised algorithm (v3.0). All analyses used SAS version 9.3 (SAS Institute, Cary, NC).
RESULTS
Study Cohort
Characteristics of participating hospitals are shown in Table 1. Hospitals represented in this sample ranged in size, teaching status, and safety net status, although all were nonprofit. We selected 663 readmissions for review, 363 planned and 300 unplanned. Overall we were able to select 80% of hospitals planned cases for review; the remainder occurred at hospitals outside the participating hospital system. Abstractors were able to locate and review 634 (96%) of the eligible charts (range, 86%100% per hospital). The kappa statistic for inter‐rater reliability was 0.83.
| Description | Hospitals, N | Readmissions Selected for Review, N* | Readmissions Reviewed, N (% of Eligible) | Unplanned Readmissions Reviewed, N | Planned Readmissions Reviewed, N | % of Hospital's Planned Readmissions Reviewed* | |
|---|---|---|---|---|---|---|---|
| |||||||
| All hospitals | 7 | 663 | 634 (95.6) | 283 | 351 | 77.3 | |
| No. of beds | >600 | 2 | 346 | 339 (98.0) | 116 | 223 | 84.5 |
| >300600 | 2 | 190 | 173 (91.1) | 85 | 88 | 87.1 | |
| <300 | 3 | 127 | 122 (96.0) | 82 | 40 | 44.9 | |
| Ownership | Government | 0 | |||||
| For profit | 0 | ||||||
| Not for profit | 7 | 663 | 634 (95.6) | 283 | 351 | 77.3 | |
| Teaching status | Teaching | 2 | 346 | 339 (98.0) | 116 | 223 | 84.5 |
| Nonteaching | 5 | 317 | 295 (93.1) | 167 | 128 | 67.4 | |
| Safety net status | Safety net | 2 | 346 | 339 (98.0) | 116 | 223 | 84.5 |
| Nonsafety net | 5 | 317 | 295 (93.1) | 167 | 128 | 67.4 | |
| Region | New England | 3 | 409 | 392 (95.8) | 155 | 237 | 85.9 |
| South Central | 4 | 254 | 242 (95.3) | 128 | 114 | 64.0 | |
The study sample included 57/67 (85%) of the procedure or condition categories on the potentially planned list. The most common procedure CCS categories among planned readmissions (v2.1) in the validation cohort were very similar to those in the national dataset (see Supporting Information, Appendix D, in the online version of this article). Of the top 20 most commonly planned procedure CCS categories in the validation set, all but 2, therapeutic radiology for cancer treatment (CCS 211) and peripheral vascular bypass (CCS 55), were among the top 20 most commonly planned procedure CCS categories in the national data.
Test Characteristics of Algorithm
The weighted test characteristics of the current algorithm (v2.1) are shown in Table 2. Overall, the algorithm correctly identified 266 readmissions as unplanned and 181 readmissions as planned, and misidentified 170 readmissions as planned and 15 as unplanned. Once weighted to account for the stratified sampling design, the overall prevalence of true planned readmissions was 8.9% of readmissions. The weighted sensitivity was 45.1% overall and was higher in large teaching centers than in smaller community hospitals. The weighted specificity was 95.9%. The positive predictive value was 51.6%, and the negative predictive value was 94.7%.
| Cohort | Sensitivity | Specificity | Positive Predictive Value | Negative Predictive Value |
|---|---|---|---|---|
| Algorithm v2.1 | ||||
| Full cohort | 45.1% | 95.9% | 51.6% | 94.7% |
| Large hospitals | 50.9% | 96.1% | 53.8% | 95.6% |
| Small hospitals | 40.2% | 95.5% | 47.7% | 94.0% |
| Revised algorithm v3.0 | ||||
| Full cohort | 49.8% | 96.5% | 58.7% | 94.5% |
| Large hospitals | 57.1% | 96.8% | 63.0% | 95.9% |
| Small hospitals | 42.6% | 95.9% | 52.6% | 93.9% |
Accuracy of Individual Diagnoses and Procedures
The positive predictive value of the algorithm for individual procedure categories varied widely, from 0% to 100% among procedures with at least 10 cases (Table 3). The procedure for which the algorithm was least accurate was CCS 211, therapeutic radiology for cancer treatment (0% positive predictive value). By contrast, maintenance chemotherapy (90%) and other therapeutic procedures, hemic and lymphatic system (100%) were most accurate. Common procedures with less than 50% positive predictive value (ie, that the algorithm commonly misclassified as planned) were diagnostic cardiac catheterization (25%); debridement of wound, infection, or burn (25%); amputation of lower extremity (29%); insertion, revision, replacement, removal of cardiac pacemaker or cardioverter/defibrillator (33%); and other hernia repair (43%). Of these, diagnostic cardiac catheterization and cardiac devices are the first and second most common procedures nationally, respectively.
| Readmission Procedure CCS Code | Total Categorized as Planned by Algorithm, N | Verified as Planned by Chart Review, N | Positive Predictive Value |
|---|---|---|---|
| |||
| 47 Diagnostic cardiac catheterization; coronary arteriography | 44 | 11 | 25% |
| 224 Cancer chemotherapy | 40 | 22 | 55% |
| 157 Amputation of lower extremity | 31 | 9 | 29% |
| 49 Other operating room heart procedures | 27 | 16 | 59% |
| 48 Insertion, revision, replacement, removal of cardiac pacemaker or cardioverter/defibrillator | 24 | 8 | 33% |
| 43 Heart valve procedures | 20 | 16 | 80% |
| Maintenance chemotherapy (diagnosis CCS 45) | 20 | 18 | 90% |
| 78 Colorectal resection | 18 | 9 | 50% |
| 169 Debridement of wound, infection or burn | 16 | 4 | 25% |
| 84 Cholecystectomy and common duct exploration | 16 | 5 | 31% |
| 99 Other OR gastrointestinal therapeutic procedures | 16 | 8 | 50% |
| 158 Spinal fusion | 15 | 11 | 73% |
| 142 Partial excision bone | 14 | 10 | 71% |
| 86 Other hernia repair | 14 | 6 | 42% |
| 44 Coronary artery bypass graft | 13 | 10 | 77% |
| 67 Other therapeutic procedures, hemic and lymphatic system | 13 | 13 | 100% |
| 211 Therapeutic radiology for cancer treatment | 12 | 0 | 0% |
| 45 Percutaneous transluminal coronary angioplasty | 11 | 7 | 64% |
| Total | 497 | 272 | 54.7% |
The readmissions with least abstractor agreement were those involving CCS 157 (amputation of lower extremity) and CCS 169 (debridement of wound, infection or burn). Readmissions for these procedures were nearly always performed as a consequence of acute worsening of chronic conditions such as osteomyelitis or ulceration. Abstractors were divided over whether these readmissions were appropriate to call planned.
Changes to the Algorithm
We determined that the accuracy of the algorithm would be improved by removing 2 procedure categories from the planned procedure list (therapeutic radiation [CCS 211] and cancer chemotherapy [CCS 224]), adding 1 diagnosis category to the acute diagnosis list (hypertension with complications [CCS 99]), and splitting 2 diagnosis condition categories into acute and nonacute ICD‐9‐CM codes (pancreatic disorders [CCS 149] and biliary tract disease [CCS 152]). Detailed rationales for each modification to the planned readmission algorithm are described in Table 4. We felt further examination of diagnostic cardiac catheterization and cardiac devices was warranted given their high frequency, despite low positive predictive value. We also elected not to alter the categorization of amputation or debridement because it was not easy to determine whether these admissions were planned or unplanned even with chart review. We plan further analyses of these procedure categories.
| Action | Diagnosis or Procedure Category | Algorithm | Chart | N | Rationale for Change |
|---|---|---|---|---|---|
| |||||
| Remove from planned procedure list | Therapeutic radiation (CCS 211) | Accurate | The algorithm was inaccurate in every case. All therapeutic radiology during readmissions was performed because of acute illness (pain crisis, neurologic crisis) or because scheduled treatment occurred during an unplanned readmission. In national data, this ranks as the 25th most common planned procedure identified by the algorithm v2.1. | ||
| Planned | Planned | 0 | |||
| Unplanned | Unplanned | 0 | |||
| Inaccurate | |||||
| Unplanned | Planned | 0 | |||
| Planned | Unplanned | 12 | |||
| Cancer chemotherapy (CCS 224) | Accurate | Of the 22 correctly identified as planned, 18 (82%) would already have been categorized as planned because of a principal diagnosis of maintenance chemotherapy. Therefore, removing CCS 224 from the planned procedure list would only miss a small fraction of planned readmissions but would avoid a large number of misclassifications. In national data, this ranks as the 8th most common planned procedure identified by the algorithm v2.1. | |||
| Planned | Planned | 22 | |||
| Unplanned | Unplanned | 0 | |||
| Inaccurate | |||||
| Unplanned | Planned | 0 | |||
| Planned | Unplanned | 18 | |||
| Add to planned procedure list | None | The abstractors felt a planned readmission was missed by the algorithm in 15 cases. A handful of these cases were missed because the planned procedure was not on the current planned procedure list; however, those procedures (eg, abdominal paracentesis, colonoscopy, endoscopy) were nearly always unplanned overall and should therefore not be added as procedures that potentially qualify as an admission as planned. | |||
| Remove from acute diagnosis list | None | The abstractors felt a planned readmission was missed by the algorithm in 15 cases. The relevant disqualifying acute diagnoses were much more often associated with unplanned readmissions in our dataset. | |||
| Add to acute diagnosis list | Hypertension with complications (CCS 99) | Accurate | This CCS was associated with only 1 planned readmission (for elective nephrectomy, a very rare procedure). Every other time this CCS appeared in the dataset, it was associated with an unplanned readmission (12/13, 92%); 10 of those, however, were misclassified by the algorithm as planned because they were not excluded by diagnosis (91% error rate). Consequently, adding this CCS to the acute diagnosis list is likely to miss only a very small fraction of planned readmissions, while making the overall algorithm much more accurate. | ||
| Planned | Planned | 1 | |||
| Unplanned | Unplanned | 2 | |||
| Inaccurate | |||||
| Unplanned | Planned | 0 | |||
| Planned | Unplanned | 10 | |||
| Split diagnosis condition category into component ICD‐9 codes | Pancreatic disorders (CCS 152) | Accurate | ICD‐9 code 577.0 (acute pancreatitis) is the only acute code in this CCS. Acute pancreatitis was present in 2 cases that were misclassified as planned. Clinically, there is no situation in which a planned procedure would reasonably be performed in the setting of acute pancreatitis. Moving ICD‐9 code 577.0 to the acute list and leaving the rest of the ICD‐9 codes in CCS 152 on the nonacute list will enable the algorithm to continue to identify planned procedures for chronic pancreatitis. | ||
| Planned | Planned | 0 | |||
| Unplanned | Unplanned | 1 | |||
| Inaccurate | |||||
| Unplanned | Planned | 0 | |||
| Planned | Unplanned | 2 | |||
| Biliary tract disease (CCS 149) | Accurate | This CCS is a mix of acute and chronic diagnoses. Of 14 charts classified as planned with CCS 149 in the principal diagnosis field, 12 were misclassified (of which 10 were associated with cholecystectomy). Separating out the acute and nonacute diagnoses will increase the accuracy of the algorithm while still ensuring that planned cholecystectomies and other procedures can be identified. Of the ICD‐9 codes in CCS 149, the following will be added to the acute diagnosis list: 574.0, 574.3, 574.6, 574.8, 575.0, 575.12, 576.1. | |||
| Planned | Planned | 2 | |||
| Unplanned | Unplanned | 3 | |||
| Inaccurate | |||||
| Unplanned | Planned | 0 | |||
| Planned | Unplanned | 12 | |||
| Consider for change after additional study | Diagnostic cardiac catheterization (CCS 47) | Accurate | The algorithm misclassified as planned 25/38 (66%) unplanned readmissions in which diagnostic catheterizations were the only qualifying planned procedure. It also correctly identified 3/3 (100%) planned readmissions in which diagnostic cardiac catheterizations were the only qualifying planned procedure. This is the highest volume procedure in national data. | ||
| Planned | Planned | 3* | |||
| Unplanned | Unplanned | 13* | |||
| Inaccurate | |||||
| Unplanned | Planned | 0* | |||
| Planned | Unplanned | 25* | |||
| Insertion, revision, replacement, removal of cardiac pacemaker or cardioverter/defibrillator (CCS 48) | Accurate | The algorithm misclassified as planned 4/5 (80%) unplanned readmissions in which cardiac devices were the only qualifying procedure. However, it also correctly identified 7/8 (87.5%) planned readmissions in which cardiac devices were the only qualifying planned procedure. CCS 48 is the second most common planned procedure category nationally. | |||
| Planned | Planned | 7 | |||
| Unplanned | Unplanned | 1 | |||
| Inaccurate | |||||
| Unplanned | Planned | 1 | |||
| Planned | Unplanned | 4 | |||
The revised algorithm (v3.0) had a weighted sensitivity of 49.8%, weighted specificity of 96.5%, positive predictive value of 58.7%, and negative predictive value of 94.5% (Table 2). In aggregate, these changes would increase the reported unplanned readmission rate from 16.0% to 16.1% in the hospital‐wide readmission measure, using 2011 to 2012 data, and would decrease the fraction of all readmissions considered planned from 7.8% to 7.2%.
DISCUSSION
We developed an algorithm based on administrative data that in its currently implemented form is very accurate at identifying unplanned readmissions, ensuring that readmissions included in publicly reported readmission measures are likely to be truly unplanned. However, nearly half of readmissions the algorithm classifies as planned are actually unplanned. That is, the algorithm is overcautious in excluding unplanned readmissions that could have counted as outcomes, particularly among admissions that include diagnostic cardiac catheterization or placement of cardiac devices (pacemakers, defibrillators). However, these errors only occur within the 7.8% of readmissions that are classified as planned and therefore do not affect overall readmission rates dramatically. A perfect algorithm would reclassify approximately half of these planned readmissions as unplanned, increasing the overall readmission rate by 0.6 percentage points.
On the other hand, the algorithm also only identifies approximately half of true planned readmissions as planned. Because the true prevalence of planned readmissions is low (approximately 9% of readmissions based on weighted chart review prevalence, or an absolute rate of 1.4%), this low sensitivity has a small effect on algorithm performance. Removing all true planned readmissions from the measure outcome would decrease the overall readmission rate by 0.8 percentage points, similar to the expected 0.6 percentage point increase that would result from better identifying unplanned readmissions; thus, a perfect algorithm would likely decrease the reported unplanned readmission rate by a net 0.2%. Overall, the existing algorithm appears to come close to the true prevalence of planned readmissions, despite inaccuracy on an individual‐case basis. The algorithm performed best at large hospitals, which are at greatest risk of being statistical outliers and of accruing penalties under the Hospital Readmissions Reduction Program.[10]
We identified several changes that marginally improved the performance of the algorithm by reducing the number of unplanned readmissions that are incorrectly removed from the measure, while avoiding the inappropriate inclusion of planned readmissions in the outcome. This revised algorithm, v3.0, was applied to public reporting of readmission rates at the end of 2014. Overall, implementing these changes increases the reported readmission rate very slightly. We also identified other procedures associated with high inaccuracy rates, removal of which would have larger impact on reporting rates, and which therefore merit further evaluation.
There are other potential methods of identifying planned readmissions. For instance, as of October 1, 2013, new administrative billing codes were created to allow hospitals to indicate that a patient was discharged with a planned acute‐care hospital inpatient readmission, without limitation as to when it will take place.[11] This code must be used at the time of the index admission to indicate that a future planned admission is expected, and was specified only to be used for neonates and patients with acute myocardial infarction. This approach, however, would omit planned readmissions that are not known to the initial discharging team, potentially missing planned readmissions. Conversely, some patients discharged with a plan for readmission may be unexpectedly readmitted for an unplanned reason. Given that the new codes were not available at the time we conducted the validation study, we were not able to determine how often the billing codes accurately identified planned readmissions. This would be an important area to consider for future study.
An alternative approach would be to create indicator codes to be applied at the time of readmission that would indicate whether that admission was planned or unplanned. Such a code would have the advantage of allowing each planned readmission to be flagged by the admitting clinicians at the time of admission rather than by an algorithm that inherently cannot be perfect. However, identifying planned readmissions at the time of readmission would also create opportunity for gaming and inconsistent application of definitions between hospitals; additional checks would need to be put in place to guard against these possibilities.
Our study has some limitations. We relied on the opinion of chart abstractors to determine whether a readmission was planned or unplanned; in a few cases, such as smoldering wounds that ultimately require surgical intervention, that determination is debatable. Abstractions were done at local institutions to minimize risks to patient privacy, and therefore we could not centrally verify determinations of planned status except by reviewing source of admission, dates of procedures, and narrative comments reported by the abstractors. Finally, we did not have sufficient volume of planned procedures to determine accuracy of the algorithm for less common procedure categories or individual procedures within categories.
In summary, we developed an algorithm to identify planned readmissions from administrative data that had high specificity and moderate sensitivity, and refined it based on chart validation. This algorithm is in use in public reporting of readmission measures to maximize the probability that the reported readmission rates represent truly unplanned readmissions.[12]
Disclosures: Financial supportThis work was performed under contract HHSM‐500‐2008‐0025I/HHSM‐500‐T0001, Modification No. 000008, titled Measure Instrument Development and Support, funded by the Centers for Medicare and Medicaid Services (CMS), an agency of the US Department of Health and Human Services. Drs. Horwitz and Ross are supported by the National Institute on Aging (K08 AG038336 and K08 AG032886, respectively) and by the American Federation for Aging Research through the Paul B. Beeson Career Development Award Program. Dr. Krumholz is supported by grant U01 HL105270‐05 (Center for Cardiovascular Outcomes Research at Yale University) from the National Heart, Lung, and Blood Institute. No funding source had any role in the study design; in the collection, analysis, and interpretation of data; or in the writing of the article. The CMS reviewed and approved the use of its data for this work and approved submission of the manuscript. All authors have completed the Unified Competing Interest form at
- , , , et al. Development, validation, and results of a measure of 30‐day readmission following hospitalization for pneumonia. J Hosp Med. 2011;6(3):142–150.
- , , , et al. An administrative claims measure suitable for profiling hospital performance based on 30‐day all‐cause readmission rates among patients with acute myocardial infarction. Circ Cardiovasc Qual Outcomes. 2011;4(2):243–252.
- , , , et al. An administrative claims measure suitable for profiling hospital performance on the basis of 30‐day all‐cause readmission rates among patients with heart failure. Circ Cardiovasc Qual Outcomes. 2008;1:29–37.
- , , , et al. Hospital‐level 30‐day all‐cause risk‐standardized readmission rate following elective primary total hip arthroplasty (THA) and/or total knee arthroplasty (TKA). Available at: http://www.qualitynet.org/dcs/ContentServer?c=Page161(supp10 l):S66–S75.
- , , A meta‐analysis of hospital 30‐day avoidable readmission rates. J Eval Clin Pract. 2011;18(6):1211–1218.
- , , , , Proportion of hospital readmissions deemed avoidable: a systematic review. CMAJ. 2011;183(7):E391–E402.
- , , , et al. Centers for Medicare 3(4):477–492.
- , Characteristics of hospitals receiving penalties under the Hospital Readmissions Reduction Program. JAMA. 2013;309(4):342–343.
- Centers for Medicare and Medicaid Services. Inpatient Prospective Payment System/Long‐Term Care Hospital (IPPS/LTCH) final rule. Fed Regist. 2013;78:50533–50534.
- , , Massachusetts health reforms: uninsurance remains low, self‐reported health status improves as state prepares to tackle costs. Health Aff (Millwood). 2012;31(2):444–451.
© 2015 Society of Hospital Medicine
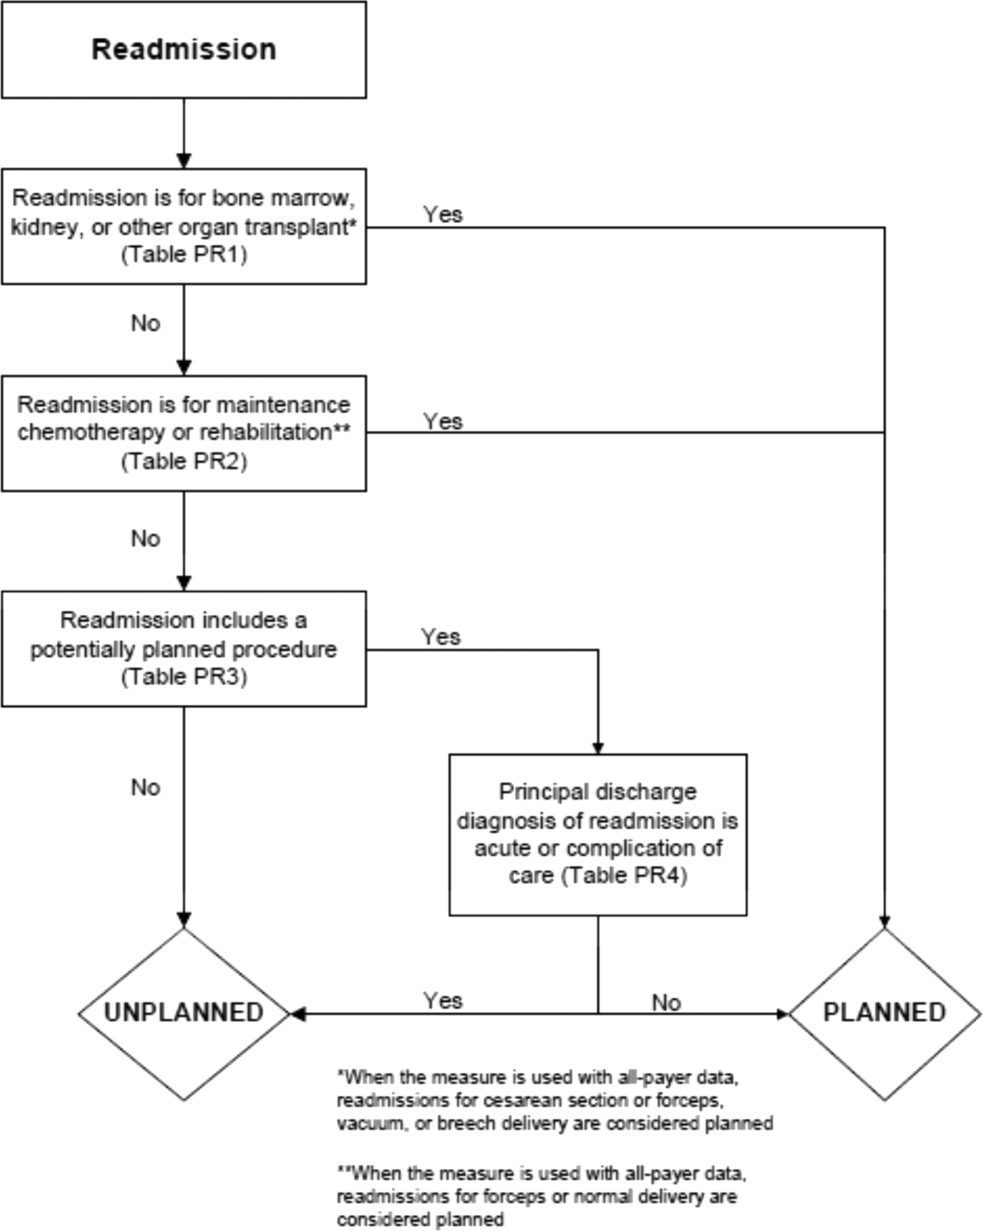
Risk After Hospitalization
The immediate period after hospital discharge is dangerous. Patients' health, often marginal at best, frequently deteriorates, sending them to the emergency department,[1] back to the hospital inpatient service,[2] or into a period of functional decline.[3, 4] Among older patients hospitalized with heart failure, for example, death is even more common in the month following discharge than during the initial hospital stay.[5, 6] Vulnerabilities in this period are many, and patients are susceptible to deterioration in health from a broad spectrum of conditions, not just the initial illness that triggered hospitalization.[7] This period has been labeled posthospital syndrome, as it appears that patients have an acquired, transient period of generalized risk to a wide range of medical problems.[8] As recognition of these risks has increased, the goal of improved short‐term outcomes after hospitalization has become a focus for providers, payers, and policymakers.[9]
In this issue of the Journal of Hospital Medicine, McAlister and colleagues10 ask whether short‐term vulnerability after hospitalization is related to weekend versus weekday discharge. After examining almost 8000 patients discharged from the general medical wards of 7 teaching hospitals in Alberta, Canada, the authors found that only 1 in 7 were discharged on weekends, defined as Saturday or Sunday. Patients discharged on the weekend were younger, had fewer chronic health conditions, and shorter average lengths of stay. In analyses adjusted for patient demographics and a measure of short‐term risk after hospitalization (LACE score [length of hospital stay, acuity of admission, comorbidity burden quantified using the Charlson Comorbidity Index, and emergency department visits in the 6 months prior to admission]), weekend discharge was not associated with higher rates of unplanned readmission or death at 30 days.
Most strikingly, only the healthiest patients were discharged on weekends. These results are similar to findings from the authors' previous work on patients hospitalized with heart failure.[11] Yet the implications for discharge planning are much less clear, as the few analyses of discharge day from the authors[11] and others[12] do not account for the range of factors that may influence risk after hospitalization such as patients' clinical characteristics, the quality of both hospital and transitional care, and the posthospital environments to which patients are discharged. Not surprisingly, different methodological approaches have shown weekend discharge to be associated with a range of outcomes including lower,[12] identical,[10] and higher[11] rates of unplanned readmission and death. Moreover, the influence of discharge timing itself is likely to involve further complexities including patients' readiness for discharge,[13] the specific days of the week on which both admission and discharge occur,[14] and the outpatient resources made available to patients by specific health insurance carriers.[14]
These studies illustrate a fundamental issue with our efforts to reduce short‐term readmission, namely, that we do not understand which factors most influence risk.[15] Prediction models have generally focused on traditional markers of risk including patients' demographic characteristics, their physical examination findings, and laboratory test results. Although models based on these variables are often excellent at discriminating between patients who are likely to die soon after hospitalization, their ability to identify specific patients who will be rehospitalized has been mediocre.[16, 17] This difficulty with prediction suggests that readmission has far more complex determinants than death in the short‐term period after hospitalization. Unfortunately, we have yet to identify and model the factors that matter most.
Where should we look to find these additional sources of vulnerability after hospitalization? Previous research has made clear that we are unlikely to find single markers of risk that adequately predict the future. Rather, we will need to develop more complete understandings of patients including their dynamics of recovery, the role of the hospital environment in prolonging or instigating further vulnerability, the manners by which organizational context and implementation strategies impact transitional care, and the ways in which social and environmental factors hasten or retard recovery. For each of these categories, there are multiple specific questions to address. The following are illustrative examples.
PATIENT FACTORS
What is the role of multiple chronic conditions in risk after discharge? Are specific clusters of chronic diseases particularly correlated with adverse health events? Moreover, how do common impairments and syndromes in older persons, such as cognitive impairment, functional impairment, difficulty with walking, sleep disturbance, and frailty, contribute to posthospitalization vulnerability? Would measurements of mobility and function immediately after discharge provide additional value in risk stratification beyond such measurements made during hospitalization?
HOSPITAL ENVIRONMENT
How does ambient sound, ambient light, shared rooms, and frequent awakening for vital signs checks, diagnostic tests, or medication administration affect sleep duration and quality, incident delirium, and in‐hospital complications? What influence do these factors have on postdischarge recovery of baseline sleep patterns and cognition? How does forced immobility from bed rest or restraints influence recovery of muscle mass and the function of arms and legs after discharge? How does fasting prior to diagnostic tests or therapeutic interventions impact recovery of weight, recovery of strength, and susceptibility to further illnesses after hospitalization?
CARE TRANSITIONS
What are the influences of organizational context on the success or failure of specific transitional care interventions? What is the relative importance of senior managerial commitment to improving postdischarge outcomes, the presence of local champions for quality, and an organization's culture of learning, collaboration, and belief in shared accountability? How does the particular way in which a program is implemented and managed with regard to its staffing, education of key personnel, available resources, methods for data collection, measurement of results, and approach to continuous quality improvement relate to its ability to reduce readmission?
SOCIAL AND ENVIRONMENTAL FACTORS
What particular types of emotional, informational, and instrumental supports are most critical after hospitalization to avoid subsequent adverse health events? How do financial issues contribute to difficulties with follow‐up care and medication management, adherence to dietary and activity recommendations, and levels of stress and anxiety following discharge? How does the home environment mitigate or exacerbate new vulnerabilities after hospitalization?
Ultimately, an improved understanding of the breadth of factors that predict recurrent medical illness after discharge, as signaled by readmission, and the manner in which they confer risk will improve both risk prediction and efforts to mitigate vulnerability after hospitalization. Ultimately, we need to learn how to align our hospital environments, transitional care interventions, and strategies for longitudinal engagement in ways that improve patients' recovery. The work by McAlister and colleagues[10] is a step in the right direction, as it breaks with the exclusive examination of traditional patient factors to incorporate complexities associated with discharge timing. Such investigations are necessary to truly understand the myriad sources of risk and recovery after hospital discharge.
ACKNOWLEDGMENTS
Disclosures: Dr. Dharmarajan is supported by grant K23AG048331‐01 from the National Institute on Aging and the American Federation for Aging Research through the Paul B. Beeson Career Development Award Program. Dr. Krumholz is supported by grant 1U01HL105270‐05 (Center for Cardiovascular Outcomes Research at Yale University) from the National Heart, Lung, and Blood Institute. The content is solely the responsibility of the authors and does not represent the official views of the National Institute on Aging; National Heart, Lung, and Blood Institute; or American Federation for Aging Research. Drs. Dharmarajan and Krumholz work under contract with the Centers for Medicare & Medicaid Services to develop and maintain performance measures. Dr. Krumholz is the chair of a cardiac scientific advisory board for UnitedHealth and is the recipient of research grants from Medtronic and from Johnson & Johnson, through Yale University, to develop methods of clinical trial data sharing.
- , , , et al. Use of hospital‐based acute care among patients recently discharged from the hospital. JAMA. 2013;309:364–371.
- , , . Rehospitalizations among patients in the Medicare fee‐for‐service program. N Engl J Med. 2009;360:1418–1428.
- , , , . Hospitalization, restricted activity, and the development of disability among older persons. JAMA. 2004;292:2115–2124.
- , , , . Change in disability after hospitalization or restricted activity in older persons. JAMA. 2010;304:1919–1928.
- , , , et al. Trends in length of stay and short‐term outcomes among Medicare patients hospitalized for heart failure, 1993–2006. JAMA. 2010;303:2141–2147.
- , , , et al. Comparison of hospital risk‐standardized mortality rates calculated by using in‐hospital and 30‐day models: an observational study with implications for hospital profiling. Ann Intern Med. 2012;156:19–26.
- , , , et al. Diagnoses and timing of 30‐day readmissions after hospitalization for heart failure, acute myocardial infarction, or pneumonia. JAMA. 2013;309:355–363.
- . Post‐hospital syndrome—an acquired, transient condition of generalized risk. N Engl J Med. 2013;368:100–102.
- , . Hospital readmissions and the Affordable Care Act: paying for coordinated quality care. JAMA. 2011;306:1794–1795.
- , , , . Post‐discharge outcomes are similar for weekend versus weekday discharges for general internal medicine patients admitted to teaching hospitals. J Hosp Med. 2015;10(2):69–74.
- , , , , . Postdischarge outcomes in heart failure are better for teaching hospitals and weekday discharges. Circ Heart Fail. 2013;6:922–929.
- , . Risk of death or readmission among people discharged from hospital on Fridays. CMAJ. 2002;166:1672–1673.
- , , , et al. Predictors of short‐term rehospitalization following discharge of patients hospitalized with community‐acquired pneumonia. Chest. 2009;136:1079–1085.
- , , . Should hospitals keep their patients longer? The role of inpatient and outpatient care in reducing readmissions. NBER working paper no. 20499. Cambridge, MA: National Bureau of Economic Research; 2014.
- , , , et al. Risk prediction models for hospital readmission: a systematic review. JAMA. 2011;306:1688–1698.
- , . Strategies to reduce 30‐day readmissions in older patients hospitalized with heart failure and acute myocardial infarction. Curr Geri Rep. 2014;3:306–315.
- , , . Postdischarge environment following heart failure hospitalization: expanding the view of hospital readmission. J Am Heart Assoc. 2013;2:e000116.
The immediate period after hospital discharge is dangerous. Patients' health, often marginal at best, frequently deteriorates, sending them to the emergency department,[1] back to the hospital inpatient service,[2] or into a period of functional decline.[3, 4] Among older patients hospitalized with heart failure, for example, death is even more common in the month following discharge than during the initial hospital stay.[5, 6] Vulnerabilities in this period are many, and patients are susceptible to deterioration in health from a broad spectrum of conditions, not just the initial illness that triggered hospitalization.[7] This period has been labeled posthospital syndrome, as it appears that patients have an acquired, transient period of generalized risk to a wide range of medical problems.[8] As recognition of these risks has increased, the goal of improved short‐term outcomes after hospitalization has become a focus for providers, payers, and policymakers.[9]
In this issue of the Journal of Hospital Medicine, McAlister and colleagues10 ask whether short‐term vulnerability after hospitalization is related to weekend versus weekday discharge. After examining almost 8000 patients discharged from the general medical wards of 7 teaching hospitals in Alberta, Canada, the authors found that only 1 in 7 were discharged on weekends, defined as Saturday or Sunday. Patients discharged on the weekend were younger, had fewer chronic health conditions, and shorter average lengths of stay. In analyses adjusted for patient demographics and a measure of short‐term risk after hospitalization (LACE score [length of hospital stay, acuity of admission, comorbidity burden quantified using the Charlson Comorbidity Index, and emergency department visits in the 6 months prior to admission]), weekend discharge was not associated with higher rates of unplanned readmission or death at 30 days.
Most strikingly, only the healthiest patients were discharged on weekends. These results are similar to findings from the authors' previous work on patients hospitalized with heart failure.[11] Yet the implications for discharge planning are much less clear, as the few analyses of discharge day from the authors[11] and others[12] do not account for the range of factors that may influence risk after hospitalization such as patients' clinical characteristics, the quality of both hospital and transitional care, and the posthospital environments to which patients are discharged. Not surprisingly, different methodological approaches have shown weekend discharge to be associated with a range of outcomes including lower,[12] identical,[10] and higher[11] rates of unplanned readmission and death. Moreover, the influence of discharge timing itself is likely to involve further complexities including patients' readiness for discharge,[13] the specific days of the week on which both admission and discharge occur,[14] and the outpatient resources made available to patients by specific health insurance carriers.[14]
These studies illustrate a fundamental issue with our efforts to reduce short‐term readmission, namely, that we do not understand which factors most influence risk.[15] Prediction models have generally focused on traditional markers of risk including patients' demographic characteristics, their physical examination findings, and laboratory test results. Although models based on these variables are often excellent at discriminating between patients who are likely to die soon after hospitalization, their ability to identify specific patients who will be rehospitalized has been mediocre.[16, 17] This difficulty with prediction suggests that readmission has far more complex determinants than death in the short‐term period after hospitalization. Unfortunately, we have yet to identify and model the factors that matter most.
Where should we look to find these additional sources of vulnerability after hospitalization? Previous research has made clear that we are unlikely to find single markers of risk that adequately predict the future. Rather, we will need to develop more complete understandings of patients including their dynamics of recovery, the role of the hospital environment in prolonging or instigating further vulnerability, the manners by which organizational context and implementation strategies impact transitional care, and the ways in which social and environmental factors hasten or retard recovery. For each of these categories, there are multiple specific questions to address. The following are illustrative examples.
PATIENT FACTORS
What is the role of multiple chronic conditions in risk after discharge? Are specific clusters of chronic diseases particularly correlated with adverse health events? Moreover, how do common impairments and syndromes in older persons, such as cognitive impairment, functional impairment, difficulty with walking, sleep disturbance, and frailty, contribute to posthospitalization vulnerability? Would measurements of mobility and function immediately after discharge provide additional value in risk stratification beyond such measurements made during hospitalization?
HOSPITAL ENVIRONMENT
How does ambient sound, ambient light, shared rooms, and frequent awakening for vital signs checks, diagnostic tests, or medication administration affect sleep duration and quality, incident delirium, and in‐hospital complications? What influence do these factors have on postdischarge recovery of baseline sleep patterns and cognition? How does forced immobility from bed rest or restraints influence recovery of muscle mass and the function of arms and legs after discharge? How does fasting prior to diagnostic tests or therapeutic interventions impact recovery of weight, recovery of strength, and susceptibility to further illnesses after hospitalization?
CARE TRANSITIONS
What are the influences of organizational context on the success or failure of specific transitional care interventions? What is the relative importance of senior managerial commitment to improving postdischarge outcomes, the presence of local champions for quality, and an organization's culture of learning, collaboration, and belief in shared accountability? How does the particular way in which a program is implemented and managed with regard to its staffing, education of key personnel, available resources, methods for data collection, measurement of results, and approach to continuous quality improvement relate to its ability to reduce readmission?
SOCIAL AND ENVIRONMENTAL FACTORS
What particular types of emotional, informational, and instrumental supports are most critical after hospitalization to avoid subsequent adverse health events? How do financial issues contribute to difficulties with follow‐up care and medication management, adherence to dietary and activity recommendations, and levels of stress and anxiety following discharge? How does the home environment mitigate or exacerbate new vulnerabilities after hospitalization?
Ultimately, an improved understanding of the breadth of factors that predict recurrent medical illness after discharge, as signaled by readmission, and the manner in which they confer risk will improve both risk prediction and efforts to mitigate vulnerability after hospitalization. Ultimately, we need to learn how to align our hospital environments, transitional care interventions, and strategies for longitudinal engagement in ways that improve patients' recovery. The work by McAlister and colleagues[10] is a step in the right direction, as it breaks with the exclusive examination of traditional patient factors to incorporate complexities associated with discharge timing. Such investigations are necessary to truly understand the myriad sources of risk and recovery after hospital discharge.
ACKNOWLEDGMENTS
Disclosures: Dr. Dharmarajan is supported by grant K23AG048331‐01 from the National Institute on Aging and the American Federation for Aging Research through the Paul B. Beeson Career Development Award Program. Dr. Krumholz is supported by grant 1U01HL105270‐05 (Center for Cardiovascular Outcomes Research at Yale University) from the National Heart, Lung, and Blood Institute. The content is solely the responsibility of the authors and does not represent the official views of the National Institute on Aging; National Heart, Lung, and Blood Institute; or American Federation for Aging Research. Drs. Dharmarajan and Krumholz work under contract with the Centers for Medicare & Medicaid Services to develop and maintain performance measures. Dr. Krumholz is the chair of a cardiac scientific advisory board for UnitedHealth and is the recipient of research grants from Medtronic and from Johnson & Johnson, through Yale University, to develop methods of clinical trial data sharing.
- , , , et al. Use of hospital‐based acute care among patients recently discharged from the hospital. JAMA. 2013;309:364–371.
- , , . Rehospitalizations among patients in the Medicare fee‐for‐service program. N Engl J Med. 2009;360:1418–1428.
- , , , . Hospitalization, restricted activity, and the development of disability among older persons. JAMA. 2004;292:2115–2124.
- , , , . Change in disability after hospitalization or restricted activity in older persons. JAMA. 2010;304:1919–1928.
- , , , et al. Trends in length of stay and short‐term outcomes among Medicare patients hospitalized for heart failure, 1993–2006. JAMA. 2010;303:2141–2147.
- , , , et al. Comparison of hospital risk‐standardized mortality rates calculated by using in‐hospital and 30‐day models: an observational study with implications for hospital profiling. Ann Intern Med. 2012;156:19–26.
- , , , et al. Diagnoses and timing of 30‐day readmissions after hospitalization for heart failure, acute myocardial infarction, or pneumonia. JAMA. 2013;309:355–363.
- . Post‐hospital syndrome—an acquired, transient condition of generalized risk. N Engl J Med. 2013;368:100–102.
- , . Hospital readmissions and the Affordable Care Act: paying for coordinated quality care. JAMA. 2011;306:1794–1795.
- , , , . Post‐discharge outcomes are similar for weekend versus weekday discharges for general internal medicine patients admitted to teaching hospitals. J Hosp Med. 2015;10(2):69–74.
- , , , , . Postdischarge outcomes in heart failure are better for teaching hospitals and weekday discharges. Circ Heart Fail. 2013;6:922–929.
- , . Risk of death or readmission among people discharged from hospital on Fridays. CMAJ. 2002;166:1672–1673.
- , , , et al. Predictors of short‐term rehospitalization following discharge of patients hospitalized with community‐acquired pneumonia. Chest. 2009;136:1079–1085.
- , , . Should hospitals keep their patients longer? The role of inpatient and outpatient care in reducing readmissions. NBER working paper no. 20499. Cambridge, MA: National Bureau of Economic Research; 2014.
- , , , et al. Risk prediction models for hospital readmission: a systematic review. JAMA. 2011;306:1688–1698.
- , . Strategies to reduce 30‐day readmissions in older patients hospitalized with heart failure and acute myocardial infarction. Curr Geri Rep. 2014;3:306–315.
- , , . Postdischarge environment following heart failure hospitalization: expanding the view of hospital readmission. J Am Heart Assoc. 2013;2:e000116.
Quantifying Treatment Intensity
Healthcare spending exceeded $2.5 trillion in 2007, and payments to hospitals represented the largest portion of this spending (more than 30%), equaling the combined cost of physician services and prescription drugs.[1, 2] Researchers and policymakers have emphasized the need to improve the value of hospital care in the United States, but this has been challenging, in part because of the difficulty in identifying hospitals that have high resource utilization relative to their peers.[3, 4, 5, 6, 7, 8, 9, 10, 11]
Most hospitals calculate their costs using internal accounting systems that determine resource utilization via relative value units (RVUs).[7, 8] RVU‐derived costs, also known as hospital reported costs, have proven to be an excellent method for quantifying what it costs a given hospital to provide a treatment, test, or procedure. However, RVU‐based costs are less useful for comparing resource utilization across hospitals because the cost to provide a treatment or service varies widely across hospitals. The cost of an item calculated using RVUs includes not just the item itself, but also a portion of the fixed costs of the hospital (overhead, labor, and infrastructure investments such as electronic records, new buildings, or expensive radiological or surgical equipment).[12] These costs vary by institution, patient population, region of the country, teaching status, and many other variables, making it difficult to identify resource utilization across hospitals.[13, 14]
Recently, a few claims‐based multi‐institutional datasets have begun incorporating item‐level RVU‐based costs derived directly from the cost accounting systems of participating institutions.[15] Such datasets allow researchers to compare reported costs of care from hospital to hospital, but because of the limitations we described above, they still cannot be used to answer the question: Which hospitals with higher costs of care are actually providing more treatments and services to patients?
To better facilitate the comparison of resource utilization patterns across hospitals, we standardized the unit costs of all treatments and services across hospitals by applying a single cost to every item across hospitals. This standardized cost allowed to compare utilization of that item (and the 15,000 other items in the database) across hospitals. We then compared estimates of resource utilization as measured by the 2 approaches: standardized and RVU‐based costs.
METHODS
Ethics Statement
All data were deidentified, by Premier, Inc., at both the hospital and patient level in accordance with the Health Insurance Portability and Accountability Act. The Yale University Human Investigation Committee reviewed the protocol for this study and determined that it is not considered to be human subjects research as defined by the Office of Human Research Protections.
Data Source
We conducted a cross‐sectional study using data from hospitals that participated in the database maintained by Premier Healthcare Informatics (Charlotte, NC) in the years 2009 to 2010. The Premier database is a voluntary, fee‐supported database created to measure quality and healthcare utilization.[3, 16, 17, 18] In 2010, it included detailed billing data from 500 hospitals in the United States, with more than 130 million cumulative hospital discharges. The detailed billing data includes all elements found in hospital claims derived from the uniform billing‐04 form, as well as an itemized, date‐stamped log of all items and services charged to the patient or insurer, such as medications, laboratory tests, and diagnostic and therapeutic services. The database includes approximately 15% of all US hospitalizations. Participating hospitals are similar to the composition of acute care hospitals nationwide. They represent all regions of the United States, and represent predominantly small‐ to mid‐sized nonteaching facilities that serve a largely urban population. The database also contains hospital reported costs at the item level as well as the total cost of the hospitalization. Approximately 75% of hospitals that participate submit RVU‐based costs taken from internal cost accounting systems. Because of our focus on comparing standardized costs to reported costs, we included only data from hospitals that use RVU‐based costs in this study.
Study Subjects
We included adult patients with a hospitalization recorded in the Premier database between January 1, 2009 and December 31, 2010, and a principal discharge diagnosis of heart failure (HF) (International Classification of Diseases, Ninth Revision, Clinical Modification codes: 402.01, 402.11, 402.91, 404.01, 404.03, 404.11, 404.13, 404.91, 404.93, 428.xx). We excluded transfers, patients assigned a pediatrician as the attending of record, and those who received a heart transplant or ventricular assist device during their stay. Because cost data are prone to extreme outliers, we excluded hospitalizations that were in the top 0.1% of length of stay, number of billing records, quantity of items billed, or total standardized cost. We also excluded hospitals that admitted fewer than 25 HF patients during the study period to reduce the possibility that a single high‐cost patient affected the hospital's cost profile.
Hospital Information
For each hospital included in the study, we recorded number of beds, teaching status, geographic region, and whether it served an urban or rural population.
Assignment of Standardized Costs
We defined reported cost as the RVU‐based cost per item in the database. We then calculated the median across hospitals for each item in the database and set this as the standardized unit cost of that item at every hospital (Figure 1). Once standardized costs were assigned at the item level, we summed the costs of all items assigned to each patient and calculated the standardized cost of a hospitalization per patient at each hospital.

Examination of Cost Variation
We compared the standardized and reported costs of hospitalizations using medians, interquartile ranges, and interquartile ratios (Q75/Q25). To examine whether standardized costs can reduce the noise due to differences in overhead and other fixed costs, we calculated, for each hospital, the coefficients of variation (CV) for per‐day reported and standardized costs and per‐hospitalization reported and standardized costs. We used the Fligner‐Killeen test to determine whether the variance of CVs was different for reported and standardized costs.[19]
Creation of Basket of Goods
Because there can be differences in the costs of items, the number and types of items administered during hospitalizations, 2 hospitals with similar reported costs for a hospitalization might deliver different quantities and combinations of treatments (Figure 1). We wished to demonstrate that there is variation in reported costs of items when the quantity and type of item is held constant, so we created a basket of items. We chose items that are commonly administered to patients with heart failure, but could have chosen any combination of items. The basket included a day of medical room and board, a day of intensive care unit (ICU) room and board, a single dose of ‐blocker, a single dose of angiotensin‐converting enzyme inhibitor, complete blood count, a B‐natriuretic peptide level, a chest radiograph, a chest computed tomography, and an echocardiogram. We then examined the range of hospitals' reported costs for this basket of goods using percentiles, medians, and interquartile ranges.
Reported to Standardized Cost Ratio
Next, we calculated standardized costs of hospitalizations for included hospitals and examined the relationship between hospitals' mean reported costs and mean standardized costs. This ratio could help diagnose the mechanism of high reported costs for a hospital, because high reported costs with low utilization would indicate high fixed costs, while high reported costs with high utilization would indicate greater use of tests and treatments. We assigned hospitals to strata based on reported costs greater than standardized costs by more than 25%, reported costs within 25% of standardized costs, and reported costs less than standardized costs by more than 25%. We examined the association between hospital characteristics and strata using a 2 test. All analyses were carried out using SAS version 9.3 (SAS Institute Inc., Cary, NC).
RESULTS
The 234 hospitals included in the analysis contributed a total of 165,647 hospitalizations, with the number of hospitalizations ranging from 33 to 2,772 hospitalizations per hospital (see Supporting Table 1 in the online version of this article). Most were located in urban areas (84%), and many were in the southern United States (42%). The median hospital reported cost per hospitalization was $6,535, with an interquartile range of $5,541 to $7,454. The median standardized cost per hospitalization was $6,602, with a range of $5,866 to $7,386. The interquartile ratio (Q75/Q25) of the reported costs of a hospitalization was 1.35. After costs were standardized, the interquartile ratio fell to 1.26, indicating that variation decreased. We found that the median hospital reported cost per day was $1,651, with an IQR of $1,400 to $1,933 (ratio 1.38), whereas the median standardized cost per day was $1,640, with an IQR of $1,511 to $1,812 (ratio 1.20).
There were more than 15,000 items (eg, treatments, tests, and supplies) that received a standardized charge code in our cohort. These were divided into 11 summary departments and 40 standard departments (see Supporting Table 2 in the online version of this article). We observed a high level of variation in the reported costs of individual items: the reported costs of a day of room and board in an ICU ranged from $773 at hospitals at the 10th percentile to $2,471 at the 90th percentile (Table 1.). The standardized cost of a day of ICU room and board was $1,577. We also observed variation in the reported costs of items across item categories. Although a day of medical room and board showed a 3‐fold difference between the 10th and 90th percentile, we observed a more than 10‐fold difference in the reported cost of an echocardiogram, from $31 at the 10th percentile to $356 at the 90th percentile. After examining the hospital‐level cost for a basket of goods, we found variation in the reported costs for these items across hospitals, with a 10th percentile cost of $1,552 and a 90th percentile cost of $3,967.
| Reported Costs | 10th Percentile | 25th Percentile | 75th Percentile | 90th Percentile | Median (Standardized Cost) |
|---|---|---|---|---|---|
| |||||
| Item | |||||
| Day of medical | 490.03 | 586.41 | 889.95 | 1121.20 | 722.59 |
| Day of ICU | 773.01 | 1275.84 | 1994.81 | 2471.75 | 1577.93 |
| Complete blood count | 6.87 | 9.34 | 18.34 | 23.46 | 13.07 |
| B‐natriuretic peptide | 12.13 | 19.22 | 44.19 | 60.56 | 28.23 |
| Metoprolol | 0.20 | 0.68 | 2.67 | 3.74 | 1.66 |
| Lisinopril | 0.28 | 1.02 | 2.79 | 4.06 | 1.72 |
| Spironolactone | 0.22 | 0.53 | 2.68 | 3.83 | 1.63 |
| Furosemide | 1.27 | 2.45 | 5.73 | 8.12 | 3.82 |
| Chest x‐ray | 43.88 | 51.54 | 89.96 | 117.16 | 67.45 |
| Echocardiogram | 31.53 | 98.63 | 244.63 | 356.50 | 159.07 |
| Chest CT (w & w/o contrast) | 65.17 | 83.99 | 157.23 | 239.27 | 110.76 |
| Noninvasive positive pressure ventilation | 126.23 | 127.25 | 370.44 | 514.67 | 177.24 |
| Electrocardiogram | 12.08 | 18.77 | 42.74 | 64.94 | 29.78 |
| Total basket | 1552.50 | 2157.85 | 3417.34 | 3967.78 | 2710.49 |
We found that 46 (20%) hospitals had reported costs of hospitalizations that were 25% greater than standardized costs (Figure 2). This group of hospitals had overestimated reported costs of utilization; 146 (62%) had reported costs within 25% of standardized costs, and 42 (17%) had reported costs that were 25% less than standardized costs (indicating that reported costs underestimated utilization). We examined the relationship between hospital characteristics and strata and found no significant association between the reported to standardized cost ratio and number of beds, teaching status, or urban location (Table 2). Hospitals in the Midwest and South were more likely to have a lower reported cost of hospitalizations, whereas hospitals in the West were more likely to have higher reported costs (P<0.001). When using the CV to compare reported costs to standardized costs, we found that per‐day standardized costs showed reduced variance (P=0.0238), but there was no significant difference in variance of the reported and standardized costs when examining the entire hospitalization (P=0.1423). At the level of the hospitalization, the Spearman correlation coefficient between reported and standardized cost was 0.89.
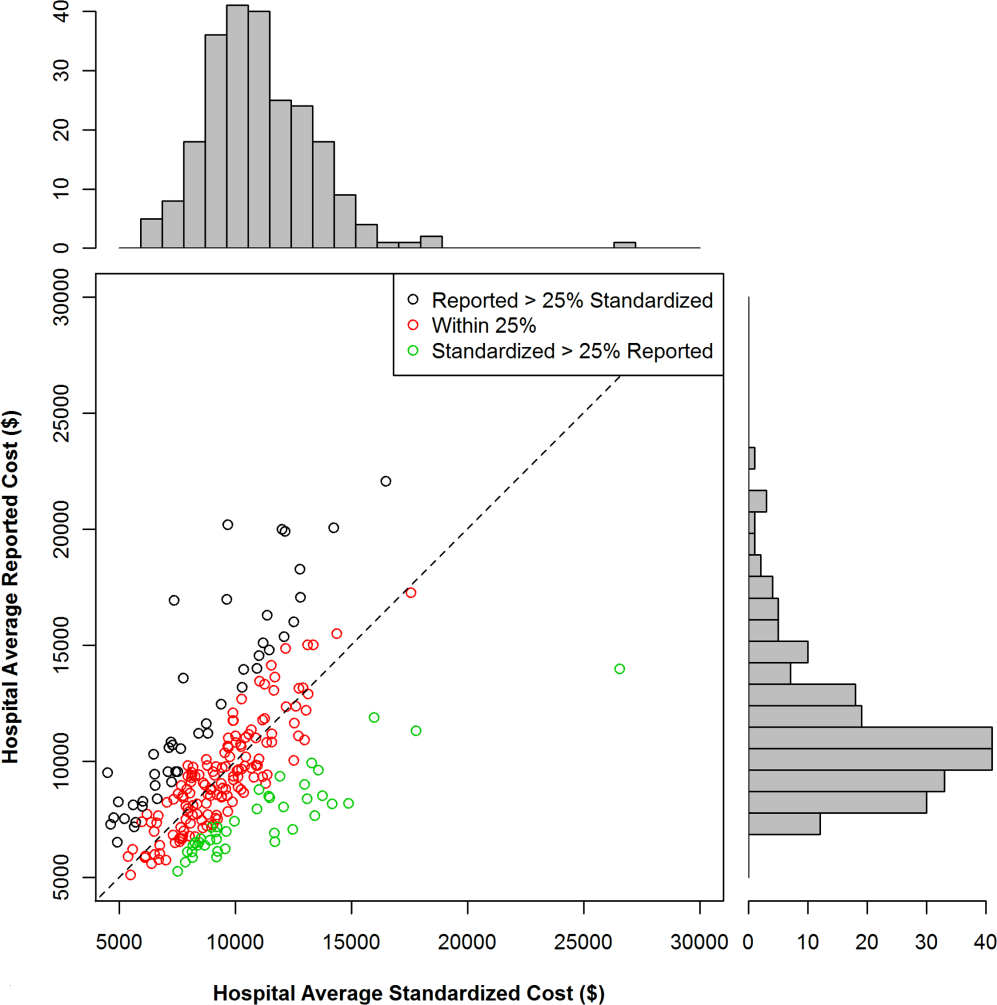
| Reported Greater Than Standardized by >25%, n (%) | Reported Within 25% (2‐tailed) of Standardized, n (%) | Reported Less Than Standardized by >25%, n (%) | P for 2 Test | |
|---|---|---|---|---|
| Total | 46 (19.7) | 146 (62.4) | 42 (17.0) | |
| No. of beds | 0.2313 | |||
| <200 | 19 (41.3) | 40 (27.4) | 12 (28.6) | |
| 200400 | 14 (30.4) | 67 (45.9) | 15 (35.7) | |
| >400 | 13 (28.3) | 39 (26.7) | 15 (35.7) | |
| Teaching | 0.8278 | |||
| Yes | 13 (28.3) | 45 (30.8) | 11 (26.2) | |
| No | 33 (71.7) | 101 (69.2) | 31 (73.8) | |
| Region | <0.0001 | |||
| Midwest | 7 (15.2) | 43 (29.5) | 19 (45.2) | |
| Northeast | 6 (13.0) | 18 (12.3) | 3 (7.1) | |
| South | 14 (30.4) | 64 (43.8) | 20 (47.6) | |
| West | 19 (41.3) | 21 (14.4) | 0 (0) | |
| Urban vs rural | 36 (78.3) | 128 (87.7) | 33 (78.6) | 0.1703 |
To better understand how hospitals can achieve high reported costs through different mechanisms, we more closely examined 3 hospitals with similar reported costs (Figure 3). These hospitals represented low, average, and high utilization according to their standardized costs, but had similar average per‐hospitalization reported costs: $11,643, $11,787, and $11,892, respectively. The corresponding standardized costs were $8,757, $11,169, and $15,978. The hospital with high utilization ($15,978 in standardized costs) was accounted for by increased use of supplies and other services. In contrast, the low‐ and average‐utilization hospitals had proportionally lower standardized costs across categories, with the greatest percentage of spending going toward room and board (includes nursing).
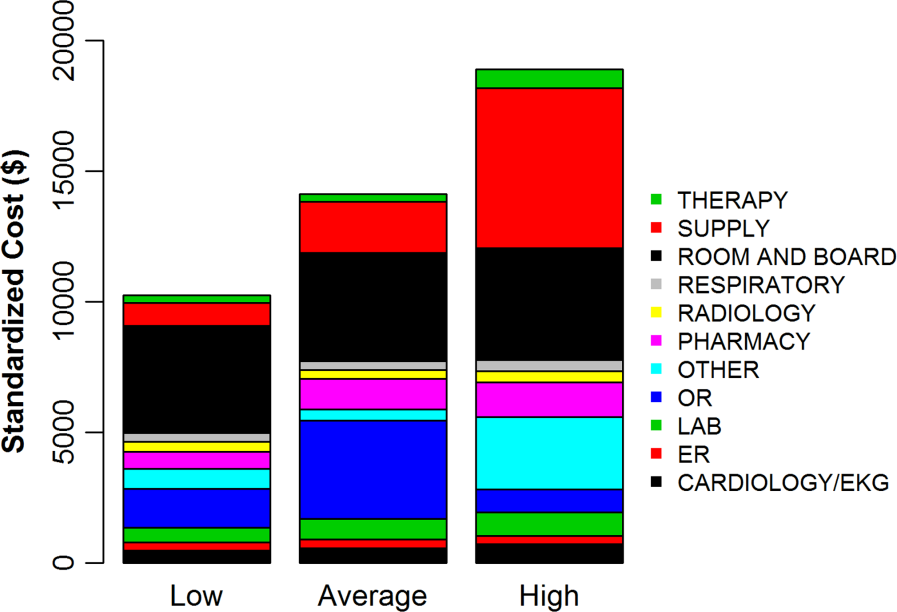
DISCUSSION
In a large national sample of hospitals, we observed variation in the reported costs for a uniform basket of goods, with a more than 2‐fold difference in cost between the 10th and 90th percentile hospitals. These findings suggest that reported costs have limited ability to reliably describe differences in utilization across hospitals. In contrast, when we applied standardized costs, the variance of per‐day costs decreased significantly, and the interquartile ratio of per‐day and hospitalization costs decreased as well, suggesting less variation in utilization across hospitals than would have been inferred from a comparison of reported costs. Applying a single, standard cost to all items can facilitate comparisons of utilization between hospitals (Figure 1). Standardized costs will give hospitals the potential to compare their utilization to their competitors and will facilitate research that examines the comparative effectiveness of high and low utilization in the management of medical and surgical conditions.
The reported to standardized cost ratio is another useful tool. It indicates whether the hospital's reported costs exaggerate its utilization relative to other hospitals. In this study, we found that a significant proportion of hospitals (20%) had reported costs that exceeded standardized costs by more than 25%. These hospitals have higher infrastructure, labor, or acquisition costs relative to their peers. To the extent that these hospitals might wish to lower the cost of care at their institution, they could focus on renegotiating purchasing or labor contracts, identifying areas where they may be overstaffed, or holding off on future infrastructure investments (Table 3).[14] In contrast, 17% of hospitals had reported costs that were 25% less than standardized costs. High‐cost hospitals in this group are therefore providing more treatments and testing to patients relative to their peers and could focus cost‐control efforts on reducing unnecessary utilization and duplicative testing.[20] Our examination of the hospital with high reported costs and very high utilization revealed a high percentage of supplies and other items, which is a category used primarily for nursing expenditures (Figure 3). Because the use of nursing services is directly related to days spent in the hospital, this hospital may wish to more closely examine specific strategies for reducing length of stay.
| High Reported Costs/High Standardized Costs | High Reported Costs/Low Standardized Costs | Low Reported Costs/High Standardized Costs | Low Reported Costs/Low Standardized Costs | |
|---|---|---|---|---|
| Utilization | High | Low | High | Low |
| Severity of illness | Likely to be higher | Likely to be lower | Likely to be higher | Likely to be lower |
| Practice style | Likely to be more intense | Likely to be less intense | Likely to be more intense | Likely to be less intense |
| Fixed costs | High or average | High | Low | Low |
| Infrastructure costs | Likely to be higher | Likely to be higher | Likely to be lower | Likely to be lower |
| Labor costs | Likely to be higher | Likely to be higher | Likely to be lower | Likely to be lower |
| Reported‐to‐standardized cost ratio | Close to 1 | >1 | <1 | Close to 1 |
| Causes of high costs | High utilization, high fixed costs, or both | High acquisition costs, high labor costs, or expensive infrastructure | High utilization | |
| Interventions to reduce costs | Work with clinicians to alter practice style, consider renegotiating cost of acquisitions, hold off on new infrastructure investments | Consider renegotiating cost of acquisitions, hold off on new infrastructure investments, consider reducing size of labor force | Work with clinicians to alter practice style | |
| Usefulness of reported‐ to‐standardized cost ratio | Less useful | More useful | More useful | Less useful |
We did not find a consistent association between the reported to standardized cost ratio and hospital characteristics. This is an important finding that contradicts prior work examining associations between hospital characteristics and costs for heart failure patients,[21] further indicating the complexity of the relationship between fixed costs and variable costs and the difficulty in adjusting reported costs to calculate utilization. For example, small hospitals may have higher acquisition costs and more supply chain difficulties, but they may also have less technology, lower overhead costs, and fewer specialists to order tests and procedures. Hospital characteristics, such as urban location and teaching status, are commonly used as adjustors in cost studies because hospitals in urban areas with teaching missions (which often provide care to low‐income populations) are assumed to have higher fixed costs,[3, 4, 5, 6] but the lack of a consistent relationship between these characteristics and the standardized cost ratio may indicate that using these factors as adjustors for cost may not be effective and could even obscure differences in utilization between hospitals. Notably, we did find an association between hospital region and the reported to standardized cost ratio, but we hesitate to draw conclusions from this finding because the Premier database is imbalanced in terms of regional representation, with fewer hospitals in the Midwest and West and the bulk of the hospitals in the South.
Although standardized costs have great potential, this method has limitations as well. Standardized costs can only be applied when detailed billing data with item‐level costs are available. This is because calculation of standardized costs requires taking the median of item costs and applying the median cost across the database, maintaining the integrity of the relative cost of items to one another. The relative cost of items is preserved (ie, magnetic resonance imaging still costs more than an aspirin), which maintains the general scheme of RVU‐based costs while removing the noise of varying RVU‐based costs across hospitals.[7] Application of an arbitrary item cost would result in the loss of this relative cost difference. Because item costs are not available in traditional administrative datasets, these datasets would not be amenable to this method. However, highly detailed billing data are now being shared by hundreds of hospitals in the Premier network and the University Health System Consortium. These data are widely available to investigators, meaning that the generalizability of this method will only improve over time. It was also a limitation of the study that we chose a limited basket of items common to patients with heart failure to describe the range of reported costs and to provide a standardized snapshot by which to compare hospitals. Because we only included a few items, we may have overestimated or underestimated the range of reported costs for such a basket.
Standardized costs are a novel method for comparing utilization across hospitals. Used properly, they will help identify high‐ and low‐intensity providers of hospital care.
- Health care costs–a primer. Kaiser Family Foundation Web site. Available at: http://www.kff.org/insurance/7670.cfm. Accessed July 20, 2012.
- . Explaining high health care spending in the United States: an international comparison of supply, utilization, prices, and quality. The Commonwealth Fund. 2012. Available at: http://www.commonwealthfund.org/Publications/Issue‐Briefs/2012/May/High‐Health‐Care‐Spending. aspx. Accessed on July 20, 2012.
- , , , , , . The relationship between hospital spending and mortality in patients with sepsis. Arch Intern Med. 2011;171(4):292–299.
- , , , . The elusive connection between health care spending and quality. Health Aff (Millwood). 2009;28(1):w119–w123.
- , , , . Hospital quality and intensity of spending: is there an association? Health Aff (Millwood). 2009;28(4):w566–w572.
- , , , , . Measuring efficiency: the association of hospital costs and quality of care. Health Aff (Millwood). 2009;28(3):897–906.
- , . Assigning resources to health care use for health services research: options and consequences. Med Care. 2009;47(7 suppl 1):S70–S75.
- , , , , . Health care costing: data, methods, current applications. Med Care. 2009;47(7 suppl 1):S1–S6.
- . Determination of VA health care costs. Med Care Res Rev. 2003;60(3 suppl):124S–141S.
- . An improved set of standards for finding cost for cost‐effectiveness analysis. Med Care. 2009;47(7 suppl 1):S82–S88.
- , , , et al. Comparison of approaches for estimating prevalence costs of care for cancer patients: what is the impact of data source? Med Care. 2009;47(7 suppl 1):S64–S69.
- . Principles involved in costing. Med J Aust. 1990;153Suppl:S10–S12.
- . Spending more through “cost control:” our obsessive quest to gut the hospital. Health Aff (Millwood). 1996;15(2):145–154.
- , , , et al. Distribution of variable vs. fixed costs of hospital care. JAMA. 1999;281(7):644–649.
- . Administrative and claims records as sources of health care cost data. Med Care. 2009;47(7 suppl 1):S51–S55.
- , , , , , . Perioperative beta‐blocker therapy and mortality after major noncardiac surgery. N Engl J Med. 2005;353(4):349–361.
- , , , et al. Public reporting and pay for performance in hospital quality improvement. N Engl J Med. 2007;356(5):486–496.
- , , , et al. Procedure intensity and the cost of care. Circ Cardiovasc Qual Outcomes. 2012;5(3):308–313.
- , , . A comparative study of tests for homogeneity of variances, with applications to the outer continental shelf bidding data. Technometrics. 1981;23:351–361.
- , , . Beyond the efficiency index: finding a better way to reduce overuse and increase efficiency in physician care. Health Aff (Millwood). 2008;27(4):w250–w259.
- , , . The association between hospital volume and processes, outcomes, and costs of care for congestive heart failure. Ann Intern Med. 2011;154(2):94–102.
Healthcare spending exceeded $2.5 trillion in 2007, and payments to hospitals represented the largest portion of this spending (more than 30%), equaling the combined cost of physician services and prescription drugs.[1, 2] Researchers and policymakers have emphasized the need to improve the value of hospital care in the United States, but this has been challenging, in part because of the difficulty in identifying hospitals that have high resource utilization relative to their peers.[3, 4, 5, 6, 7, 8, 9, 10, 11]
Most hospitals calculate their costs using internal accounting systems that determine resource utilization via relative value units (RVUs).[7, 8] RVU‐derived costs, also known as hospital reported costs, have proven to be an excellent method for quantifying what it costs a given hospital to provide a treatment, test, or procedure. However, RVU‐based costs are less useful for comparing resource utilization across hospitals because the cost to provide a treatment or service varies widely across hospitals. The cost of an item calculated using RVUs includes not just the item itself, but also a portion of the fixed costs of the hospital (overhead, labor, and infrastructure investments such as electronic records, new buildings, or expensive radiological or surgical equipment).[12] These costs vary by institution, patient population, region of the country, teaching status, and many other variables, making it difficult to identify resource utilization across hospitals.[13, 14]
Recently, a few claims‐based multi‐institutional datasets have begun incorporating item‐level RVU‐based costs derived directly from the cost accounting systems of participating institutions.[15] Such datasets allow researchers to compare reported costs of care from hospital to hospital, but because of the limitations we described above, they still cannot be used to answer the question: Which hospitals with higher costs of care are actually providing more treatments and services to patients?
To better facilitate the comparison of resource utilization patterns across hospitals, we standardized the unit costs of all treatments and services across hospitals by applying a single cost to every item across hospitals. This standardized cost allowed to compare utilization of that item (and the 15,000 other items in the database) across hospitals. We then compared estimates of resource utilization as measured by the 2 approaches: standardized and RVU‐based costs.
METHODS
Ethics Statement
All data were deidentified, by Premier, Inc., at both the hospital and patient level in accordance with the Health Insurance Portability and Accountability Act. The Yale University Human Investigation Committee reviewed the protocol for this study and determined that it is not considered to be human subjects research as defined by the Office of Human Research Protections.
Data Source
We conducted a cross‐sectional study using data from hospitals that participated in the database maintained by Premier Healthcare Informatics (Charlotte, NC) in the years 2009 to 2010. The Premier database is a voluntary, fee‐supported database created to measure quality and healthcare utilization.[3, 16, 17, 18] In 2010, it included detailed billing data from 500 hospitals in the United States, with more than 130 million cumulative hospital discharges. The detailed billing data includes all elements found in hospital claims derived from the uniform billing‐04 form, as well as an itemized, date‐stamped log of all items and services charged to the patient or insurer, such as medications, laboratory tests, and diagnostic and therapeutic services. The database includes approximately 15% of all US hospitalizations. Participating hospitals are similar to the composition of acute care hospitals nationwide. They represent all regions of the United States, and represent predominantly small‐ to mid‐sized nonteaching facilities that serve a largely urban population. The database also contains hospital reported costs at the item level as well as the total cost of the hospitalization. Approximately 75% of hospitals that participate submit RVU‐based costs taken from internal cost accounting systems. Because of our focus on comparing standardized costs to reported costs, we included only data from hospitals that use RVU‐based costs in this study.
Study Subjects
We included adult patients with a hospitalization recorded in the Premier database between January 1, 2009 and December 31, 2010, and a principal discharge diagnosis of heart failure (HF) (International Classification of Diseases, Ninth Revision, Clinical Modification codes: 402.01, 402.11, 402.91, 404.01, 404.03, 404.11, 404.13, 404.91, 404.93, 428.xx). We excluded transfers, patients assigned a pediatrician as the attending of record, and those who received a heart transplant or ventricular assist device during their stay. Because cost data are prone to extreme outliers, we excluded hospitalizations that were in the top 0.1% of length of stay, number of billing records, quantity of items billed, or total standardized cost. We also excluded hospitals that admitted fewer than 25 HF patients during the study period to reduce the possibility that a single high‐cost patient affected the hospital's cost profile.
Hospital Information
For each hospital included in the study, we recorded number of beds, teaching status, geographic region, and whether it served an urban or rural population.
Assignment of Standardized Costs
We defined reported cost as the RVU‐based cost per item in the database. We then calculated the median across hospitals for each item in the database and set this as the standardized unit cost of that item at every hospital (Figure 1). Once standardized costs were assigned at the item level, we summed the costs of all items assigned to each patient and calculated the standardized cost of a hospitalization per patient at each hospital.
Examination of Cost Variation
We compared the standardized and reported costs of hospitalizations using medians, interquartile ranges, and interquartile ratios (Q75/Q25). To examine whether standardized costs can reduce the noise due to differences in overhead and other fixed costs, we calculated, for each hospital, the coefficients of variation (CV) for per‐day reported and standardized costs and per‐hospitalization reported and standardized costs. We used the Fligner‐Killeen test to determine whether the variance of CVs was different for reported and standardized costs.[19]
Creation of Basket of Goods
Because there can be differences in the costs of items, the number and types of items administered during hospitalizations, 2 hospitals with similar reported costs for a hospitalization might deliver different quantities and combinations of treatments (Figure 1). We wished to demonstrate that there is variation in reported costs of items when the quantity and type of item is held constant, so we created a basket of items. We chose items that are commonly administered to patients with heart failure, but could have chosen any combination of items. The basket included a day of medical room and board, a day of intensive care unit (ICU) room and board, a single dose of ‐blocker, a single dose of angiotensin‐converting enzyme inhibitor, complete blood count, a B‐natriuretic peptide level, a chest radiograph, a chest computed tomography, and an echocardiogram. We then examined the range of hospitals' reported costs for this basket of goods using percentiles, medians, and interquartile ranges.
Reported to Standardized Cost Ratio
Next, we calculated standardized costs of hospitalizations for included hospitals and examined the relationship between hospitals' mean reported costs and mean standardized costs. This ratio could help diagnose the mechanism of high reported costs for a hospital, because high reported costs with low utilization would indicate high fixed costs, while high reported costs with high utilization would indicate greater use of tests and treatments. We assigned hospitals to strata based on reported costs greater than standardized costs by more than 25%, reported costs within 25% of standardized costs, and reported costs less than standardized costs by more than 25%. We examined the association between hospital characteristics and strata using a 2 test. All analyses were carried out using SAS version 9.3 (SAS Institute Inc., Cary, NC).
RESULTS
The 234 hospitals included in the analysis contributed a total of 165,647 hospitalizations, with the number of hospitalizations ranging from 33 to 2,772 hospitalizations per hospital (see Supporting Table 1 in the online version of this article). Most were located in urban areas (84%), and many were in the southern United States (42%). The median hospital reported cost per hospitalization was $6,535, with an interquartile range of $5,541 to $7,454. The median standardized cost per hospitalization was $6,602, with a range of $5,866 to $7,386. The interquartile ratio (Q75/Q25) of the reported costs of a hospitalization was 1.35. After costs were standardized, the interquartile ratio fell to 1.26, indicating that variation decreased. We found that the median hospital reported cost per day was $1,651, with an IQR of $1,400 to $1,933 (ratio 1.38), whereas the median standardized cost per day was $1,640, with an IQR of $1,511 to $1,812 (ratio 1.20).
There were more than 15,000 items (eg, treatments, tests, and supplies) that received a standardized charge code in our cohort. These were divided into 11 summary departments and 40 standard departments (see Supporting Table 2 in the online version of this article). We observed a high level of variation in the reported costs of individual items: the reported costs of a day of room and board in an ICU ranged from $773 at hospitals at the 10th percentile to $2,471 at the 90th percentile (Table 1.). The standardized cost of a day of ICU room and board was $1,577. We also observed variation in the reported costs of items across item categories. Although a day of medical room and board showed a 3‐fold difference between the 10th and 90th percentile, we observed a more than 10‐fold difference in the reported cost of an echocardiogram, from $31 at the 10th percentile to $356 at the 90th percentile. After examining the hospital‐level cost for a basket of goods, we found variation in the reported costs for these items across hospitals, with a 10th percentile cost of $1,552 and a 90th percentile cost of $3,967.
| Reported Costs | 10th Percentile | 25th Percentile | 75th Percentile | 90th Percentile | Median (Standardized Cost) |
|---|---|---|---|---|---|
| |||||
| Item | |||||
| Day of medical | 490.03 | 586.41 | 889.95 | 1121.20 | 722.59 |
| Day of ICU | 773.01 | 1275.84 | 1994.81 | 2471.75 | 1577.93 |
| Complete blood count | 6.87 | 9.34 | 18.34 | 23.46 | 13.07 |
| B‐natriuretic peptide | 12.13 | 19.22 | 44.19 | 60.56 | 28.23 |
| Metoprolol | 0.20 | 0.68 | 2.67 | 3.74 | 1.66 |
| Lisinopril | 0.28 | 1.02 | 2.79 | 4.06 | 1.72 |
| Spironolactone | 0.22 | 0.53 | 2.68 | 3.83 | 1.63 |
| Furosemide | 1.27 | 2.45 | 5.73 | 8.12 | 3.82 |
| Chest x‐ray | 43.88 | 51.54 | 89.96 | 117.16 | 67.45 |
| Echocardiogram | 31.53 | 98.63 | 244.63 | 356.50 | 159.07 |
| Chest CT (w & w/o contrast) | 65.17 | 83.99 | 157.23 | 239.27 | 110.76 |
| Noninvasive positive pressure ventilation | 126.23 | 127.25 | 370.44 | 514.67 | 177.24 |
| Electrocardiogram | 12.08 | 18.77 | 42.74 | 64.94 | 29.78 |
| Total basket | 1552.50 | 2157.85 | 3417.34 | 3967.78 | 2710.49 |
We found that 46 (20%) hospitals had reported costs of hospitalizations that were 25% greater than standardized costs (Figure 2). This group of hospitals had overestimated reported costs of utilization; 146 (62%) had reported costs within 25% of standardized costs, and 42 (17%) had reported costs that were 25% less than standardized costs (indicating that reported costs underestimated utilization). We examined the relationship between hospital characteristics and strata and found no significant association between the reported to standardized cost ratio and number of beds, teaching status, or urban location (Table 2). Hospitals in the Midwest and South were more likely to have a lower reported cost of hospitalizations, whereas hospitals in the West were more likely to have higher reported costs (P<0.001). When using the CV to compare reported costs to standardized costs, we found that per‐day standardized costs showed reduced variance (P=0.0238), but there was no significant difference in variance of the reported and standardized costs when examining the entire hospitalization (P=0.1423). At the level of the hospitalization, the Spearman correlation coefficient between reported and standardized cost was 0.89.
| Reported Greater Than Standardized by >25%, n (%) | Reported Within 25% (2‐tailed) of Standardized, n (%) | Reported Less Than Standardized by >25%, n (%) | P for 2 Test | |
|---|---|---|---|---|
| Total | 46 (19.7) | 146 (62.4) | 42 (17.0) | |
| No. of beds | 0.2313 | |||
| <200 | 19 (41.3) | 40 (27.4) | 12 (28.6) | |
| 200400 | 14 (30.4) | 67 (45.9) | 15 (35.7) | |
| >400 | 13 (28.3) | 39 (26.7) | 15 (35.7) | |
| Teaching | 0.8278 | |||
| Yes | 13 (28.3) | 45 (30.8) | 11 (26.2) | |
| No | 33 (71.7) | 101 (69.2) | 31 (73.8) | |
| Region | <0.0001 | |||
| Midwest | 7 (15.2) | 43 (29.5) | 19 (45.2) | |
| Northeast | 6 (13.0) | 18 (12.3) | 3 (7.1) | |
| South | 14 (30.4) | 64 (43.8) | 20 (47.6) | |
| West | 19 (41.3) | 21 (14.4) | 0 (0) | |
| Urban vs rural | 36 (78.3) | 128 (87.7) | 33 (78.6) | 0.1703 |
To better understand how hospitals can achieve high reported costs through different mechanisms, we more closely examined 3 hospitals with similar reported costs (Figure 3). These hospitals represented low, average, and high utilization according to their standardized costs, but had similar average per‐hospitalization reported costs: $11,643, $11,787, and $11,892, respectively. The corresponding standardized costs were $8,757, $11,169, and $15,978. The hospital with high utilization ($15,978 in standardized costs) was accounted for by increased use of supplies and other services. In contrast, the low‐ and average‐utilization hospitals had proportionally lower standardized costs across categories, with the greatest percentage of spending going toward room and board (includes nursing).
DISCUSSION
In a large national sample of hospitals, we observed variation in the reported costs for a uniform basket of goods, with a more than 2‐fold difference in cost between the 10th and 90th percentile hospitals. These findings suggest that reported costs have limited ability to reliably describe differences in utilization across hospitals. In contrast, when we applied standardized costs, the variance of per‐day costs decreased significantly, and the interquartile ratio of per‐day and hospitalization costs decreased as well, suggesting less variation in utilization across hospitals than would have been inferred from a comparison of reported costs. Applying a single, standard cost to all items can facilitate comparisons of utilization between hospitals (Figure 1). Standardized costs will give hospitals the potential to compare their utilization to their competitors and will facilitate research that examines the comparative effectiveness of high and low utilization in the management of medical and surgical conditions.
The reported to standardized cost ratio is another useful tool. It indicates whether the hospital's reported costs exaggerate its utilization relative to other hospitals. In this study, we found that a significant proportion of hospitals (20%) had reported costs that exceeded standardized costs by more than 25%. These hospitals have higher infrastructure, labor, or acquisition costs relative to their peers. To the extent that these hospitals might wish to lower the cost of care at their institution, they could focus on renegotiating purchasing or labor contracts, identifying areas where they may be overstaffed, or holding off on future infrastructure investments (Table 3).[14] In contrast, 17% of hospitals had reported costs that were 25% less than standardized costs. High‐cost hospitals in this group are therefore providing more treatments and testing to patients relative to their peers and could focus cost‐control efforts on reducing unnecessary utilization and duplicative testing.[20] Our examination of the hospital with high reported costs and very high utilization revealed a high percentage of supplies and other items, which is a category used primarily for nursing expenditures (Figure 3). Because the use of nursing services is directly related to days spent in the hospital, this hospital may wish to more closely examine specific strategies for reducing length of stay.
| High Reported Costs/High Standardized Costs | High Reported Costs/Low Standardized Costs | Low Reported Costs/High Standardized Costs | Low Reported Costs/Low Standardized Costs | |
|---|---|---|---|---|
| Utilization | High | Low | High | Low |
| Severity of illness | Likely to be higher | Likely to be lower | Likely to be higher | Likely to be lower |
| Practice style | Likely to be more intense | Likely to be less intense | Likely to be more intense | Likely to be less intense |
| Fixed costs | High or average | High | Low | Low |
| Infrastructure costs | Likely to be higher | Likely to be higher | Likely to be lower | Likely to be lower |
| Labor costs | Likely to be higher | Likely to be higher | Likely to be lower | Likely to be lower |
| Reported‐to‐standardized cost ratio | Close to 1 | >1 | <1 | Close to 1 |
| Causes of high costs | High utilization, high fixed costs, or both | High acquisition costs, high labor costs, or expensive infrastructure | High utilization | |
| Interventions to reduce costs | Work with clinicians to alter practice style, consider renegotiating cost of acquisitions, hold off on new infrastructure investments | Consider renegotiating cost of acquisitions, hold off on new infrastructure investments, consider reducing size of labor force | Work with clinicians to alter practice style | |
| Usefulness of reported‐ to‐standardized cost ratio | Less useful | More useful | More useful | Less useful |
We did not find a consistent association between the reported to standardized cost ratio and hospital characteristics. This is an important finding that contradicts prior work examining associations between hospital characteristics and costs for heart failure patients,[21] further indicating the complexity of the relationship between fixed costs and variable costs and the difficulty in adjusting reported costs to calculate utilization. For example, small hospitals may have higher acquisition costs and more supply chain difficulties, but they may also have less technology, lower overhead costs, and fewer specialists to order tests and procedures. Hospital characteristics, such as urban location and teaching status, are commonly used as adjustors in cost studies because hospitals in urban areas with teaching missions (which often provide care to low‐income populations) are assumed to have higher fixed costs,[3, 4, 5, 6] but the lack of a consistent relationship between these characteristics and the standardized cost ratio may indicate that using these factors as adjustors for cost may not be effective and could even obscure differences in utilization between hospitals. Notably, we did find an association between hospital region and the reported to standardized cost ratio, but we hesitate to draw conclusions from this finding because the Premier database is imbalanced in terms of regional representation, with fewer hospitals in the Midwest and West and the bulk of the hospitals in the South.
Although standardized costs have great potential, this method has limitations as well. Standardized costs can only be applied when detailed billing data with item‐level costs are available. This is because calculation of standardized costs requires taking the median of item costs and applying the median cost across the database, maintaining the integrity of the relative cost of items to one another. The relative cost of items is preserved (ie, magnetic resonance imaging still costs more than an aspirin), which maintains the general scheme of RVU‐based costs while removing the noise of varying RVU‐based costs across hospitals.[7] Application of an arbitrary item cost would result in the loss of this relative cost difference. Because item costs are not available in traditional administrative datasets, these datasets would not be amenable to this method. However, highly detailed billing data are now being shared by hundreds of hospitals in the Premier network and the University Health System Consortium. These data are widely available to investigators, meaning that the generalizability of this method will only improve over time. It was also a limitation of the study that we chose a limited basket of items common to patients with heart failure to describe the range of reported costs and to provide a standardized snapshot by which to compare hospitals. Because we only included a few items, we may have overestimated or underestimated the range of reported costs for such a basket.
Standardized costs are a novel method for comparing utilization across hospitals. Used properly, they will help identify high‐ and low‐intensity providers of hospital care.
- Health care costs–a primer. Kaiser Family Foundation Web site. Available at: http://www.kff.org/insurance/7670.cfm. Accessed July 20, 2012.
- . Explaining high health care spending in the United States: an international comparison of supply, utilization, prices, and quality. The Commonwealth Fund. 2012. Available at: http://www.commonwealthfund.org/Publications/Issue‐Briefs/2012/May/High‐Health‐Care‐Spending. aspx. Accessed on July 20, 2012.
- , , , , , . The relationship between hospital spending and mortality in patients with sepsis. Arch Intern Med. 2011;171(4):292–299.
- , , , . The elusive connection between health care spending and quality. Health Aff (Millwood). 2009;28(1):w119–w123.
- , , , . Hospital quality and intensity of spending: is there an association? Health Aff (Millwood). 2009;28(4):w566–w572.
- , , , , . Measuring efficiency: the association of hospital costs and quality of care. Health Aff (Millwood). 2009;28(3):897–906.
- , . Assigning resources to health care use for health services research: options and consequences. Med Care. 2009;47(7 suppl 1):S70–S75.
- , , , , . Health care costing: data, methods, current applications. Med Care. 2009;47(7 suppl 1):S1–S6.
- . Determination of VA health care costs. Med Care Res Rev. 2003;60(3 suppl):124S–141S.
- . An improved set of standards for finding cost for cost‐effectiveness analysis. Med Care. 2009;47(7 suppl 1):S82–S88.
- , , , et al. Comparison of approaches for estimating prevalence costs of care for cancer patients: what is the impact of data source? Med Care. 2009;47(7 suppl 1):S64–S69.
- . Principles involved in costing. Med J Aust. 1990;153Suppl:S10–S12.
- . Spending more through “cost control:” our obsessive quest to gut the hospital. Health Aff (Millwood). 1996;15(2):145–154.
- , , , et al. Distribution of variable vs. fixed costs of hospital care. JAMA. 1999;281(7):644–649.
- . Administrative and claims records as sources of health care cost data. Med Care. 2009;47(7 suppl 1):S51–S55.
- , , , , , . Perioperative beta‐blocker therapy and mortality after major noncardiac surgery. N Engl J Med. 2005;353(4):349–361.
- , , , et al. Public reporting and pay for performance in hospital quality improvement. N Engl J Med. 2007;356(5):486–496.
- , , , et al. Procedure intensity and the cost of care. Circ Cardiovasc Qual Outcomes. 2012;5(3):308–313.
- , , . A comparative study of tests for homogeneity of variances, with applications to the outer continental shelf bidding data. Technometrics. 1981;23:351–361.
- , , . Beyond the efficiency index: finding a better way to reduce overuse and increase efficiency in physician care. Health Aff (Millwood). 2008;27(4):w250–w259.
- , , . The association between hospital volume and processes, outcomes, and costs of care for congestive heart failure. Ann Intern Med. 2011;154(2):94–102.
© 2013 Society of Hospital Medicine
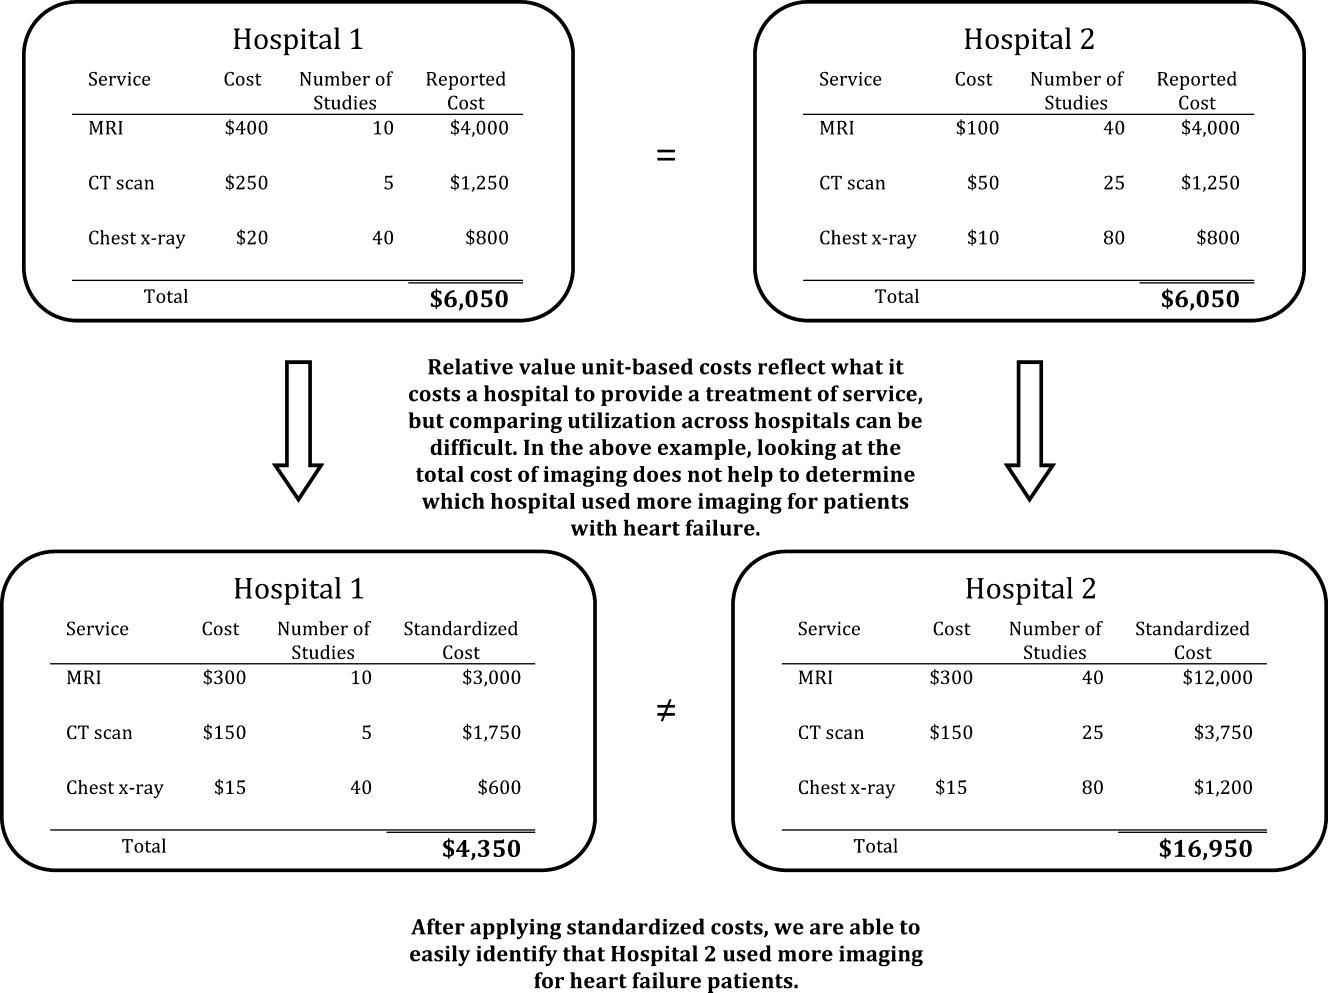
Discharge Summary Quality
Hospitalized patients are often cared for by physicians who do not follow them in the community, creating a discontinuity of care that must be bridged through communication. This communication between inpatient and outpatient physicians occurs, in part via a discharge summary, which is intended to summarize events during hospitalization and prepare the outpatient physician to resume care of the patient. Yet, this form of communication has long been problematic.[1, 2, 3] In a 1960 study, only 30% of discharge letters were received by the primary care physician within 48 hours of discharge.[1]
More recent studies have shown little improvement. Direct communication between hospital and outpatient physicians is rare, and discharge summaries are still largely unavailable at the time of follow‐up.[4] In 1 study, primary care physicians were unaware of 62% of laboratory tests or study results that were pending on discharge,[5] in part because this information is missing from most discharge summaries.[6] Deficits such as these persist despite the fact that the rate of postdischarge completion of recommended tests, referrals, or procedures is significantly increased when the recommendation is included in the discharge summary.[7]
Regulatory mandates for discharge summaries from the Centers for Medicare and Medicaid Services[8] and from The Joint Commission[9] appear to be generally met[10, 11]; however, these mandates have no requirements for timeliness stricter than 30 days, do not require that summaries be transmitted to outpatient physicians, and do not require several content elements that might be useful to outside physicians such as condition of the patient at discharge, cognitive and functional status, goals of care, or pending studies. Expert opinion guidelines have more comprehensive recommendations,[12, 13] but it is uncertain how widely they are followed.
The existence of a discharge summary does not necessarily mean it serves a patient well in the transitional period.[11, 14, 15] Discharge summaries are a complex intervention, and we do not yet understand the best ways discharge summaries may fulfill needs specific to transitional care. Furthermore, it is uncertain what factors improve aspects of discharge summary quality as defined by timeliness, transmission, and content.[6, 16]
The goal of the DIagnosing Systemic failures, Complexities and HARm in GEriatric discharges study (DISCHARGE) was to comprehensively assess the discharge process for older patients discharged to the community. In this article we examine discharge summaries of patients enrolled in the study to determine the timeliness, transmission to outside physicians, and content of the summaries. We further examine the effect of provider training level and timeliness of dictation on discharge summary quality.
METHODS
Study Cohort
The DISCHARGE study was a prospective, observational cohort study of patients 65 years or older discharged to home from YaleNew Haven Hospital (YNHH) who were admitted with acute coronary syndrome (ACS), community‐acquired pneumonia, or heart failure (HF). Patients were screened by physicians for eligibility within 24 hours of admission using specialty society guidelines[17, 18, 19, 20] and were enrolled by telephone within 1 week of discharge. Additional inclusion criteria included speaking English or Spanish, and ability of the patient or caregiver to participate in a telephone interview. Patients enrolled in hospice were excluded, as were patients who failed the Mini‐Cog mental status screen (3‐item recall and a clock draw)[21] while in the hospital or appeared confused or delirious during the telephone interview. Caregivers of cognitively impaired patients were eligible for enrollment instead if the patient provided permission.
Study Setting
YNHH is a 966‐bed urban tertiary care hospital with statistically lower than the national average mortality for acute myocardial infarction, HF, and pneumonia but statistically higher than the national average for 30‐day readmission rates for HF and pneumonia at the time this study was conducted. Advanced practice registered nurses (APRNs) working under the supervision of private or university cardiologists provided care for cardiology service patients. Housestaff under the supervision of university or hospitalist attending physicians, or physician assistants or APRNs under the supervision of hospitalist attending physicians provided care for patients on medical services. Discharge summaries were typically dictated by APRNs for cardiology patients, by 2nd‐ or 3rd‐year residents for housestaff patients, and by hospitalists for hospitalist patients. A dictation guideline was provided to housestaff and hospitalists (see Supporting Information, Appendix 1, in the online version of this article); this guideline suggested including basic demographic information, disposition and diagnoses, the admission history and physical, hospital course, discharge medications, and follow‐up appointments. Additionally, housestaff received a lecture about discharge summaries at the start of their 2nd year. Discharge instructions including medications and follow‐up appointment information were automatically appended to the discharge summaries. Summaries were sent by the medical records department only to physicians in the system who were listed by the dictating physician as needing to receive a copy of the summary; no summary was automatically sent (ie, to the primary care physician) if not requested by the dictating physician.
Data Collection
Experienced registered nurses trained in chart abstraction conducted explicit reviews of medical charts using a standardized review tool. The tool included 24 questions about the discharge summary applicable to all 3 conditions, with 7 additional questions for patients with HF and 1 additional question for patients with ACS. These questions included the 6 elements required by The Joint Commission for all discharge summaries (reason for hospitalization, significant findings, procedures and treatment provided, patient's discharge condition, patient and family instructions, and attending physician's signature)[9] as well as the 7 elements (principal diagnosis and problem list, medication list, transferring physician name and contact information, cognitive status of the patient, test results, and pending test results) recommended by the Transitions of Care Consensus Conference (TOCCC), a recent consensus statement produced by 6 major medical societies.[13] Each content element is shown in (see Supporting Information, Appendix 2, in the online version of this article), which also indicates the elements included in the 2 guidelines.
Main Measures
We assessed quality in 3 main domains: timeliness, transmission, and content. We defined timeliness as days between discharge date and dictation date (not final signature date, which may occur later), and measured both median timeliness and proportion of discharge summaries completed on the day of discharge. We defined transmission as successful fax or mail of the discharge summary to an outside physician as reported by the medical records department, and measured the proportion of discharge summaries sent to any outside physician as well as the median number of physicians per discharge summary who were scheduled to follow‐up with the patient postdischarge but who did not receive a copy of the summary. We defined 21 individual content items and assessed the frequency of each individual content item. We also measured compliance with The Joint Commission mandates and TOCCC recommendations, which included several of the individual content items.
To measure compliance with The Joint Commission requirements, we created a composite score in which 1 point was provided for the presence of each of the 6 required elements (maximum score=6). Every discharge summary received 1 point for attending physician signature, because all discharge summaries were electronically signed. Discharge instructions to family/patients were automatically appended to every discharge summary; however, we gave credit for patient and family instructions only to those that included any information about signs and symptoms to monitor for at home. We defined discharge condition as any information about functional status, cognitive status, physical exam, or laboratory findings at discharge.
To measure compliance with specialty society recommendations for discharge summaries, we created a composite score in which 1 point was provided for the presence of each of the 7 recommended elements (maximum score=7). Every discharge summary received 1 point for discharge medications, because these are automatically appended.
We obtained data on age, race, gender, and length of stay from hospital administrative databases. The study was approved by the Yale Human Investigation Committee, and verbal informed consent was obtained from all study participants.
Statistical Analysis
Characteristics of the sample are described with counts and percentages or means and standard deviations. Medians and interquartile ranges (IQRs) or counts and percentages were calculated for summary measures of timeliness, transmission, and content. We assessed differences in quality measures between APRNs, housestaff, and hospitalists using 2 tests. We conducted multivariable logistic regression analyses for timeliness and for transmission to any outside physician. All discharge summaries included at least 4 of The Joint Commission elements; consequently, we coded this content outcome as an ordinal variable with 3 levels indicating inclusion of 4, 5, or 6 of The Joint Commission elements. We coded the TOCCC content outcome as a 3‐level variable indicating <4, 4, or >4 elements satisfied. Accordingly, proportional odds models were used, in which the reported odds ratios (ORs) can be interpreted as the average effect of the explanatory variable on the odds of having more recommendations, for any dichotomization of the outcome. Residual analysis and goodness‐of‐fit statistics were used to assess model fit; the proportional odds assumption was tested. Statistical analyses were conducted with SAS 9.2 (SAS Institute, Cary, NC). P values <0.05 were interpreted as statistically significant for 2‐sided tests.
RESULTS
Enrollment and Study Sample
A total of 3743 patients over 64 years old were discharged home from the medical service at YNHH during the study period; 3028 patients were screened for eligibility within 24 hours of admission. We identified 635 eligible admissions and enrolled 395 patients (62.2%) in the study. Of these, 377 granted permission for chart review and were included in this analysis (Figure 1).

The study sample had a mean age of 77.1 years (standard deviation: 7.8); 205 (54.4%) were male and 310 (82.5%) were non‐Hispanic white. A total of 195 (51.7%) had ACS, 91 (24.1%) had pneumonia, and 146 (38.7%) had HF; 54 (14.3%) patients had more than 1 qualifying condition. There were similar numbers of patients on the cardiology, medicine housestaff, and medicine hospitalist teams (Table 1).
| Characteristic | N (%) or Mean (SD) |
|---|---|
| |
| Condition | |
| Acute coronary syndrome | 195 (51.7) |
| Community‐acquired pneumonia | 91 (24.1) |
| Heart failure | 146 (38.7) |
| Training level of summary dictator | |
| APRN | 140 (37.1) |
| House staff | 123 (32.6) |
| Hospitalist | 114 (30.2) |
| Length of stay, mean, d | 3.5 (2.5) |
| Total number of medications | 8.9 (3.3) |
| Identify a usual source of care | 360 (96.0) |
| Age, mean, y | 77.1 (7.8) |
| Male | 205 (54.4) |
| English‐speaking | 366 (98.1) |
| Race/ethnicity | |
| Non‐Hispanic white | 310 (82.5) |
| Non‐Hispanic black | 44 (11.7) |
| Hispanic | 15 (4.0) |
| Other | 7 (1.9) |
| High school graduate or GED Admission source | 268 (73.4) |
| Emergency department | 248 (66.0) |
| Direct transfer from hospital or nursing facility | 94 (25.0) |
| Direct admission from office | 34 (9.0) |
Timeliness
Discharge summaries were completed for 376/377 patients, of which 174 (46.3%) were dictated on the day of discharge. However, 122 (32.4%) summaries were dictated more than 48 hours after discharge, including 93 (24.7%) that were dictated more than 1 week after discharge (see Supporting Information, Appendix 3, in the online version of this article).
Summaries dictated by hospitalists were most likely to be done on the day of discharge (35.3% APRNs, 38.2% housestaff, 68.4% hospitalists, P<0.001). After adjustment for diagnosis and length of stay, hospitalists were still significantly more likely to produce a timely discharge summary than APRNs (OR: 2.82; 95% confidence interval [CI]: 1.56‐5.09), whereas housestaff were no different than APRNs (OR: 0.84; 95% CI: 0.48‐1.46).
Transmission
A total of 144 (38.3%) discharge summaries were not sent to any physician besides the inpatient attending, and 209/374 (55.9%) were not sent to at least 1 physician listed as having a follow‐up appointment planned with the patient. Each discharge summary was sent to a median of 1 physician besides the dictating physician (IQR: 01). However, for each summary, a median of 1 physician (IQR: 01) who had a scheduled follow‐up with the patient did not receive the summary. Summaries dictated by hospitalists were most likely to be sent to at least 1 outside physician (54.7% APRNs, 58.5% housestaff, 73.7% hospitalists, P=0.006). Summaries dictated on the day of discharge were more likely than delayed summaries to be sent to at least 1 outside physician (75.9% vs 49.5%, P<0.001). After adjustment for diagnosis and length of stay, there was no longer a difference in likelihood of transmitting a discharge summary to any outpatient physician according to training level; however, dictations completed on the day of discharge remained significantly more likely to be transmitted to an outside physician (OR: 3.05; 95% CI: 1.88‐4.93) (Table 2).
| Explanatory Variable | Proportion Transmitted to at Least 1 Outside Physician | OR for Transmission to Any Outside Physician (95% CI) | Adjusted P Value |
|---|---|---|---|
| |||
| Training level | 0.52 | ||
| APRN | 54.7% | REF | |
| Housestaff | 58.5% | 1.17 (0.66‐2.06) | |
| Hospitalist | 73.7% | 1.46 (0.76‐2.79) | |
| Timeliness | |||
| Dictated after discharge | 49.5% | REF | <0.001 |
| Dictated day of discharge | 75.9% | 3.05 (1.88‐4.93) | |
| Acute coronary syndrome vs nota | 52.1 % | 1.05 (0.49‐2.26) | 0.89 |
| Pneumonia vs nota | 69.2 % | 1.59 (0.66‐3.79) | 0.30 |
| Heart failure vs nota | 74.7 % | 3.32 (1.61‐6.84) | 0.001 |
| Length of stay, d | 0.91 (0.83‐1.00) | 0.06 | |
Content
Rate of inclusion of each content element is shown in Table 3, overall and by training level. Nearly every discharge summary included information about admitting diagnosis, hospital course, and procedures or tests performed during the hospitalization. However, few summaries included information about the patient's condition at discharge. Less than half included discharge laboratory results; less than one‐third included functional capacity, cognitive capacity, or discharge physical exam. Only 4.1% overall of discharge summaries for patients with HF included the patient's weight at discharge; best were hospitalists who still included this information in only 7.7% of summaries. Information about postdischarge care, including home social support, pending tests, or recommended follow‐up tests/procedures was also rarely specified. Last, only 6.2% of discharge summaries included the name and contact number of the inpatient physician; this information was least likely to be provided by housestaff (1.6%) and most likely to be provided by hospitalists (15.2%) (P<0.001).
| Discharge Summary Component | Overall, n=377, n (%) | APRN, n=140, n (%) | Housestaff, n=123, n (%) | Hospitalist, n=114, n (%) | P Value |
|---|---|---|---|---|---|
| |||||
| Diagnosisab | 368 (97.9) | 136 (97.8) | 120 (97.6) | 112 (98.3) | 1.00 |
| Discharge second diagnosisb | 289 (76.9) | 100 (71.9) | 89 (72.4) | 100 (87.7) | <0.001 |
| Hospital coursea | 375 (100.0) | 138 (100) | 123 (100) | 114 (100) | N/A |
| Procedures/tests performed during admissionab | 374 (99.7) | 138 (99.3) | 123 (100) | 113 (100) | N/A |
| Patient and family instructionsa | 371 (98.4) | 136 (97.1) | 122 (99.2) | 113 (99.1) | .43 |
| Social support or living situation of patient | 148 (39.5) | 18 (12.9) | 62 (50.4) | 68 (60.2) | <0.001 |
| Functional capacity at dischargea | 99 (26.4) | 37 (26.6) | 32 (26.0) | 30 (26.6) | 0.99 |
| Cognitive capacity at dischargeab | 30 (8.0) | 6 (4.4) | 11 (8.9) | 13 (11.5) | 0.10 |
| Physical exam at dischargea | 62 (16.7) | 19 (13.8) | 16 (13.1) | 27 (24.1) | 0.04 |
| Laboratory results at time of dischargea | 164 (43.9) | 63 (45.3) | 50 (40.7) | 51 (45.5) | 0.68 |
| Back to baseline or other nonspecific remark about discharge statusa | 71 (19.0) | 30 (21.6) | 18 (14.8) | 23 (20.4) | 0.34 |
| Any test or result still pending or specific comment that nothing is pendingb | 46 (12.2) | 9 (6.4) | 20 (16.3) | 17 (14.9) | 0.03 |
| Recommendation for follow‐up tests/procedures | 157 (41.9) | 43 (30.9) | 54 (43.9) | 60 (53.1) | 0.002 |
| Call‐back number of responsible in‐house physicianb | 23 (6.2) | 4 (2.9) | 2 (1.6) | 17 (15.2) | <0.001 |
| Resuscitation status | 27 (7.7) | 2 (1.5) | 18 (15.4) | 7 (6.7) | <0.001 |
| Etiology of heart failurec | 120 (82.8) | 44 (81.5) | 34 (87.2) | 42 (80.8) | 0.69 |
| Reason/trigger for exacerbationc | 86 (58.9) | 30 (55.6) | 27 (67.5) | 29 (55.8) | 0.43 |
| Ejection fractionc | 107 (73.3) | 40 (74.1) | 32 (80.0) | 35 (67.3) | 0.39 |
| Discharge weightc | 6 (4.1) | 1 (1.9) | 1 (2.5) | 4 (7.7) | 0.33 |
| Target weight rangec | 5 (3.4) | 0 (0) | 2 (5.0) | 3 (5.8) | 0.22 |
| Discharge creatinine or GFRc | 34 (23.3) | 14 (25.9) | 10 (25.0) | 10 (19.2) | 0.69 |
| If stent placed, whether drug‐eluting or notd | 89 (81.7) | 58 (87.9) | 27 (81.8) | 4 (40.0) | 0.001 |
On average, summaries included 5.6 of the 6 Joint Commission elements and 4.0 of the 7 TOCCC elements. A total of 63.0% of discharge summaries included all 6 elements required by The Joint Commission, whereas no discharge summary included all 7 TOCCC elements.
APRNs, housestaff and hospitalists included the same average number of The Joint Commission elements (5.6 each), but hospitalists on average included slightly more TOCCC elements (4.3) than did housestaff (4.0) or APRNs (3.8) (P<0.001). Summaries dictated on the day of discharge included an average of 4.2 TOCCC elements, compared to 3.9 TOCCC elements in delayed discharge. In multivariable analyses adjusted for diagnosis and length of stay, there was still no difference by training level in presence of The Joint Commission elements, but hospitalists were significantly more likely to include more TOCCC elements than APRNs (OR: 2.70; 95% CI: 1.49‐4.90) (Table 4). Summaries dictated on the day of discharge were significantly more likely to include more TOCCC elements (OR: 1.92; 95% CI: 1.23‐2.99).
| Explanatory Variable | Average Number of TOCCC Elements Included | OR (95% CI) | Adjusted P Value |
|---|---|---|---|
| |||
| Training level | 0.004 | ||
| APRN | 3.8 | REF | |
| Housestaff | 4.0 | 1.54 (0.90‐2.62) | |
| Hospitalist | 4.3 | 2.70 (1.49‐4.90) | |
| Timeliness | |||
| Dictated after discharge | 3.9 | REF | |
| Dictated day of discharge | 4.2 | 1.92 (1.23‐2.99) | 0.004 |
| Acute coronary syndrome vs nota | 3.9 | 0.72 (0.37‐1.39) | 0.33 |
| Pneumonia vs nota | 4.2 | 1.02 (0.49‐2.14) | 0.95 |
| Heart failure vs nota | 4.1 | 1.49 (0.80‐2.78) | 0.21 |
| Length of stay, d | 0.99 (0.90‐1.07) | 0.73 | |
No discharge summary included all 7 TOCCC‐endorsed content elements, was dictated on the day of discharge, and was sent to an outside physician.
DISCUSSION
In this prospective single‐site study of medical patients with 3 common conditions, we found that discharge summaries were completed relatively promptly, but were often not sent to the appropriate outpatient physicians. We also found that summaries were uniformly excellent at providing details of the hospitalization, but less reliable at providing details relevant to transitional care such as the patient's condition on discharge or existence of pending tests. On average, summaries included 57% of the elements included in consensus guidelines by 6 major medical societies. The content of discharge summaries dictated by hospitalists was slightly more comprehensive than that of APRNs and trainees, but no group exhibited high performance. In fact, not one discharge summary fully met all 3 quality criteria of timeliness, transmission, and content.
Our study, unlike most in the field, focused on multiple dimensions of discharge summary quality simultaneously. For instance, previous studies have found that timely receipt of a discharge summary does not reduce readmission rates.[11, 14, 15] Yet, if the content of the discharge summary is inadequate for postdischarge care, the summary may not be useful even if it is received by the follow‐up visit. Conversely, high‐quality content is ineffective if the summary is not sent to the outpatient physician.
This study suggests several avenues for improving summary quality. Timely discharge summaries in this study were more likely to include key content and to be transmitted to the appropriate physician. Strategies to improve discharge summary quality should therefore prioritize timely summaries, which can be expected to have downstream benefits for other aspects of quality. Some studies have found that templates improve discharge summary content.[22] In our institution, a template exists, but it favors a hospitalization‐focused rather than transition‐focused approach to the discharge summary. For instance, it includes instructions to dictate the admission exam, but not the discharge exam. Thus, designing templates specifically for transitional care is key. Maximizing capabilities of electronic records may help; many content elements that were commonly missing (e.g., pending results, discharge vitals, discharge weight) could be automatically inserted from electronic records. Likewise, automatic transmission of the summary to care providers listed in the electronic record might ameliorate many transmission failures. Some efforts have been made to convert existing electronic data into discharge summaries.[23, 24, 25] However, these activities are very preliminary, and some studies have found the quality of electronic summaries to be lower than dictated or handwritten summaries.[26] As with all automated or electronic applications, it will be essential to consider workflow, readability, and ability to synthesize information prior to adoption.
Hospitalists consistently produced highest‐quality summaries, even though they did not receive explicit training, suggesting experience may be beneficial,[27, 28, 29] or that the hospitalist community focus on transitional care has been effective. In addition, hospitalists at our institution explicitly prioritize timely and comprehensive discharge dictations, because their business relies on maintaining good relationships with outpatient physicians who contract for their services. Housestaff and APRNs have no such incentives or policies; rather, they typically consider discharge summaries to be a useful source of patient history at the time of an admission or readmission. Other academic centers have found similar results.[6, 16] Nonetheless, even though hospitalists had slightly better performance in our study, large gaps in the quality of summaries remained for all groups including hospitalists.
This study has several limitations. First, as a single‐site study at an academic hospital, it may not be generalizable to other hospitals or other settings. It is noteworthy, however, that the average time to dictation in this study was much lower than that of other studies,[4, 14, 30, 31, 32] suggesting that practices at this institution are at least no worse and possibly better than elsewhere. Second, although there are some mandates and expert opinion‐based guidelines for discharge summary content, there is no validated evidence base to confirm what content ought to be present in discharge summaries to improve patient outcomes. Third, we had too few readmissions in the dataset to have enough power to determine whether discharge summary content, timeliness, or transmission predicts readmission. Fourth, we did not determine whether the information in discharge summaries was accurate or complete; we merely assessed whether it was present. For example, we gave every discharge summary full credit for including discharge medications because they are automatically appended. Yet medication reconciliation errors at discharge are common.[33, 34] In fact, in the DISCHARGE study cohort, more than a quarter of discharge medication lists contained a suspected error.[35]
In summary, this study demonstrated the inadequacy of the contemporary discharge summary for conveying information that is critical to the transition from hospital to home. It may be that hospital culture treats hospitalizations as discrete and self‐contained events rather than as components of a larger episode of care. As interest in reducing readmissions rises, reframing the discharge summary to serve as a transitional tool and targeting it for quality assessment will likely be necessary.
Acknowledgments
The authors would like to acknowledge Amy Browning and the staff of the Center for Outcomes Research and Evaluation Follow‐Up Center for conducting patient interviews, Mark Abroms and Katherine Herman for patient recruitment and screening, and Peter Charpentier for Web site development.
Disclosures
At the time this study was conducted, Dr. Horwitz was supported by the CTSA Grant UL1 RR024139 and KL2 RR024138 from the National Center for Advancing Translational Sciences (NCATS), a component of the National Institutes of Health (NIH), and NIH roadmap for Medical Research, and was a Centers of Excellence Scholar in Geriatric Medicine by the John A. Hartford Foundation and the American Federation for Aging Research. Dr. Horwitz is now supported by the National Institute on Aging (K08 AG038336) and by the American Federation for Aging Research through the Paul B. Beeson Career Development Award Program. This work was also supported by a grant from the Claude D. Pepper Older Americans Independence Center at Yale University School of Medicine (P30AG021342 NIH/NIA). Dr. Krumholz is supported by grant U01 HL105270‐01 (Center for Cardiovascular Outcomes Research at Yale University) from the National Heart, Lung, and Blood Institute. No funding source had any role in the study design; in the collection, analysis, and interpretation of data; in the writing of the report; or in the decision to submit the article for publication. The content is solely the responsibility of the authors and does not necessarily represent the official views of the National Institute on Aging, the National Center for Advancing Translational Sciences, the National Institutes of Health, The John A. Hartford Foundation, the National Heart, Lung, and Blood Institute, or the American Federation for Aging Research. Dr. Horwitz had full access to all of the data in the study and takes responsibility for the integrity of the data and the accuracy of the data analysis. An earlier version of this work was presented as an oral presentation at the Society of General Internal Medicine Annual Meeting in Orlando, Florida on May 12, 2012. Dr. Krumholz chairs a cardiac scientific advisory board for UnitedHealth. Dr. Krumholz receives support from the Centers of Medicare and Medicaid Services (CMS) to develop and maintain performance measures that are used for public reporting, including readmission measures.
APPENDIX
A
Dictation guidelines provided to house staff and hospitalists
DICTATION GUIDELINES
FORMAT OF DISCHARGE SUMMARY
- Your name(spell it out), andPatient name(spell it out as well)
- Medical record number, date of admission, date of discharge
- Attending physician
- Disposition
- Principal and other diagnoses, Principal and other operations/procedures
- Copies to be sent to other physicians
- Begin narrative: CC, HPI, PMHx, Medications on admit, Social, Family Hx, Physical exam on admission, Data (labs on admission, plus labs relevant to workup, significant changes at discharge, admission EKG, radiologic and other data),Hospital course by problem, discharge meds, follow‐up appointments
APPENDIX
B
| Diagnosis |
| Discharge Second Diagnosis |
| Hospital course |
| Procedures/tests performed during admission |
| Patient and Family Instructions |
| Social support or living situation of patient |
| Functional capacity at discharge |
| Cognitive capacity at discharge |
| Physical exam at discharge |
| Laboratory results at time of discharge |
| Back to baseline or other nonspecific remark about discharge status |
| Any test or result still pending |
| Specific comment that nothing is pending |
| Recommendation for follow up tests/procedures |
| Call back number of responsible in‐house physician |
| Resuscitation status |
| Etiology of heart failure |
| Reason/trigger for exacerbation |
| Ejection fraction |
| Discharge weight |
| Target weight range |
| Discharge creatinine or GFR |
| If stent placed, whether drug‐eluting or not |
| Composite element | Data elements abstracted that qualify as meeting measure |
|---|---|
| Reason for hospitalization | Diagnosis |
| Significant findings | Hospital course |
| Procedures and treatment provided | Procedures/tests performed during admission |
| Patient's discharge condition | Functional capacity at discharge, Cognitive capacity at discharge, Physical exam at discharge, Laboratory results at time of discharge, Back to baseline or other nonspecific remark about discharge status |
| Patient and family instructions | Signs and symptoms to monitor at home |
| Attending physician's signature | Attending signature |
| Composite element | Data elements abstracted that qualify as meeting measure |
|---|---|
| Principal diagnosis | Diagnosis |
| Problem list | Discharge second diagnosis |
| Medication list | [Automatically appended; full credit to every summary] |
| Transferring physician name and contact information | Call back number of responsible in‐house physician |
| Cognitive status of the patient | Cognitive capacity at discharge |
| Test results | Procedures/tests performed during admission |
| Pending test results | Any test or result still pending or specific comment that nothing is pending |
APPENDIX
C
Histogram of days between discharge and dictation
- , , . Value of the specialist's report. Br Med J. 1960;2(5213):1663–1664.
- , . Communications between general practitioners and consultants. Br Med J. 1974;4(5942):456–459.
- , , . A functional hospital discharge summary. J Pediatr. 1975;86(1):97–98.
- , , , , , . Deficits in communication and information transfer between hospital‐based and primary care physicians: implications for patient safety and continuity of care. JAMA. 2007;297(8):831–841.
- , , , et al. Patient safety concerns arising from test results that return after hospital discharge. Ann Intern Med. 2005;143(2):121–128.
- , , , et al. Adequacy of hospital discharge summaries in documenting tests with pending results and outpatient follow‐up providers. J Gen Intern Med. 2009;24(9):1002–1006.
- , , . Tying up loose ends: discharging patients with unresolved medical issues. Arch Intern Med. 2007;167(12):1305–1311.
- Centers for Medicare and Medicaid Services. Condition of participation: medical record services. 42. Vol 482.C.F.R. § 482.24 (2012).
- Joint Commission on Accreditation of Healthcare Organizations. Hospital Accreditation Standards. Standard IM 6.10 EP 7–9. Oakbrook Terrace, IL: The Joint Commission; 2008.
- , . Documentation of mandated discharge summary components in transitions from acute to subacute care. In: Agency for Healthcare Research and Quality, ed. Advances in Patient Safety: New Directions and Alternative Approaches. Vol 2: Culture and Redesign. AHRQ Publication No. 08-0034‐2. Rockville, MD: Agency for Healthcare Research and Quality; 2008:179–188.
- , , , et al. Hospital discharge documentation and risk of rehospitalisation. BMJ Qual Saf. 2011;20(9):773–778.
- , , , et al. Transition of care for hospitalized elderly patients‐development of a discharge checklist for hospitalists. J Hosp Med. 2006;1(6):354–360.
- , , , et al. Transitions of Care Consensus Policy Statement American College of Physicians‐Society of General Internal Medicine‐Society of Hospital Medicine‐American Geriatrics Society‐American College of Emergency Physicians‐Society of Academic Emergency Medicine. J Gen Intern Med. 2009;24(8):971–976.
- , , , et al. Association of communication between hospital‐based physicians and primary care providers with patient outcomes. J Gen Intern Med. 2009;24(3):381–386.
- , , , . Effect of discharge summary availability during post‐discharge visits on hospital readmission. J Gen Intern Med. 2002;17(3):186–192.
- , , , , . Provider characteristics, clinical‐work processes and their relationship to discharge summary quality for sub‐acute care patients. J Gen Intern Med. 2012;27(1):78–84.
- , , , et al. ACC/AHA 2007 guidelines for the management of patients with unstable angina/non‐ST‐elevation myocardial infarction: a report of the American College of Cardiology/American Heart Association Task Force on Practice Guidelines (Writing Committee to Revise the 2002 Guidelines for the Management of Patients With Unstable Angina/Non‐ST‐Elevation Myocardial Infarction) developed in collaboration with the American College of Emergency Physicians, the Society for Cardiovascular Angiography and Interventions, and the Society of Thoracic Surgeons endorsed by the American Association of Cardiovascular and Pulmonary Rehabilitation and the Society for Academic Emergency Medicine. J Am Coll Cardiol. 2007;50(7):e1–e157.
- , , . Universal definition of myocardial infarction. Eur Heart J. 2007;28(20):2525–2538.
- , , , et al. ESC guidelines for the diagnosis and treatment of acute and chronic heart failure 2008: the Task Force for the diagnosis and treatment of acute and chronic heart failure 2008 of the European Society of Cardiology. Developed in collaboration with the Heart Failure Association of the ESC (HFA) and endorsed by the European Society of Intensive Care Medicine (ESICM). Eur J Heart Fail. 2008;10(10):933–989.
- , , , et al. Infectious Diseases Society of America/American Thoracic Society consensus guidelines on the management of community‐acquired pneumonia in adults. Clin Infect Dis. 2007;44(suppl 2):S27–S72.
- , , , et al. Clock drawing in Alzheimer's disease. A novel measure of dementia severity. J Am Geriatr Soc. 1989;37(8):725–729.
- , , , , . Assessing quality and efficiency of discharge summaries. Am J Med Qual. 2005;20(6):337–343.
- , , , et al. Electronic versus dictated hospital discharge summaries: a randomized controlled trial. J Gen Intern Med. 2009;24(9):995–1001.
- , , , . Dictated versus database‐generated discharge summaries: a randomized clinical trial. CMAJ. 1999;160(3):319–326.
- , , , , . Computerised updating of clinical summaries: new opportunities for clinical practice and research? BMJ. 1988;297(6662):1504–1506.
- , , . Evaluation of electronic discharge summaries: a comparison of documentation in electronic and handwritten discharge summaries. Int J Med Inform. 2008;77(9):613–620.
- , , , , . Did I do as best as the system would let me? Healthcare professional views on hospital to home care transitions. J Gen Intern Med. 2012;27(12):1649–1656.
- , , , , . Learning by doing—resident perspectives on developing competency in high‐quality discharge care. J Gen Intern Med. 2012;27(9):1188–1194.
- , , , , . Out of sight, out of mind: housestaff perceptions of quality‐limiting factors in discharge care at teaching hospitals. J Hosp Med. 2012;7(5):376–381.
- , , . Dissemination of discharge summaries. Not reaching follow‐up physicians. Can Fam Physician. 2002;48:737–742.
- , , , . Primary care physician attitudes regarding communication with hospitalists. Am J Med. 2001;111(9B):15S–20S.
- , , , . General practitioner‐hospital communications: a review of discharge summaries. J Qual Clin Pract. 2001;21(4):104–108.
- , , . Accuracy of information on medicines in hospital discharge summaries. Intern Med J. 2006;36(4):221–225.
- , , . Accuracy of medication documentation in hospital discharge summaries: A retrospective analysis of medication transcription errors in manual and electronic discharge summaries. Int J Med Inform. 2010;79(1):58–64.
- , , , . Medication reconciliation accuracy and patient understanding of intended medication changes on hospital discharge. J Gen Intern Med. 2012;27(11):1513–1520.
Hospitalized patients are often cared for by physicians who do not follow them in the community, creating a discontinuity of care that must be bridged through communication. This communication between inpatient and outpatient physicians occurs, in part via a discharge summary, which is intended to summarize events during hospitalization and prepare the outpatient physician to resume care of the patient. Yet, this form of communication has long been problematic.[1, 2, 3] In a 1960 study, only 30% of discharge letters were received by the primary care physician within 48 hours of discharge.[1]
More recent studies have shown little improvement. Direct communication between hospital and outpatient physicians is rare, and discharge summaries are still largely unavailable at the time of follow‐up.[4] In 1 study, primary care physicians were unaware of 62% of laboratory tests or study results that were pending on discharge,[5] in part because this information is missing from most discharge summaries.[6] Deficits such as these persist despite the fact that the rate of postdischarge completion of recommended tests, referrals, or procedures is significantly increased when the recommendation is included in the discharge summary.[7]
Regulatory mandates for discharge summaries from the Centers for Medicare and Medicaid Services[8] and from The Joint Commission[9] appear to be generally met[10, 11]; however, these mandates have no requirements for timeliness stricter than 30 days, do not require that summaries be transmitted to outpatient physicians, and do not require several content elements that might be useful to outside physicians such as condition of the patient at discharge, cognitive and functional status, goals of care, or pending studies. Expert opinion guidelines have more comprehensive recommendations,[12, 13] but it is uncertain how widely they are followed.
The existence of a discharge summary does not necessarily mean it serves a patient well in the transitional period.[11, 14, 15] Discharge summaries are a complex intervention, and we do not yet understand the best ways discharge summaries may fulfill needs specific to transitional care. Furthermore, it is uncertain what factors improve aspects of discharge summary quality as defined by timeliness, transmission, and content.[6, 16]
The goal of the DIagnosing Systemic failures, Complexities and HARm in GEriatric discharges study (DISCHARGE) was to comprehensively assess the discharge process for older patients discharged to the community. In this article we examine discharge summaries of patients enrolled in the study to determine the timeliness, transmission to outside physicians, and content of the summaries. We further examine the effect of provider training level and timeliness of dictation on discharge summary quality.
METHODS
Study Cohort
The DISCHARGE study was a prospective, observational cohort study of patients 65 years or older discharged to home from YaleNew Haven Hospital (YNHH) who were admitted with acute coronary syndrome (ACS), community‐acquired pneumonia, or heart failure (HF). Patients were screened by physicians for eligibility within 24 hours of admission using specialty society guidelines[17, 18, 19, 20] and were enrolled by telephone within 1 week of discharge. Additional inclusion criteria included speaking English or Spanish, and ability of the patient or caregiver to participate in a telephone interview. Patients enrolled in hospice were excluded, as were patients who failed the Mini‐Cog mental status screen (3‐item recall and a clock draw)[21] while in the hospital or appeared confused or delirious during the telephone interview. Caregivers of cognitively impaired patients were eligible for enrollment instead if the patient provided permission.
Study Setting
YNHH is a 966‐bed urban tertiary care hospital with statistically lower than the national average mortality for acute myocardial infarction, HF, and pneumonia but statistically higher than the national average for 30‐day readmission rates for HF and pneumonia at the time this study was conducted. Advanced practice registered nurses (APRNs) working under the supervision of private or university cardiologists provided care for cardiology service patients. Housestaff under the supervision of university or hospitalist attending physicians, or physician assistants or APRNs under the supervision of hospitalist attending physicians provided care for patients on medical services. Discharge summaries were typically dictated by APRNs for cardiology patients, by 2nd‐ or 3rd‐year residents for housestaff patients, and by hospitalists for hospitalist patients. A dictation guideline was provided to housestaff and hospitalists (see Supporting Information, Appendix 1, in the online version of this article); this guideline suggested including basic demographic information, disposition and diagnoses, the admission history and physical, hospital course, discharge medications, and follow‐up appointments. Additionally, housestaff received a lecture about discharge summaries at the start of their 2nd year. Discharge instructions including medications and follow‐up appointment information were automatically appended to the discharge summaries. Summaries were sent by the medical records department only to physicians in the system who were listed by the dictating physician as needing to receive a copy of the summary; no summary was automatically sent (ie, to the primary care physician) if not requested by the dictating physician.
Data Collection
Experienced registered nurses trained in chart abstraction conducted explicit reviews of medical charts using a standardized review tool. The tool included 24 questions about the discharge summary applicable to all 3 conditions, with 7 additional questions for patients with HF and 1 additional question for patients with ACS. These questions included the 6 elements required by The Joint Commission for all discharge summaries (reason for hospitalization, significant findings, procedures and treatment provided, patient's discharge condition, patient and family instructions, and attending physician's signature)[9] as well as the 7 elements (principal diagnosis and problem list, medication list, transferring physician name and contact information, cognitive status of the patient, test results, and pending test results) recommended by the Transitions of Care Consensus Conference (TOCCC), a recent consensus statement produced by 6 major medical societies.[13] Each content element is shown in (see Supporting Information, Appendix 2, in the online version of this article), which also indicates the elements included in the 2 guidelines.
Main Measures
We assessed quality in 3 main domains: timeliness, transmission, and content. We defined timeliness as days between discharge date and dictation date (not final signature date, which may occur later), and measured both median timeliness and proportion of discharge summaries completed on the day of discharge. We defined transmission as successful fax or mail of the discharge summary to an outside physician as reported by the medical records department, and measured the proportion of discharge summaries sent to any outside physician as well as the median number of physicians per discharge summary who were scheduled to follow‐up with the patient postdischarge but who did not receive a copy of the summary. We defined 21 individual content items and assessed the frequency of each individual content item. We also measured compliance with The Joint Commission mandates and TOCCC recommendations, which included several of the individual content items.
To measure compliance with The Joint Commission requirements, we created a composite score in which 1 point was provided for the presence of each of the 6 required elements (maximum score=6). Every discharge summary received 1 point for attending physician signature, because all discharge summaries were electronically signed. Discharge instructions to family/patients were automatically appended to every discharge summary; however, we gave credit for patient and family instructions only to those that included any information about signs and symptoms to monitor for at home. We defined discharge condition as any information about functional status, cognitive status, physical exam, or laboratory findings at discharge.
To measure compliance with specialty society recommendations for discharge summaries, we created a composite score in which 1 point was provided for the presence of each of the 7 recommended elements (maximum score=7). Every discharge summary received 1 point for discharge medications, because these are automatically appended.
We obtained data on age, race, gender, and length of stay from hospital administrative databases. The study was approved by the Yale Human Investigation Committee, and verbal informed consent was obtained from all study participants.
Statistical Analysis
Characteristics of the sample are described with counts and percentages or means and standard deviations. Medians and interquartile ranges (IQRs) or counts and percentages were calculated for summary measures of timeliness, transmission, and content. We assessed differences in quality measures between APRNs, housestaff, and hospitalists using 2 tests. We conducted multivariable logistic regression analyses for timeliness and for transmission to any outside physician. All discharge summaries included at least 4 of The Joint Commission elements; consequently, we coded this content outcome as an ordinal variable with 3 levels indicating inclusion of 4, 5, or 6 of The Joint Commission elements. We coded the TOCCC content outcome as a 3‐level variable indicating <4, 4, or >4 elements satisfied. Accordingly, proportional odds models were used, in which the reported odds ratios (ORs) can be interpreted as the average effect of the explanatory variable on the odds of having more recommendations, for any dichotomization of the outcome. Residual analysis and goodness‐of‐fit statistics were used to assess model fit; the proportional odds assumption was tested. Statistical analyses were conducted with SAS 9.2 (SAS Institute, Cary, NC). P values <0.05 were interpreted as statistically significant for 2‐sided tests.
RESULTS
Enrollment and Study Sample
A total of 3743 patients over 64 years old were discharged home from the medical service at YNHH during the study period; 3028 patients were screened for eligibility within 24 hours of admission. We identified 635 eligible admissions and enrolled 395 patients (62.2%) in the study. Of these, 377 granted permission for chart review and were included in this analysis (Figure 1).
The study sample had a mean age of 77.1 years (standard deviation: 7.8); 205 (54.4%) were male and 310 (82.5%) were non‐Hispanic white. A total of 195 (51.7%) had ACS, 91 (24.1%) had pneumonia, and 146 (38.7%) had HF; 54 (14.3%) patients had more than 1 qualifying condition. There were similar numbers of patients on the cardiology, medicine housestaff, and medicine hospitalist teams (Table 1).
| Characteristic | N (%) or Mean (SD) |
|---|---|
| |
| Condition | |
| Acute coronary syndrome | 195 (51.7) |
| Community‐acquired pneumonia | 91 (24.1) |
| Heart failure | 146 (38.7) |
| Training level of summary dictator | |
| APRN | 140 (37.1) |
| House staff | 123 (32.6) |
| Hospitalist | 114 (30.2) |
| Length of stay, mean, d | 3.5 (2.5) |
| Total number of medications | 8.9 (3.3) |
| Identify a usual source of care | 360 (96.0) |
| Age, mean, y | 77.1 (7.8) |
| Male | 205 (54.4) |
| English‐speaking | 366 (98.1) |
| Race/ethnicity | |
| Non‐Hispanic white | 310 (82.5) |
| Non‐Hispanic black | 44 (11.7) |
| Hispanic | 15 (4.0) |
| Other | 7 (1.9) |
| High school graduate or GED Admission source | 268 (73.4) |
| Emergency department | 248 (66.0) |
| Direct transfer from hospital or nursing facility | 94 (25.0) |
| Direct admission from office | 34 (9.0) |
Timeliness
Discharge summaries were completed for 376/377 patients, of which 174 (46.3%) were dictated on the day of discharge. However, 122 (32.4%) summaries were dictated more than 48 hours after discharge, including 93 (24.7%) that were dictated more than 1 week after discharge (see Supporting Information, Appendix 3, in the online version of this article).
Summaries dictated by hospitalists were most likely to be done on the day of discharge (35.3% APRNs, 38.2% housestaff, 68.4% hospitalists, P<0.001). After adjustment for diagnosis and length of stay, hospitalists were still significantly more likely to produce a timely discharge summary than APRNs (OR: 2.82; 95% confidence interval [CI]: 1.56‐5.09), whereas housestaff were no different than APRNs (OR: 0.84; 95% CI: 0.48‐1.46).
Transmission
A total of 144 (38.3%) discharge summaries were not sent to any physician besides the inpatient attending, and 209/374 (55.9%) were not sent to at least 1 physician listed as having a follow‐up appointment planned with the patient. Each discharge summary was sent to a median of 1 physician besides the dictating physician (IQR: 01). However, for each summary, a median of 1 physician (IQR: 01) who had a scheduled follow‐up with the patient did not receive the summary. Summaries dictated by hospitalists were most likely to be sent to at least 1 outside physician (54.7% APRNs, 58.5% housestaff, 73.7% hospitalists, P=0.006). Summaries dictated on the day of discharge were more likely than delayed summaries to be sent to at least 1 outside physician (75.9% vs 49.5%, P<0.001). After adjustment for diagnosis and length of stay, there was no longer a difference in likelihood of transmitting a discharge summary to any outpatient physician according to training level; however, dictations completed on the day of discharge remained significantly more likely to be transmitted to an outside physician (OR: 3.05; 95% CI: 1.88‐4.93) (Table 2).
| Explanatory Variable | Proportion Transmitted to at Least 1 Outside Physician | OR for Transmission to Any Outside Physician (95% CI) | Adjusted P Value |
|---|---|---|---|
| |||
| Training level | 0.52 | ||
| APRN | 54.7% | REF | |
| Housestaff | 58.5% | 1.17 (0.66‐2.06) | |
| Hospitalist | 73.7% | 1.46 (0.76‐2.79) | |
| Timeliness | |||
| Dictated after discharge | 49.5% | REF | <0.001 |
| Dictated day of discharge | 75.9% | 3.05 (1.88‐4.93) | |
| Acute coronary syndrome vs nota | 52.1 % | 1.05 (0.49‐2.26) | 0.89 |
| Pneumonia vs nota | 69.2 % | 1.59 (0.66‐3.79) | 0.30 |
| Heart failure vs nota | 74.7 % | 3.32 (1.61‐6.84) | 0.001 |
| Length of stay, d | 0.91 (0.83‐1.00) | 0.06 | |
Content
Rate of inclusion of each content element is shown in Table 3, overall and by training level. Nearly every discharge summary included information about admitting diagnosis, hospital course, and procedures or tests performed during the hospitalization. However, few summaries included information about the patient's condition at discharge. Less than half included discharge laboratory results; less than one‐third included functional capacity, cognitive capacity, or discharge physical exam. Only 4.1% overall of discharge summaries for patients with HF included the patient's weight at discharge; best were hospitalists who still included this information in only 7.7% of summaries. Information about postdischarge care, including home social support, pending tests, or recommended follow‐up tests/procedures was also rarely specified. Last, only 6.2% of discharge summaries included the name and contact number of the inpatient physician; this information was least likely to be provided by housestaff (1.6%) and most likely to be provided by hospitalists (15.2%) (P<0.001).
| Discharge Summary Component | Overall, n=377, n (%) | APRN, n=140, n (%) | Housestaff, n=123, n (%) | Hospitalist, n=114, n (%) | P Value |
|---|---|---|---|---|---|
| |||||
| Diagnosisab | 368 (97.9) | 136 (97.8) | 120 (97.6) | 112 (98.3) | 1.00 |
| Discharge second diagnosisb | 289 (76.9) | 100 (71.9) | 89 (72.4) | 100 (87.7) | <0.001 |
| Hospital coursea | 375 (100.0) | 138 (100) | 123 (100) | 114 (100) | N/A |
| Procedures/tests performed during admissionab | 374 (99.7) | 138 (99.3) | 123 (100) | 113 (100) | N/A |
| Patient and family instructionsa | 371 (98.4) | 136 (97.1) | 122 (99.2) | 113 (99.1) | .43 |
| Social support or living situation of patient | 148 (39.5) | 18 (12.9) | 62 (50.4) | 68 (60.2) | <0.001 |
| Functional capacity at dischargea | 99 (26.4) | 37 (26.6) | 32 (26.0) | 30 (26.6) | 0.99 |
| Cognitive capacity at dischargeab | 30 (8.0) | 6 (4.4) | 11 (8.9) | 13 (11.5) | 0.10 |
| Physical exam at dischargea | 62 (16.7) | 19 (13.8) | 16 (13.1) | 27 (24.1) | 0.04 |
| Laboratory results at time of dischargea | 164 (43.9) | 63 (45.3) | 50 (40.7) | 51 (45.5) | 0.68 |
| Back to baseline or other nonspecific remark about discharge statusa | 71 (19.0) | 30 (21.6) | 18 (14.8) | 23 (20.4) | 0.34 |
| Any test or result still pending or specific comment that nothing is pendingb | 46 (12.2) | 9 (6.4) | 20 (16.3) | 17 (14.9) | 0.03 |
| Recommendation for follow‐up tests/procedures | 157 (41.9) | 43 (30.9) | 54 (43.9) | 60 (53.1) | 0.002 |
| Call‐back number of responsible in‐house physicianb | 23 (6.2) | 4 (2.9) | 2 (1.6) | 17 (15.2) | <0.001 |
| Resuscitation status | 27 (7.7) | 2 (1.5) | 18 (15.4) | 7 (6.7) | <0.001 |
| Etiology of heart failurec | 120 (82.8) | 44 (81.5) | 34 (87.2) | 42 (80.8) | 0.69 |
| Reason/trigger for exacerbationc | 86 (58.9) | 30 (55.6) | 27 (67.5) | 29 (55.8) | 0.43 |
| Ejection fractionc | 107 (73.3) | 40 (74.1) | 32 (80.0) | 35 (67.3) | 0.39 |
| Discharge weightc | 6 (4.1) | 1 (1.9) | 1 (2.5) | 4 (7.7) | 0.33 |
| Target weight rangec | 5 (3.4) | 0 (0) | 2 (5.0) | 3 (5.8) | 0.22 |
| Discharge creatinine or GFRc | 34 (23.3) | 14 (25.9) | 10 (25.0) | 10 (19.2) | 0.69 |
| If stent placed, whether drug‐eluting or notd | 89 (81.7) | 58 (87.9) | 27 (81.8) | 4 (40.0) | 0.001 |
On average, summaries included 5.6 of the 6 Joint Commission elements and 4.0 of the 7 TOCCC elements. A total of 63.0% of discharge summaries included all 6 elements required by The Joint Commission, whereas no discharge summary included all 7 TOCCC elements.
APRNs, housestaff and hospitalists included the same average number of The Joint Commission elements (5.6 each), but hospitalists on average included slightly more TOCCC elements (4.3) than did housestaff (4.0) or APRNs (3.8) (P<0.001). Summaries dictated on the day of discharge included an average of 4.2 TOCCC elements, compared to 3.9 TOCCC elements in delayed discharge. In multivariable analyses adjusted for diagnosis and length of stay, there was still no difference by training level in presence of The Joint Commission elements, but hospitalists were significantly more likely to include more TOCCC elements than APRNs (OR: 2.70; 95% CI: 1.49‐4.90) (Table 4). Summaries dictated on the day of discharge were significantly more likely to include more TOCCC elements (OR: 1.92; 95% CI: 1.23‐2.99).
| Explanatory Variable | Average Number of TOCCC Elements Included | OR (95% CI) | Adjusted P Value |
|---|---|---|---|
| |||
| Training level | 0.004 | ||
| APRN | 3.8 | REF | |
| Housestaff | 4.0 | 1.54 (0.90‐2.62) | |
| Hospitalist | 4.3 | 2.70 (1.49‐4.90) | |
| Timeliness | |||
| Dictated after discharge | 3.9 | REF | |
| Dictated day of discharge | 4.2 | 1.92 (1.23‐2.99) | 0.004 |
| Acute coronary syndrome vs nota | 3.9 | 0.72 (0.37‐1.39) | 0.33 |
| Pneumonia vs nota | 4.2 | 1.02 (0.49‐2.14) | 0.95 |
| Heart failure vs nota | 4.1 | 1.49 (0.80‐2.78) | 0.21 |
| Length of stay, d | 0.99 (0.90‐1.07) | 0.73 | |
No discharge summary included all 7 TOCCC‐endorsed content elements, was dictated on the day of discharge, and was sent to an outside physician.
DISCUSSION
In this prospective single‐site study of medical patients with 3 common conditions, we found that discharge summaries were completed relatively promptly, but were often not sent to the appropriate outpatient physicians. We also found that summaries were uniformly excellent at providing details of the hospitalization, but less reliable at providing details relevant to transitional care such as the patient's condition on discharge or existence of pending tests. On average, summaries included 57% of the elements included in consensus guidelines by 6 major medical societies. The content of discharge summaries dictated by hospitalists was slightly more comprehensive than that of APRNs and trainees, but no group exhibited high performance. In fact, not one discharge summary fully met all 3 quality criteria of timeliness, transmission, and content.
Our study, unlike most in the field, focused on multiple dimensions of discharge summary quality simultaneously. For instance, previous studies have found that timely receipt of a discharge summary does not reduce readmission rates.[11, 14, 15] Yet, if the content of the discharge summary is inadequate for postdischarge care, the summary may not be useful even if it is received by the follow‐up visit. Conversely, high‐quality content is ineffective if the summary is not sent to the outpatient physician.
This study suggests several avenues for improving summary quality. Timely discharge summaries in this study were more likely to include key content and to be transmitted to the appropriate physician. Strategies to improve discharge summary quality should therefore prioritize timely summaries, which can be expected to have downstream benefits for other aspects of quality. Some studies have found that templates improve discharge summary content.[22] In our institution, a template exists, but it favors a hospitalization‐focused rather than transition‐focused approach to the discharge summary. For instance, it includes instructions to dictate the admission exam, but not the discharge exam. Thus, designing templates specifically for transitional care is key. Maximizing capabilities of electronic records may help; many content elements that were commonly missing (e.g., pending results, discharge vitals, discharge weight) could be automatically inserted from electronic records. Likewise, automatic transmission of the summary to care providers listed in the electronic record might ameliorate many transmission failures. Some efforts have been made to convert existing electronic data into discharge summaries.[23, 24, 25] However, these activities are very preliminary, and some studies have found the quality of electronic summaries to be lower than dictated or handwritten summaries.[26] As with all automated or electronic applications, it will be essential to consider workflow, readability, and ability to synthesize information prior to adoption.
Hospitalists consistently produced highest‐quality summaries, even though they did not receive explicit training, suggesting experience may be beneficial,[27, 28, 29] or that the hospitalist community focus on transitional care has been effective. In addition, hospitalists at our institution explicitly prioritize timely and comprehensive discharge dictations, because their business relies on maintaining good relationships with outpatient physicians who contract for their services. Housestaff and APRNs have no such incentives or policies; rather, they typically consider discharge summaries to be a useful source of patient history at the time of an admission or readmission. Other academic centers have found similar results.[6, 16] Nonetheless, even though hospitalists had slightly better performance in our study, large gaps in the quality of summaries remained for all groups including hospitalists.
This study has several limitations. First, as a single‐site study at an academic hospital, it may not be generalizable to other hospitals or other settings. It is noteworthy, however, that the average time to dictation in this study was much lower than that of other studies,[4, 14, 30, 31, 32] suggesting that practices at this institution are at least no worse and possibly better than elsewhere. Second, although there are some mandates and expert opinion‐based guidelines for discharge summary content, there is no validated evidence base to confirm what content ought to be present in discharge summaries to improve patient outcomes. Third, we had too few readmissions in the dataset to have enough power to determine whether discharge summary content, timeliness, or transmission predicts readmission. Fourth, we did not determine whether the information in discharge summaries was accurate or complete; we merely assessed whether it was present. For example, we gave every discharge summary full credit for including discharge medications because they are automatically appended. Yet medication reconciliation errors at discharge are common.[33, 34] In fact, in the DISCHARGE study cohort, more than a quarter of discharge medication lists contained a suspected error.[35]
In summary, this study demonstrated the inadequacy of the contemporary discharge summary for conveying information that is critical to the transition from hospital to home. It may be that hospital culture treats hospitalizations as discrete and self‐contained events rather than as components of a larger episode of care. As interest in reducing readmissions rises, reframing the discharge summary to serve as a transitional tool and targeting it for quality assessment will likely be necessary.
Acknowledgments
The authors would like to acknowledge Amy Browning and the staff of the Center for Outcomes Research and Evaluation Follow‐Up Center for conducting patient interviews, Mark Abroms and Katherine Herman for patient recruitment and screening, and Peter Charpentier for Web site development.
Disclosures
At the time this study was conducted, Dr. Horwitz was supported by the CTSA Grant UL1 RR024139 and KL2 RR024138 from the National Center for Advancing Translational Sciences (NCATS), a component of the National Institutes of Health (NIH), and NIH roadmap for Medical Research, and was a Centers of Excellence Scholar in Geriatric Medicine by the John A. Hartford Foundation and the American Federation for Aging Research. Dr. Horwitz is now supported by the National Institute on Aging (K08 AG038336) and by the American Federation for Aging Research through the Paul B. Beeson Career Development Award Program. This work was also supported by a grant from the Claude D. Pepper Older Americans Independence Center at Yale University School of Medicine (P30AG021342 NIH/NIA). Dr. Krumholz is supported by grant U01 HL105270‐01 (Center for Cardiovascular Outcomes Research at Yale University) from the National Heart, Lung, and Blood Institute. No funding source had any role in the study design; in the collection, analysis, and interpretation of data; in the writing of the report; or in the decision to submit the article for publication. The content is solely the responsibility of the authors and does not necessarily represent the official views of the National Institute on Aging, the National Center for Advancing Translational Sciences, the National Institutes of Health, The John A. Hartford Foundation, the National Heart, Lung, and Blood Institute, or the American Federation for Aging Research. Dr. Horwitz had full access to all of the data in the study and takes responsibility for the integrity of the data and the accuracy of the data analysis. An earlier version of this work was presented as an oral presentation at the Society of General Internal Medicine Annual Meeting in Orlando, Florida on May 12, 2012. Dr. Krumholz chairs a cardiac scientific advisory board for UnitedHealth. Dr. Krumholz receives support from the Centers of Medicare and Medicaid Services (CMS) to develop and maintain performance measures that are used for public reporting, including readmission measures.
APPENDIX
A
Dictation guidelines provided to house staff and hospitalists
DICTATION GUIDELINES
FORMAT OF DISCHARGE SUMMARY
- Your name(spell it out), andPatient name(spell it out as well)
- Medical record number, date of admission, date of discharge
- Attending physician
- Disposition
- Principal and other diagnoses, Principal and other operations/procedures
- Copies to be sent to other physicians
- Begin narrative: CC, HPI, PMHx, Medications on admit, Social, Family Hx, Physical exam on admission, Data (labs on admission, plus labs relevant to workup, significant changes at discharge, admission EKG, radiologic and other data),Hospital course by problem, discharge meds, follow‐up appointments
APPENDIX
B
| Diagnosis |
| Discharge Second Diagnosis |
| Hospital course |
| Procedures/tests performed during admission |
| Patient and Family Instructions |
| Social support or living situation of patient |
| Functional capacity at discharge |
| Cognitive capacity at discharge |
| Physical exam at discharge |
| Laboratory results at time of discharge |
| Back to baseline or other nonspecific remark about discharge status |
| Any test or result still pending |
| Specific comment that nothing is pending |
| Recommendation for follow up tests/procedures |
| Call back number of responsible in‐house physician |
| Resuscitation status |
| Etiology of heart failure |
| Reason/trigger for exacerbation |
| Ejection fraction |
| Discharge weight |
| Target weight range |
| Discharge creatinine or GFR |
| If stent placed, whether drug‐eluting or not |
| Composite element | Data elements abstracted that qualify as meeting measure |
|---|---|
| Reason for hospitalization | Diagnosis |
| Significant findings | Hospital course |
| Procedures and treatment provided | Procedures/tests performed during admission |
| Patient's discharge condition | Functional capacity at discharge, Cognitive capacity at discharge, Physical exam at discharge, Laboratory results at time of discharge, Back to baseline or other nonspecific remark about discharge status |
| Patient and family instructions | Signs and symptoms to monitor at home |
| Attending physician's signature | Attending signature |
| Composite element | Data elements abstracted that qualify as meeting measure |
|---|---|
| Principal diagnosis | Diagnosis |
| Problem list | Discharge second diagnosis |
| Medication list | [Automatically appended; full credit to every summary] |
| Transferring physician name and contact information | Call back number of responsible in‐house physician |
| Cognitive status of the patient | Cognitive capacity at discharge |
| Test results | Procedures/tests performed during admission |
| Pending test results | Any test or result still pending or specific comment that nothing is pending |
APPENDIX
C
Histogram of days between discharge and dictation
- , , . Value of the specialist's report. Br Med J. 1960;2(5213):1663–1664.
- , . Communications between general practitioners and consultants. Br Med J. 1974;4(5942):456–459.
- , , . A functional hospital discharge summary. J Pediatr. 1975;86(1):97–98.
- , , , , , . Deficits in communication and information transfer between hospital‐based and primary care physicians: implications for patient safety and continuity of care. JAMA. 2007;297(8):831–841.
- , , , et al. Patient safety concerns arising from test results that return after hospital discharge. Ann Intern Med. 2005;143(2):121–128.
- , , , et al. Adequacy of hospital discharge summaries in documenting tests with pending results and outpatient follow‐up providers. J Gen Intern Med. 2009;24(9):1002–1006.
- , , . Tying up loose ends: discharging patients with unresolved medical issues. Arch Intern Med. 2007;167(12):1305–1311.
- Centers for Medicare and Medicaid Services. Condition of participation: medical record services. 42. Vol 482.C.F.R. § 482.24 (2012).
- Joint Commission on Accreditation of Healthcare Organizations. Hospital Accreditation Standards. Standard IM 6.10 EP 7–9. Oakbrook Terrace, IL: The Joint Commission; 2008.
- , . Documentation of mandated discharge summary components in transitions from acute to subacute care. In: Agency for Healthcare Research and Quality, ed. Advances in Patient Safety: New Directions and Alternative Approaches. Vol 2: Culture and Redesign. AHRQ Publication No. 08-0034‐2. Rockville, MD: Agency for Healthcare Research and Quality; 2008:179–188.
- , , , et al. Hospital discharge documentation and risk of rehospitalisation. BMJ Qual Saf. 2011;20(9):773–778.
- , , , et al. Transition of care for hospitalized elderly patients‐development of a discharge checklist for hospitalists. J Hosp Med. 2006;1(6):354–360.
- , , , et al. Transitions of Care Consensus Policy Statement American College of Physicians‐Society of General Internal Medicine‐Society of Hospital Medicine‐American Geriatrics Society‐American College of Emergency Physicians‐Society of Academic Emergency Medicine. J Gen Intern Med. 2009;24(8):971–976.
- , , , et al. Association of communication between hospital‐based physicians and primary care providers with patient outcomes. J Gen Intern Med. 2009;24(3):381–386.
- , , , . Effect of discharge summary availability during post‐discharge visits on hospital readmission. J Gen Intern Med. 2002;17(3):186–192.
- , , , , . Provider characteristics, clinical‐work processes and their relationship to discharge summary quality for sub‐acute care patients. J Gen Intern Med. 2012;27(1):78–84.
- , , , et al. ACC/AHA 2007 guidelines for the management of patients with unstable angina/non‐ST‐elevation myocardial infarction: a report of the American College of Cardiology/American Heart Association Task Force on Practice Guidelines (Writing Committee to Revise the 2002 Guidelines for the Management of Patients With Unstable Angina/Non‐ST‐Elevation Myocardial Infarction) developed in collaboration with the American College of Emergency Physicians, the Society for Cardiovascular Angiography and Interventions, and the Society of Thoracic Surgeons endorsed by the American Association of Cardiovascular and Pulmonary Rehabilitation and the Society for Academic Emergency Medicine. J Am Coll Cardiol. 2007;50(7):e1–e157.
- , , . Universal definition of myocardial infarction. Eur Heart J. 2007;28(20):2525–2538.
- , , , et al. ESC guidelines for the diagnosis and treatment of acute and chronic heart failure 2008: the Task Force for the diagnosis and treatment of acute and chronic heart failure 2008 of the European Society of Cardiology. Developed in collaboration with the Heart Failure Association of the ESC (HFA) and endorsed by the European Society of Intensive Care Medicine (ESICM). Eur J Heart Fail. 2008;10(10):933–989.
- , , , et al. Infectious Diseases Society of America/American Thoracic Society consensus guidelines on the management of community‐acquired pneumonia in adults. Clin Infect Dis. 2007;44(suppl 2):S27–S72.
- , , , et al. Clock drawing in Alzheimer's disease. A novel measure of dementia severity. J Am Geriatr Soc. 1989;37(8):725–729.
- , , , , . Assessing quality and efficiency of discharge summaries. Am J Med Qual. 2005;20(6):337–343.
- , , , et al. Electronic versus dictated hospital discharge summaries: a randomized controlled trial. J Gen Intern Med. 2009;24(9):995–1001.
- , , , . Dictated versus database‐generated discharge summaries: a randomized clinical trial. CMAJ. 1999;160(3):319–326.
- , , , , . Computerised updating of clinical summaries: new opportunities for clinical practice and research? BMJ. 1988;297(6662):1504–1506.
- , , . Evaluation of electronic discharge summaries: a comparison of documentation in electronic and handwritten discharge summaries. Int J Med Inform. 2008;77(9):613–620.
- , , , , . Did I do as best as the system would let me? Healthcare professional views on hospital to home care transitions. J Gen Intern Med. 2012;27(12):1649–1656.
- , , , , . Learning by doing—resident perspectives on developing competency in high‐quality discharge care. J Gen Intern Med. 2012;27(9):1188–1194.
- , , , , . Out of sight, out of mind: housestaff perceptions of quality‐limiting factors in discharge care at teaching hospitals. J Hosp Med. 2012;7(5):376–381.
- , , . Dissemination of discharge summaries. Not reaching follow‐up physicians. Can Fam Physician. 2002;48:737–742.
- , , , . Primary care physician attitudes regarding communication with hospitalists. Am J Med. 2001;111(9B):15S–20S.
- , , , . General practitioner‐hospital communications: a review of discharge summaries. J Qual Clin Pract. 2001;21(4):104–108.
- , , . Accuracy of information on medicines in hospital discharge summaries. Intern Med J. 2006;36(4):221–225.
- , , . Accuracy of medication documentation in hospital discharge summaries: A retrospective analysis of medication transcription errors in manual and electronic discharge summaries. Int J Med Inform. 2010;79(1):58–64.
- , , , . Medication reconciliation accuracy and patient understanding of intended medication changes on hospital discharge. J Gen Intern Med. 2012;27(11):1513–1520.
Copyright © 2013 Society of Hospital Medicine
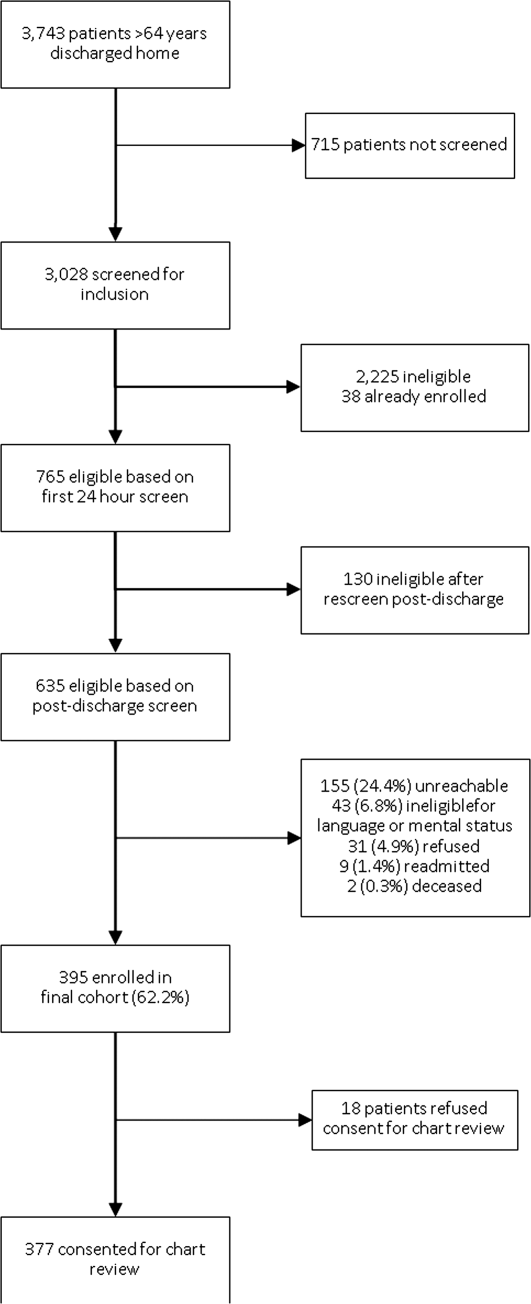
Mortality and Readmission Correlations
The Centers for Medicare & Medicaid Services (CMS) publicly reports hospital‐specific, 30‐day risk‐standardized mortality and readmission rates for Medicare fee‐for‐service patients admitted with acute myocardial infarction (AMI), heart failure (HF), and pneumonia.1 These measures are intended to reflect hospital performance on quality of care provided to patients during and after hospitalization.2, 3
Quality‐of‐care measures for a given disease are often assumed to reflect the quality of care for that particular condition. However, studies have found limited association between condition‐specific process measures and either mortality or readmission rates for those conditions.46 Mortality and readmission rates may instead reflect broader hospital‐wide or specialty‐wide structure, culture, and practice. For example, studies have previously found that hospitals differ in mortality or readmission rates according to organizational structure,7 financial structure,8 culture,9, 10 information technology,11 patient volume,1214 academic status,12 and other institution‐wide factors.12 There is now a strong policy push towards developing hospital‐wide (all‐condition) measures, beginning with readmission.15
It is not clear how much of the quality of care for a given condition is attributable to hospital‐wide influences that affect all conditions rather than disease‐specific factors. If readmission or mortality performance for a particular condition reflects, in large part, broader institutional characteristics, then improvement efforts might better be focused on hospital‐wide activities, such as team training or implementing electronic medical records. On the other hand, if the disease‐specific measures reflect quality strictly for those conditions, then improvement efforts would be better focused on disease‐specific care, such as early identification of the relevant patient population or standardizing disease‐specific care. As hospitals work to improve performance across an increasingly wide variety of conditions, it is becoming more important for hospitals to prioritize and focus their activities effectively and efficiently.
One means of determining the relative contribution of hospital versus disease factors is to explore whether outcome rates are consistent among different conditions cared for in the same hospital. If mortality (or readmission) rates across different conditions are highly correlated, it would suggest that hospital‐wide factors may play a substantive role in outcomes. Some studies have found that mortality for a particular surgical condition is a useful proxy for mortality for other surgical conditions,16, 17 while other studies have found little correlation among mortality rates for various medical conditions.18, 19 It is also possible that correlation varies according to hospital characteristics; for example, smaller or nonteaching hospitals might be more homogenous in their care than larger, less homogeneous institutions. No studies have been performed using publicly reported estimates of risk‐standardized mortality or readmission rates. In this study we use the publicly reported measures of 30‐day mortality and 30‐day readmission for AMI, HF, and pneumonia to examine whether, and to what degree, mortality rates track together within US hospitals, and separately, to what degree readmission rates track together within US hospitals.
METHODS
Data Sources
CMS calculates risk‐standardized mortality and readmission rates, and patient volume, for all acute care nonfederal hospitals with one or more eligible case of AMI, HF, and pneumonia annually based on fee‐for‐service (FFS) Medicare claims. CMS publicly releases the rates for the large subset of hospitals that participate in public reporting and have 25 or more cases for the conditions over the 3‐year period between July 2006 and June 2009. We estimated the rates for all hospitals included in the measure calculations, including those with fewer than 25 cases, using the CMS methodology and data obtained from CMS. The distribution of these rates has been previously reported.20, 21 In addition, we used the 2008 American Hospital Association (AHA) Survey to obtain data about hospital characteristics, including number of beds, hospital ownership (government, not‐for‐profit, for‐profit), teaching status (member of Council of Teaching Hospitals, other teaching hospital, nonteaching), presence of specialized cardiac capabilities (coronary artery bypass graft surgery, cardiac catheterization lab without cardiac surgery, neither), US Census Bureau core‐based statistical area (division [subarea of area with urban center >2.5 million people], metropolitan [urban center of at least 50,000 people], micropolitan [urban center of between 10,000 and 50,000 people], and rural [<10,000 people]), and safety net status22 (yes/no). Safety net status was defined as either public hospitals or private hospitals with a Medicaid caseload greater than one standard deviation above their respective state's mean private hospital Medicaid caseload using the 2007 AHA Annual Survey data.
Study Sample
This study includes 2 hospital cohorts, 1 for mortality and 1 for readmission. Hospitals were eligible for the mortality cohort if the dataset included risk‐standardized mortality rates for all 3 conditions (AMI, HF, and pneumonia). Hospitals were eligible for the readmission cohort if the dataset included risk‐standardized readmission rates for all 3 of these conditions.
Risk‐Standardized Measures
The measures include all FFS Medicare patients who are 65 years old, have been enrolled in FFS Medicare for the 12 months before the index hospitalization, are admitted with 1 of the 3 qualifying diagnoses, and do not leave the hospital against medical advice. The mortality measures include all deaths within 30 days of admission, and all deaths are attributable to the initial admitting hospital, even if the patient is then transferred to another acute care facility. Therefore, for a given hospital, transfers into the hospital are excluded from its rate, but transfers out are included. The readmission measures include all readmissions within 30 days of discharge, and all readmissions are attributable to the final discharging hospital, even if the patient was originally admitted to a different acute care facility. Therefore, for a given hospital, transfers in are included in its rate, but transfers out are excluded. For mortality measures, only 1 hospitalization for a patient in a specific year is randomly selected if the patient has multiple hospitalizations in the year. For readmission measures, admissions in which the patient died prior to discharge, and admissions within 30 days of an index admission, are not counted as index admissions.
Outcomes for all measures are all‐cause; however, for the AMI readmission measure, planned admissions for cardiac procedures are not counted as readmissions. Patients in observation status or in non‐acute care facilities are not counted as readmissions. Detailed specifications for the outcomes measures are available at the National Quality Measures Clearinghouse.23
The derivation and validation of the risk‐standardized outcome measures have been previously reported.20, 21, 2327 The measures are derived from hierarchical logistic regression models that include age, sex, clinical covariates, and a hospital‐specific random effect. The rates are calculated as the ratio of the number of predicted outcomes (obtained from a model applying the hospital‐specific effect) to the number of expected outcomes (obtained from a model applying the average effect among hospitals), multiplied by the unadjusted overall 30‐day rate.
Statistical Analysis
We examined patterns and distributions of hospital volume, risk‐standardized mortality rates, and risk‐standardized readmission rates among included hospitals. To measure the degree of association among hospitals' risk‐standardized mortality rates for AMI, HF, and pneumonia, we calculated Pearson correlation coefficients, resulting in 3 correlations for the 3 pairs of conditions (AMI and HF, AMI and pneumonia, HF and pneumonia), and tested whether they were significantly different from 0. We also conducted a factor analysis using the principal component method with a minimum eigenvalue of 1 to retain factors to determine whether there was a single common factor underlying mortality performance for the 3 conditions.28 Finally, we divided hospitals into quartiles of performance for each outcome based on the point estimate of risk‐standardized rate, and compared quartile of performance between condition pairs for each outcome. For each condition pair, we assessed the percent of hospitals in the same quartile of performance in both conditions, the percent of hospitals in either the top quartile of performance or the bottom quartile of performance for both, and the percent of hospitals in the top quartile for one and the bottom quartile for the other. We calculated the weighted kappa for agreement on quartile of performance between condition pairs for each outcome and the Spearman correlation for quartiles of performance. Then, we examined Pearson correlation coefficients in different subgroups of hospitals, including by size, ownership, teaching status, cardiac procedure capability, statistical area, and safety net status. In order to determine whether these correlations differed by hospital characteristics, we tested if the Pearson correlation coefficients were different between any 2 subgroups using the method proposed by Fisher.29 We repeated all of these analyses separately for the risk‐standardized readmission rates.
To determine whether correlations between mortality rates were significantly different than correlations between readmission rates for any given condition pair, we used the method recommended by Raghunathan et al.30 For these analyses, we included only hospitals reporting both mortality and readmission rates for the condition pairs. We used the same methods to determine whether correlations between mortality rates were significantly different than correlations between readmission rates for any given condition pair among subgroups of hospital characteristics.
All analyses and graphing were performed using the SAS statistical package version 9.2 (SAS Institute, Cary, NC). We considered a P‐value < 0.05 to be statistically significant, and all statistical tests were 2‐tailed.
RESULTS
The mortality cohort included 4559 hospitals, and the readmission cohort included 4468 hospitals. The majority of hospitals was small, nonteaching, and did not have advanced cardiac capabilities such as cardiac surgery or cardiac catheterization (Table 1).
| Description | Mortality Measures | Readmission Measures |
|---|---|---|
| Hospital N = 4559 | Hospital N = 4468 | |
| N (%)* | N (%)* | |
| ||
| No. of beds | ||
| >600 | 157 (3.4) | 156 (3.5) |
| 300600 | 628 (13.8) | 626 (14.0) |
| <300 | 3588 (78.7) | 3505 (78.5) |
| Unknown | 186 (4.08) | 181 (4.1) |
| Mean (SD) | 173.24 (189.52) | 175.23 (190.00) |
| Ownership | ||
| Not‐for‐profit | 2650 (58.1) | 2619 (58.6) |
| For‐profit | 672 (14.7) | 663 (14.8) |
| Government | 1051 (23.1) | 1005 (22.5) |
| Unknown | 186 (4.1) | 181 (4.1) |
| Teaching status | ||
| COTH | 277 (6.1) | 276 (6.2) |
| Teaching | 505 (11.1) | 503 (11.3) |
| Nonteaching | 3591 (78.8) | 3508 (78.5) |
| Unknown | 186 (4.1) | 181 (4.1) |
| Cardiac facility type | ||
| CABG | 1471 (32.3) | 1467 (32.8) |
| Cath lab | 578 (12.7) | 578 (12.9) |
| Neither | 2324 (51.0) | 2242 (50.2) |
| Unknown | 186 (4.1) | 181 (4.1) |
| Core‐based statistical area | ||
| Division | 621 (13.6) | 618 (13.8) |
| Metro | 1850 (40.6) | 1835 (41.1) |
| Micro | 801 (17.6) | 788 (17.6) |
| Rural | 1101 (24.2) | 1046 (23.4) |
| Unknown | 186 (4.1) | 181 (4.1) |
| Safety net status | ||
| No | 2995 (65.7) | 2967 (66.4) |
| Yes | 1377 (30.2) | 1319 (29.5) |
| Unknown | 187 (4.1) | 182 (4.1) |
For mortality measures, the smallest median number of cases per hospital was for AMI (48; interquartile range [IQR], 13,171), and the greatest number was for pneumonia (178; IQR, 87, 336). The same pattern held for readmission measures (AMI median 33; IQR; 9, 150; pneumonia median 191; IQR, 95, 352.5). With respect to mortality measures, AMI had the highest rate and HF the lowest rate; however, for readmission measures, HF had the highest rate and pneumonia the lowest rate (Table 2).
| Description | Mortality Measures (N = 4559) | Readmission Measures (N = 4468) | ||||
|---|---|---|---|---|---|---|
| AMI | HF | PN | AMI | HF | PN | |
| ||||||
| Total discharges | 558,653 | 1,094,960 | 1,114,706 | 546,514 | 1,314,394 | 1,152,708 |
| Hospital volume | ||||||
| Mean (SD) | 122.54 (172.52) | 240.18 (271.35) | 244.51 (220.74) | 122.32 (201.78) | 294.18 (333.2) | 257.99 (228.5) |
| Median (IQR) | 48 (13, 171) | 142 (56, 337) | 178 (87, 336) | 33 (9, 150) | 172.5 (68, 407) | 191 (95, 352.5) |
| Range min, max | 1, 1379 | 1, 2814 | 1, 2241 | 1, 1611 | 1, 3410 | 2, 2359 |
| 30‐Day risk‐standardized rate* | ||||||
| Mean (SD) | 15.7 (1.8) | 10.9 (1.6) | 11.5 (1.9) | 19.9 (1.5) | 24.8 (2.1) | 18.5 (1.7) |
| Median (IQR) | 15.7 (14.5, 16.8) | 10.8 (9.9, 11.9) | 11.3 (10.2, 12.6) | 19.9 (18.9, 20.8) | 24.7 (23.4, 26.1) | 18.4 (17.3, 19.5) |
| Range min, max | 10.3, 24.6 | 6.6, 18.2 | 6.7, 20.9 | 15.2, 26.3 | 17.3, 32.4 | 13.6, 26.7 |
Every mortality measure was significantly correlated with every other mortality measure (range of correlation coefficients, 0.270.41, P < 0.0001 for all 3 correlations). For example, the correlation between risk‐standardized mortality rates (RSMR) for HF and pneumonia was 0.41. Similarly, every readmission measure was significantly correlated with every other readmission measure (range of correlation coefficients, 0.320.47; P < 0.0001 for all 3 correlations). Overall, the lowest correlation was between risk‐standardized mortality rates for AMI and pneumonia (r = 0.27), and the highest correlation was between risk‐standardized readmission rates (RSRR) for HF and pneumonia (r = 0.47) (Table 3).
| Description | Mortality Measures | Readmission Measures | ||||||||||||
|---|---|---|---|---|---|---|---|---|---|---|---|---|---|---|
| N | AMI and HF | AMI and PN | HF and PN | AMI and HF | AMI and PN | HF and PN | ||||||||
| r | P | r | P | r | P | N | r | P | r | P | r | P | ||
| ||||||||||||||
| All | 4559 | 0.30 | 0.27 | 0.41 | 4468 | 0.38 | 0.32 | 0.47 | ||||||
| Hospitals with 25 patients | 2872 | 0.33 | 0.30 | 0.44 | 2467 | 0.44 | 0.38 | 0.51 | ||||||
| No. of beds | 0.15 | 0.005 | 0.0009 | <0.0001 | <0.0001 | <0.0001 | ||||||||
| >600 | 157 | 0.38 | 0.43 | 0.51 | 156 | 0.67 | 0.50 | 0.66 | ||||||
| 300600 | 628 | 0.29 | 0.30 | 0.49 | 626 | 0.54 | 0.45 | 0.58 | ||||||
| <300 | 3588 | 0.27 | 0.23 | 0.37 | 3505 | 0.30 | 0.26 | 0.44 | ||||||
| Ownership | 0.021 | 0.05 | 0.39 | 0.0004 | 0.0004 | 0.003 | ||||||||
| Not‐for‐profit | 2650 | 0.32 | 0.28 | 0.42 | 2619 | 0.43 | 0.36 | 0.50 | ||||||
| For‐profit | 672 | 0.30 | 0.23 | 0.40 | 663 | 0.29 | 0.22 | 0.40 | ||||||
| Government | 1051 | 0.24 | 0.22 | 0.39 | 1005 | 0.32 | 0.29 | 0.45 | ||||||
| Teaching status | 0.11 | 0.08 | 0.0012 | <0.0001 | 0.0002 | 0.0003 | ||||||||
| COTH | 277 | 0.31 | 0.34 | 0.54 | 276 | 0.54 | 0.47 | 0.59 | ||||||
| Teaching | 505 | 0.22 | 0.28 | 0.43 | 503 | 0.52 | 0.42 | 0.56 | ||||||
| Nonteaching | 3591 | 0.29 | 0.24 | 0.39 | 3508 | 0.32 | 0.26 | 0.44 | ||||||
| Cardiac facility type | 0.022 | 0.006 | <0.0001 | <0.0001 | 0.0006 | 0.004 | ||||||||
| CABG | 1471 | 0.33 | 0.29 | 0.47 | 1467 | 0.48 | 0.37 | 0.52 | ||||||
| Cath lab | 578 | 0.25 | 0.26 | 0.36 | 578 | 0.32 | 0.37 | 0.47 | ||||||
| Neither | 2324 | 0.26 | 0.21 | 0.36 | 2242 | 0.28 | 0.27 | 0.44 | ||||||
| Core‐based statistical area | 0.0001 | <0.0001 | 0.002 | <0.0001 | <0.0001 | <0.0001 | ||||||||
| Division | 621 | 0.38 | 0.34 | 0.41 | 618 | 0.46 | 0.40 | 0.56 | ||||||
| Metro | 1850 | 0.26 | 0.26 | 0.42 | 1835 | 0.38 | 0.30 | 0.40 | ||||||
| Micro | 801 | 0.23 | 0.22 | 0.34 | 788 | 0.32 | 0.30 | 0.47 | ||||||
| Rural | 1101 | 0.21 | 0.13 | 0.32 | 1046 | 0.22 | 0.21 | 0.44 | ||||||
| Safety net status | 0.001 | 0.027 | 0.68 | 0.029 | 0.037 | 0.28 | ||||||||
| No | 2995 | 0.33 | 0.28 | 0.41 | 2967 | 0.40 | 0.33 | 0.48 | ||||||
| Yes | 1377 | 0.23 | 0.21 | 0.40 | 1319 | 0.34 | 0.30 | 0.45 | ||||||
Both the factor analysis for the mortality measures and the factor analysis for the readmission measures yielded only one factor with an eigenvalue >1. In each factor analysis, this single common factor kept more than half of the data based on the cumulative eigenvalue (55% for mortality measures and 60% for readmission measures). For the mortality measures, the pattern of RSMR for myocardial infarction (MI), heart failure (HF), and pneumonia (PN) in the factor was high (0.68 for MI, 0.78 for HF, and 0.76 for PN); the same was true of the RSRR in the readmission measures (0.72 for MI, 0.81 for HF, and 0.78 for PN).
For all condition pairs and both outcomes, a third or more of hospitals were in the same quartile of performance for both conditions of the pair (Table 4). Hospitals were more likely to be in the same quartile of performance if they were in the top or bottom quartile than if they were in the middle. Less than 10% of hospitals were in the top quartile for one condition in the mortality or readmission pair and in the bottom quartile for the other condition in the pair. Kappa scores for same quartile of performance between pairs of outcomes ranged from 0.16 to 0.27, and were highest for HF and pneumonia for both mortality and readmission rates.
| Condition Pair | Same Quartile (Any) (%) | Same Quartile (Q1 or Q4) (%) | Q1 in One and Q4 in Another (%) | Weighted Kappa | Spearman Correlation |
|---|---|---|---|---|---|
| |||||
| Mortality | |||||
| MI and HF | 34.8 | 20.2 | 7.9 | 0.19 | 0.25 |
| MI and PN | 32.7 | 18.8 | 8.2 | 0.16 | 0.22 |
| HF and PN | 35.9 | 21.8 | 5.0 | 0.26 | 0.36 |
| Readmission | |||||
| MI and HF | 36.6 | 21.0 | 7.5 | 0.22 | 0.28 |
| MI and PN | 34.0 | 19.6 | 8.1 | 0.19 | 0.24 |
| HF and PN | 37.1 | 22.6 | 5.4 | 0.27 | 0.37 |
In subgroup analyses, the highest mortality correlation was between HF and pneumonia in hospitals with more than 600 beds (r = 0.51, P = 0.0009), and the highest readmission correlation was between AMI and HF in hospitals with more than 600 beds (r = 0.67, P < 0.0001). Across both measures and all 3 condition pairs, correlations between conditions increased with increasing hospital bed size, presence of cardiac surgery capability, and increasing population of the hospital's Census Bureau statistical area. Furthermore, for most measures and condition pairs, correlations between conditions were highest in not‐for‐profit hospitals, hospitals belonging to the Council of Teaching Hospitals, and non‐safety net hospitals (Table 3).
For all condition pairs, the correlation between readmission rates was significantly higher than the correlation between mortality rates (P < 0.01). In subgroup analyses, readmission correlations were also significantly higher than mortality correlations for all pairs of conditions among moderate‐sized hospitals, among nonprofit hospitals, among teaching hospitals that did not belong to the Council of Teaching Hospitals, and among non‐safety net hospitals (Table 5).
| Description | AMI and HF | AMI and PN | HF and PN | |||||||||
|---|---|---|---|---|---|---|---|---|---|---|---|---|
| N | MC | RC | P | N | MC | RC | P | N | MC | RC | P | |
| ||||||||||||
| All | 4457 | 0.31 | 0.38 | <0.0001 | 4459 | 0.27 | 0.32 | 0.007 | 4731 | 0.41 | 0.46 | 0.0004 |
| Hospitals with 25 patients | 2472 | 0.33 | 0.44 | <0.001 | 2463 | 0.31 | 0.38 | 0.01 | 4104 | 0.42 | 0.47 | 0.001 |
| No. of beds | ||||||||||||
| >600 | 156 | 0.38 | 0.67 | 0.0002 | 156 | 0.43 | 0.50 | 0.48 | 160 | 0.51 | 0.66 | 0.042 |
| 300600 | 626 | 0.29 | 0.54 | <0.0001 | 626 | 0.31 | 0.45 | 0.003 | 630 | 0.49 | 0.58 | 0.033 |
| <300 | 3494 | 0.28 | 0.30 | 0.21 | 3496 | 0.23 | 0.26 | 0.17 | 3733 | 0.37 | 0.43 | 0.003 |
| Ownership | ||||||||||||
| Not‐for‐profit | 2614 | 0.32 | 0.43 | <0.0001 | 2617 | 0.28 | 0.36 | 0.003 | 2697 | 0.42 | 0.50 | 0.0003 |
| For‐profit | 662 | 0.30 | 0.29 | 0.90 | 661 | 0.23 | 0.22 | 0.75 | 699 | 0.40 | 0.40 | 0.99 |
| Government | 1000 | 0.25 | 0.32 | 0.09 | 1000 | 0.22 | 0.29 | 0.09 | 1127 | 0.39 | 0.43 | 0.21 |
| Teaching status | ||||||||||||
| COTH | 276 | 0.31 | 0.54 | 0.001 | 277 | 0.35 | 0.46 | 0.10 | 278 | 0.54 | 0.59 | 0.41 |
| Teaching | 504 | 0.22 | 0.52 | <0.0001 | 504 | 0.28 | 0.42 | 0.012 | 508 | 0.43 | 0.56 | 0.005 |
| Nonteaching | 3496 | 0.29 | 0.32 | 0.18 | 3497 | 0.24 | 0.26 | 0.46 | 3737 | 0.39 | 0.43 | 0.016 |
| Cardiac facility type | ||||||||||||
| CABG | 1465 | 0.33 | 0.48 | <0.0001 | 1467 | 0.30 | 0.37 | 0.018 | 1483 | 0.47 | 0.51 | 0.103 |
| Cath lab | 577 | 0.25 | 0.32 | 0.18 | 577 | 0.26 | 0.37 | 0.046 | 579 | 0.36 | 0.47 | 0.022 |
| Neither | 2234 | 0.26 | 0.28 | 0.48 | 2234 | 0.21 | 0.27 | 0.037 | 2461 | 0.36 | 0.44 | 0.002 |
| Core‐based statistical area | ||||||||||||
| Division | 618 | 0.38 | 0.46 | 0.09 | 620 | 0.34 | 0.40 | 0.18 | 630 | 0.41 | 0.56 | 0.001 |
| Metro | 1833 | 0.26 | 0.38 | <0.0001 | 1832 | 0.26 | 0.30 | 0.21 | 1896 | 0.42 | 0.40 | 0.63 |
| Micro | 787 | 0.24 | 0.32 | 0.08 | 787 | 0.22 | 0.30 | 0.11 | 820 | 0.34 | 0.46 | 0.003 |
| Rural | 1038 | 0.21 | 0.22 | 0.83 | 1039 | 0.13 | 0.21 | 0.056 | 1177 | 0.32 | 0.43 | 0.002 |
| Safety net status | ||||||||||||
| No | 2961 | 0.33 | 0.40 | 0.001 | 2963 | 0.28 | 0.33 | 0.036 | 3062 | 0.41 | 0.48 | 0.001 |
| Yes | 1314 | 0.23 | 0.34 | 0.003 | 1314 | 0.22 | 0.30 | 0.015 | 1460 | 0.40 | 0.45 | 0.14 |
DISCUSSION
In this study, we found that risk‐standardized mortality rates for 3 common medical conditions were moderately correlated within institutions, as were risk‐standardized readmission rates. Readmission rates were more strongly correlated than mortality rates, and all rates tracked closest together in large, urban, and/or teaching hospitals. Very few hospitals were in the top quartile of performance for one condition and in the bottom quartile for a different condition.
Our findings are consistent with the hypothesis that 30‐day risk‐standardized mortality and 30‐day risk‐standardized readmission rates, in part, capture broad aspects of hospital quality that transcend condition‐specific activities. In this study, readmission rates tracked better together than mortality rates for every pair of conditions, suggesting that there may be a greater contribution of hospital‐wide environment, structure, and processes to readmission rates than to mortality rates. This difference is plausible because services specific to readmission, such as discharge planning, care coordination, medication reconciliation, and discharge communication with patients and outpatient clinicians, are typically hospital‐wide processes.
Our study differs from earlier studies of medical conditions in that the correlations we found were higher.18, 19 There are several possible explanations for this difference. First, during the intervening 1525 years since those studies were performed, care for these conditions has evolved substantially, such that there are now more standardized protocols available for all 3 of these diseases. Hospitals that are sufficiently organized or acculturated to systematically implement care protocols may have the infrastructure or culture to do so for all conditions, increasing correlation of performance among conditions. In addition, there are now more technologies and systems available that span care for multiple conditions, such as electronic medical records and quality committees, than were available in previous generations. Second, one of these studies utilized less robust risk‐adjustment,18 and neither used the same methodology of risk standardization. Nonetheless, it is interesting to note that Rosenthal and colleagues identified the same increase in correlation with higher volumes than we did.19 Studies investigating mortality correlations among surgical procedures, on the other hand, have generally found higher correlations than we found in these medical conditions.16, 17
Accountable care organizations will be assessed using an all‐condition readmission measure,31 several states track all‐condition readmission rates,3234 and several countries measure all‐condition mortality.35 An all‐condition measure for quality assessment first requires that there be a hospital‐wide quality signal above and beyond disease‐specific care. This study suggests that a moderate signal exists for readmission and, to a slightly lesser extent, for mortality, across 3 common conditions. There are other considerations, however, in developing all‐condition measures. There must be adequate risk adjustment for the wide variety of conditions that are included, and there must be a means of accounting for the variation in types of conditions and procedures cared for by different hospitals. Our study does not address these challenges, which have been described to be substantial for mortality measures.35
We were surprised by the finding that risk‐standardized rates correlated more strongly within larger institutions than smaller ones, because one might assume that care within smaller hospitals might be more homogenous. It may be easier, however, to detect a quality signal in hospitals with higher volumes of patients for all 3 conditions, because estimates for these hospitals are more precise. Consequently, we have greater confidence in results for larger volumes, and suspect a similar quality signal may be present but more difficult to detect statistically in smaller hospitals. Overall correlations were higher when we restricted the sample to hospitals with at least 25 cases, as is used for public reporting. It is also possible that the finding is real given that large‐volume hospitals have been demonstrated to provide better care for these conditions and are more likely to adopt systems of care that affect multiple conditions, such as electronic medical records.14, 36
The kappa scores comparing quartile of national performance for pairs of conditions were only in the fair range. There are several possible explanations for this fact: 1) outcomes for these 3 conditions are not measuring the same constructs; 2) they are all measuring the same construct, but they are unreliable in doing so; and/or 3) hospitals have similar latent quality for all 3 conditions, but the national quality of performance differs by condition, yielding variable relative performance per hospital for each condition. Based solely on our findings, we cannot distinguish which, if any, of these explanations may be true.31
Our study has several limitations. First, all 3 conditions currently publicly reported by CMS are medical diagnoses, although AMI patients may be cared for in distinct cardiology units and often undergo procedures; therefore, we cannot determine the degree to which correlations reflect hospital‐wide quality versus medicine‐wide quality. An institution may have a weak medicine department but a strong surgical department or vice versa. Second, it is possible that the correlations among conditions for readmission and among conditions for mortality are attributable to patient characteristics that are not adequately adjusted for in the risk‐adjustment model, such as socioeconomic factors, or to hospital characteristics not related to quality, such as coding practices or inter‐hospital transfer rates. For this to be true, these unmeasured characteristics would have to be consistent across different conditions within each hospital and have a consistent influence on outcomes. Third, it is possible that public reporting may have prompted disease‐specific focus on these conditions. We do not have data from non‐publicly reported conditions to test this hypothesis. Fourth, there are many small‐volume hospitals in this study; their estimates for readmission and mortality are less reliable than for large‐volume hospitals, potentially limiting our ability to detect correlations in this group of hospitals.
This study lends credence to the hypothesis that 30‐day risk‐standardized mortality and readmission rates for individual conditions may reflect aspects of hospital‐wide quality or at least medicine‐wide quality, although the correlations are not large enough to conclude that hospital‐wide factors play a dominant role, and there are other possible explanations for the correlations. Further work is warranted to better understand the causes of the correlations, and to better specify the nature of hospital factors that contribute to correlations among outcomes.
Acknowledgements
Disclosures: Dr Horwitz is supported by the National Institute on Aging (K08 AG038336) and by the American Federation of Aging Research through the Paul B. Beeson Career Development Award Program. Dr Horwitz is also a Pepper Scholar with support from the Claude D. Pepper Older Americans Independence Center at Yale University School of Medicine (P30 AG021342 NIH/NIA). Dr Krumholz is supported by grant U01 HL105270‐01 (Center for Cardiovascular Outcomes Research at Yale University) from the National Heart, Lung, and Blood Institute. Dr Krumholz chairs a cardiac scientific advisory board for UnitedHealth. Authors Drye, Krumholz, and Wang receive support from the Centers for Medicare & Medicaid Services (CMS) to develop and maintain performance measures that are used for public reporting. The analyses upon which this publication is based were performed under Contract Number HHSM‐500‐2008‐0025I Task Order T0001, entitled Measure & Instrument Development and Support (MIDS)Development and Re‐evaluation of the CMS Hospital Outcomes and Efficiency Measures, funded by the Centers for Medicare & Medicaid Services, an agency of the US Department of Health and Human Services. The Centers for Medicare & Medicaid Services reviewed and approved the use of its data for this work, and approved submission of the manuscript. The content of this publication does not necessarily reflect the views or policies of the Department of Health and Human Services, nor does mention of trade names, commercial products, or organizations imply endorsement by the US Government. The authors assume full responsibility for the accuracy and completeness of the ideas presented.
- US Department of Health and Human Services. Hospital Compare.2011. Available at: http://www.hospitalcompare.hhs.gov. Accessed March 5, 2011.
- ,,.Early readmissions to the department of medicine as a screening tool for monitoring quality of care problems.Medicine (Baltimore).2008;87(5):294–300.
- ,,,,.Hospital inpatient mortality. Is it a predictor of quality?N Engl J Med.1987;317(26):1674–1680.
- ,.Relationship between Medicare's hospital compare performance measures and mortality rates.JAMA.2006;296(22):2694–2702.
- ,,.Public reporting of discharge planning and rates of readmissions.N Engl J Med.2009;361(27):2637–2645.
- ,,, et al.Process of care performance measures and long‐term outcomes in patients hospitalized with heart failure.Med Care.2010;48(3):210–216.
- ,,,,,.Variations in inpatient mortality among hospitals in different system types, 1995 to 2000.Med Care.2009;47(4):466–473.
- ,,, et al.A systematic review and meta‐analysis of studies comparing mortality rates of private for‐profit and private not‐for‐profit hospitals.Can Med Assoc J.2002;166(11):1399–1406.
- ,,, et al.What distinguishes top‐performing hospitals in acute myocardial infarction mortality rates? A qualitative study.Ann Intern Med.2011;154(6):384–390.
- ,,.Perceptions of hospital safety climate and incidence of readmission.Health Serv Res.2011;46(2):596–616.
- ,,, et al.Decrease in hospital‐wide mortality rate after implementation of a commercially sold computerized physician order entry system.Pediatrics.2010;126(1):14–21.
- ,,.The condition of the literature on differences in hospital mortality.Med Care.1989;27(4):315–336.
- ,,.Threshold volumes associated with higher survival in health care: a systematic review.Med Care.2003;41(10):1129–1141.
- ,,, et al.Hospital volume and 30‐day mortality for three common medical conditions.N Engl J Med.2010;362(12):1110–1118.
- Patient Protection and Affordable Care Act Pub. L. No. 111–148, 124 Stat, §3025.2010. Available at: http://www.gpo.gov/fdsys/pkg/PLAW‐111publ148/content‐detail.html. Accessed on July 26, year="2012"2012.
- ,,.Are mortality rates for different operations related? Implications for measuring the quality of noncardiac surgery.Med Care.2006;44(8):774–778.
- ,,,.Do hospitals with low mortality rates in coronary artery bypass also perform well in valve replacement?Ann Thorac Surg.2003;76(4):1131–1137.
- ,,,,.Differences among hospitals in Medicare patient mortality.Health Serv Res.1989;24(1):1–31.
- ,,,.Variations in standardized hospital mortality rates for six common medical diagnoses: implications for profiling hospital quality.Med Care.1998;36(7):955–964.
- ,,, et al.Development, validation, and results of a measure of 30‐day readmission following hospitalization for pneumonia.J Hosp Med.2011;6(3):142–150.
- ,,, et al.An administrative claims measure suitable for profiling hospital performance on the basis of 30‐day all‐cause readmission rates among patients with heart failure.Circ Cardiovasc Qual Outcomes.2008;1:29–37.
- ,,, et al.Quality of care for acute myocardial infarction at urban safety‐net hospitals.Health Aff (Millwood).2007;26(1):238–248.
- National Quality Measures Clearinghouse.2011. Available at: http://www.qualitymeasures.ahrq.gov/. Accessed February 21,year="2011"2011.
- ,,, et al.An administrative claims model suitable for profiling hospital performance based on 30‐day mortality rates among patients with an acute myocardial infarction.Circulation.2006;113(13):1683–1692.
- ,,, et al.An administrative claims model suitable for profiling hospital performance based on 30‐day mortality rates among patients with heart failure.Circulation.2006;113(13):1693–1701.
- ,,, et al.An administrative claims model for profiling hospital 30‐day mortality rates for pneumonia patients.PLoS One.2011;6(4):e17401.
- ,,, et al.An administrative claims measure suitable for profiling hospital performance based on 30‐day all‐cause readmission rates among patients with acute myocardial infarction.Circ Cardiovasc Qual Outcomes.2011;4(2):243–252.
- .The application of electronic computers to factor analysis.Educ Psychol Meas.1960;20:141–151.
- .On the ‘probable error’ of a coefficient of correlation deduced from a small sample.Metron.1921;1:3–32.
- ,,.Comparing correlated but nonoverlapping correlations.Psychol Methods.1996;1(2):178–183.
- Centers for Medicare and Medicaid Services.Medicare Shared Savings Program: Accountable Care Organizations, Final Rule.Fed Reg.2011;76:67802–67990.
- Massachusetts Healthcare Quality and Cost Council. Potentially Preventable Readmissions.2011. Available at: http://www.mass.gov/hqcc/the‐hcqcc‐council/data‐submission‐information/potentially‐preventable‐readmissions‐ppr.html. Accessed February 29, 2012.
- Texas Medicaid. Potentially Preventable Readmission (PPR).2012. Available at: http://www.tmhp.com/Pages/Medicaid/Hospital_PPR.aspx. Accessed February 29, 2012.
- New York State. Potentially Preventable Readmissions.2011. Available at: http://www.health.ny.gov/regulations/recently_adopted/docs/2011–02‐23_potentially_preventable_readmissions.pdf. Accessed February 29, 2012.
- ,,,,.Variability in the measurement of hospital‐wide mortality rates.N Engl J Med.2010;363(26):2530–2539.
- ,,, et al.Use of electronic health records in U.S. hospitals.N Engl J Med.2009;360(16):1628–1638.
The Centers for Medicare & Medicaid Services (CMS) publicly reports hospital‐specific, 30‐day risk‐standardized mortality and readmission rates for Medicare fee‐for‐service patients admitted with acute myocardial infarction (AMI), heart failure (HF), and pneumonia.1 These measures are intended to reflect hospital performance on quality of care provided to patients during and after hospitalization.2, 3
Quality‐of‐care measures for a given disease are often assumed to reflect the quality of care for that particular condition. However, studies have found limited association between condition‐specific process measures and either mortality or readmission rates for those conditions.46 Mortality and readmission rates may instead reflect broader hospital‐wide or specialty‐wide structure, culture, and practice. For example, studies have previously found that hospitals differ in mortality or readmission rates according to organizational structure,7 financial structure,8 culture,9, 10 information technology,11 patient volume,1214 academic status,12 and other institution‐wide factors.12 There is now a strong policy push towards developing hospital‐wide (all‐condition) measures, beginning with readmission.15
It is not clear how much of the quality of care for a given condition is attributable to hospital‐wide influences that affect all conditions rather than disease‐specific factors. If readmission or mortality performance for a particular condition reflects, in large part, broader institutional characteristics, then improvement efforts might better be focused on hospital‐wide activities, such as team training or implementing electronic medical records. On the other hand, if the disease‐specific measures reflect quality strictly for those conditions, then improvement efforts would be better focused on disease‐specific care, such as early identification of the relevant patient population or standardizing disease‐specific care. As hospitals work to improve performance across an increasingly wide variety of conditions, it is becoming more important for hospitals to prioritize and focus their activities effectively and efficiently.
One means of determining the relative contribution of hospital versus disease factors is to explore whether outcome rates are consistent among different conditions cared for in the same hospital. If mortality (or readmission) rates across different conditions are highly correlated, it would suggest that hospital‐wide factors may play a substantive role in outcomes. Some studies have found that mortality for a particular surgical condition is a useful proxy for mortality for other surgical conditions,16, 17 while other studies have found little correlation among mortality rates for various medical conditions.18, 19 It is also possible that correlation varies according to hospital characteristics; for example, smaller or nonteaching hospitals might be more homogenous in their care than larger, less homogeneous institutions. No studies have been performed using publicly reported estimates of risk‐standardized mortality or readmission rates. In this study we use the publicly reported measures of 30‐day mortality and 30‐day readmission for AMI, HF, and pneumonia to examine whether, and to what degree, mortality rates track together within US hospitals, and separately, to what degree readmission rates track together within US hospitals.
METHODS
Data Sources
CMS calculates risk‐standardized mortality and readmission rates, and patient volume, for all acute care nonfederal hospitals with one or more eligible case of AMI, HF, and pneumonia annually based on fee‐for‐service (FFS) Medicare claims. CMS publicly releases the rates for the large subset of hospitals that participate in public reporting and have 25 or more cases for the conditions over the 3‐year period between July 2006 and June 2009. We estimated the rates for all hospitals included in the measure calculations, including those with fewer than 25 cases, using the CMS methodology and data obtained from CMS. The distribution of these rates has been previously reported.20, 21 In addition, we used the 2008 American Hospital Association (AHA) Survey to obtain data about hospital characteristics, including number of beds, hospital ownership (government, not‐for‐profit, for‐profit), teaching status (member of Council of Teaching Hospitals, other teaching hospital, nonteaching), presence of specialized cardiac capabilities (coronary artery bypass graft surgery, cardiac catheterization lab without cardiac surgery, neither), US Census Bureau core‐based statistical area (division [subarea of area with urban center >2.5 million people], metropolitan [urban center of at least 50,000 people], micropolitan [urban center of between 10,000 and 50,000 people], and rural [<10,000 people]), and safety net status22 (yes/no). Safety net status was defined as either public hospitals or private hospitals with a Medicaid caseload greater than one standard deviation above their respective state's mean private hospital Medicaid caseload using the 2007 AHA Annual Survey data.
Study Sample
This study includes 2 hospital cohorts, 1 for mortality and 1 for readmission. Hospitals were eligible for the mortality cohort if the dataset included risk‐standardized mortality rates for all 3 conditions (AMI, HF, and pneumonia). Hospitals were eligible for the readmission cohort if the dataset included risk‐standardized readmission rates for all 3 of these conditions.
Risk‐Standardized Measures
The measures include all FFS Medicare patients who are 65 years old, have been enrolled in FFS Medicare for the 12 months before the index hospitalization, are admitted with 1 of the 3 qualifying diagnoses, and do not leave the hospital against medical advice. The mortality measures include all deaths within 30 days of admission, and all deaths are attributable to the initial admitting hospital, even if the patient is then transferred to another acute care facility. Therefore, for a given hospital, transfers into the hospital are excluded from its rate, but transfers out are included. The readmission measures include all readmissions within 30 days of discharge, and all readmissions are attributable to the final discharging hospital, even if the patient was originally admitted to a different acute care facility. Therefore, for a given hospital, transfers in are included in its rate, but transfers out are excluded. For mortality measures, only 1 hospitalization for a patient in a specific year is randomly selected if the patient has multiple hospitalizations in the year. For readmission measures, admissions in which the patient died prior to discharge, and admissions within 30 days of an index admission, are not counted as index admissions.
Outcomes for all measures are all‐cause; however, for the AMI readmission measure, planned admissions for cardiac procedures are not counted as readmissions. Patients in observation status or in non‐acute care facilities are not counted as readmissions. Detailed specifications for the outcomes measures are available at the National Quality Measures Clearinghouse.23
The derivation and validation of the risk‐standardized outcome measures have been previously reported.20, 21, 2327 The measures are derived from hierarchical logistic regression models that include age, sex, clinical covariates, and a hospital‐specific random effect. The rates are calculated as the ratio of the number of predicted outcomes (obtained from a model applying the hospital‐specific effect) to the number of expected outcomes (obtained from a model applying the average effect among hospitals), multiplied by the unadjusted overall 30‐day rate.
Statistical Analysis
We examined patterns and distributions of hospital volume, risk‐standardized mortality rates, and risk‐standardized readmission rates among included hospitals. To measure the degree of association among hospitals' risk‐standardized mortality rates for AMI, HF, and pneumonia, we calculated Pearson correlation coefficients, resulting in 3 correlations for the 3 pairs of conditions (AMI and HF, AMI and pneumonia, HF and pneumonia), and tested whether they were significantly different from 0. We also conducted a factor analysis using the principal component method with a minimum eigenvalue of 1 to retain factors to determine whether there was a single common factor underlying mortality performance for the 3 conditions.28 Finally, we divided hospitals into quartiles of performance for each outcome based on the point estimate of risk‐standardized rate, and compared quartile of performance between condition pairs for each outcome. For each condition pair, we assessed the percent of hospitals in the same quartile of performance in both conditions, the percent of hospitals in either the top quartile of performance or the bottom quartile of performance for both, and the percent of hospitals in the top quartile for one and the bottom quartile for the other. We calculated the weighted kappa for agreement on quartile of performance between condition pairs for each outcome and the Spearman correlation for quartiles of performance. Then, we examined Pearson correlation coefficients in different subgroups of hospitals, including by size, ownership, teaching status, cardiac procedure capability, statistical area, and safety net status. In order to determine whether these correlations differed by hospital characteristics, we tested if the Pearson correlation coefficients were different between any 2 subgroups using the method proposed by Fisher.29 We repeated all of these analyses separately for the risk‐standardized readmission rates.
To determine whether correlations between mortality rates were significantly different than correlations between readmission rates for any given condition pair, we used the method recommended by Raghunathan et al.30 For these analyses, we included only hospitals reporting both mortality and readmission rates for the condition pairs. We used the same methods to determine whether correlations between mortality rates were significantly different than correlations between readmission rates for any given condition pair among subgroups of hospital characteristics.
All analyses and graphing were performed using the SAS statistical package version 9.2 (SAS Institute, Cary, NC). We considered a P‐value < 0.05 to be statistically significant, and all statistical tests were 2‐tailed.
RESULTS
The mortality cohort included 4559 hospitals, and the readmission cohort included 4468 hospitals. The majority of hospitals was small, nonteaching, and did not have advanced cardiac capabilities such as cardiac surgery or cardiac catheterization (Table 1).
| Description | Mortality Measures | Readmission Measures |
|---|---|---|
| Hospital N = 4559 | Hospital N = 4468 | |
| N (%)* | N (%)* | |
| ||
| No. of beds | ||
| >600 | 157 (3.4) | 156 (3.5) |
| 300600 | 628 (13.8) | 626 (14.0) |
| <300 | 3588 (78.7) | 3505 (78.5) |
| Unknown | 186 (4.08) | 181 (4.1) |
| Mean (SD) | 173.24 (189.52) | 175.23 (190.00) |
| Ownership | ||
| Not‐for‐profit | 2650 (58.1) | 2619 (58.6) |
| For‐profit | 672 (14.7) | 663 (14.8) |
| Government | 1051 (23.1) | 1005 (22.5) |
| Unknown | 186 (4.1) | 181 (4.1) |
| Teaching status | ||
| COTH | 277 (6.1) | 276 (6.2) |
| Teaching | 505 (11.1) | 503 (11.3) |
| Nonteaching | 3591 (78.8) | 3508 (78.5) |
| Unknown | 186 (4.1) | 181 (4.1) |
| Cardiac facility type | ||
| CABG | 1471 (32.3) | 1467 (32.8) |
| Cath lab | 578 (12.7) | 578 (12.9) |
| Neither | 2324 (51.0) | 2242 (50.2) |
| Unknown | 186 (4.1) | 181 (4.1) |
| Core‐based statistical area | ||
| Division | 621 (13.6) | 618 (13.8) |
| Metro | 1850 (40.6) | 1835 (41.1) |
| Micro | 801 (17.6) | 788 (17.6) |
| Rural | 1101 (24.2) | 1046 (23.4) |
| Unknown | 186 (4.1) | 181 (4.1) |
| Safety net status | ||
| No | 2995 (65.7) | 2967 (66.4) |
| Yes | 1377 (30.2) | 1319 (29.5) |
| Unknown | 187 (4.1) | 182 (4.1) |
For mortality measures, the smallest median number of cases per hospital was for AMI (48; interquartile range [IQR], 13,171), and the greatest number was for pneumonia (178; IQR, 87, 336). The same pattern held for readmission measures (AMI median 33; IQR; 9, 150; pneumonia median 191; IQR, 95, 352.5). With respect to mortality measures, AMI had the highest rate and HF the lowest rate; however, for readmission measures, HF had the highest rate and pneumonia the lowest rate (Table 2).
| Description | Mortality Measures (N = 4559) | Readmission Measures (N = 4468) | ||||
|---|---|---|---|---|---|---|
| AMI | HF | PN | AMI | HF | PN | |
| ||||||
| Total discharges | 558,653 | 1,094,960 | 1,114,706 | 546,514 | 1,314,394 | 1,152,708 |
| Hospital volume | ||||||
| Mean (SD) | 122.54 (172.52) | 240.18 (271.35) | 244.51 (220.74) | 122.32 (201.78) | 294.18 (333.2) | 257.99 (228.5) |
| Median (IQR) | 48 (13, 171) | 142 (56, 337) | 178 (87, 336) | 33 (9, 150) | 172.5 (68, 407) | 191 (95, 352.5) |
| Range min, max | 1, 1379 | 1, 2814 | 1, 2241 | 1, 1611 | 1, 3410 | 2, 2359 |
| 30‐Day risk‐standardized rate* | ||||||
| Mean (SD) | 15.7 (1.8) | 10.9 (1.6) | 11.5 (1.9) | 19.9 (1.5) | 24.8 (2.1) | 18.5 (1.7) |
| Median (IQR) | 15.7 (14.5, 16.8) | 10.8 (9.9, 11.9) | 11.3 (10.2, 12.6) | 19.9 (18.9, 20.8) | 24.7 (23.4, 26.1) | 18.4 (17.3, 19.5) |
| Range min, max | 10.3, 24.6 | 6.6, 18.2 | 6.7, 20.9 | 15.2, 26.3 | 17.3, 32.4 | 13.6, 26.7 |
Every mortality measure was significantly correlated with every other mortality measure (range of correlation coefficients, 0.270.41, P < 0.0001 for all 3 correlations). For example, the correlation between risk‐standardized mortality rates (RSMR) for HF and pneumonia was 0.41. Similarly, every readmission measure was significantly correlated with every other readmission measure (range of correlation coefficients, 0.320.47; P < 0.0001 for all 3 correlations). Overall, the lowest correlation was between risk‐standardized mortality rates for AMI and pneumonia (r = 0.27), and the highest correlation was between risk‐standardized readmission rates (RSRR) for HF and pneumonia (r = 0.47) (Table 3).
| Description | Mortality Measures | Readmission Measures | ||||||||||||
|---|---|---|---|---|---|---|---|---|---|---|---|---|---|---|
| N | AMI and HF | AMI and PN | HF and PN | AMI and HF | AMI and PN | HF and PN | ||||||||
| r | P | r | P | r | P | N | r | P | r | P | r | P | ||
| ||||||||||||||
| All | 4559 | 0.30 | 0.27 | 0.41 | 4468 | 0.38 | 0.32 | 0.47 | ||||||
| Hospitals with 25 patients | 2872 | 0.33 | 0.30 | 0.44 | 2467 | 0.44 | 0.38 | 0.51 | ||||||
| No. of beds | 0.15 | 0.005 | 0.0009 | <0.0001 | <0.0001 | <0.0001 | ||||||||
| >600 | 157 | 0.38 | 0.43 | 0.51 | 156 | 0.67 | 0.50 | 0.66 | ||||||
| 300600 | 628 | 0.29 | 0.30 | 0.49 | 626 | 0.54 | 0.45 | 0.58 | ||||||
| <300 | 3588 | 0.27 | 0.23 | 0.37 | 3505 | 0.30 | 0.26 | 0.44 | ||||||
| Ownership | 0.021 | 0.05 | 0.39 | 0.0004 | 0.0004 | 0.003 | ||||||||
| Not‐for‐profit | 2650 | 0.32 | 0.28 | 0.42 | 2619 | 0.43 | 0.36 | 0.50 | ||||||
| For‐profit | 672 | 0.30 | 0.23 | 0.40 | 663 | 0.29 | 0.22 | 0.40 | ||||||
| Government | 1051 | 0.24 | 0.22 | 0.39 | 1005 | 0.32 | 0.29 | 0.45 | ||||||
| Teaching status | 0.11 | 0.08 | 0.0012 | <0.0001 | 0.0002 | 0.0003 | ||||||||
| COTH | 277 | 0.31 | 0.34 | 0.54 | 276 | 0.54 | 0.47 | 0.59 | ||||||
| Teaching | 505 | 0.22 | 0.28 | 0.43 | 503 | 0.52 | 0.42 | 0.56 | ||||||
| Nonteaching | 3591 | 0.29 | 0.24 | 0.39 | 3508 | 0.32 | 0.26 | 0.44 | ||||||
| Cardiac facility type | 0.022 | 0.006 | <0.0001 | <0.0001 | 0.0006 | 0.004 | ||||||||
| CABG | 1471 | 0.33 | 0.29 | 0.47 | 1467 | 0.48 | 0.37 | 0.52 | ||||||
| Cath lab | 578 | 0.25 | 0.26 | 0.36 | 578 | 0.32 | 0.37 | 0.47 | ||||||
| Neither | 2324 | 0.26 | 0.21 | 0.36 | 2242 | 0.28 | 0.27 | 0.44 | ||||||
| Core‐based statistical area | 0.0001 | <0.0001 | 0.002 | <0.0001 | <0.0001 | <0.0001 | ||||||||
| Division | 621 | 0.38 | 0.34 | 0.41 | 618 | 0.46 | 0.40 | 0.56 | ||||||
| Metro | 1850 | 0.26 | 0.26 | 0.42 | 1835 | 0.38 | 0.30 | 0.40 | ||||||
| Micro | 801 | 0.23 | 0.22 | 0.34 | 788 | 0.32 | 0.30 | 0.47 | ||||||
| Rural | 1101 | 0.21 | 0.13 | 0.32 | 1046 | 0.22 | 0.21 | 0.44 | ||||||
| Safety net status | 0.001 | 0.027 | 0.68 | 0.029 | 0.037 | 0.28 | ||||||||
| No | 2995 | 0.33 | 0.28 | 0.41 | 2967 | 0.40 | 0.33 | 0.48 | ||||||
| Yes | 1377 | 0.23 | 0.21 | 0.40 | 1319 | 0.34 | 0.30 | 0.45 | ||||||
Both the factor analysis for the mortality measures and the factor analysis for the readmission measures yielded only one factor with an eigenvalue >1. In each factor analysis, this single common factor kept more than half of the data based on the cumulative eigenvalue (55% for mortality measures and 60% for readmission measures). For the mortality measures, the pattern of RSMR for myocardial infarction (MI), heart failure (HF), and pneumonia (PN) in the factor was high (0.68 for MI, 0.78 for HF, and 0.76 for PN); the same was true of the RSRR in the readmission measures (0.72 for MI, 0.81 for HF, and 0.78 for PN).
For all condition pairs and both outcomes, a third or more of hospitals were in the same quartile of performance for both conditions of the pair (Table 4). Hospitals were more likely to be in the same quartile of performance if they were in the top or bottom quartile than if they were in the middle. Less than 10% of hospitals were in the top quartile for one condition in the mortality or readmission pair and in the bottom quartile for the other condition in the pair. Kappa scores for same quartile of performance between pairs of outcomes ranged from 0.16 to 0.27, and were highest for HF and pneumonia for both mortality and readmission rates.
| Condition Pair | Same Quartile (Any) (%) | Same Quartile (Q1 or Q4) (%) | Q1 in One and Q4 in Another (%) | Weighted Kappa | Spearman Correlation |
|---|---|---|---|---|---|
| |||||
| Mortality | |||||
| MI and HF | 34.8 | 20.2 | 7.9 | 0.19 | 0.25 |
| MI and PN | 32.7 | 18.8 | 8.2 | 0.16 | 0.22 |
| HF and PN | 35.9 | 21.8 | 5.0 | 0.26 | 0.36 |
| Readmission | |||||
| MI and HF | 36.6 | 21.0 | 7.5 | 0.22 | 0.28 |
| MI and PN | 34.0 | 19.6 | 8.1 | 0.19 | 0.24 |
| HF and PN | 37.1 | 22.6 | 5.4 | 0.27 | 0.37 |
In subgroup analyses, the highest mortality correlation was between HF and pneumonia in hospitals with more than 600 beds (r = 0.51, P = 0.0009), and the highest readmission correlation was between AMI and HF in hospitals with more than 600 beds (r = 0.67, P < 0.0001). Across both measures and all 3 condition pairs, correlations between conditions increased with increasing hospital bed size, presence of cardiac surgery capability, and increasing population of the hospital's Census Bureau statistical area. Furthermore, for most measures and condition pairs, correlations between conditions were highest in not‐for‐profit hospitals, hospitals belonging to the Council of Teaching Hospitals, and non‐safety net hospitals (Table 3).
For all condition pairs, the correlation between readmission rates was significantly higher than the correlation between mortality rates (P < 0.01). In subgroup analyses, readmission correlations were also significantly higher than mortality correlations for all pairs of conditions among moderate‐sized hospitals, among nonprofit hospitals, among teaching hospitals that did not belong to the Council of Teaching Hospitals, and among non‐safety net hospitals (Table 5).
| Description | AMI and HF | AMI and PN | HF and PN | |||||||||
|---|---|---|---|---|---|---|---|---|---|---|---|---|
| N | MC | RC | P | N | MC | RC | P | N | MC | RC | P | |
| ||||||||||||
| All | 4457 | 0.31 | 0.38 | <0.0001 | 4459 | 0.27 | 0.32 | 0.007 | 4731 | 0.41 | 0.46 | 0.0004 |
| Hospitals with 25 patients | 2472 | 0.33 | 0.44 | <0.001 | 2463 | 0.31 | 0.38 | 0.01 | 4104 | 0.42 | 0.47 | 0.001 |
| No. of beds | ||||||||||||
| >600 | 156 | 0.38 | 0.67 | 0.0002 | 156 | 0.43 | 0.50 | 0.48 | 160 | 0.51 | 0.66 | 0.042 |
| 300600 | 626 | 0.29 | 0.54 | <0.0001 | 626 | 0.31 | 0.45 | 0.003 | 630 | 0.49 | 0.58 | 0.033 |
| <300 | 3494 | 0.28 | 0.30 | 0.21 | 3496 | 0.23 | 0.26 | 0.17 | 3733 | 0.37 | 0.43 | 0.003 |
| Ownership | ||||||||||||
| Not‐for‐profit | 2614 | 0.32 | 0.43 | <0.0001 | 2617 | 0.28 | 0.36 | 0.003 | 2697 | 0.42 | 0.50 | 0.0003 |
| For‐profit | 662 | 0.30 | 0.29 | 0.90 | 661 | 0.23 | 0.22 | 0.75 | 699 | 0.40 | 0.40 | 0.99 |
| Government | 1000 | 0.25 | 0.32 | 0.09 | 1000 | 0.22 | 0.29 | 0.09 | 1127 | 0.39 | 0.43 | 0.21 |
| Teaching status | ||||||||||||
| COTH | 276 | 0.31 | 0.54 | 0.001 | 277 | 0.35 | 0.46 | 0.10 | 278 | 0.54 | 0.59 | 0.41 |
| Teaching | 504 | 0.22 | 0.52 | <0.0001 | 504 | 0.28 | 0.42 | 0.012 | 508 | 0.43 | 0.56 | 0.005 |
| Nonteaching | 3496 | 0.29 | 0.32 | 0.18 | 3497 | 0.24 | 0.26 | 0.46 | 3737 | 0.39 | 0.43 | 0.016 |
| Cardiac facility type | ||||||||||||
| CABG | 1465 | 0.33 | 0.48 | <0.0001 | 1467 | 0.30 | 0.37 | 0.018 | 1483 | 0.47 | 0.51 | 0.103 |
| Cath lab | 577 | 0.25 | 0.32 | 0.18 | 577 | 0.26 | 0.37 | 0.046 | 579 | 0.36 | 0.47 | 0.022 |
| Neither | 2234 | 0.26 | 0.28 | 0.48 | 2234 | 0.21 | 0.27 | 0.037 | 2461 | 0.36 | 0.44 | 0.002 |
| Core‐based statistical area | ||||||||||||
| Division | 618 | 0.38 | 0.46 | 0.09 | 620 | 0.34 | 0.40 | 0.18 | 630 | 0.41 | 0.56 | 0.001 |
| Metro | 1833 | 0.26 | 0.38 | <0.0001 | 1832 | 0.26 | 0.30 | 0.21 | 1896 | 0.42 | 0.40 | 0.63 |
| Micro | 787 | 0.24 | 0.32 | 0.08 | 787 | 0.22 | 0.30 | 0.11 | 820 | 0.34 | 0.46 | 0.003 |
| Rural | 1038 | 0.21 | 0.22 | 0.83 | 1039 | 0.13 | 0.21 | 0.056 | 1177 | 0.32 | 0.43 | 0.002 |
| Safety net status | ||||||||||||
| No | 2961 | 0.33 | 0.40 | 0.001 | 2963 | 0.28 | 0.33 | 0.036 | 3062 | 0.41 | 0.48 | 0.001 |
| Yes | 1314 | 0.23 | 0.34 | 0.003 | 1314 | 0.22 | 0.30 | 0.015 | 1460 | 0.40 | 0.45 | 0.14 |
DISCUSSION
In this study, we found that risk‐standardized mortality rates for 3 common medical conditions were moderately correlated within institutions, as were risk‐standardized readmission rates. Readmission rates were more strongly correlated than mortality rates, and all rates tracked closest together in large, urban, and/or teaching hospitals. Very few hospitals were in the top quartile of performance for one condition and in the bottom quartile for a different condition.
Our findings are consistent with the hypothesis that 30‐day risk‐standardized mortality and 30‐day risk‐standardized readmission rates, in part, capture broad aspects of hospital quality that transcend condition‐specific activities. In this study, readmission rates tracked better together than mortality rates for every pair of conditions, suggesting that there may be a greater contribution of hospital‐wide environment, structure, and processes to readmission rates than to mortality rates. This difference is plausible because services specific to readmission, such as discharge planning, care coordination, medication reconciliation, and discharge communication with patients and outpatient clinicians, are typically hospital‐wide processes.
Our study differs from earlier studies of medical conditions in that the correlations we found were higher.18, 19 There are several possible explanations for this difference. First, during the intervening 1525 years since those studies were performed, care for these conditions has evolved substantially, such that there are now more standardized protocols available for all 3 of these diseases. Hospitals that are sufficiently organized or acculturated to systematically implement care protocols may have the infrastructure or culture to do so for all conditions, increasing correlation of performance among conditions. In addition, there are now more technologies and systems available that span care for multiple conditions, such as electronic medical records and quality committees, than were available in previous generations. Second, one of these studies utilized less robust risk‐adjustment,18 and neither used the same methodology of risk standardization. Nonetheless, it is interesting to note that Rosenthal and colleagues identified the same increase in correlation with higher volumes than we did.19 Studies investigating mortality correlations among surgical procedures, on the other hand, have generally found higher correlations than we found in these medical conditions.16, 17
Accountable care organizations will be assessed using an all‐condition readmission measure,31 several states track all‐condition readmission rates,3234 and several countries measure all‐condition mortality.35 An all‐condition measure for quality assessment first requires that there be a hospital‐wide quality signal above and beyond disease‐specific care. This study suggests that a moderate signal exists for readmission and, to a slightly lesser extent, for mortality, across 3 common conditions. There are other considerations, however, in developing all‐condition measures. There must be adequate risk adjustment for the wide variety of conditions that are included, and there must be a means of accounting for the variation in types of conditions and procedures cared for by different hospitals. Our study does not address these challenges, which have been described to be substantial for mortality measures.35
We were surprised by the finding that risk‐standardized rates correlated more strongly within larger institutions than smaller ones, because one might assume that care within smaller hospitals might be more homogenous. It may be easier, however, to detect a quality signal in hospitals with higher volumes of patients for all 3 conditions, because estimates for these hospitals are more precise. Consequently, we have greater confidence in results for larger volumes, and suspect a similar quality signal may be present but more difficult to detect statistically in smaller hospitals. Overall correlations were higher when we restricted the sample to hospitals with at least 25 cases, as is used for public reporting. It is also possible that the finding is real given that large‐volume hospitals have been demonstrated to provide better care for these conditions and are more likely to adopt systems of care that affect multiple conditions, such as electronic medical records.14, 36
The kappa scores comparing quartile of national performance for pairs of conditions were only in the fair range. There are several possible explanations for this fact: 1) outcomes for these 3 conditions are not measuring the same constructs; 2) they are all measuring the same construct, but they are unreliable in doing so; and/or 3) hospitals have similar latent quality for all 3 conditions, but the national quality of performance differs by condition, yielding variable relative performance per hospital for each condition. Based solely on our findings, we cannot distinguish which, if any, of these explanations may be true.31
Our study has several limitations. First, all 3 conditions currently publicly reported by CMS are medical diagnoses, although AMI patients may be cared for in distinct cardiology units and often undergo procedures; therefore, we cannot determine the degree to which correlations reflect hospital‐wide quality versus medicine‐wide quality. An institution may have a weak medicine department but a strong surgical department or vice versa. Second, it is possible that the correlations among conditions for readmission and among conditions for mortality are attributable to patient characteristics that are not adequately adjusted for in the risk‐adjustment model, such as socioeconomic factors, or to hospital characteristics not related to quality, such as coding practices or inter‐hospital transfer rates. For this to be true, these unmeasured characteristics would have to be consistent across different conditions within each hospital and have a consistent influence on outcomes. Third, it is possible that public reporting may have prompted disease‐specific focus on these conditions. We do not have data from non‐publicly reported conditions to test this hypothesis. Fourth, there are many small‐volume hospitals in this study; their estimates for readmission and mortality are less reliable than for large‐volume hospitals, potentially limiting our ability to detect correlations in this group of hospitals.
This study lends credence to the hypothesis that 30‐day risk‐standardized mortality and readmission rates for individual conditions may reflect aspects of hospital‐wide quality or at least medicine‐wide quality, although the correlations are not large enough to conclude that hospital‐wide factors play a dominant role, and there are other possible explanations for the correlations. Further work is warranted to better understand the causes of the correlations, and to better specify the nature of hospital factors that contribute to correlations among outcomes.
Acknowledgements
Disclosures: Dr Horwitz is supported by the National Institute on Aging (K08 AG038336) and by the American Federation of Aging Research through the Paul B. Beeson Career Development Award Program. Dr Horwitz is also a Pepper Scholar with support from the Claude D. Pepper Older Americans Independence Center at Yale University School of Medicine (P30 AG021342 NIH/NIA). Dr Krumholz is supported by grant U01 HL105270‐01 (Center for Cardiovascular Outcomes Research at Yale University) from the National Heart, Lung, and Blood Institute. Dr Krumholz chairs a cardiac scientific advisory board for UnitedHealth. Authors Drye, Krumholz, and Wang receive support from the Centers for Medicare & Medicaid Services (CMS) to develop and maintain performance measures that are used for public reporting. The analyses upon which this publication is based were performed under Contract Number HHSM‐500‐2008‐0025I Task Order T0001, entitled Measure & Instrument Development and Support (MIDS)Development and Re‐evaluation of the CMS Hospital Outcomes and Efficiency Measures, funded by the Centers for Medicare & Medicaid Services, an agency of the US Department of Health and Human Services. The Centers for Medicare & Medicaid Services reviewed and approved the use of its data for this work, and approved submission of the manuscript. The content of this publication does not necessarily reflect the views or policies of the Department of Health and Human Services, nor does mention of trade names, commercial products, or organizations imply endorsement by the US Government. The authors assume full responsibility for the accuracy and completeness of the ideas presented.
- US Department of Health and Human Services. Hospital Compare.2011. Available at: http://www.hospitalcompare.hhs.gov. Accessed March 5, 2011.
- ,,.Early readmissions to the department of medicine as a screening tool for monitoring quality of care problems.Medicine (Baltimore).2008;87(5):294–300.
- ,,,,.Hospital inpatient mortality. Is it a predictor of quality?N Engl J Med.1987;317(26):1674–1680.
- ,.Relationship between Medicare's hospital compare performance measures and mortality rates.JAMA.2006;296(22):2694–2702.
- ,,.Public reporting of discharge planning and rates of readmissions.N Engl J Med.2009;361(27):2637–2645.
- ,,, et al.Process of care performance measures and long‐term outcomes in patients hospitalized with heart failure.Med Care.2010;48(3):210–216.
- ,,,,,.Variations in inpatient mortality among hospitals in different system types, 1995 to 2000.Med Care.2009;47(4):466–473.
- ,,, et al.A systematic review and meta‐analysis of studies comparing mortality rates of private for‐profit and private not‐for‐profit hospitals.Can Med Assoc J.2002;166(11):1399–1406.
- ,,, et al.What distinguishes top‐performing hospitals in acute myocardial infarction mortality rates? A qualitative study.Ann Intern Med.2011;154(6):384–390.
- ,,.Perceptions of hospital safety climate and incidence of readmission.Health Serv Res.2011;46(2):596–616.
- ,,, et al.Decrease in hospital‐wide mortality rate after implementation of a commercially sold computerized physician order entry system.Pediatrics.2010;126(1):14–21.
- ,,.The condition of the literature on differences in hospital mortality.Med Care.1989;27(4):315–336.
- ,,.Threshold volumes associated with higher survival in health care: a systematic review.Med Care.2003;41(10):1129–1141.
- ,,, et al.Hospital volume and 30‐day mortality for three common medical conditions.N Engl J Med.2010;362(12):1110–1118.
- Patient Protection and Affordable Care Act Pub. L. No. 111–148, 124 Stat, §3025.2010. Available at: http://www.gpo.gov/fdsys/pkg/PLAW‐111publ148/content‐detail.html. Accessed on July 26, year="2012"2012.
- ,,.Are mortality rates for different operations related? Implications for measuring the quality of noncardiac surgery.Med Care.2006;44(8):774–778.
- ,,,.Do hospitals with low mortality rates in coronary artery bypass also perform well in valve replacement?Ann Thorac Surg.2003;76(4):1131–1137.
- ,,,,.Differences among hospitals in Medicare patient mortality.Health Serv Res.1989;24(1):1–31.
- ,,,.Variations in standardized hospital mortality rates for six common medical diagnoses: implications for profiling hospital quality.Med Care.1998;36(7):955–964.
- ,,, et al.Development, validation, and results of a measure of 30‐day readmission following hospitalization for pneumonia.J Hosp Med.2011;6(3):142–150.
- ,,, et al.An administrative claims measure suitable for profiling hospital performance on the basis of 30‐day all‐cause readmission rates among patients with heart failure.Circ Cardiovasc Qual Outcomes.2008;1:29–37.
- ,,, et al.Quality of care for acute myocardial infarction at urban safety‐net hospitals.Health Aff (Millwood).2007;26(1):238–248.
- National Quality Measures Clearinghouse.2011. Available at: http://www.qualitymeasures.ahrq.gov/. Accessed February 21,year="2011"2011.
- ,,, et al.An administrative claims model suitable for profiling hospital performance based on 30‐day mortality rates among patients with an acute myocardial infarction.Circulation.2006;113(13):1683–1692.
- ,,, et al.An administrative claims model suitable for profiling hospital performance based on 30‐day mortality rates among patients with heart failure.Circulation.2006;113(13):1693–1701.
- ,,, et al.An administrative claims model for profiling hospital 30‐day mortality rates for pneumonia patients.PLoS One.2011;6(4):e17401.
- ,,, et al.An administrative claims measure suitable for profiling hospital performance based on 30‐day all‐cause readmission rates among patients with acute myocardial infarction.Circ Cardiovasc Qual Outcomes.2011;4(2):243–252.
- .The application of electronic computers to factor analysis.Educ Psychol Meas.1960;20:141–151.
- .On the ‘probable error’ of a coefficient of correlation deduced from a small sample.Metron.1921;1:3–32.
- ,,.Comparing correlated but nonoverlapping correlations.Psychol Methods.1996;1(2):178–183.
- Centers for Medicare and Medicaid Services.Medicare Shared Savings Program: Accountable Care Organizations, Final Rule.Fed Reg.2011;76:67802–67990.
- Massachusetts Healthcare Quality and Cost Council. Potentially Preventable Readmissions.2011. Available at: http://www.mass.gov/hqcc/the‐hcqcc‐council/data‐submission‐information/potentially‐preventable‐readmissions‐ppr.html. Accessed February 29, 2012.
- Texas Medicaid. Potentially Preventable Readmission (PPR).2012. Available at: http://www.tmhp.com/Pages/Medicaid/Hospital_PPR.aspx. Accessed February 29, 2012.
- New York State. Potentially Preventable Readmissions.2011. Available at: http://www.health.ny.gov/regulations/recently_adopted/docs/2011–02‐23_potentially_preventable_readmissions.pdf. Accessed February 29, 2012.
- ,,,,.Variability in the measurement of hospital‐wide mortality rates.N Engl J Med.2010;363(26):2530–2539.
- ,,, et al.Use of electronic health records in U.S. hospitals.N Engl J Med.2009;360(16):1628–1638.
Copyright © 2012 Society of Hospital Medicine
Hospitalist Utilization and Performance
The past several years have seen a dramatic increase in the percentage of patients cared for by hospitalists, yet an emerging body of literature examining the association between care given by hospitalists and performance on a number of process measures has shown mixed results. Hospitalists do not appear to provide higher quality of care for pneumonia,1, 2 while results in heart failure are mixed.35 Each of these studies was conducted at a single site, and examined patient‐level effects. More recently, Vasilevskis et al6 assessed the association between the intensity of hospitalist use (measured as the percentage of patients admitted by hospitalists) and performance on process measures. In a cohort of 208 California hospitals, they found a significant improvement in performance on process measures in patients with acute myocardial infarction, heart failure, and pneumonia with increasing percentages of patients admitted by hospitalists.6
To date, no study has examined the association between the use of hospitalists and the publicly reported 30‐day mortality and readmission measures. Specifically, the Centers for Medicare and Medicaid Services (CMS) have developed and now publicly report risk‐standardized 30‐day mortality (RSMR) and readmission rates (RSRR) for Medicare patients hospitalized for 3 common and costly conditionsacute myocardial infarction (AMI), heart failure (HF), and pneumonia.7 Performance on these hospital‐based quality measures varies widely, and vary by hospital volume, ownership status, teaching status, and nurse staffing levels.813 However, even accounting for these characteristics leaves much of the variation in outcomes unexplained. We hypothesized that the presence of hospitalists within a hospital would be associated with higher performance on 30‐day mortality and 30‐day readmission measures for AMI, HF, and pneumonia. We further hypothesized that for hospitals using hospitalists, there would be a positive correlation between increasing percentage of patients admitted by hospitalists and performance on outcome measures. To test these hypotheses, we conducted a national survey of hospitalist leaders, linking data from survey responses to data on publicly reported outcome measures for AMI, HF, and pneumonia.
MATERIALS AND METHODS
Study Sites
Of the 4289 hospitals in operation in 2008, 1945 had 25 or more AMI discharges. We identified hospitals using American Hospital Association (AHA) data, calling hospitals up to 6 times each until we reached our target sample size of 600. Using this methodology, we contacted 1558 hospitals of a possible 1920 with AHA data; of the 1558 called, 598 provided survey results.
Survey Data
Our survey was adapted from the survey developed by Vasilevskis et al.6 The entire survey can be found in the Appendix (see Supporting Information in the online version of this article). Our key questions were: 1) Does your hospital have at least 1 hospitalist program or group? 2) Approximately what percentage of all medical patients in your hospital are admitted by hospitalists? The latter question was intended as an approximation of the intensity of hospitalist use, and has been used in prior studies.6, 14 A more direct measure was not feasible given the complexity of obtaining admission data for such a large and diverse set of hospitals. Respondents were also asked about hospitalist care of AMI, HF, and pneumonia patients. Given the low likelihood of precise estimation of hospitalist participation in care for specific conditions, the response choices were divided into percentage quartiles: 025, 2650, 5175, and 76100. Finally, participants were asked a number of questions regarding hospitalist organizational and clinical characteristics.
Survey Process
We obtained data regarding presence or absence of hospitalists and characteristics of the hospitalist services via phone‐ and fax‐administered survey (see Supporting Information, Appendix, in the online version of this article). Telephone and faxed surveys were administered between February 2010 and January 2011. Hospital telephone numbers were obtained from the 2008 AHA survey database and from a review of each hospital's website. Up to 6 attempts were made to obtain a completed survey from nonrespondents unless participation was specifically refused. Potential respondents were contacted in the following order: hospital medicine department leaders, hospital medicine clinical managers, vice president for medical affairs, chief medical officers, and other hospital executives with knowledge of the hospital medicine services. All respondents agreed with a question asking whether they had direct working knowledge of their hospital medicine services; contacts who said they did not have working knowledge of their hospital medicine services were asked to refer our surveyor to the appropriate person at their site. Absence of a hospitalist program was confirmed by contacting the Medical Staff Office.
Hospital Organizational and Patient‐Mix Characteristics
Hospital‐level organizational characteristics (eg, bed size, teaching status) and patient‐mix characteristics (eg, Medicare and Medicaid inpatient days) were obtained from the 2008 AHA survey database.
Outcome Performance Measures
The 30‐day risk‐standardized mortality and readmission rates (RSMR and RSRR) for 2008 for AMI, HF, and pneumonia were calculated for all admissions for people age 65 and over with traditional fee‐for‐service Medicare. Beneficiaries had to be enrolled for 12 months prior to their hospitalization for any of the 3 conditions, and had to have complete claims data available for that 12‐month period.7 These 6 outcome measures were constructed using hierarchical generalized linear models.1520 Using the RSMR for AMI as an example, for each hospital, the measure is estimated by dividing the predicted number of deaths within 30 days of admission for AMI by the expected number of deaths within 30 days of admission for AMI. This ratio is then divided by the national unadjusted 30‐day mortality rate for AMI, which is obtained using data on deaths from the Medicare beneficiary denominator file. Each measure is adjusted for patient characteristics such as age, gender, and comorbidities. All 6 measures are endorsed by the National Quality Forum (NQF) and are reported publicly by CMS on the Hospital Compare web site.
Statistical Analysis
Comparison of hospital‐ and patient‐level characteristics between hospitals with and without hospitalists was performed using chi‐square tests and Student t tests.
The primary outcome variables are the RSMRs and RSRRs for AMI, HF, and pneumonia. Multivariable linear regression models were used to assess the relationship between hospitals with at least 1 hospitalist group and each dependent variable. Models were adjusted for variables previously reported to be associated with quality of care. Hospital‐level characteristics included core‐based statistical area, teaching status, number of beds, region, safety‐net status, nursing staff ratio (number of registered nurse FTEs/number of hospital FTEs), and presence or absence of cardiac catheterization and coronary bypass capability. Patient‐level characteristics included Medicare and Medicaid inpatient days as a percentage of total inpatient days and percentage of admissions by race (black vs non‐black). The presence of hospitalists was correlated with each of the hospital and patient‐level characteristics. Further analyses of the subset of hospitals that use hospitalists included construction of multivariable linear regression models to assess the relationship between the percentage of patients admitted by hospitalists and the dependent variables. Models were adjusted for the same patient‐ and hospital‐level characteristics.
The institutional review boards at Yale University and University of California, San Francisco approved the study. All analyses were performed using Statistical Analysis Software (SAS) version 9.1 (SAS Institute, Inc, Cary, NC).
RESULTS
Characteristics of Participating Hospitals
Telephone, fax, and e‐mail surveys were attempted with 1558 hospitals; we received 598 completed surveys for a response rate of 40%. There was no difference between responders and nonresponders on any of the 6 outcome variables, the number of Medicare or Medicaid inpatient days, and the percentage of admissions by race. Responders and nonresponders were also similar in size, ownership, safety‐net and teaching status, nursing staff ratio, presence of cardiac catheterization and coronary bypass capability, and core‐based statistical area. They differed only on region of the country, where hospitals in the northwest Central and Pacific regions of the country had larger overall proportions of respondents. All hospitals provided information about the presence or absence of hospitalist programs. The majority of respondents were hospitalist clinical or administrative managers (n = 220) followed by hospitalist leaders (n = 106), other executives (n = 58), vice presidents for medical affairs (n = 39), and chief medical officers (n = 15). Each respondent indicated a working knowledge of their site's hospitalist utilization and practice characteristics. Absence of hospitalist utilization was confirmed by contact with the Medical Staff Office.
Comparisons of Sites With Hospitalists and Those Without Hospitalists
Hospitals with and without hospitalists differed by a number of organizational characteristics (Table 1). Sites with hospitalists were more likely to be larger, nonprofit teaching hospitals, located in metropolitan regions, and have cardiac surgical services. There was no difference in the hospitals' safety‐net status or RN staffing ratio. Hospitals with hospitalists admitted lower percentages of black patients.
| Hospitalist Program | No Hospitalist Program | ||
|---|---|---|---|
| N = 429 | N = 169 | ||
| N (%) | N (%) | P Value | |
| |||
| Core‐based statistical area | <0.0001 | ||
| Division | 94 (21.9%) | 53 (31.4%) | |
| Metro | 275 (64.1%) | 72 (42.6%) | |
| Micro | 52 (12.1%) | 38 (22.5%) | |
| Rural | 8 (1.9%) | 6 (3.6%) | |
| Owner | 0.0003 | ||
| Public | 47 (11.0%) | 20 (11.8%) | |
| Nonprofit | 333 (77.6%) | 108 (63.9%) | |
| Private | 49 (11.4%) | 41 (24.3%) | |
| Teaching status | <0.0001 | ||
| COTH | 54 (12.6%) | 7 (4.1%) | |
| Teaching | 110 (25.6%) | 26 (15.4%) | |
| Other | 265 (61.8%) | 136 (80.5%) | |
| Cardiac type | 0.0003 | ||
| CABG | 286 (66.7%) | 86 (50.9%) | |
| CATH | 79 (18.4%) | 36 (21.3%) | |
| Other | 64 (14.9%) | 47 (27.8%) | |
| Region | 0.007 | ||
| New England | 35 (8.2%) | 3 (1.8%) | |
| Middle Atlantic | 60 (14.0%) | 29 (17.2%) | |
| South Atlantic | 78 (18.2%) | 23 (13.6%) | |
| NE Central | 60 (14.0%) | 35 (20.7%) | |
| SE Central | 31 (7.2%) | 10 (5.9%) | |
| NW Central | 38 (8.9%) | 23 (13.6%) | |
| SW Central | 41 (9.6%) | 21 (12.4%) | |
| Mountain | 22 (5.1%) | 3 (1.8%) | |
| Pacific | 64 (14.9%) | 22 (13.0%) | |
| Safety‐net | 0.53 | ||
| Yes | 72 (16.8%) | 32 (18.9%) | |
| No | 357 (83.2%) | 137 (81.1%) | |
| Mean (SD) | Mean (SD) | P value | |
| RN staffing ratio (n = 455) | 27.3 (17.0) | 26.1 (7.6) | 0.28 |
| Total beds | 315.0 (216.6) | 214.8 (136.0) | <0.0001 |
| % Medicare inpatient days | 47.2 (42) | 49.7 (41) | 0.19 |
| % Medicaid inpatient days | 18.5 (28) | 21.4 (46) | 0.16 |
| % Black | 7.6 (9.6) | 10.6 (17.4) | 0.03 |
Characteristics of Hospitalist Programs and Responsibilities
Of the 429 sites reporting use of hospitalists, the median percentage of patients admitted by hospitalists was 60%, with an interquartile range (IQR) of 35% to 80%. The median number of full‐time equivalent hospitalists per hospital was 8 with an IQR of 5 to 14. The IQR reflects the middle 50% of the distribution of responses, and is not affected by outliers or extreme values. Additional characteristics of hospitalist programs can be found in Table 2. The estimated percentage of patients with AMI, HF, and pneumonia cared for by hospitalists varied considerably, with fewer patients with AMI and more patients with pneumonia under hospitalist care. Overall, a majority of hospitalist groups provided the following services: care of critical care patients, emergency department admission screening, observation unit coverage, coverage for cardiac arrests and rapid response teams, quality improvement or utilization review activities, development of hospital practice guidelines, and participation in implementation of major hospital system projects (such as implementation of an electronic health record system).
| N (%) | |
|---|---|
| |
| Date program established | |
| 19871994 | 9 (2.2%) |
| 19952002 | 130 (32.1%) |
| 20032011 | 266 (65.7%) |
| Missing date | 24 |
| No. of hospitalist FTEs | |
| Median (IQR) | 8 (5, 14) |
| Percent of medical patients admitted by hospitalists | |
| Median (IQR) | 60% (35, 80) |
| No. of hospitalists groups | |
| 1 | 333 (77.6%) |
| 2 | 54 (12.6%) |
| 3 | 36 (8.4%) |
| Don't know | 6 (1.4%) |
| Employment of hospitalists (not mutually exclusive) | |
| Hospital system | 98 (22.8%) |
| Hospital | 185 (43.1%) |
| Local physician practice group | 62 (14.5%) |
| Hospitalist physician practice group (local) | 83 (19.3%) |
| Hospitalist physician practice group (national/regional) | 36 (8.4%) |
| Other/unknown | 36 (8.4%) |
| Any 24‐hr in‐house coverage by hospitalists | |
| Yes | 329 (76.7%) |
| No | 98 (22.8%) |
| 3 | 1 (0.2%) |
| Unknown | 1 (0.2%) |
| No. of hospitalist international medical graduates | |
| Median (IQR) | 3 (1, 6) |
| No. of hospitalists that are <1 yr out of residency | |
| Median (IQR) | 1 (0, 2) |
| Percent of patients with AMI cared for by hospitalists | |
| 0%25% | 148 (34.5%) |
| 26%50% | 67 (15.6%) |
| 51%75% | 50 (11.7%) |
| 76%100% | 54 (12.6%) |
| Don't know | 110 (25.6%) |
| Percent of patients with heart failure cared for by hospitalists | |
| 0%25% | 79 (18.4%) |
| 26%50% | 78 (18.2%) |
| 51%75% | 75 (17.5%) |
| 76%100% | 84 (19.6%) |
| Don't know | 113 (26.3%) |
| Percent of patients with pneumonia cared for by hospitalists | |
| 0%25% | 47 (11.0%) |
| 26%50% | 61 (14.3%) |
| 51%75% | 74 (17.3%) |
| 76%100% | 141 (32.9%) |
| Don't know | 105 (24.5%) |
| Hospitalist provision of services | |
| Care of critical care patients | |
| Hospitalists provide service | 346 (80.7%) |
| Hospitalists do not provide service | 80 (18.7%) |
| Don't know | 3 (0.7%) |
| Emergency department admission screening | |
| Hospitalists provide service | 281 (65.5%) |
| Hospitalists do not provide service | 143 (33.3%) |
| Don't know | 5 (1.2%) |
| Observation unit coverage | |
| Hospitalists provide service | 359 (83.7%) |
| Hospitalists do not provide service | 64 (14.9%) |
| Don't know | 6 (1.4%) |
| Emergency department coverage | |
| Hospitalists provide service | 145 (33.8%) |
| Hospitalists do not provide service | 280 (65.3%) |
| Don't know | 4 (0.9%) |
| Coverage for cardiac arrests | |
| Hospitalists provide service | 283 (66.0%) |
| Hospitalists do not provide service | 135 (31.5%) |
| Don't know | 11 (2.6%) |
| Rapid response team coverage | |
| Hospitalists provide service | 240 (55.9%) |
| Hospitalists do not provide service | 168 (39.2%) |
| Don't know | 21 (4.9%) |
| Quality improvement or utilization review | |
| Hospitalists provide service | 376 (87.7%) |
| Hospitalists do not provide service | 37 (8.6%) |
| Don't know | 16 (3.7%) |
| Hospital practice guideline development | |
| Hospitalists provide service | 339 (79.0%) |
| Hospitalists do not provide service | 55 (12.8%) |
| Don't know | 35 (8.2%) |
| Implementation of major hospital system projects | |
| Hospitalists provide service | 309 (72.0%) |
| Hospitalists do not provide service | 96 (22.4%) |
| Don't know | 24 (5.6%) |
Relationship Between Hospitalist Utilization and Outcomes
Tables 3 and 4 show the comparisons between hospitals with and without hospitalists on each of the 6 outcome measures. In the bivariate analysis (Table 3), there was no statistically significant difference between groups on any of the outcome measures with the exception of the risk‐stratified readmission rate for heart failure. Sites with hospitalists had a lower RSRR for HF than sites without hospitalists (24.7% vs 25.4%, P < 0.0001). These results were similar in the multivariable models as seen in Table 4, in which the beta estimate (slope) was not significantly different for hospitals utilizing hospitalists compared to those that did not, on all measures except the RSRR for HF. For the subset of hospitals that used hospitalists, there was no statistically significant change in any of the 6 outcome measures, with increasing percentage of patients admitted by hospitalists. Table 5 demonstrates that for each RSMR and RSRR, the slope did not consistently increase or decrease with incrementally higher percentages of patients admitted by hospitalists, and the confidence intervals for all estimates crossed zero.
| Hospitalist Program | No Hospitalist Program | ||
|---|---|---|---|
| N = 429 | N = 169 | ||
| Outcome Measure | Mean % (SD) | Mean (SD) | P Value |
| |||
| MI RSMR | 16.0 (1.6) | 16.1 (1.5) | 0.56 |
| MI RSRR | 19.9 (0.88) | 20.0 (0.86) | 0.16 |
| HF RSMR | 11.3 (1.4) | 11.3 (1.4) | 0.77 |
| HF RSRR | 24.7 (1.6) | 25.4 (1.8) | <0.0001 |
| Pneumonia RSMR | 11.7 (1.7) | 12.0 (1.7) | 0.08 |
| Pneumonia RSRR | 18.2 (1.2) | 18.3 (1.1) | 0.28 |
| Adjusted beta estimate (95% CI) | |
|---|---|
| |
| MI RSMR | |
| Hospitalist | 0.001 (0.002, 004) |
| MI RSRR | |
| Hospitalist | 0.001 (0.002, 0.001) |
| HF RSMR | |
| Hospitalist | 0.0004 (0.002, 0.003) |
| HF RSRR | |
| Hospitalist | 0.006 (0.009, 0.003) |
| Pneumonia RSMR | |
| Hospitalist | 0.002 (0.005, 0.001) |
| Pneumonia RSRR | |
| Hospitalist | 0.00001 (0.002, 0.002) |
| Adjusted Beta Estimate (95% CI) | |
|---|---|
| |
| MI RSMR | |
| Percent admit | |
| 0%30% | 0.003 (0.007, 0.002) |
| 32%48% | 0.001 (0.005, 0.006) |
| 50%66% | Ref |
| 70%80% | 0.004 (0.001, 0.009) |
| 85% | 0.004 (0.009, 0.001) |
| MI RSRR | |
| Percent admit | |
| 0%30% | 0.001 (0.002, 0.004) |
| 32%48% | 0.001 (0.004, 0.004) |
| 50%66% | Ref |
| 70%80% | 0.001 (0.002, 0.004) |
| 85% | 0.001 (0.002, 0.004) |
| HF RSMR | |
| Percent admit | |
| 0%30% | 0.001 (0.005, 0.003) |
| 32%48% | 0.002 (0.007, 0.003) |
| 50%66% | Ref |
| 70%80% | 0.002 (0.006, 0.002) |
| 85% | 0.001 (0.004, 0.005) |
| HF RSRR | |
| Percent admit | |
| 0%30% | 0.002 (0.004, 0.007) |
| 32%48% | 0.0003 (0.005, 0.006) |
| 50%66% | Ref |
| 70%80% | 0.001 (0.005, 0.004) |
| 85% | 0.002 (0.007, 0.003) |
| Pneumonia RSMR | |
| Percent admit | |
| 0%30% | 0.001 (0.004, 0.006) |
| 32%48% | 0.00001 (0.006, 0.006) |
| 50%66% | Ref |
| 70%80% | 0.001 (0.004, 0.006) |
| 85% | 0.001 (0.006, 0.005) |
| Pneumonia RSRR | |
| Percent admit | |
| 0%30% | 0.0002 (0.004, 0.003) |
| 32%48% | 0.004 (0.0003, 0.008) |
| 50%66% | Ref |
| 70%80% | 0.001 (0.003, 0.004) |
| 85% | 0.002 (0.002, 0.006) |
DISCUSSION
In this national survey of hospitals, we did not find a significant association between the use of hospitalists and hospitals' performance on 30‐day mortality or readmissions measures for AMI, HF, or pneumonia. While there was a statistically lower 30‐day risk‐standardized readmission rate measure for the heart failure measure among hospitals that use hospitalists, the effect size was small. The survey response rate of 40% is comparable to other surveys of physicians and other healthcare personnel, however, there were no significant differences between responders and nonresponders, so the potential for response bias, while present, is small.
Contrary to the findings of a recent study,21 we did not find a higher readmission rate for any of the 3 conditions in hospitals with hospitalist programs. One advantage of our study is the use of more robust risk‐adjustment methods. Our study used NQF‐endorsed risk‐standardized measures of readmission, which capture readmissions to any hospital for common, high priority conditions where the impact of care coordination and discontinuity of care are paramount. The models use administrative claims data, but have been validated by medical record data. Another advantage is that our study focused on a time period when hospital readmissions were a standard quality benchmark and increasing priority for hospitals, hospitalists, and community‐based care delivery systems. While our study is not able to discern whether patients had primary care physicians or the reason for admission to a hospitalist's care, our data do suggest that hospitalists continue to care for a large percentage of hospitalized patients. Moreover, increasing the proportion of patients being admitted to hospitalists did not affect the risk for readmission, providing perhaps reassuring evidence (or lack of proof) for a direct association between use of hospitalist systems and higher risk for readmission.
While hospitals with hospitalists clearly did not have better mortality or readmission rates, an alternate viewpoint might hold that, despite concerns that hospitalists negatively impact care continuity, our data do not demonstrate an association between readmission rates and use of hospitalist services. It is possible that hospitals that have hospitalists may have more ability to invest in hospital‐based systems of care,22 an association which may incorporate any hospitalist effect, but our results were robust even after testing whether adjustment for hospital factors (such as profit status, size) affected our results.
It is also possible that secular trends in hospitals or hospitalist systems affected our results. A handful of single‐site studies carried out soon after the hospitalist model's earliest descriptions found a reduction in mortality and readmission rates with the implementation of a hospitalist program.2325 Alternatively, it may be that there has been a dilution of the effect of hospitalists as often occurs when any new innovation is spread from early adopter sites to routine practice. Consistent with other multicenter studies from recent eras,21, 26 our article's findings do not demonstrate an association between hospitalists and improved outcomes. Unlike other multicenter studies, we had access to disease‐specific risk‐adjustment methodologies, which may partially account for referral biases related to patient‐specific measures of acute or chronic illness severity.
Changes in the hospitalist effect over time have a number of explanations, some of which are relevant to our study. Recent evidence suggests that complex organizational characteristics, such as organizational values and goals, may contribute to performance on 30‐day mortality for AMI rather than specific processes and protocols27; intense focus on AMI as a quality improvement target is emblematic of a number of national initiatives that may have affected our results. Interestingly, hospitalist systems have changed over time as well. Early in the hospitalist movement, hospitalist systems were implemented largely at the behest of hospitals trying to reduce costs. In recent years, however, hospitalist systems are at least as frequently being implemented because outpatient‐based physicians or surgeons request hospitalists; hospitalists have been focused on care of uncoveredpatients, since the model's earliest description. In addition, some hospitals invest in hospitalist programs based on perceived ability of hospitalists to improve quality and achieve better patient outcomes in an era of payment increasingly being linked to quality of care metrics.
Our study has several limitations, six of which are noted here. First, while the hospitalist model has been widely embraced in the adult medicine field, in the absence of board certification, there is no gold standard definition of a hospitalist. It is therefore possible that some respondents may have represented groups that were identified incorrectly as hospitalists. Second, the data for the primary independent variable of interest was based upon self‐report and, therefore, subject to recall bias and potential misclassification of results. Respondents were not aware of our hypothesis, so the bias should not have been in one particular direction. Third, the data for the outcome variables are from 2008. They may, therefore, not reflect organizational enhancements related to use of hospitalists that are in process, and take years to yield downstream improvements on performance metrics. In addition, of the 429 hospitals that have hospitalist programs, 46 programs were initiated after 2008. While national performance on the 6 outcome variables has been relatively static over time,7 any significant change in hospital performance on these metrics since 2008 could suggest an overestimation or underestimation of the effect of hospitalist programs on patient outcomes. Fourth, we were not able to adjust for additional hospital or health system level characteristics that may be associated with hospitalist use or patient outcomes. Fifth, our regression models had significant collinearity, in that the presence of hospitalists was correlated with each of the covariates. However, this finding would indicate that our estimates may be overly conservative and could have contributed to our nonsignificant findings. Finally, outcomes for 2 of the 3 clinical conditions measured are ones for which hospitalists may less frequently provide care: acute myocardial infarction and heart failure. Outcome measures more relevant for hospitalists may be all‐condition, all‐cause, 30‐day mortality and readmission.
This work adds to the growing body of literature examining the impact of hospitalists on quality of care. To our knowledge, it is the first study to assess the association between hospitalist use and performance on outcome metrics at a national level. While our findings suggest that use of hospitalists alone may not lead to improved performance on outcome measures, a parallel body of research is emerging implicating broader system and organizational factors as key to high performance on outcome measures. It is likely that multiple factors contribute to performance on outcome measures, including type and mix of hospital personnel, patient care processes and workflow, and system level attributes. Comparative effectiveness and implementation research that assess the contextual factors and interventions that lead to successful system improvement and better performance is increasingly needed. It is unlikely that a single factor, such as hospitalist use, will significantly impact 30‐day mortality or readmission and, therefore, multifactorial interventions are likely required. In addition, hospitalist use is a complex intervention as the structure, processes, training, experience, role in the hospital system, and other factors (including quality of hospitalists or the hospitalist program) vary across programs. Rather than focusing on the volume of care delivered by hospitalists, hospitals will likely need to support hospital medicine programs that have the time and expertise to devote to improving the quality and value of care delivered across the hospital system. This study highlights that interventions leading to improvement on core outcome measures are more complex than simply having a hospital medicine program.
Acknowledgements
The authors acknowledge Judy Maselli, MPH, Division of General Internal Medicine, Department of Medicine, University of California, San Francisco, for her assistance with statistical analyses and preparation of tables.
Disclosures: Work on this project was supported by the Robert Wood Johnson Clinical Scholars Program (K.G.); California Healthcare Foundation grant 15763 (A.D.A.); and a grant from the National Heart, Lung, and Blood Institute (NHLBI), study 1U01HL105270‐02 (H.M.K.). Dr Krumholz is the chair of the Cardiac Scientific Advisory Board for United Health and has a research grant with Medtronic through Yale University; Dr Auerbach has a grant through the National Heart, Lung, and Blood Institute (NHLBI). The authors have no other disclosures to report.
- ,,,.Comparison of hospitalists and nonhospitalists regarding core measures of pneumonia care.Am J Manag Care.2007;13:129–132.
- ,,,.Comparison of processes and outcomes of pneumonia care between hospitalists and community‐based primary care physicians.Mayo Clin Proc.2002;77(10):1053–1058.
- ,,,,.Quality of care for patients hospitalized with heart failure: assessing the impact of hospitalists.Arch Intern Med.2002;162(11):1251–1256.
- ,,, et al.Quality of care for decompensated heart failure: comparable performance between academic hospitalists and non‐hospitalists.J Gen Intern Med.2008;23(9):1399–1406.
- ,,.Comparison of practice patterns of hospitalists and community physicians in the care of patients with congestive heart failure.J Hosp Med.2008;3(1):35–41.
- ,,,,.Cross‐sectional analysis of hospitalist prevalence and quality of care in California.J Hosp Med.2010;5(4):200–207.
- Hospital Compare. Department of Health and Human Services. Available at: http://www.hospitalcompare.hhs.gov. Accessed September 3,2011.
- ,.Teaching hospitals and quality of care: a review of the literature.Milbank Q.2002;80(3):569–593.
- ,,, et al.A systematic review and meta‐analysis of studies comparing mortality rates of private for‐profit and private not‐for‐profit hospitals.Can Med Assoc J.2002;166(11):1399–1406.
- ,,,,.Patient and hospital characteristics associated with recommended processes of care for elderly patients hospitalized with pneumonia: results from the Medicare Quality Indicator System Pneumonia Module.Arch Intern Med.2002;162(7):827–833.
- ,,,.Care in U.S. hospitals—The Hospital Quality Alliance Program.N Engl J Med.2005;353(3):265–274.
- ,,, et al.Hospital characteristics and quality of care.JAMA.1992;268(13):1709–1714.
- ,,,,.Nurse‐staffing levels and the quality of care in hospitals.N Engl J Med.2002;346(22):1715–1722.
- ,,,.Health care market trends and the evolution of hospitalist use and roles.J Gen Intern Med.2005;20:101–107.
- ,,, et al.An administrative claims model suitable for profiling hospital performance based on 30‐day mortality rates among patients with an acute myocardial infarction.Circulation.2006;113:1683–1692.
- ,,, et al.An administrative claims measure suitable for profiling hospital performance based on 30‐day all‐cause readmission rates among patients with acute myocardial infarction.Circulation.2011;4:243–252.
- ,,, et al.An administrative claims measure suitable for profiling hospital performance on the basis of 30‐day all‐cause readmission rates among patients with heart failure.Circ Cardiovasc Qual Outcomes.2008;1:29–37.
- ,,, et al.An administrative claims model suitable for profiling hospital performance based on 30‐day mortality rates among patients with heart failure.Circulation.2006;113:1693–1701.
- ,,, et al.An administrative claims model for profiling hospital 30‐day mortality rates for pneumonia patients.PLoS ONE.2011;6(4):e17401.
- ,,, et al.Development, validation and results of a measure of 30‐day readmission following hospitalization for pneumonia.J Hosp Med.2011;6:142–150.
- ,.Association of hospitalist care with medical utilization after discharge: evidence of cost shift from a cohort study.Ann Intern Med.2011;155:152–159.
- ,,,.California hospital leaders' views of hospitalists: meeting needs of the present and future.J Hosp Med.2009;4:528–534.
- ,,, et al.Effects of physician experience on costs and outcomes on an academic general medicine service: results of a trial of hospitalists.Ann Intern Med.2002;137:866–874.
- ,,,,,.Implementation of a voluntary hospitalist service at a community teaching hospital: improved clinical efficiency and patients outcomes.Ann Intern Med.2002;137:859–865.
- ,,,.A comparative study of unscheduled hospital readmissions in a resident‐staffed teaching service and a hospitalist‐based service.South Med J.2009;102:145–149.
- ,,,,,.Outcomes of care by hospitalists, general internists, and family physicians.N Engl J Med.2007;357:2589–2600.
- ,,, et al.What distinguishes top‐performing hospitals in acute myocardial infarction mortality rates?Ann Intern Med.2011;154:384–390.
The past several years have seen a dramatic increase in the percentage of patients cared for by hospitalists, yet an emerging body of literature examining the association between care given by hospitalists and performance on a number of process measures has shown mixed results. Hospitalists do not appear to provide higher quality of care for pneumonia,1, 2 while results in heart failure are mixed.35 Each of these studies was conducted at a single site, and examined patient‐level effects. More recently, Vasilevskis et al6 assessed the association between the intensity of hospitalist use (measured as the percentage of patients admitted by hospitalists) and performance on process measures. In a cohort of 208 California hospitals, they found a significant improvement in performance on process measures in patients with acute myocardial infarction, heart failure, and pneumonia with increasing percentages of patients admitted by hospitalists.6
To date, no study has examined the association between the use of hospitalists and the publicly reported 30‐day mortality and readmission measures. Specifically, the Centers for Medicare and Medicaid Services (CMS) have developed and now publicly report risk‐standardized 30‐day mortality (RSMR) and readmission rates (RSRR) for Medicare patients hospitalized for 3 common and costly conditionsacute myocardial infarction (AMI), heart failure (HF), and pneumonia.7 Performance on these hospital‐based quality measures varies widely, and vary by hospital volume, ownership status, teaching status, and nurse staffing levels.813 However, even accounting for these characteristics leaves much of the variation in outcomes unexplained. We hypothesized that the presence of hospitalists within a hospital would be associated with higher performance on 30‐day mortality and 30‐day readmission measures for AMI, HF, and pneumonia. We further hypothesized that for hospitals using hospitalists, there would be a positive correlation between increasing percentage of patients admitted by hospitalists and performance on outcome measures. To test these hypotheses, we conducted a national survey of hospitalist leaders, linking data from survey responses to data on publicly reported outcome measures for AMI, HF, and pneumonia.
MATERIALS AND METHODS
Study Sites
Of the 4289 hospitals in operation in 2008, 1945 had 25 or more AMI discharges. We identified hospitals using American Hospital Association (AHA) data, calling hospitals up to 6 times each until we reached our target sample size of 600. Using this methodology, we contacted 1558 hospitals of a possible 1920 with AHA data; of the 1558 called, 598 provided survey results.
Survey Data
Our survey was adapted from the survey developed by Vasilevskis et al.6 The entire survey can be found in the Appendix (see Supporting Information in the online version of this article). Our key questions were: 1) Does your hospital have at least 1 hospitalist program or group? 2) Approximately what percentage of all medical patients in your hospital are admitted by hospitalists? The latter question was intended as an approximation of the intensity of hospitalist use, and has been used in prior studies.6, 14 A more direct measure was not feasible given the complexity of obtaining admission data for such a large and diverse set of hospitals. Respondents were also asked about hospitalist care of AMI, HF, and pneumonia patients. Given the low likelihood of precise estimation of hospitalist participation in care for specific conditions, the response choices were divided into percentage quartiles: 025, 2650, 5175, and 76100. Finally, participants were asked a number of questions regarding hospitalist organizational and clinical characteristics.
Survey Process
We obtained data regarding presence or absence of hospitalists and characteristics of the hospitalist services via phone‐ and fax‐administered survey (see Supporting Information, Appendix, in the online version of this article). Telephone and faxed surveys were administered between February 2010 and January 2011. Hospital telephone numbers were obtained from the 2008 AHA survey database and from a review of each hospital's website. Up to 6 attempts were made to obtain a completed survey from nonrespondents unless participation was specifically refused. Potential respondents were contacted in the following order: hospital medicine department leaders, hospital medicine clinical managers, vice president for medical affairs, chief medical officers, and other hospital executives with knowledge of the hospital medicine services. All respondents agreed with a question asking whether they had direct working knowledge of their hospital medicine services; contacts who said they did not have working knowledge of their hospital medicine services were asked to refer our surveyor to the appropriate person at their site. Absence of a hospitalist program was confirmed by contacting the Medical Staff Office.
Hospital Organizational and Patient‐Mix Characteristics
Hospital‐level organizational characteristics (eg, bed size, teaching status) and patient‐mix characteristics (eg, Medicare and Medicaid inpatient days) were obtained from the 2008 AHA survey database.
Outcome Performance Measures
The 30‐day risk‐standardized mortality and readmission rates (RSMR and RSRR) for 2008 for AMI, HF, and pneumonia were calculated for all admissions for people age 65 and over with traditional fee‐for‐service Medicare. Beneficiaries had to be enrolled for 12 months prior to their hospitalization for any of the 3 conditions, and had to have complete claims data available for that 12‐month period.7 These 6 outcome measures were constructed using hierarchical generalized linear models.1520 Using the RSMR for AMI as an example, for each hospital, the measure is estimated by dividing the predicted number of deaths within 30 days of admission for AMI by the expected number of deaths within 30 days of admission for AMI. This ratio is then divided by the national unadjusted 30‐day mortality rate for AMI, which is obtained using data on deaths from the Medicare beneficiary denominator file. Each measure is adjusted for patient characteristics such as age, gender, and comorbidities. All 6 measures are endorsed by the National Quality Forum (NQF) and are reported publicly by CMS on the Hospital Compare web site.
Statistical Analysis
Comparison of hospital‐ and patient‐level characteristics between hospitals with and without hospitalists was performed using chi‐square tests and Student t tests.
The primary outcome variables are the RSMRs and RSRRs for AMI, HF, and pneumonia. Multivariable linear regression models were used to assess the relationship between hospitals with at least 1 hospitalist group and each dependent variable. Models were adjusted for variables previously reported to be associated with quality of care. Hospital‐level characteristics included core‐based statistical area, teaching status, number of beds, region, safety‐net status, nursing staff ratio (number of registered nurse FTEs/number of hospital FTEs), and presence or absence of cardiac catheterization and coronary bypass capability. Patient‐level characteristics included Medicare and Medicaid inpatient days as a percentage of total inpatient days and percentage of admissions by race (black vs non‐black). The presence of hospitalists was correlated with each of the hospital and patient‐level characteristics. Further analyses of the subset of hospitals that use hospitalists included construction of multivariable linear regression models to assess the relationship between the percentage of patients admitted by hospitalists and the dependent variables. Models were adjusted for the same patient‐ and hospital‐level characteristics.
The institutional review boards at Yale University and University of California, San Francisco approved the study. All analyses were performed using Statistical Analysis Software (SAS) version 9.1 (SAS Institute, Inc, Cary, NC).
RESULTS
Characteristics of Participating Hospitals
Telephone, fax, and e‐mail surveys were attempted with 1558 hospitals; we received 598 completed surveys for a response rate of 40%. There was no difference between responders and nonresponders on any of the 6 outcome variables, the number of Medicare or Medicaid inpatient days, and the percentage of admissions by race. Responders and nonresponders were also similar in size, ownership, safety‐net and teaching status, nursing staff ratio, presence of cardiac catheterization and coronary bypass capability, and core‐based statistical area. They differed only on region of the country, where hospitals in the northwest Central and Pacific regions of the country had larger overall proportions of respondents. All hospitals provided information about the presence or absence of hospitalist programs. The majority of respondents were hospitalist clinical or administrative managers (n = 220) followed by hospitalist leaders (n = 106), other executives (n = 58), vice presidents for medical affairs (n = 39), and chief medical officers (n = 15). Each respondent indicated a working knowledge of their site's hospitalist utilization and practice characteristics. Absence of hospitalist utilization was confirmed by contact with the Medical Staff Office.
Comparisons of Sites With Hospitalists and Those Without Hospitalists
Hospitals with and without hospitalists differed by a number of organizational characteristics (Table 1). Sites with hospitalists were more likely to be larger, nonprofit teaching hospitals, located in metropolitan regions, and have cardiac surgical services. There was no difference in the hospitals' safety‐net status or RN staffing ratio. Hospitals with hospitalists admitted lower percentages of black patients.
| Hospitalist Program | No Hospitalist Program | ||
|---|---|---|---|
| N = 429 | N = 169 | ||
| N (%) | N (%) | P Value | |
| |||
| Core‐based statistical area | <0.0001 | ||
| Division | 94 (21.9%) | 53 (31.4%) | |
| Metro | 275 (64.1%) | 72 (42.6%) | |
| Micro | 52 (12.1%) | 38 (22.5%) | |
| Rural | 8 (1.9%) | 6 (3.6%) | |
| Owner | 0.0003 | ||
| Public | 47 (11.0%) | 20 (11.8%) | |
| Nonprofit | 333 (77.6%) | 108 (63.9%) | |
| Private | 49 (11.4%) | 41 (24.3%) | |
| Teaching status | <0.0001 | ||
| COTH | 54 (12.6%) | 7 (4.1%) | |
| Teaching | 110 (25.6%) | 26 (15.4%) | |
| Other | 265 (61.8%) | 136 (80.5%) | |
| Cardiac type | 0.0003 | ||
| CABG | 286 (66.7%) | 86 (50.9%) | |
| CATH | 79 (18.4%) | 36 (21.3%) | |
| Other | 64 (14.9%) | 47 (27.8%) | |
| Region | 0.007 | ||
| New England | 35 (8.2%) | 3 (1.8%) | |
| Middle Atlantic | 60 (14.0%) | 29 (17.2%) | |
| South Atlantic | 78 (18.2%) | 23 (13.6%) | |
| NE Central | 60 (14.0%) | 35 (20.7%) | |
| SE Central | 31 (7.2%) | 10 (5.9%) | |
| NW Central | 38 (8.9%) | 23 (13.6%) | |
| SW Central | 41 (9.6%) | 21 (12.4%) | |
| Mountain | 22 (5.1%) | 3 (1.8%) | |
| Pacific | 64 (14.9%) | 22 (13.0%) | |
| Safety‐net | 0.53 | ||
| Yes | 72 (16.8%) | 32 (18.9%) | |
| No | 357 (83.2%) | 137 (81.1%) | |
| Mean (SD) | Mean (SD) | P value | |
| RN staffing ratio (n = 455) | 27.3 (17.0) | 26.1 (7.6) | 0.28 |
| Total beds | 315.0 (216.6) | 214.8 (136.0) | <0.0001 |
| % Medicare inpatient days | 47.2 (42) | 49.7 (41) | 0.19 |
| % Medicaid inpatient days | 18.5 (28) | 21.4 (46) | 0.16 |
| % Black | 7.6 (9.6) | 10.6 (17.4) | 0.03 |
Characteristics of Hospitalist Programs and Responsibilities
Of the 429 sites reporting use of hospitalists, the median percentage of patients admitted by hospitalists was 60%, with an interquartile range (IQR) of 35% to 80%. The median number of full‐time equivalent hospitalists per hospital was 8 with an IQR of 5 to 14. The IQR reflects the middle 50% of the distribution of responses, and is not affected by outliers or extreme values. Additional characteristics of hospitalist programs can be found in Table 2. The estimated percentage of patients with AMI, HF, and pneumonia cared for by hospitalists varied considerably, with fewer patients with AMI and more patients with pneumonia under hospitalist care. Overall, a majority of hospitalist groups provided the following services: care of critical care patients, emergency department admission screening, observation unit coverage, coverage for cardiac arrests and rapid response teams, quality improvement or utilization review activities, development of hospital practice guidelines, and participation in implementation of major hospital system projects (such as implementation of an electronic health record system).
| N (%) | |
|---|---|
| |
| Date program established | |
| 19871994 | 9 (2.2%) |
| 19952002 | 130 (32.1%) |
| 20032011 | 266 (65.7%) |
| Missing date | 24 |
| No. of hospitalist FTEs | |
| Median (IQR) | 8 (5, 14) |
| Percent of medical patients admitted by hospitalists | |
| Median (IQR) | 60% (35, 80) |
| No. of hospitalists groups | |
| 1 | 333 (77.6%) |
| 2 | 54 (12.6%) |
| 3 | 36 (8.4%) |
| Don't know | 6 (1.4%) |
| Employment of hospitalists (not mutually exclusive) | |
| Hospital system | 98 (22.8%) |
| Hospital | 185 (43.1%) |
| Local physician practice group | 62 (14.5%) |
| Hospitalist physician practice group (local) | 83 (19.3%) |
| Hospitalist physician practice group (national/regional) | 36 (8.4%) |
| Other/unknown | 36 (8.4%) |
| Any 24‐hr in‐house coverage by hospitalists | |
| Yes | 329 (76.7%) |
| No | 98 (22.8%) |
| 3 | 1 (0.2%) |
| Unknown | 1 (0.2%) |
| No. of hospitalist international medical graduates | |
| Median (IQR) | 3 (1, 6) |
| No. of hospitalists that are <1 yr out of residency | |
| Median (IQR) | 1 (0, 2) |
| Percent of patients with AMI cared for by hospitalists | |
| 0%25% | 148 (34.5%) |
| 26%50% | 67 (15.6%) |
| 51%75% | 50 (11.7%) |
| 76%100% | 54 (12.6%) |
| Don't know | 110 (25.6%) |
| Percent of patients with heart failure cared for by hospitalists | |
| 0%25% | 79 (18.4%) |
| 26%50% | 78 (18.2%) |
| 51%75% | 75 (17.5%) |
| 76%100% | 84 (19.6%) |
| Don't know | 113 (26.3%) |
| Percent of patients with pneumonia cared for by hospitalists | |
| 0%25% | 47 (11.0%) |
| 26%50% | 61 (14.3%) |
| 51%75% | 74 (17.3%) |
| 76%100% | 141 (32.9%) |
| Don't know | 105 (24.5%) |
| Hospitalist provision of services | |
| Care of critical care patients | |
| Hospitalists provide service | 346 (80.7%) |
| Hospitalists do not provide service | 80 (18.7%) |
| Don't know | 3 (0.7%) |
| Emergency department admission screening | |
| Hospitalists provide service | 281 (65.5%) |
| Hospitalists do not provide service | 143 (33.3%) |
| Don't know | 5 (1.2%) |
| Observation unit coverage | |
| Hospitalists provide service | 359 (83.7%) |
| Hospitalists do not provide service | 64 (14.9%) |
| Don't know | 6 (1.4%) |
| Emergency department coverage | |
| Hospitalists provide service | 145 (33.8%) |
| Hospitalists do not provide service | 280 (65.3%) |
| Don't know | 4 (0.9%) |
| Coverage for cardiac arrests | |
| Hospitalists provide service | 283 (66.0%) |
| Hospitalists do not provide service | 135 (31.5%) |
| Don't know | 11 (2.6%) |
| Rapid response team coverage | |
| Hospitalists provide service | 240 (55.9%) |
| Hospitalists do not provide service | 168 (39.2%) |
| Don't know | 21 (4.9%) |
| Quality improvement or utilization review | |
| Hospitalists provide service | 376 (87.7%) |
| Hospitalists do not provide service | 37 (8.6%) |
| Don't know | 16 (3.7%) |
| Hospital practice guideline development | |
| Hospitalists provide service | 339 (79.0%) |
| Hospitalists do not provide service | 55 (12.8%) |
| Don't know | 35 (8.2%) |
| Implementation of major hospital system projects | |
| Hospitalists provide service | 309 (72.0%) |
| Hospitalists do not provide service | 96 (22.4%) |
| Don't know | 24 (5.6%) |
Relationship Between Hospitalist Utilization and Outcomes
Tables 3 and 4 show the comparisons between hospitals with and without hospitalists on each of the 6 outcome measures. In the bivariate analysis (Table 3), there was no statistically significant difference between groups on any of the outcome measures with the exception of the risk‐stratified readmission rate for heart failure. Sites with hospitalists had a lower RSRR for HF than sites without hospitalists (24.7% vs 25.4%, P < 0.0001). These results were similar in the multivariable models as seen in Table 4, in which the beta estimate (slope) was not significantly different for hospitals utilizing hospitalists compared to those that did not, on all measures except the RSRR for HF. For the subset of hospitals that used hospitalists, there was no statistically significant change in any of the 6 outcome measures, with increasing percentage of patients admitted by hospitalists. Table 5 demonstrates that for each RSMR and RSRR, the slope did not consistently increase or decrease with incrementally higher percentages of patients admitted by hospitalists, and the confidence intervals for all estimates crossed zero.
| Hospitalist Program | No Hospitalist Program | ||
|---|---|---|---|
| N = 429 | N = 169 | ||
| Outcome Measure | Mean % (SD) | Mean (SD) | P Value |
| |||
| MI RSMR | 16.0 (1.6) | 16.1 (1.5) | 0.56 |
| MI RSRR | 19.9 (0.88) | 20.0 (0.86) | 0.16 |
| HF RSMR | 11.3 (1.4) | 11.3 (1.4) | 0.77 |
| HF RSRR | 24.7 (1.6) | 25.4 (1.8) | <0.0001 |
| Pneumonia RSMR | 11.7 (1.7) | 12.0 (1.7) | 0.08 |
| Pneumonia RSRR | 18.2 (1.2) | 18.3 (1.1) | 0.28 |
| Adjusted beta estimate (95% CI) | |
|---|---|
| |
| MI RSMR | |
| Hospitalist | 0.001 (0.002, 004) |
| MI RSRR | |
| Hospitalist | 0.001 (0.002, 0.001) |
| HF RSMR | |
| Hospitalist | 0.0004 (0.002, 0.003) |
| HF RSRR | |
| Hospitalist | 0.006 (0.009, 0.003) |
| Pneumonia RSMR | |
| Hospitalist | 0.002 (0.005, 0.001) |
| Pneumonia RSRR | |
| Hospitalist | 0.00001 (0.002, 0.002) |
| Adjusted Beta Estimate (95% CI) | |
|---|---|
| |
| MI RSMR | |
| Percent admit | |
| 0%30% | 0.003 (0.007, 0.002) |
| 32%48% | 0.001 (0.005, 0.006) |
| 50%66% | Ref |
| 70%80% | 0.004 (0.001, 0.009) |
| 85% | 0.004 (0.009, 0.001) |
| MI RSRR | |
| Percent admit | |
| 0%30% | 0.001 (0.002, 0.004) |
| 32%48% | 0.001 (0.004, 0.004) |
| 50%66% | Ref |
| 70%80% | 0.001 (0.002, 0.004) |
| 85% | 0.001 (0.002, 0.004) |
| HF RSMR | |
| Percent admit | |
| 0%30% | 0.001 (0.005, 0.003) |
| 32%48% | 0.002 (0.007, 0.003) |
| 50%66% | Ref |
| 70%80% | 0.002 (0.006, 0.002) |
| 85% | 0.001 (0.004, 0.005) |
| HF RSRR | |
| Percent admit | |
| 0%30% | 0.002 (0.004, 0.007) |
| 32%48% | 0.0003 (0.005, 0.006) |
| 50%66% | Ref |
| 70%80% | 0.001 (0.005, 0.004) |
| 85% | 0.002 (0.007, 0.003) |
| Pneumonia RSMR | |
| Percent admit | |
| 0%30% | 0.001 (0.004, 0.006) |
| 32%48% | 0.00001 (0.006, 0.006) |
| 50%66% | Ref |
| 70%80% | 0.001 (0.004, 0.006) |
| 85% | 0.001 (0.006, 0.005) |
| Pneumonia RSRR | |
| Percent admit | |
| 0%30% | 0.0002 (0.004, 0.003) |
| 32%48% | 0.004 (0.0003, 0.008) |
| 50%66% | Ref |
| 70%80% | 0.001 (0.003, 0.004) |
| 85% | 0.002 (0.002, 0.006) |
DISCUSSION
In this national survey of hospitals, we did not find a significant association between the use of hospitalists and hospitals' performance on 30‐day mortality or readmissions measures for AMI, HF, or pneumonia. While there was a statistically lower 30‐day risk‐standardized readmission rate measure for the heart failure measure among hospitals that use hospitalists, the effect size was small. The survey response rate of 40% is comparable to other surveys of physicians and other healthcare personnel, however, there were no significant differences between responders and nonresponders, so the potential for response bias, while present, is small.
Contrary to the findings of a recent study,21 we did not find a higher readmission rate for any of the 3 conditions in hospitals with hospitalist programs. One advantage of our study is the use of more robust risk‐adjustment methods. Our study used NQF‐endorsed risk‐standardized measures of readmission, which capture readmissions to any hospital for common, high priority conditions where the impact of care coordination and discontinuity of care are paramount. The models use administrative claims data, but have been validated by medical record data. Another advantage is that our study focused on a time period when hospital readmissions were a standard quality benchmark and increasing priority for hospitals, hospitalists, and community‐based care delivery systems. While our study is not able to discern whether patients had primary care physicians or the reason for admission to a hospitalist's care, our data do suggest that hospitalists continue to care for a large percentage of hospitalized patients. Moreover, increasing the proportion of patients being admitted to hospitalists did not affect the risk for readmission, providing perhaps reassuring evidence (or lack of proof) for a direct association between use of hospitalist systems and higher risk for readmission.
While hospitals with hospitalists clearly did not have better mortality or readmission rates, an alternate viewpoint might hold that, despite concerns that hospitalists negatively impact care continuity, our data do not demonstrate an association between readmission rates and use of hospitalist services. It is possible that hospitals that have hospitalists may have more ability to invest in hospital‐based systems of care,22 an association which may incorporate any hospitalist effect, but our results were robust even after testing whether adjustment for hospital factors (such as profit status, size) affected our results.
It is also possible that secular trends in hospitals or hospitalist systems affected our results. A handful of single‐site studies carried out soon after the hospitalist model's earliest descriptions found a reduction in mortality and readmission rates with the implementation of a hospitalist program.2325 Alternatively, it may be that there has been a dilution of the effect of hospitalists as often occurs when any new innovation is spread from early adopter sites to routine practice. Consistent with other multicenter studies from recent eras,21, 26 our article's findings do not demonstrate an association between hospitalists and improved outcomes. Unlike other multicenter studies, we had access to disease‐specific risk‐adjustment methodologies, which may partially account for referral biases related to patient‐specific measures of acute or chronic illness severity.
Changes in the hospitalist effect over time have a number of explanations, some of which are relevant to our study. Recent evidence suggests that complex organizational characteristics, such as organizational values and goals, may contribute to performance on 30‐day mortality for AMI rather than specific processes and protocols27; intense focus on AMI as a quality improvement target is emblematic of a number of national initiatives that may have affected our results. Interestingly, hospitalist systems have changed over time as well. Early in the hospitalist movement, hospitalist systems were implemented largely at the behest of hospitals trying to reduce costs. In recent years, however, hospitalist systems are at least as frequently being implemented because outpatient‐based physicians or surgeons request hospitalists; hospitalists have been focused on care of uncoveredpatients, since the model's earliest description. In addition, some hospitals invest in hospitalist programs based on perceived ability of hospitalists to improve quality and achieve better patient outcomes in an era of payment increasingly being linked to quality of care metrics.
Our study has several limitations, six of which are noted here. First, while the hospitalist model has been widely embraced in the adult medicine field, in the absence of board certification, there is no gold standard definition of a hospitalist. It is therefore possible that some respondents may have represented groups that were identified incorrectly as hospitalists. Second, the data for the primary independent variable of interest was based upon self‐report and, therefore, subject to recall bias and potential misclassification of results. Respondents were not aware of our hypothesis, so the bias should not have been in one particular direction. Third, the data for the outcome variables are from 2008. They may, therefore, not reflect organizational enhancements related to use of hospitalists that are in process, and take years to yield downstream improvements on performance metrics. In addition, of the 429 hospitals that have hospitalist programs, 46 programs were initiated after 2008. While national performance on the 6 outcome variables has been relatively static over time,7 any significant change in hospital performance on these metrics since 2008 could suggest an overestimation or underestimation of the effect of hospitalist programs on patient outcomes. Fourth, we were not able to adjust for additional hospital or health system level characteristics that may be associated with hospitalist use or patient outcomes. Fifth, our regression models had significant collinearity, in that the presence of hospitalists was correlated with each of the covariates. However, this finding would indicate that our estimates may be overly conservative and could have contributed to our nonsignificant findings. Finally, outcomes for 2 of the 3 clinical conditions measured are ones for which hospitalists may less frequently provide care: acute myocardial infarction and heart failure. Outcome measures more relevant for hospitalists may be all‐condition, all‐cause, 30‐day mortality and readmission.
This work adds to the growing body of literature examining the impact of hospitalists on quality of care. To our knowledge, it is the first study to assess the association between hospitalist use and performance on outcome metrics at a national level. While our findings suggest that use of hospitalists alone may not lead to improved performance on outcome measures, a parallel body of research is emerging implicating broader system and organizational factors as key to high performance on outcome measures. It is likely that multiple factors contribute to performance on outcome measures, including type and mix of hospital personnel, patient care processes and workflow, and system level attributes. Comparative effectiveness and implementation research that assess the contextual factors and interventions that lead to successful system improvement and better performance is increasingly needed. It is unlikely that a single factor, such as hospitalist use, will significantly impact 30‐day mortality or readmission and, therefore, multifactorial interventions are likely required. In addition, hospitalist use is a complex intervention as the structure, processes, training, experience, role in the hospital system, and other factors (including quality of hospitalists or the hospitalist program) vary across programs. Rather than focusing on the volume of care delivered by hospitalists, hospitals will likely need to support hospital medicine programs that have the time and expertise to devote to improving the quality and value of care delivered across the hospital system. This study highlights that interventions leading to improvement on core outcome measures are more complex than simply having a hospital medicine program.
Acknowledgements
The authors acknowledge Judy Maselli, MPH, Division of General Internal Medicine, Department of Medicine, University of California, San Francisco, for her assistance with statistical analyses and preparation of tables.
Disclosures: Work on this project was supported by the Robert Wood Johnson Clinical Scholars Program (K.G.); California Healthcare Foundation grant 15763 (A.D.A.); and a grant from the National Heart, Lung, and Blood Institute (NHLBI), study 1U01HL105270‐02 (H.M.K.). Dr Krumholz is the chair of the Cardiac Scientific Advisory Board for United Health and has a research grant with Medtronic through Yale University; Dr Auerbach has a grant through the National Heart, Lung, and Blood Institute (NHLBI). The authors have no other disclosures to report.
- ,,,.Comparison of hospitalists and nonhospitalists regarding core measures of pneumonia care.Am J Manag Care.2007;13:129–132.
- ,,,.Comparison of processes and outcomes of pneumonia care between hospitalists and community‐based primary care physicians.Mayo Clin Proc.2002;77(10):1053–1058.
- ,,,,.Quality of care for patients hospitalized with heart failure: assessing the impact of hospitalists.Arch Intern Med.2002;162(11):1251–1256.
- ,,, et al.Quality of care for decompensated heart failure: comparable performance between academic hospitalists and non‐hospitalists.J Gen Intern Med.2008;23(9):1399–1406.
- ,,.Comparison of practice patterns of hospitalists and community physicians in the care of patients with congestive heart failure.J Hosp Med.2008;3(1):35–41.
- ,,,,.Cross‐sectional analysis of hospitalist prevalence and quality of care in California.J Hosp Med.2010;5(4):200–207.
- Hospital Compare. Department of Health and Human Services. Available at: http://www.hospitalcompare.hhs.gov. Accessed September 3,2011.
- ,.Teaching hospitals and quality of care: a review of the literature.Milbank Q.2002;80(3):569–593.
- ,,, et al.A systematic review and meta‐analysis of studies comparing mortality rates of private for‐profit and private not‐for‐profit hospitals.Can Med Assoc J.2002;166(11):1399–1406.
- ,,,,.Patient and hospital characteristics associated with recommended processes of care for elderly patients hospitalized with pneumonia: results from the Medicare Quality Indicator System Pneumonia Module.Arch Intern Med.2002;162(7):827–833.
- ,,,.Care in U.S. hospitals—The Hospital Quality Alliance Program.N Engl J Med.2005;353(3):265–274.
- ,,, et al.Hospital characteristics and quality of care.JAMA.1992;268(13):1709–1714.
- ,,,,.Nurse‐staffing levels and the quality of care in hospitals.N Engl J Med.2002;346(22):1715–1722.
- ,,,.Health care market trends and the evolution of hospitalist use and roles.J Gen Intern Med.2005;20:101–107.
- ,,, et al.An administrative claims model suitable for profiling hospital performance based on 30‐day mortality rates among patients with an acute myocardial infarction.Circulation.2006;113:1683–1692.
- ,,, et al.An administrative claims measure suitable for profiling hospital performance based on 30‐day all‐cause readmission rates among patients with acute myocardial infarction.Circulation.2011;4:243–252.
- ,,, et al.An administrative claims measure suitable for profiling hospital performance on the basis of 30‐day all‐cause readmission rates among patients with heart failure.Circ Cardiovasc Qual Outcomes.2008;1:29–37.
- ,,, et al.An administrative claims model suitable for profiling hospital performance based on 30‐day mortality rates among patients with heart failure.Circulation.2006;113:1693–1701.
- ,,, et al.An administrative claims model for profiling hospital 30‐day mortality rates for pneumonia patients.PLoS ONE.2011;6(4):e17401.
- ,,, et al.Development, validation and results of a measure of 30‐day readmission following hospitalization for pneumonia.J Hosp Med.2011;6:142–150.
- ,.Association of hospitalist care with medical utilization after discharge: evidence of cost shift from a cohort study.Ann Intern Med.2011;155:152–159.
- ,,,.California hospital leaders' views of hospitalists: meeting needs of the present and future.J Hosp Med.2009;4:528–534.
- ,,, et al.Effects of physician experience on costs and outcomes on an academic general medicine service: results of a trial of hospitalists.Ann Intern Med.2002;137:866–874.
- ,,,,,.Implementation of a voluntary hospitalist service at a community teaching hospital: improved clinical efficiency and patients outcomes.Ann Intern Med.2002;137:859–865.
- ,,,.A comparative study of unscheduled hospital readmissions in a resident‐staffed teaching service and a hospitalist‐based service.South Med J.2009;102:145–149.
- ,,,,,.Outcomes of care by hospitalists, general internists, and family physicians.N Engl J Med.2007;357:2589–2600.
- ,,, et al.What distinguishes top‐performing hospitals in acute myocardial infarction mortality rates?Ann Intern Med.2011;154:384–390.
Copyright © 2012 Society of Hospital Medicine
Readmission and Mortality [Rates] in Pneumonia
Pneumonia results in some 1.2 million hospital admissions each year in the United States, is the second leading cause of hospitalization among patients over 65, and accounts for more than $10 billion annually in hospital expenditures.1, 2 As a result of complex demographic and clinical forces, including an aging population, increasing prevalence of comorbidities, and changes in antimicrobial resistance patterns, between the periods 1988 to 1990 and 2000 to 2002 the number of patients hospitalized for pneumonia grew by 20%, and pneumonia was the leading infectious cause of death.3, 4
Given its public health significance, pneumonia has been the subject of intensive quality measurement and improvement efforts for well over a decade. Two of the largest initiatives are the Centers for Medicare & Medicaid Services (CMS) National Pneumonia Project and The Joint Commission ORYX program.5, 6 These efforts have largely entailed measuring hospital performance on pneumonia‐specific processes of care, such as whether blood oxygen levels were assessed, whether blood cultures were drawn before antibiotic treatment was initiated, the choice and timing of antibiotics, and smoking cessation counseling and vaccination at the time of discharge. While measuring processes of care (especially when they are based on sound evidence), can provide insights about quality, and can help guide hospital improvement efforts, these measures necessarily focus on a narrow spectrum of the overall care provided. Outcomes can complement process measures by directing attention to the results of care, which are influenced by both measured and unmeasured factors, and which may be more relevant from the patient's perspective.79
In 2008 CMS expanded its public reporting initiatives by adding risk‐standardized hospital mortality rates for pneumonia to the Hospital Compare website (
Methods
Design, Setting, Subjects
We conducted a cross‐sectional study at the hospital level of the outcomes of care of fee‐for‐service patients hospitalized for pneumonia between July 2006 and June 2009. Patients are eligible to be included in the measures if they are 65 years or older, have a principal diagnosis of pneumonia (International Classification of Diseases, Ninth Revision, Clinical Modification codes 480.X, 481, 482.XX, 483.X, 485, 486, and 487.0), and are cared for at a nonfederal acute care hospital in the US and its organized territories, including Puerto Rico, Guam, the US Virgin Islands, and the Northern Mariana Islands.
The mortality measure excludes patients enrolled in the Medicare hospice program in the year prior to, or on the day of admission, those in whom pneumonia is listed as a secondary diagnosis (to eliminate cases resulting from complications of hospitalization), those discharged against medical advice, and patients who are discharged alive but whose length of stay in the hospital is less than 1 day (because of concerns about the accuracy of the pneumonia diagnosis). Patients are also excluded if their administrative records for the period of analysis (1 year prior to hospitalization and 30 days following discharge) were not available or were incomplete, because these are needed to assess comorbid illness and outcomes. The readmission measure is similar, but does not exclude patients on the basis of hospice program enrollment (because these patients have been admitted and readmissions for hospice patients are likely unplanned events that can be measured and reduced), nor on the basis of hospital length of stay (because patients discharged within 24 hours may be at a heightened risk of readmission).11, 12
Information about patient comorbidities is derived from diagnoses recorded in the year prior to the index hospitalization as found in Medicare inpatient, outpatient, and carrier (physician) standard analytic files. Comorbidities are identified using the Condition Categories of the Hierarchical Condition Category grouper, which sorts the more than 15,000 possible diagnostic codes into 189 clinically‐coherent conditions and which was originally developed to support risk‐adjusted payments within Medicare managed care.13
Outcomes
The patient outcomes assessed include death from any cause within 30 days of admission and readmission for any cause within 30 days of discharge. All‐cause, rather than disease‐specific, readmission was chosen because hospital readmission as a consequence of suboptimal inpatient care or discharge coordination may manifest in many different diagnoses, and no validated method is available to distinguish related from unrelated readmissions. The measures use the Medicare Enrollment Database to determine mortality status, and acute care hospital inpatient claims are used to identify readmission events. For patients with multiple hospitalizations during the study period, the mortality measure randomly selects one hospitalization to use for determination of mortality. Admissions that are counted as readmissions (i.e., those that occurred within 30 days of discharge following hospitalization for pneumonia) are not also treated as index hospitalizations. In the case of patients who are transferred to or from another acute care facility, responsibility for deaths is assigned to the hospital that initially admitted the patient, while responsibility for readmissions is assigned to the hospital that ultimately discharges the patient to a nonacute setting (e.g., home, skilled nursing facilities).
Risk‐Standardization Methods
Hierarchical logistic regression is used to model the log‐odds of mortality or readmission within 30 days of admission or discharge from an index pneumonia admission as a function of patient demographic and clinical characteristics and a random hospital‐specific intercept. This strategy accounts for within‐hospital correlation of the observed outcomes, and reflects the assumption that underlying differences in quality among the hospitals being evaluated lead to systematic differences in outcomes. In contrast to nonhierarchical models which ignore hospital effects, this method attempts to measure the influence of the hospital on patient outcome after adjusting for patient characteristics. Comorbidities from the index admission that could represent potential complications of care are not included in the model unless they are also documented in the 12 months prior to admission. Hospital‐specific mortality and readmission rates are calculated as the ratio of predicted‐to‐expected events (similar to the observed/expected ratio), multiplied by the national unadjusted rate, a form of indirect standardization.
The model for mortality has a c‐statistic of 0.72 whereas a model based on medical record review that was developed for validation purposes had a c‐statistic of 0.77. The model for readmission has a c‐statistic of 0.63 whereas a model based on medical review had a c‐statistic of 0.59. The mortality and readmission models produce similar state‐level mortality and readmission rate estimates as the models derived from medical record review, and can therefore serve as reasonable surrogates. These methods, including their development and validation, have been described fully elsewhere,14, 15 and have been evaluated and subsequently endorsed by the National Quality Forum.16
Identification of Geographic Regions
To characterize patterns of performance geographically we identified the 306 hospital referral regions for each hospital in our analysis using definitions provided by the Dartmouth Atlas of Health Care project. Unlike a hospital‐level analysis, the hospital referral regions represent regional markets for tertiary care and are widely used to summarize variation in medical care inputs, utilization patterns, and health outcomes and provide a more detailed look at variation in outcomes than results at the state level.17
Analyses
Summary statistics were constructed using frequencies and proportions for categorical data, and means, medians and interquartile ranges for continuous variables. To characterize 30‐day risk‐standardized mortality and readmission rates at the hospital‐referral region level, we calculated means and percentiles by weighting each hospital's value by the inverse of the variance of the hospital's estimated rate. Hospitals with larger sample sizes, and therefore more precise estimates, lend more weight to the average. Hierarchical models were estimated using the SAS GLIMMIX procedure. Bayesian shrinkage was used to estimate rates in order to take into account the greater uncertainty in the true rates of hospitals with small caseloads. Using this technique, estimated rates at low volume institutions are shrunken toward the population mean, while hospitals with large caseloads have a relatively smaller amount of shrinkage and the estimate is closer to the hospital's observed rate.18
To determine whether a hospital's performance is significantly different than the national rate we measured whether the 95% interval estimate for the risk‐standardized rate overlapped with the national crude mortality or readmission rate. This information is used to categorize hospitals on Hospital Compare as better than the US national rate, worse than the US national rate, or no different than the US national rate. Hospitals with fewer than 25 cases in the 3‐year period, are excluded from this categorization on Hospital Compare.
Analyses were conducted with the use of SAS 9.1.3 (SAS Institute Inc, Cary, NC). We created the hospital referral region maps using ArcGIS version 9.3 (ESRI, Redlands, CA). The Human Investigation Committee at the Yale School of Medicine approved an exemption for the authors to use CMS claims and enrollment data for research analyses and publication.
Results
Hospital‐Specific Risk‐Standardized 30‐Day Mortality and Readmission Rates
Of the 1,118,583 patients included in the mortality analysis 129,444 (11.6%) died within 30 days of hospital admission. The median (Q1, Q3) hospital 30‐day risk‐standardized mortality rate was 11.1% (10.0%, 12.3%), and ranged from 6.7% to 20.9% (Table 1, Figure 1). Hospitals at the 10th percentile had 30‐day risk‐standardized mortality rates of 9.0% while for those at the 90th percentile of performance the rate was 13.5%. The odds of all‐cause mortality for a patient treated at a hospital that was one standard deviation above the national average was 1.68 times higher than that of a patient treated at a hospital that was one standard deviation below the national average.
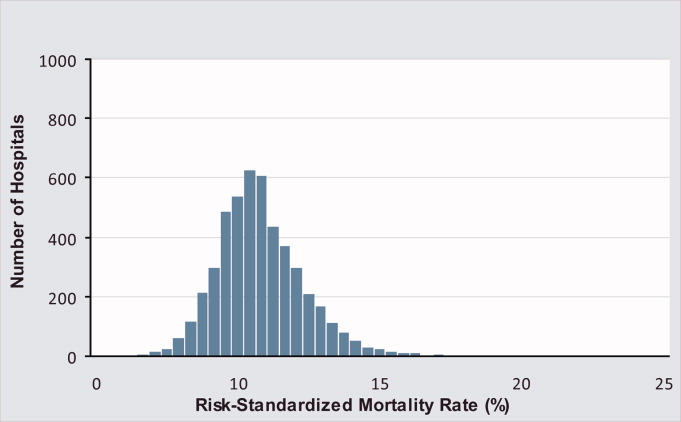
| Mortality | Readmission | |
|---|---|---|
| ||
| Patients (n) | 1118583 | 1161817 |
| Hospitals (n) | 4788 | 4813 |
| Patient age, years, median (Q1, Q3) | 81 (74,86) | 80 (74,86) |
| Nonwhite, % | 11.1 | 11.1 |
| Hospital case volume, median (Q1, Q3) | 168 (77,323) | 174 (79,334) |
| Risk‐standardized hospital rate, mean (SD) | 11.2 (1.2) | 18.3 (0.9) |
| Minimum | 6.7 | 13.6 |
| 1st percentile | 7.5 | 14.9 |
| 5th percentile | 8.5 | 15.8 |
| 10th percentile | 9.0 | 16.4 |
| 25th percentile | 10.0 | 17.2 |
| Median | 11.1 | 18.2 |
| 75th percentile | 12.3 | 19.2 |
| 90th percentile | 13.5 | 20.4 |
| 95th percentile | 14.4 | 21.1 |
| 99th percentile | 16.1 | 22.8 |
| Maximum | 20.9 | 26.7 |
| Model fit statistics | ||
| c‐Statistic | 0.72 | 0.63 |
| Intrahospital Correlation | 0.07 | 0.03 |
For the 3‐year period 2006 to 2009, 222 (4.7%) hospitals were categorized as having a mortality rate that was better than the national average, 3968 (83.7%) were no different than the national average, 221 (4.6%) were worse and 332 (7.0%) did not meet the minimum case threshold.
Among the 1,161,817 patients included in the readmission analysis 212,638 (18.3%) were readmitted within 30 days of hospital discharge. The median (Q1,Q3) 30‐day risk‐standardized readmission rate was 18.2% (17.2%, 19.2%) and ranged from 13.6% to 26.7% (Table 1, Figure 2). Hospitals at the 10th percentile had 30‐day risk‐standardized readmission rates of 16.4% while for those at the 90th percentile of performance the rate was 20.4%. The odds of all‐cause readmission for a patient treated at a hospital that was one standard deviation above the national average was 1.40 times higher than the odds of all‐cause readmission if treated at a hospital that was one standard deviation below the national average.
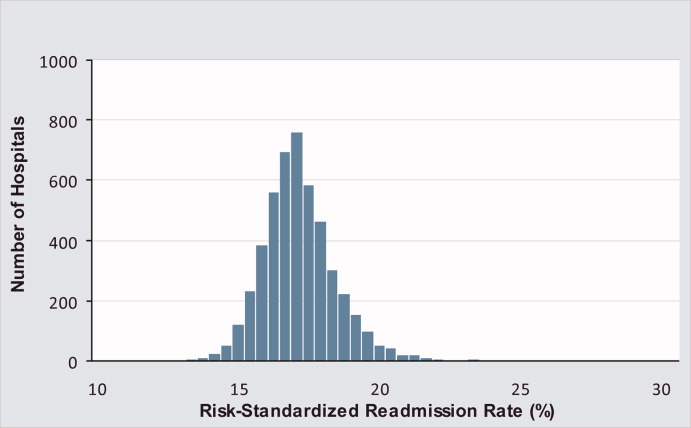
For the 3‐year period 2006 to 2009, 64 (1.3%) hospitals were categorized as having a readmission rate that was better than the national average, 4203 (88.2%) were no different than the national average, 163 (3.4%) were worse and 333 (7.0%) had less than 25 cases and were therefore not categorized.
While risk‐standardized readmission rates were substantially higher than risk‐standardized mortality rates, mortality rates varied more. For example, the top 10% of hospitals had a relative mortality rate that was 33% lower than those in the bottom 10%, as compared with just a 20% relative difference for readmission rates. The coefficient of variation, a normalized measure of dispersion that unlike the standard deviation is independent of the population mean, was 10.7 for risk‐standardized mortality rates and 4.9 for readmission rates.
Regional Risk‐Standardized 30‐Day Mortality and Readmission Rates
Figures 3 and 4 show the distribution of 30‐day risk‐standardized mortality and readmission rates among hospital referral regions by quintile. Highest mortality regions were found across the entire country, including parts of Northern New England, the Mid and South Atlantic, East and the West South Central, East and West North Central, and the Mountain and Pacific regions of the West. The lowest mortality rates were observed in Southern New England, parts of the Mid and South Atlantic, East and West South Central, and parts of the Mountain and Pacific regions of the West (Figure 3).
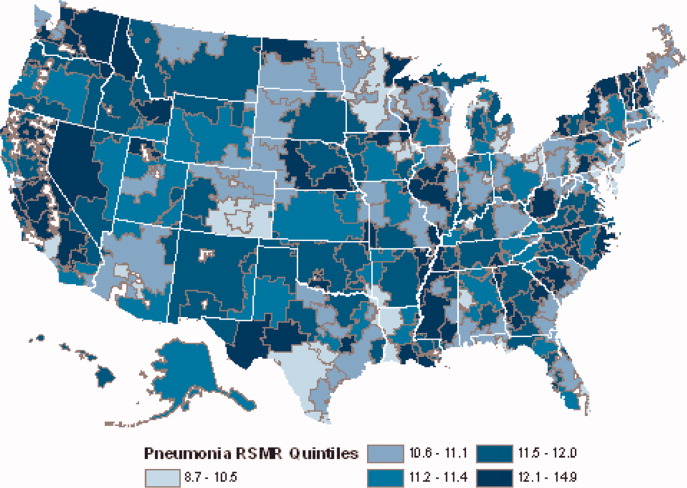
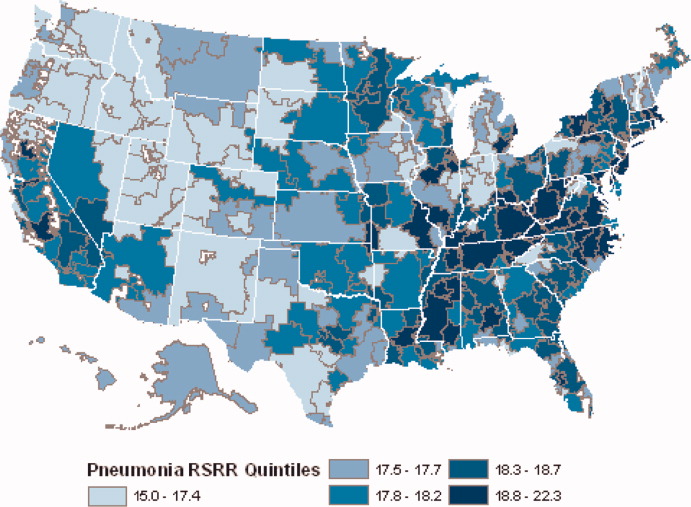
Readmission rates were higher in the eastern portions of the US (including the Northeast, Mid and South Atlantic, East South Central) as well as the East North Central, and small parts of the West North Central portions of the Midwest and in Central California. The lowest readmission rates were observed in the West (Mountain and Pacific regions), parts of the Midwest (East and West North Central) and small pockets within the South and Northeast (Figure 4).
Discussion
In this 3‐year analysis of patient, hospital, and regional outcomes we observed that pneumonia in the elderly remains a highly morbid illness, with a 30‐day mortality rate of approximately 11.6%. More notably we observed that risk‐standardized mortality rates, and to a lesser extent readmission rates, vary significantly across hospitals and regions. Finally, we observed that readmission rates, but not mortality rates, show strong geographic concentration.
These findings suggest possible opportunities to save or extend the lives of a substantial number of Americans, and to reduce the burden of rehospitalization on patients and families, if low performing institutions were able to achieve the performance of those with better outcomes. Additionally, because readmission is so common (nearly 1 in 5 patients), efforts to reduce overall health care spending should focus on this large potential source of savings.19 In this regard, impending changes in payment to hospitals around readmissions will change incentives for hospitals and physicians that may ultimately lead to lower readmission rates.20
Previous analyses of the quality of hospital care for patients with pneumonia have focused on the percentage of eligible patients who received guideline‐recommended antibiotics within a specified time frame (4 or 8 hours), and vaccination prior to hospital discharge.21, 22 These studies have highlighted large differences across hospitals and states in the percentage receiving recommended care. In contrast, the focus of this study was to compare risk‐standardized outcomes of care at the nation's hospitals and across its regions. This effort was guided by the notion that the measurement of care outcomes is an important complement to process measurement because outcomes represent a more holistic assessment of care, that an outcomes focus offers hospitals greater autonomy in terms of what processes to improve, and that outcomes are ultimately more meaningful to patients than the technical aspects of how the outcomes were achieved. In contrast to these earlier process‐oriented efforts, the magnitude of the differences we observed in mortality and readmission rates across hospitals was not nearly as large.
A recent analysis of the outcomes of care for patients with heart failure and acute myocardial infarction also found significant variation in both hospital and regional mortality and readmission rates.23 The relative differences in risk‐standardized hospital mortality rates across the 10th to 90th percentiles of hospital performance was 25% for acute myocardial infarction, and 39% for heart failure. By contrast, we found that the difference in risk‐standardized hospital mortality rates across the 10th to 90th percentiles in pneumonia was an even greater 50% (13.5% vs. 9.0%). Similar to the findings in acute myocardial infarction and heart failure, we observed that risk‐standardized mortality rates varied more so than did readmission rates.
Our study has a number of limitations. First, the analysis was restricted to Medicare patients only, and our findings may not be generalizable to younger patients. Second, our risk‐adjustment methods relied on claims data, not clinical information abstracted from charts. Nevertheless, we assessed comorbidities using all physician and hospital claims from the year prior to the index admission. Additionally our mortality and readmission models were validated against those based on medical record data and the outputs of the 2 approaches were highly correlated.15, 24, 25 Our study was restricted to patients with a principal diagnosis of pneumonia, and we therefore did not include those whose principal diagnosis was sepsis or respiratory failure and who had a secondary diagnosis of pneumonia. While this decision was made to reduce the risk of misclassifying complications of care as the reason for admission, we acknowledge that this is likely to have limited our study to patients with less severe disease, and may have introduced bias related to differences in hospital coding practices regarding the use of sepsis and respiratory failure codes. While we excluded patients with 1 day length of stay from the mortality analysis to reduce the risk of including patients in the measure who did not actually have pneumonia, we did not exclude them from the readmission analysis because very short length of stay may be a risk factor for readmission. An additional limitation of our study is that our findings are primarily descriptive, and we did not attempt to explain the sources of the variation we observed. For example, we did not examine the extent to which these differences might be explained by differences in adherence to process measures across hospitals or regions. However, if the experience in acute myocardial infarction can serve as a guide, then it is unlikely that more than a small fraction of the observed variation in outcomes can be attributed to factors such as antibiotic timing or selection.26 Additionally, we cannot explain why readmission rates were more geographically distributed than mortality rates, however it is possible that this may be related to the supply of physicians or hospital beds.27 Finally, some have argued that mortality and readmission rates do not necessarily reflect the very quality they intend to measure.2830
The outcomes of patients with pneumonia appear to be significantly influenced by both the hospital and region where they receive care. Efforts to improve population level outcomes might be informed by studying the practices of hospitals and regions that consistently achieve high levels of performance.31
Acknowledgements
The authors thank Sandi Nelson, Eric Schone, and Marian Wrobel at Mathematicia Policy Research and Changquin Wang and Jinghong Gao at YNHHS/Yale CORE for analytic support. They also acknowledge Shantal Savage, Kanchana Bhat, and Mayur M. Desai at Yale, Joseph S. Ross at the Mount Sinai School of Medicine, and Shaheen Halim at the Centers for Medicare and Medicaid Services.
- , , , , . HCUP Facts and Figures: Statistics on Hospital‐based Care in the United States, 2007 [Internet]. 2009 [cited 2009 Nov 7]. Available at: http://www.hcup‐us.ahrq.gov/reports.jsp. Accessed June2010.
- Agency for Healthcare Research and Quality. HCUP Nationwide Inpatient Sample (NIS). Healthcare Cost and Utilization Project (HCUP). [Internet]. 2007 [cited 2010 May 13]. Available at: http://www.hcup‐us.ahrq.gov/nisoverview.jsp. Accessed June2010.
- , , , , .Trends in hospitalizations for pneumonia among persons aged 65 years or older in the United States, 1988‐2002.JAMA.20057;294(21):2712–2719.
- . Deaths: Leading Causes for 2006. NVSS [Internet]. 2010 Mar 31;58(14). Available at: http://www.cdc.gov/nchs/data/nvsr/nvsr58/nvsr58_ 14.pdf. Accessed June2010.
- Centers for Medicare and Medicaid Services. Pneumonia [Internet]. [cited 2010 May 13]. Available at: http://www.qualitynet.org/dcs/ContentServer?cid= 108981596702326(1):75–85.
- , , .Performance measures for pneumonia: are they valuable, and are process measures adequate?Curr Opin Infect Dis.2007;20(2):182–189.
- , .Relationship Between Medicare's Hospital Compare Performance Measures and Mortality Rates.JAMA.2006;296(22):2694–2702.
- Medicare.gov ‐ Hospital Compare [Internet]. [cited 2009 Nov 6]. Available at: http://www.hospitalcompare.hhs.gov/Hospital/Search/Welcome.asp? version=default 2010. Available at: http://www.qualitynet.org/dcs/ContentServer? c=Page 2010. Available at: http://www.qualitynet.org/dcs/ContentServer? c=Page 2000 [cited 2009 Nov 7]. Available at: http://www.cms.hhs.gov/Reports/Reports/ItemDetail.asp?ItemID=CMS023176. Accessed June2010.
- , , , et al. Risk‐Adjustment Methodology for Hospital Monitoring/Surveillance and Public Reporting Supplement #1: 30‐Day Mortality Model for Pneumonia [Internet]. Yale University; 2006. Available at: http://www.qualitynet.org/dcs/ContentServer?c= Page 2008. Available at: http://www.qualitynet.org/dcs/ContentServer?c= Page1999.
- , .Statistical and clinical aspects of hospital outcomes profiling.Stat Sci.2007;22(2):206–226.
- Medicare Payment Advisory Commission. Report to the Congress: Promoting Greater Efficiency in Medicare.2007 June.
- Patient Protection and Affordable Care Act [Internet]. 2010. Available at: http://thomas.loc.gov. Accessed June2010.
- , , , et al.Quality of medical care delivered to medicare beneficiaries: a profile at state and national levels.JAMA.2000;284(13):1670–1676.
- , , , .Care in U.S. hospitals — the hospital quality alliance program.N Engl J Med.2005;353(3):265–274.
- , , , et al.Patterns of hospital performance in acute myocardial infarction and heart failure 30‐day mortality and readmission.Circ Cardiovasc Qual Outcomes.2009;2(5):407–413.
- , , , et al.An administrative claims model suitable for profiling hospital performance based on 30‐day mortality rates among patients with heart failure.Circulation.2006;113(13):1693–1701.
- , , , et al.An administrative claims model suitable for profiling hospital performance based on 30‐day mortality rates among patients with an acute myocardial infarction.Circulation.2006;113(13):1683–1692.
- , , , et al.Hospital quality for acute myocardial infarction: correlation among process measures and relationship with short‐term mortality.JAMA.2006;296(1):72–78.
- , , , .Hospital readmission rates for cohorts of medicare beneficiaries in Boston and New Haven.N Engl J Med.1994;331(15):989–995.
- , .Research evidence on the validity of risk‐adjusted mortality rate as a measure of hospital quality of care.Med Care Res Rev.1998;55(4):371–404.
- , .Hospital readmissions as a measure of quality of health care: advantages and limitations.Arch Intern Med.2000;160(8):1074–1081.
- , .Hospital mortality: when failure is not a good measure of success.CMAJ.2008;179(2):153–157.
- , , , , , .Research in action: using positive deviance to improve quality of health care.Implement Sci.2009;4:25.
Pneumonia results in some 1.2 million hospital admissions each year in the United States, is the second leading cause of hospitalization among patients over 65, and accounts for more than $10 billion annually in hospital expenditures.1, 2 As a result of complex demographic and clinical forces, including an aging population, increasing prevalence of comorbidities, and changes in antimicrobial resistance patterns, between the periods 1988 to 1990 and 2000 to 2002 the number of patients hospitalized for pneumonia grew by 20%, and pneumonia was the leading infectious cause of death.3, 4
Given its public health significance, pneumonia has been the subject of intensive quality measurement and improvement efforts for well over a decade. Two of the largest initiatives are the Centers for Medicare & Medicaid Services (CMS) National Pneumonia Project and The Joint Commission ORYX program.5, 6 These efforts have largely entailed measuring hospital performance on pneumonia‐specific processes of care, such as whether blood oxygen levels were assessed, whether blood cultures were drawn before antibiotic treatment was initiated, the choice and timing of antibiotics, and smoking cessation counseling and vaccination at the time of discharge. While measuring processes of care (especially when they are based on sound evidence), can provide insights about quality, and can help guide hospital improvement efforts, these measures necessarily focus on a narrow spectrum of the overall care provided. Outcomes can complement process measures by directing attention to the results of care, which are influenced by both measured and unmeasured factors, and which may be more relevant from the patient's perspective.79
In 2008 CMS expanded its public reporting initiatives by adding risk‐standardized hospital mortality rates for pneumonia to the Hospital Compare website (
Methods
Design, Setting, Subjects
We conducted a cross‐sectional study at the hospital level of the outcomes of care of fee‐for‐service patients hospitalized for pneumonia between July 2006 and June 2009. Patients are eligible to be included in the measures if they are 65 years or older, have a principal diagnosis of pneumonia (International Classification of Diseases, Ninth Revision, Clinical Modification codes 480.X, 481, 482.XX, 483.X, 485, 486, and 487.0), and are cared for at a nonfederal acute care hospital in the US and its organized territories, including Puerto Rico, Guam, the US Virgin Islands, and the Northern Mariana Islands.
The mortality measure excludes patients enrolled in the Medicare hospice program in the year prior to, or on the day of admission, those in whom pneumonia is listed as a secondary diagnosis (to eliminate cases resulting from complications of hospitalization), those discharged against medical advice, and patients who are discharged alive but whose length of stay in the hospital is less than 1 day (because of concerns about the accuracy of the pneumonia diagnosis). Patients are also excluded if their administrative records for the period of analysis (1 year prior to hospitalization and 30 days following discharge) were not available or were incomplete, because these are needed to assess comorbid illness and outcomes. The readmission measure is similar, but does not exclude patients on the basis of hospice program enrollment (because these patients have been admitted and readmissions for hospice patients are likely unplanned events that can be measured and reduced), nor on the basis of hospital length of stay (because patients discharged within 24 hours may be at a heightened risk of readmission).11, 12
Information about patient comorbidities is derived from diagnoses recorded in the year prior to the index hospitalization as found in Medicare inpatient, outpatient, and carrier (physician) standard analytic files. Comorbidities are identified using the Condition Categories of the Hierarchical Condition Category grouper, which sorts the more than 15,000 possible diagnostic codes into 189 clinically‐coherent conditions and which was originally developed to support risk‐adjusted payments within Medicare managed care.13
Outcomes
The patient outcomes assessed include death from any cause within 30 days of admission and readmission for any cause within 30 days of discharge. All‐cause, rather than disease‐specific, readmission was chosen because hospital readmission as a consequence of suboptimal inpatient care or discharge coordination may manifest in many different diagnoses, and no validated method is available to distinguish related from unrelated readmissions. The measures use the Medicare Enrollment Database to determine mortality status, and acute care hospital inpatient claims are used to identify readmission events. For patients with multiple hospitalizations during the study period, the mortality measure randomly selects one hospitalization to use for determination of mortality. Admissions that are counted as readmissions (i.e., those that occurred within 30 days of discharge following hospitalization for pneumonia) are not also treated as index hospitalizations. In the case of patients who are transferred to or from another acute care facility, responsibility for deaths is assigned to the hospital that initially admitted the patient, while responsibility for readmissions is assigned to the hospital that ultimately discharges the patient to a nonacute setting (e.g., home, skilled nursing facilities).
Risk‐Standardization Methods
Hierarchical logistic regression is used to model the log‐odds of mortality or readmission within 30 days of admission or discharge from an index pneumonia admission as a function of patient demographic and clinical characteristics and a random hospital‐specific intercept. This strategy accounts for within‐hospital correlation of the observed outcomes, and reflects the assumption that underlying differences in quality among the hospitals being evaluated lead to systematic differences in outcomes. In contrast to nonhierarchical models which ignore hospital effects, this method attempts to measure the influence of the hospital on patient outcome after adjusting for patient characteristics. Comorbidities from the index admission that could represent potential complications of care are not included in the model unless they are also documented in the 12 months prior to admission. Hospital‐specific mortality and readmission rates are calculated as the ratio of predicted‐to‐expected events (similar to the observed/expected ratio), multiplied by the national unadjusted rate, a form of indirect standardization.
The model for mortality has a c‐statistic of 0.72 whereas a model based on medical record review that was developed for validation purposes had a c‐statistic of 0.77. The model for readmission has a c‐statistic of 0.63 whereas a model based on medical review had a c‐statistic of 0.59. The mortality and readmission models produce similar state‐level mortality and readmission rate estimates as the models derived from medical record review, and can therefore serve as reasonable surrogates. These methods, including their development and validation, have been described fully elsewhere,14, 15 and have been evaluated and subsequently endorsed by the National Quality Forum.16
Identification of Geographic Regions
To characterize patterns of performance geographically we identified the 306 hospital referral regions for each hospital in our analysis using definitions provided by the Dartmouth Atlas of Health Care project. Unlike a hospital‐level analysis, the hospital referral regions represent regional markets for tertiary care and are widely used to summarize variation in medical care inputs, utilization patterns, and health outcomes and provide a more detailed look at variation in outcomes than results at the state level.17
Analyses
Summary statistics were constructed using frequencies and proportions for categorical data, and means, medians and interquartile ranges for continuous variables. To characterize 30‐day risk‐standardized mortality and readmission rates at the hospital‐referral region level, we calculated means and percentiles by weighting each hospital's value by the inverse of the variance of the hospital's estimated rate. Hospitals with larger sample sizes, and therefore more precise estimates, lend more weight to the average. Hierarchical models were estimated using the SAS GLIMMIX procedure. Bayesian shrinkage was used to estimate rates in order to take into account the greater uncertainty in the true rates of hospitals with small caseloads. Using this technique, estimated rates at low volume institutions are shrunken toward the population mean, while hospitals with large caseloads have a relatively smaller amount of shrinkage and the estimate is closer to the hospital's observed rate.18
To determine whether a hospital's performance is significantly different than the national rate we measured whether the 95% interval estimate for the risk‐standardized rate overlapped with the national crude mortality or readmission rate. This information is used to categorize hospitals on Hospital Compare as better than the US national rate, worse than the US national rate, or no different than the US national rate. Hospitals with fewer than 25 cases in the 3‐year period, are excluded from this categorization on Hospital Compare.
Analyses were conducted with the use of SAS 9.1.3 (SAS Institute Inc, Cary, NC). We created the hospital referral region maps using ArcGIS version 9.3 (ESRI, Redlands, CA). The Human Investigation Committee at the Yale School of Medicine approved an exemption for the authors to use CMS claims and enrollment data for research analyses and publication.
Results
Hospital‐Specific Risk‐Standardized 30‐Day Mortality and Readmission Rates
Of the 1,118,583 patients included in the mortality analysis 129,444 (11.6%) died within 30 days of hospital admission. The median (Q1, Q3) hospital 30‐day risk‐standardized mortality rate was 11.1% (10.0%, 12.3%), and ranged from 6.7% to 20.9% (Table 1, Figure 1). Hospitals at the 10th percentile had 30‐day risk‐standardized mortality rates of 9.0% while for those at the 90th percentile of performance the rate was 13.5%. The odds of all‐cause mortality for a patient treated at a hospital that was one standard deviation above the national average was 1.68 times higher than that of a patient treated at a hospital that was one standard deviation below the national average.
| Mortality | Readmission | |
|---|---|---|
| ||
| Patients (n) | 1118583 | 1161817 |
| Hospitals (n) | 4788 | 4813 |
| Patient age, years, median (Q1, Q3) | 81 (74,86) | 80 (74,86) |
| Nonwhite, % | 11.1 | 11.1 |
| Hospital case volume, median (Q1, Q3) | 168 (77,323) | 174 (79,334) |
| Risk‐standardized hospital rate, mean (SD) | 11.2 (1.2) | 18.3 (0.9) |
| Minimum | 6.7 | 13.6 |
| 1st percentile | 7.5 | 14.9 |
| 5th percentile | 8.5 | 15.8 |
| 10th percentile | 9.0 | 16.4 |
| 25th percentile | 10.0 | 17.2 |
| Median | 11.1 | 18.2 |
| 75th percentile | 12.3 | 19.2 |
| 90th percentile | 13.5 | 20.4 |
| 95th percentile | 14.4 | 21.1 |
| 99th percentile | 16.1 | 22.8 |
| Maximum | 20.9 | 26.7 |
| Model fit statistics | ||
| c‐Statistic | 0.72 | 0.63 |
| Intrahospital Correlation | 0.07 | 0.03 |
For the 3‐year period 2006 to 2009, 222 (4.7%) hospitals were categorized as having a mortality rate that was better than the national average, 3968 (83.7%) were no different than the national average, 221 (4.6%) were worse and 332 (7.0%) did not meet the minimum case threshold.
Among the 1,161,817 patients included in the readmission analysis 212,638 (18.3%) were readmitted within 30 days of hospital discharge. The median (Q1,Q3) 30‐day risk‐standardized readmission rate was 18.2% (17.2%, 19.2%) and ranged from 13.6% to 26.7% (Table 1, Figure 2). Hospitals at the 10th percentile had 30‐day risk‐standardized readmission rates of 16.4% while for those at the 90th percentile of performance the rate was 20.4%. The odds of all‐cause readmission for a patient treated at a hospital that was one standard deviation above the national average was 1.40 times higher than the odds of all‐cause readmission if treated at a hospital that was one standard deviation below the national average.
For the 3‐year period 2006 to 2009, 64 (1.3%) hospitals were categorized as having a readmission rate that was better than the national average, 4203 (88.2%) were no different than the national average, 163 (3.4%) were worse and 333 (7.0%) had less than 25 cases and were therefore not categorized.
While risk‐standardized readmission rates were substantially higher than risk‐standardized mortality rates, mortality rates varied more. For example, the top 10% of hospitals had a relative mortality rate that was 33% lower than those in the bottom 10%, as compared with just a 20% relative difference for readmission rates. The coefficient of variation, a normalized measure of dispersion that unlike the standard deviation is independent of the population mean, was 10.7 for risk‐standardized mortality rates and 4.9 for readmission rates.
Regional Risk‐Standardized 30‐Day Mortality and Readmission Rates
Figures 3 and 4 show the distribution of 30‐day risk‐standardized mortality and readmission rates among hospital referral regions by quintile. Highest mortality regions were found across the entire country, including parts of Northern New England, the Mid and South Atlantic, East and the West South Central, East and West North Central, and the Mountain and Pacific regions of the West. The lowest mortality rates were observed in Southern New England, parts of the Mid and South Atlantic, East and West South Central, and parts of the Mountain and Pacific regions of the West (Figure 3).
Readmission rates were higher in the eastern portions of the US (including the Northeast, Mid and South Atlantic, East South Central) as well as the East North Central, and small parts of the West North Central portions of the Midwest and in Central California. The lowest readmission rates were observed in the West (Mountain and Pacific regions), parts of the Midwest (East and West North Central) and small pockets within the South and Northeast (Figure 4).
Discussion
In this 3‐year analysis of patient, hospital, and regional outcomes we observed that pneumonia in the elderly remains a highly morbid illness, with a 30‐day mortality rate of approximately 11.6%. More notably we observed that risk‐standardized mortality rates, and to a lesser extent readmission rates, vary significantly across hospitals and regions. Finally, we observed that readmission rates, but not mortality rates, show strong geographic concentration.
These findings suggest possible opportunities to save or extend the lives of a substantial number of Americans, and to reduce the burden of rehospitalization on patients and families, if low performing institutions were able to achieve the performance of those with better outcomes. Additionally, because readmission is so common (nearly 1 in 5 patients), efforts to reduce overall health care spending should focus on this large potential source of savings.19 In this regard, impending changes in payment to hospitals around readmissions will change incentives for hospitals and physicians that may ultimately lead to lower readmission rates.20
Previous analyses of the quality of hospital care for patients with pneumonia have focused on the percentage of eligible patients who received guideline‐recommended antibiotics within a specified time frame (4 or 8 hours), and vaccination prior to hospital discharge.21, 22 These studies have highlighted large differences across hospitals and states in the percentage receiving recommended care. In contrast, the focus of this study was to compare risk‐standardized outcomes of care at the nation's hospitals and across its regions. This effort was guided by the notion that the measurement of care outcomes is an important complement to process measurement because outcomes represent a more holistic assessment of care, that an outcomes focus offers hospitals greater autonomy in terms of what processes to improve, and that outcomes are ultimately more meaningful to patients than the technical aspects of how the outcomes were achieved. In contrast to these earlier process‐oriented efforts, the magnitude of the differences we observed in mortality and readmission rates across hospitals was not nearly as large.
A recent analysis of the outcomes of care for patients with heart failure and acute myocardial infarction also found significant variation in both hospital and regional mortality and readmission rates.23 The relative differences in risk‐standardized hospital mortality rates across the 10th to 90th percentiles of hospital performance was 25% for acute myocardial infarction, and 39% for heart failure. By contrast, we found that the difference in risk‐standardized hospital mortality rates across the 10th to 90th percentiles in pneumonia was an even greater 50% (13.5% vs. 9.0%). Similar to the findings in acute myocardial infarction and heart failure, we observed that risk‐standardized mortality rates varied more so than did readmission rates.
Our study has a number of limitations. First, the analysis was restricted to Medicare patients only, and our findings may not be generalizable to younger patients. Second, our risk‐adjustment methods relied on claims data, not clinical information abstracted from charts. Nevertheless, we assessed comorbidities using all physician and hospital claims from the year prior to the index admission. Additionally our mortality and readmission models were validated against those based on medical record data and the outputs of the 2 approaches were highly correlated.15, 24, 25 Our study was restricted to patients with a principal diagnosis of pneumonia, and we therefore did not include those whose principal diagnosis was sepsis or respiratory failure and who had a secondary diagnosis of pneumonia. While this decision was made to reduce the risk of misclassifying complications of care as the reason for admission, we acknowledge that this is likely to have limited our study to patients with less severe disease, and may have introduced bias related to differences in hospital coding practices regarding the use of sepsis and respiratory failure codes. While we excluded patients with 1 day length of stay from the mortality analysis to reduce the risk of including patients in the measure who did not actually have pneumonia, we did not exclude them from the readmission analysis because very short length of stay may be a risk factor for readmission. An additional limitation of our study is that our findings are primarily descriptive, and we did not attempt to explain the sources of the variation we observed. For example, we did not examine the extent to which these differences might be explained by differences in adherence to process measures across hospitals or regions. However, if the experience in acute myocardial infarction can serve as a guide, then it is unlikely that more than a small fraction of the observed variation in outcomes can be attributed to factors such as antibiotic timing or selection.26 Additionally, we cannot explain why readmission rates were more geographically distributed than mortality rates, however it is possible that this may be related to the supply of physicians or hospital beds.27 Finally, some have argued that mortality and readmission rates do not necessarily reflect the very quality they intend to measure.2830
The outcomes of patients with pneumonia appear to be significantly influenced by both the hospital and region where they receive care. Efforts to improve population level outcomes might be informed by studying the practices of hospitals and regions that consistently achieve high levels of performance.31
Acknowledgements
The authors thank Sandi Nelson, Eric Schone, and Marian Wrobel at Mathematicia Policy Research and Changquin Wang and Jinghong Gao at YNHHS/Yale CORE for analytic support. They also acknowledge Shantal Savage, Kanchana Bhat, and Mayur M. Desai at Yale, Joseph S. Ross at the Mount Sinai School of Medicine, and Shaheen Halim at the Centers for Medicare and Medicaid Services.
- , , , , . HCUP Facts and Figures: Statistics on Hospital‐based Care in the United States, 2007 [Internet]. 2009 [cited 2009 Nov 7]. Available at: http://www.hcup‐us.ahrq.gov/reports.jsp. Accessed June2010.
- Agency for Healthcare Research and Quality. HCUP Nationwide Inpatient Sample (NIS). Healthcare Cost and Utilization Project (HCUP). [Internet]. 2007 [cited 2010 May 13]. Available at: http://www.hcup‐us.ahrq.gov/nisoverview.jsp. Accessed June2010.
- , , , , .Trends in hospitalizations for pneumonia among persons aged 65 years or older in the United States, 1988‐2002.JAMA.20057;294(21):2712–2719.
- . Deaths: Leading Causes for 2006. NVSS [Internet]. 2010 Mar 31;58(14). Available at: http://www.cdc.gov/nchs/data/nvsr/nvsr58/nvsr58_ 14.pdf. Accessed June2010.
- Centers for Medicare and Medicaid Services. Pneumonia [Internet]. [cited 2010 May 13]. Available at: http://www.qualitynet.org/dcs/ContentServer?cid= 108981596702326(1):75–85.
- , , .Performance measures for pneumonia: are they valuable, and are process measures adequate?Curr Opin Infect Dis.2007;20(2):182–189.
- , .Relationship Between Medicare's Hospital Compare Performance Measures and Mortality Rates.JAMA.2006;296(22):2694–2702.
- Medicare.gov ‐ Hospital Compare [Internet]. [cited 2009 Nov 6]. Available at: http://www.hospitalcompare.hhs.gov/Hospital/Search/Welcome.asp? version=default 2010. Available at: http://www.qualitynet.org/dcs/ContentServer? c=Page 2010. Available at: http://www.qualitynet.org/dcs/ContentServer? c=Page 2000 [cited 2009 Nov 7]. Available at: http://www.cms.hhs.gov/Reports/Reports/ItemDetail.asp?ItemID=CMS023176. Accessed June2010.
- , , , et al. Risk‐Adjustment Methodology for Hospital Monitoring/Surveillance and Public Reporting Supplement #1: 30‐Day Mortality Model for Pneumonia [Internet]. Yale University; 2006. Available at: http://www.qualitynet.org/dcs/ContentServer?c= Page 2008. Available at: http://www.qualitynet.org/dcs/ContentServer?c= Page1999.
- , .Statistical and clinical aspects of hospital outcomes profiling.Stat Sci.2007;22(2):206–226.
- Medicare Payment Advisory Commission. Report to the Congress: Promoting Greater Efficiency in Medicare.2007 June.
- Patient Protection and Affordable Care Act [Internet]. 2010. Available at: http://thomas.loc.gov. Accessed June2010.
- , , , et al.Quality of medical care delivered to medicare beneficiaries: a profile at state and national levels.JAMA.2000;284(13):1670–1676.
- , , , .Care in U.S. hospitals — the hospital quality alliance program.N Engl J Med.2005;353(3):265–274.
- , , , et al.Patterns of hospital performance in acute myocardial infarction and heart failure 30‐day mortality and readmission.Circ Cardiovasc Qual Outcomes.2009;2(5):407–413.
- , , , et al.An administrative claims model suitable for profiling hospital performance based on 30‐day mortality rates among patients with heart failure.Circulation.2006;113(13):1693–1701.
- , , , et al.An administrative claims model suitable for profiling hospital performance based on 30‐day mortality rates among patients with an acute myocardial infarction.Circulation.2006;113(13):1683–1692.
- , , , et al.Hospital quality for acute myocardial infarction: correlation among process measures and relationship with short‐term mortality.JAMA.2006;296(1):72–78.
- , , , .Hospital readmission rates for cohorts of medicare beneficiaries in Boston and New Haven.N Engl J Med.1994;331(15):989–995.
- , .Research evidence on the validity of risk‐adjusted mortality rate as a measure of hospital quality of care.Med Care Res Rev.1998;55(4):371–404.
- , .Hospital readmissions as a measure of quality of health care: advantages and limitations.Arch Intern Med.2000;160(8):1074–1081.
- , .Hospital mortality: when failure is not a good measure of success.CMAJ.2008;179(2):153–157.
- , , , , , .Research in action: using positive deviance to improve quality of health care.Implement Sci.2009;4:25.
Copyright © 2010 Society of Hospital Medicine
