User login
An unplanned career
A focus on health system transformation
I have to admit that I am not sure I am a legacy in hospital medicine, and the term legacy throws me off a bit. I came to medical school after working at McKinsey & Co. consulting, and I chose pediatrics because of my love of working with children and families, as well as a vague notion that I wanted to work on “system” issues, and therefore, more generalist-type training seemed applicable.

I met Chris Landrigan, MD, MPH, and Vinny Chiang, MD, and learned what a hospitalist was, as an intern in 2002. We had a research elective and I was able to publish a couple of papers in Pediatrics on pediatric hospital medicine with Chris and Raj Srivastava, MD, MPH. In 2004, I went to my first Society of Hospital Medicine meeting and met Larry Wellikson, MD, MHM, and others. From there, I went to the Robert Wood Johnson Clinical Scholars Program, with Ron Keren, MD, MPH, and others, and along with faculty from the Cincinnati Children’s in hospital medicine.
In 2007, I applied for a White House Fellowship and told my wife that I didn’t think there was a chance that I would get it, so we should keep building our new home in Cincinnati. We were both surprised when I was selected. I served Michael Leavitt, the then-Secretary of the Department of Health & Human Services, as his White House fellow during the Bush administration, and then served as his chief medical officer. Exposure to health policy and leadership at that level was career shaping. Cincinnati Children’s was searching for a leader for the conversion of pediatric hospital medicine into a full division in 2009. So I returned to Cincinnati to take on leading pediatric hospital medicine, and a role leading quality measurement and improvement efforts for the entire health system. I loved the work and thought I would remain in that role, and our family would be in Cincinnati for a long time. Best laid plans …
In early 2011, Don Berwick, MD, who was then the administrator of the Centers for Medicare & Medicaid Services called and asked whether I “would come talk with him in D.C.” That talk quickly became a series of interviews, and he offered me the opportunity to be chief medical officer of CMS. He said “this platform is like no other to drive change.” He was right. I have been fortunate to have a few step-change opportunities in my life, and that was one.
On my first day at CMS, I looked around the table of senior executives reporting to me and realized they had more than 200 years of CMS experience. I was a bit scared. Together, we led the implementation of Hospital Value-Based Purchasing, the Compare websites, and numerous quality measurement and improvement programs. Partnership for Patients works on patient safety and was associated with preventing more than 3 million infections and adverse events, over 125,000 lives saved, and more than $26 billion in savings.
In early 2013, I was asked to lead the CMS Innovation Center (CMMI). The goal was to launch new payment and service delivery models to improve quality and lower costs. We launched Accountable Care Organizations, Bundled Payment programs, primary care medical homes, state-based innovation, and so much more. Medicare went from zero dollars in alternative payment models, where providers are accountable for quality and total cost of care, to more than 30% of Medicare payments, representing over $200 billion through agreements with more than 200,000 providers in these alternative payment models. It was the biggest shift in U.S. history in how CMS paid for care. Later, I became principal deputy administrator and acting administrator of CMS, leading an agency that spends over $1 trillion per year, or more than $2.5 billion per day and insures over 130 million Americans. We also improved from being bottom quintile in employee engagement and satisfaction across the federal government to No. 2.
I had assumed that, after working at CMS, I would return to a hospital/health system leadership role. But then, a recruiter called about the CEO role at Blue Cross Blue Shield of North Carolina. It is one of the largest not-for-profit health plans in the country and insures most of the people in North Carolina, many for most of their lives. I met a 75-year-old woman the other day that we have insured every day of her life. I am almost a year into the role and it is a mission-driven organization that drives positive change. I love it so far.
We are going to partner with providers, so that more than half of our payments will be in advanced alternative payment models. No payer in the United States has done that yet. This allows us to innovate and decrease friction in the system (e.g., turn off prior authorization) and be jointly accountable with providers for quality and total cost of care. We insure people through the ACA [Affordable Care Act], commercial, and Medicare markets, and are competing to serve Medicaid as well. We have invested more than $50 million to address social determinants of health across the state. We are making major investments in primary care, and mental and behavioral health. Our goal is to be a Model Blue – or a Model of Health Transformation for our state and nation – and achieve better health outcomes, lower costs, and best-in-class experience for all people we serve. I have learned that no physician leads a health plan of this size, and apparently, no practicing physician has ever led a health plan of this size.
What are some lessons learned over my career? I have had five criteria for all my career decisions: 1) family; 2) impact – better care and outcomes, lower costs, and exceptional experience for populations of patients; 3) people – mentors and colleagues; 4) learning; and 5) joy in work. If someone gives you a chance to lead people in your career as a physician, jump at the chance. We do a relatively poor job of providing this type of opportunity to those early in their careers in medicine, and learning how to manage people and money allows you to progress as a leader and manager.
Don’t listen to the people who say “you must do X before Y” or “you must take this path.” They are usually wrong. Take chances. I applied for many roles for which I was a long shot, and I didn’t always succeed. That’s life and learning. Hospital medicine is a great career. I worked in the hospital on a recent weekend and was able to help families through everything from palliative care decisions and new diagnoses, to recovering from illness. It is an honor to serve and help families in their time of need. Hospitalists have been – and should continue to be – primary drivers of the shift in our health system to value-based care.
As I look back on my career (and I hope I am only halfway done), I could not have predicted more than 90% of it. I was blessed with many opportunities, mentors, and teachers along the way. I try to pass this on by mentoring and teaching others. How did my career happen? I am not sure, but it has been a fun ride! And hopefully I have helped improve the health system some, along the way.
Dr. Conway is president and CEO of Blue Cross and Blue Shield of North Carolina. He is a hospitalist and former deputy administrator for innovation and quality at the Centers for Medicare and Medicaid Services.
A focus on health system transformation
A focus on health system transformation
I have to admit that I am not sure I am a legacy in hospital medicine, and the term legacy throws me off a bit. I came to medical school after working at McKinsey & Co. consulting, and I chose pediatrics because of my love of working with children and families, as well as a vague notion that I wanted to work on “system” issues, and therefore, more generalist-type training seemed applicable.
I met Chris Landrigan, MD, MPH, and Vinny Chiang, MD, and learned what a hospitalist was, as an intern in 2002. We had a research elective and I was able to publish a couple of papers in Pediatrics on pediatric hospital medicine with Chris and Raj Srivastava, MD, MPH. In 2004, I went to my first Society of Hospital Medicine meeting and met Larry Wellikson, MD, MHM, and others. From there, I went to the Robert Wood Johnson Clinical Scholars Program, with Ron Keren, MD, MPH, and others, and along with faculty from the Cincinnati Children’s in hospital medicine.
In 2007, I applied for a White House Fellowship and told my wife that I didn’t think there was a chance that I would get it, so we should keep building our new home in Cincinnati. We were both surprised when I was selected. I served Michael Leavitt, the then-Secretary of the Department of Health & Human Services, as his White House fellow during the Bush administration, and then served as his chief medical officer. Exposure to health policy and leadership at that level was career shaping. Cincinnati Children’s was searching for a leader for the conversion of pediatric hospital medicine into a full division in 2009. So I returned to Cincinnati to take on leading pediatric hospital medicine, and a role leading quality measurement and improvement efforts for the entire health system. I loved the work and thought I would remain in that role, and our family would be in Cincinnati for a long time. Best laid plans …
In early 2011, Don Berwick, MD, who was then the administrator of the Centers for Medicare & Medicaid Services called and asked whether I “would come talk with him in D.C.” That talk quickly became a series of interviews, and he offered me the opportunity to be chief medical officer of CMS. He said “this platform is like no other to drive change.” He was right. I have been fortunate to have a few step-change opportunities in my life, and that was one.
On my first day at CMS, I looked around the table of senior executives reporting to me and realized they had more than 200 years of CMS experience. I was a bit scared. Together, we led the implementation of Hospital Value-Based Purchasing, the Compare websites, and numerous quality measurement and improvement programs. Partnership for Patients works on patient safety and was associated with preventing more than 3 million infections and adverse events, over 125,000 lives saved, and more than $26 billion in savings.
In early 2013, I was asked to lead the CMS Innovation Center (CMMI). The goal was to launch new payment and service delivery models to improve quality and lower costs. We launched Accountable Care Organizations, Bundled Payment programs, primary care medical homes, state-based innovation, and so much more. Medicare went from zero dollars in alternative payment models, where providers are accountable for quality and total cost of care, to more than 30% of Medicare payments, representing over $200 billion through agreements with more than 200,000 providers in these alternative payment models. It was the biggest shift in U.S. history in how CMS paid for care. Later, I became principal deputy administrator and acting administrator of CMS, leading an agency that spends over $1 trillion per year, or more than $2.5 billion per day and insures over 130 million Americans. We also improved from being bottom quintile in employee engagement and satisfaction across the federal government to No. 2.
I had assumed that, after working at CMS, I would return to a hospital/health system leadership role. But then, a recruiter called about the CEO role at Blue Cross Blue Shield of North Carolina. It is one of the largest not-for-profit health plans in the country and insures most of the people in North Carolina, many for most of their lives. I met a 75-year-old woman the other day that we have insured every day of her life. I am almost a year into the role and it is a mission-driven organization that drives positive change. I love it so far.
We are going to partner with providers, so that more than half of our payments will be in advanced alternative payment models. No payer in the United States has done that yet. This allows us to innovate and decrease friction in the system (e.g., turn off prior authorization) and be jointly accountable with providers for quality and total cost of care. We insure people through the ACA [Affordable Care Act], commercial, and Medicare markets, and are competing to serve Medicaid as well. We have invested more than $50 million to address social determinants of health across the state. We are making major investments in primary care, and mental and behavioral health. Our goal is to be a Model Blue – or a Model of Health Transformation for our state and nation – and achieve better health outcomes, lower costs, and best-in-class experience for all people we serve. I have learned that no physician leads a health plan of this size, and apparently, no practicing physician has ever led a health plan of this size.
What are some lessons learned over my career? I have had five criteria for all my career decisions: 1) family; 2) impact – better care and outcomes, lower costs, and exceptional experience for populations of patients; 3) people – mentors and colleagues; 4) learning; and 5) joy in work. If someone gives you a chance to lead people in your career as a physician, jump at the chance. We do a relatively poor job of providing this type of opportunity to those early in their careers in medicine, and learning how to manage people and money allows you to progress as a leader and manager.
Don’t listen to the people who say “you must do X before Y” or “you must take this path.” They are usually wrong. Take chances. I applied for many roles for which I was a long shot, and I didn’t always succeed. That’s life and learning. Hospital medicine is a great career. I worked in the hospital on a recent weekend and was able to help families through everything from palliative care decisions and new diagnoses, to recovering from illness. It is an honor to serve and help families in their time of need. Hospitalists have been – and should continue to be – primary drivers of the shift in our health system to value-based care.
As I look back on my career (and I hope I am only halfway done), I could not have predicted more than 90% of it. I was blessed with many opportunities, mentors, and teachers along the way. I try to pass this on by mentoring and teaching others. How did my career happen? I am not sure, but it has been a fun ride! And hopefully I have helped improve the health system some, along the way.
Dr. Conway is president and CEO of Blue Cross and Blue Shield of North Carolina. He is a hospitalist and former deputy administrator for innovation and quality at the Centers for Medicare and Medicaid Services.
Affordable Care Act Implementation
At the Centers for Medicare and Medicaid Services (CMS), we are charged with implementing many of the major provisions of the Affordable Care Act (ACA). Major policies and programs aimed at transforming the way care is delivered and paid for, testing and scaling innovative delivery system reforms, and expanding the number of Americans with health insurance will now move forward. The healthcare system is moving from paying for volume to paying for value. Hospitals and clinicians will need to be able to manage and be accountable for populations of patients and improving health outcomes. In this article, we highlight 4 broad provisions of the ACA that are either already implemented or under development for implementation in 2014, and are anticipated to have widespread impact on our health system. The potential impacts of each provision on hospitals and hospitalists are outlined in Table 1.
| Affordable Care Act Provision | Example of Potential Impacts on Hospitals and Hospitalists |
|---|---|
| |
| Expansion of insurance coverage | Care for fewer uninsured patients/fewer unreimbursed services |
| Patients have improved access to services after discharge | |
| Shorter lengths of stay due to better access to outpatient services and care | |
| Delivery system transformation | Financial incentives aligned between inpatient and outpatient providers to better coordinate care |
| Payment is at risk if performance rates do not meet benchmarks and if costs are not lowered | |
| Consolidation of hospitals and health systems within local markets | |
| Value‐based purchasing | Medicare FFS reimbursement increased or decreased based on quality and cost measure results |
| Opportunity to align incentives between hospitals and hospitalists | |
| Patient‐centered outcomes research | Emerging research on delivery system interventions relevant to hospitalists, such as care transitions |
| Funding for PCOR available for hospitalist researchers interested in delivery systems and outcomes research | |
EXPANSION OF INSURANCE COVERAGE
The central and perhaps most anticipated provision of the ACA is the expansion of insurance to the currently uninsured through the creation of state‐based health insurance exchanges. The exchanges are a competitive marketplace for purchasing private insurance products by individuals and small and large businesses. The individual mandate that accompanies the exchange provision requires that individuals purchase insurance. For those who cannot afford it, the government provides a subsidy. Any health plan that wishes to participate in an exchange marketplace must include at minimum a package of essential health benefits in each of their insurance products, which include benefits such as ambulatory care services, maternal and newborn services, and prescription drugs.[1] Importantly, health plans are required to implement quality improvement strategies and publicly report quality data. The ACA also requires the Secretary of Health and Human Services (HHS) to develop and administer a quality rating system and an enrollee satisfaction survey system, the results of which will be available to exchange consumers. All of these requirements will promote the delivery of high‐quality healthcare to millions of previously uninsured Americans.
Implementation of the exchanges in combination with the expansion of Medicaid is expected to provide insurance to approximately 30 million people who currently lack coverage. Prior to the Supreme Court ruling in June of 2012, states were required to expand Medicaid eligibility to a minimum of 133% of the federal poverty level. This expansion is subsidized 100% by the federal government through 2016, dropping to 90% by 2020. The Supreme Court ruled that the federal government could not require states to expand their Medicaid rolls, although it is expected that most states will do so given the generous federal subsidy and the significant cost to states, hospitals, and society to provide healthcare to the uninsured.
TRANSFORMATION OF HEALTHCARE DELIVERY
In addition to the expansion of insurance coverage, the ACA initiates a transformation in the way that healthcare will be delivered through the testing and implementation of innovative payment and care delivery models. The ACA authorized the creation of the Center for Medicare and Medicaid Innovation (CMMI, or The Innovation Center) within CMS. Payment and care delivery demonstrations or pilots that demonstrate a high quality of care at lower costs can be scaled up nationally at the discretion of the Secretary, rather than requiring authorization by Congress. The Innovation Center has already launched initiatives that test a variety of new models of care, all of which incentivize care coordination, provision of team‐based care, and use of data and quality metrics to drive systems‐based improvement. These programs include pilots that bundle payments to hospitals, physician group practices, and post‐acute care facilities for episodes of care across settings. This allows providers to innovate and redesign systems to deliver equivalent or higher quality of care at lower costs. Another CMMI model, called the comprehensive primary care initiative, involves CMS partnering with private insurers to provide payment to primary care practices for the delivery of chronic disease management and coordinated care to their entire population of patients, regardless of payer. Of great relevance to all hospitalists, CMMI and CMS, in partnership with other HHS agencies, launched the Partnership for Patients program in 2011. To date, approximately 4000 hospitals have signed on to the Partnership in a collective effort to significantly reduce hospital readmissions and hospital‐acquired conditions. Hospitalists are leading the charge related to Partnership for Patients in many hospitals. The Innovation Center is concurrently launching and rapidly evaluating current pilots, while considering what other new pilots might be needed to further test models aimed at the delivery of better healthcare and health outcomes at lower costs.
Perhaps the delivery system initiative that has received the most attention is the implementation of the Medicare Shared Savings Program (MSSP), or Accountable Care Organizations (ACO). Under the MSSP, ACOs are groups of providers (which may include hospitals) and suppliers of services who work together to coordinate care for the patients they serve. Participating ACOs must achieve performance benchmarks while lowering costs to share in the cost savings with CMS. Although this program is focused on Medicare fee‐for‐service (FFS) beneficiaries, it is expected that all patients will benefit from the infrastructure redesign and care coordination that is required under this program. The pioneer ACOs are large integrated health systems or other providers that have higher levels of shared risk in addition to shared savings. Hospitals that are a part of a participating ACO have greater financial incentives to work with their primary care and other outpatient providers to reduce readmissions and other adverse events and achieve quality benchmarks. With the degree of savings as well as financial risk that is on the table, it is possible that over time, hospitals and health systems may consolidate to capture a larger share of the market. Such a consequence could have a parallel effect on job opportunities and financial incentives and risk for hospitalists in local markets.
VALUE‐BASED PURCHASING
Improvement in the quality of care delivered to all patients is another central purpose of the Affordable Care Act. The law requires that the Secretary develop a National Quality Strategy that must be updated annually; the first version of this strategy was published in April of 2011.[2] The strategy identifies 3 aims for the nation: better healthcare for individuals, better health for populations and communities, and lower costs for all. One of the levers that CMS uses to achieve these 3 aims is value‐based purchasing (VBP). VBP is a way to link the National Quality Strategy with Medicare FFS payments on a national scale by adjusting payments based on performance. VBP rewards providers and health systems that deliver better outcomes in health and healthcare at lower cost to the beneficiaries and communities they serve, rather than rewarding them for the volume of services they provide. The ACA authorizes implementation of the Hospital Value‐Based Purchasing (HVBP) program as well as the Physician Value Modifier (PVM). The HVBP program began in 2011, and currently includes process, outcome, and patient experience quality metrics as well as a total cost metric, which includes 30 days postdischarge for beneficiaries admitted to the hospital. Hospitals are rewarded on either their improvement from baseline or achievement of a benchmark, whichever is higher.[3] The PVM program adjusts providers' Medicare FFS payments up or down beginning in 2015, based on quality metrics reported on care provided in 2013. In the first year of the program, groups of 100 or more physicians are eligible for the program, and are given a choice on metrics to report and whether to elect for quality tiering and the potential for payment adjustment[4]; by payment year 2017, all physicians must participate. To participate, physicians must report on quality metrics that they choose through the Physician Quality Reporting System (PQRS) or elect to have their quality assessed based on administrative claim measures. Measures currently in the PQRS program may not always be relevant for hospitalists; CMS is working to define and include metrics that would be most meaningful to hospitalists' scope of practice and is seeking comment on whether to allow hospital‐based physicians to align with and accept hospital quality measures to count as their performance metrics.
PATIENT‐CENTERED OUTCOMES RESEARCH
Building on the down payment on Comparative Effectiveness Research (CER) funded under the American Recovery and Reinvestment Act of 2009, the ACA authorized the creation of the Patient‐Centered Outcomes Research Institute (PCORI) and allocated funding for CER over 10 years. Rebranded as Patient‐Centered Outcomes Research (PCOR), CER has the potential to improve quality and reduce costs by identifying what works for different populations of patients (eg, children, elderly, patients with multiple chronic conditions, racial and ethnic minorities) in varied settings (eg, ambulatory, hospital, nursing home) under real‐world conditions. The PCORI governance board was created in 2010, and as required by law, developed a national agenda for patient‐centered outcomes research, which includes assessment of prevention, diagnosis, and treatment options; improving healthcare systems; communicating and disseminating research; addressing healthcare disparities; and accelerating PCOR and methodological research. The amount of funding available for research and PCOR infrastructure will ramp up over the next several years, eventually reaching approximately $500 million annually, with increasing funding opportunities for comparative research questions related to clinical and delivery system interventions using pragmatic, randomized, controlled trials; implementation science; and other novel research methodologies. Hospitalists have many roles within this realm, whether as researchers comparing delivery system or clinical interventions, as educators of students or healthcare professionals on the results of PCOR and their implications for practice, or as hospital leaders responsible for implementation of evidence‐based practices.[5]
CONCLUSION
The Affordable Care Act is a transformative piece of legislation, and our healthcare system is changing rapidly. Many of the ACA's provisions will change how care is delivered in the United States and will have a direct effect on practicing physicians, hospitals, and patients. Although CMS plays a major role in the implementation of the law, the government cannot be, and should not be, the primary force in transforming health care in this country. Through the provisions highlighted here as well as others, CMS can create a supportive environment, be a catalyst, and provide incentives for change; however, true transformation must occur on the front lines. For hospitalists, this means partnering with the hospital administration and other hospital personnel, local providers, and community organizations to drive systems‐based improvements that will ultimately achieve higher‐quality care at lower costs for all. It also calls for hospitalists to lead change in their local systems focused on better care, better health, and lower costs through improvement.
Disclosure
The views expressed in this manuscript represent the authors and not necessarily the policy or opinions of the Centers for Medicare and Medicaid Services.
- Department of Health and Human Services. Essential Health Benefits: HHS Informational Bulletin. Available at: http://www.healthcare.gov/news/factsheets/2011/12/essential‐health‐benefits12162011a.html. Accessed December 13, 2012.
- Department of Health and Human Services. Report to Congress: National Strategy for Quality Improvement in Healthcare. March 2011. Available at: http://www.healthcare.gov/law/resources/reports/quality03212011a.html. Accessed December 13, 2012.
- Centers for Medicare and Medicaid Services. FY 2013 IPPS Final Rule Home Page. August 2012. Available at: http://www.cms.gov/Medicare/Medicare‐Fee‐for‐Service‐Payment/AcuteInpatientPPS/FY‐2013‐IPPS‐Final‐Rule‐Home‐Page.html. Accessed December 13, 2012.
- Centers for Medicare and Medicaid Services. Physician Fee Schedule. November 2012. Available at: http://www.cms.gov/Medicare/Medicare‐Fee‐for‐Service‐Payment/PhysicianFeeSched/index.html. Accessed December 13, 2012.
- , . Comparative effectiveness research: implications for hospitalists. J Hosp Medicine. 2010;5(5):257–260.
At the Centers for Medicare and Medicaid Services (CMS), we are charged with implementing many of the major provisions of the Affordable Care Act (ACA). Major policies and programs aimed at transforming the way care is delivered and paid for, testing and scaling innovative delivery system reforms, and expanding the number of Americans with health insurance will now move forward. The healthcare system is moving from paying for volume to paying for value. Hospitals and clinicians will need to be able to manage and be accountable for populations of patients and improving health outcomes. In this article, we highlight 4 broad provisions of the ACA that are either already implemented or under development for implementation in 2014, and are anticipated to have widespread impact on our health system. The potential impacts of each provision on hospitals and hospitalists are outlined in Table 1.
| Affordable Care Act Provision | Example of Potential Impacts on Hospitals and Hospitalists |
|---|---|
| |
| Expansion of insurance coverage | Care for fewer uninsured patients/fewer unreimbursed services |
| Patients have improved access to services after discharge | |
| Shorter lengths of stay due to better access to outpatient services and care | |
| Delivery system transformation | Financial incentives aligned between inpatient and outpatient providers to better coordinate care |
| Payment is at risk if performance rates do not meet benchmarks and if costs are not lowered | |
| Consolidation of hospitals and health systems within local markets | |
| Value‐based purchasing | Medicare FFS reimbursement increased or decreased based on quality and cost measure results |
| Opportunity to align incentives between hospitals and hospitalists | |
| Patient‐centered outcomes research | Emerging research on delivery system interventions relevant to hospitalists, such as care transitions |
| Funding for PCOR available for hospitalist researchers interested in delivery systems and outcomes research | |
EXPANSION OF INSURANCE COVERAGE
The central and perhaps most anticipated provision of the ACA is the expansion of insurance to the currently uninsured through the creation of state‐based health insurance exchanges. The exchanges are a competitive marketplace for purchasing private insurance products by individuals and small and large businesses. The individual mandate that accompanies the exchange provision requires that individuals purchase insurance. For those who cannot afford it, the government provides a subsidy. Any health plan that wishes to participate in an exchange marketplace must include at minimum a package of essential health benefits in each of their insurance products, which include benefits such as ambulatory care services, maternal and newborn services, and prescription drugs.[1] Importantly, health plans are required to implement quality improvement strategies and publicly report quality data. The ACA also requires the Secretary of Health and Human Services (HHS) to develop and administer a quality rating system and an enrollee satisfaction survey system, the results of which will be available to exchange consumers. All of these requirements will promote the delivery of high‐quality healthcare to millions of previously uninsured Americans.
Implementation of the exchanges in combination with the expansion of Medicaid is expected to provide insurance to approximately 30 million people who currently lack coverage. Prior to the Supreme Court ruling in June of 2012, states were required to expand Medicaid eligibility to a minimum of 133% of the federal poverty level. This expansion is subsidized 100% by the federal government through 2016, dropping to 90% by 2020. The Supreme Court ruled that the federal government could not require states to expand their Medicaid rolls, although it is expected that most states will do so given the generous federal subsidy and the significant cost to states, hospitals, and society to provide healthcare to the uninsured.
TRANSFORMATION OF HEALTHCARE DELIVERY
In addition to the expansion of insurance coverage, the ACA initiates a transformation in the way that healthcare will be delivered through the testing and implementation of innovative payment and care delivery models. The ACA authorized the creation of the Center for Medicare and Medicaid Innovation (CMMI, or The Innovation Center) within CMS. Payment and care delivery demonstrations or pilots that demonstrate a high quality of care at lower costs can be scaled up nationally at the discretion of the Secretary, rather than requiring authorization by Congress. The Innovation Center has already launched initiatives that test a variety of new models of care, all of which incentivize care coordination, provision of team‐based care, and use of data and quality metrics to drive systems‐based improvement. These programs include pilots that bundle payments to hospitals, physician group practices, and post‐acute care facilities for episodes of care across settings. This allows providers to innovate and redesign systems to deliver equivalent or higher quality of care at lower costs. Another CMMI model, called the comprehensive primary care initiative, involves CMS partnering with private insurers to provide payment to primary care practices for the delivery of chronic disease management and coordinated care to their entire population of patients, regardless of payer. Of great relevance to all hospitalists, CMMI and CMS, in partnership with other HHS agencies, launched the Partnership for Patients program in 2011. To date, approximately 4000 hospitals have signed on to the Partnership in a collective effort to significantly reduce hospital readmissions and hospital‐acquired conditions. Hospitalists are leading the charge related to Partnership for Patients in many hospitals. The Innovation Center is concurrently launching and rapidly evaluating current pilots, while considering what other new pilots might be needed to further test models aimed at the delivery of better healthcare and health outcomes at lower costs.
Perhaps the delivery system initiative that has received the most attention is the implementation of the Medicare Shared Savings Program (MSSP), or Accountable Care Organizations (ACO). Under the MSSP, ACOs are groups of providers (which may include hospitals) and suppliers of services who work together to coordinate care for the patients they serve. Participating ACOs must achieve performance benchmarks while lowering costs to share in the cost savings with CMS. Although this program is focused on Medicare fee‐for‐service (FFS) beneficiaries, it is expected that all patients will benefit from the infrastructure redesign and care coordination that is required under this program. The pioneer ACOs are large integrated health systems or other providers that have higher levels of shared risk in addition to shared savings. Hospitals that are a part of a participating ACO have greater financial incentives to work with their primary care and other outpatient providers to reduce readmissions and other adverse events and achieve quality benchmarks. With the degree of savings as well as financial risk that is on the table, it is possible that over time, hospitals and health systems may consolidate to capture a larger share of the market. Such a consequence could have a parallel effect on job opportunities and financial incentives and risk for hospitalists in local markets.
VALUE‐BASED PURCHASING
Improvement in the quality of care delivered to all patients is another central purpose of the Affordable Care Act. The law requires that the Secretary develop a National Quality Strategy that must be updated annually; the first version of this strategy was published in April of 2011.[2] The strategy identifies 3 aims for the nation: better healthcare for individuals, better health for populations and communities, and lower costs for all. One of the levers that CMS uses to achieve these 3 aims is value‐based purchasing (VBP). VBP is a way to link the National Quality Strategy with Medicare FFS payments on a national scale by adjusting payments based on performance. VBP rewards providers and health systems that deliver better outcomes in health and healthcare at lower cost to the beneficiaries and communities they serve, rather than rewarding them for the volume of services they provide. The ACA authorizes implementation of the Hospital Value‐Based Purchasing (HVBP) program as well as the Physician Value Modifier (PVM). The HVBP program began in 2011, and currently includes process, outcome, and patient experience quality metrics as well as a total cost metric, which includes 30 days postdischarge for beneficiaries admitted to the hospital. Hospitals are rewarded on either their improvement from baseline or achievement of a benchmark, whichever is higher.[3] The PVM program adjusts providers' Medicare FFS payments up or down beginning in 2015, based on quality metrics reported on care provided in 2013. In the first year of the program, groups of 100 or more physicians are eligible for the program, and are given a choice on metrics to report and whether to elect for quality tiering and the potential for payment adjustment[4]; by payment year 2017, all physicians must participate. To participate, physicians must report on quality metrics that they choose through the Physician Quality Reporting System (PQRS) or elect to have their quality assessed based on administrative claim measures. Measures currently in the PQRS program may not always be relevant for hospitalists; CMS is working to define and include metrics that would be most meaningful to hospitalists' scope of practice and is seeking comment on whether to allow hospital‐based physicians to align with and accept hospital quality measures to count as their performance metrics.
PATIENT‐CENTERED OUTCOMES RESEARCH
Building on the down payment on Comparative Effectiveness Research (CER) funded under the American Recovery and Reinvestment Act of 2009, the ACA authorized the creation of the Patient‐Centered Outcomes Research Institute (PCORI) and allocated funding for CER over 10 years. Rebranded as Patient‐Centered Outcomes Research (PCOR), CER has the potential to improve quality and reduce costs by identifying what works for different populations of patients (eg, children, elderly, patients with multiple chronic conditions, racial and ethnic minorities) in varied settings (eg, ambulatory, hospital, nursing home) under real‐world conditions. The PCORI governance board was created in 2010, and as required by law, developed a national agenda for patient‐centered outcomes research, which includes assessment of prevention, diagnosis, and treatment options; improving healthcare systems; communicating and disseminating research; addressing healthcare disparities; and accelerating PCOR and methodological research. The amount of funding available for research and PCOR infrastructure will ramp up over the next several years, eventually reaching approximately $500 million annually, with increasing funding opportunities for comparative research questions related to clinical and delivery system interventions using pragmatic, randomized, controlled trials; implementation science; and other novel research methodologies. Hospitalists have many roles within this realm, whether as researchers comparing delivery system or clinical interventions, as educators of students or healthcare professionals on the results of PCOR and their implications for practice, or as hospital leaders responsible for implementation of evidence‐based practices.[5]
CONCLUSION
The Affordable Care Act is a transformative piece of legislation, and our healthcare system is changing rapidly. Many of the ACA's provisions will change how care is delivered in the United States and will have a direct effect on practicing physicians, hospitals, and patients. Although CMS plays a major role in the implementation of the law, the government cannot be, and should not be, the primary force in transforming health care in this country. Through the provisions highlighted here as well as others, CMS can create a supportive environment, be a catalyst, and provide incentives for change; however, true transformation must occur on the front lines. For hospitalists, this means partnering with the hospital administration and other hospital personnel, local providers, and community organizations to drive systems‐based improvements that will ultimately achieve higher‐quality care at lower costs for all. It also calls for hospitalists to lead change in their local systems focused on better care, better health, and lower costs through improvement.
Disclosure
The views expressed in this manuscript represent the authors and not necessarily the policy or opinions of the Centers for Medicare and Medicaid Services.
- Department of Health and Human Services. Essential Health Benefits: HHS Informational Bulletin. Available at: http://www.healthcare.gov/news/factsheets/2011/12/essential‐health‐benefits12162011a.html. Accessed December 13, 2012.
- Department of Health and Human Services. Report to Congress: National Strategy for Quality Improvement in Healthcare. March 2011. Available at: http://www.healthcare.gov/law/resources/reports/quality03212011a.html. Accessed December 13, 2012.
- Centers for Medicare and Medicaid Services. FY 2013 IPPS Final Rule Home Page. August 2012. Available at: http://www.cms.gov/Medicare/Medicare‐Fee‐for‐Service‐Payment/AcuteInpatientPPS/FY‐2013‐IPPS‐Final‐Rule‐Home‐Page.html. Accessed December 13, 2012.
- Centers for Medicare and Medicaid Services. Physician Fee Schedule. November 2012. Available at: http://www.cms.gov/Medicare/Medicare‐Fee‐for‐Service‐Payment/PhysicianFeeSched/index.html. Accessed December 13, 2012.
- , . Comparative effectiveness research: implications for hospitalists. J Hosp Medicine. 2010;5(5):257–260.
Hospitalist Utilization and Performance
The past several years have seen a dramatic increase in the percentage of patients cared for by hospitalists, yet an emerging body of literature examining the association between care given by hospitalists and performance on a number of process measures has shown mixed results. Hospitalists do not appear to provide higher quality of care for pneumonia,1, 2 while results in heart failure are mixed.35 Each of these studies was conducted at a single site, and examined patient‐level effects. More recently, Vasilevskis et al6 assessed the association between the intensity of hospitalist use (measured as the percentage of patients admitted by hospitalists) and performance on process measures. In a cohort of 208 California hospitals, they found a significant improvement in performance on process measures in patients with acute myocardial infarction, heart failure, and pneumonia with increasing percentages of patients admitted by hospitalists.6
To date, no study has examined the association between the use of hospitalists and the publicly reported 30‐day mortality and readmission measures. Specifically, the Centers for Medicare and Medicaid Services (CMS) have developed and now publicly report risk‐standardized 30‐day mortality (RSMR) and readmission rates (RSRR) for Medicare patients hospitalized for 3 common and costly conditionsacute myocardial infarction (AMI), heart failure (HF), and pneumonia.7 Performance on these hospital‐based quality measures varies widely, and vary by hospital volume, ownership status, teaching status, and nurse staffing levels.813 However, even accounting for these characteristics leaves much of the variation in outcomes unexplained. We hypothesized that the presence of hospitalists within a hospital would be associated with higher performance on 30‐day mortality and 30‐day readmission measures for AMI, HF, and pneumonia. We further hypothesized that for hospitals using hospitalists, there would be a positive correlation between increasing percentage of patients admitted by hospitalists and performance on outcome measures. To test these hypotheses, we conducted a national survey of hospitalist leaders, linking data from survey responses to data on publicly reported outcome measures for AMI, HF, and pneumonia.
MATERIALS AND METHODS
Study Sites
Of the 4289 hospitals in operation in 2008, 1945 had 25 or more AMI discharges. We identified hospitals using American Hospital Association (AHA) data, calling hospitals up to 6 times each until we reached our target sample size of 600. Using this methodology, we contacted 1558 hospitals of a possible 1920 with AHA data; of the 1558 called, 598 provided survey results.
Survey Data
Our survey was adapted from the survey developed by Vasilevskis et al.6 The entire survey can be found in the Appendix (see Supporting Information in the online version of this article). Our key questions were: 1) Does your hospital have at least 1 hospitalist program or group? 2) Approximately what percentage of all medical patients in your hospital are admitted by hospitalists? The latter question was intended as an approximation of the intensity of hospitalist use, and has been used in prior studies.6, 14 A more direct measure was not feasible given the complexity of obtaining admission data for such a large and diverse set of hospitals. Respondents were also asked about hospitalist care of AMI, HF, and pneumonia patients. Given the low likelihood of precise estimation of hospitalist participation in care for specific conditions, the response choices were divided into percentage quartiles: 025, 2650, 5175, and 76100. Finally, participants were asked a number of questions regarding hospitalist organizational and clinical characteristics.
Survey Process
We obtained data regarding presence or absence of hospitalists and characteristics of the hospitalist services via phone‐ and fax‐administered survey (see Supporting Information, Appendix, in the online version of this article). Telephone and faxed surveys were administered between February 2010 and January 2011. Hospital telephone numbers were obtained from the 2008 AHA survey database and from a review of each hospital's website. Up to 6 attempts were made to obtain a completed survey from nonrespondents unless participation was specifically refused. Potential respondents were contacted in the following order: hospital medicine department leaders, hospital medicine clinical managers, vice president for medical affairs, chief medical officers, and other hospital executives with knowledge of the hospital medicine services. All respondents agreed with a question asking whether they had direct working knowledge of their hospital medicine services; contacts who said they did not have working knowledge of their hospital medicine services were asked to refer our surveyor to the appropriate person at their site. Absence of a hospitalist program was confirmed by contacting the Medical Staff Office.
Hospital Organizational and Patient‐Mix Characteristics
Hospital‐level organizational characteristics (eg, bed size, teaching status) and patient‐mix characteristics (eg, Medicare and Medicaid inpatient days) were obtained from the 2008 AHA survey database.
Outcome Performance Measures
The 30‐day risk‐standardized mortality and readmission rates (RSMR and RSRR) for 2008 for AMI, HF, and pneumonia were calculated for all admissions for people age 65 and over with traditional fee‐for‐service Medicare. Beneficiaries had to be enrolled for 12 months prior to their hospitalization for any of the 3 conditions, and had to have complete claims data available for that 12‐month period.7 These 6 outcome measures were constructed using hierarchical generalized linear models.1520 Using the RSMR for AMI as an example, for each hospital, the measure is estimated by dividing the predicted number of deaths within 30 days of admission for AMI by the expected number of deaths within 30 days of admission for AMI. This ratio is then divided by the national unadjusted 30‐day mortality rate for AMI, which is obtained using data on deaths from the Medicare beneficiary denominator file. Each measure is adjusted for patient characteristics such as age, gender, and comorbidities. All 6 measures are endorsed by the National Quality Forum (NQF) and are reported publicly by CMS on the Hospital Compare web site.
Statistical Analysis
Comparison of hospital‐ and patient‐level characteristics between hospitals with and without hospitalists was performed using chi‐square tests and Student t tests.
The primary outcome variables are the RSMRs and RSRRs for AMI, HF, and pneumonia. Multivariable linear regression models were used to assess the relationship between hospitals with at least 1 hospitalist group and each dependent variable. Models were adjusted for variables previously reported to be associated with quality of care. Hospital‐level characteristics included core‐based statistical area, teaching status, number of beds, region, safety‐net status, nursing staff ratio (number of registered nurse FTEs/number of hospital FTEs), and presence or absence of cardiac catheterization and coronary bypass capability. Patient‐level characteristics included Medicare and Medicaid inpatient days as a percentage of total inpatient days and percentage of admissions by race (black vs non‐black). The presence of hospitalists was correlated with each of the hospital and patient‐level characteristics. Further analyses of the subset of hospitals that use hospitalists included construction of multivariable linear regression models to assess the relationship between the percentage of patients admitted by hospitalists and the dependent variables. Models were adjusted for the same patient‐ and hospital‐level characteristics.
The institutional review boards at Yale University and University of California, San Francisco approved the study. All analyses were performed using Statistical Analysis Software (SAS) version 9.1 (SAS Institute, Inc, Cary, NC).
RESULTS
Characteristics of Participating Hospitals
Telephone, fax, and e‐mail surveys were attempted with 1558 hospitals; we received 598 completed surveys for a response rate of 40%. There was no difference between responders and nonresponders on any of the 6 outcome variables, the number of Medicare or Medicaid inpatient days, and the percentage of admissions by race. Responders and nonresponders were also similar in size, ownership, safety‐net and teaching status, nursing staff ratio, presence of cardiac catheterization and coronary bypass capability, and core‐based statistical area. They differed only on region of the country, where hospitals in the northwest Central and Pacific regions of the country had larger overall proportions of respondents. All hospitals provided information about the presence or absence of hospitalist programs. The majority of respondents were hospitalist clinical or administrative managers (n = 220) followed by hospitalist leaders (n = 106), other executives (n = 58), vice presidents for medical affairs (n = 39), and chief medical officers (n = 15). Each respondent indicated a working knowledge of their site's hospitalist utilization and practice characteristics. Absence of hospitalist utilization was confirmed by contact with the Medical Staff Office.
Comparisons of Sites With Hospitalists and Those Without Hospitalists
Hospitals with and without hospitalists differed by a number of organizational characteristics (Table 1). Sites with hospitalists were more likely to be larger, nonprofit teaching hospitals, located in metropolitan regions, and have cardiac surgical services. There was no difference in the hospitals' safety‐net status or RN staffing ratio. Hospitals with hospitalists admitted lower percentages of black patients.
| Hospitalist Program | No Hospitalist Program | ||
|---|---|---|---|
| N = 429 | N = 169 | ||
| N (%) | N (%) | P Value | |
| |||
| Core‐based statistical area | <0.0001 | ||
| Division | 94 (21.9%) | 53 (31.4%) | |
| Metro | 275 (64.1%) | 72 (42.6%) | |
| Micro | 52 (12.1%) | 38 (22.5%) | |
| Rural | 8 (1.9%) | 6 (3.6%) | |
| Owner | 0.0003 | ||
| Public | 47 (11.0%) | 20 (11.8%) | |
| Nonprofit | 333 (77.6%) | 108 (63.9%) | |
| Private | 49 (11.4%) | 41 (24.3%) | |
| Teaching status | <0.0001 | ||
| COTH | 54 (12.6%) | 7 (4.1%) | |
| Teaching | 110 (25.6%) | 26 (15.4%) | |
| Other | 265 (61.8%) | 136 (80.5%) | |
| Cardiac type | 0.0003 | ||
| CABG | 286 (66.7%) | 86 (50.9%) | |
| CATH | 79 (18.4%) | 36 (21.3%) | |
| Other | 64 (14.9%) | 47 (27.8%) | |
| Region | 0.007 | ||
| New England | 35 (8.2%) | 3 (1.8%) | |
| Middle Atlantic | 60 (14.0%) | 29 (17.2%) | |
| South Atlantic | 78 (18.2%) | 23 (13.6%) | |
| NE Central | 60 (14.0%) | 35 (20.7%) | |
| SE Central | 31 (7.2%) | 10 (5.9%) | |
| NW Central | 38 (8.9%) | 23 (13.6%) | |
| SW Central | 41 (9.6%) | 21 (12.4%) | |
| Mountain | 22 (5.1%) | 3 (1.8%) | |
| Pacific | 64 (14.9%) | 22 (13.0%) | |
| Safety‐net | 0.53 | ||
| Yes | 72 (16.8%) | 32 (18.9%) | |
| No | 357 (83.2%) | 137 (81.1%) | |
| Mean (SD) | Mean (SD) | P value | |
| RN staffing ratio (n = 455) | 27.3 (17.0) | 26.1 (7.6) | 0.28 |
| Total beds | 315.0 (216.6) | 214.8 (136.0) | <0.0001 |
| % Medicare inpatient days | 47.2 (42) | 49.7 (41) | 0.19 |
| % Medicaid inpatient days | 18.5 (28) | 21.4 (46) | 0.16 |
| % Black | 7.6 (9.6) | 10.6 (17.4) | 0.03 |
Characteristics of Hospitalist Programs and Responsibilities
Of the 429 sites reporting use of hospitalists, the median percentage of patients admitted by hospitalists was 60%, with an interquartile range (IQR) of 35% to 80%. The median number of full‐time equivalent hospitalists per hospital was 8 with an IQR of 5 to 14. The IQR reflects the middle 50% of the distribution of responses, and is not affected by outliers or extreme values. Additional characteristics of hospitalist programs can be found in Table 2. The estimated percentage of patients with AMI, HF, and pneumonia cared for by hospitalists varied considerably, with fewer patients with AMI and more patients with pneumonia under hospitalist care. Overall, a majority of hospitalist groups provided the following services: care of critical care patients, emergency department admission screening, observation unit coverage, coverage for cardiac arrests and rapid response teams, quality improvement or utilization review activities, development of hospital practice guidelines, and participation in implementation of major hospital system projects (such as implementation of an electronic health record system).
| N (%) | |
|---|---|
| |
| Date program established | |
| 19871994 | 9 (2.2%) |
| 19952002 | 130 (32.1%) |
| 20032011 | 266 (65.7%) |
| Missing date | 24 |
| No. of hospitalist FTEs | |
| Median (IQR) | 8 (5, 14) |
| Percent of medical patients admitted by hospitalists | |
| Median (IQR) | 60% (35, 80) |
| No. of hospitalists groups | |
| 1 | 333 (77.6%) |
| 2 | 54 (12.6%) |
| 3 | 36 (8.4%) |
| Don't know | 6 (1.4%) |
| Employment of hospitalists (not mutually exclusive) | |
| Hospital system | 98 (22.8%) |
| Hospital | 185 (43.1%) |
| Local physician practice group | 62 (14.5%) |
| Hospitalist physician practice group (local) | 83 (19.3%) |
| Hospitalist physician practice group (national/regional) | 36 (8.4%) |
| Other/unknown | 36 (8.4%) |
| Any 24‐hr in‐house coverage by hospitalists | |
| Yes | 329 (76.7%) |
| No | 98 (22.8%) |
| 3 | 1 (0.2%) |
| Unknown | 1 (0.2%) |
| No. of hospitalist international medical graduates | |
| Median (IQR) | 3 (1, 6) |
| No. of hospitalists that are <1 yr out of residency | |
| Median (IQR) | 1 (0, 2) |
| Percent of patients with AMI cared for by hospitalists | |
| 0%25% | 148 (34.5%) |
| 26%50% | 67 (15.6%) |
| 51%75% | 50 (11.7%) |
| 76%100% | 54 (12.6%) |
| Don't know | 110 (25.6%) |
| Percent of patients with heart failure cared for by hospitalists | |
| 0%25% | 79 (18.4%) |
| 26%50% | 78 (18.2%) |
| 51%75% | 75 (17.5%) |
| 76%100% | 84 (19.6%) |
| Don't know | 113 (26.3%) |
| Percent of patients with pneumonia cared for by hospitalists | |
| 0%25% | 47 (11.0%) |
| 26%50% | 61 (14.3%) |
| 51%75% | 74 (17.3%) |
| 76%100% | 141 (32.9%) |
| Don't know | 105 (24.5%) |
| Hospitalist provision of services | |
| Care of critical care patients | |
| Hospitalists provide service | 346 (80.7%) |
| Hospitalists do not provide service | 80 (18.7%) |
| Don't know | 3 (0.7%) |
| Emergency department admission screening | |
| Hospitalists provide service | 281 (65.5%) |
| Hospitalists do not provide service | 143 (33.3%) |
| Don't know | 5 (1.2%) |
| Observation unit coverage | |
| Hospitalists provide service | 359 (83.7%) |
| Hospitalists do not provide service | 64 (14.9%) |
| Don't know | 6 (1.4%) |
| Emergency department coverage | |
| Hospitalists provide service | 145 (33.8%) |
| Hospitalists do not provide service | 280 (65.3%) |
| Don't know | 4 (0.9%) |
| Coverage for cardiac arrests | |
| Hospitalists provide service | 283 (66.0%) |
| Hospitalists do not provide service | 135 (31.5%) |
| Don't know | 11 (2.6%) |
| Rapid response team coverage | |
| Hospitalists provide service | 240 (55.9%) |
| Hospitalists do not provide service | 168 (39.2%) |
| Don't know | 21 (4.9%) |
| Quality improvement or utilization review | |
| Hospitalists provide service | 376 (87.7%) |
| Hospitalists do not provide service | 37 (8.6%) |
| Don't know | 16 (3.7%) |
| Hospital practice guideline development | |
| Hospitalists provide service | 339 (79.0%) |
| Hospitalists do not provide service | 55 (12.8%) |
| Don't know | 35 (8.2%) |
| Implementation of major hospital system projects | |
| Hospitalists provide service | 309 (72.0%) |
| Hospitalists do not provide service | 96 (22.4%) |
| Don't know | 24 (5.6%) |
Relationship Between Hospitalist Utilization and Outcomes
Tables 3 and 4 show the comparisons between hospitals with and without hospitalists on each of the 6 outcome measures. In the bivariate analysis (Table 3), there was no statistically significant difference between groups on any of the outcome measures with the exception of the risk‐stratified readmission rate for heart failure. Sites with hospitalists had a lower RSRR for HF than sites without hospitalists (24.7% vs 25.4%, P < 0.0001). These results were similar in the multivariable models as seen in Table 4, in which the beta estimate (slope) was not significantly different for hospitals utilizing hospitalists compared to those that did not, on all measures except the RSRR for HF. For the subset of hospitals that used hospitalists, there was no statistically significant change in any of the 6 outcome measures, with increasing percentage of patients admitted by hospitalists. Table 5 demonstrates that for each RSMR and RSRR, the slope did not consistently increase or decrease with incrementally higher percentages of patients admitted by hospitalists, and the confidence intervals for all estimates crossed zero.
| Hospitalist Program | No Hospitalist Program | ||
|---|---|---|---|
| N = 429 | N = 169 | ||
| Outcome Measure | Mean % (SD) | Mean (SD) | P Value |
| |||
| MI RSMR | 16.0 (1.6) | 16.1 (1.5) | 0.56 |
| MI RSRR | 19.9 (0.88) | 20.0 (0.86) | 0.16 |
| HF RSMR | 11.3 (1.4) | 11.3 (1.4) | 0.77 |
| HF RSRR | 24.7 (1.6) | 25.4 (1.8) | <0.0001 |
| Pneumonia RSMR | 11.7 (1.7) | 12.0 (1.7) | 0.08 |
| Pneumonia RSRR | 18.2 (1.2) | 18.3 (1.1) | 0.28 |
| Adjusted beta estimate (95% CI) | |
|---|---|
| |
| MI RSMR | |
| Hospitalist | 0.001 (0.002, 004) |
| MI RSRR | |
| Hospitalist | 0.001 (0.002, 0.001) |
| HF RSMR | |
| Hospitalist | 0.0004 (0.002, 0.003) |
| HF RSRR | |
| Hospitalist | 0.006 (0.009, 0.003) |
| Pneumonia RSMR | |
| Hospitalist | 0.002 (0.005, 0.001) |
| Pneumonia RSRR | |
| Hospitalist | 0.00001 (0.002, 0.002) |
| Adjusted Beta Estimate (95% CI) | |
|---|---|
| |
| MI RSMR | |
| Percent admit | |
| 0%30% | 0.003 (0.007, 0.002) |
| 32%48% | 0.001 (0.005, 0.006) |
| 50%66% | Ref |
| 70%80% | 0.004 (0.001, 0.009) |
| 85% | 0.004 (0.009, 0.001) |
| MI RSRR | |
| Percent admit | |
| 0%30% | 0.001 (0.002, 0.004) |
| 32%48% | 0.001 (0.004, 0.004) |
| 50%66% | Ref |
| 70%80% | 0.001 (0.002, 0.004) |
| 85% | 0.001 (0.002, 0.004) |
| HF RSMR | |
| Percent admit | |
| 0%30% | 0.001 (0.005, 0.003) |
| 32%48% | 0.002 (0.007, 0.003) |
| 50%66% | Ref |
| 70%80% | 0.002 (0.006, 0.002) |
| 85% | 0.001 (0.004, 0.005) |
| HF RSRR | |
| Percent admit | |
| 0%30% | 0.002 (0.004, 0.007) |
| 32%48% | 0.0003 (0.005, 0.006) |
| 50%66% | Ref |
| 70%80% | 0.001 (0.005, 0.004) |
| 85% | 0.002 (0.007, 0.003) |
| Pneumonia RSMR | |
| Percent admit | |
| 0%30% | 0.001 (0.004, 0.006) |
| 32%48% | 0.00001 (0.006, 0.006) |
| 50%66% | Ref |
| 70%80% | 0.001 (0.004, 0.006) |
| 85% | 0.001 (0.006, 0.005) |
| Pneumonia RSRR | |
| Percent admit | |
| 0%30% | 0.0002 (0.004, 0.003) |
| 32%48% | 0.004 (0.0003, 0.008) |
| 50%66% | Ref |
| 70%80% | 0.001 (0.003, 0.004) |
| 85% | 0.002 (0.002, 0.006) |
DISCUSSION
In this national survey of hospitals, we did not find a significant association between the use of hospitalists and hospitals' performance on 30‐day mortality or readmissions measures for AMI, HF, or pneumonia. While there was a statistically lower 30‐day risk‐standardized readmission rate measure for the heart failure measure among hospitals that use hospitalists, the effect size was small. The survey response rate of 40% is comparable to other surveys of physicians and other healthcare personnel, however, there were no significant differences between responders and nonresponders, so the potential for response bias, while present, is small.
Contrary to the findings of a recent study,21 we did not find a higher readmission rate for any of the 3 conditions in hospitals with hospitalist programs. One advantage of our study is the use of more robust risk‐adjustment methods. Our study used NQF‐endorsed risk‐standardized measures of readmission, which capture readmissions to any hospital for common, high priority conditions where the impact of care coordination and discontinuity of care are paramount. The models use administrative claims data, but have been validated by medical record data. Another advantage is that our study focused on a time period when hospital readmissions were a standard quality benchmark and increasing priority for hospitals, hospitalists, and community‐based care delivery systems. While our study is not able to discern whether patients had primary care physicians or the reason for admission to a hospitalist's care, our data do suggest that hospitalists continue to care for a large percentage of hospitalized patients. Moreover, increasing the proportion of patients being admitted to hospitalists did not affect the risk for readmission, providing perhaps reassuring evidence (or lack of proof) for a direct association between use of hospitalist systems and higher risk for readmission.
While hospitals with hospitalists clearly did not have better mortality or readmission rates, an alternate viewpoint might hold that, despite concerns that hospitalists negatively impact care continuity, our data do not demonstrate an association between readmission rates and use of hospitalist services. It is possible that hospitals that have hospitalists may have more ability to invest in hospital‐based systems of care,22 an association which may incorporate any hospitalist effect, but our results were robust even after testing whether adjustment for hospital factors (such as profit status, size) affected our results.
It is also possible that secular trends in hospitals or hospitalist systems affected our results. A handful of single‐site studies carried out soon after the hospitalist model's earliest descriptions found a reduction in mortality and readmission rates with the implementation of a hospitalist program.2325 Alternatively, it may be that there has been a dilution of the effect of hospitalists as often occurs when any new innovation is spread from early adopter sites to routine practice. Consistent with other multicenter studies from recent eras,21, 26 our article's findings do not demonstrate an association between hospitalists and improved outcomes. Unlike other multicenter studies, we had access to disease‐specific risk‐adjustment methodologies, which may partially account for referral biases related to patient‐specific measures of acute or chronic illness severity.
Changes in the hospitalist effect over time have a number of explanations, some of which are relevant to our study. Recent evidence suggests that complex organizational characteristics, such as organizational values and goals, may contribute to performance on 30‐day mortality for AMI rather than specific processes and protocols27; intense focus on AMI as a quality improvement target is emblematic of a number of national initiatives that may have affected our results. Interestingly, hospitalist systems have changed over time as well. Early in the hospitalist movement, hospitalist systems were implemented largely at the behest of hospitals trying to reduce costs. In recent years, however, hospitalist systems are at least as frequently being implemented because outpatient‐based physicians or surgeons request hospitalists; hospitalists have been focused on care of uncoveredpatients, since the model's earliest description. In addition, some hospitals invest in hospitalist programs based on perceived ability of hospitalists to improve quality and achieve better patient outcomes in an era of payment increasingly being linked to quality of care metrics.
Our study has several limitations, six of which are noted here. First, while the hospitalist model has been widely embraced in the adult medicine field, in the absence of board certification, there is no gold standard definition of a hospitalist. It is therefore possible that some respondents may have represented groups that were identified incorrectly as hospitalists. Second, the data for the primary independent variable of interest was based upon self‐report and, therefore, subject to recall bias and potential misclassification of results. Respondents were not aware of our hypothesis, so the bias should not have been in one particular direction. Third, the data for the outcome variables are from 2008. They may, therefore, not reflect organizational enhancements related to use of hospitalists that are in process, and take years to yield downstream improvements on performance metrics. In addition, of the 429 hospitals that have hospitalist programs, 46 programs were initiated after 2008. While national performance on the 6 outcome variables has been relatively static over time,7 any significant change in hospital performance on these metrics since 2008 could suggest an overestimation or underestimation of the effect of hospitalist programs on patient outcomes. Fourth, we were not able to adjust for additional hospital or health system level characteristics that may be associated with hospitalist use or patient outcomes. Fifth, our regression models had significant collinearity, in that the presence of hospitalists was correlated with each of the covariates. However, this finding would indicate that our estimates may be overly conservative and could have contributed to our nonsignificant findings. Finally, outcomes for 2 of the 3 clinical conditions measured are ones for which hospitalists may less frequently provide care: acute myocardial infarction and heart failure. Outcome measures more relevant for hospitalists may be all‐condition, all‐cause, 30‐day mortality and readmission.
This work adds to the growing body of literature examining the impact of hospitalists on quality of care. To our knowledge, it is the first study to assess the association between hospitalist use and performance on outcome metrics at a national level. While our findings suggest that use of hospitalists alone may not lead to improved performance on outcome measures, a parallel body of research is emerging implicating broader system and organizational factors as key to high performance on outcome measures. It is likely that multiple factors contribute to performance on outcome measures, including type and mix of hospital personnel, patient care processes and workflow, and system level attributes. Comparative effectiveness and implementation research that assess the contextual factors and interventions that lead to successful system improvement and better performance is increasingly needed. It is unlikely that a single factor, such as hospitalist use, will significantly impact 30‐day mortality or readmission and, therefore, multifactorial interventions are likely required. In addition, hospitalist use is a complex intervention as the structure, processes, training, experience, role in the hospital system, and other factors (including quality of hospitalists or the hospitalist program) vary across programs. Rather than focusing on the volume of care delivered by hospitalists, hospitals will likely need to support hospital medicine programs that have the time and expertise to devote to improving the quality and value of care delivered across the hospital system. This study highlights that interventions leading to improvement on core outcome measures are more complex than simply having a hospital medicine program.
Acknowledgements
The authors acknowledge Judy Maselli, MPH, Division of General Internal Medicine, Department of Medicine, University of California, San Francisco, for her assistance with statistical analyses and preparation of tables.
Disclosures: Work on this project was supported by the Robert Wood Johnson Clinical Scholars Program (K.G.); California Healthcare Foundation grant 15763 (A.D.A.); and a grant from the National Heart, Lung, and Blood Institute (NHLBI), study 1U01HL105270‐02 (H.M.K.). Dr Krumholz is the chair of the Cardiac Scientific Advisory Board for United Health and has a research grant with Medtronic through Yale University; Dr Auerbach has a grant through the National Heart, Lung, and Blood Institute (NHLBI). The authors have no other disclosures to report.
- ,,,.Comparison of hospitalists and nonhospitalists regarding core measures of pneumonia care.Am J Manag Care.2007;13:129–132.
- ,,,.Comparison of processes and outcomes of pneumonia care between hospitalists and community‐based primary care physicians.Mayo Clin Proc.2002;77(10):1053–1058.
- ,,,,.Quality of care for patients hospitalized with heart failure: assessing the impact of hospitalists.Arch Intern Med.2002;162(11):1251–1256.
- ,,, et al.Quality of care for decompensated heart failure: comparable performance between academic hospitalists and non‐hospitalists.J Gen Intern Med.2008;23(9):1399–1406.
- ,,.Comparison of practice patterns of hospitalists and community physicians in the care of patients with congestive heart failure.J Hosp Med.2008;3(1):35–41.
- ,,,,.Cross‐sectional analysis of hospitalist prevalence and quality of care in California.J Hosp Med.2010;5(4):200–207.
- Hospital Compare. Department of Health and Human Services. Available at: http://www.hospitalcompare.hhs.gov. Accessed September 3,2011.
- ,.Teaching hospitals and quality of care: a review of the literature.Milbank Q.2002;80(3):569–593.
- ,,, et al.A systematic review and meta‐analysis of studies comparing mortality rates of private for‐profit and private not‐for‐profit hospitals.Can Med Assoc J.2002;166(11):1399–1406.
- ,,,,.Patient and hospital characteristics associated with recommended processes of care for elderly patients hospitalized with pneumonia: results from the Medicare Quality Indicator System Pneumonia Module.Arch Intern Med.2002;162(7):827–833.
- ,,,.Care in U.S. hospitals—The Hospital Quality Alliance Program.N Engl J Med.2005;353(3):265–274.
- ,,, et al.Hospital characteristics and quality of care.JAMA.1992;268(13):1709–1714.
- ,,,,.Nurse‐staffing levels and the quality of care in hospitals.N Engl J Med.2002;346(22):1715–1722.
- ,,,.Health care market trends and the evolution of hospitalist use and roles.J Gen Intern Med.2005;20:101–107.
- ,,, et al.An administrative claims model suitable for profiling hospital performance based on 30‐day mortality rates among patients with an acute myocardial infarction.Circulation.2006;113:1683–1692.
- ,,, et al.An administrative claims measure suitable for profiling hospital performance based on 30‐day all‐cause readmission rates among patients with acute myocardial infarction.Circulation.2011;4:243–252.
- ,,, et al.An administrative claims measure suitable for profiling hospital performance on the basis of 30‐day all‐cause readmission rates among patients with heart failure.Circ Cardiovasc Qual Outcomes.2008;1:29–37.
- ,,, et al.An administrative claims model suitable for profiling hospital performance based on 30‐day mortality rates among patients with heart failure.Circulation.2006;113:1693–1701.
- ,,, et al.An administrative claims model for profiling hospital 30‐day mortality rates for pneumonia patients.PLoS ONE.2011;6(4):e17401.
- ,,, et al.Development, validation and results of a measure of 30‐day readmission following hospitalization for pneumonia.J Hosp Med.2011;6:142–150.
- ,.Association of hospitalist care with medical utilization after discharge: evidence of cost shift from a cohort study.Ann Intern Med.2011;155:152–159.
- ,,,.California hospital leaders' views of hospitalists: meeting needs of the present and future.J Hosp Med.2009;4:528–534.
- ,,, et al.Effects of physician experience on costs and outcomes on an academic general medicine service: results of a trial of hospitalists.Ann Intern Med.2002;137:866–874.
- ,,,,,.Implementation of a voluntary hospitalist service at a community teaching hospital: improved clinical efficiency and patients outcomes.Ann Intern Med.2002;137:859–865.
- ,,,.A comparative study of unscheduled hospital readmissions in a resident‐staffed teaching service and a hospitalist‐based service.South Med J.2009;102:145–149.
- ,,,,,.Outcomes of care by hospitalists, general internists, and family physicians.N Engl J Med.2007;357:2589–2600.
- ,,, et al.What distinguishes top‐performing hospitals in acute myocardial infarction mortality rates?Ann Intern Med.2011;154:384–390.
The past several years have seen a dramatic increase in the percentage of patients cared for by hospitalists, yet an emerging body of literature examining the association between care given by hospitalists and performance on a number of process measures has shown mixed results. Hospitalists do not appear to provide higher quality of care for pneumonia,1, 2 while results in heart failure are mixed.35 Each of these studies was conducted at a single site, and examined patient‐level effects. More recently, Vasilevskis et al6 assessed the association between the intensity of hospitalist use (measured as the percentage of patients admitted by hospitalists) and performance on process measures. In a cohort of 208 California hospitals, they found a significant improvement in performance on process measures in patients with acute myocardial infarction, heart failure, and pneumonia with increasing percentages of patients admitted by hospitalists.6
To date, no study has examined the association between the use of hospitalists and the publicly reported 30‐day mortality and readmission measures. Specifically, the Centers for Medicare and Medicaid Services (CMS) have developed and now publicly report risk‐standardized 30‐day mortality (RSMR) and readmission rates (RSRR) for Medicare patients hospitalized for 3 common and costly conditionsacute myocardial infarction (AMI), heart failure (HF), and pneumonia.7 Performance on these hospital‐based quality measures varies widely, and vary by hospital volume, ownership status, teaching status, and nurse staffing levels.813 However, even accounting for these characteristics leaves much of the variation in outcomes unexplained. We hypothesized that the presence of hospitalists within a hospital would be associated with higher performance on 30‐day mortality and 30‐day readmission measures for AMI, HF, and pneumonia. We further hypothesized that for hospitals using hospitalists, there would be a positive correlation between increasing percentage of patients admitted by hospitalists and performance on outcome measures. To test these hypotheses, we conducted a national survey of hospitalist leaders, linking data from survey responses to data on publicly reported outcome measures for AMI, HF, and pneumonia.
MATERIALS AND METHODS
Study Sites
Of the 4289 hospitals in operation in 2008, 1945 had 25 or more AMI discharges. We identified hospitals using American Hospital Association (AHA) data, calling hospitals up to 6 times each until we reached our target sample size of 600. Using this methodology, we contacted 1558 hospitals of a possible 1920 with AHA data; of the 1558 called, 598 provided survey results.
Survey Data
Our survey was adapted from the survey developed by Vasilevskis et al.6 The entire survey can be found in the Appendix (see Supporting Information in the online version of this article). Our key questions were: 1) Does your hospital have at least 1 hospitalist program or group? 2) Approximately what percentage of all medical patients in your hospital are admitted by hospitalists? The latter question was intended as an approximation of the intensity of hospitalist use, and has been used in prior studies.6, 14 A more direct measure was not feasible given the complexity of obtaining admission data for such a large and diverse set of hospitals. Respondents were also asked about hospitalist care of AMI, HF, and pneumonia patients. Given the low likelihood of precise estimation of hospitalist participation in care for specific conditions, the response choices were divided into percentage quartiles: 025, 2650, 5175, and 76100. Finally, participants were asked a number of questions regarding hospitalist organizational and clinical characteristics.
Survey Process
We obtained data regarding presence or absence of hospitalists and characteristics of the hospitalist services via phone‐ and fax‐administered survey (see Supporting Information, Appendix, in the online version of this article). Telephone and faxed surveys were administered between February 2010 and January 2011. Hospital telephone numbers were obtained from the 2008 AHA survey database and from a review of each hospital's website. Up to 6 attempts were made to obtain a completed survey from nonrespondents unless participation was specifically refused. Potential respondents were contacted in the following order: hospital medicine department leaders, hospital medicine clinical managers, vice president for medical affairs, chief medical officers, and other hospital executives with knowledge of the hospital medicine services. All respondents agreed with a question asking whether they had direct working knowledge of their hospital medicine services; contacts who said they did not have working knowledge of their hospital medicine services were asked to refer our surveyor to the appropriate person at their site. Absence of a hospitalist program was confirmed by contacting the Medical Staff Office.
Hospital Organizational and Patient‐Mix Characteristics
Hospital‐level organizational characteristics (eg, bed size, teaching status) and patient‐mix characteristics (eg, Medicare and Medicaid inpatient days) were obtained from the 2008 AHA survey database.
Outcome Performance Measures
The 30‐day risk‐standardized mortality and readmission rates (RSMR and RSRR) for 2008 for AMI, HF, and pneumonia were calculated for all admissions for people age 65 and over with traditional fee‐for‐service Medicare. Beneficiaries had to be enrolled for 12 months prior to their hospitalization for any of the 3 conditions, and had to have complete claims data available for that 12‐month period.7 These 6 outcome measures were constructed using hierarchical generalized linear models.1520 Using the RSMR for AMI as an example, for each hospital, the measure is estimated by dividing the predicted number of deaths within 30 days of admission for AMI by the expected number of deaths within 30 days of admission for AMI. This ratio is then divided by the national unadjusted 30‐day mortality rate for AMI, which is obtained using data on deaths from the Medicare beneficiary denominator file. Each measure is adjusted for patient characteristics such as age, gender, and comorbidities. All 6 measures are endorsed by the National Quality Forum (NQF) and are reported publicly by CMS on the Hospital Compare web site.
Statistical Analysis
Comparison of hospital‐ and patient‐level characteristics between hospitals with and without hospitalists was performed using chi‐square tests and Student t tests.
The primary outcome variables are the RSMRs and RSRRs for AMI, HF, and pneumonia. Multivariable linear regression models were used to assess the relationship between hospitals with at least 1 hospitalist group and each dependent variable. Models were adjusted for variables previously reported to be associated with quality of care. Hospital‐level characteristics included core‐based statistical area, teaching status, number of beds, region, safety‐net status, nursing staff ratio (number of registered nurse FTEs/number of hospital FTEs), and presence or absence of cardiac catheterization and coronary bypass capability. Patient‐level characteristics included Medicare and Medicaid inpatient days as a percentage of total inpatient days and percentage of admissions by race (black vs non‐black). The presence of hospitalists was correlated with each of the hospital and patient‐level characteristics. Further analyses of the subset of hospitals that use hospitalists included construction of multivariable linear regression models to assess the relationship between the percentage of patients admitted by hospitalists and the dependent variables. Models were adjusted for the same patient‐ and hospital‐level characteristics.
The institutional review boards at Yale University and University of California, San Francisco approved the study. All analyses were performed using Statistical Analysis Software (SAS) version 9.1 (SAS Institute, Inc, Cary, NC).
RESULTS
Characteristics of Participating Hospitals
Telephone, fax, and e‐mail surveys were attempted with 1558 hospitals; we received 598 completed surveys for a response rate of 40%. There was no difference between responders and nonresponders on any of the 6 outcome variables, the number of Medicare or Medicaid inpatient days, and the percentage of admissions by race. Responders and nonresponders were also similar in size, ownership, safety‐net and teaching status, nursing staff ratio, presence of cardiac catheterization and coronary bypass capability, and core‐based statistical area. They differed only on region of the country, where hospitals in the northwest Central and Pacific regions of the country had larger overall proportions of respondents. All hospitals provided information about the presence or absence of hospitalist programs. The majority of respondents were hospitalist clinical or administrative managers (n = 220) followed by hospitalist leaders (n = 106), other executives (n = 58), vice presidents for medical affairs (n = 39), and chief medical officers (n = 15). Each respondent indicated a working knowledge of their site's hospitalist utilization and practice characteristics. Absence of hospitalist utilization was confirmed by contact with the Medical Staff Office.
Comparisons of Sites With Hospitalists and Those Without Hospitalists
Hospitals with and without hospitalists differed by a number of organizational characteristics (Table 1). Sites with hospitalists were more likely to be larger, nonprofit teaching hospitals, located in metropolitan regions, and have cardiac surgical services. There was no difference in the hospitals' safety‐net status or RN staffing ratio. Hospitals with hospitalists admitted lower percentages of black patients.
| Hospitalist Program | No Hospitalist Program | ||
|---|---|---|---|
| N = 429 | N = 169 | ||
| N (%) | N (%) | P Value | |
| |||
| Core‐based statistical area | <0.0001 | ||
| Division | 94 (21.9%) | 53 (31.4%) | |
| Metro | 275 (64.1%) | 72 (42.6%) | |
| Micro | 52 (12.1%) | 38 (22.5%) | |
| Rural | 8 (1.9%) | 6 (3.6%) | |
| Owner | 0.0003 | ||
| Public | 47 (11.0%) | 20 (11.8%) | |
| Nonprofit | 333 (77.6%) | 108 (63.9%) | |
| Private | 49 (11.4%) | 41 (24.3%) | |
| Teaching status | <0.0001 | ||
| COTH | 54 (12.6%) | 7 (4.1%) | |
| Teaching | 110 (25.6%) | 26 (15.4%) | |
| Other | 265 (61.8%) | 136 (80.5%) | |
| Cardiac type | 0.0003 | ||
| CABG | 286 (66.7%) | 86 (50.9%) | |
| CATH | 79 (18.4%) | 36 (21.3%) | |
| Other | 64 (14.9%) | 47 (27.8%) | |
| Region | 0.007 | ||
| New England | 35 (8.2%) | 3 (1.8%) | |
| Middle Atlantic | 60 (14.0%) | 29 (17.2%) | |
| South Atlantic | 78 (18.2%) | 23 (13.6%) | |
| NE Central | 60 (14.0%) | 35 (20.7%) | |
| SE Central | 31 (7.2%) | 10 (5.9%) | |
| NW Central | 38 (8.9%) | 23 (13.6%) | |
| SW Central | 41 (9.6%) | 21 (12.4%) | |
| Mountain | 22 (5.1%) | 3 (1.8%) | |
| Pacific | 64 (14.9%) | 22 (13.0%) | |
| Safety‐net | 0.53 | ||
| Yes | 72 (16.8%) | 32 (18.9%) | |
| No | 357 (83.2%) | 137 (81.1%) | |
| Mean (SD) | Mean (SD) | P value | |
| RN staffing ratio (n = 455) | 27.3 (17.0) | 26.1 (7.6) | 0.28 |
| Total beds | 315.0 (216.6) | 214.8 (136.0) | <0.0001 |
| % Medicare inpatient days | 47.2 (42) | 49.7 (41) | 0.19 |
| % Medicaid inpatient days | 18.5 (28) | 21.4 (46) | 0.16 |
| % Black | 7.6 (9.6) | 10.6 (17.4) | 0.03 |
Characteristics of Hospitalist Programs and Responsibilities
Of the 429 sites reporting use of hospitalists, the median percentage of patients admitted by hospitalists was 60%, with an interquartile range (IQR) of 35% to 80%. The median number of full‐time equivalent hospitalists per hospital was 8 with an IQR of 5 to 14. The IQR reflects the middle 50% of the distribution of responses, and is not affected by outliers or extreme values. Additional characteristics of hospitalist programs can be found in Table 2. The estimated percentage of patients with AMI, HF, and pneumonia cared for by hospitalists varied considerably, with fewer patients with AMI and more patients with pneumonia under hospitalist care. Overall, a majority of hospitalist groups provided the following services: care of critical care patients, emergency department admission screening, observation unit coverage, coverage for cardiac arrests and rapid response teams, quality improvement or utilization review activities, development of hospital practice guidelines, and participation in implementation of major hospital system projects (such as implementation of an electronic health record system).
| N (%) | |
|---|---|
| |
| Date program established | |
| 19871994 | 9 (2.2%) |
| 19952002 | 130 (32.1%) |
| 20032011 | 266 (65.7%) |
| Missing date | 24 |
| No. of hospitalist FTEs | |
| Median (IQR) | 8 (5, 14) |
| Percent of medical patients admitted by hospitalists | |
| Median (IQR) | 60% (35, 80) |
| No. of hospitalists groups | |
| 1 | 333 (77.6%) |
| 2 | 54 (12.6%) |
| 3 | 36 (8.4%) |
| Don't know | 6 (1.4%) |
| Employment of hospitalists (not mutually exclusive) | |
| Hospital system | 98 (22.8%) |
| Hospital | 185 (43.1%) |
| Local physician practice group | 62 (14.5%) |
| Hospitalist physician practice group (local) | 83 (19.3%) |
| Hospitalist physician practice group (national/regional) | 36 (8.4%) |
| Other/unknown | 36 (8.4%) |
| Any 24‐hr in‐house coverage by hospitalists | |
| Yes | 329 (76.7%) |
| No | 98 (22.8%) |
| 3 | 1 (0.2%) |
| Unknown | 1 (0.2%) |
| No. of hospitalist international medical graduates | |
| Median (IQR) | 3 (1, 6) |
| No. of hospitalists that are <1 yr out of residency | |
| Median (IQR) | 1 (0, 2) |
| Percent of patients with AMI cared for by hospitalists | |
| 0%25% | 148 (34.5%) |
| 26%50% | 67 (15.6%) |
| 51%75% | 50 (11.7%) |
| 76%100% | 54 (12.6%) |
| Don't know | 110 (25.6%) |
| Percent of patients with heart failure cared for by hospitalists | |
| 0%25% | 79 (18.4%) |
| 26%50% | 78 (18.2%) |
| 51%75% | 75 (17.5%) |
| 76%100% | 84 (19.6%) |
| Don't know | 113 (26.3%) |
| Percent of patients with pneumonia cared for by hospitalists | |
| 0%25% | 47 (11.0%) |
| 26%50% | 61 (14.3%) |
| 51%75% | 74 (17.3%) |
| 76%100% | 141 (32.9%) |
| Don't know | 105 (24.5%) |
| Hospitalist provision of services | |
| Care of critical care patients | |
| Hospitalists provide service | 346 (80.7%) |
| Hospitalists do not provide service | 80 (18.7%) |
| Don't know | 3 (0.7%) |
| Emergency department admission screening | |
| Hospitalists provide service | 281 (65.5%) |
| Hospitalists do not provide service | 143 (33.3%) |
| Don't know | 5 (1.2%) |
| Observation unit coverage | |
| Hospitalists provide service | 359 (83.7%) |
| Hospitalists do not provide service | 64 (14.9%) |
| Don't know | 6 (1.4%) |
| Emergency department coverage | |
| Hospitalists provide service | 145 (33.8%) |
| Hospitalists do not provide service | 280 (65.3%) |
| Don't know | 4 (0.9%) |
| Coverage for cardiac arrests | |
| Hospitalists provide service | 283 (66.0%) |
| Hospitalists do not provide service | 135 (31.5%) |
| Don't know | 11 (2.6%) |
| Rapid response team coverage | |
| Hospitalists provide service | 240 (55.9%) |
| Hospitalists do not provide service | 168 (39.2%) |
| Don't know | 21 (4.9%) |
| Quality improvement or utilization review | |
| Hospitalists provide service | 376 (87.7%) |
| Hospitalists do not provide service | 37 (8.6%) |
| Don't know | 16 (3.7%) |
| Hospital practice guideline development | |
| Hospitalists provide service | 339 (79.0%) |
| Hospitalists do not provide service | 55 (12.8%) |
| Don't know | 35 (8.2%) |
| Implementation of major hospital system projects | |
| Hospitalists provide service | 309 (72.0%) |
| Hospitalists do not provide service | 96 (22.4%) |
| Don't know | 24 (5.6%) |
Relationship Between Hospitalist Utilization and Outcomes
Tables 3 and 4 show the comparisons between hospitals with and without hospitalists on each of the 6 outcome measures. In the bivariate analysis (Table 3), there was no statistically significant difference between groups on any of the outcome measures with the exception of the risk‐stratified readmission rate for heart failure. Sites with hospitalists had a lower RSRR for HF than sites without hospitalists (24.7% vs 25.4%, P < 0.0001). These results were similar in the multivariable models as seen in Table 4, in which the beta estimate (slope) was not significantly different for hospitals utilizing hospitalists compared to those that did not, on all measures except the RSRR for HF. For the subset of hospitals that used hospitalists, there was no statistically significant change in any of the 6 outcome measures, with increasing percentage of patients admitted by hospitalists. Table 5 demonstrates that for each RSMR and RSRR, the slope did not consistently increase or decrease with incrementally higher percentages of patients admitted by hospitalists, and the confidence intervals for all estimates crossed zero.
| Hospitalist Program | No Hospitalist Program | ||
|---|---|---|---|
| N = 429 | N = 169 | ||
| Outcome Measure | Mean % (SD) | Mean (SD) | P Value |
| |||
| MI RSMR | 16.0 (1.6) | 16.1 (1.5) | 0.56 |
| MI RSRR | 19.9 (0.88) | 20.0 (0.86) | 0.16 |
| HF RSMR | 11.3 (1.4) | 11.3 (1.4) | 0.77 |
| HF RSRR | 24.7 (1.6) | 25.4 (1.8) | <0.0001 |
| Pneumonia RSMR | 11.7 (1.7) | 12.0 (1.7) | 0.08 |
| Pneumonia RSRR | 18.2 (1.2) | 18.3 (1.1) | 0.28 |
| Adjusted beta estimate (95% CI) | |
|---|---|
| |
| MI RSMR | |
| Hospitalist | 0.001 (0.002, 004) |
| MI RSRR | |
| Hospitalist | 0.001 (0.002, 0.001) |
| HF RSMR | |
| Hospitalist | 0.0004 (0.002, 0.003) |
| HF RSRR | |
| Hospitalist | 0.006 (0.009, 0.003) |
| Pneumonia RSMR | |
| Hospitalist | 0.002 (0.005, 0.001) |
| Pneumonia RSRR | |
| Hospitalist | 0.00001 (0.002, 0.002) |
| Adjusted Beta Estimate (95% CI) | |
|---|---|
| |
| MI RSMR | |
| Percent admit | |
| 0%30% | 0.003 (0.007, 0.002) |
| 32%48% | 0.001 (0.005, 0.006) |
| 50%66% | Ref |
| 70%80% | 0.004 (0.001, 0.009) |
| 85% | 0.004 (0.009, 0.001) |
| MI RSRR | |
| Percent admit | |
| 0%30% | 0.001 (0.002, 0.004) |
| 32%48% | 0.001 (0.004, 0.004) |
| 50%66% | Ref |
| 70%80% | 0.001 (0.002, 0.004) |
| 85% | 0.001 (0.002, 0.004) |
| HF RSMR | |
| Percent admit | |
| 0%30% | 0.001 (0.005, 0.003) |
| 32%48% | 0.002 (0.007, 0.003) |
| 50%66% | Ref |
| 70%80% | 0.002 (0.006, 0.002) |
| 85% | 0.001 (0.004, 0.005) |
| HF RSRR | |
| Percent admit | |
| 0%30% | 0.002 (0.004, 0.007) |
| 32%48% | 0.0003 (0.005, 0.006) |
| 50%66% | Ref |
| 70%80% | 0.001 (0.005, 0.004) |
| 85% | 0.002 (0.007, 0.003) |
| Pneumonia RSMR | |
| Percent admit | |
| 0%30% | 0.001 (0.004, 0.006) |
| 32%48% | 0.00001 (0.006, 0.006) |
| 50%66% | Ref |
| 70%80% | 0.001 (0.004, 0.006) |
| 85% | 0.001 (0.006, 0.005) |
| Pneumonia RSRR | |
| Percent admit | |
| 0%30% | 0.0002 (0.004, 0.003) |
| 32%48% | 0.004 (0.0003, 0.008) |
| 50%66% | Ref |
| 70%80% | 0.001 (0.003, 0.004) |
| 85% | 0.002 (0.002, 0.006) |
DISCUSSION
In this national survey of hospitals, we did not find a significant association between the use of hospitalists and hospitals' performance on 30‐day mortality or readmissions measures for AMI, HF, or pneumonia. While there was a statistically lower 30‐day risk‐standardized readmission rate measure for the heart failure measure among hospitals that use hospitalists, the effect size was small. The survey response rate of 40% is comparable to other surveys of physicians and other healthcare personnel, however, there were no significant differences between responders and nonresponders, so the potential for response bias, while present, is small.
Contrary to the findings of a recent study,21 we did not find a higher readmission rate for any of the 3 conditions in hospitals with hospitalist programs. One advantage of our study is the use of more robust risk‐adjustment methods. Our study used NQF‐endorsed risk‐standardized measures of readmission, which capture readmissions to any hospital for common, high priority conditions where the impact of care coordination and discontinuity of care are paramount. The models use administrative claims data, but have been validated by medical record data. Another advantage is that our study focused on a time period when hospital readmissions were a standard quality benchmark and increasing priority for hospitals, hospitalists, and community‐based care delivery systems. While our study is not able to discern whether patients had primary care physicians or the reason for admission to a hospitalist's care, our data do suggest that hospitalists continue to care for a large percentage of hospitalized patients. Moreover, increasing the proportion of patients being admitted to hospitalists did not affect the risk for readmission, providing perhaps reassuring evidence (or lack of proof) for a direct association between use of hospitalist systems and higher risk for readmission.
While hospitals with hospitalists clearly did not have better mortality or readmission rates, an alternate viewpoint might hold that, despite concerns that hospitalists negatively impact care continuity, our data do not demonstrate an association between readmission rates and use of hospitalist services. It is possible that hospitals that have hospitalists may have more ability to invest in hospital‐based systems of care,22 an association which may incorporate any hospitalist effect, but our results were robust even after testing whether adjustment for hospital factors (such as profit status, size) affected our results.
It is also possible that secular trends in hospitals or hospitalist systems affected our results. A handful of single‐site studies carried out soon after the hospitalist model's earliest descriptions found a reduction in mortality and readmission rates with the implementation of a hospitalist program.2325 Alternatively, it may be that there has been a dilution of the effect of hospitalists as often occurs when any new innovation is spread from early adopter sites to routine practice. Consistent with other multicenter studies from recent eras,21, 26 our article's findings do not demonstrate an association between hospitalists and improved outcomes. Unlike other multicenter studies, we had access to disease‐specific risk‐adjustment methodologies, which may partially account for referral biases related to patient‐specific measures of acute or chronic illness severity.
Changes in the hospitalist effect over time have a number of explanations, some of which are relevant to our study. Recent evidence suggests that complex organizational characteristics, such as organizational values and goals, may contribute to performance on 30‐day mortality for AMI rather than specific processes and protocols27; intense focus on AMI as a quality improvement target is emblematic of a number of national initiatives that may have affected our results. Interestingly, hospitalist systems have changed over time as well. Early in the hospitalist movement, hospitalist systems were implemented largely at the behest of hospitals trying to reduce costs. In recent years, however, hospitalist systems are at least as frequently being implemented because outpatient‐based physicians or surgeons request hospitalists; hospitalists have been focused on care of uncoveredpatients, since the model's earliest description. In addition, some hospitals invest in hospitalist programs based on perceived ability of hospitalists to improve quality and achieve better patient outcomes in an era of payment increasingly being linked to quality of care metrics.
Our study has several limitations, six of which are noted here. First, while the hospitalist model has been widely embraced in the adult medicine field, in the absence of board certification, there is no gold standard definition of a hospitalist. It is therefore possible that some respondents may have represented groups that were identified incorrectly as hospitalists. Second, the data for the primary independent variable of interest was based upon self‐report and, therefore, subject to recall bias and potential misclassification of results. Respondents were not aware of our hypothesis, so the bias should not have been in one particular direction. Third, the data for the outcome variables are from 2008. They may, therefore, not reflect organizational enhancements related to use of hospitalists that are in process, and take years to yield downstream improvements on performance metrics. In addition, of the 429 hospitals that have hospitalist programs, 46 programs were initiated after 2008. While national performance on the 6 outcome variables has been relatively static over time,7 any significant change in hospital performance on these metrics since 2008 could suggest an overestimation or underestimation of the effect of hospitalist programs on patient outcomes. Fourth, we were not able to adjust for additional hospital or health system level characteristics that may be associated with hospitalist use or patient outcomes. Fifth, our regression models had significant collinearity, in that the presence of hospitalists was correlated with each of the covariates. However, this finding would indicate that our estimates may be overly conservative and could have contributed to our nonsignificant findings. Finally, outcomes for 2 of the 3 clinical conditions measured are ones for which hospitalists may less frequently provide care: acute myocardial infarction and heart failure. Outcome measures more relevant for hospitalists may be all‐condition, all‐cause, 30‐day mortality and readmission.
This work adds to the growing body of literature examining the impact of hospitalists on quality of care. To our knowledge, it is the first study to assess the association between hospitalist use and performance on outcome metrics at a national level. While our findings suggest that use of hospitalists alone may not lead to improved performance on outcome measures, a parallel body of research is emerging implicating broader system and organizational factors as key to high performance on outcome measures. It is likely that multiple factors contribute to performance on outcome measures, including type and mix of hospital personnel, patient care processes and workflow, and system level attributes. Comparative effectiveness and implementation research that assess the contextual factors and interventions that lead to successful system improvement and better performance is increasingly needed. It is unlikely that a single factor, such as hospitalist use, will significantly impact 30‐day mortality or readmission and, therefore, multifactorial interventions are likely required. In addition, hospitalist use is a complex intervention as the structure, processes, training, experience, role in the hospital system, and other factors (including quality of hospitalists or the hospitalist program) vary across programs. Rather than focusing on the volume of care delivered by hospitalists, hospitals will likely need to support hospital medicine programs that have the time and expertise to devote to improving the quality and value of care delivered across the hospital system. This study highlights that interventions leading to improvement on core outcome measures are more complex than simply having a hospital medicine program.
Acknowledgements
The authors acknowledge Judy Maselli, MPH, Division of General Internal Medicine, Department of Medicine, University of California, San Francisco, for her assistance with statistical analyses and preparation of tables.
Disclosures: Work on this project was supported by the Robert Wood Johnson Clinical Scholars Program (K.G.); California Healthcare Foundation grant 15763 (A.D.A.); and a grant from the National Heart, Lung, and Blood Institute (NHLBI), study 1U01HL105270‐02 (H.M.K.). Dr Krumholz is the chair of the Cardiac Scientific Advisory Board for United Health and has a research grant with Medtronic through Yale University; Dr Auerbach has a grant through the National Heart, Lung, and Blood Institute (NHLBI). The authors have no other disclosures to report.
- ,,,.Comparison of hospitalists and nonhospitalists regarding core measures of pneumonia care.Am J Manag Care.2007;13:129–132.
- ,,,.Comparison of processes and outcomes of pneumonia care between hospitalists and community‐based primary care physicians.Mayo Clin Proc.2002;77(10):1053–1058.
- ,,,,.Quality of care for patients hospitalized with heart failure: assessing the impact of hospitalists.Arch Intern Med.2002;162(11):1251–1256.
- ,,, et al.Quality of care for decompensated heart failure: comparable performance between academic hospitalists and non‐hospitalists.J Gen Intern Med.2008;23(9):1399–1406.
- ,,.Comparison of practice patterns of hospitalists and community physicians in the care of patients with congestive heart failure.J Hosp Med.2008;3(1):35–41.
- ,,,,.Cross‐sectional analysis of hospitalist prevalence and quality of care in California.J Hosp Med.2010;5(4):200–207.
- Hospital Compare. Department of Health and Human Services. Available at: http://www.hospitalcompare.hhs.gov. Accessed September 3,2011.
- ,.Teaching hospitals and quality of care: a review of the literature.Milbank Q.2002;80(3):569–593.
- ,,, et al.A systematic review and meta‐analysis of studies comparing mortality rates of private for‐profit and private not‐for‐profit hospitals.Can Med Assoc J.2002;166(11):1399–1406.
- ,,,,.Patient and hospital characteristics associated with recommended processes of care for elderly patients hospitalized with pneumonia: results from the Medicare Quality Indicator System Pneumonia Module.Arch Intern Med.2002;162(7):827–833.
- ,,,.Care in U.S. hospitals—The Hospital Quality Alliance Program.N Engl J Med.2005;353(3):265–274.
- ,,, et al.Hospital characteristics and quality of care.JAMA.1992;268(13):1709–1714.
- ,,,,.Nurse‐staffing levels and the quality of care in hospitals.N Engl J Med.2002;346(22):1715–1722.
- ,,,.Health care market trends and the evolution of hospitalist use and roles.J Gen Intern Med.2005;20:101–107.
- ,,, et al.An administrative claims model suitable for profiling hospital performance based on 30‐day mortality rates among patients with an acute myocardial infarction.Circulation.2006;113:1683–1692.
- ,,, et al.An administrative claims measure suitable for profiling hospital performance based on 30‐day all‐cause readmission rates among patients with acute myocardial infarction.Circulation.2011;4:243–252.
- ,,, et al.An administrative claims measure suitable for profiling hospital performance on the basis of 30‐day all‐cause readmission rates among patients with heart failure.Circ Cardiovasc Qual Outcomes.2008;1:29–37.
- ,,, et al.An administrative claims model suitable for profiling hospital performance based on 30‐day mortality rates among patients with heart failure.Circulation.2006;113:1693–1701.
- ,,, et al.An administrative claims model for profiling hospital 30‐day mortality rates for pneumonia patients.PLoS ONE.2011;6(4):e17401.
- ,,, et al.Development, validation and results of a measure of 30‐day readmission following hospitalization for pneumonia.J Hosp Med.2011;6:142–150.
- ,.Association of hospitalist care with medical utilization after discharge: evidence of cost shift from a cohort study.Ann Intern Med.2011;155:152–159.
- ,,,.California hospital leaders' views of hospitalists: meeting needs of the present and future.J Hosp Med.2009;4:528–534.
- ,,, et al.Effects of physician experience on costs and outcomes on an academic general medicine service: results of a trial of hospitalists.Ann Intern Med.2002;137:866–874.
- ,,,,,.Implementation of a voluntary hospitalist service at a community teaching hospital: improved clinical efficiency and patients outcomes.Ann Intern Med.2002;137:859–865.
- ,,,.A comparative study of unscheduled hospital readmissions in a resident‐staffed teaching service and a hospitalist‐based service.South Med J.2009;102:145–149.
- ,,,,,.Outcomes of care by hospitalists, general internists, and family physicians.N Engl J Med.2007;357:2589–2600.
- ,,, et al.What distinguishes top‐performing hospitals in acute myocardial infarction mortality rates?Ann Intern Med.2011;154:384–390.
Copyright © 2012 Society of Hospital Medicine
PHM Strategic Planning Roundtable
Hospitalists are the fastest growing segment of physicians in the United States.1 Given the growing field of Pediatric Hospital Medicine (PHM) and the need to define strategic direction, the Society of Hospital Medicine (SHM), the American Academy of Pediatrics (AAP), and the Academic Pediatric Association (APA) sponsored a strategic planning meeting in February 2009 that brought together 22 PHM leaders to discuss the future of the field.
PHM is at a critical juncture in terms of clinical practice, research, workforce issues, and quality improvement. The field has developed sufficiently to produce leaders capable of setting an agenda and moving forward. A discussion with the American Board of Pediatrics (ABP) by PHM leaders from the AAP, APA, and SHM at the Pediatric Hospital Medicine 2007 Conference regarding subspecialty designation stimulated convening the PHM Strategic Planning Roundtable to address the task of coordinating further development of PHM (Table 1).
|
| Develop a strategic vision for the role of PHM in the future of children's health care |
| Describe the current gaps between the vision and today's reality |
| Develop a common understanding regarding current initiatives in PHM domains of clinical practice, quality, research, and workforce |
| Determine the method(s) by which participants can be organized to accomplish additional initiatives to implement the vision |
| Identify and prioritize key strategic initiatives |
| Assign accountability and determine next steps and timeline to implement the selected initiatives |
The objective of this article is to describe: (1) the Strategic Planning Roundtable's vision for the field of pediatric hospital medicine; (2) the generation and progress on specific initiatives in clinical practice, quality, research, and workforce identified by the Strategic Planning Roundtable; and (3) issues in the designation of PHM as a subspecialty.
METHODS
The PHM Strategic Planning Roundtable was conducted by a facilitator (S.M.) during a 2‐day retreat using established healthcare strategic planning methods.2
Participants were the existing PHM leaders from the AAP, APA, and SHM, as well as other national leaders in clinical practice, quality, research, and workforce. Development of the vision statement was a key step in which the participants developed a consensus‐based aspirational view of the future. The draft version of the vision statement was initially developed after extensive interviews with key stakeholders and experts in PHM, and was revised by the participants in the course of a facilitated group discussion during the retreat. Following creation of the vision statement, the group then defined the elements of transformation pertaining to PHM and detailed the components of the vision.
Analysis of internal and external environmental factors was critical in the strategic planning process. This type of analysis, detailing the current state of PHM practice, permitted the strategic planners to understand the gaps that existed between the aspirational vision statement and today's reality, and set the stage to identify and implement initiatives to achieve the vision. Several months before the meeting, 4 expert panels comprised of PHM specialists representing a variety of academic and clinical practice settings were brought together via e‐mail and conference calls to focus on 4 domains of PHM: clinical practice, quality of care, research, and workforce. These groups were asked to describe the current status, challenges, and opportunities in these areas. Combining literature review and key stakeholder interviews, their findings and recommendations were distilled into brief summaries that were presented at the Roundtable meeting. Following the presentations, the participants, working in small groups representing all areas of focus,provided additional feedback.
Following the creation of a consensus vision statement and review of internal and external factors, the participants worked to identify specific initiatives in the 4 domains that would advance the field towards the goals contained in the vision statement. These initiatives were grouped into categories. Initiatives by category were scored and prioritized according to predetermined criteria including potential impact, cost, operational complexity, and achievability.
For each initiative selected, the group developed targets and metrics that would be used to track progress. Assigning leadership, accountability, and a timeline to each of the selected projects completed the implementation plan. In addition, the group developed an organizational structure to provide oversight for the overall process, and designated individuals representing the sponsoring organizations into those roles. In conclusion, the group discussed potential structures to guide the future of PHM.
CLINICAL PRACTICE
The Roundtable defined clinical practice for PHM as the general medical care of the hospitalized child, including direct patient care and leadership of the inpatient service. Clinical practice is affected by a number of current national trends including: fewer primary care providers interested in, or with the time to provide, inpatient care; resident work hour restrictions; increasing complexity of clinical issues; and increasing availability of pediatric hospitalists. At the hospital level, clinical practice is affected by increasing need for quality and safety measures, electronic health records and computerized physician order entry, and mounting financial pressures on the hospital system. Hospitalists are assuming more roles in leading quality and safety initiatives, creating computerized systems that address children's needs, and creating financially viable systems of quality pediatric care.3 Hospitalists' clinical care and leadership roles are emerging, and therefore the field faces training and mentorship issues.
Progress to date in this area includes 2 textbooks that define a scope of knowledge and practice, and a newly developed journal in PHM. Core competencies in PHM have been published and provide further refinement of scope and a template for future training.4
Multiple opportunities exist for hospitalists to establish themselves as clinical leaders. Hospitalists can become the preferred providers for hospitalized chronically ill children, with specific initiatives to improve care coordination and multidisciplinary communication. In addition to care coordination and decreasing length of stay, hospitalists, with their intimate knowledge of hospital operations, can be leaders in hospital capacity management and patient flow to increase operational efficiency. Hospitalists can expand evidence‐based guidelines for, and data about, inpatient conditions, and explore the effect of workload and hours on patient care. In addition, there is an expanding role into administrative areas, as well as alternate care arenas, such as: intensive care support (pediatric and neonatal), transport, sedation, palliative care, and pain management. Activities in administrative and alternate care areas have profound direct affects on patient care, as well as providing value added services and additional revenue streams which can further support clinical needs. Finally, achieving quality targets will likely be increasingly linked to payment, so hospitalists may play a key role in the incentives paid to their hospitals. Meeting these challenges will further solidify the standing of hospitalists in the clinical realm.
QUALITY
National and governmental agencies have influenced quality and performance improvement measurements in adult healthcare, resulting in improvements in adult healthcare quality measurement.5 There is limited similar influence or measure development in pediatric medicine, so the quality chasm between adult and child healthcare has widened. Few resources are invested in improving quality and safety of pediatric inpatient care. Of the 18 private health insurance plans' quality and pay for performance programs identified by Leapfrog, only 17% developed pediatric‐specific inpatient measures.6 Only 5 of 40 controlled trials of quality improvement efforts for children published between 1980 and 1998 addressed inpatient problems.7
There have been recent efforts at the national level addressing these issues, highlighted by the introduction of The Children's Health Care Quality Act, in 2007. Early studies in PHM systems focused on overall operational efficiency, documenting 9% to 16% decreases in length of stay and cost compared to traditional models of care.8 Conway et al. identified higher reported adherence to evidence‐based care for hospitalists compared to community pediatricians.9 However, Landrigan et al. demonstrated that there is still large variation in care that exists in the management of common inpatient diagnoses, lacking strong evidence‐based guidelines even among pediatric hospitalists.10 Moreover, there have been no significant studies reviewing the impact of pediatric hospitalists on safety of inpatient care. Magnifying these challenges is the reality that our healthcare system is fragmented with various entities scrambling to define, measure, and compare the effectiveness and safety of pediatric healthcare.
These challenges create an opportunity for PHM to develop a model of how to deliver the highest quality and safest care to our patients. The solution is complex and will take cooperation at many levels of our healthcare system. Improving the safety and quality of care for children in all settings of inpatient care in the United States may best be accomplished via an effective collaborative. This collaborative should be comprehensive and inclusive, and focused on demonstrating and disseminating how standardized, evidence‐based care in both clinical and safety domains can lead to high‐value and high‐quality outcomes. The success of PHM will be measured by its ability to deliver a clear value proposition to all consumers and payers of healthcare. The creation of a robust national collaborative network is a first step towards meeting this goal and will take an extraordinary effort. A PHM Quality Improvement (QI) Collaborative workgroup was created in August 2009. Three collaboratives have been commissioned: (1) Reduction of patient identification errors; (2) Improving discharge communication to referring primary care providers for pediatric hospitalist programs, and (3) Reducing the misuse and overuse of bronchodilators for bronchiolitis. All the collaborative groups have effectively engaged key groups of stakeholders and utilized standard QI tools, demonstrating improvement by the fall of 2010 (unpublished data, S.N.).
RESEARCH
Despite being a relatively young field, there is a critical mass of pediatric hospitalist‐investigators who are establishing research career paths for themselves by securing external grant funding for their work, publishing, and receiving mentorship from largely non‐hospitalist mentors. Some hospitalists are now in a position to mentor junior investigators. These hospitalist‐investigators identified a collective goal of working together across multiple sites in a clinical research network. The goal is to conduct high‐quality studies and provide the necessary clinical information to allow practicing hospitalists to make better decisions regarding patient care. This new inpatient evidence‐base will have the added advantage of helping further define the field of PHM.
The Pediatric Research in Inpatient Settings Network (PRIS) was identified as the vehicle to accomplish these goals. A series of objectives were identified to redesign PRIS in order to accommodate and organize this new influx of hospitalist‐investigators. These objectives included having hospitalist‐investigators commit their time to the prioritization, design, and execution of multicenter studies, drafting new governance documents for PRIS, securing external funding, redefining the relationships of the 3 existing organizations that formed PRIS (AAP, APA, SHM), defining how new clinical sites could be added to PRIS, creating a pipeline for junior hospitalist‐investigators to transition to leadership roles, securing a data coordinating center with established expertise in conducting multicenter studies, and establishing an external research advisory committee of leaders in pediatric clinical research and QI.
Several critical issues were identified, but funding remained a priority for the sustainability of PRIS. Comparative effectiveness (CE) was recognized as a potential important source of future funding. Pediatric studies on CE (eg, surgery vs medical management) conducted by PRIS would provide important new data to allow hospitalists to practice evidence‐based medicine and to improve quality.
A Research Leadership Task Force was created with 4 members of the PHM Strategic Planning Roundtable to work on the identified issues. The APA leadership worked with PRIS to establish a new Executive Council (comprised of additional qualified hospitalist‐investigators). The Executive Council was charged with accomplishing the tasks outlined from the Strategic Planning Roundtable. They have created the governance documents and standard operating procedures necessary for PRIS to conduct multicenter studies, defined a strategic framework for PRIS including the mission, vision and values, and funding strategy. In February 2010, PRIS received a 3‐year award for over $1 million from the Child Health Corporation of America to both fund the infrastructure of PRIS and to conduct a Prioritization Project. The Prioritization Project seeks to identify the conditions that are costly, prevalent, and demonstrate high inter‐hospital variation in resource utilization, which signals either lack of high‐quality data upon which to base medical decisions, and/or an opportunity to standardize care across hospitals. Some of these conditions will warrant further investigation to define the evidence base, whereas other conditions may require implementation studies to reliably introduce evidence into practice. Members of the Executive Council received additional funding to investigate community settings, as most children are hospitalized outside of large children's hospitals. PRIS also reengaged all 3 societies (APA, AAP, and SHM) for support for the first face‐to‐face meeting of the Executive Council. PRIS applied for 2 Recovery Act stimulus grants, and received funding for both of approximately $12 million. The processes used to design, provide feedback, and shepherd these initial studies formed the basis for the standard operating procedures for the Network. PRIS is now reengaging its membership to establish how sites may be able to conduct research, and receive new ideas to be considered for study in PRIS.
Although much work remains to be done, the Executive Council is continuing the charge with quarterly face‐to‐face meetings, hiring of a full‐time PRIS Coordinator, and carrying out these initial projects, while maintaining the goal of meeting the needs of the membership and PHM. If PRIS is to accomplish its mission of improving the health of, and healthcare delivery to, hospitalized children and their families, then the types of studies undertaken will include not only original research questions, but also comparative implementation methods to better understand how hospitalists in a variety of settings can best translate research findings into clinical practice and ultimately improve patient outcomes.
WORKFORCE
The current number of pediatric hospitalists is difficult to gauge11; estimates range from 1500 to 3000 physicians. There are groups of pediatric hospitalists within several national organizations including the AAP, APA, and SHM, in addition to a very active listserve community. It is likely that only a portion of pediatric hospitalists are represented by membership in these organizations.
Most physicians entering the field of PHM come directly out of residency. A recent survey by Freed et al.12 reported that 3% of current pediatric residents are interested in PHM as a career. In another survey by Freed et al., about 6% of recent pediatric residency graduates reported currently practicing as pediatric hospitalists.13 This difference may indicate a number of pediatricians practicing transiently as pediatric hospitalists.
There are numerous issues that will affect the growth and sustainability of PHM. A large number of pediatric residents entering the field will be needed to maintain current numbers. With 45% of hospitalists in practice less than 3 years,11 the growth of PHM in both numbers and influence will require an increasing number of hospitalists with sustained careers in the field. Recognition as experts in inpatient care, as well as expansion of the role of hospitalists beyond the clinical realm to education, research, and hospital leadership, will foster long‐term career satisfaction. The increasingly common stature of hospital medicine as an independent division, equivalent to general pediatrics and subspecialty divisions within a department, may further bolster the perception of hospital medicine as a career.
The majority of pediatric hospitalists believe that current pediatric residency training does not provide all of the skills necessary to practice as a pediatric hospitalist,14 though there is disagreement regarding how additional training in pediatric hospital medicine should be achieved: a dedicated fellowship versus continuing medical education (CME). There are several initiatives with the potential to transform the way pediatric hospitalists are trained and certified. The Residency Review and Redesign Project indicates that pediatric residency is likely to be reformed to better meet the training demands of the individual resident's chosen career path. Changing residency to better prepare pediatric residents to take positions in pediatric hospital medicine will certainly affect the workforce emerging from residency programs and their subsequent training needs.15 The American Board of Internal Medicine and the American Board of Family Medicine have approved a Recognition of Focused Practice in Hospital Medicine. This recognition is gained through the Maintenance of Certification (MOC) Program of the respective boards after a minimum of 3 years of practice. SHM is offering fellow recognition in tiered designations of Fellow of Hospital Medicine (FHM), Senior Fellow of Hospital Medicine, and Master of Hospital Medicine. Five hundred hospitalists, including many pediatric hospitalists, received the inaugural FHM designation in 2009. Organizational recognition is a common process in many other medical fields, although previously limited in pediatrics to Fellow of the AAP. FHM is an important step, but cannot substitute for specific training and certification.
Academic fellowships in PHM will aid in the training of hospitalists with scholarly skills and will help produce more pediatric hospitalists with clinical, quality, administrative, and leadership skills. A model of subspecialty fellowship training and certification of all PHM physicians would require a several‐fold increase in available fellowships, currently approximately 15.
Ongoing CME offerings are also critical to sustaining and developing the workforce. The annual national meetings of the APA, AAP, and SHM all offer PHM‐dedicated content, and there is an annual PHM conference sponsored by these 3 organizations. There are now multiple additional national and regional meetings focused on PHM, reflecting the growing audience for PHM CME content. The AAP offers a PHM study guide and an Education in quality improvement for pediatric practice (eQIPP) module on inpatient asthma, specifically designed to facilitate the MOC process for pediatric hospitalists.
Some form of ABP recognition may be necessary to provide the status for PHM to be widely recognized as a viable academic career in the larger pediatric community. This would entail standardized fellowships that will ensure graduates have demonstrated proficiency in the core competencies. PHM leaders have engaged the ABP to better understand the subspecialty approval process and thoughtfully examine the ramifications of subspecialty status, specifically what subspecialty certification would mean for PHM providers and hospitals. Achieving ABP certification may create a new standard of care meaning that noncertified PHM providers will be at a disadvantage. It is unknown what the impact on pediatric inpatient care would be if a PHM standard was set without the supply of practitioners to provide that care.
STRUCTURE
The efforts of the Roundtable demonstrate the potential effectiveness of the current structure that guides the field: that of the cooperative interchange between the PHM leaders within the APA, AAP, and SHM. It may be that, similar to Pediatric Emergency Medicine (PEM), no formal, unifying structure is necessary. Alternatively, both Adolescent Medicine and Behavioral and Developmental Pediatrics (BDP) have their own organizations that guide their respective fields. A hybrid model is that of Pediatric Cardiology which has the Joint Council on Congenital Heart Disease. This structure assures that the leaders of the various organizations concerned with congenital heart disease meet at least annually to report on their activities and coordinate future efforts. Its makeup is similar to how the planning committee of the annual national PHM conference is constructed. Although PHM has largely succeeded with the current organizational structure, it is possible that a more formal structure is needed to continue forward.
CONCLUSION
The Roundtable members developed the following vision for PHM: Pediatric hospitalists will transform the delivery of hospital care for children. This will be done by achieving 7 goals (Table 2).
|
| We will ensure that care for hospitalized children is fully integrated and includes the medical home |
| We will design and support systems for children that eliminate harm associated with hospital care |
| We will develop a skilled and stable workforce that is the preferred provider of care for most hospitalized children |
| We will use collaborative research models to answer questions of clinical efficacy, comparative effectiveness, and quality improvement, and we will deliver care based on that knowledge |
| We will provide the expertise that supports continuing education in the care of the hospitalized child for pediatric hospitalists, trainees, midlevel providers, and hospital staff |
| We will create value for our patients and organizations in which we work based on our unique expertise in PHM clinical care, research, and education |
| We will be leaders and influential agents in national health care policies that impact hospital care |
Attaining this vision will take tremendous dedication, effort, and collaboration. As a starting point, the following initiatives were proposed and implemented as noted:
Clinical
-
Develop an educational plan supporting the PHM Core Competencies, addressing both hospitalist training needs and the role as formal educators.
-
Create a clinical practice monitoring dashboard template for use at PHM hospitals and practices (implemented July 2010).
Quality
-
Undertake environmental assessment of PHM participation on key quality and safety committees, societies, and agencies to ensure appropriate PHM representation in liaison and/or leadership positions.
-
Create a plan for a QI collaborative by assessing the needs and resources available; draft plans for 2 projects (1 safety and 1 quality) which will improve care for children hospitalized with common conditions (started July 2009).
Research
-
Create a collaborative research entity by restructuring the existing research network and formalizing relationships with affiliated networks.
-
Create a pipeline/mentorship system to increase the number of PHM researchers.
Workforce
-
Develop a descriptive statement that can be used by any PHM physician that defines the field of PHM and answers the question who are we?
-
Develop a communications tool describing value added of PHM.
-
Develop a tool to assess career satisfaction among PHM physicians, with links to current SHM work in this area.
Structure
-
Formalize an organizational infrastructure for oversight and guidance of PHM Strategic Planning Roundtable efforts, with clear delineation of the relationships with the AAP, APA, and SHM.
This review demonstrates the work that needs to be done to close the gaps between the current state of affairs and the full vision of the potential impact of PHM. Harm is still common in hospitalized children, and, as a group of physicians, we do not consistently provide evidence‐based care. Quality and safety activities are currently dispersed throughout multiple national entities often working in silos. Much of our PHM research is fragmented, with a lack of effective research networks and collaborative efforts. We also found that while our workforce has many strengths, it is not yet stable.
We believe the Roundtable was successful in describing the current state of PHM and laying a course for the future. We developed a series of deliverable products that have already seen success on many fronts, and that will serve as the foundation for further maturation of the field. We hope to engage the pediatric community, within and without PHM, to comment, advise, and foster PHM so that these efforts are not static but ongoing and evolving. Already, new challenges have arisen not addressed at the Roundtable, such as further resident work restrictions, and healthcare reform with its potential effects on hospital finances. This is truly an exciting and dynamic time, and we know that this is just the beginning.
Acknowledgements
The authors acknowledge the contribution of all members of the roundtable: Douglas Carlson, Vincent Chiang, Patrick Conway, Jennifer Daru, Matthew Garber, Christopher Landrigan, Patricia Lye, Sanjay Mahant, Jennifer Maniscalco, Sanford Melzer, Stephen Muething, Steve Narang, Mary Ottolini, Jack Percelay, Daniel Rauch, Mario Reyes, Beth Robbins, Jeff Sperring, Rajendu Srivastava, Erin Stucky, Lisa Zaoutis, and David Zipes. The authors thank David Zipes for his help in reviewing the manuscript.
- ,.The hospitalist movement 5 years later.JAMA.2002;287(4):487–494.
- ,,.The Physician Strategist: Setting Strategic Direction for Your Practice; Chicago, Irwin Professional Pub,1996.
- ,.Pediatric hospitalists: training, current practice, and career goals.J Hosp Med.2009;4(3):179–186.
- The Pediatric Core Competencies Supplement.J Hosp Med.2010;5(suppl 2):1–114.
- ,,,.Reauthorizing SCHIP: Opportunities for Promoting Effective Health Coverage and High Quality Care for Children and Adolescents. Publication 1051.New York, NY:The Commonwealth Fund; August2007:4.
- ,.National Association of Children's Hospitals. Quality Performance Measurement in Medicaid and SCHIP: Result of a 2006 National Survey of State Officials.Lansing, MI:Health Management Associates; August2006.
- ,,,.A report card on quality improvement for children's health care.Pediatrics.2001;107:143–155.
- ,,, et al.Impact of a hospitalist system on length of stay and cost for children with common conditions.Pediatrics.2007;120(2):267–274.
- ,,,,,.Variations in management of common inpatient pediatric illnesses: hospitalists and community pediatricians.Pediatrics.2006;118:441–447.
- ,,,,.Variation in pediatric hospitalists' use of unproven therapies: a study from the Pediatric Research in Inpatient Settings (PRIS) network.J Hosp Med.2008;3(4):292–298.
- ,,,.Characteristics of the pediatric hospitalist workforce: its roles and work environment.Pediatrics.2007;120(1):33–39.
- ,,,,.General pediatrics resident perspectives on training decisions and career choice.Pediatrics.2009;123(suppl 1):S26–S30.
- ,,,,.Recently trained general pediatricians: perspectives on residency training and scope of practice.Pediatrics.2009;123(suppl 1):S38–S43.
- ,,,.PRIS survey: pediatric hospitalist roles and training needs [abstract].Pediatr Res.2004(55):1.
- ,,.The Residency Review and Redesign in Pediatrics (R3P) Project: roots and branches.Pediatrics.2009;123(suppl 1):S8–S11.
Hospitalists are the fastest growing segment of physicians in the United States.1 Given the growing field of Pediatric Hospital Medicine (PHM) and the need to define strategic direction, the Society of Hospital Medicine (SHM), the American Academy of Pediatrics (AAP), and the Academic Pediatric Association (APA) sponsored a strategic planning meeting in February 2009 that brought together 22 PHM leaders to discuss the future of the field.
PHM is at a critical juncture in terms of clinical practice, research, workforce issues, and quality improvement. The field has developed sufficiently to produce leaders capable of setting an agenda and moving forward. A discussion with the American Board of Pediatrics (ABP) by PHM leaders from the AAP, APA, and SHM at the Pediatric Hospital Medicine 2007 Conference regarding subspecialty designation stimulated convening the PHM Strategic Planning Roundtable to address the task of coordinating further development of PHM (Table 1).
|
| Develop a strategic vision for the role of PHM in the future of children's health care |
| Describe the current gaps between the vision and today's reality |
| Develop a common understanding regarding current initiatives in PHM domains of clinical practice, quality, research, and workforce |
| Determine the method(s) by which participants can be organized to accomplish additional initiatives to implement the vision |
| Identify and prioritize key strategic initiatives |
| Assign accountability and determine next steps and timeline to implement the selected initiatives |
The objective of this article is to describe: (1) the Strategic Planning Roundtable's vision for the field of pediatric hospital medicine; (2) the generation and progress on specific initiatives in clinical practice, quality, research, and workforce identified by the Strategic Planning Roundtable; and (3) issues in the designation of PHM as a subspecialty.
METHODS
The PHM Strategic Planning Roundtable was conducted by a facilitator (S.M.) during a 2‐day retreat using established healthcare strategic planning methods.2
Participants were the existing PHM leaders from the AAP, APA, and SHM, as well as other national leaders in clinical practice, quality, research, and workforce. Development of the vision statement was a key step in which the participants developed a consensus‐based aspirational view of the future. The draft version of the vision statement was initially developed after extensive interviews with key stakeholders and experts in PHM, and was revised by the participants in the course of a facilitated group discussion during the retreat. Following creation of the vision statement, the group then defined the elements of transformation pertaining to PHM and detailed the components of the vision.
Analysis of internal and external environmental factors was critical in the strategic planning process. This type of analysis, detailing the current state of PHM practice, permitted the strategic planners to understand the gaps that existed between the aspirational vision statement and today's reality, and set the stage to identify and implement initiatives to achieve the vision. Several months before the meeting, 4 expert panels comprised of PHM specialists representing a variety of academic and clinical practice settings were brought together via e‐mail and conference calls to focus on 4 domains of PHM: clinical practice, quality of care, research, and workforce. These groups were asked to describe the current status, challenges, and opportunities in these areas. Combining literature review and key stakeholder interviews, their findings and recommendations were distilled into brief summaries that were presented at the Roundtable meeting. Following the presentations, the participants, working in small groups representing all areas of focus,provided additional feedback.
Following the creation of a consensus vision statement and review of internal and external factors, the participants worked to identify specific initiatives in the 4 domains that would advance the field towards the goals contained in the vision statement. These initiatives were grouped into categories. Initiatives by category were scored and prioritized according to predetermined criteria including potential impact, cost, operational complexity, and achievability.
For each initiative selected, the group developed targets and metrics that would be used to track progress. Assigning leadership, accountability, and a timeline to each of the selected projects completed the implementation plan. In addition, the group developed an organizational structure to provide oversight for the overall process, and designated individuals representing the sponsoring organizations into those roles. In conclusion, the group discussed potential structures to guide the future of PHM.
CLINICAL PRACTICE
The Roundtable defined clinical practice for PHM as the general medical care of the hospitalized child, including direct patient care and leadership of the inpatient service. Clinical practice is affected by a number of current national trends including: fewer primary care providers interested in, or with the time to provide, inpatient care; resident work hour restrictions; increasing complexity of clinical issues; and increasing availability of pediatric hospitalists. At the hospital level, clinical practice is affected by increasing need for quality and safety measures, electronic health records and computerized physician order entry, and mounting financial pressures on the hospital system. Hospitalists are assuming more roles in leading quality and safety initiatives, creating computerized systems that address children's needs, and creating financially viable systems of quality pediatric care.3 Hospitalists' clinical care and leadership roles are emerging, and therefore the field faces training and mentorship issues.
Progress to date in this area includes 2 textbooks that define a scope of knowledge and practice, and a newly developed journal in PHM. Core competencies in PHM have been published and provide further refinement of scope and a template for future training.4
Multiple opportunities exist for hospitalists to establish themselves as clinical leaders. Hospitalists can become the preferred providers for hospitalized chronically ill children, with specific initiatives to improve care coordination and multidisciplinary communication. In addition to care coordination and decreasing length of stay, hospitalists, with their intimate knowledge of hospital operations, can be leaders in hospital capacity management and patient flow to increase operational efficiency. Hospitalists can expand evidence‐based guidelines for, and data about, inpatient conditions, and explore the effect of workload and hours on patient care. In addition, there is an expanding role into administrative areas, as well as alternate care arenas, such as: intensive care support (pediatric and neonatal), transport, sedation, palliative care, and pain management. Activities in administrative and alternate care areas have profound direct affects on patient care, as well as providing value added services and additional revenue streams which can further support clinical needs. Finally, achieving quality targets will likely be increasingly linked to payment, so hospitalists may play a key role in the incentives paid to their hospitals. Meeting these challenges will further solidify the standing of hospitalists in the clinical realm.
QUALITY
National and governmental agencies have influenced quality and performance improvement measurements in adult healthcare, resulting in improvements in adult healthcare quality measurement.5 There is limited similar influence or measure development in pediatric medicine, so the quality chasm between adult and child healthcare has widened. Few resources are invested in improving quality and safety of pediatric inpatient care. Of the 18 private health insurance plans' quality and pay for performance programs identified by Leapfrog, only 17% developed pediatric‐specific inpatient measures.6 Only 5 of 40 controlled trials of quality improvement efforts for children published between 1980 and 1998 addressed inpatient problems.7
There have been recent efforts at the national level addressing these issues, highlighted by the introduction of The Children's Health Care Quality Act, in 2007. Early studies in PHM systems focused on overall operational efficiency, documenting 9% to 16% decreases in length of stay and cost compared to traditional models of care.8 Conway et al. identified higher reported adherence to evidence‐based care for hospitalists compared to community pediatricians.9 However, Landrigan et al. demonstrated that there is still large variation in care that exists in the management of common inpatient diagnoses, lacking strong evidence‐based guidelines even among pediatric hospitalists.10 Moreover, there have been no significant studies reviewing the impact of pediatric hospitalists on safety of inpatient care. Magnifying these challenges is the reality that our healthcare system is fragmented with various entities scrambling to define, measure, and compare the effectiveness and safety of pediatric healthcare.
These challenges create an opportunity for PHM to develop a model of how to deliver the highest quality and safest care to our patients. The solution is complex and will take cooperation at many levels of our healthcare system. Improving the safety and quality of care for children in all settings of inpatient care in the United States may best be accomplished via an effective collaborative. This collaborative should be comprehensive and inclusive, and focused on demonstrating and disseminating how standardized, evidence‐based care in both clinical and safety domains can lead to high‐value and high‐quality outcomes. The success of PHM will be measured by its ability to deliver a clear value proposition to all consumers and payers of healthcare. The creation of a robust national collaborative network is a first step towards meeting this goal and will take an extraordinary effort. A PHM Quality Improvement (QI) Collaborative workgroup was created in August 2009. Three collaboratives have been commissioned: (1) Reduction of patient identification errors; (2) Improving discharge communication to referring primary care providers for pediatric hospitalist programs, and (3) Reducing the misuse and overuse of bronchodilators for bronchiolitis. All the collaborative groups have effectively engaged key groups of stakeholders and utilized standard QI tools, demonstrating improvement by the fall of 2010 (unpublished data, S.N.).
RESEARCH
Despite being a relatively young field, there is a critical mass of pediatric hospitalist‐investigators who are establishing research career paths for themselves by securing external grant funding for their work, publishing, and receiving mentorship from largely non‐hospitalist mentors. Some hospitalists are now in a position to mentor junior investigators. These hospitalist‐investigators identified a collective goal of working together across multiple sites in a clinical research network. The goal is to conduct high‐quality studies and provide the necessary clinical information to allow practicing hospitalists to make better decisions regarding patient care. This new inpatient evidence‐base will have the added advantage of helping further define the field of PHM.
The Pediatric Research in Inpatient Settings Network (PRIS) was identified as the vehicle to accomplish these goals. A series of objectives were identified to redesign PRIS in order to accommodate and organize this new influx of hospitalist‐investigators. These objectives included having hospitalist‐investigators commit their time to the prioritization, design, and execution of multicenter studies, drafting new governance documents for PRIS, securing external funding, redefining the relationships of the 3 existing organizations that formed PRIS (AAP, APA, SHM), defining how new clinical sites could be added to PRIS, creating a pipeline for junior hospitalist‐investigators to transition to leadership roles, securing a data coordinating center with established expertise in conducting multicenter studies, and establishing an external research advisory committee of leaders in pediatric clinical research and QI.
Several critical issues were identified, but funding remained a priority for the sustainability of PRIS. Comparative effectiveness (CE) was recognized as a potential important source of future funding. Pediatric studies on CE (eg, surgery vs medical management) conducted by PRIS would provide important new data to allow hospitalists to practice evidence‐based medicine and to improve quality.
A Research Leadership Task Force was created with 4 members of the PHM Strategic Planning Roundtable to work on the identified issues. The APA leadership worked with PRIS to establish a new Executive Council (comprised of additional qualified hospitalist‐investigators). The Executive Council was charged with accomplishing the tasks outlined from the Strategic Planning Roundtable. They have created the governance documents and standard operating procedures necessary for PRIS to conduct multicenter studies, defined a strategic framework for PRIS including the mission, vision and values, and funding strategy. In February 2010, PRIS received a 3‐year award for over $1 million from the Child Health Corporation of America to both fund the infrastructure of PRIS and to conduct a Prioritization Project. The Prioritization Project seeks to identify the conditions that are costly, prevalent, and demonstrate high inter‐hospital variation in resource utilization, which signals either lack of high‐quality data upon which to base medical decisions, and/or an opportunity to standardize care across hospitals. Some of these conditions will warrant further investigation to define the evidence base, whereas other conditions may require implementation studies to reliably introduce evidence into practice. Members of the Executive Council received additional funding to investigate community settings, as most children are hospitalized outside of large children's hospitals. PRIS also reengaged all 3 societies (APA, AAP, and SHM) for support for the first face‐to‐face meeting of the Executive Council. PRIS applied for 2 Recovery Act stimulus grants, and received funding for both of approximately $12 million. The processes used to design, provide feedback, and shepherd these initial studies formed the basis for the standard operating procedures for the Network. PRIS is now reengaging its membership to establish how sites may be able to conduct research, and receive new ideas to be considered for study in PRIS.
Although much work remains to be done, the Executive Council is continuing the charge with quarterly face‐to‐face meetings, hiring of a full‐time PRIS Coordinator, and carrying out these initial projects, while maintaining the goal of meeting the needs of the membership and PHM. If PRIS is to accomplish its mission of improving the health of, and healthcare delivery to, hospitalized children and their families, then the types of studies undertaken will include not only original research questions, but also comparative implementation methods to better understand how hospitalists in a variety of settings can best translate research findings into clinical practice and ultimately improve patient outcomes.
WORKFORCE
The current number of pediatric hospitalists is difficult to gauge11; estimates range from 1500 to 3000 physicians. There are groups of pediatric hospitalists within several national organizations including the AAP, APA, and SHM, in addition to a very active listserve community. It is likely that only a portion of pediatric hospitalists are represented by membership in these organizations.
Most physicians entering the field of PHM come directly out of residency. A recent survey by Freed et al.12 reported that 3% of current pediatric residents are interested in PHM as a career. In another survey by Freed et al., about 6% of recent pediatric residency graduates reported currently practicing as pediatric hospitalists.13 This difference may indicate a number of pediatricians practicing transiently as pediatric hospitalists.
There are numerous issues that will affect the growth and sustainability of PHM. A large number of pediatric residents entering the field will be needed to maintain current numbers. With 45% of hospitalists in practice less than 3 years,11 the growth of PHM in both numbers and influence will require an increasing number of hospitalists with sustained careers in the field. Recognition as experts in inpatient care, as well as expansion of the role of hospitalists beyond the clinical realm to education, research, and hospital leadership, will foster long‐term career satisfaction. The increasingly common stature of hospital medicine as an independent division, equivalent to general pediatrics and subspecialty divisions within a department, may further bolster the perception of hospital medicine as a career.
The majority of pediatric hospitalists believe that current pediatric residency training does not provide all of the skills necessary to practice as a pediatric hospitalist,14 though there is disagreement regarding how additional training in pediatric hospital medicine should be achieved: a dedicated fellowship versus continuing medical education (CME). There are several initiatives with the potential to transform the way pediatric hospitalists are trained and certified. The Residency Review and Redesign Project indicates that pediatric residency is likely to be reformed to better meet the training demands of the individual resident's chosen career path. Changing residency to better prepare pediatric residents to take positions in pediatric hospital medicine will certainly affect the workforce emerging from residency programs and their subsequent training needs.15 The American Board of Internal Medicine and the American Board of Family Medicine have approved a Recognition of Focused Practice in Hospital Medicine. This recognition is gained through the Maintenance of Certification (MOC) Program of the respective boards after a minimum of 3 years of practice. SHM is offering fellow recognition in tiered designations of Fellow of Hospital Medicine (FHM), Senior Fellow of Hospital Medicine, and Master of Hospital Medicine. Five hundred hospitalists, including many pediatric hospitalists, received the inaugural FHM designation in 2009. Organizational recognition is a common process in many other medical fields, although previously limited in pediatrics to Fellow of the AAP. FHM is an important step, but cannot substitute for specific training and certification.
Academic fellowships in PHM will aid in the training of hospitalists with scholarly skills and will help produce more pediatric hospitalists with clinical, quality, administrative, and leadership skills. A model of subspecialty fellowship training and certification of all PHM physicians would require a several‐fold increase in available fellowships, currently approximately 15.
Ongoing CME offerings are also critical to sustaining and developing the workforce. The annual national meetings of the APA, AAP, and SHM all offer PHM‐dedicated content, and there is an annual PHM conference sponsored by these 3 organizations. There are now multiple additional national and regional meetings focused on PHM, reflecting the growing audience for PHM CME content. The AAP offers a PHM study guide and an Education in quality improvement for pediatric practice (eQIPP) module on inpatient asthma, specifically designed to facilitate the MOC process for pediatric hospitalists.
Some form of ABP recognition may be necessary to provide the status for PHM to be widely recognized as a viable academic career in the larger pediatric community. This would entail standardized fellowships that will ensure graduates have demonstrated proficiency in the core competencies. PHM leaders have engaged the ABP to better understand the subspecialty approval process and thoughtfully examine the ramifications of subspecialty status, specifically what subspecialty certification would mean for PHM providers and hospitals. Achieving ABP certification may create a new standard of care meaning that noncertified PHM providers will be at a disadvantage. It is unknown what the impact on pediatric inpatient care would be if a PHM standard was set without the supply of practitioners to provide that care.
STRUCTURE
The efforts of the Roundtable demonstrate the potential effectiveness of the current structure that guides the field: that of the cooperative interchange between the PHM leaders within the APA, AAP, and SHM. It may be that, similar to Pediatric Emergency Medicine (PEM), no formal, unifying structure is necessary. Alternatively, both Adolescent Medicine and Behavioral and Developmental Pediatrics (BDP) have their own organizations that guide their respective fields. A hybrid model is that of Pediatric Cardiology which has the Joint Council on Congenital Heart Disease. This structure assures that the leaders of the various organizations concerned with congenital heart disease meet at least annually to report on their activities and coordinate future efforts. Its makeup is similar to how the planning committee of the annual national PHM conference is constructed. Although PHM has largely succeeded with the current organizational structure, it is possible that a more formal structure is needed to continue forward.
CONCLUSION
The Roundtable members developed the following vision for PHM: Pediatric hospitalists will transform the delivery of hospital care for children. This will be done by achieving 7 goals (Table 2).
|
| We will ensure that care for hospitalized children is fully integrated and includes the medical home |
| We will design and support systems for children that eliminate harm associated with hospital care |
| We will develop a skilled and stable workforce that is the preferred provider of care for most hospitalized children |
| We will use collaborative research models to answer questions of clinical efficacy, comparative effectiveness, and quality improvement, and we will deliver care based on that knowledge |
| We will provide the expertise that supports continuing education in the care of the hospitalized child for pediatric hospitalists, trainees, midlevel providers, and hospital staff |
| We will create value for our patients and organizations in which we work based on our unique expertise in PHM clinical care, research, and education |
| We will be leaders and influential agents in national health care policies that impact hospital care |
Attaining this vision will take tremendous dedication, effort, and collaboration. As a starting point, the following initiatives were proposed and implemented as noted:
Clinical
-
Develop an educational plan supporting the PHM Core Competencies, addressing both hospitalist training needs and the role as formal educators.
-
Create a clinical practice monitoring dashboard template for use at PHM hospitals and practices (implemented July 2010).
Quality
-
Undertake environmental assessment of PHM participation on key quality and safety committees, societies, and agencies to ensure appropriate PHM representation in liaison and/or leadership positions.
-
Create a plan for a QI collaborative by assessing the needs and resources available; draft plans for 2 projects (1 safety and 1 quality) which will improve care for children hospitalized with common conditions (started July 2009).
Research
-
Create a collaborative research entity by restructuring the existing research network and formalizing relationships with affiliated networks.
-
Create a pipeline/mentorship system to increase the number of PHM researchers.
Workforce
-
Develop a descriptive statement that can be used by any PHM physician that defines the field of PHM and answers the question who are we?
-
Develop a communications tool describing value added of PHM.
-
Develop a tool to assess career satisfaction among PHM physicians, with links to current SHM work in this area.
Structure
-
Formalize an organizational infrastructure for oversight and guidance of PHM Strategic Planning Roundtable efforts, with clear delineation of the relationships with the AAP, APA, and SHM.
This review demonstrates the work that needs to be done to close the gaps between the current state of affairs and the full vision of the potential impact of PHM. Harm is still common in hospitalized children, and, as a group of physicians, we do not consistently provide evidence‐based care. Quality and safety activities are currently dispersed throughout multiple national entities often working in silos. Much of our PHM research is fragmented, with a lack of effective research networks and collaborative efforts. We also found that while our workforce has many strengths, it is not yet stable.
We believe the Roundtable was successful in describing the current state of PHM and laying a course for the future. We developed a series of deliverable products that have already seen success on many fronts, and that will serve as the foundation for further maturation of the field. We hope to engage the pediatric community, within and without PHM, to comment, advise, and foster PHM so that these efforts are not static but ongoing and evolving. Already, new challenges have arisen not addressed at the Roundtable, such as further resident work restrictions, and healthcare reform with its potential effects on hospital finances. This is truly an exciting and dynamic time, and we know that this is just the beginning.
Acknowledgements
The authors acknowledge the contribution of all members of the roundtable: Douglas Carlson, Vincent Chiang, Patrick Conway, Jennifer Daru, Matthew Garber, Christopher Landrigan, Patricia Lye, Sanjay Mahant, Jennifer Maniscalco, Sanford Melzer, Stephen Muething, Steve Narang, Mary Ottolini, Jack Percelay, Daniel Rauch, Mario Reyes, Beth Robbins, Jeff Sperring, Rajendu Srivastava, Erin Stucky, Lisa Zaoutis, and David Zipes. The authors thank David Zipes for his help in reviewing the manuscript.
- ,.The hospitalist movement 5 years later.JAMA.2002;287(4):487–494.
- ,,.The Physician Strategist: Setting Strategic Direction for Your Practice; Chicago, Irwin Professional Pub,1996.
- ,.Pediatric hospitalists: training, current practice, and career goals.J Hosp Med.2009;4(3):179–186.
- The Pediatric Core Competencies Supplement.J Hosp Med.2010;5(suppl 2):1–114.
- ,,,.Reauthorizing SCHIP: Opportunities for Promoting Effective Health Coverage and High Quality Care for Children and Adolescents. Publication 1051.New York, NY:The Commonwealth Fund; August2007:4.
- ,.National Association of Children's Hospitals. Quality Performance Measurement in Medicaid and SCHIP: Result of a 2006 National Survey of State Officials.Lansing, MI:Health Management Associates; August2006.
- ,,,.A report card on quality improvement for children's health care.Pediatrics.2001;107:143–155.
- ,,, et al.Impact of a hospitalist system on length of stay and cost for children with common conditions.Pediatrics.2007;120(2):267–274.
- ,,,,,.Variations in management of common inpatient pediatric illnesses: hospitalists and community pediatricians.Pediatrics.2006;118:441–447.
- ,,,,.Variation in pediatric hospitalists' use of unproven therapies: a study from the Pediatric Research in Inpatient Settings (PRIS) network.J Hosp Med.2008;3(4):292–298.
- ,,,.Characteristics of the pediatric hospitalist workforce: its roles and work environment.Pediatrics.2007;120(1):33–39.
- ,,,,.General pediatrics resident perspectives on training decisions and career choice.Pediatrics.2009;123(suppl 1):S26–S30.
- ,,,,.Recently trained general pediatricians: perspectives on residency training and scope of practice.Pediatrics.2009;123(suppl 1):S38–S43.
- ,,,.PRIS survey: pediatric hospitalist roles and training needs [abstract].Pediatr Res.2004(55):1.
- ,,.The Residency Review and Redesign in Pediatrics (R3P) Project: roots and branches.Pediatrics.2009;123(suppl 1):S8–S11.
Hospitalist Versus Traditional Systems
In the United States, general medical inpatient care is increasingly provided by hospital‐based physicians, also called hospitalists.1 The field of pediatrics is no exception, and by 2005 there were an estimated 1000 pediatric hospitalists in the workforce.2 Current numbers are likely to be greater than 2500, as the need for pediatric hospitalists has grown considerably.
At the same time, the quality of care delivered by the United States health system has come under increased scrutiny. In 2001, the Institute of Medicine, in its report on the quality of healthcare in America, concluded that between the care we have and what we could have lies not just a gap but a chasm.3 Meanwhile, the cost of healthcare delivery continues to increase. The pressure to deliver cost‐effective, high quality care is among the more important forces driving the proliferation of hospitalists.4
Over the last decade, data supporting the role of hospitalists in improving quality of care for adult patients has continued to accumulate.58 A 2007 retrospective cohort study by Lindenaur et al.7 included nearly 77,000 adult patients and found small reductions in length of stay without adverse effects on mortality or readmission rates, and a 2009 systematic review by Peterson6 included 33 studies and concluded that in general inpatient care of general medical patients by hospitalist physicians leads to decreased hospital cost and length of stay. A 2002 study by Meltzer et al.8 is also interesting, suggesting that improvements in costs and short‐term mortality are related to the disease‐specific experience of hospitalists.
Similar data for pediatric hospitalists has been slower to emerge. A systematic review of the literature by Landrigan et al., which included studies through 2004, concluded that [R]esearch suggests that pediatric hospitalists decrease costs and length of stay . The quality of care in pediatric hospitalist systems is unclear, because rigorous metrics to evaluate quality are lacking.9 Since the publication of that review, there have been multiple studies which have sought to evaluate the quality of pediatric hospitalist systems. This review was undertaken to synthesize this new information, and to determine the effect of pediatric hospitalist systems on quality of care.
METHODS
A review of the available English language literature on the Medline database was undertaken in November of 2010 to answer the question, What are the differences in quality of care and outcomes of inpatient medical care provided by hospitalists versus non‐hospitalists in the pediatric population? Care metrics of interest were categorized according to the Society of Hospital Medicine's recommendations for measuring hospital performance.10
Search terms used (with additional medical subject headings [MeSH] terms in parenthesis) were hospital medicine (hospitalist), pediatrics (child health, child welfare), cost (cost and cost analysis), quality (quality indicators, healthcare), outcomes (outcome assessment, healthcare; outcomes and process assessment, healthcare); volume, patient satisfaction, length of stay, productivity (efficiency), provider satisfaction (attitude of health personnel, job satisfaction), mortality, and readmission rate (patient readmission). The citing articles search tool was used to identify other articles that potentially could meet criteria. Finally, references cited in the selected articles, as well as in excluded literature reviews, were searched for additional articles.
Articles were deemed eligible if they were published in a peer‐reviewed journal, if they had a comparative experimental design for hospitalists versus non‐hospitalists, and if they dealt exclusively with pediatric hospitalists. Noncomparative studies were excluded, as were studies that pertained to settings besides that of an inpatient pediatrics ward, such as pediatric intensive care units or emergency rooms. The search algorithm is diagrammed in Figure 1.
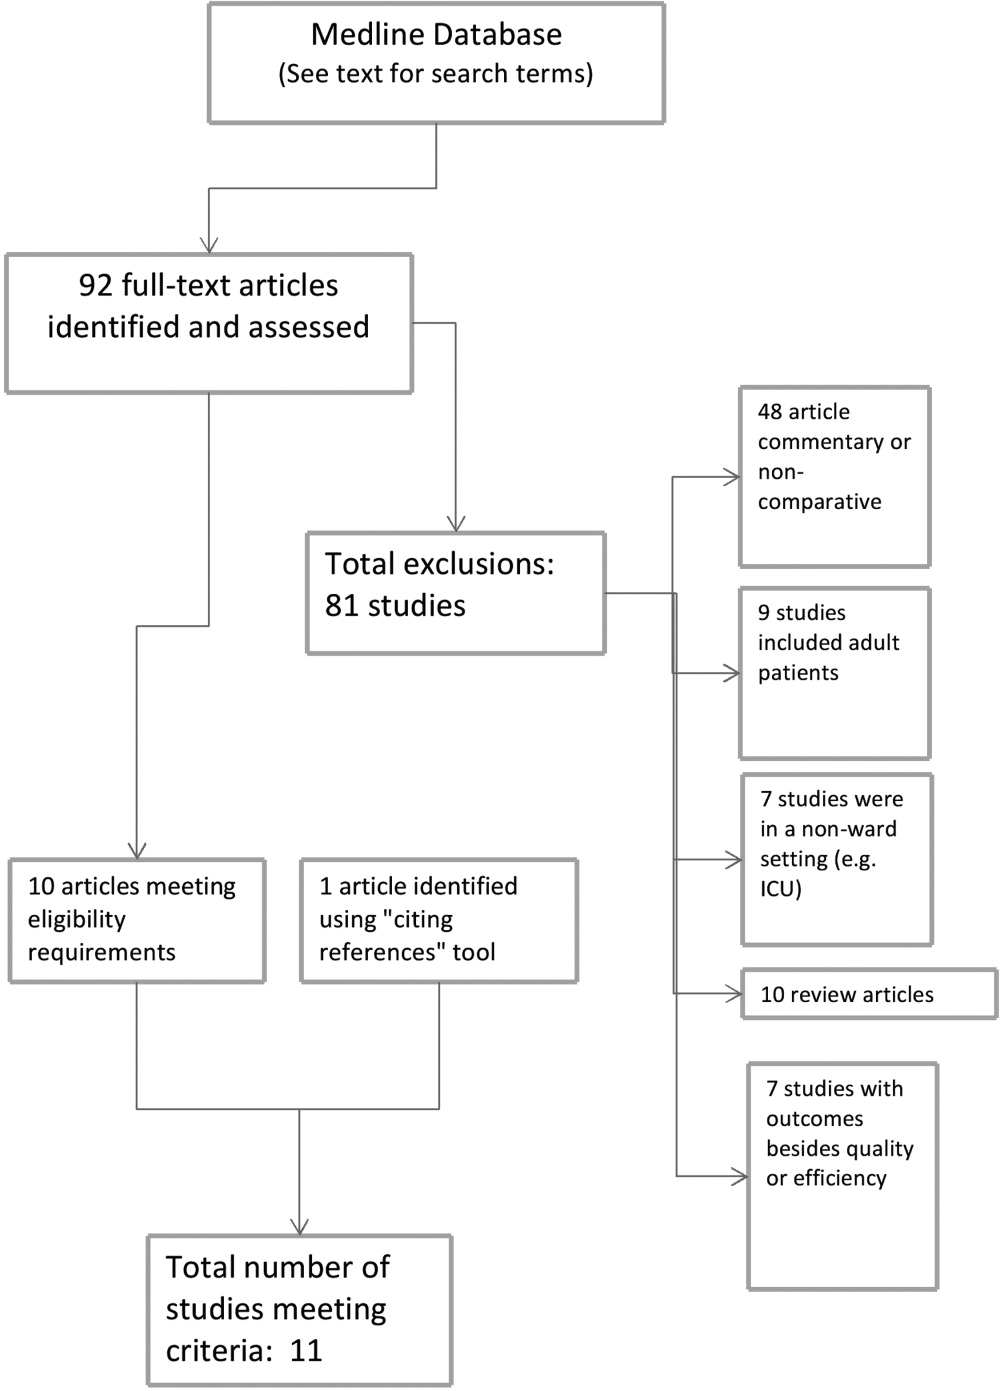
The selected articles were reviewed for the relevant outcome measures. The quality of each article was assessed using the Oxford Centre for Evidence‐Based Medicine levels of evidence,11 a widely accepted standard for critical analysis of studies. Levels of evidence are assigned to studies, from 1a (systematic reviews of randomized controlled trials) to 5 (expert opinion only). Well‐conducted prospective cohort studies receive a rating of 2c; those with wide confidence intervals due to small sample size receive a minus () modifier. This system does not specifically address survey studies, which were therefore not assigned a level of evidence.
RESULTS
The screening process yielded 92 possible relevant articles, which were then reviewed individually (by G.M.M.) by title and abstract. A total of 81 articles were excluded, including 48 studies that were either noncomparative or descriptive in nature. Ten of the identified articles were reviews and did not contain primary data. Nine studies were not restricted to the pediatric population. Also excluded were 7 studies that did not have outcomes related to quality (eg, billing performance), and 7 studies of hospitalists in settings besides general pediatric wards (eg, pediatric intensive care units). Ten studies were thus identified. The cited reference tool was used to identify an additional article which met criteria, yielding 11 total articles that were included in the review.
Five of the identified studies published prior to 2005 were previously reviewed by Landrigan et al.9 Since then, 6 additional studies of similar nature have been published and were included here. Articles that met criteria but appeared in an earlier review are included in Table 1; new articles appear in Table 2. The results of all 11 articles were included for this discussion.
| Source | Site | Study Design | Outcomes Measured (Oxford Level of Evidence) | Results for Hospitalists |
|---|---|---|---|---|
| ||||
| Bellet and Whitaker13 (2000) | Cincinnati Children's Hospital Medical Center, Cincinnati, OH | 1440 general pediatric patients | LOS, costs (2c) | LOS shorter (2.4 vs 2.7 days) |
| Retrospective cohort study | Readmission rate, subspecialty consultations, mortality (2c, low power) | Costs lower ($2720 vs $3002) | ||
| Readmissions higher for hospitalists (1% vs 3%) | ||||
| No differences in consultations | ||||
| No mortality in study | ||||
| Ogershok et al.16 (2001) | West Virginia University Children's Hospitals, Morgantown, WV | 2177 general pediatric patients | LOS, cost (2c) | No difference in LOS |
| Retrospective cohort study | Readmission rate, patient satisfaction, mortality (2c, low power) | Costs lower ($1238 vs $1421) | ||
| Lab and radiology tests ordered less often | ||||
| No difference in mortality or readmission rates | ||||
| No difference in satisfaction scores | ||||
| Wells et al.15 (2001) | Valley Children's Hospital, Madera, CA | 182 general pediatric patients | LOS, cost, patient satisfaction, follow‐up rate (2c, low power) | LOS shorter (45.2 vs 66.8 hr; P = 0.01) |
| Prospective cohort study | No LOS or cost benefit for patients with bronchiolitis, gastroenteritis, or pneumonia | |||
| Costs lower ($2701 vs $4854; P = 0.005) for patients with asthma | ||||
| No difference in outpatient follow‐up rate | ||||
| Landrigan et al.14 (2002) | Boston Children's Hospital, Boston, MA | 17,873 general pediatric patients | LOS, cost (2c) | LOS shorter (2.2 vs 2.5 days) |
| Retrospective cohort study | Readmission rate, follow‐up rate, mortality (2c, low power) | Costs lower ($1139 vs $1356) | ||
| No difference in follow‐up rate | ||||
| No mortality in study | ||||
| Dwight et al.12 (2004) | Hospital for Sick Children, Toronto, Ontario, Canada | 3807 general pediatric patients | LOS (2c) | LOS shorter (from 2.9 to 2.5 days; P = 0.04) |
| Retrospective cohort study | Subspecialty consultations, readmission rate, mortality (2c, low power) | No difference in readmission rates | ||
| No difference in mortality | ||||
| Source | Site | Study Design | Outcomes Measured (Oxford Level of Evidence) | Results for Hospitalists |
|---|---|---|---|---|
| ||||
| Boyd et al.21 (2006) | St Joseph's Hospital and Medical Center, Phoenix, AZ | 1009 patients with 11 most common DRGs (3 groups) | Cost, LOS, and readmission rate (2c, low power) | LOS longer (2.6 2.0 vs 3.1 2.6 vs 2.9 2.3, mean SD) |
| Retrospective cohort study | Costs higher ($1781 $1449 (faculty) vs $1954 $1212 (hospitalist group 1) vs $1964 $1495 (hospitalist group 2) | |||
| No difference in readmission rates | ||||
| Conway et al.22 (2006) | National provider survey | 213 hospitalists and 352 community pediatrician survey responses | Self‐reported evidence‐based medicine use (descriptive study, no assignable level) | Hospitalists more likely to follow EBG for following: VCUG and RUS after first UTI, albuterol and ipratropium in first 24 hr for asthma |
| Descriptive study | Hospitalists less likely to use the following unproven therapies: levalbuterol and inhaled or oral steroids for bronchiolitis, stool culture or rotavirus testing for gastroenteritis, or ipratropium after 24 hr for asthma | |||
| Srivastava et al.17 (2007) | University of Utah Health Sciences Center, Salt Lake City, UT | 1970 patients with asthma, dehydration, or viral illness | LOS, cost (2c, no confidence intervals reported) | LOS shorter for asthma (0.23 days, 13%) and for dehydration (0.19 days, 11%) |
| Retrospective cohort study | No LOS difference for patients with viral illness | |||
| Costs lower for asthma ($105.51, 9.3%) and for dehydration ($86.22, 7.8%) | ||||
| Simon et al.19 (2007) | Children's Hospital of Denver, Denver, CO | 759 patients undergoing spinal fusion before and after availability of hospitalist consultation | LOS (4, unaccounted confounding factors) | LOS shorter, 6.5 (6.26.7) days to 4.8 (4.55.1) |
| Retrospective cohort study | ||||
| Bekmezian et al.18 (2008) | UCLA Hospital and Medical Center, Los Angeles, CA | 925 subspecialty patients on GI and Heme/Onc services vs hospitalist service | LOS, cost, readmission rate, mortality (2c, low power) | LOS shorter (38%, P < 0.01) |
| Retrospective cohort study | Cost lower (29%, P < 0.05) | |||
| Readmissions lower (36 for faculty vs none for hospitalists, P = 0.02) | ||||
| No difference in mortality | ||||
| Conway and Keren20 (2009) | Multicenter, 25 children's hospitals | 20,892 patients identified with UTI admissions in PHIS database | LOS, cost, evidence‐based medicine use (2c) | No difference in LOS |
| Retrospective cohort study | No difference in cost | |||
| No difference in performance of EBM guideline (VCUG and RUS for first UTI) | ||||
Effect on Length of Stay, Cost, and Resource Utilization
Ten articles addressed length of stay as an outcome measure, and 8 included cost as well. Five have been previously reported9 (see Table 1). Of these, Dwight et al.,12, Bellet and Whitaker,13 and Landrigan et al.14 found decreased length of stay (LOS) and cost for all patients. Wells et al.15 found significantly decreased LOS and cost for asthma patients but not for all diagnoses taken together, and Ogershok et al.16 found lower hospital costs but not length of stay. Five of the 6 new studies, listed in Table 2, reported on length of stay and cost. Three showed some benefits for length of stay: Srivastava et al.17 reported improvement in length of stay and cost for asthma and dehydration, but not for all diagnoses together; Bekmezian et al.18 reported improved length of stay and cost for pediatric hospitalists for patients on a hematology and gastroenterology service; and Simon et al.19 attributes a generalized decrease in length of stay on a surgical service to implementation of hospitalist comanagement of their most complex patients, though hospitalists only comanaged 12% of the patients in the study. A multicentered study in 2009 by Conway and Keren20 reported no significant difference in length of stay for general pediatric patients with urinary tract infections.
Of the 4 total studies that showed significant advantage in length of stay for hospitalist groups, improvement ranged from 11% to 38%. All attempted to adjust for diagnosis and severity using diagnosis‐related groups (DRGs) or other methods. Dwight et al.,12 Bellet and Whitaker,13 and Bekmezian et al.18 used retrospective or historical comparison alone, while Landrigan et al.14 had both concurrent and historical comparison groups.
In contrast to the other studies, Boyd et al.21 in 2006 found significant advantages, in both length of stay and cost, for a faculty/resident service in comparison to a hospitalist service. This nonrandomized, retrospective cohort study included 1009 pediatric patients, with the 11 most common DRGs, admitted during the same time period to either a traditional faculty/resident team or 1 of 2 private practice hospitalist groups at an academic medical center. The 8 general pediatric faculty practice attendings were dedicated to inpatient care while on service, and rotated bimonthly. The authors found that the faculty group patients had significantly shorter lengths of stay and total direct patient costs.
Cost‐comparison results were reported by 7 of the studies. Bellet and Whitaker,13 Landrigan et al.,14 Ogershok et al.,16 and Bekmezian et al.18 reported reductions in cost for all patients varying from 9% to 29%, while Wells et al.15 and Srivastava et al.17 found reductions in cost only for patients with certain diagnoses. Srivastava et al.17 analyzed 1970 patients, admitted with primary diagnoses of asthma, dehydration, or viral illness, over a 5‐year period from 1993 to 1997. Cost‐per‐patient was reduced between 9.3% for asthma and 7.8% for dehydrations, but when combined with the viral illness group, the difference was not statistically significant. Wells et al.15 studied 182 admissions over a 1‐year period, and found significant reductions in cost of 44% (P < 0.005) for patients with asthma but not for bronchiolitis, gastroenteritis, or pneumonia. In 2009, Conway and Keren20 studied a multicentered cohort of 20,892 children hospitalized for urinary tract infection, and found no significant difference in hospitalization costs between hospitalist services and more traditional models.
Other Quality Measures
Though financial outcomes (length of stay, cost, and resource utilization) were the primary area of emphasis for most of the selected articles, other parameters with more of a focus on quality were examined as well. The studies by Dwight et al.,12 Bellet and Whitaker,13 Landrigan et al.,14 Ogershok et al.,16 Bekmezian et al.,18 and Boyd et al.21 examined mortality and readmission rate. None of these studies reported differences in mortality rate, though none were powered to do so. When studying readmission rate, Bellet and Whitaker13 reported a statistically significant lower rate of readmission for a traditionally staffed service versus the hospitalist service (1% vs 3%; P = 0.006). In contrast, Bekmezian et al.18 found a lower readmission rate for the hospitalist service (4.4% vs 0%; P = 0.02). The studies by Dwight et al.,12 Landrigan et al.,14 Ogershok et al.,16 and Boyd et al.21 did not detect differences in readmission rates.
Two studies measured patient satisfaction.15, 16 Ogershok et al.16 utilized hospital‐generated patient satisfaction surveys, completed at discharge, for comparison and found no differences between the hospitalist and non‐hospitalist ward services. Wells et al.15 utilized a standardized patient satisfaction assessment tool, given at discharge, followed by a telephone interview after 1 month. At discharge, parents rated hospitalist physicians higher in courtesy (P < 0.05) and friendliness (P < 0.005), though this difference was not detected in the telephone interviews 1 month later. However, at that time, parents did indicate that they received better explanations about their child's illness if their child was seen by their primary care physician rather than a hospitalist.
In 2006, a study by Conway et al.22 reported on the use of evidence‐based therapies and tests by hospitalists as compared to community pediatricians. The survey identified evidence‐based therapies and tests for asthma, bronchiolitis, gastroenteritis, and first‐time urinary tract infection (UTI) diagnosis. A total of 213 hospitalists and 228 community pediatricians met the inclusion criteria by returning the completed survey. After multivariate regression analysis, hospitalists were found to be more likely to use 4 of 5 evidence‐based therapies and recommended tests, and were less likely to use 6 of 7 therapies and tests of unproven benefit. In 2009, Conway and Clancy23 again studied the use of evidence‐based therapies, this time using more objective measures. In this report, the Pediatric Health Information System (PHIS) was examined for a cohort of 20,892 patients. After multivariable regression analysis, there was no statistical difference in the performance of evidence‐based imaging following a first UTI between hospitals staffed primarily by community pediatricians versus those with pediatric hospitalist systems. However, it should be noted that the evidence base for UTI‐related imaging has been debated in the literature over the past decade.
DISCUSSION
Of the 11 studies selected for this review, 10 measured length of stay as an outcome, with the majority favoring hospitalists but with mixed results. Three of these studies, those by Dwight et al.,12 Bellet and Whitaker,13 and Landrigan et al.,14 demonstrated 11% to 14% improvement for hospitalist services compared to community pediatricians. Boyd et al.,21 however, found exactly the opposite result, and 2 studies by Conway and Keren20 and Ogershok et al.16 found no difference in length of stay. Two more studies found benefits restricted to certain conditions: Wells et al.15 found 32% shorter lengths of stay for asthma, but not for other conditions; Srivastava et al.17 found a 13% reduction in length of stay for asthma and 11% for dehydration, but none for viral illnesses or when all conditions were combined. Bekmezian et al.18 found shorter lengths of stay on a hospitalist service for hematology and gastroenterology patients, and Simon et al.19 attribute a general trend of decreasing lengths of stay on a surgical service to the implementation of hospital comanagement for a small percentage of patients.
The most common quality measures studied were patient satisfaction, readmission rates, and mortality. Only 1 study by Ogershok et al.16 reported on patient satisfaction and found few differences between hospitalists and community pediatricians. Readmission rate were reported by 6 studies. Bellet and Whitaker13 found a higher readmission rate for pediatric hospitalists, Bekmezian et al.18 found a lower rate but on a subspecialty service. The study with the greatest power for this analysis, by Landrigan et al.14 with nearly 18,000 patients, found no difference, and neither did another 3 studies. Unsurprisingly, no study detected differences in mortality; it would be extremely difficult to adequately power a study to do so in the general pediatric setting, where mortality is rare.
The effect of relative experience of hospitalist physicians is uncertain. Boyd et al.21 speculated that 1 possible cause for the decreased lengths of stay and costs associated with their faculty group compared to hospitalists may have been due to the increased experience of the faculty group. Unfortunately, they were unable to generate statistical significance due to the small numbers of physicians in the study. In contrast, the hospitalists in the report by Dwight et al.12 had decreased lengths of stay but were less experienced. In the adult literature, the study by Meltzer et al.8 suggests that improved outcomes from hospitalist systems may not become apparent for 1 or more years after implementation, but none of the pediatric studies included in our review specifically address this issue. This leaves the possibility open that the hospitalist systems evaluated in some studies had insufficient time in which to develop increased efficiencies.
There were several limitations to our studies. First, due to the heterogeneity and methodological variations among the included studies, we were unable to perform a meta‐analysis. Second, the overall quality of evidence is limited due to the lack of randomized control trials. Third, a lack of agreement on appropriate quality markers has limited the study of quality of care. Published reports continue to focus on financial measures, such as length of stay, despite the recommendation in the previous review by Landrigan et al.9 that such studies would be of limited value. Finally, the current variability of hospitalist models and lack of study of factors that might influence outcomes makes comparisons difficult.
Despite these limitations, several interesting trends emerge from these studies. One such trend is that the more recent studies highlight that simple classification of hospitalist system versus traditional system fails to measure the complexity and nuance of care delivery. The 2006 study by Boyd et al.21 is especially notable because it showed the opposite effect of previous studies, namely, an increase in length of stay and costs for hospitalists at St Joseph's Medical Center in Phoenix, Arizona. In this study, the traditional faculty group was employed by the hospital, and the hospitalist group was a private practice model. The authors suggest that their faculty physicians were therefore operating like hospitalists in that almost all of their time was focused on inpatient care while they were on service. They also had a limited number of general pediatricians, who attended in the inpatient setting, who were more experienced than the private practice groups. Also, the authors theorize that their faculty may have had a closer working relationship with their residents due to additional service responsibilities and locations of the faculty group onsite. Further study of the care models utilized by faculty and hospitalist practices at St Joseph's and other hospitals may reveal important insights about improving the quality and efficiency of inpatient pediatric care in general.
Though there is a clear trend in the adult literature indicating that the use of hospitalists results in superior quality of care, there is less evidence for pediatric systems. The aforementioned previous review by Landrigan et al.9, in 2006 concluded that emerging research suggests that pediatric hospitalist systems decrease cost and length of stay, but also the quality of care in pediatric hospitalist systems is unclear, because rigorous metrics to evaluate quality are lacking. Data from the 6 additional studies presented here lend limited support to the first hypothesis, and the presence of only 1 negative study is not sufficient to undermine it.
While data on quality markers such as readmission rate or mortality remain elusive, the 2 studies by Conway et al.20, 22 attempt to evaluate quality by comparing the use of evidence‐based therapies by hospitalists and community pediatricians. Though the use of objective PHIS data for UTI in 2009 did not confirm the conclusion suggested by the 2006 provider survey study, the attempt to find measurable outcomes such as the use of evidence‐based therapies is a start but we need more metrics, including rigorous patient outcome metrics, to define the quality of our care systems. Before the effect of hospitalist systems on quality is fully understood, more work will need to be done defining metrics for comparison.
Unfortunately, over 5 years since the previous review by Landrigan et al.9 called for increased focus on inpatient quality and understanding how to improve, the sophistication of our measurement of pediatric inpatient quality and understanding of the mechanisms underlying improvement is still in its infancy. We propose a solution at multiple levels.
First, the investment in research comparing system‐level interventions (eg, discharge process A vs discharge process B) must be increased. This investment increased significantly due to the over $1 billion in Recovery Act funding for comparative effectiveness research.23 However, the future investment in comparative effectiveness research, often called patient‐centered outcomes research, and proportion of investment focused on delivery system interventions is unclear. We propose that the investment in comparing delivery system interventions is essential to improving not only hospital medicine systems, but, more importantly, the healthcare system broadly. In addition, research investment needs to focus on reliably implementing proven interventions in systems of care, and evaluating both the effects on patient outcomes and cost, and the contextual factors associated with successful implementation.24 A hospital medicine example would be the comparison of the implementation of a guideline for a common disease across a set of hospitals. One could perform a prospective observational design, in which one compares high intensity versus low intensity intervention and assesses the baseline characteristics of the hospital systems, to understand their association with successful implementation and, ultimately, patient outcomes. One could also perform a clustered randomized design.
Second, the development and implementation of pediatric quality of care measures, including in the inpatient setting, needs to increase rapidly. The Children's Health Insurance Program (CHIP) and its focus on an initial core set of quality measures that expands over time, through an investment in measure development and validation, is an opportunity for pediatric hospital medicine. Inpatient measures should be a focus of measure development and implementation. We must move beyond a limited set of inpatient measures to a broader set focused on issues such as patient safety, hospital‐acquired infections, outcomes for common illnesses, and transitions of care. We also need better measures for important pediatric populations, such as children with complex medical conditions.25
Third, our understanding of the mechanisms leading to improvement in hospital medicine systems needs to be developed. Studies of hospital medicine systems should move past simple binary comparisons of hospitalist systems versus traditional systems to understand the effect on patient outcomes and cost of factors such as years of experience, volume of patients seen overall and with a specific condition, staffing model, training, quality improvement knowledge and application, and health information systems. These factors may be additive or multiplicative to the performance of inpatient systems once put into place, but these hypotheses need to be tested.
Fourth, individual hospitalists and their groups must focus on quality measurement and improvement in quality and value delivered. At Cincinnati, we have a portfolio of quality and value projects derived from our strategic objectives, illustrated in Figure 2. The projects have leaders and teams to drive improvement and measure results. Increasingly, we are able to publish these results in peer‐reviewed journals. On a quarterly basis, we review the portfolio via a dashboard and/or run and control charts. We establish new projects and set new goals on at least an annual basis. It is important to note that at the beginning of the 2010‐2011 fiscal year, almost all initiatives identified as priorities were yellow or red. Our group is now planning new initiatives and goals for next year. This is one method applicable to our setting, but a focus on quality and value and measuring results needs to be part of every hospital medicine program. As payer focus on value increases, this will be essential to demonstrate how a hospitalist group improves outcomes and adds value.
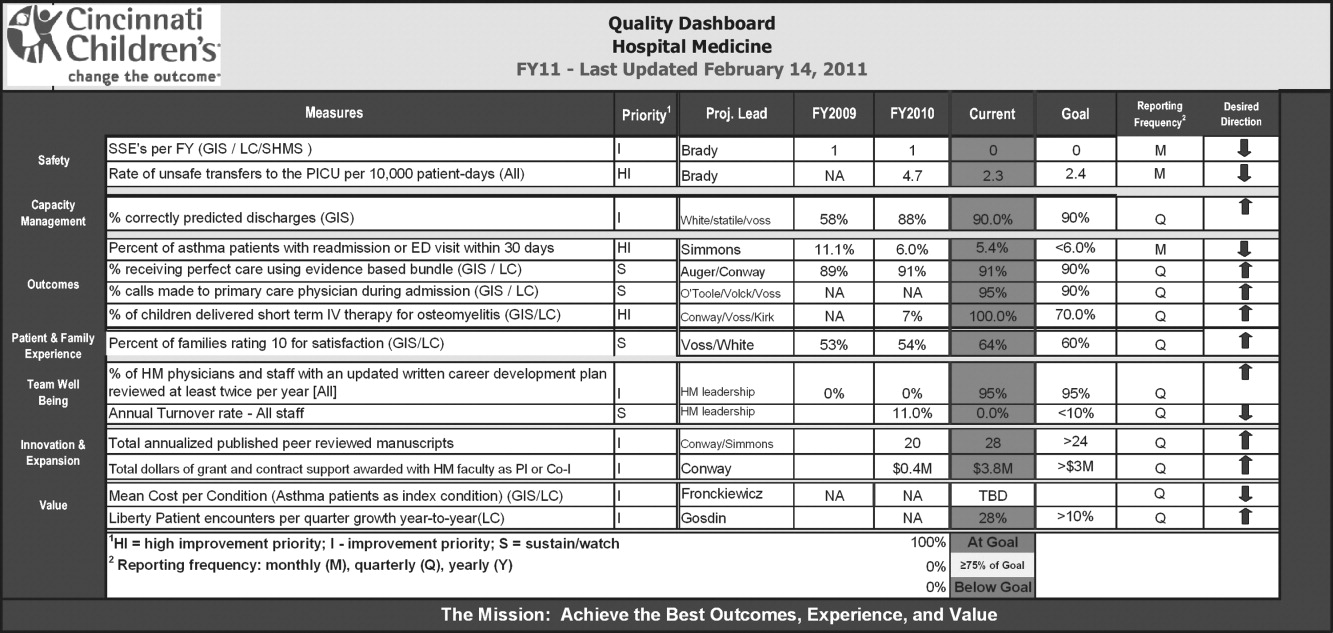
CONCLUSION
This review suggests that the use of hospitalists can improve the quality of inpatient care in the pediatric population, but this is not a universal finding and, most importantly, the mechanisms of improvement are poorly understood. We propose 4 components to address these issues so that a systematic review 5 years from now would be much more robust. These are: 1) increased investment in research comparing system‐level interventions and reliable implementation; 2) further development and implementation of pediatric quality of care measures in the inpatient setting; 3) understanding the mechanisms and factors leading to improvement in hospital medicine systems; and 4) an increased focus on quality measurement, and improvement in quality and value delivered by all individual hospitalists and their groups.
- ,.The emerging role of “hospitalists” in the American health care system.N Engl J Med.1996;335(7):514–517.
- ,,, et al.Pediatric hospitalists: report of a leadership conference.Pediatrics.2006;117(4):1122–1130.
- Institute of Medicine.Crossing the Quality Chasm: A New Health System for the 21st Century.Washington, DC:National Academy Press;2001.
- ,.The hospitalist movement 5 years later.JAMA.2002;287(4):487–494.
- ,.The impact of hospitalists on the cost and quality of inpatient care in the United States: a research synthesis.Med Care Res Rev.2005;62(4):379–406.
- .A systematic review of outcomes and quality measures in adult patients cared for by hospitalists vs nonhospitalists.Mayo Clin Proc.2009;84(3):248–254.
- ,,,,,.Outcomes of care by hospitalists, general internists, and family physicians.N Engl J Med.2007;375(25):2589–2600.
- ,,, et al.Effects of physician experience on costs and outcomes on an academic general medicine service: results of a trial of hospitalists.Ann Intern Med.2002;137(11):866–875.
- ,,,.Pediatric hospitalists: a systematic review of the literature.Pediatrics.2006;117(5):1736–1744.
- Society of Hospital Medicine. Measuring hospitalist performance: metrics, reports, and dashboards. Available at: http://www.hospitalmedicine.org/AM/Template.cfm?Section=Publications; April2007.
- Oxford Centre for Evidence‐Based Medicine levels of evidence. Updated March 2009. Available at: http://www.cebm.net/index.aspx?o=1025. Accessed March 14,2011.
- ,,,.Evaluation of a staff‐only hospitalist system in a tertiary care, academic children's hospital.Pediatrics.2004;114(6):1545–1549.
- ,.Evaluation of a pediatric hospitalist service: impact on length of stay and hospital charges.Pediatrics.2000;105(3 pt 1):478–484.
- ,,, et al.Impact of a health maintenance organization hospitalist system in academic pediatrics.Pediatrics.2002;110(4):720–728.
- ,,.Pediatric hospitalists: quality care for the underserved?Am J Med Qual.2001;16(5):174–180.
- ,,,,,.Restructuring an academic pediatric inpatient service using concepts developed by hospitalists.Clin Pediatr (Phila).2001;40(12):653–662.
- ,,, et al.Impact of a hospitalist system on length of stay and cost for children with common conditions.Pediatrics.2007;120(2):267–274.
- ,,.Staff‐only pediatric hospitalist care of patients with medically complex subspecialty conditions in a major teaching hospital.Arch Pediatr Adolesc Med.2008;162(10):975–980.
- ,,,,,.Pediatric hospitalist comanagement of spinal fusion surgery patients.J Hosp Med.2007;2(1):23–30.
- ,.Factors associated with variability in outcomes for children hospitalized with urinary tract infection.J Pediatr.2009;154(6):789–796.
- ,,,,.Comparison of outcome measures for a traditional pediatric faculty service and nonfaculty hospitalist services in a community teaching hospital.Pediatrics.2006;118(4):1327–1331.
- ,,,,,.Variations in management of common inpatient pediatric illnesses: hospitalists and community pediatricians.Pediatrics.2006;118(2):441–447.
- ,.Comparative‐effectiveness research—implications of the federal coordinating council's report.N Engl J Med.2009;361(4):328–330.
- ,.Charting a path from comparative effectiveness funding to improved patient‐centered health care.JAMA.2010;303(10):985–986.
- ,,, et al.Children with medical complexity: an emerging population for clinical and research initiatives.Pediatrics.2011;127(3):529–538.
In the United States, general medical inpatient care is increasingly provided by hospital‐based physicians, also called hospitalists.1 The field of pediatrics is no exception, and by 2005 there were an estimated 1000 pediatric hospitalists in the workforce.2 Current numbers are likely to be greater than 2500, as the need for pediatric hospitalists has grown considerably.
At the same time, the quality of care delivered by the United States health system has come under increased scrutiny. In 2001, the Institute of Medicine, in its report on the quality of healthcare in America, concluded that between the care we have and what we could have lies not just a gap but a chasm.3 Meanwhile, the cost of healthcare delivery continues to increase. The pressure to deliver cost‐effective, high quality care is among the more important forces driving the proliferation of hospitalists.4
Over the last decade, data supporting the role of hospitalists in improving quality of care for adult patients has continued to accumulate.58 A 2007 retrospective cohort study by Lindenaur et al.7 included nearly 77,000 adult patients and found small reductions in length of stay without adverse effects on mortality or readmission rates, and a 2009 systematic review by Peterson6 included 33 studies and concluded that in general inpatient care of general medical patients by hospitalist physicians leads to decreased hospital cost and length of stay. A 2002 study by Meltzer et al.8 is also interesting, suggesting that improvements in costs and short‐term mortality are related to the disease‐specific experience of hospitalists.
Similar data for pediatric hospitalists has been slower to emerge. A systematic review of the literature by Landrigan et al., which included studies through 2004, concluded that [R]esearch suggests that pediatric hospitalists decrease costs and length of stay . The quality of care in pediatric hospitalist systems is unclear, because rigorous metrics to evaluate quality are lacking.9 Since the publication of that review, there have been multiple studies which have sought to evaluate the quality of pediatric hospitalist systems. This review was undertaken to synthesize this new information, and to determine the effect of pediatric hospitalist systems on quality of care.
METHODS
A review of the available English language literature on the Medline database was undertaken in November of 2010 to answer the question, What are the differences in quality of care and outcomes of inpatient medical care provided by hospitalists versus non‐hospitalists in the pediatric population? Care metrics of interest were categorized according to the Society of Hospital Medicine's recommendations for measuring hospital performance.10
Search terms used (with additional medical subject headings [MeSH] terms in parenthesis) were hospital medicine (hospitalist), pediatrics (child health, child welfare), cost (cost and cost analysis), quality (quality indicators, healthcare), outcomes (outcome assessment, healthcare; outcomes and process assessment, healthcare); volume, patient satisfaction, length of stay, productivity (efficiency), provider satisfaction (attitude of health personnel, job satisfaction), mortality, and readmission rate (patient readmission). The citing articles search tool was used to identify other articles that potentially could meet criteria. Finally, references cited in the selected articles, as well as in excluded literature reviews, were searched for additional articles.
Articles were deemed eligible if they were published in a peer‐reviewed journal, if they had a comparative experimental design for hospitalists versus non‐hospitalists, and if they dealt exclusively with pediatric hospitalists. Noncomparative studies were excluded, as were studies that pertained to settings besides that of an inpatient pediatrics ward, such as pediatric intensive care units or emergency rooms. The search algorithm is diagrammed in Figure 1.
The selected articles were reviewed for the relevant outcome measures. The quality of each article was assessed using the Oxford Centre for Evidence‐Based Medicine levels of evidence,11 a widely accepted standard for critical analysis of studies. Levels of evidence are assigned to studies, from 1a (systematic reviews of randomized controlled trials) to 5 (expert opinion only). Well‐conducted prospective cohort studies receive a rating of 2c; those with wide confidence intervals due to small sample size receive a minus () modifier. This system does not specifically address survey studies, which were therefore not assigned a level of evidence.
RESULTS
The screening process yielded 92 possible relevant articles, which were then reviewed individually (by G.M.M.) by title and abstract. A total of 81 articles were excluded, including 48 studies that were either noncomparative or descriptive in nature. Ten of the identified articles were reviews and did not contain primary data. Nine studies were not restricted to the pediatric population. Also excluded were 7 studies that did not have outcomes related to quality (eg, billing performance), and 7 studies of hospitalists in settings besides general pediatric wards (eg, pediatric intensive care units). Ten studies were thus identified. The cited reference tool was used to identify an additional article which met criteria, yielding 11 total articles that were included in the review.
Five of the identified studies published prior to 2005 were previously reviewed by Landrigan et al.9 Since then, 6 additional studies of similar nature have been published and were included here. Articles that met criteria but appeared in an earlier review are included in Table 1; new articles appear in Table 2. The results of all 11 articles were included for this discussion.
| Source | Site | Study Design | Outcomes Measured (Oxford Level of Evidence) | Results for Hospitalists |
|---|---|---|---|---|
| ||||
| Bellet and Whitaker13 (2000) | Cincinnati Children's Hospital Medical Center, Cincinnati, OH | 1440 general pediatric patients | LOS, costs (2c) | LOS shorter (2.4 vs 2.7 days) |
| Retrospective cohort study | Readmission rate, subspecialty consultations, mortality (2c, low power) | Costs lower ($2720 vs $3002) | ||
| Readmissions higher for hospitalists (1% vs 3%) | ||||
| No differences in consultations | ||||
| No mortality in study | ||||
| Ogershok et al.16 (2001) | West Virginia University Children's Hospitals, Morgantown, WV | 2177 general pediatric patients | LOS, cost (2c) | No difference in LOS |
| Retrospective cohort study | Readmission rate, patient satisfaction, mortality (2c, low power) | Costs lower ($1238 vs $1421) | ||
| Lab and radiology tests ordered less often | ||||
| No difference in mortality or readmission rates | ||||
| No difference in satisfaction scores | ||||
| Wells et al.15 (2001) | Valley Children's Hospital, Madera, CA | 182 general pediatric patients | LOS, cost, patient satisfaction, follow‐up rate (2c, low power) | LOS shorter (45.2 vs 66.8 hr; P = 0.01) |
| Prospective cohort study | No LOS or cost benefit for patients with bronchiolitis, gastroenteritis, or pneumonia | |||
| Costs lower ($2701 vs $4854; P = 0.005) for patients with asthma | ||||
| No difference in outpatient follow‐up rate | ||||
| Landrigan et al.14 (2002) | Boston Children's Hospital, Boston, MA | 17,873 general pediatric patients | LOS, cost (2c) | LOS shorter (2.2 vs 2.5 days) |
| Retrospective cohort study | Readmission rate, follow‐up rate, mortality (2c, low power) | Costs lower ($1139 vs $1356) | ||
| No difference in follow‐up rate | ||||
| No mortality in study | ||||
| Dwight et al.12 (2004) | Hospital for Sick Children, Toronto, Ontario, Canada | 3807 general pediatric patients | LOS (2c) | LOS shorter (from 2.9 to 2.5 days; P = 0.04) |
| Retrospective cohort study | Subspecialty consultations, readmission rate, mortality (2c, low power) | No difference in readmission rates | ||
| No difference in mortality | ||||
| Source | Site | Study Design | Outcomes Measured (Oxford Level of Evidence) | Results for Hospitalists |
|---|---|---|---|---|
| ||||
| Boyd et al.21 (2006) | St Joseph's Hospital and Medical Center, Phoenix, AZ | 1009 patients with 11 most common DRGs (3 groups) | Cost, LOS, and readmission rate (2c, low power) | LOS longer (2.6 2.0 vs 3.1 2.6 vs 2.9 2.3, mean SD) |
| Retrospective cohort study | Costs higher ($1781 $1449 (faculty) vs $1954 $1212 (hospitalist group 1) vs $1964 $1495 (hospitalist group 2) | |||
| No difference in readmission rates | ||||
| Conway et al.22 (2006) | National provider survey | 213 hospitalists and 352 community pediatrician survey responses | Self‐reported evidence‐based medicine use (descriptive study, no assignable level) | Hospitalists more likely to follow EBG for following: VCUG and RUS after first UTI, albuterol and ipratropium in first 24 hr for asthma |
| Descriptive study | Hospitalists less likely to use the following unproven therapies: levalbuterol and inhaled or oral steroids for bronchiolitis, stool culture or rotavirus testing for gastroenteritis, or ipratropium after 24 hr for asthma | |||
| Srivastava et al.17 (2007) | University of Utah Health Sciences Center, Salt Lake City, UT | 1970 patients with asthma, dehydration, or viral illness | LOS, cost (2c, no confidence intervals reported) | LOS shorter for asthma (0.23 days, 13%) and for dehydration (0.19 days, 11%) |
| Retrospective cohort study | No LOS difference for patients with viral illness | |||
| Costs lower for asthma ($105.51, 9.3%) and for dehydration ($86.22, 7.8%) | ||||
| Simon et al.19 (2007) | Children's Hospital of Denver, Denver, CO | 759 patients undergoing spinal fusion before and after availability of hospitalist consultation | LOS (4, unaccounted confounding factors) | LOS shorter, 6.5 (6.26.7) days to 4.8 (4.55.1) |
| Retrospective cohort study | ||||
| Bekmezian et al.18 (2008) | UCLA Hospital and Medical Center, Los Angeles, CA | 925 subspecialty patients on GI and Heme/Onc services vs hospitalist service | LOS, cost, readmission rate, mortality (2c, low power) | LOS shorter (38%, P < 0.01) |
| Retrospective cohort study | Cost lower (29%, P < 0.05) | |||
| Readmissions lower (36 for faculty vs none for hospitalists, P = 0.02) | ||||
| No difference in mortality | ||||
| Conway and Keren20 (2009) | Multicenter, 25 children's hospitals | 20,892 patients identified with UTI admissions in PHIS database | LOS, cost, evidence‐based medicine use (2c) | No difference in LOS |
| Retrospective cohort study | No difference in cost | |||
| No difference in performance of EBM guideline (VCUG and RUS for first UTI) | ||||
Effect on Length of Stay, Cost, and Resource Utilization
Ten articles addressed length of stay as an outcome measure, and 8 included cost as well. Five have been previously reported9 (see Table 1). Of these, Dwight et al.,12, Bellet and Whitaker,13 and Landrigan et al.14 found decreased length of stay (LOS) and cost for all patients. Wells et al.15 found significantly decreased LOS and cost for asthma patients but not for all diagnoses taken together, and Ogershok et al.16 found lower hospital costs but not length of stay. Five of the 6 new studies, listed in Table 2, reported on length of stay and cost. Three showed some benefits for length of stay: Srivastava et al.17 reported improvement in length of stay and cost for asthma and dehydration, but not for all diagnoses together; Bekmezian et al.18 reported improved length of stay and cost for pediatric hospitalists for patients on a hematology and gastroenterology service; and Simon et al.19 attributes a generalized decrease in length of stay on a surgical service to implementation of hospitalist comanagement of their most complex patients, though hospitalists only comanaged 12% of the patients in the study. A multicentered study in 2009 by Conway and Keren20 reported no significant difference in length of stay for general pediatric patients with urinary tract infections.
Of the 4 total studies that showed significant advantage in length of stay for hospitalist groups, improvement ranged from 11% to 38%. All attempted to adjust for diagnosis and severity using diagnosis‐related groups (DRGs) or other methods. Dwight et al.,12 Bellet and Whitaker,13 and Bekmezian et al.18 used retrospective or historical comparison alone, while Landrigan et al.14 had both concurrent and historical comparison groups.
In contrast to the other studies, Boyd et al.21 in 2006 found significant advantages, in both length of stay and cost, for a faculty/resident service in comparison to a hospitalist service. This nonrandomized, retrospective cohort study included 1009 pediatric patients, with the 11 most common DRGs, admitted during the same time period to either a traditional faculty/resident team or 1 of 2 private practice hospitalist groups at an academic medical center. The 8 general pediatric faculty practice attendings were dedicated to inpatient care while on service, and rotated bimonthly. The authors found that the faculty group patients had significantly shorter lengths of stay and total direct patient costs.
Cost‐comparison results were reported by 7 of the studies. Bellet and Whitaker,13 Landrigan et al.,14 Ogershok et al.,16 and Bekmezian et al.18 reported reductions in cost for all patients varying from 9% to 29%, while Wells et al.15 and Srivastava et al.17 found reductions in cost only for patients with certain diagnoses. Srivastava et al.17 analyzed 1970 patients, admitted with primary diagnoses of asthma, dehydration, or viral illness, over a 5‐year period from 1993 to 1997. Cost‐per‐patient was reduced between 9.3% for asthma and 7.8% for dehydrations, but when combined with the viral illness group, the difference was not statistically significant. Wells et al.15 studied 182 admissions over a 1‐year period, and found significant reductions in cost of 44% (P < 0.005) for patients with asthma but not for bronchiolitis, gastroenteritis, or pneumonia. In 2009, Conway and Keren20 studied a multicentered cohort of 20,892 children hospitalized for urinary tract infection, and found no significant difference in hospitalization costs between hospitalist services and more traditional models.
Other Quality Measures
Though financial outcomes (length of stay, cost, and resource utilization) were the primary area of emphasis for most of the selected articles, other parameters with more of a focus on quality were examined as well. The studies by Dwight et al.,12 Bellet and Whitaker,13 Landrigan et al.,14 Ogershok et al.,16 Bekmezian et al.,18 and Boyd et al.21 examined mortality and readmission rate. None of these studies reported differences in mortality rate, though none were powered to do so. When studying readmission rate, Bellet and Whitaker13 reported a statistically significant lower rate of readmission for a traditionally staffed service versus the hospitalist service (1% vs 3%; P = 0.006). In contrast, Bekmezian et al.18 found a lower readmission rate for the hospitalist service (4.4% vs 0%; P = 0.02). The studies by Dwight et al.,12 Landrigan et al.,14 Ogershok et al.,16 and Boyd et al.21 did not detect differences in readmission rates.
Two studies measured patient satisfaction.15, 16 Ogershok et al.16 utilized hospital‐generated patient satisfaction surveys, completed at discharge, for comparison and found no differences between the hospitalist and non‐hospitalist ward services. Wells et al.15 utilized a standardized patient satisfaction assessment tool, given at discharge, followed by a telephone interview after 1 month. At discharge, parents rated hospitalist physicians higher in courtesy (P < 0.05) and friendliness (P < 0.005), though this difference was not detected in the telephone interviews 1 month later. However, at that time, parents did indicate that they received better explanations about their child's illness if their child was seen by their primary care physician rather than a hospitalist.
In 2006, a study by Conway et al.22 reported on the use of evidence‐based therapies and tests by hospitalists as compared to community pediatricians. The survey identified evidence‐based therapies and tests for asthma, bronchiolitis, gastroenteritis, and first‐time urinary tract infection (UTI) diagnosis. A total of 213 hospitalists and 228 community pediatricians met the inclusion criteria by returning the completed survey. After multivariate regression analysis, hospitalists were found to be more likely to use 4 of 5 evidence‐based therapies and recommended tests, and were less likely to use 6 of 7 therapies and tests of unproven benefit. In 2009, Conway and Clancy23 again studied the use of evidence‐based therapies, this time using more objective measures. In this report, the Pediatric Health Information System (PHIS) was examined for a cohort of 20,892 patients. After multivariable regression analysis, there was no statistical difference in the performance of evidence‐based imaging following a first UTI between hospitals staffed primarily by community pediatricians versus those with pediatric hospitalist systems. However, it should be noted that the evidence base for UTI‐related imaging has been debated in the literature over the past decade.
DISCUSSION
Of the 11 studies selected for this review, 10 measured length of stay as an outcome, with the majority favoring hospitalists but with mixed results. Three of these studies, those by Dwight et al.,12 Bellet and Whitaker,13 and Landrigan et al.,14 demonstrated 11% to 14% improvement for hospitalist services compared to community pediatricians. Boyd et al.,21 however, found exactly the opposite result, and 2 studies by Conway and Keren20 and Ogershok et al.16 found no difference in length of stay. Two more studies found benefits restricted to certain conditions: Wells et al.15 found 32% shorter lengths of stay for asthma, but not for other conditions; Srivastava et al.17 found a 13% reduction in length of stay for asthma and 11% for dehydration, but none for viral illnesses or when all conditions were combined. Bekmezian et al.18 found shorter lengths of stay on a hospitalist service for hematology and gastroenterology patients, and Simon et al.19 attribute a general trend of decreasing lengths of stay on a surgical service to the implementation of hospital comanagement for a small percentage of patients.
The most common quality measures studied were patient satisfaction, readmission rates, and mortality. Only 1 study by Ogershok et al.16 reported on patient satisfaction and found few differences between hospitalists and community pediatricians. Readmission rate were reported by 6 studies. Bellet and Whitaker13 found a higher readmission rate for pediatric hospitalists, Bekmezian et al.18 found a lower rate but on a subspecialty service. The study with the greatest power for this analysis, by Landrigan et al.14 with nearly 18,000 patients, found no difference, and neither did another 3 studies. Unsurprisingly, no study detected differences in mortality; it would be extremely difficult to adequately power a study to do so in the general pediatric setting, where mortality is rare.
The effect of relative experience of hospitalist physicians is uncertain. Boyd et al.21 speculated that 1 possible cause for the decreased lengths of stay and costs associated with their faculty group compared to hospitalists may have been due to the increased experience of the faculty group. Unfortunately, they were unable to generate statistical significance due to the small numbers of physicians in the study. In contrast, the hospitalists in the report by Dwight et al.12 had decreased lengths of stay but were less experienced. In the adult literature, the study by Meltzer et al.8 suggests that improved outcomes from hospitalist systems may not become apparent for 1 or more years after implementation, but none of the pediatric studies included in our review specifically address this issue. This leaves the possibility open that the hospitalist systems evaluated in some studies had insufficient time in which to develop increased efficiencies.
There were several limitations to our studies. First, due to the heterogeneity and methodological variations among the included studies, we were unable to perform a meta‐analysis. Second, the overall quality of evidence is limited due to the lack of randomized control trials. Third, a lack of agreement on appropriate quality markers has limited the study of quality of care. Published reports continue to focus on financial measures, such as length of stay, despite the recommendation in the previous review by Landrigan et al.9 that such studies would be of limited value. Finally, the current variability of hospitalist models and lack of study of factors that might influence outcomes makes comparisons difficult.
Despite these limitations, several interesting trends emerge from these studies. One such trend is that the more recent studies highlight that simple classification of hospitalist system versus traditional system fails to measure the complexity and nuance of care delivery. The 2006 study by Boyd et al.21 is especially notable because it showed the opposite effect of previous studies, namely, an increase in length of stay and costs for hospitalists at St Joseph's Medical Center in Phoenix, Arizona. In this study, the traditional faculty group was employed by the hospital, and the hospitalist group was a private practice model. The authors suggest that their faculty physicians were therefore operating like hospitalists in that almost all of their time was focused on inpatient care while they were on service. They also had a limited number of general pediatricians, who attended in the inpatient setting, who were more experienced than the private practice groups. Also, the authors theorize that their faculty may have had a closer working relationship with their residents due to additional service responsibilities and locations of the faculty group onsite. Further study of the care models utilized by faculty and hospitalist practices at St Joseph's and other hospitals may reveal important insights about improving the quality and efficiency of inpatient pediatric care in general.
Though there is a clear trend in the adult literature indicating that the use of hospitalists results in superior quality of care, there is less evidence for pediatric systems. The aforementioned previous review by Landrigan et al.9, in 2006 concluded that emerging research suggests that pediatric hospitalist systems decrease cost and length of stay, but also the quality of care in pediatric hospitalist systems is unclear, because rigorous metrics to evaluate quality are lacking. Data from the 6 additional studies presented here lend limited support to the first hypothesis, and the presence of only 1 negative study is not sufficient to undermine it.
While data on quality markers such as readmission rate or mortality remain elusive, the 2 studies by Conway et al.20, 22 attempt to evaluate quality by comparing the use of evidence‐based therapies by hospitalists and community pediatricians. Though the use of objective PHIS data for UTI in 2009 did not confirm the conclusion suggested by the 2006 provider survey study, the attempt to find measurable outcomes such as the use of evidence‐based therapies is a start but we need more metrics, including rigorous patient outcome metrics, to define the quality of our care systems. Before the effect of hospitalist systems on quality is fully understood, more work will need to be done defining metrics for comparison.
Unfortunately, over 5 years since the previous review by Landrigan et al.9 called for increased focus on inpatient quality and understanding how to improve, the sophistication of our measurement of pediatric inpatient quality and understanding of the mechanisms underlying improvement is still in its infancy. We propose a solution at multiple levels.
First, the investment in research comparing system‐level interventions (eg, discharge process A vs discharge process B) must be increased. This investment increased significantly due to the over $1 billion in Recovery Act funding for comparative effectiveness research.23 However, the future investment in comparative effectiveness research, often called patient‐centered outcomes research, and proportion of investment focused on delivery system interventions is unclear. We propose that the investment in comparing delivery system interventions is essential to improving not only hospital medicine systems, but, more importantly, the healthcare system broadly. In addition, research investment needs to focus on reliably implementing proven interventions in systems of care, and evaluating both the effects on patient outcomes and cost, and the contextual factors associated with successful implementation.24 A hospital medicine example would be the comparison of the implementation of a guideline for a common disease across a set of hospitals. One could perform a prospective observational design, in which one compares high intensity versus low intensity intervention and assesses the baseline characteristics of the hospital systems, to understand their association with successful implementation and, ultimately, patient outcomes. One could also perform a clustered randomized design.
Second, the development and implementation of pediatric quality of care measures, including in the inpatient setting, needs to increase rapidly. The Children's Health Insurance Program (CHIP) and its focus on an initial core set of quality measures that expands over time, through an investment in measure development and validation, is an opportunity for pediatric hospital medicine. Inpatient measures should be a focus of measure development and implementation. We must move beyond a limited set of inpatient measures to a broader set focused on issues such as patient safety, hospital‐acquired infections, outcomes for common illnesses, and transitions of care. We also need better measures for important pediatric populations, such as children with complex medical conditions.25
Third, our understanding of the mechanisms leading to improvement in hospital medicine systems needs to be developed. Studies of hospital medicine systems should move past simple binary comparisons of hospitalist systems versus traditional systems to understand the effect on patient outcomes and cost of factors such as years of experience, volume of patients seen overall and with a specific condition, staffing model, training, quality improvement knowledge and application, and health information systems. These factors may be additive or multiplicative to the performance of inpatient systems once put into place, but these hypotheses need to be tested.
Fourth, individual hospitalists and their groups must focus on quality measurement and improvement in quality and value delivered. At Cincinnati, we have a portfolio of quality and value projects derived from our strategic objectives, illustrated in Figure 2. The projects have leaders and teams to drive improvement and measure results. Increasingly, we are able to publish these results in peer‐reviewed journals. On a quarterly basis, we review the portfolio via a dashboard and/or run and control charts. We establish new projects and set new goals on at least an annual basis. It is important to note that at the beginning of the 2010‐2011 fiscal year, almost all initiatives identified as priorities were yellow or red. Our group is now planning new initiatives and goals for next year. This is one method applicable to our setting, but a focus on quality and value and measuring results needs to be part of every hospital medicine program. As payer focus on value increases, this will be essential to demonstrate how a hospitalist group improves outcomes and adds value.
CONCLUSION
This review suggests that the use of hospitalists can improve the quality of inpatient care in the pediatric population, but this is not a universal finding and, most importantly, the mechanisms of improvement are poorly understood. We propose 4 components to address these issues so that a systematic review 5 years from now would be much more robust. These are: 1) increased investment in research comparing system‐level interventions and reliable implementation; 2) further development and implementation of pediatric quality of care measures in the inpatient setting; 3) understanding the mechanisms and factors leading to improvement in hospital medicine systems; and 4) an increased focus on quality measurement, and improvement in quality and value delivered by all individual hospitalists and their groups.
- ,.The emerging role of “hospitalists” in the American health care system.N Engl J Med.1996;335(7):514–517.
- ,,, et al.Pediatric hospitalists: report of a leadership conference.Pediatrics.2006;117(4):1122–1130.
- Institute of Medicine.Crossing the Quality Chasm: A New Health System for the 21st Century.Washington, DC:National Academy Press;2001.
- ,.The hospitalist movement 5 years later.JAMA.2002;287(4):487–494.
- ,.The impact of hospitalists on the cost and quality of inpatient care in the United States: a research synthesis.Med Care Res Rev.2005;62(4):379–406.
- .A systematic review of outcomes and quality measures in adult patients cared for by hospitalists vs nonhospitalists.Mayo Clin Proc.2009;84(3):248–254.
- ,,,,,.Outcomes of care by hospitalists, general internists, and family physicians.N Engl J Med.2007;375(25):2589–2600.
- ,,, et al.Effects of physician experience on costs and outcomes on an academic general medicine service: results of a trial of hospitalists.Ann Intern Med.2002;137(11):866–875.
- ,,,.Pediatric hospitalists: a systematic review of the literature.Pediatrics.2006;117(5):1736–1744.
- Society of Hospital Medicine. Measuring hospitalist performance: metrics, reports, and dashboards. Available at: http://www.hospitalmedicine.org/AM/Template.cfm?Section=Publications; April2007.
- Oxford Centre for Evidence‐Based Medicine levels of evidence. Updated March 2009. Available at: http://www.cebm.net/index.aspx?o=1025. Accessed March 14,2011.
- ,,,.Evaluation of a staff‐only hospitalist system in a tertiary care, academic children's hospital.Pediatrics.2004;114(6):1545–1549.
- ,.Evaluation of a pediatric hospitalist service: impact on length of stay and hospital charges.Pediatrics.2000;105(3 pt 1):478–484.
- ,,, et al.Impact of a health maintenance organization hospitalist system in academic pediatrics.Pediatrics.2002;110(4):720–728.
- ,,.Pediatric hospitalists: quality care for the underserved?Am J Med Qual.2001;16(5):174–180.
- ,,,,,.Restructuring an academic pediatric inpatient service using concepts developed by hospitalists.Clin Pediatr (Phila).2001;40(12):653–662.
- ,,, et al.Impact of a hospitalist system on length of stay and cost for children with common conditions.Pediatrics.2007;120(2):267–274.
- ,,.Staff‐only pediatric hospitalist care of patients with medically complex subspecialty conditions in a major teaching hospital.Arch Pediatr Adolesc Med.2008;162(10):975–980.
- ,,,,,.Pediatric hospitalist comanagement of spinal fusion surgery patients.J Hosp Med.2007;2(1):23–30.
- ,.Factors associated with variability in outcomes for children hospitalized with urinary tract infection.J Pediatr.2009;154(6):789–796.
- ,,,,.Comparison of outcome measures for a traditional pediatric faculty service and nonfaculty hospitalist services in a community teaching hospital.Pediatrics.2006;118(4):1327–1331.
- ,,,,,.Variations in management of common inpatient pediatric illnesses: hospitalists and community pediatricians.Pediatrics.2006;118(2):441–447.
- ,.Comparative‐effectiveness research—implications of the federal coordinating council's report.N Engl J Med.2009;361(4):328–330.
- ,.Charting a path from comparative effectiveness funding to improved patient‐centered health care.JAMA.2010;303(10):985–986.
- ,,, et al.Children with medical complexity: an emerging population for clinical and research initiatives.Pediatrics.2011;127(3):529–538.

CER and Hospital Medicine
The topic of comparative effectiveness research (CER) has recently gained prominence within the context of the national focus on health reform. This article provides a brief overview and history of CER, and discusses the implications of CER for hospitalists in each of four major career roles: research, clinical practice, education and training, and hospital leadership. Both medical journals and lay media have produced a flurry of articles recently on a variety of health reform subjects. One topic that has achieved prominence within this growing body of literature is comparative effectiveness research (CER). For many hospitalists, this particular brand of research may be unfamiliar. As discussions about CER priorities, the controversy surrounding CER, and even the definition of CER gain visibility, hospitalists may be left wondering, What exactly is CER and what does it mean for me?
Until recently no common definition for CER existed, and the very concept was identified only in relatively narrow policy and research circles. However, CER is not a new idea. Its ancestor is the notion of medical technology assessment (MTA), which garnered enthusiasm and support in the 1970s. In 1978, Congress established the National Center for Health Technology Assessment (which, over time, evolved into the Agency for Healthcare Research and Quality [AHRQ]), whose charge was to coordinate efforts within the government to assess the safety, efficacy, effectiveness, and cost‐effectiveness of medical technologies. The recognition of a need for technology assessment at that time is mirrored by the widespread interest in CER seen today. Part of the reason that MTA did not take hold is that then, as now, this type of evaluation is challenging and time consuming, requiring large, well‐designed effectiveness studies. These studies require rigorous methods, typically long‐term follow‐up, and acceptance via editors and the medical literature that effectiveness is as important as efficacy demonstrated in a randomized trial. With the spread of antiregulatory sentiment and the lack of an economic imperative to reduce costs, the national focus on technology assessment waned. The current economic crisis has refocused the government and private sector on the soaring cost of health care and the need to improve quality, and the stimulus package passed in February of 2009 placed CER once again in the forefront. The American Recovery and Reinvestment Act (ARRA) of 2009 allocated $1.1 billion for CER.1 On June 30, 2009, 2 reports delineating the strategy and priorities for CER were released. The report from the ARRA‐mandated Federal Coordinating Council (FCC) for CER includes a broad definition of CER and outlines a high‐level strategic framework for priorities and investments in CER.2 Simultaneously, the report from the Institute of Medicine (IOM) lists 100 priority research topics, and gives 10 general recommendations for the CER enterprise going forward.3
So what is CER and why is it important? How is it different from standard research that hospitalists use every day to inform their clinical decision‐making? Unfortunately, patients and providers confront medical decisions daily that are not evidence based. All too frequently it is unclear what therapeutic option works best for which patient under which circumstances. For example, what is the best inpatient diabetes management strategy for an African American woman with multiple medical problems? What is the best discharge process for an elderly man with heart disease in order to prevent readmission? CER seeks to fill the gaps in evidence needed by patients and clinicians in order to make appropriate medical decisions. It differs from standard efficacy research in that it compares interventions or management strategies in real world settings, allows identification of effectiveness in patient subgroups, and is more patient‐centered, focusing on the decisions confronting patients and their physicians. The following definition of CER was developed by the FCC for CER:
CER is the conduct and synthesis of research comparing the benefits and harms of different interventions and strategies to prevent, diagnose, treat and monitor health conditions in real world settings. The purpose of this research is to improve health outcomes by developing and disseminating evidence‐based information to patients, clinicians, and other decision‐makers, responding to their expressed needs about which interventions are most effective for which patients under specific circumstances.
-
To provide this information, CER must assess a comprehensive array of health‐related outcomes for diverse patient populations and sub‐groups.
-
Defined interventions compared may include medications, procedures, medical and assistive devices and technologies, diagnostic testing, behavioral change and delivery system strategies.
-
This research necessitates the development, expansion and use of a variety of data sources and methods to assess comparative effectiveness and actively disseminate the results.
While CER is an evolving field requiring continued methodological development (such as enhancement of methods for practical, or pragmatic trials and complex analyses of large, linked databases), examples of rigorous comparative studies do exist. The Veterans Administration (VA) COURAGE trial compared optimal medical therapy (OMT) with or without percutaneous coronary intervention (PCI) for patients with stable coronary disease, finding that PCI did not reduce the risk of death or cardiovascular events compared to OMT alone.4 Another example is the Diabetes Prevention Program which compared placebo, metformin, and a lifestyle modification program to prevent or delay the onset of type 2 diabetes. This study famously showed that lifestyle modification was more effective than metformin or placebo in reducing the incidence of diabetes.5
CER holds the promise of significantly improving the health of Americans through the ability to target treatments and other interventions to individual patients. As noted by the FCC, CER can allow for the delivery of the right treatment to the right patient at the right time2 even as the field continues to evolve. To quote Fineberg and Hiatt6 in describing technology assessment in 1979, we cannot expect CER to lead to perfect decisions, but we can expect even imperfect methods to facilitate better informed decisions than would otherwise be possible.
CER has important implications for hospitalists in all roles and settings. As the field of hospital medicine has grown, hospitalists have increasingly assumed more responsibilities than just patient care. In academic and community hospitals, hospitalists take on leadership roles, particularly in quality improvement (QI) and patient safety, and educational roles in the training of housestaff, medical students, and physician extenders. The last several years have also seen a significant increase in hospitalists participating in research. The relevance of CER to each of these 4 major activities is described below and in the accompanying Table 1.
| Primary Role | Potential Implications of CER |
|---|---|
| |
| Research | New availability of funds for hospital‐based CER |
| Enhanced data infrastructure to conduct CER | |
| Opportunity to apply CER to issues unique to hospital medicine | |
| Opportunity to develop methodologic skills | |
| Clinical practice | End users of CER evidence |
| Responsibility for translation of CER into practice | |
| Targets of Federal and non‐Federal dissemination efforts | |
| Education and training | Development of a workforce to conduct hospital‐based CER |
| Responsibility for teaching physician and nonphysician trainees about CER concepts and review of CER literature | |
| Hospital leadership | Direct hospital‐wide efforts to implement emerging CER evidence into practice through a multidisciplinary approach |
| Education and empowerment of clinician and nonclinician staff to translate CER information into practice | |
Hospitalists and Research
Many comparative effectiveness questions about clinical care, processes of care, and quality of care within the inpatient setting are in need of answers. Hospitalist researchers have the opportunity to make a significant impact on care by pursuing answers to questions that are unique to the field of hospital medicine. With the new availability of funds for CER, now is the time to address many of these questions head‐on. For example, there is a lack of evidence about best practices for a large number of inpatient acute conditions. What is the best strategy to manage acute hospital delirium in an elderly patient? What is the best approach to treating acute pain in an elderly woman on multiple medications? Overwhelmingly the patients that hospitalists care for are elderly and/or have multiple chronic conditions, including children with special health care needs. Many are from racial or ethnic minority backgrounds. These subgroups of patients have been historically under‐represented in clinical trials, yet represent exactly the priority populations that the Federal CER effort targets. The field of hospital medicine can be transformed with a substantial investment in research to address common inpatient clinical conditions in real world settings focused on the kinds of patients hospitalists actually care for.
One of the most vexing and frustrating care delivery issues for hospitalists, clinicians and researchers alike, is the discharge process. This problem received increased attention after a recent article highlighted the high rate of readmissions in the Medicare population.7 Research on the discharge process has grown substantially in recent years, and has become an area of intense focus and attention for hospitalists, nurses, researchers, hospital administrators and policymakers. Without question, hospitalists are uniquely poised to conduct research on this critically important topic, and CER is an ideal vehicle for moving this field forward. In collaboration with nurses, primary care physicians, pharmacists, case managers and others, hospitalists should take advantage of the Federal investment in studying care delivery systems interventions, and develop innovative methods and strategies for studying and improving this crucial transition in care. CER is also applicable to other care transitions, including the admission process, transitions within the hospital, and discharge to nursing facilities. Other examples of comparative effectiveness topics that hospitalist researchers are particularly suited for include comparing methods for implementing inpatient treatment protocols or clinical pathways, comparison of health information technology (IT) systems to reduce medical error, and QI approaches.
What are the methodologies that hospitalists should use to conduct CER? While randomized pragmatic real world trials are appealing, this method may not always be practical. Other methodologies are available for rigorous use, including cohort studies, comparative QI interventions, clustered and factorial design, systematic reviews, and analysis of registries, administrative claims, or other databases. Databases currently available for analysis on priority populations and subgroups are limited, and include the VA and Medicare databases. To address this need, one of the primary Federal investments in CER is for the enhancement and expansion of data infrastructure. Data infrastructure tools that are likely to be available to hospitalist researchers for CER include expanded longitudinal administrative claims databases with linkages to electronic health records (EHRs), expanded patient registries with linkages to other forms of data, and distributed data networks that are populated by EHRs in provider and practice settings. Hospitalist researchers should take advantage of these resources as they become available, as they have tremendous potential to inform decision‐making for providers and patients alike.
Hospitalists and Clinical Practice
As with all providers, hospitalists will be end‐users of CER evidence, and will have the responsibility of translating new knowledge into practice. This process will not be easy. How are hospitalists to reliably access and incorporate new comparative effectiveness information into their daily practice? How should they deal with some of the potential unintended consequences of CER, such as information overload or conflicting evidence? While hospitalists have a professional responsibility to search for and apply CER findings, the future development of CER‐based practice guidelines will encourage evidence translation. The development of a common platform for the dissemination of CER relevant to hospitalists would significantly enhance the uptake of new evidence by practicing hospitalists and other hospital‐based providers such as physician assistants or nurse practitioners. Medical societies such as the Society of Hospital Medicine and the American Academy of Pediatrics should consider developing committees for CER and leading coordinated educational efforts specifically focused on CER results through publications and presentations at local, regional, and national meetings. In addition, other dissemination tools for CER will soon emerge and existing tools will be enhanced, such as the Effective Health Care Program and Eisenberg Center housed at the AHRQ. The coming years will see an expansion of these and other dissemination efforts to both providers and patients, and hospitalists must be vigilant about accessing these resources and integrating comparative effectiveness evidence into practice. As Federal dissemination efforts to consumers spread, patients will increasingly expect physicians to discuss comparative effectiveness evidence in describing options for their individual health needs. Finally, a key lever for translating CER into practice will be payment models that place accountability for performance on physicians and hospitals, with a significant proportion of payment based on the delivery of high quality, efficient care.
Education and Training
Investment in the training and development of a skilled workforce to conduct CER is an important priority. Hospitalist researchers should take advantage of education and training programs to support the development of methodologies and skills for conducting CER that will become available. These programs will enable hospitalists to learn such skills as the use of the newly enhanced data infrastructure discussed above. The national investment in human and scientific capital for CER can promote the training of a corps of hospitalist researchers focused on this research which, in turn, could support the growth of the academic hospitalist field. Hospitalists who have responsibilities in medical education and residency training programs should take the lead in teaching CER concepts that are relevant to inpatient care. They will need to train the next generation of medical students and residents to read and understand comparative effectiveness literature and its application in clinical practice. Hospitalist educators are also best positioned to teach medical trainees comparative effectiveness evidence about inpatient QI methods and care processes.
Hospital Leadership
As front‐line providers and team leaders, hospitalists are well placed to direct the efforts within their hospitals to implement new CER evidence. For example, suppose new comparative effectiveness evidence about best practices for the discharge process for community‐dwelling older adults with multiple chronic conditions were to emerge. Hospitalists could lead efforts within their hospital to establish a multidisciplinary team to address this development, create standard protocols for implementing the new discharge process that align with their hospital's unique systems and organizational structure, advocate for necessary resources for the team to accomplish the goal of safely discharging these patients, ensure a method to track outcomes such as readmissions once the new discharge process is implemented, and provide data feedback to the team, hospital staff, and administrative leadership of the hospital. All of these activities should include a variety of disciplines working together, but as physician leaders, hospitalists can take the initiative to spearhead these endeavors. The inpatient setting is one that requires teamwork and coordination, and as team leaders, hospitalists can strongly influence the spread and adoption of CER results. Similarly, hospitalists are in a position to affect this dissemination and translation process by actively educating and empowering other clinicians and hospital staff within their local environment. Finally, as hospitalists increasingly take on leadership roles in QI departments and as chief medical officers within both community and university‐affiliated hospitals8, they are in a unique position to lead efforts to implement CER‐based QI activities. These may range from the implementation of IT functions to reduce medical error to strategies to reduce hospital‐acquired infections or falls.
Conclusion
As a result of the stimulus funds directed towards CER, the coming years will see a vast increase in the generation of comparative effectiveness evidence and the application of that evidence into practice.9 The national CER endeavor is particularly germane to the field of hospital medicine, as uncertainty about best practices is common, and the patients hospitalists serve represent priority populations for CER investments. Hospitalists can play a central role in both generating CER and implementing its findings in settings in which patients are highly vulnerable, and existing information is insufficient. In addition to clinical questions, hospitalist researchers are particularly suited to answering important questions about quality of care and inpatient processes such as transitions of care and care coordination. Having evidence on the best practices for care transitions or strategies to reduce medical error, for example, could have a significant impact on patient outcomes, quality of life, and cost of care. However, none of this new evidence will be of any value if it is not used by front‐line providers.10 Practicing hospitalists should lead efforts within their hospital to disseminate new CER findings to their hospitalist and non‐hospitalist colleagues, and to leverage their position as hospital and team leaders to implement inpatient‐based CER findings. All of these combined efforts have the potential to significantly move the field of hospital medicine forward, with the end result being improved health and better outcomes for patients.
- American Recovery and Reinvestment Act. Available at: http://frwebgate.access.gpo.gov/cgi‐bin/getdoc.cgi?dbname=111_cong_bills356:1503–1516.
- ,,, et al.Reduction in the Incidence of Type 2 diabetes with lifestyle intervention or metformin.N Engl J Med.2002;346:393–403.
- ,,Evaluation of medical practices: the case for technology assessment.N Engl J Med.1979;301:1086–1091.
- ,,,Rehospitalizations among patients in the Medicare Fee‐for‐Service Program.N Engl J Med.2009;360:1418–1428.
- 2005–2006 Society of Hospital Medicine Survey. Available at: http://www.hospitalmedicine.org/AM/Template.cfm?Section=Surveys2361:328–330.
- ,,Transformation of health care at the front line.JAMA.2009;301:763–765.
The topic of comparative effectiveness research (CER) has recently gained prominence within the context of the national focus on health reform. This article provides a brief overview and history of CER, and discusses the implications of CER for hospitalists in each of four major career roles: research, clinical practice, education and training, and hospital leadership. Both medical journals and lay media have produced a flurry of articles recently on a variety of health reform subjects. One topic that has achieved prominence within this growing body of literature is comparative effectiveness research (CER). For many hospitalists, this particular brand of research may be unfamiliar. As discussions about CER priorities, the controversy surrounding CER, and even the definition of CER gain visibility, hospitalists may be left wondering, What exactly is CER and what does it mean for me?
Until recently no common definition for CER existed, and the very concept was identified only in relatively narrow policy and research circles. However, CER is not a new idea. Its ancestor is the notion of medical technology assessment (MTA), which garnered enthusiasm and support in the 1970s. In 1978, Congress established the National Center for Health Technology Assessment (which, over time, evolved into the Agency for Healthcare Research and Quality [AHRQ]), whose charge was to coordinate efforts within the government to assess the safety, efficacy, effectiveness, and cost‐effectiveness of medical technologies. The recognition of a need for technology assessment at that time is mirrored by the widespread interest in CER seen today. Part of the reason that MTA did not take hold is that then, as now, this type of evaluation is challenging and time consuming, requiring large, well‐designed effectiveness studies. These studies require rigorous methods, typically long‐term follow‐up, and acceptance via editors and the medical literature that effectiveness is as important as efficacy demonstrated in a randomized trial. With the spread of antiregulatory sentiment and the lack of an economic imperative to reduce costs, the national focus on technology assessment waned. The current economic crisis has refocused the government and private sector on the soaring cost of health care and the need to improve quality, and the stimulus package passed in February of 2009 placed CER once again in the forefront. The American Recovery and Reinvestment Act (ARRA) of 2009 allocated $1.1 billion for CER.1 On June 30, 2009, 2 reports delineating the strategy and priorities for CER were released. The report from the ARRA‐mandated Federal Coordinating Council (FCC) for CER includes a broad definition of CER and outlines a high‐level strategic framework for priorities and investments in CER.2 Simultaneously, the report from the Institute of Medicine (IOM) lists 100 priority research topics, and gives 10 general recommendations for the CER enterprise going forward.3
So what is CER and why is it important? How is it different from standard research that hospitalists use every day to inform their clinical decision‐making? Unfortunately, patients and providers confront medical decisions daily that are not evidence based. All too frequently it is unclear what therapeutic option works best for which patient under which circumstances. For example, what is the best inpatient diabetes management strategy for an African American woman with multiple medical problems? What is the best discharge process for an elderly man with heart disease in order to prevent readmission? CER seeks to fill the gaps in evidence needed by patients and clinicians in order to make appropriate medical decisions. It differs from standard efficacy research in that it compares interventions or management strategies in real world settings, allows identification of effectiveness in patient subgroups, and is more patient‐centered, focusing on the decisions confronting patients and their physicians. The following definition of CER was developed by the FCC for CER:
CER is the conduct and synthesis of research comparing the benefits and harms of different interventions and strategies to prevent, diagnose, treat and monitor health conditions in real world settings. The purpose of this research is to improve health outcomes by developing and disseminating evidence‐based information to patients, clinicians, and other decision‐makers, responding to their expressed needs about which interventions are most effective for which patients under specific circumstances.
-
To provide this information, CER must assess a comprehensive array of health‐related outcomes for diverse patient populations and sub‐groups.
-
Defined interventions compared may include medications, procedures, medical and assistive devices and technologies, diagnostic testing, behavioral change and delivery system strategies.
-
This research necessitates the development, expansion and use of a variety of data sources and methods to assess comparative effectiveness and actively disseminate the results.
While CER is an evolving field requiring continued methodological development (such as enhancement of methods for practical, or pragmatic trials and complex analyses of large, linked databases), examples of rigorous comparative studies do exist. The Veterans Administration (VA) COURAGE trial compared optimal medical therapy (OMT) with or without percutaneous coronary intervention (PCI) for patients with stable coronary disease, finding that PCI did not reduce the risk of death or cardiovascular events compared to OMT alone.4 Another example is the Diabetes Prevention Program which compared placebo, metformin, and a lifestyle modification program to prevent or delay the onset of type 2 diabetes. This study famously showed that lifestyle modification was more effective than metformin or placebo in reducing the incidence of diabetes.5
CER holds the promise of significantly improving the health of Americans through the ability to target treatments and other interventions to individual patients. As noted by the FCC, CER can allow for the delivery of the right treatment to the right patient at the right time2 even as the field continues to evolve. To quote Fineberg and Hiatt6 in describing technology assessment in 1979, we cannot expect CER to lead to perfect decisions, but we can expect even imperfect methods to facilitate better informed decisions than would otherwise be possible.
CER has important implications for hospitalists in all roles and settings. As the field of hospital medicine has grown, hospitalists have increasingly assumed more responsibilities than just patient care. In academic and community hospitals, hospitalists take on leadership roles, particularly in quality improvement (QI) and patient safety, and educational roles in the training of housestaff, medical students, and physician extenders. The last several years have also seen a significant increase in hospitalists participating in research. The relevance of CER to each of these 4 major activities is described below and in the accompanying Table 1.
| Primary Role | Potential Implications of CER |
|---|---|
| |
| Research | New availability of funds for hospital‐based CER |
| Enhanced data infrastructure to conduct CER | |
| Opportunity to apply CER to issues unique to hospital medicine | |
| Opportunity to develop methodologic skills | |
| Clinical practice | End users of CER evidence |
| Responsibility for translation of CER into practice | |
| Targets of Federal and non‐Federal dissemination efforts | |
| Education and training | Development of a workforce to conduct hospital‐based CER |
| Responsibility for teaching physician and nonphysician trainees about CER concepts and review of CER literature | |
| Hospital leadership | Direct hospital‐wide efforts to implement emerging CER evidence into practice through a multidisciplinary approach |
| Education and empowerment of clinician and nonclinician staff to translate CER information into practice | |
Hospitalists and Research
Many comparative effectiveness questions about clinical care, processes of care, and quality of care within the inpatient setting are in need of answers. Hospitalist researchers have the opportunity to make a significant impact on care by pursuing answers to questions that are unique to the field of hospital medicine. With the new availability of funds for CER, now is the time to address many of these questions head‐on. For example, there is a lack of evidence about best practices for a large number of inpatient acute conditions. What is the best strategy to manage acute hospital delirium in an elderly patient? What is the best approach to treating acute pain in an elderly woman on multiple medications? Overwhelmingly the patients that hospitalists care for are elderly and/or have multiple chronic conditions, including children with special health care needs. Many are from racial or ethnic minority backgrounds. These subgroups of patients have been historically under‐represented in clinical trials, yet represent exactly the priority populations that the Federal CER effort targets. The field of hospital medicine can be transformed with a substantial investment in research to address common inpatient clinical conditions in real world settings focused on the kinds of patients hospitalists actually care for.
One of the most vexing and frustrating care delivery issues for hospitalists, clinicians and researchers alike, is the discharge process. This problem received increased attention after a recent article highlighted the high rate of readmissions in the Medicare population.7 Research on the discharge process has grown substantially in recent years, and has become an area of intense focus and attention for hospitalists, nurses, researchers, hospital administrators and policymakers. Without question, hospitalists are uniquely poised to conduct research on this critically important topic, and CER is an ideal vehicle for moving this field forward. In collaboration with nurses, primary care physicians, pharmacists, case managers and others, hospitalists should take advantage of the Federal investment in studying care delivery systems interventions, and develop innovative methods and strategies for studying and improving this crucial transition in care. CER is also applicable to other care transitions, including the admission process, transitions within the hospital, and discharge to nursing facilities. Other examples of comparative effectiveness topics that hospitalist researchers are particularly suited for include comparing methods for implementing inpatient treatment protocols or clinical pathways, comparison of health information technology (IT) systems to reduce medical error, and QI approaches.
What are the methodologies that hospitalists should use to conduct CER? While randomized pragmatic real world trials are appealing, this method may not always be practical. Other methodologies are available for rigorous use, including cohort studies, comparative QI interventions, clustered and factorial design, systematic reviews, and analysis of registries, administrative claims, or other databases. Databases currently available for analysis on priority populations and subgroups are limited, and include the VA and Medicare databases. To address this need, one of the primary Federal investments in CER is for the enhancement and expansion of data infrastructure. Data infrastructure tools that are likely to be available to hospitalist researchers for CER include expanded longitudinal administrative claims databases with linkages to electronic health records (EHRs), expanded patient registries with linkages to other forms of data, and distributed data networks that are populated by EHRs in provider and practice settings. Hospitalist researchers should take advantage of these resources as they become available, as they have tremendous potential to inform decision‐making for providers and patients alike.
Hospitalists and Clinical Practice
As with all providers, hospitalists will be end‐users of CER evidence, and will have the responsibility of translating new knowledge into practice. This process will not be easy. How are hospitalists to reliably access and incorporate new comparative effectiveness information into their daily practice? How should they deal with some of the potential unintended consequences of CER, such as information overload or conflicting evidence? While hospitalists have a professional responsibility to search for and apply CER findings, the future development of CER‐based practice guidelines will encourage evidence translation. The development of a common platform for the dissemination of CER relevant to hospitalists would significantly enhance the uptake of new evidence by practicing hospitalists and other hospital‐based providers such as physician assistants or nurse practitioners. Medical societies such as the Society of Hospital Medicine and the American Academy of Pediatrics should consider developing committees for CER and leading coordinated educational efforts specifically focused on CER results through publications and presentations at local, regional, and national meetings. In addition, other dissemination tools for CER will soon emerge and existing tools will be enhanced, such as the Effective Health Care Program and Eisenberg Center housed at the AHRQ. The coming years will see an expansion of these and other dissemination efforts to both providers and patients, and hospitalists must be vigilant about accessing these resources and integrating comparative effectiveness evidence into practice. As Federal dissemination efforts to consumers spread, patients will increasingly expect physicians to discuss comparative effectiveness evidence in describing options for their individual health needs. Finally, a key lever for translating CER into practice will be payment models that place accountability for performance on physicians and hospitals, with a significant proportion of payment based on the delivery of high quality, efficient care.
Education and Training
Investment in the training and development of a skilled workforce to conduct CER is an important priority. Hospitalist researchers should take advantage of education and training programs to support the development of methodologies and skills for conducting CER that will become available. These programs will enable hospitalists to learn such skills as the use of the newly enhanced data infrastructure discussed above. The national investment in human and scientific capital for CER can promote the training of a corps of hospitalist researchers focused on this research which, in turn, could support the growth of the academic hospitalist field. Hospitalists who have responsibilities in medical education and residency training programs should take the lead in teaching CER concepts that are relevant to inpatient care. They will need to train the next generation of medical students and residents to read and understand comparative effectiveness literature and its application in clinical practice. Hospitalist educators are also best positioned to teach medical trainees comparative effectiveness evidence about inpatient QI methods and care processes.
Hospital Leadership
As front‐line providers and team leaders, hospitalists are well placed to direct the efforts within their hospitals to implement new CER evidence. For example, suppose new comparative effectiveness evidence about best practices for the discharge process for community‐dwelling older adults with multiple chronic conditions were to emerge. Hospitalists could lead efforts within their hospital to establish a multidisciplinary team to address this development, create standard protocols for implementing the new discharge process that align with their hospital's unique systems and organizational structure, advocate for necessary resources for the team to accomplish the goal of safely discharging these patients, ensure a method to track outcomes such as readmissions once the new discharge process is implemented, and provide data feedback to the team, hospital staff, and administrative leadership of the hospital. All of these activities should include a variety of disciplines working together, but as physician leaders, hospitalists can take the initiative to spearhead these endeavors. The inpatient setting is one that requires teamwork and coordination, and as team leaders, hospitalists can strongly influence the spread and adoption of CER results. Similarly, hospitalists are in a position to affect this dissemination and translation process by actively educating and empowering other clinicians and hospital staff within their local environment. Finally, as hospitalists increasingly take on leadership roles in QI departments and as chief medical officers within both community and university‐affiliated hospitals8, they are in a unique position to lead efforts to implement CER‐based QI activities. These may range from the implementation of IT functions to reduce medical error to strategies to reduce hospital‐acquired infections or falls.
Conclusion
As a result of the stimulus funds directed towards CER, the coming years will see a vast increase in the generation of comparative effectiveness evidence and the application of that evidence into practice.9 The national CER endeavor is particularly germane to the field of hospital medicine, as uncertainty about best practices is common, and the patients hospitalists serve represent priority populations for CER investments. Hospitalists can play a central role in both generating CER and implementing its findings in settings in which patients are highly vulnerable, and existing information is insufficient. In addition to clinical questions, hospitalist researchers are particularly suited to answering important questions about quality of care and inpatient processes such as transitions of care and care coordination. Having evidence on the best practices for care transitions or strategies to reduce medical error, for example, could have a significant impact on patient outcomes, quality of life, and cost of care. However, none of this new evidence will be of any value if it is not used by front‐line providers.10 Practicing hospitalists should lead efforts within their hospital to disseminate new CER findings to their hospitalist and non‐hospitalist colleagues, and to leverage their position as hospital and team leaders to implement inpatient‐based CER findings. All of these combined efforts have the potential to significantly move the field of hospital medicine forward, with the end result being improved health and better outcomes for patients.
- American Recovery and Reinvestment Act. Available at: http://frwebgate.access.gpo.gov/cgi‐bin/getdoc.cgi?dbname=111_cong_bills356:1503–1516.
- ,,, et al.Reduction in the Incidence of Type 2 diabetes with lifestyle intervention or metformin.N Engl J Med.2002;346:393–403.
- ,,Evaluation of medical practices: the case for technology assessment.N Engl J Med.1979;301:1086–1091.
- ,,,Rehospitalizations among patients in the Medicare Fee‐for‐Service Program.N Engl J Med.2009;360:1418–1428.
- 2005–2006 Society of Hospital Medicine Survey. Available at: http://www.hospitalmedicine.org/AM/Template.cfm?Section=Surveys2361:328–330.
- ,,Transformation of health care at the front line.JAMA.2009;301:763–765.
Value‐Driven Health Care
It is estimated that the Medicare Part A trust fund will be exhausted by 2016 to 2019; also, the quality of care delivered in the United States is highly variable.13 Value is typically defined as the quality achieved for a given cost (ie, value = quality/cost). The focus on the 3 related concepts of value, quality, and cost of health care is likely to continue to increase. Previously, the U.S. Department of Health and Human Services (HHS) made value‐driven health care one of the Department's top priorities.4 Policymakers are in a period of transition but the publicly available plans of the President and Senate leadership indicate that the focus on value‐based initiatives will likely continue to increase as our nation strives to achieve better outcomes for our health care dollar.5, 6 Specifically, the federal government and other payers increasingly align payment incentives with value and quality, encourage public reporting on quality and Medicare payment costs, such as on the Hospital Compare website (
Since hospital care represented $648 billion in 2006, which is 37% of the total patient‐related U.S. health care expenditure, the trend to pay for value will likely have significant impact on hospitals and hospitalists.7 The Society of Hospital Medicine has a public policy committee that provides feedback to government on programs and policies related to value‐driven health care. The policies and programs need consideration and input from the broader community of hospitalists. This work outlines some of the major national initiatives and policies focused on value‐driven health care and their implications for hospitalists. Hospitalists will need to understand the policy landscape and trends, lead improvement in their individual hospitals to receive value‐based incentives, and assess the opportunities and challenges of current and potential payer programs and policies.
Policies and Initiatives: Implications for Hospitals and Hospitalists
Within the portfolio of value‐driven health care, there are at least 6 major government programs, initiatives, and policies with implications for hospitals and hospitalists: value‐based purchasing (VBP), quality and cost public reporting, Medicare demonstrations, hospital‐acquired conditions, incentives for use of effective HIT, and the physician quality reporting initiative (PQRI) (Table 1).
| Initiative or Policy | Description | Specific Examples | Potential Implications |
|---|---|---|---|
| Value‐based purchasing | At least a portion of hospital payment related to value instead of the traditional fee‐for‐service model | Performance score is based on domains such as process measures (eg, beta‐blocker at discharge for acute myocardial), outcome measures (eg, 30‐day AMI mortality), and satisfaction measures (eg, Consumer Assessment of Healthcare Providers and Hospital Survey, aka HCAHPS) | Hospitalists will influence hospital performance on Total Performance Score and could lead quality improvement efforts to improve score |
| Payment based on hospital Total Performance Score | |||
| Public reporting of quality and cost | Websites such as CMS HospitalCompare increasingly report on select quality and cost metrics | HospitalCompare reports process measures (eg, percent of heart failure patients given discharge instructions), outcome measures (eg, 30‐day risk‐adjusted mortality for AMI), survey of patients' hospital experience, and Medicare payment and volume for certain conditions | Many of these measures are directly related to care provided by hospitalists |
| Hospitalists could lead quality improvement initiatives focused on these measures | |||
| Medicare demonstrations | CMS has demonstration projects to test concepts, such as value‐based purchasing, incentive payments, and care management, aimed at improving the value of care delivered | Premier Hospital Quality Incentive Demonstration: Differentiates payment to hospitals based on performance on 30 metrics | Hospitals with their associated hospitalists can apply to participate in these and other demonstrations |
| Acute Care Episode (ACE) Demonstration: Provides bundled payments for select orthopedic and cardiovascular inpatient procedures | |||
| Medicare Hospital Gainsharing Demonstration: Hospitals can provide gainsharing payments to physicians based on savings from improving quality and efficiency | Successful demonstrations can be expanded or components incorporated into payment policy | ||
| Hospital‐acquired conditions | CMS rule that the presence of a select group of reasonably preventable conditions as the only complicating condition will not cause a higher‐paying diagnosis‐related group (DRG) to be assigned to the case | First 10 implemented: | Hospitalists can lead or participate in safety initiatives to decrease or eliminate these complications |
| Foreign object retained after surgery; | |||
| Air embolism; | |||
| Blood incompatibility; | |||
| Stage III and IV pressure ulcers; | |||
| Falls and trauma; | |||
| Manifestations of poor glycemic control; | |||
| Catheter‐associated urinary tract infections; | |||
| Vascular catheter‐associated infection; | |||
| Surgical site infection following specific surgeries; | |||
| Deep vein thrombosis and pulmonary embolus | |||
| Incentives for use of effective health information technology | Incentives for HIT use, often focused on certified interoperable systems and/or quality reporting, are provided by federal and private payers | The American Recovery and Reinvestment Act included over $17 billion of HIT incentives | Front line providers, including hospitalists, need to help guide implementation of HIT to be successful |
| Incentive money was directed at hospitals (hospital‐based physicians were excluded) and ambulatory physicians are eligible for direct incentives | Systems that include physician order entry, clinical decision support, and quality measurement capture and reporting can help hospitalists deliver higher quality care | ||
| Physician Quality Reporting Initiative (PQRI) | Quality measures linked to 2% incentive payment to physicians and other practitioners for reporting quality measures via claims or registry | Examples of measures hospitalists can report on include: | Hospitalists can drive performance on these measures, lead reporting efforts, and share in the financial rewards |
| Deep vein thrombosis prophylaxis for ischemic stroke or intracranial hemorrhage; | |||
| Medication reconciliation at discharge; | |||
| Advance care plan documented; | |||
| Oral antiplatelet therapy for patients discharged with stroke diagnosis |
Value‐Based Purchasing
The Deficit Reduction Act Section 5001(b) authorized the Centers for Medicare and Medicaid Services (CMS) to develop a Medicare hospital VBP plan. The VBP plan is currently in the Presidents FY10 budget and the senate Committee's specification for health reform. VBP involves at least a portion of the payment being related to value instead of the traditional fee‐for‐service (FFS) model. CMS has consulted with external stakeholders on the measures, data infrastructure and validation, and incentive structure for the proposed program. Hospitals would submit data for all VBP measures that apply and performance scores would be given based on both attainment and improvement. The higher of the 2 scores (ie, attainment or improvement) would represent the hospital's performance in a given domain and the weighted domain scores would determine the hospital's total performance score. This total performance score would then be translated into an incentive payment for the hospital. Measure domains would include process measures (eg, beta‐blocker at discharge for acute myocardial infarction [AMI]), outcome measures (eg, 30‐day AMI mortality), and satisfaction measures (eg, Consumer Assessment of Healthcare Providers and Systems Hospital survey [HCAHPS]). Hospitalists are in a unique position to impact and improve performance in all of the above domains for hospitals. This has the potential to increase the value of high‐performing hospitalist groups to their respective hospitals. Most importantly, this program aligns incentives with rewarding the provision of high‐quality care as defined by these measures. Over time, CMS may consider expanding the measures to other domains such as efficiency, more patient‐centered outcomes, and care coordination. In terms of efficiency measurement, the Medicare Improvements for Patients and Providers Act (MIPPA) passed in 2008 called for CMS to provide confidential reports to physicians or groups of physicians on their relative resource use. This legislation also called for HHS to develop a plan for transitioning to VBP for Medicare professional services and a report to Congress on this plan.9 This lays the foundation for transforming Medicare to focus more on quality, resource use, and value and less on FFS.
Public Reporting of Quality and Cost
CMS is beginning to empower consumers with information on quality and Medicare payment costs so they can make educated decisions on where and how they seek care. The CMS website focused on hospitals is HospitalCompare (
Medicare Demonstrations
Several Medicare demonstration projects already implemented or in the planning stages are particularly relevant to hospitals and hospitalist practice. These demonstrations test concepts, such as VBP, incentive payments, and care management, aimed at improving the value of care delivered. If demonstrations are successful, they have potential for incorporation into federal policy. The Premier Hospital Quality Incentive Demonstration is an incentive program that differentiates payment to hospitals based on performance on 30 quality measures. Participation is voluntary. The top 20% of hospitals receive incentive payments.11 The success of this demonstration led to its current second phase. The Acute Care Episode (ACE) Demonstration will provide bundled payments (including Part A and B services) for ACEs within Medicare FFS. The demonstration includes gainsharing by allowing sites to reward individual clinicians, teams of clinicians, or other hospital staff who show measurable clinical quality improvement. The focus is on select orthopedic and cardiovascular inpatient procedures (eg, hip/knee replacement surgery and coronary artery bypass graft surgery).12 The demonstration also has potential to increase volume to participant physician‐hospital organizations through financial incentives to beneficiaries via payments to offset their Medicare cost‐sharing obligations. If this demonstration is successful and the concept of bundled payment is expanded to other conditions and additional geographies, this could have significant impact on hospitalists. Specifically, programs for care coordination and reducing readmissions and complications after discharge would be directly incentivized. The demonstration focuses on Texas, Oklahoma, Colorado, and New Mexico. The Medicare Hospital Gainsharing Demonstration program to test and evaluate arrangements between hospitals and physicians is designed improve the quality and efficiency of care provided to beneficiaries. The demonstration allows hospitals to provide gainsharing payments to physicians that represent solely a share of the savings incurred as a result of collaborative efforts to improve overall quality and efficiency. The demonstration was launched in 2007.13 Finally, the upcoming Medicare Medical Home Demonstration has the potential for direct or indirect hospitalist participation as facilitators in Tier 2 medical homes that take into account care coordination across inpatient and outpatient settings.14 These demonstrations represent attempts by the federal government to align incentives with high‐quality, high‐value delivery of care.
Hospital‐Acquired Conditions
Hospital‐acquired conditions (HACs) have significant cost and quality implications for U.S. healthcare, such as the estimated 99,000 deaths associated with hospital‐acquired infections annually.15 Therefore, CMS received statutory authority to not pay additional charges for reasonably preventable HACs. Beginning October 1, 2008, CMS implemented a rule that the presence of selected reasonably preventable conditions as the only complicating condition would not cause a higher‐paying DRG to be assigned to the case; therefore, the case would be paid as though the secondary diagnosis were not present. CMS also required the reporting of a new data element to delineate HACs from conditions present on admission. Hospitals can indicate to CMS if a condition was present on admission as a secondary diagnosis, allowing reimbursement for care provided to treat any condition present on admission. The first 10 HACs to be implemented were: foreign object retained after surgery, air embolism, blood incompatibility, stage III and IV pressure ulcers, falls and trauma, manifestations of poor glycemic control, catheter‐associated urinary tract infections, vascular catheterassociated infection, surgical site infection following specific surgeries, and deep vein thrombosis and pulmonary embolus.16 Since some complications are not absolutely preventable and evidence‐based guidelines for the prevention of some complications are lacking, this has generated some resistance from the provider community.17 The HAC payment policy is a step toward aligning incentives with quality performance, but any further HACs will need to be evaluated for their level of preventability and potential for unintended consequences.
Incentives for Use of Effective HIT
The use of HIT can be incentivized in 3 main ways, all of which are likely to increase over time. First, incentives can be implemented to reward reporting quality metrics via electronic health records or registries. Second, incentives based on quality performance may indirectly encourage the adoption of HIT because an electronic medical record, especially with computerized provider order entry and decision support, may enable higher performance on quality metrics. Finally, CMS has provided direct incentives for information technology adoption, such as certified electronic health records.18 The American Recovery and Reinvestment Act of 2009 created over $17 billion of potential incentive payments for HIT use by physicians and hospitals.19 Hospitals are eligible for significant incentives reaching estimates over $6 million per year, phasing out by 2015, so Congress excluded hospital‐based physicians from direct payments. Ambulatory physicians are eligible for up to $18,000 per year, phasing out by 2015, with subsequent payment reductions for nonuse. Since hospitalists often function at the nexus of clinical care, quality improvement, and technology use, they have the opportunity to lead or facilitate effective implementation of information technology in their hospitals. These efforts may be rewarded by hospitals.
PQRI
PQRI was authorized in 2006 and included a 1.5% incentive payment for satisfactorily reporting quality data. The incentive payment will increase to 2% in 2009. There are 153 PQRI measures in 2009 and a significant number of the measures focus on hospital‐based care. Examples of measures hospitalists can help report include: deep vein thrombosis prophylaxis for ischemic stroke or intracranial hemorrhage, medication reconciliation at discharge, advance care plan documentation, oral antiplatelet therapy for patients discharged with stroke diagnosis, and anticoagulant therapy prescribed for atrial fibrillation in stroke patients at discharge. PQRI measures can be reported through claims‐based or registry‐based reporting. Reporting can be done on individual measures or for measure groups associated with specific conditions.20 Hospitalists have the potential to drive performance on these measures, lead reporting efforts, and share in the financial rewards.
Future Considerations
The political leadership at the federal and state level is beginning a new transition; however, the focus on quality and value for our health care dollar will likely continue to increase.5, 6 The U.S. health care system has untenable cost estimates, significant quality gaps, and a fractured payment system that fails to reward effective care coordination.2, 21, 22 This increased focus on quality and value should be viewed as an opportunity for hospitalists and hospitals. Hospitalist groups that can achieve high‐quality performance will be increasingly valued, and hospitals should further recognize the critical role hospitalists play in achieving high performance and the associated financial rewards. Hospitalists often lead quality improvement and safety programs in hospitals, and these programs are likely to be seen as progressively more important as payment is linked to performance. The Society of Hospital Medicine engages with policymakers and this role is increasingly significant as more policy and payment decisions impact hospitalists. The Society has focused on collaborative work with payers, policymakers, and other providers to find joint shared solutions. Hospitalists can serve as a link between providers and a focal point of care coordination, especially for the hospitalized patient. Finally, as our system and its incentives continue to progress toward alignment with value‐based high quality care, hospitalists should be leading the change and be an essential part of the solution to transform our health care system to provide high‐quality, efficient care to all Americans.
Acknowledgements
Dr. Tom Valuck is recognized for his thoughtful comments and edits in preparation, submission, and revision of this manuscript.
- Medicare Board of Trustees. A Summary of the 2008 Report. Available at: http://www.ssa.gov/OACT/TRSUM/trsummary.html. Accessed April 2009.
- , , , et al.The quality of health care delivered to adults in the United States.N Engl J Med.2003;348(26):2635–2645.
- Economy Likely to Move up Medicare's Insolvency. Available at: http://abcnews.go.com/Politics/Health/wireStory?id=6369658. Accessed April 2009.
- Value‐Driven Health Care. Available at: http://www.hhs.gov/valuedriven. Accessed April 2009.
- Obama‐Biden Full Health Care Plan. Available at: http://www.barackobama.com/issues/healthcare. Accessed April 2009.
- Senate Chairman Max Baucus Call to Action Health Reform 2009. Available at: http://finance.senate.gov/healthreform2009/finalwhitepaper.pdf. Accessed April 2009.
- , , , .National health spending in 2006: a year of change for prescription drugs.Health Aff (Millwood).2008;27(1):14–29.
- Medicare Hospital Value‐Based Purchasing Plan. October 31,2008. Available at: http://www.cms.hhs.gov/AcuteInpatientPPS/downloads/hospital_VBP_plan_issues_paper.pdf. Accessed April 2009.
- Medicare Improvements for Patients and Providers Act of 2008. Available at: http://www.asm.org/ASM/files/ccLibraryFiles/Filename/000000004120/HR6331.pdf. Accessed April 2009.
- HospitalCompare. Available at: www.hospitalcompare.hhs.gov. Accessed April 2009.
- Premier Hospital Quality Incentive Demonstration. Available at: http://www.cms.hhs.gov/HospitalQualityInits/35_hospitalpremier.asp. Accessed April 2009.
- Acute Care Episode Demonstration. Available at: http://www.cms.hhs.gov/DemoProjectsEvalRpts/MD/itemdetail.asp?filterType=none122(2):160–166.
- Hospital Acquired Conditions. Available at: http://www.cms.hhs.gov/HospitalAcqCond/06_Hospital‐Acquired_Conditions.asp. Accessed April 2009.
- , , .The wisdom and justice of not paying for “preventable complications”.JAMA.2008;299(18):2197–2199.
- E‐prescribing incentive program. Available at: http://www.cms.hhs.gov/ERXincentive. Accessed April 2009.
- American Recovery and Reinvestment Act. Available at: http://frwebgate.access.gpo.gov/cgi‐bin/getdoc.cgi?dbname=111_cong_bills299(19):2319–2321.
It is estimated that the Medicare Part A trust fund will be exhausted by 2016 to 2019; also, the quality of care delivered in the United States is highly variable.13 Value is typically defined as the quality achieved for a given cost (ie, value = quality/cost). The focus on the 3 related concepts of value, quality, and cost of health care is likely to continue to increase. Previously, the U.S. Department of Health and Human Services (HHS) made value‐driven health care one of the Department's top priorities.4 Policymakers are in a period of transition but the publicly available plans of the President and Senate leadership indicate that the focus on value‐based initiatives will likely continue to increase as our nation strives to achieve better outcomes for our health care dollar.5, 6 Specifically, the federal government and other payers increasingly align payment incentives with value and quality, encourage public reporting on quality and Medicare payment costs, such as on the Hospital Compare website (
Since hospital care represented $648 billion in 2006, which is 37% of the total patient‐related U.S. health care expenditure, the trend to pay for value will likely have significant impact on hospitals and hospitalists.7 The Society of Hospital Medicine has a public policy committee that provides feedback to government on programs and policies related to value‐driven health care. The policies and programs need consideration and input from the broader community of hospitalists. This work outlines some of the major national initiatives and policies focused on value‐driven health care and their implications for hospitalists. Hospitalists will need to understand the policy landscape and trends, lead improvement in their individual hospitals to receive value‐based incentives, and assess the opportunities and challenges of current and potential payer programs and policies.
Policies and Initiatives: Implications for Hospitals and Hospitalists
Within the portfolio of value‐driven health care, there are at least 6 major government programs, initiatives, and policies with implications for hospitals and hospitalists: value‐based purchasing (VBP), quality and cost public reporting, Medicare demonstrations, hospital‐acquired conditions, incentives for use of effective HIT, and the physician quality reporting initiative (PQRI) (Table 1).
| Initiative or Policy | Description | Specific Examples | Potential Implications |
|---|---|---|---|
| Value‐based purchasing | At least a portion of hospital payment related to value instead of the traditional fee‐for‐service model | Performance score is based on domains such as process measures (eg, beta‐blocker at discharge for acute myocardial), outcome measures (eg, 30‐day AMI mortality), and satisfaction measures (eg, Consumer Assessment of Healthcare Providers and Hospital Survey, aka HCAHPS) | Hospitalists will influence hospital performance on Total Performance Score and could lead quality improvement efforts to improve score |
| Payment based on hospital Total Performance Score | |||
| Public reporting of quality and cost | Websites such as CMS HospitalCompare increasingly report on select quality and cost metrics | HospitalCompare reports process measures (eg, percent of heart failure patients given discharge instructions), outcome measures (eg, 30‐day risk‐adjusted mortality for AMI), survey of patients' hospital experience, and Medicare payment and volume for certain conditions | Many of these measures are directly related to care provided by hospitalists |
| Hospitalists could lead quality improvement initiatives focused on these measures | |||
| Medicare demonstrations | CMS has demonstration projects to test concepts, such as value‐based purchasing, incentive payments, and care management, aimed at improving the value of care delivered | Premier Hospital Quality Incentive Demonstration: Differentiates payment to hospitals based on performance on 30 metrics | Hospitals with their associated hospitalists can apply to participate in these and other demonstrations |
| Acute Care Episode (ACE) Demonstration: Provides bundled payments for select orthopedic and cardiovascular inpatient procedures | |||
| Medicare Hospital Gainsharing Demonstration: Hospitals can provide gainsharing payments to physicians based on savings from improving quality and efficiency | Successful demonstrations can be expanded or components incorporated into payment policy | ||
| Hospital‐acquired conditions | CMS rule that the presence of a select group of reasonably preventable conditions as the only complicating condition will not cause a higher‐paying diagnosis‐related group (DRG) to be assigned to the case | First 10 implemented: | Hospitalists can lead or participate in safety initiatives to decrease or eliminate these complications |
| Foreign object retained after surgery; | |||
| Air embolism; | |||
| Blood incompatibility; | |||
| Stage III and IV pressure ulcers; | |||
| Falls and trauma; | |||
| Manifestations of poor glycemic control; | |||
| Catheter‐associated urinary tract infections; | |||
| Vascular catheter‐associated infection; | |||
| Surgical site infection following specific surgeries; | |||
| Deep vein thrombosis and pulmonary embolus | |||
| Incentives for use of effective health information technology | Incentives for HIT use, often focused on certified interoperable systems and/or quality reporting, are provided by federal and private payers | The American Recovery and Reinvestment Act included over $17 billion of HIT incentives | Front line providers, including hospitalists, need to help guide implementation of HIT to be successful |
| Incentive money was directed at hospitals (hospital‐based physicians were excluded) and ambulatory physicians are eligible for direct incentives | Systems that include physician order entry, clinical decision support, and quality measurement capture and reporting can help hospitalists deliver higher quality care | ||
| Physician Quality Reporting Initiative (PQRI) | Quality measures linked to 2% incentive payment to physicians and other practitioners for reporting quality measures via claims or registry | Examples of measures hospitalists can report on include: | Hospitalists can drive performance on these measures, lead reporting efforts, and share in the financial rewards |
| Deep vein thrombosis prophylaxis for ischemic stroke or intracranial hemorrhage; | |||
| Medication reconciliation at discharge; | |||
| Advance care plan documented; | |||
| Oral antiplatelet therapy for patients discharged with stroke diagnosis |
Value‐Based Purchasing
The Deficit Reduction Act Section 5001(b) authorized the Centers for Medicare and Medicaid Services (CMS) to develop a Medicare hospital VBP plan. The VBP plan is currently in the Presidents FY10 budget and the senate Committee's specification for health reform. VBP involves at least a portion of the payment being related to value instead of the traditional fee‐for‐service (FFS) model. CMS has consulted with external stakeholders on the measures, data infrastructure and validation, and incentive structure for the proposed program. Hospitals would submit data for all VBP measures that apply and performance scores would be given based on both attainment and improvement. The higher of the 2 scores (ie, attainment or improvement) would represent the hospital's performance in a given domain and the weighted domain scores would determine the hospital's total performance score. This total performance score would then be translated into an incentive payment for the hospital. Measure domains would include process measures (eg, beta‐blocker at discharge for acute myocardial infarction [AMI]), outcome measures (eg, 30‐day AMI mortality), and satisfaction measures (eg, Consumer Assessment of Healthcare Providers and Systems Hospital survey [HCAHPS]). Hospitalists are in a unique position to impact and improve performance in all of the above domains for hospitals. This has the potential to increase the value of high‐performing hospitalist groups to their respective hospitals. Most importantly, this program aligns incentives with rewarding the provision of high‐quality care as defined by these measures. Over time, CMS may consider expanding the measures to other domains such as efficiency, more patient‐centered outcomes, and care coordination. In terms of efficiency measurement, the Medicare Improvements for Patients and Providers Act (MIPPA) passed in 2008 called for CMS to provide confidential reports to physicians or groups of physicians on their relative resource use. This legislation also called for HHS to develop a plan for transitioning to VBP for Medicare professional services and a report to Congress on this plan.9 This lays the foundation for transforming Medicare to focus more on quality, resource use, and value and less on FFS.
Public Reporting of Quality and Cost
CMS is beginning to empower consumers with information on quality and Medicare payment costs so they can make educated decisions on where and how they seek care. The CMS website focused on hospitals is HospitalCompare (
Medicare Demonstrations
Several Medicare demonstration projects already implemented or in the planning stages are particularly relevant to hospitals and hospitalist practice. These demonstrations test concepts, such as VBP, incentive payments, and care management, aimed at improving the value of care delivered. If demonstrations are successful, they have potential for incorporation into federal policy. The Premier Hospital Quality Incentive Demonstration is an incentive program that differentiates payment to hospitals based on performance on 30 quality measures. Participation is voluntary. The top 20% of hospitals receive incentive payments.11 The success of this demonstration led to its current second phase. The Acute Care Episode (ACE) Demonstration will provide bundled payments (including Part A and B services) for ACEs within Medicare FFS. The demonstration includes gainsharing by allowing sites to reward individual clinicians, teams of clinicians, or other hospital staff who show measurable clinical quality improvement. The focus is on select orthopedic and cardiovascular inpatient procedures (eg, hip/knee replacement surgery and coronary artery bypass graft surgery).12 The demonstration also has potential to increase volume to participant physician‐hospital organizations through financial incentives to beneficiaries via payments to offset their Medicare cost‐sharing obligations. If this demonstration is successful and the concept of bundled payment is expanded to other conditions and additional geographies, this could have significant impact on hospitalists. Specifically, programs for care coordination and reducing readmissions and complications after discharge would be directly incentivized. The demonstration focuses on Texas, Oklahoma, Colorado, and New Mexico. The Medicare Hospital Gainsharing Demonstration program to test and evaluate arrangements between hospitals and physicians is designed improve the quality and efficiency of care provided to beneficiaries. The demonstration allows hospitals to provide gainsharing payments to physicians that represent solely a share of the savings incurred as a result of collaborative efforts to improve overall quality and efficiency. The demonstration was launched in 2007.13 Finally, the upcoming Medicare Medical Home Demonstration has the potential for direct or indirect hospitalist participation as facilitators in Tier 2 medical homes that take into account care coordination across inpatient and outpatient settings.14 These demonstrations represent attempts by the federal government to align incentives with high‐quality, high‐value delivery of care.
Hospital‐Acquired Conditions
Hospital‐acquired conditions (HACs) have significant cost and quality implications for U.S. healthcare, such as the estimated 99,000 deaths associated with hospital‐acquired infections annually.15 Therefore, CMS received statutory authority to not pay additional charges for reasonably preventable HACs. Beginning October 1, 2008, CMS implemented a rule that the presence of selected reasonably preventable conditions as the only complicating condition would not cause a higher‐paying DRG to be assigned to the case; therefore, the case would be paid as though the secondary diagnosis were not present. CMS also required the reporting of a new data element to delineate HACs from conditions present on admission. Hospitals can indicate to CMS if a condition was present on admission as a secondary diagnosis, allowing reimbursement for care provided to treat any condition present on admission. The first 10 HACs to be implemented were: foreign object retained after surgery, air embolism, blood incompatibility, stage III and IV pressure ulcers, falls and trauma, manifestations of poor glycemic control, catheter‐associated urinary tract infections, vascular catheterassociated infection, surgical site infection following specific surgeries, and deep vein thrombosis and pulmonary embolus.16 Since some complications are not absolutely preventable and evidence‐based guidelines for the prevention of some complications are lacking, this has generated some resistance from the provider community.17 The HAC payment policy is a step toward aligning incentives with quality performance, but any further HACs will need to be evaluated for their level of preventability and potential for unintended consequences.
Incentives for Use of Effective HIT
The use of HIT can be incentivized in 3 main ways, all of which are likely to increase over time. First, incentives can be implemented to reward reporting quality metrics via electronic health records or registries. Second, incentives based on quality performance may indirectly encourage the adoption of HIT because an electronic medical record, especially with computerized provider order entry and decision support, may enable higher performance on quality metrics. Finally, CMS has provided direct incentives for information technology adoption, such as certified electronic health records.18 The American Recovery and Reinvestment Act of 2009 created over $17 billion of potential incentive payments for HIT use by physicians and hospitals.19 Hospitals are eligible for significant incentives reaching estimates over $6 million per year, phasing out by 2015, so Congress excluded hospital‐based physicians from direct payments. Ambulatory physicians are eligible for up to $18,000 per year, phasing out by 2015, with subsequent payment reductions for nonuse. Since hospitalists often function at the nexus of clinical care, quality improvement, and technology use, they have the opportunity to lead or facilitate effective implementation of information technology in their hospitals. These efforts may be rewarded by hospitals.
PQRI
PQRI was authorized in 2006 and included a 1.5% incentive payment for satisfactorily reporting quality data. The incentive payment will increase to 2% in 2009. There are 153 PQRI measures in 2009 and a significant number of the measures focus on hospital‐based care. Examples of measures hospitalists can help report include: deep vein thrombosis prophylaxis for ischemic stroke or intracranial hemorrhage, medication reconciliation at discharge, advance care plan documentation, oral antiplatelet therapy for patients discharged with stroke diagnosis, and anticoagulant therapy prescribed for atrial fibrillation in stroke patients at discharge. PQRI measures can be reported through claims‐based or registry‐based reporting. Reporting can be done on individual measures or for measure groups associated with specific conditions.20 Hospitalists have the potential to drive performance on these measures, lead reporting efforts, and share in the financial rewards.
Future Considerations
The political leadership at the federal and state level is beginning a new transition; however, the focus on quality and value for our health care dollar will likely continue to increase.5, 6 The U.S. health care system has untenable cost estimates, significant quality gaps, and a fractured payment system that fails to reward effective care coordination.2, 21, 22 This increased focus on quality and value should be viewed as an opportunity for hospitalists and hospitals. Hospitalist groups that can achieve high‐quality performance will be increasingly valued, and hospitals should further recognize the critical role hospitalists play in achieving high performance and the associated financial rewards. Hospitalists often lead quality improvement and safety programs in hospitals, and these programs are likely to be seen as progressively more important as payment is linked to performance. The Society of Hospital Medicine engages with policymakers and this role is increasingly significant as more policy and payment decisions impact hospitalists. The Society has focused on collaborative work with payers, policymakers, and other providers to find joint shared solutions. Hospitalists can serve as a link between providers and a focal point of care coordination, especially for the hospitalized patient. Finally, as our system and its incentives continue to progress toward alignment with value‐based high quality care, hospitalists should be leading the change and be an essential part of the solution to transform our health care system to provide high‐quality, efficient care to all Americans.
Acknowledgements
Dr. Tom Valuck is recognized for his thoughtful comments and edits in preparation, submission, and revision of this manuscript.
- Medicare Board of Trustees. A Summary of the 2008 Report. Available at: http://www.ssa.gov/OACT/TRSUM/trsummary.html. Accessed April 2009.
- , , , et al.The quality of health care delivered to adults in the United States.N Engl J Med.2003;348(26):2635–2645.
- Economy Likely to Move up Medicare's Insolvency. Available at: http://abcnews.go.com/Politics/Health/wireStory?id=6369658. Accessed April 2009.
- Value‐Driven Health Care. Available at: http://www.hhs.gov/valuedriven. Accessed April 2009.
- Obama‐Biden Full Health Care Plan. Available at: http://www.barackobama.com/issues/healthcare. Accessed April 2009.
- Senate Chairman Max Baucus Call to Action Health Reform 2009. Available at: http://finance.senate.gov/healthreform2009/finalwhitepaper.pdf. Accessed April 2009.
- , , , .National health spending in 2006: a year of change for prescription drugs.Health Aff (Millwood).2008;27(1):14–29.
- Medicare Hospital Value‐Based Purchasing Plan. October 31,2008. Available at: http://www.cms.hhs.gov/AcuteInpatientPPS/downloads/hospital_VBP_plan_issues_paper.pdf. Accessed April 2009.
- Medicare Improvements for Patients and Providers Act of 2008. Available at: http://www.asm.org/ASM/files/ccLibraryFiles/Filename/000000004120/HR6331.pdf. Accessed April 2009.
- HospitalCompare. Available at: www.hospitalcompare.hhs.gov. Accessed April 2009.
- Premier Hospital Quality Incentive Demonstration. Available at: http://www.cms.hhs.gov/HospitalQualityInits/35_hospitalpremier.asp. Accessed April 2009.
- Acute Care Episode Demonstration. Available at: http://www.cms.hhs.gov/DemoProjectsEvalRpts/MD/itemdetail.asp?filterType=none122(2):160–166.
- Hospital Acquired Conditions. Available at: http://www.cms.hhs.gov/HospitalAcqCond/06_Hospital‐Acquired_Conditions.asp. Accessed April 2009.
- , , .The wisdom and justice of not paying for “preventable complications”.JAMA.2008;299(18):2197–2199.
- E‐prescribing incentive program. Available at: http://www.cms.hhs.gov/ERXincentive. Accessed April 2009.
- American Recovery and Reinvestment Act. Available at: http://frwebgate.access.gpo.gov/cgi‐bin/getdoc.cgi?dbname=111_cong_bills299(19):2319–2321.
Nurse Staffing Ratio Trends and Implications
Many studies have reported associations between higher nurse‐to‐patient ratios and decreased mortality and complications. These studies coupled with increasing concern about patient safety, nursing shortages, and nurse burnout have spurred many state legislatures to discuss mandating minimum nurse staffing ratios.15 The California legislature passed law AB394 in 1999, mandating minimum nurse staffing ratios in order to improve patient safety and the nurse work environment. The original implementation date, January 1, 2001, was delayed to allow the California Department of Health Services more time to develop minimum nurse ratios for each unit type.6, 7 California implemented a ratio of at least 1 licensed nurse (RN+LVN) for every 6 patients on general adult medical‐surgical floors on January 1, 2004. This was subsequently increased, on January 1, 2005, to at least 1 licensed nurse for every 5 patients, a ratio that was upheld by the California Supreme Court on March 14, 2005.8
Additional laws regarding nurse staffing are being considered in at least 25 states.9 States have taken 3 main approaches to legislation: mandating nurse staffing ratios for each hospital unit type, requiring hospitals to establish and report nurse staffing plans that typically include ratios, or a combination of mandated ratios and staffing plans.10 This type of legislation would have a major impact on hospitalists, nurses, other health care personnel, hospital administrators, and patients. However, little is known about trends in nurse staffing, how staffing levels vary among hospitals overall, in different markets, and by ownership type and location, and consequently how implementing nurse staffing ratios will affect different types of hospitals, including those that make up the safety net.11
California nurse staffing data are better than many other sources because the state provides nurse staffing hours by unit types in hospitals as opposed to aggregate numbers of nurse hours across an entire hospital or medical center.12 California is also at the forefront of mandated minimum nurse staffing legislation, as it is the only state to have enacted nurse staffing ratio legislation. Examining nurse staffing trends and hospital types currently under mandated or proposed nurse staffing ratios is integral to informing the debate on nurse staffing legislation and its effect on hospitalists. We hypothesized that nurse staffing would increase in California after the legislation was passed in 1999 but that safety‐net hospitals such as those that are urban, government owned, and serving a high percentage of Medicaid and uninsured patients would be more likely to be below minimum ratios.13
MATERIALS AND METHODS
We used hospital financial panel data for 1993 through 2004, the most recent year with complete data, from California's Office of Statewide Health Planning and Development (OSHPD). We included only short‐term acute‐care general hospitals and excluded other hospital types such as long‐term care, children's, and psychiatric hospitals. We investigated staffing of adult general medical‐surgical units and not of other types of units such as intensive care units. The numerator of the staffing variables for each hospital was the combined medical‐surgical productive hours for registered nurses (RNs) and licensed vocational nurses (LVNs), as California allows up to 50% of staffing hours to be LVN hours. Staffing hours of the adult general medical‐surgical units of each hospital are reported on an annual basis. The denominator was total patient days on the acute adult medical‐surgical units of each hospital in a given year. We calculated the number of patients per one nurse by dividing 24 by the nurse hours per patient day (eg, 4.0 nurse hours per patient day is equivalent to a nurse‐to‐patient ratio of 1:6). We did not adjust staffing ratios by the hospital case mix or other factors because the ratio legislation did not take these factors into account.
We further evaluated staffing ratios in 2003 and 2004 based on 5 hospital characteristics: hospital ownership, market competitiveness, teaching status, urban versus rural location, and safety‐net hospitals, using 2 common definitions for the latter. The Institute of Medicine report defines safety‐net providers as those with a substantial share of their patient mix from uninsured and Medicaid populations.13 Safety‐net hospitals have been more specifically defined as short‐term general hospitals whose percentage of Medicaid and uninsured patients is greater than 1 standard deviation above the mean.14 Using this definition, hospitals in California where more than 36% of patients had Medicaid or no insurance in 2004 would be considered safety‐net hospitals. A more comprehensive definition of the hospital safety net that has been used includes urban nonprofit and government hospitals and hospitals with a high percentage of Medicaid/uninsured patients.10, 11, 15 We analyzed nurse staffing ratios using both these definitions. Hospital ownership was designated as for profit, nonprofit, or government owned. Hospital competitiveness was measured using the Hirschman‐Herfindahl Index (HHI), or the sum of squared market shares, a standard approach to defining hospital market competition. Market boundaries were defined as those zip codes from which each hospital draws most of its patients.16 We then dichotomized hospitals into a high‐ or low‐competition category based on the approximate median HHI cut point of 0.34. Teaching status was based on intern/resident‐to‐bed ratio (ie, 0 = nonteaching, 0.010.25 = minor teaching, and >0.25 = major teaching). Location was defined by county location as either urban or nonurban medical service area.
We then analyzed the percentage of hospitals in 2003 and 2004 below the mandated minimum ratios of (1) at least 1 licensed nurse (RN+LVN) per 6 patients effective in 2004, (2) the ratio of 1 (RN+LVN) nurse per 5 patients to be implemented in 2005, (3) the ratio of at least 1 registered nurse (RN only) per 5 patients, and (4) at least 1 nurse (RN+LVN) per 4 patients, as these ratios are under consideration in other states.9, 17 Finally, we examined the trend in nurse staffing ratios from 2003, the pre‐implementation year, to 2004, the post‐implementation year. Data analysis was performed using STATA SE 9.1 (College Station, TX).
RESULTS
Nurse Staffing Trends
The trend in nurse staffing ratios based on licensed nurses (RN + LVN) from 1993 to 2004 is shown in Figure 1, with lines representing the 10th, 25th, 50th (median), and 75th percentiles of hospital nurse staffing ratios. The nurse staffing ratios were essentially flat from 1993 to 1999 without any significant trend. After nurse staffing legislation was passed in 1999, median nurse‐to‐patient ratio rose, with the largest increase from 2003 to the implementation year for staffing ratios, 2004. From 2003 to 2004, the median hospital staffing ratio increased from fewer than 1 nurse per 4 patients to a ratio of more than 1 nurse per 4 patients. The first year that fewer than 25% of hospitals were below the minimum of at least 1 nurse per 5 patients was 2003.

Trends in Nurse Staffing Mix
The legislation in California and the proposed legislation in some other states allow hospitals to meet mandated ratios with both RNs and LVNs or LPNs, that is, with licensed nursing staff. Specifically, California allows up to 50% of nurse staffing ratios to be met by LVN hours. Therefore, we analyzed the overall trend in percentage of nurse staffing hours attributable to LVNs. In 1993, LVNs accounted for 27% of nurse staffing hours. Because of a steady decrease in the proportion of LVNs staffing relative to RNs staffing, LVNs accounted for only 13% of the nurse staffing hours by 2004.
Hospitals Below Implemented and Proposed Ratios
The first column of Table 1 shows the percentage of hospitals of each type in 2003 and 2004 below the mandated ratio of at least 1 licensed nurse (RN+LVN) per 6 patients, which went into effect January 1, 2004. The next column represents the hospitals below the ratio of at least 1 licensed nurse per 5 patients, which was implemented in 2005. The final 2 columns represent ratios that have been considered in other states of at least 1 RN per 5 patients and at least 1 licensed nurse per 4 patients.9, 17 In 2004, only 2.4% of hospitals were below a minimum ratio of at least 1 nurse (RN+LVN) per 6 patients, but 11.4% were below 1:5, 29.5% were below 1 RN per 5 patients, and 40.4% were below at least 1 nurse (RN+LVN) per 4 patients. This demonstrates the substantial increase in the proportion of hospitals that are below minimum ratios as the number of nurses or required training level of nurses is increased.
| <1 Nurse per 6 patients (RN+LVN)* | <1 Nurse per 5 patients (RN+LVN)* | <1 Nurse per 5 patients (RN only)* | <1 Nurse per 4 patients (RN+LVN)* | |||||
|---|---|---|---|---|---|---|---|---|
| 2003 (%) | 2004 (%) | 2003 (%) | 2004 (%) | 2003 (%) | 2004 (%) | 2003 (%) | 2004 (%) | |
| ||||||||
| All hospitals (2003, n = 342; 2004, n = 332) | 5.0% | 2.4% | 19.6% | 11.4% | 39.8 | 29.5% | 53.2% | 40.4% |
| Hospital ownership‖ | ||||||||
| For‐profit (2003, n = 87; 2004, n = 82) | 2.3% | 1.2% | 25.3% | 9.8% | 54.0 | 32.9% | 63.2% | 40.2% |
| Nonprofit (2003, n = 234; 2004, n = 231) | 5.6% | 3.0% | 16.7% | 11.3% | 34.6 | 28.1% | 49.6% | 40.7% |
| Government (2003, n = 21; 2004, n = 19) | 9.5% | 0% | 28.6% | 21.1% | 38.1 | 31.6% | 52.4% | 36.8% |
| More competitive versus less competitive markets‖ | ||||||||
| More competitive (2003, n = 168; 2004, n = 163) | 6.0% | 2.6% | 25.0% | 11.7% | 46.4 | 33.8% | 59.3% | 42.2% |
| Less competitive (2003, n = 174; 2004, n = 169) | 4.0% | 2.2% | 14.4% | 11.2% | 33.3 | 25.8% | 48.3% | 38.8% |
| Teaching status‖ | ||||||||
| No teaching (2003 n = 250; 2004 n = 251) | 5.6% | 2.4% | 20.4% | 12.0% | 42.0% | 30.7% | 56.0% | 41.0% |
| Minor teaching (2003 n = 72; 2004 n = 60) | 2.8% | 3.3% | 18.1% | 10.0% | 36.5% | 28.3% | 48.6% | 41.7% |
| Major teaching (2003 n = 20; 2004 n = 21) | 5.0% | 0% | 15.0% | 9.5% | 20.0% | 19.0% | 35.0% | 28.6% |
| Urban versus nonurban‖ | ||||||||
| Urban (2003 n = 306; 2004 n = 294) | 4.9% | 2.4% | 20.9% | 11.9% | 41.2% | 30.6% | 55.6% | 42.5% |
| Nonurban (2003 n = 36; 2004 n = 38) | 5.6% | 2.6% | 8.3% | 7.9% | 27.8% | 21.1% | 33.3% | 23.7% |
| High versus low Medicaid/uninsured patient population‖ | ||||||||
| High (36%; 2003, n = 65; 2004, n = 60) | 6.2% | 5.0% | 30.8% | 21.7% | 50.8% | 43.3% | 64.6% | 48.7% |
| Low (<36%; 2003, n = 276; 2004, n = 270) | 4.7% | 1.9% | 17.0% | 9.3% | 37.3% | 26.7% | 50.7% | 39.3% |
Nurse Staffing Ratio Changes in First Year of Implementation of Legislation
From 2003 to 2004, there was a decrease in the percentage of hospitals below all the ratios. The absolute decrease was least in the actual mandated ratio in 2004 of at least 1 nurse per 6 patients (5.0% of hospitals below the ratio in 2003 versus 2.4% of hospitals in 2004), and the decrease was greatest in the highest ratio of at least 1 nurse per 4 patients (53.2% versus 40.4%). Although there was a decrease in the percentage of hospitals of all types below the minimum ratios from 2003 to 2004, some hospital types had larger reductions in hospitals below ratios than others. The types of hospitals with the most significant decreases in the percentage below minimum ratios were for‐profit hospitals, hospitals in more competitive markets, nonteaching hospitals, urban hospitals, and non‐safety‐net hospitals with a low percentage of Medicaid/uninsured patients.
Types of Hospitals Below Minimum Ratios
One of the most important considerations is the type of hospital in 2004 below the minimum ratio of at least 1 nurse (RN+LVN) per 5 patients implemented January 1, 2005. The hospital types with the highest percentage of hospitals below the 1:5 ratio were those with a high proportion of Medicaid/uninsured (21.7%), government owned (21.1%), nonteaching (12.0%), urban (11.9%), and in more competitive markets (11.7%). Of note, hospitals with a high proportion of Medicaid/uninsured patients were significantly more likely than hospitals with a low proportion of Medicaid patients to be below minimum ratios. These safety net hospitals also failed to achieve the significant decrease in percentage of hospitals below minimum ratios from 2003 to 2004 that hospitals with a low Medicaid population achieved. There were a total of 38 of 332 hospitals (11.4%) whose ratios were below the minimum of at least 1 nurse (RN+LVN) per 5 patients in 2004 (Table 1). Using the broader definition of hospital safety net, which includes urban nonprofit and government hospitals in addition to those hospitals with a high percentage of Medicaid/uninsured patients, the vast majority of hospitals (84%)32 of 38below the minimum ratio of 1:5 in 2004 were part of the hospital safety net.
DISCUSSION
These data demonstrate that nurse staffing ratios in California were relatively stable from 1993 to 1999. In 1999, law AB 394 with its focus on nurse staffing levels passed, and subsequently, from 1999 to 2004, nurse staffing levels increased significantly, with the largest increase in 2004, the year of implementation. Although multiple factors could account for this trend, a likely cause for the statewide increase in nurse staffing was the anticipation and then implementation of legislation to achieve minimum ratios.
This study had several limitations. The OSHPD data capture nurse staffing on an annual basis, but the California legislation mandated minimum nurse staffing ratios be kept at all times; these data do not capture how often a given hospital was below the minimum ratio on a monthly or shift‐by‐shift basis. These data may overreport nurse staffing hours if they include hours not spent in direct patient care, or they could misrepresent nurse staffing ratios because of poor reporting.
Certain hospitals are more likely to be below mandated ratios. These hospitals are often government owned, in urban areas, and serve a high percentage of Medicaid/uninsured patients. Hospitals with these characteristics are typically considered part of the safety net. These are the hospitals that serve our nation's most vulnerable populations and are likely to struggle disproportionately to meet minimum mandated ratios. As evidence of these precarious finances, 67% of hospitals defined as safety‐net hospitals based on a high percentage of Medicaid/uninsured patients in 2004 had a negative operating margin versus 40% of hospitals not considered to be safety‐net hospitals (P < .001).18 The question remains how hospitals will meet minimum nurse staffing ratios given these tenuous operating margins, as some of the approaches might result in restricted access, reduced services, reduced expenditures on new equipment or technology, or other decisions that might adversely affect quality. These potential tradeoffs will directly affect hospitalists, nurses, and other health care personnel working in hospitals. Because legislation generally does not provide funds or mechanisms to help hospitals meet proposed staffing ratios and there is a national nursing shortage, hospitals may struggle to meet minimum ratios. Cross‐sectional studies have demonstrated a potential link between increased nurse staffing and better patient outcomes,15 but if a financially constrained hospital makes tradeoffs by restricting access to care and services or by diverting funds from other beneficial uses, on balance, mandated nurse staffing ratios may not be beneficial to patients. The potential for unintended but serious negative consequences exists if hospitals in the safety net are mandated to meet minimum nurse staffing ratios without adequate resources.
At all types of hospitals, hospitalists are increasingly becoming responsible for quality improvement programs and outcomes measurement. However, the outcomes of these programs may be strongly influenced by nurse staffing. For example, cross‐sectional studies have demonstrated that increased nurse staffing was associated with decreased mortality, length of stay, failure to rescue from complications, catheter‐associated bloodstream infections, catheter‐associated urinary tract infections, gastrointestinal bleeding, ventilator‐acquired pneumonia, and shock or cardiac arrest.1, 4, 19 These types of quality and patient safety outcomes are likely to be the focus of many hospitalist‐led quality improvement programs and may even be linked to hospitalist compensation. Therefore, hospitals and their hospitalists must take into account the effect that inadequate nurse staffing could have on their patient outcomes while balancing the investment in nurse staffing with other quality improvement investments. An interaction between nurse staffing level and hospitalist staffing may exist, but we are unaware of any published studies investigating this interaction. The nurse burnout documented to be associated with inadequate nurse staffing certainly could affect hospitalists if it increases nurse turnover or inhibits effective communication.1 Additional research is needed to better delineate the effects of nurse staffing, particularly in regard to hospitalists and hospital‐based quality and safety initiatives.
Finally, these data highlight the need for policymakers and hospital administrators to consider whether the aim is to establish a minimal floor or an optimal ratio. California first opted for what many would consider a minimal floor of at least 1 nurse per 6 patients, as only 5% of hospitals were below this ratio in 2003. California then increased the ratio to a 1:5 nurse‐to‐patient ratio, which affected a larger percentage of hospitals, presumably because of a belief that this higher ratio would lead to better outcomes. In addition, some states such as Massachusetts have considered a minimum ratio of 1:4.17 A ratio of 1:4 would require a significant proportion of hospitals to hire more nurses if staffing levels are similar to California. Only a few studies have estimated the cost effectiveness of staffing changes. Based on cross‐sectional data, Needleman et al. estimated that it would cost $8.5 billion nationally to raise all hospitals to the 75th percentile of RN and overall nurse staffing but that this would prevent 70,000 adverse patient outcomes (eg, hospital‐acquired pneumonia). Rothberg et al. estimated that the incremental cost per life saved as a hospital moved from 1 nurse per 8 patients to 1 nurse per 5 patients was $48,100. However, these estimates based on cross‐sectional data fail to inform the debate on optimal nurse staffing ratios. The effect on patient outcomes when hospitals move from 1:6 to 1:5 or 1:4 nurse staffing levels needs to be determined in a longitudinal study. Thus, legislators and hospitals have little to guide them in establishing optimal nurse staffing ratios, and consideration of specific mandated minimum ratios would benefit greatly from comparative information on the cost and quality tradeoffs.
Hospitals, policy makers, health care providers, and researchers are struggling to improve the health care delivered in our hospitals; fortunately, there has been an increased focus on the importance of nurses who deliver medical care on the front lines and are responsible for many aspects of quality. Mandating minimum nurse staffing ratios may seem like an easy fix of the problem; however, we must consider how these ratios can be met, the potential difficulty for hospitals to meet these ratios in the fraying safety net20, and possible unintended negative consequences. Without a mechanism for hospitals to meet ratios, simply mandating a minimum ratio will not necessarily improve care. Hospitalists should be leaders in better understanding the effects of nurse staffing on patient outcomes and quality initiatives in hospitals.
Acknowledgements
We acknowledge the California Office of Statewide Health Planning and Development (OSHPD) for providing the data for this study.
- ,,,,.Hospital nurse staffing and patient mortality, nurse burnout, and job dissatisfaction.JAMA.2002;288:1987–1993.
- ,.Working conditions that support patient safety.J Nurs Care Qual.2005;20:289–292.
- ,,,,.Nurse‐patient ratios: a systematic review on the effects of nurse staffing on patient, nurse employee, and hospital outcomes.J Nurs Adm.2004;34:326–337.
- ,,,,.Nurse‐staffing levels and the quality of care in hospitals.N Engl J Med.2002;346:1715–1722.
- ,,,,.Making health care safer: a critical analysis of patient safety practices.Evid Rep Technol Assess (Summ).2001;43:i–x,1–668.
- Implementation of California's Nurse Staffing Law: History of the Law. Available at: http://www.calhealth.org/public/press/Article%5C113%5CImplementation%20of%20CA%20Nurse%20Ratio%20Law,%20History%20of%20 the%20Law.pdf. Accessed September 5,2007.
- AB 394: California and the Demand for Safe and Effective Nurse to Patient Ratios. Available at: http://www.calnurses.org/research/pdfs/IHSP_AB394_staffing_ratios.pdf. Accessed September 5,2007.
- . Information regarding R‐01‐04E: Licensed Nurse‐to‐Patient Ratio. Available at: http://www.dhs.ca.gov/lnc/pubnotice/NTPR/DADMmemoSupCourtDecision.pdf. Accessed December 3,2006.
- Nationwide State Legislative Agenda: Nurse Staffing Plans and Ratios. Available at: http://www.nursingworld.org/GOVA/state.htm. Accessed April 10,2007.
- Staffing Plans and Ratios. Available at: http://nursingworld.org/MainMenuCategories/ThePracticeofProfessionalNursing/workplace/Workforce/ShortageStaffing/Staffing/staffing12765.aspx. Accessed September 5,2007.
- .California's minimum nurse‐to‐patient ratios: the first few months.J Nurs Adm.2004;34:571–578.
- ,.Addressing measurement error bias in nurse staffing research.Health Serv Res.2006;41:2006–2024.
- Institute of Medicine.America's Health Care Safety Net. Washington, DC;2000.
- ,.Population characteristics of markets of safety‐net and non‐safety‐net hospitals.J Urban Health.1999;76:351–370.
- ,.The evolution of support for safety‐net hospitals.Health Aff (Millwood).1997;16:30–47.
- ,.The effects of hospital competition and the Medicare PPS program on hospital cost behavior in California.J Health Econ.1988;7:301–320.
- Massachusetts Nursing Association. Specific RN‐to‐Patient Ratios. Available at: http://www.massnurses.org/safe_care/ratios.htm. Accessed April 1,2007.
- Office of Statewide Health Planning and Development. Available at: http://www.oshpd.state.ca.us/HQAD/Hospital/financial/hospAF.htm. Accessed May 6,2007.
- ,,, et al.Nurse working conditions and patient safety outcomes.Med Care.2007;45:571–578.
- .By a thread—a fragile, fraying safety net is everybody's problem.Hosp Health Netw.2002;76:32,34–40.
Many studies have reported associations between higher nurse‐to‐patient ratios and decreased mortality and complications. These studies coupled with increasing concern about patient safety, nursing shortages, and nurse burnout have spurred many state legislatures to discuss mandating minimum nurse staffing ratios.15 The California legislature passed law AB394 in 1999, mandating minimum nurse staffing ratios in order to improve patient safety and the nurse work environment. The original implementation date, January 1, 2001, was delayed to allow the California Department of Health Services more time to develop minimum nurse ratios for each unit type.6, 7 California implemented a ratio of at least 1 licensed nurse (RN+LVN) for every 6 patients on general adult medical‐surgical floors on January 1, 2004. This was subsequently increased, on January 1, 2005, to at least 1 licensed nurse for every 5 patients, a ratio that was upheld by the California Supreme Court on March 14, 2005.8
Additional laws regarding nurse staffing are being considered in at least 25 states.9 States have taken 3 main approaches to legislation: mandating nurse staffing ratios for each hospital unit type, requiring hospitals to establish and report nurse staffing plans that typically include ratios, or a combination of mandated ratios and staffing plans.10 This type of legislation would have a major impact on hospitalists, nurses, other health care personnel, hospital administrators, and patients. However, little is known about trends in nurse staffing, how staffing levels vary among hospitals overall, in different markets, and by ownership type and location, and consequently how implementing nurse staffing ratios will affect different types of hospitals, including those that make up the safety net.11
California nurse staffing data are better than many other sources because the state provides nurse staffing hours by unit types in hospitals as opposed to aggregate numbers of nurse hours across an entire hospital or medical center.12 California is also at the forefront of mandated minimum nurse staffing legislation, as it is the only state to have enacted nurse staffing ratio legislation. Examining nurse staffing trends and hospital types currently under mandated or proposed nurse staffing ratios is integral to informing the debate on nurse staffing legislation and its effect on hospitalists. We hypothesized that nurse staffing would increase in California after the legislation was passed in 1999 but that safety‐net hospitals such as those that are urban, government owned, and serving a high percentage of Medicaid and uninsured patients would be more likely to be below minimum ratios.13
MATERIALS AND METHODS
We used hospital financial panel data for 1993 through 2004, the most recent year with complete data, from California's Office of Statewide Health Planning and Development (OSHPD). We included only short‐term acute‐care general hospitals and excluded other hospital types such as long‐term care, children's, and psychiatric hospitals. We investigated staffing of adult general medical‐surgical units and not of other types of units such as intensive care units. The numerator of the staffing variables for each hospital was the combined medical‐surgical productive hours for registered nurses (RNs) and licensed vocational nurses (LVNs), as California allows up to 50% of staffing hours to be LVN hours. Staffing hours of the adult general medical‐surgical units of each hospital are reported on an annual basis. The denominator was total patient days on the acute adult medical‐surgical units of each hospital in a given year. We calculated the number of patients per one nurse by dividing 24 by the nurse hours per patient day (eg, 4.0 nurse hours per patient day is equivalent to a nurse‐to‐patient ratio of 1:6). We did not adjust staffing ratios by the hospital case mix or other factors because the ratio legislation did not take these factors into account.
We further evaluated staffing ratios in 2003 and 2004 based on 5 hospital characteristics: hospital ownership, market competitiveness, teaching status, urban versus rural location, and safety‐net hospitals, using 2 common definitions for the latter. The Institute of Medicine report defines safety‐net providers as those with a substantial share of their patient mix from uninsured and Medicaid populations.13 Safety‐net hospitals have been more specifically defined as short‐term general hospitals whose percentage of Medicaid and uninsured patients is greater than 1 standard deviation above the mean.14 Using this definition, hospitals in California where more than 36% of patients had Medicaid or no insurance in 2004 would be considered safety‐net hospitals. A more comprehensive definition of the hospital safety net that has been used includes urban nonprofit and government hospitals and hospitals with a high percentage of Medicaid/uninsured patients.10, 11, 15 We analyzed nurse staffing ratios using both these definitions. Hospital ownership was designated as for profit, nonprofit, or government owned. Hospital competitiveness was measured using the Hirschman‐Herfindahl Index (HHI), or the sum of squared market shares, a standard approach to defining hospital market competition. Market boundaries were defined as those zip codes from which each hospital draws most of its patients.16 We then dichotomized hospitals into a high‐ or low‐competition category based on the approximate median HHI cut point of 0.34. Teaching status was based on intern/resident‐to‐bed ratio (ie, 0 = nonteaching, 0.010.25 = minor teaching, and >0.25 = major teaching). Location was defined by county location as either urban or nonurban medical service area.
We then analyzed the percentage of hospitals in 2003 and 2004 below the mandated minimum ratios of (1) at least 1 licensed nurse (RN+LVN) per 6 patients effective in 2004, (2) the ratio of 1 (RN+LVN) nurse per 5 patients to be implemented in 2005, (3) the ratio of at least 1 registered nurse (RN only) per 5 patients, and (4) at least 1 nurse (RN+LVN) per 4 patients, as these ratios are under consideration in other states.9, 17 Finally, we examined the trend in nurse staffing ratios from 2003, the pre‐implementation year, to 2004, the post‐implementation year. Data analysis was performed using STATA SE 9.1 (College Station, TX).
RESULTS
Nurse Staffing Trends
The trend in nurse staffing ratios based on licensed nurses (RN + LVN) from 1993 to 2004 is shown in Figure 1, with lines representing the 10th, 25th, 50th (median), and 75th percentiles of hospital nurse staffing ratios. The nurse staffing ratios were essentially flat from 1993 to 1999 without any significant trend. After nurse staffing legislation was passed in 1999, median nurse‐to‐patient ratio rose, with the largest increase from 2003 to the implementation year for staffing ratios, 2004. From 2003 to 2004, the median hospital staffing ratio increased from fewer than 1 nurse per 4 patients to a ratio of more than 1 nurse per 4 patients. The first year that fewer than 25% of hospitals were below the minimum of at least 1 nurse per 5 patients was 2003.
Trends in Nurse Staffing Mix
The legislation in California and the proposed legislation in some other states allow hospitals to meet mandated ratios with both RNs and LVNs or LPNs, that is, with licensed nursing staff. Specifically, California allows up to 50% of nurse staffing ratios to be met by LVN hours. Therefore, we analyzed the overall trend in percentage of nurse staffing hours attributable to LVNs. In 1993, LVNs accounted for 27% of nurse staffing hours. Because of a steady decrease in the proportion of LVNs staffing relative to RNs staffing, LVNs accounted for only 13% of the nurse staffing hours by 2004.
Hospitals Below Implemented and Proposed Ratios
The first column of Table 1 shows the percentage of hospitals of each type in 2003 and 2004 below the mandated ratio of at least 1 licensed nurse (RN+LVN) per 6 patients, which went into effect January 1, 2004. The next column represents the hospitals below the ratio of at least 1 licensed nurse per 5 patients, which was implemented in 2005. The final 2 columns represent ratios that have been considered in other states of at least 1 RN per 5 patients and at least 1 licensed nurse per 4 patients.9, 17 In 2004, only 2.4% of hospitals were below a minimum ratio of at least 1 nurse (RN+LVN) per 6 patients, but 11.4% were below 1:5, 29.5% were below 1 RN per 5 patients, and 40.4% were below at least 1 nurse (RN+LVN) per 4 patients. This demonstrates the substantial increase in the proportion of hospitals that are below minimum ratios as the number of nurses or required training level of nurses is increased.
| <1 Nurse per 6 patients (RN+LVN)* | <1 Nurse per 5 patients (RN+LVN)* | <1 Nurse per 5 patients (RN only)* | <1 Nurse per 4 patients (RN+LVN)* | |||||
|---|---|---|---|---|---|---|---|---|
| 2003 (%) | 2004 (%) | 2003 (%) | 2004 (%) | 2003 (%) | 2004 (%) | 2003 (%) | 2004 (%) | |
| ||||||||
| All hospitals (2003, n = 342; 2004, n = 332) | 5.0% | 2.4% | 19.6% | 11.4% | 39.8 | 29.5% | 53.2% | 40.4% |
| Hospital ownership‖ | ||||||||
| For‐profit (2003, n = 87; 2004, n = 82) | 2.3% | 1.2% | 25.3% | 9.8% | 54.0 | 32.9% | 63.2% | 40.2% |
| Nonprofit (2003, n = 234; 2004, n = 231) | 5.6% | 3.0% | 16.7% | 11.3% | 34.6 | 28.1% | 49.6% | 40.7% |
| Government (2003, n = 21; 2004, n = 19) | 9.5% | 0% | 28.6% | 21.1% | 38.1 | 31.6% | 52.4% | 36.8% |
| More competitive versus less competitive markets‖ | ||||||||
| More competitive (2003, n = 168; 2004, n = 163) | 6.0% | 2.6% | 25.0% | 11.7% | 46.4 | 33.8% | 59.3% | 42.2% |
| Less competitive (2003, n = 174; 2004, n = 169) | 4.0% | 2.2% | 14.4% | 11.2% | 33.3 | 25.8% | 48.3% | 38.8% |
| Teaching status‖ | ||||||||
| No teaching (2003 n = 250; 2004 n = 251) | 5.6% | 2.4% | 20.4% | 12.0% | 42.0% | 30.7% | 56.0% | 41.0% |
| Minor teaching (2003 n = 72; 2004 n = 60) | 2.8% | 3.3% | 18.1% | 10.0% | 36.5% | 28.3% | 48.6% | 41.7% |
| Major teaching (2003 n = 20; 2004 n = 21) | 5.0% | 0% | 15.0% | 9.5% | 20.0% | 19.0% | 35.0% | 28.6% |
| Urban versus nonurban‖ | ||||||||
| Urban (2003 n = 306; 2004 n = 294) | 4.9% | 2.4% | 20.9% | 11.9% | 41.2% | 30.6% | 55.6% | 42.5% |
| Nonurban (2003 n = 36; 2004 n = 38) | 5.6% | 2.6% | 8.3% | 7.9% | 27.8% | 21.1% | 33.3% | 23.7% |
| High versus low Medicaid/uninsured patient population‖ | ||||||||
| High (36%; 2003, n = 65; 2004, n = 60) | 6.2% | 5.0% | 30.8% | 21.7% | 50.8% | 43.3% | 64.6% | 48.7% |
| Low (<36%; 2003, n = 276; 2004, n = 270) | 4.7% | 1.9% | 17.0% | 9.3% | 37.3% | 26.7% | 50.7% | 39.3% |
Nurse Staffing Ratio Changes in First Year of Implementation of Legislation
From 2003 to 2004, there was a decrease in the percentage of hospitals below all the ratios. The absolute decrease was least in the actual mandated ratio in 2004 of at least 1 nurse per 6 patients (5.0% of hospitals below the ratio in 2003 versus 2.4% of hospitals in 2004), and the decrease was greatest in the highest ratio of at least 1 nurse per 4 patients (53.2% versus 40.4%). Although there was a decrease in the percentage of hospitals of all types below the minimum ratios from 2003 to 2004, some hospital types had larger reductions in hospitals below ratios than others. The types of hospitals with the most significant decreases in the percentage below minimum ratios were for‐profit hospitals, hospitals in more competitive markets, nonteaching hospitals, urban hospitals, and non‐safety‐net hospitals with a low percentage of Medicaid/uninsured patients.
Types of Hospitals Below Minimum Ratios
One of the most important considerations is the type of hospital in 2004 below the minimum ratio of at least 1 nurse (RN+LVN) per 5 patients implemented January 1, 2005. The hospital types with the highest percentage of hospitals below the 1:5 ratio were those with a high proportion of Medicaid/uninsured (21.7%), government owned (21.1%), nonteaching (12.0%), urban (11.9%), and in more competitive markets (11.7%). Of note, hospitals with a high proportion of Medicaid/uninsured patients were significantly more likely than hospitals with a low proportion of Medicaid patients to be below minimum ratios. These safety net hospitals also failed to achieve the significant decrease in percentage of hospitals below minimum ratios from 2003 to 2004 that hospitals with a low Medicaid population achieved. There were a total of 38 of 332 hospitals (11.4%) whose ratios were below the minimum of at least 1 nurse (RN+LVN) per 5 patients in 2004 (Table 1). Using the broader definition of hospital safety net, which includes urban nonprofit and government hospitals in addition to those hospitals with a high percentage of Medicaid/uninsured patients, the vast majority of hospitals (84%)32 of 38below the minimum ratio of 1:5 in 2004 were part of the hospital safety net.
DISCUSSION
These data demonstrate that nurse staffing ratios in California were relatively stable from 1993 to 1999. In 1999, law AB 394 with its focus on nurse staffing levels passed, and subsequently, from 1999 to 2004, nurse staffing levels increased significantly, with the largest increase in 2004, the year of implementation. Although multiple factors could account for this trend, a likely cause for the statewide increase in nurse staffing was the anticipation and then implementation of legislation to achieve minimum ratios.
This study had several limitations. The OSHPD data capture nurse staffing on an annual basis, but the California legislation mandated minimum nurse staffing ratios be kept at all times; these data do not capture how often a given hospital was below the minimum ratio on a monthly or shift‐by‐shift basis. These data may overreport nurse staffing hours if they include hours not spent in direct patient care, or they could misrepresent nurse staffing ratios because of poor reporting.
Certain hospitals are more likely to be below mandated ratios. These hospitals are often government owned, in urban areas, and serve a high percentage of Medicaid/uninsured patients. Hospitals with these characteristics are typically considered part of the safety net. These are the hospitals that serve our nation's most vulnerable populations and are likely to struggle disproportionately to meet minimum mandated ratios. As evidence of these precarious finances, 67% of hospitals defined as safety‐net hospitals based on a high percentage of Medicaid/uninsured patients in 2004 had a negative operating margin versus 40% of hospitals not considered to be safety‐net hospitals (P < .001).18 The question remains how hospitals will meet minimum nurse staffing ratios given these tenuous operating margins, as some of the approaches might result in restricted access, reduced services, reduced expenditures on new equipment or technology, or other decisions that might adversely affect quality. These potential tradeoffs will directly affect hospitalists, nurses, and other health care personnel working in hospitals. Because legislation generally does not provide funds or mechanisms to help hospitals meet proposed staffing ratios and there is a national nursing shortage, hospitals may struggle to meet minimum ratios. Cross‐sectional studies have demonstrated a potential link between increased nurse staffing and better patient outcomes,15 but if a financially constrained hospital makes tradeoffs by restricting access to care and services or by diverting funds from other beneficial uses, on balance, mandated nurse staffing ratios may not be beneficial to patients. The potential for unintended but serious negative consequences exists if hospitals in the safety net are mandated to meet minimum nurse staffing ratios without adequate resources.
At all types of hospitals, hospitalists are increasingly becoming responsible for quality improvement programs and outcomes measurement. However, the outcomes of these programs may be strongly influenced by nurse staffing. For example, cross‐sectional studies have demonstrated that increased nurse staffing was associated with decreased mortality, length of stay, failure to rescue from complications, catheter‐associated bloodstream infections, catheter‐associated urinary tract infections, gastrointestinal bleeding, ventilator‐acquired pneumonia, and shock or cardiac arrest.1, 4, 19 These types of quality and patient safety outcomes are likely to be the focus of many hospitalist‐led quality improvement programs and may even be linked to hospitalist compensation. Therefore, hospitals and their hospitalists must take into account the effect that inadequate nurse staffing could have on their patient outcomes while balancing the investment in nurse staffing with other quality improvement investments. An interaction between nurse staffing level and hospitalist staffing may exist, but we are unaware of any published studies investigating this interaction. The nurse burnout documented to be associated with inadequate nurse staffing certainly could affect hospitalists if it increases nurse turnover or inhibits effective communication.1 Additional research is needed to better delineate the effects of nurse staffing, particularly in regard to hospitalists and hospital‐based quality and safety initiatives.
Finally, these data highlight the need for policymakers and hospital administrators to consider whether the aim is to establish a minimal floor or an optimal ratio. California first opted for what many would consider a minimal floor of at least 1 nurse per 6 patients, as only 5% of hospitals were below this ratio in 2003. California then increased the ratio to a 1:5 nurse‐to‐patient ratio, which affected a larger percentage of hospitals, presumably because of a belief that this higher ratio would lead to better outcomes. In addition, some states such as Massachusetts have considered a minimum ratio of 1:4.17 A ratio of 1:4 would require a significant proportion of hospitals to hire more nurses if staffing levels are similar to California. Only a few studies have estimated the cost effectiveness of staffing changes. Based on cross‐sectional data, Needleman et al. estimated that it would cost $8.5 billion nationally to raise all hospitals to the 75th percentile of RN and overall nurse staffing but that this would prevent 70,000 adverse patient outcomes (eg, hospital‐acquired pneumonia). Rothberg et al. estimated that the incremental cost per life saved as a hospital moved from 1 nurse per 8 patients to 1 nurse per 5 patients was $48,100. However, these estimates based on cross‐sectional data fail to inform the debate on optimal nurse staffing ratios. The effect on patient outcomes when hospitals move from 1:6 to 1:5 or 1:4 nurse staffing levels needs to be determined in a longitudinal study. Thus, legislators and hospitals have little to guide them in establishing optimal nurse staffing ratios, and consideration of specific mandated minimum ratios would benefit greatly from comparative information on the cost and quality tradeoffs.
Hospitals, policy makers, health care providers, and researchers are struggling to improve the health care delivered in our hospitals; fortunately, there has been an increased focus on the importance of nurses who deliver medical care on the front lines and are responsible for many aspects of quality. Mandating minimum nurse staffing ratios may seem like an easy fix of the problem; however, we must consider how these ratios can be met, the potential difficulty for hospitals to meet these ratios in the fraying safety net20, and possible unintended negative consequences. Without a mechanism for hospitals to meet ratios, simply mandating a minimum ratio will not necessarily improve care. Hospitalists should be leaders in better understanding the effects of nurse staffing on patient outcomes and quality initiatives in hospitals.
Acknowledgements
We acknowledge the California Office of Statewide Health Planning and Development (OSHPD) for providing the data for this study.
- ,,,,.Hospital nurse staffing and patient mortality, nurse burnout, and job dissatisfaction.JAMA.2002;288:1987–1993.
- ,.Working conditions that support patient safety.J Nurs Care Qual.2005;20:289–292.
- ,,,,.Nurse‐patient ratios: a systematic review on the effects of nurse staffing on patient, nurse employee, and hospital outcomes.J Nurs Adm.2004;34:326–337.
- ,,,,.Nurse‐staffing levels and the quality of care in hospitals.N Engl J Med.2002;346:1715–1722.
- ,,,,.Making health care safer: a critical analysis of patient safety practices.Evid Rep Technol Assess (Summ).2001;43:i–x,1–668.
- Implementation of California's Nurse Staffing Law: History of the Law. Available at: http://www.calhealth.org/public/press/Article%5C113%5CImplementation%20of%20CA%20Nurse%20Ratio%20Law,%20History%20of%20 the%20Law.pdf. Accessed September 5,2007.
- AB 394: California and the Demand for Safe and Effective Nurse to Patient Ratios. Available at: http://www.calnurses.org/research/pdfs/IHSP_AB394_staffing_ratios.pdf. Accessed September 5,2007.
- . Information regarding R‐01‐04E: Licensed Nurse‐to‐Patient Ratio. Available at: http://www.dhs.ca.gov/lnc/pubnotice/NTPR/DADMmemoSupCourtDecision.pdf. Accessed December 3,2006.
- Nationwide State Legislative Agenda: Nurse Staffing Plans and Ratios. Available at: http://www.nursingworld.org/GOVA/state.htm. Accessed April 10,2007.
- Staffing Plans and Ratios. Available at: http://nursingworld.org/MainMenuCategories/ThePracticeofProfessionalNursing/workplace/Workforce/ShortageStaffing/Staffing/staffing12765.aspx. Accessed September 5,2007.
- .California's minimum nurse‐to‐patient ratios: the first few months.J Nurs Adm.2004;34:571–578.
- ,.Addressing measurement error bias in nurse staffing research.Health Serv Res.2006;41:2006–2024.
- Institute of Medicine.America's Health Care Safety Net. Washington, DC;2000.
- ,.Population characteristics of markets of safety‐net and non‐safety‐net hospitals.J Urban Health.1999;76:351–370.
- ,.The evolution of support for safety‐net hospitals.Health Aff (Millwood).1997;16:30–47.
- ,.The effects of hospital competition and the Medicare PPS program on hospital cost behavior in California.J Health Econ.1988;7:301–320.
- Massachusetts Nursing Association. Specific RN‐to‐Patient Ratios. Available at: http://www.massnurses.org/safe_care/ratios.htm. Accessed April 1,2007.
- Office of Statewide Health Planning and Development. Available at: http://www.oshpd.state.ca.us/HQAD/Hospital/financial/hospAF.htm. Accessed May 6,2007.
- ,,, et al.Nurse working conditions and patient safety outcomes.Med Care.2007;45:571–578.
- .By a thread—a fragile, fraying safety net is everybody's problem.Hosp Health Netw.2002;76:32,34–40.
Copyright © 2008 Society of Hospital Medicine