User login
In the United States, general medical inpatient care is increasingly provided by hospital‐based physicians, also called hospitalists.1 The field of pediatrics is no exception, and by 2005 there were an estimated 1000 pediatric hospitalists in the workforce.2 Current numbers are likely to be greater than 2500, as the need for pediatric hospitalists has grown considerably.
At the same time, the quality of care delivered by the United States health system has come under increased scrutiny. In 2001, the Institute of Medicine, in its report on the quality of healthcare in America, concluded that between the care we have and what we could have lies not just a gap but a chasm.3 Meanwhile, the cost of healthcare delivery continues to increase. The pressure to deliver cost‐effective, high quality care is among the more important forces driving the proliferation of hospitalists.4
Over the last decade, data supporting the role of hospitalists in improving quality of care for adult patients has continued to accumulate.58 A 2007 retrospective cohort study by Lindenaur et al.7 included nearly 77,000 adult patients and found small reductions in length of stay without adverse effects on mortality or readmission rates, and a 2009 systematic review by Peterson6 included 33 studies and concluded that in general inpatient care of general medical patients by hospitalist physicians leads to decreased hospital cost and length of stay. A 2002 study by Meltzer et al.8 is also interesting, suggesting that improvements in costs and short‐term mortality are related to the disease‐specific experience of hospitalists.
Similar data for pediatric hospitalists has been slower to emerge. A systematic review of the literature by Landrigan et al., which included studies through 2004, concluded that [R]esearch suggests that pediatric hospitalists decrease costs and length of stay . The quality of care in pediatric hospitalist systems is unclear, because rigorous metrics to evaluate quality are lacking.9 Since the publication of that review, there have been multiple studies which have sought to evaluate the quality of pediatric hospitalist systems. This review was undertaken to synthesize this new information, and to determine the effect of pediatric hospitalist systems on quality of care.
METHODS
A review of the available English language literature on the Medline database was undertaken in November of 2010 to answer the question, What are the differences in quality of care and outcomes of inpatient medical care provided by hospitalists versus non‐hospitalists in the pediatric population? Care metrics of interest were categorized according to the Society of Hospital Medicine's recommendations for measuring hospital performance.10
Search terms used (with additional medical subject headings [MeSH] terms in parenthesis) were hospital medicine (hospitalist), pediatrics (child health, child welfare), cost (cost and cost analysis), quality (quality indicators, healthcare), outcomes (outcome assessment, healthcare; outcomes and process assessment, healthcare); volume, patient satisfaction, length of stay, productivity (efficiency), provider satisfaction (attitude of health personnel, job satisfaction), mortality, and readmission rate (patient readmission). The citing articles search tool was used to identify other articles that potentially could meet criteria. Finally, references cited in the selected articles, as well as in excluded literature reviews, were searched for additional articles.
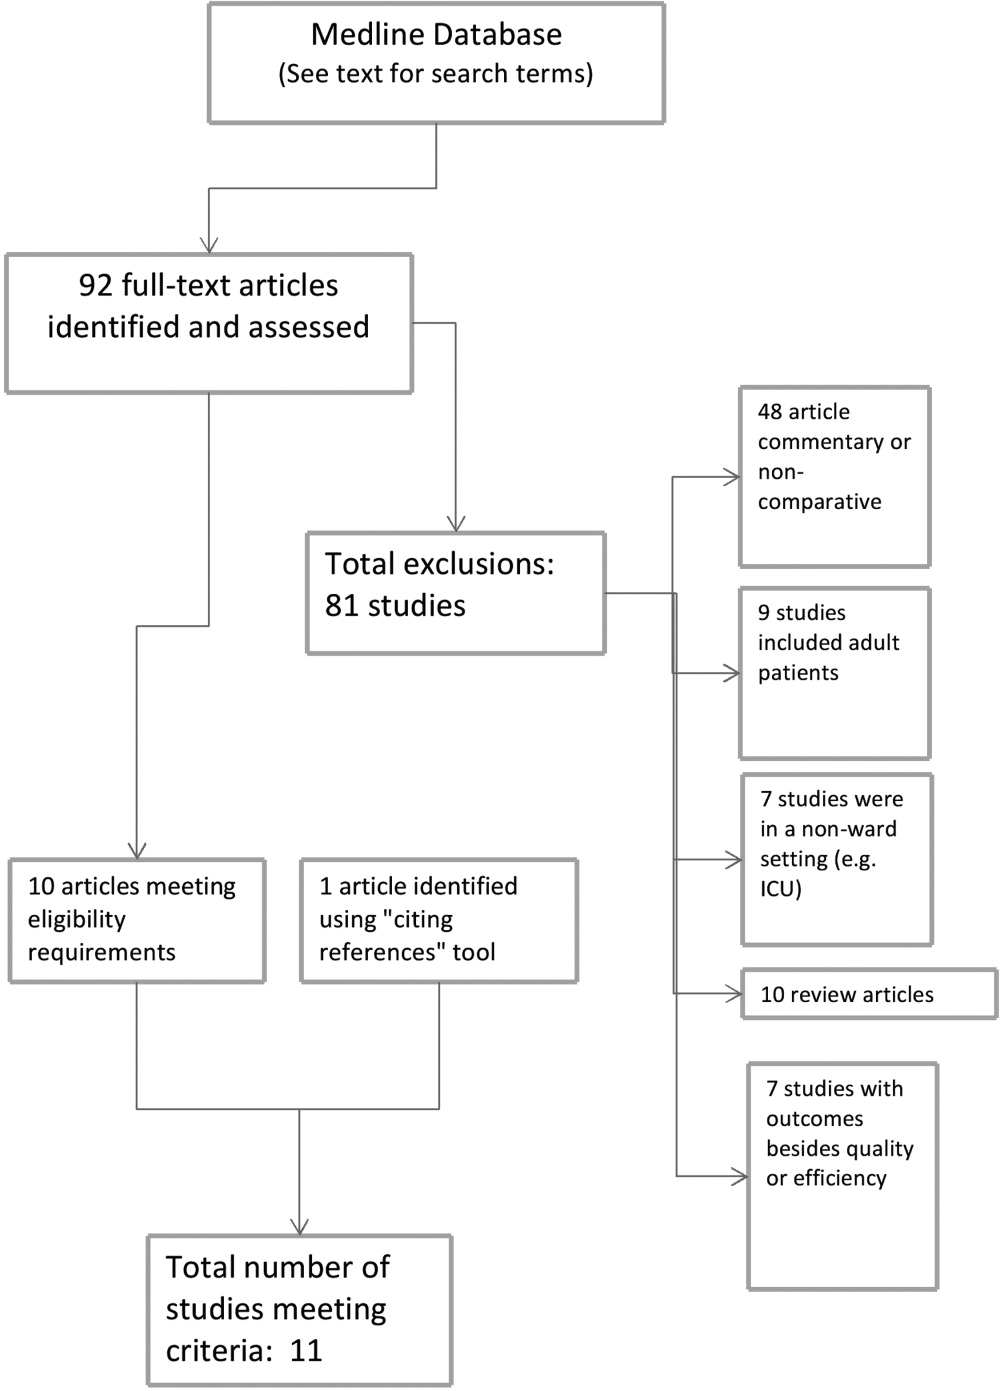
Articles were deemed eligible if they were published in a peer‐reviewed journal, if they had a comparative experimental design for hospitalists versus non‐hospitalists, and if they dealt exclusively with pediatric hospitalists. Noncomparative studies were excluded, as were studies that pertained to settings besides that of an inpatient pediatrics ward, such as pediatric intensive care units or emergency rooms. The search algorithm is diagrammed in Figure 1.
The selected articles were reviewed for the relevant outcome measures. The quality of each article was assessed using the Oxford Centre for Evidence‐Based Medicine levels of evidence,11 a widely accepted standard for critical analysis of studies. Levels of evidence are assigned to studies, from 1a (systematic reviews of randomized controlled trials) to 5 (expert opinion only). Well‐conducted prospective cohort studies receive a rating of 2c; those with wide confidence intervals due to small sample size receive a minus () modifier. This system does not specifically address survey studies, which were therefore not assigned a level of evidence.
RESULTS
The screening process yielded 92 possible relevant articles, which were then reviewed individually (by G.M.M.) by title and abstract. A total of 81 articles were excluded, including 48 studies that were either noncomparative or descriptive in nature. Ten of the identified articles were reviews and did not contain primary data. Nine studies were not restricted to the pediatric population. Also excluded were 7 studies that did not have outcomes related to quality (eg, billing performance), and 7 studies of hospitalists in settings besides general pediatric wards (eg, pediatric intensive care units). Ten studies were thus identified. The cited reference tool was used to identify an additional article which met criteria, yielding 11 total articles that were included in the review.
Five of the identified studies published prior to 2005 were previously reviewed by Landrigan et al.9 Since then, 6 additional studies of similar nature have been published and were included here. Articles that met criteria but appeared in an earlier review are included in Table 1; new articles appear in Table 2. The results of all 11 articles were included for this discussion.
| Source | Site | Study Design | Outcomes Measured (Oxford Level of Evidence) | Results for Hospitalists |
|---|---|---|---|---|
| ||||
| Bellet and Whitaker13 (2000) | Cincinnati Children's Hospital Medical Center, Cincinnati, OH | 1440 general pediatric patients | LOS, costs (2c) | LOS shorter (2.4 vs 2.7 days) |
| Retrospective cohort study | Readmission rate, subspecialty consultations, mortality (2c, low power) | Costs lower ($2720 vs $3002) | ||
| Readmissions higher for hospitalists (1% vs 3%) | ||||
| No differences in consultations | ||||
| No mortality in study | ||||
| Ogershok et al.16 (2001) | West Virginia University Children's Hospitals, Morgantown, WV | 2177 general pediatric patients | LOS, cost (2c) | No difference in LOS |
| Retrospective cohort study | Readmission rate, patient satisfaction, mortality (2c, low power) | Costs lower ($1238 vs $1421) | ||
| Lab and radiology tests ordered less often | ||||
| No difference in mortality or readmission rates | ||||
| No difference in satisfaction scores | ||||
| Wells et al.15 (2001) | Valley Children's Hospital, Madera, CA | 182 general pediatric patients | LOS, cost, patient satisfaction, follow‐up rate (2c, low power) | LOS shorter (45.2 vs 66.8 hr; P = 0.01) |
| Prospective cohort study | No LOS or cost benefit for patients with bronchiolitis, gastroenteritis, or pneumonia | |||
| Costs lower ($2701 vs $4854; P = 0.005) for patients with asthma | ||||
| No difference in outpatient follow‐up rate | ||||
| Landrigan et al.14 (2002) | Boston Children's Hospital, Boston, MA | 17,873 general pediatric patients | LOS, cost (2c) | LOS shorter (2.2 vs 2.5 days) |
| Retrospective cohort study | Readmission rate, follow‐up rate, mortality (2c, low power) | Costs lower ($1139 vs $1356) | ||
| No difference in follow‐up rate | ||||
| No mortality in study | ||||
| Dwight et al.12 (2004) | Hospital for Sick Children, Toronto, Ontario, Canada | 3807 general pediatric patients | LOS (2c) | LOS shorter (from 2.9 to 2.5 days; P = 0.04) |
| Retrospective cohort study | Subspecialty consultations, readmission rate, mortality (2c, low power) | No difference in readmission rates | ||
| No difference in mortality | ||||
| Source | Site | Study Design | Outcomes Measured (Oxford Level of Evidence) | Results for Hospitalists |
|---|---|---|---|---|
| ||||
| Boyd et al.21 (2006) | St Joseph's Hospital and Medical Center, Phoenix, AZ | 1009 patients with 11 most common DRGs (3 groups) | Cost, LOS, and readmission rate (2c, low power) | LOS longer (2.6 2.0 vs 3.1 2.6 vs 2.9 2.3, mean SD) |
| Retrospective cohort study | Costs higher ($1781 $1449 (faculty) vs $1954 $1212 (hospitalist group 1) vs $1964 $1495 (hospitalist group 2) | |||
| No difference in readmission rates | ||||
| Conway et al.22 (2006) | National provider survey | 213 hospitalists and 352 community pediatrician survey responses | Self‐reported evidence‐based medicine use (descriptive study, no assignable level) | Hospitalists more likely to follow EBG for following: VCUG and RUS after first UTI, albuterol and ipratropium in first 24 hr for asthma |
| Descriptive study | Hospitalists less likely to use the following unproven therapies: levalbuterol and inhaled or oral steroids for bronchiolitis, stool culture or rotavirus testing for gastroenteritis, or ipratropium after 24 hr for asthma | |||
| Srivastava et al.17 (2007) | University of Utah Health Sciences Center, Salt Lake City, UT | 1970 patients with asthma, dehydration, or viral illness | LOS, cost (2c, no confidence intervals reported) | LOS shorter for asthma (0.23 days, 13%) and for dehydration (0.19 days, 11%) |
| Retrospective cohort study | No LOS difference for patients with viral illness | |||
| Costs lower for asthma ($105.51, 9.3%) and for dehydration ($86.22, 7.8%) | ||||
| Simon et al.19 (2007) | Children's Hospital of Denver, Denver, CO | 759 patients undergoing spinal fusion before and after availability of hospitalist consultation | LOS (4, unaccounted confounding factors) | LOS shorter, 6.5 (6.26.7) days to 4.8 (4.55.1) |
| Retrospective cohort study | ||||
| Bekmezian et al.18 (2008) | UCLA Hospital and Medical Center, Los Angeles, CA | 925 subspecialty patients on GI and Heme/Onc services vs hospitalist service | LOS, cost, readmission rate, mortality (2c, low power) | LOS shorter (38%, P < 0.01) |
| Retrospective cohort study | Cost lower (29%, P < 0.05) | |||
| Readmissions lower (36 for faculty vs none for hospitalists, P = 0.02) | ||||
| No difference in mortality | ||||
| Conway and Keren20 (2009) | Multicenter, 25 children's hospitals | 20,892 patients identified with UTI admissions in PHIS database | LOS, cost, evidence‐based medicine use (2c) | No difference in LOS |
| Retrospective cohort study | No difference in cost | |||
| No difference in performance of EBM guideline (VCUG and RUS for first UTI) | ||||
Effect on Length of Stay, Cost, and Resource Utilization
Ten articles addressed length of stay as an outcome measure, and 8 included cost as well. Five have been previously reported9 (see Table 1). Of these, Dwight et al.,12, Bellet and Whitaker,13 and Landrigan et al.14 found decreased length of stay (LOS) and cost for all patients. Wells et al.15 found significantly decreased LOS and cost for asthma patients but not for all diagnoses taken together, and Ogershok et al.16 found lower hospital costs but not length of stay. Five of the 6 new studies, listed in Table 2, reported on length of stay and cost. Three showed some benefits for length of stay: Srivastava et al.17 reported improvement in length of stay and cost for asthma and dehydration, but not for all diagnoses together; Bekmezian et al.18 reported improved length of stay and cost for pediatric hospitalists for patients on a hematology and gastroenterology service; and Simon et al.19 attributes a generalized decrease in length of stay on a surgical service to implementation of hospitalist comanagement of their most complex patients, though hospitalists only comanaged 12% of the patients in the study. A multicentered study in 2009 by Conway and Keren20 reported no significant difference in length of stay for general pediatric patients with urinary tract infections.
Of the 4 total studies that showed significant advantage in length of stay for hospitalist groups, improvement ranged from 11% to 38%. All attempted to adjust for diagnosis and severity using diagnosis‐related groups (DRGs) or other methods. Dwight et al.,12 Bellet and Whitaker,13 and Bekmezian et al.18 used retrospective or historical comparison alone, while Landrigan et al.14 had both concurrent and historical comparison groups.
In contrast to the other studies, Boyd et al.21 in 2006 found significant advantages, in both length of stay and cost, for a faculty/resident service in comparison to a hospitalist service. This nonrandomized, retrospective cohort study included 1009 pediatric patients, with the 11 most common DRGs, admitted during the same time period to either a traditional faculty/resident team or 1 of 2 private practice hospitalist groups at an academic medical center. The 8 general pediatric faculty practice attendings were dedicated to inpatient care while on service, and rotated bimonthly. The authors found that the faculty group patients had significantly shorter lengths of stay and total direct patient costs.
Cost‐comparison results were reported by 7 of the studies. Bellet and Whitaker,13 Landrigan et al.,14 Ogershok et al.,16 and Bekmezian et al.18 reported reductions in cost for all patients varying from 9% to 29%, while Wells et al.15 and Srivastava et al.17 found reductions in cost only for patients with certain diagnoses. Srivastava et al.17 analyzed 1970 patients, admitted with primary diagnoses of asthma, dehydration, or viral illness, over a 5‐year period from 1993 to 1997. Cost‐per‐patient was reduced between 9.3% for asthma and 7.8% for dehydrations, but when combined with the viral illness group, the difference was not statistically significant. Wells et al.15 studied 182 admissions over a 1‐year period, and found significant reductions in cost of 44% (P < 0.005) for patients with asthma but not for bronchiolitis, gastroenteritis, or pneumonia. In 2009, Conway and Keren20 studied a multicentered cohort of 20,892 children hospitalized for urinary tract infection, and found no significant difference in hospitalization costs between hospitalist services and more traditional models.
Other Quality Measures
Though financial outcomes (length of stay, cost, and resource utilization) were the primary area of emphasis for most of the selected articles, other parameters with more of a focus on quality were examined as well. The studies by Dwight et al.,12 Bellet and Whitaker,13 Landrigan et al.,14 Ogershok et al.,16 Bekmezian et al.,18 and Boyd et al.21 examined mortality and readmission rate. None of these studies reported differences in mortality rate, though none were powered to do so. When studying readmission rate, Bellet and Whitaker13 reported a statistically significant lower rate of readmission for a traditionally staffed service versus the hospitalist service (1% vs 3%; P = 0.006). In contrast, Bekmezian et al.18 found a lower readmission rate for the hospitalist service (4.4% vs 0%; P = 0.02). The studies by Dwight et al.,12 Landrigan et al.,14 Ogershok et al.,16 and Boyd et al.21 did not detect differences in readmission rates.
Two studies measured patient satisfaction.15, 16 Ogershok et al.16 utilized hospital‐generated patient satisfaction surveys, completed at discharge, for comparison and found no differences between the hospitalist and non‐hospitalist ward services. Wells et al.15 utilized a standardized patient satisfaction assessment tool, given at discharge, followed by a telephone interview after 1 month. At discharge, parents rated hospitalist physicians higher in courtesy (P < 0.05) and friendliness (P < 0.005), though this difference was not detected in the telephone interviews 1 month later. However, at that time, parents did indicate that they received better explanations about their child's illness if their child was seen by their primary care physician rather than a hospitalist.
In 2006, a study by Conway et al.22 reported on the use of evidence‐based therapies and tests by hospitalists as compared to community pediatricians. The survey identified evidence‐based therapies and tests for asthma, bronchiolitis, gastroenteritis, and first‐time urinary tract infection (UTI) diagnosis. A total of 213 hospitalists and 228 community pediatricians met the inclusion criteria by returning the completed survey. After multivariate regression analysis, hospitalists were found to be more likely to use 4 of 5 evidence‐based therapies and recommended tests, and were less likely to use 6 of 7 therapies and tests of unproven benefit. In 2009, Conway and Clancy23 again studied the use of evidence‐based therapies, this time using more objective measures. In this report, the Pediatric Health Information System (PHIS) was examined for a cohort of 20,892 patients. After multivariable regression analysis, there was no statistical difference in the performance of evidence‐based imaging following a first UTI between hospitals staffed primarily by community pediatricians versus those with pediatric hospitalist systems. However, it should be noted that the evidence base for UTI‐related imaging has been debated in the literature over the past decade.
DISCUSSION
Of the 11 studies selected for this review, 10 measured length of stay as an outcome, with the majority favoring hospitalists but with mixed results. Three of these studies, those by Dwight et al.,12 Bellet and Whitaker,13 and Landrigan et al.,14 demonstrated 11% to 14% improvement for hospitalist services compared to community pediatricians. Boyd et al.,21 however, found exactly the opposite result, and 2 studies by Conway and Keren20 and Ogershok et al.16 found no difference in length of stay. Two more studies found benefits restricted to certain conditions: Wells et al.15 found 32% shorter lengths of stay for asthma, but not for other conditions; Srivastava et al.17 found a 13% reduction in length of stay for asthma and 11% for dehydration, but none for viral illnesses or when all conditions were combined. Bekmezian et al.18 found shorter lengths of stay on a hospitalist service for hematology and gastroenterology patients, and Simon et al.19 attribute a general trend of decreasing lengths of stay on a surgical service to the implementation of hospital comanagement for a small percentage of patients.
The most common quality measures studied were patient satisfaction, readmission rates, and mortality. Only 1 study by Ogershok et al.16 reported on patient satisfaction and found few differences between hospitalists and community pediatricians. Readmission rate were reported by 6 studies. Bellet and Whitaker13 found a higher readmission rate for pediatric hospitalists, Bekmezian et al.18 found a lower rate but on a subspecialty service. The study with the greatest power for this analysis, by Landrigan et al.14 with nearly 18,000 patients, found no difference, and neither did another 3 studies. Unsurprisingly, no study detected differences in mortality; it would be extremely difficult to adequately power a study to do so in the general pediatric setting, where mortality is rare.
The effect of relative experience of hospitalist physicians is uncertain. Boyd et al.21 speculated that 1 possible cause for the decreased lengths of stay and costs associated with their faculty group compared to hospitalists may have been due to the increased experience of the faculty group. Unfortunately, they were unable to generate statistical significance due to the small numbers of physicians in the study. In contrast, the hospitalists in the report by Dwight et al.12 had decreased lengths of stay but were less experienced. In the adult literature, the study by Meltzer et al.8 suggests that improved outcomes from hospitalist systems may not become apparent for 1 or more years after implementation, but none of the pediatric studies included in our review specifically address this issue. This leaves the possibility open that the hospitalist systems evaluated in some studies had insufficient time in which to develop increased efficiencies.
There were several limitations to our studies. First, due to the heterogeneity and methodological variations among the included studies, we were unable to perform a meta‐analysis. Second, the overall quality of evidence is limited due to the lack of randomized control trials. Third, a lack of agreement on appropriate quality markers has limited the study of quality of care. Published reports continue to focus on financial measures, such as length of stay, despite the recommendation in the previous review by Landrigan et al.9 that such studies would be of limited value. Finally, the current variability of hospitalist models and lack of study of factors that might influence outcomes makes comparisons difficult.
Despite these limitations, several interesting trends emerge from these studies. One such trend is that the more recent studies highlight that simple classification of hospitalist system versus traditional system fails to measure the complexity and nuance of care delivery. The 2006 study by Boyd et al.21 is especially notable because it showed the opposite effect of previous studies, namely, an increase in length of stay and costs for hospitalists at St Joseph's Medical Center in Phoenix, Arizona. In this study, the traditional faculty group was employed by the hospital, and the hospitalist group was a private practice model. The authors suggest that their faculty physicians were therefore operating like hospitalists in that almost all of their time was focused on inpatient care while they were on service. They also had a limited number of general pediatricians, who attended in the inpatient setting, who were more experienced than the private practice groups. Also, the authors theorize that their faculty may have had a closer working relationship with their residents due to additional service responsibilities and locations of the faculty group onsite. Further study of the care models utilized by faculty and hospitalist practices at St Joseph's and other hospitals may reveal important insights about improving the quality and efficiency of inpatient pediatric care in general.
Though there is a clear trend in the adult literature indicating that the use of hospitalists results in superior quality of care, there is less evidence for pediatric systems. The aforementioned previous review by Landrigan et al.9, in 2006 concluded that emerging research suggests that pediatric hospitalist systems decrease cost and length of stay, but also the quality of care in pediatric hospitalist systems is unclear, because rigorous metrics to evaluate quality are lacking. Data from the 6 additional studies presented here lend limited support to the first hypothesis, and the presence of only 1 negative study is not sufficient to undermine it.
While data on quality markers such as readmission rate or mortality remain elusive, the 2 studies by Conway et al.20, 22 attempt to evaluate quality by comparing the use of evidence‐based therapies by hospitalists and community pediatricians. Though the use of objective PHIS data for UTI in 2009 did not confirm the conclusion suggested by the 2006 provider survey study, the attempt to find measurable outcomes such as the use of evidence‐based therapies is a start but we need more metrics, including rigorous patient outcome metrics, to define the quality of our care systems. Before the effect of hospitalist systems on quality is fully understood, more work will need to be done defining metrics for comparison.
Unfortunately, over 5 years since the previous review by Landrigan et al.9 called for increased focus on inpatient quality and understanding how to improve, the sophistication of our measurement of pediatric inpatient quality and understanding of the mechanisms underlying improvement is still in its infancy. We propose a solution at multiple levels.
First, the investment in research comparing system‐level interventions (eg, discharge process A vs discharge process B) must be increased. This investment increased significantly due to the over $1 billion in Recovery Act funding for comparative effectiveness research.23 However, the future investment in comparative effectiveness research, often called patient‐centered outcomes research, and proportion of investment focused on delivery system interventions is unclear. We propose that the investment in comparing delivery system interventions is essential to improving not only hospital medicine systems, but, more importantly, the healthcare system broadly. In addition, research investment needs to focus on reliably implementing proven interventions in systems of care, and evaluating both the effects on patient outcomes and cost, and the contextual factors associated with successful implementation.24 A hospital medicine example would be the comparison of the implementation of a guideline for a common disease across a set of hospitals. One could perform a prospective observational design, in which one compares high intensity versus low intensity intervention and assesses the baseline characteristics of the hospital systems, to understand their association with successful implementation and, ultimately, patient outcomes. One could also perform a clustered randomized design.
Second, the development and implementation of pediatric quality of care measures, including in the inpatient setting, needs to increase rapidly. The Children's Health Insurance Program (CHIP) and its focus on an initial core set of quality measures that expands over time, through an investment in measure development and validation, is an opportunity for pediatric hospital medicine. Inpatient measures should be a focus of measure development and implementation. We must move beyond a limited set of inpatient measures to a broader set focused on issues such as patient safety, hospital‐acquired infections, outcomes for common illnesses, and transitions of care. We also need better measures for important pediatric populations, such as children with complex medical conditions.25
Third, our understanding of the mechanisms leading to improvement in hospital medicine systems needs to be developed. Studies of hospital medicine systems should move past simple binary comparisons of hospitalist systems versus traditional systems to understand the effect on patient outcomes and cost of factors such as years of experience, volume of patients seen overall and with a specific condition, staffing model, training, quality improvement knowledge and application, and health information systems. These factors may be additive or multiplicative to the performance of inpatient systems once put into place, but these hypotheses need to be tested.
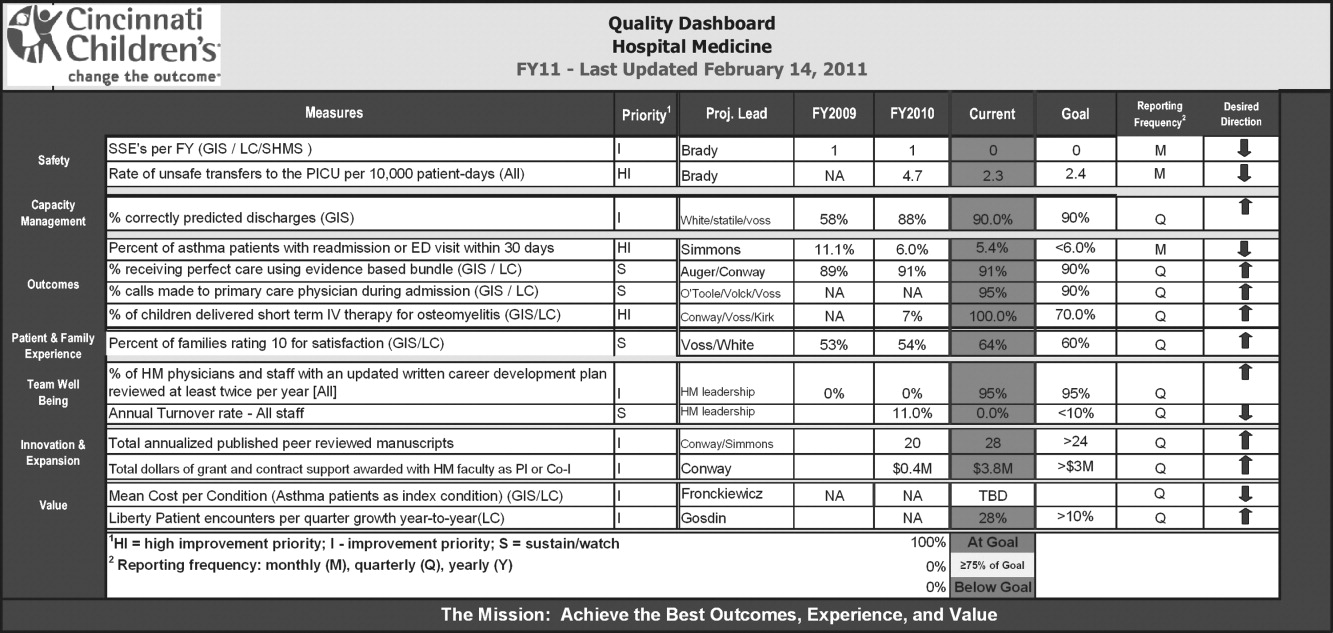
Fourth, individual hospitalists and their groups must focus on quality measurement and improvement in quality and value delivered. At Cincinnati, we have a portfolio of quality and value projects derived from our strategic objectives, illustrated in Figure 2. The projects have leaders and teams to drive improvement and measure results. Increasingly, we are able to publish these results in peer‐reviewed journals. On a quarterly basis, we review the portfolio via a dashboard and/or run and control charts. We establish new projects and set new goals on at least an annual basis. It is important to note that at the beginning of the 2010‐2011 fiscal year, almost all initiatives identified as priorities were yellow or red. Our group is now planning new initiatives and goals for next year. This is one method applicable to our setting, but a focus on quality and value and measuring results needs to be part of every hospital medicine program. As payer focus on value increases, this will be essential to demonstrate how a hospitalist group improves outcomes and adds value.
CONCLUSION
This review suggests that the use of hospitalists can improve the quality of inpatient care in the pediatric population, but this is not a universal finding and, most importantly, the mechanisms of improvement are poorly understood. We propose 4 components to address these issues so that a systematic review 5 years from now would be much more robust. These are: 1) increased investment in research comparing system‐level interventions and reliable implementation; 2) further development and implementation of pediatric quality of care measures in the inpatient setting; 3) understanding the mechanisms and factors leading to improvement in hospital medicine systems; and 4) an increased focus on quality measurement, and improvement in quality and value delivered by all individual hospitalists and their groups.
- ,.The emerging role of “hospitalists” in the American health care system.N Engl J Med.1996;335(7):514–517.
- ,,, et al.Pediatric hospitalists: report of a leadership conference.Pediatrics.2006;117(4):1122–1130.
- Institute of Medicine.Crossing the Quality Chasm: A New Health System for the 21st Century.Washington, DC:National Academy Press;2001.
- ,.The hospitalist movement 5 years later.JAMA.2002;287(4):487–494.
- ,.The impact of hospitalists on the cost and quality of inpatient care in the United States: a research synthesis.Med Care Res Rev.2005;62(4):379–406.
- .A systematic review of outcomes and quality measures in adult patients cared for by hospitalists vs nonhospitalists.Mayo Clin Proc.2009;84(3):248–254.
- ,,,,,.Outcomes of care by hospitalists, general internists, and family physicians.N Engl J Med.2007;375(25):2589–2600.
- ,,, et al.Effects of physician experience on costs and outcomes on an academic general medicine service: results of a trial of hospitalists.Ann Intern Med.2002;137(11):866–875.
- ,,,.Pediatric hospitalists: a systematic review of the literature.Pediatrics.2006;117(5):1736–1744.
- Society of Hospital Medicine. Measuring hospitalist performance: metrics, reports, and dashboards. Available at: http://www.hospitalmedicine.org/AM/Template.cfm?Section=Publications; April2007.
- Oxford Centre for Evidence‐Based Medicine levels of evidence. Updated March 2009. Available at: http://www.cebm.net/index.aspx?o=1025. Accessed March 14,2011.
- ,,,.Evaluation of a staff‐only hospitalist system in a tertiary care, academic children's hospital.Pediatrics.2004;114(6):1545–1549.
- ,.Evaluation of a pediatric hospitalist service: impact on length of stay and hospital charges.Pediatrics.2000;105(3 pt 1):478–484.
- ,,, et al.Impact of a health maintenance organization hospitalist system in academic pediatrics.Pediatrics.2002;110(4):720–728.
- ,,.Pediatric hospitalists: quality care for the underserved?Am J Med Qual.2001;16(5):174–180.
- ,,,,,.Restructuring an academic pediatric inpatient service using concepts developed by hospitalists.Clin Pediatr (Phila).2001;40(12):653–662.
- ,,, et al.Impact of a hospitalist system on length of stay and cost for children with common conditions.Pediatrics.2007;120(2):267–274.
- ,,.Staff‐only pediatric hospitalist care of patients with medically complex subspecialty conditions in a major teaching hospital.Arch Pediatr Adolesc Med.2008;162(10):975–980.
- ,,,,,.Pediatric hospitalist comanagement of spinal fusion surgery patients.J Hosp Med.2007;2(1):23–30.
- ,.Factors associated with variability in outcomes for children hospitalized with urinary tract infection.J Pediatr.2009;154(6):789–796.
- ,,,,.Comparison of outcome measures for a traditional pediatric faculty service and nonfaculty hospitalist services in a community teaching hospital.Pediatrics.2006;118(4):1327–1331.
- ,,,,,.Variations in management of common inpatient pediatric illnesses: hospitalists and community pediatricians.Pediatrics.2006;118(2):441–447.
- ,.Comparative‐effectiveness research—implications of the federal coordinating council's report.N Engl J Med.2009;361(4):328–330.
- ,.Charting a path from comparative effectiveness funding to improved patient‐centered health care.JAMA.2010;303(10):985–986.
- ,,, et al.Children with medical complexity: an emerging population for clinical and research initiatives.Pediatrics.2011;127(3):529–538.
In the United States, general medical inpatient care is increasingly provided by hospital‐based physicians, also called hospitalists.1 The field of pediatrics is no exception, and by 2005 there were an estimated 1000 pediatric hospitalists in the workforce.2 Current numbers are likely to be greater than 2500, as the need for pediatric hospitalists has grown considerably.
At the same time, the quality of care delivered by the United States health system has come under increased scrutiny. In 2001, the Institute of Medicine, in its report on the quality of healthcare in America, concluded that between the care we have and what we could have lies not just a gap but a chasm.3 Meanwhile, the cost of healthcare delivery continues to increase. The pressure to deliver cost‐effective, high quality care is among the more important forces driving the proliferation of hospitalists.4
Over the last decade, data supporting the role of hospitalists in improving quality of care for adult patients has continued to accumulate.58 A 2007 retrospective cohort study by Lindenaur et al.7 included nearly 77,000 adult patients and found small reductions in length of stay without adverse effects on mortality or readmission rates, and a 2009 systematic review by Peterson6 included 33 studies and concluded that in general inpatient care of general medical patients by hospitalist physicians leads to decreased hospital cost and length of stay. A 2002 study by Meltzer et al.8 is also interesting, suggesting that improvements in costs and short‐term mortality are related to the disease‐specific experience of hospitalists.
Similar data for pediatric hospitalists has been slower to emerge. A systematic review of the literature by Landrigan et al., which included studies through 2004, concluded that [R]esearch suggests that pediatric hospitalists decrease costs and length of stay . The quality of care in pediatric hospitalist systems is unclear, because rigorous metrics to evaluate quality are lacking.9 Since the publication of that review, there have been multiple studies which have sought to evaluate the quality of pediatric hospitalist systems. This review was undertaken to synthesize this new information, and to determine the effect of pediatric hospitalist systems on quality of care.
METHODS
A review of the available English language literature on the Medline database was undertaken in November of 2010 to answer the question, What are the differences in quality of care and outcomes of inpatient medical care provided by hospitalists versus non‐hospitalists in the pediatric population? Care metrics of interest were categorized according to the Society of Hospital Medicine's recommendations for measuring hospital performance.10
Search terms used (with additional medical subject headings [MeSH] terms in parenthesis) were hospital medicine (hospitalist), pediatrics (child health, child welfare), cost (cost and cost analysis), quality (quality indicators, healthcare), outcomes (outcome assessment, healthcare; outcomes and process assessment, healthcare); volume, patient satisfaction, length of stay, productivity (efficiency), provider satisfaction (attitude of health personnel, job satisfaction), mortality, and readmission rate (patient readmission). The citing articles search tool was used to identify other articles that potentially could meet criteria. Finally, references cited in the selected articles, as well as in excluded literature reviews, were searched for additional articles.
Articles were deemed eligible if they were published in a peer‐reviewed journal, if they had a comparative experimental design for hospitalists versus non‐hospitalists, and if they dealt exclusively with pediatric hospitalists. Noncomparative studies were excluded, as were studies that pertained to settings besides that of an inpatient pediatrics ward, such as pediatric intensive care units or emergency rooms. The search algorithm is diagrammed in Figure 1.
The selected articles were reviewed for the relevant outcome measures. The quality of each article was assessed using the Oxford Centre for Evidence‐Based Medicine levels of evidence,11 a widely accepted standard for critical analysis of studies. Levels of evidence are assigned to studies, from 1a (systematic reviews of randomized controlled trials) to 5 (expert opinion only). Well‐conducted prospective cohort studies receive a rating of 2c; those with wide confidence intervals due to small sample size receive a minus () modifier. This system does not specifically address survey studies, which were therefore not assigned a level of evidence.
RESULTS
The screening process yielded 92 possible relevant articles, which were then reviewed individually (by G.M.M.) by title and abstract. A total of 81 articles were excluded, including 48 studies that were either noncomparative or descriptive in nature. Ten of the identified articles were reviews and did not contain primary data. Nine studies were not restricted to the pediatric population. Also excluded were 7 studies that did not have outcomes related to quality (eg, billing performance), and 7 studies of hospitalists in settings besides general pediatric wards (eg, pediatric intensive care units). Ten studies were thus identified. The cited reference tool was used to identify an additional article which met criteria, yielding 11 total articles that were included in the review.
Five of the identified studies published prior to 2005 were previously reviewed by Landrigan et al.9 Since then, 6 additional studies of similar nature have been published and were included here. Articles that met criteria but appeared in an earlier review are included in Table 1; new articles appear in Table 2. The results of all 11 articles were included for this discussion.
| Source | Site | Study Design | Outcomes Measured (Oxford Level of Evidence) | Results for Hospitalists |
|---|---|---|---|---|
| ||||
| Bellet and Whitaker13 (2000) | Cincinnati Children's Hospital Medical Center, Cincinnati, OH | 1440 general pediatric patients | LOS, costs (2c) | LOS shorter (2.4 vs 2.7 days) |
| Retrospective cohort study | Readmission rate, subspecialty consultations, mortality (2c, low power) | Costs lower ($2720 vs $3002) | ||
| Readmissions higher for hospitalists (1% vs 3%) | ||||
| No differences in consultations | ||||
| No mortality in study | ||||
| Ogershok et al.16 (2001) | West Virginia University Children's Hospitals, Morgantown, WV | 2177 general pediatric patients | LOS, cost (2c) | No difference in LOS |
| Retrospective cohort study | Readmission rate, patient satisfaction, mortality (2c, low power) | Costs lower ($1238 vs $1421) | ||
| Lab and radiology tests ordered less often | ||||
| No difference in mortality or readmission rates | ||||
| No difference in satisfaction scores | ||||
| Wells et al.15 (2001) | Valley Children's Hospital, Madera, CA | 182 general pediatric patients | LOS, cost, patient satisfaction, follow‐up rate (2c, low power) | LOS shorter (45.2 vs 66.8 hr; P = 0.01) |
| Prospective cohort study | No LOS or cost benefit for patients with bronchiolitis, gastroenteritis, or pneumonia | |||
| Costs lower ($2701 vs $4854; P = 0.005) for patients with asthma | ||||
| No difference in outpatient follow‐up rate | ||||
| Landrigan et al.14 (2002) | Boston Children's Hospital, Boston, MA | 17,873 general pediatric patients | LOS, cost (2c) | LOS shorter (2.2 vs 2.5 days) |
| Retrospective cohort study | Readmission rate, follow‐up rate, mortality (2c, low power) | Costs lower ($1139 vs $1356) | ||
| No difference in follow‐up rate | ||||
| No mortality in study | ||||
| Dwight et al.12 (2004) | Hospital for Sick Children, Toronto, Ontario, Canada | 3807 general pediatric patients | LOS (2c) | LOS shorter (from 2.9 to 2.5 days; P = 0.04) |
| Retrospective cohort study | Subspecialty consultations, readmission rate, mortality (2c, low power) | No difference in readmission rates | ||
| No difference in mortality | ||||
| Source | Site | Study Design | Outcomes Measured (Oxford Level of Evidence) | Results for Hospitalists |
|---|---|---|---|---|
| ||||
| Boyd et al.21 (2006) | St Joseph's Hospital and Medical Center, Phoenix, AZ | 1009 patients with 11 most common DRGs (3 groups) | Cost, LOS, and readmission rate (2c, low power) | LOS longer (2.6 2.0 vs 3.1 2.6 vs 2.9 2.3, mean SD) |
| Retrospective cohort study | Costs higher ($1781 $1449 (faculty) vs $1954 $1212 (hospitalist group 1) vs $1964 $1495 (hospitalist group 2) | |||
| No difference in readmission rates | ||||
| Conway et al.22 (2006) | National provider survey | 213 hospitalists and 352 community pediatrician survey responses | Self‐reported evidence‐based medicine use (descriptive study, no assignable level) | Hospitalists more likely to follow EBG for following: VCUG and RUS after first UTI, albuterol and ipratropium in first 24 hr for asthma |
| Descriptive study | Hospitalists less likely to use the following unproven therapies: levalbuterol and inhaled or oral steroids for bronchiolitis, stool culture or rotavirus testing for gastroenteritis, or ipratropium after 24 hr for asthma | |||
| Srivastava et al.17 (2007) | University of Utah Health Sciences Center, Salt Lake City, UT | 1970 patients with asthma, dehydration, or viral illness | LOS, cost (2c, no confidence intervals reported) | LOS shorter for asthma (0.23 days, 13%) and for dehydration (0.19 days, 11%) |
| Retrospective cohort study | No LOS difference for patients with viral illness | |||
| Costs lower for asthma ($105.51, 9.3%) and for dehydration ($86.22, 7.8%) | ||||
| Simon et al.19 (2007) | Children's Hospital of Denver, Denver, CO | 759 patients undergoing spinal fusion before and after availability of hospitalist consultation | LOS (4, unaccounted confounding factors) | LOS shorter, 6.5 (6.26.7) days to 4.8 (4.55.1) |
| Retrospective cohort study | ||||
| Bekmezian et al.18 (2008) | UCLA Hospital and Medical Center, Los Angeles, CA | 925 subspecialty patients on GI and Heme/Onc services vs hospitalist service | LOS, cost, readmission rate, mortality (2c, low power) | LOS shorter (38%, P < 0.01) |
| Retrospective cohort study | Cost lower (29%, P < 0.05) | |||
| Readmissions lower (36 for faculty vs none for hospitalists, P = 0.02) | ||||
| No difference in mortality | ||||
| Conway and Keren20 (2009) | Multicenter, 25 children's hospitals | 20,892 patients identified with UTI admissions in PHIS database | LOS, cost, evidence‐based medicine use (2c) | No difference in LOS |
| Retrospective cohort study | No difference in cost | |||
| No difference in performance of EBM guideline (VCUG and RUS for first UTI) | ||||
Effect on Length of Stay, Cost, and Resource Utilization
Ten articles addressed length of stay as an outcome measure, and 8 included cost as well. Five have been previously reported9 (see Table 1). Of these, Dwight et al.,12, Bellet and Whitaker,13 and Landrigan et al.14 found decreased length of stay (LOS) and cost for all patients. Wells et al.15 found significantly decreased LOS and cost for asthma patients but not for all diagnoses taken together, and Ogershok et al.16 found lower hospital costs but not length of stay. Five of the 6 new studies, listed in Table 2, reported on length of stay and cost. Three showed some benefits for length of stay: Srivastava et al.17 reported improvement in length of stay and cost for asthma and dehydration, but not for all diagnoses together; Bekmezian et al.18 reported improved length of stay and cost for pediatric hospitalists for patients on a hematology and gastroenterology service; and Simon et al.19 attributes a generalized decrease in length of stay on a surgical service to implementation of hospitalist comanagement of their most complex patients, though hospitalists only comanaged 12% of the patients in the study. A multicentered study in 2009 by Conway and Keren20 reported no significant difference in length of stay for general pediatric patients with urinary tract infections.
Of the 4 total studies that showed significant advantage in length of stay for hospitalist groups, improvement ranged from 11% to 38%. All attempted to adjust for diagnosis and severity using diagnosis‐related groups (DRGs) or other methods. Dwight et al.,12 Bellet and Whitaker,13 and Bekmezian et al.18 used retrospective or historical comparison alone, while Landrigan et al.14 had both concurrent and historical comparison groups.
In contrast to the other studies, Boyd et al.21 in 2006 found significant advantages, in both length of stay and cost, for a faculty/resident service in comparison to a hospitalist service. This nonrandomized, retrospective cohort study included 1009 pediatric patients, with the 11 most common DRGs, admitted during the same time period to either a traditional faculty/resident team or 1 of 2 private practice hospitalist groups at an academic medical center. The 8 general pediatric faculty practice attendings were dedicated to inpatient care while on service, and rotated bimonthly. The authors found that the faculty group patients had significantly shorter lengths of stay and total direct patient costs.
Cost‐comparison results were reported by 7 of the studies. Bellet and Whitaker,13 Landrigan et al.,14 Ogershok et al.,16 and Bekmezian et al.18 reported reductions in cost for all patients varying from 9% to 29%, while Wells et al.15 and Srivastava et al.17 found reductions in cost only for patients with certain diagnoses. Srivastava et al.17 analyzed 1970 patients, admitted with primary diagnoses of asthma, dehydration, or viral illness, over a 5‐year period from 1993 to 1997. Cost‐per‐patient was reduced between 9.3% for asthma and 7.8% for dehydrations, but when combined with the viral illness group, the difference was not statistically significant. Wells et al.15 studied 182 admissions over a 1‐year period, and found significant reductions in cost of 44% (P < 0.005) for patients with asthma but not for bronchiolitis, gastroenteritis, or pneumonia. In 2009, Conway and Keren20 studied a multicentered cohort of 20,892 children hospitalized for urinary tract infection, and found no significant difference in hospitalization costs between hospitalist services and more traditional models.
Other Quality Measures
Though financial outcomes (length of stay, cost, and resource utilization) were the primary area of emphasis for most of the selected articles, other parameters with more of a focus on quality were examined as well. The studies by Dwight et al.,12 Bellet and Whitaker,13 Landrigan et al.,14 Ogershok et al.,16 Bekmezian et al.,18 and Boyd et al.21 examined mortality and readmission rate. None of these studies reported differences in mortality rate, though none were powered to do so. When studying readmission rate, Bellet and Whitaker13 reported a statistically significant lower rate of readmission for a traditionally staffed service versus the hospitalist service (1% vs 3%; P = 0.006). In contrast, Bekmezian et al.18 found a lower readmission rate for the hospitalist service (4.4% vs 0%; P = 0.02). The studies by Dwight et al.,12 Landrigan et al.,14 Ogershok et al.,16 and Boyd et al.21 did not detect differences in readmission rates.
Two studies measured patient satisfaction.15, 16 Ogershok et al.16 utilized hospital‐generated patient satisfaction surveys, completed at discharge, for comparison and found no differences between the hospitalist and non‐hospitalist ward services. Wells et al.15 utilized a standardized patient satisfaction assessment tool, given at discharge, followed by a telephone interview after 1 month. At discharge, parents rated hospitalist physicians higher in courtesy (P < 0.05) and friendliness (P < 0.005), though this difference was not detected in the telephone interviews 1 month later. However, at that time, parents did indicate that they received better explanations about their child's illness if their child was seen by their primary care physician rather than a hospitalist.
In 2006, a study by Conway et al.22 reported on the use of evidence‐based therapies and tests by hospitalists as compared to community pediatricians. The survey identified evidence‐based therapies and tests for asthma, bronchiolitis, gastroenteritis, and first‐time urinary tract infection (UTI) diagnosis. A total of 213 hospitalists and 228 community pediatricians met the inclusion criteria by returning the completed survey. After multivariate regression analysis, hospitalists were found to be more likely to use 4 of 5 evidence‐based therapies and recommended tests, and were less likely to use 6 of 7 therapies and tests of unproven benefit. In 2009, Conway and Clancy23 again studied the use of evidence‐based therapies, this time using more objective measures. In this report, the Pediatric Health Information System (PHIS) was examined for a cohort of 20,892 patients. After multivariable regression analysis, there was no statistical difference in the performance of evidence‐based imaging following a first UTI between hospitals staffed primarily by community pediatricians versus those with pediatric hospitalist systems. However, it should be noted that the evidence base for UTI‐related imaging has been debated in the literature over the past decade.
DISCUSSION
Of the 11 studies selected for this review, 10 measured length of stay as an outcome, with the majority favoring hospitalists but with mixed results. Three of these studies, those by Dwight et al.,12 Bellet and Whitaker,13 and Landrigan et al.,14 demonstrated 11% to 14% improvement for hospitalist services compared to community pediatricians. Boyd et al.,21 however, found exactly the opposite result, and 2 studies by Conway and Keren20 and Ogershok et al.16 found no difference in length of stay. Two more studies found benefits restricted to certain conditions: Wells et al.15 found 32% shorter lengths of stay for asthma, but not for other conditions; Srivastava et al.17 found a 13% reduction in length of stay for asthma and 11% for dehydration, but none for viral illnesses or when all conditions were combined. Bekmezian et al.18 found shorter lengths of stay on a hospitalist service for hematology and gastroenterology patients, and Simon et al.19 attribute a general trend of decreasing lengths of stay on a surgical service to the implementation of hospital comanagement for a small percentage of patients.
The most common quality measures studied were patient satisfaction, readmission rates, and mortality. Only 1 study by Ogershok et al.16 reported on patient satisfaction and found few differences between hospitalists and community pediatricians. Readmission rate were reported by 6 studies. Bellet and Whitaker13 found a higher readmission rate for pediatric hospitalists, Bekmezian et al.18 found a lower rate but on a subspecialty service. The study with the greatest power for this analysis, by Landrigan et al.14 with nearly 18,000 patients, found no difference, and neither did another 3 studies. Unsurprisingly, no study detected differences in mortality; it would be extremely difficult to adequately power a study to do so in the general pediatric setting, where mortality is rare.
The effect of relative experience of hospitalist physicians is uncertain. Boyd et al.21 speculated that 1 possible cause for the decreased lengths of stay and costs associated with their faculty group compared to hospitalists may have been due to the increased experience of the faculty group. Unfortunately, they were unable to generate statistical significance due to the small numbers of physicians in the study. In contrast, the hospitalists in the report by Dwight et al.12 had decreased lengths of stay but were less experienced. In the adult literature, the study by Meltzer et al.8 suggests that improved outcomes from hospitalist systems may not become apparent for 1 or more years after implementation, but none of the pediatric studies included in our review specifically address this issue. This leaves the possibility open that the hospitalist systems evaluated in some studies had insufficient time in which to develop increased efficiencies.
There were several limitations to our studies. First, due to the heterogeneity and methodological variations among the included studies, we were unable to perform a meta‐analysis. Second, the overall quality of evidence is limited due to the lack of randomized control trials. Third, a lack of agreement on appropriate quality markers has limited the study of quality of care. Published reports continue to focus on financial measures, such as length of stay, despite the recommendation in the previous review by Landrigan et al.9 that such studies would be of limited value. Finally, the current variability of hospitalist models and lack of study of factors that might influence outcomes makes comparisons difficult.
Despite these limitations, several interesting trends emerge from these studies. One such trend is that the more recent studies highlight that simple classification of hospitalist system versus traditional system fails to measure the complexity and nuance of care delivery. The 2006 study by Boyd et al.21 is especially notable because it showed the opposite effect of previous studies, namely, an increase in length of stay and costs for hospitalists at St Joseph's Medical Center in Phoenix, Arizona. In this study, the traditional faculty group was employed by the hospital, and the hospitalist group was a private practice model. The authors suggest that their faculty physicians were therefore operating like hospitalists in that almost all of their time was focused on inpatient care while they were on service. They also had a limited number of general pediatricians, who attended in the inpatient setting, who were more experienced than the private practice groups. Also, the authors theorize that their faculty may have had a closer working relationship with their residents due to additional service responsibilities and locations of the faculty group onsite. Further study of the care models utilized by faculty and hospitalist practices at St Joseph's and other hospitals may reveal important insights about improving the quality and efficiency of inpatient pediatric care in general.
Though there is a clear trend in the adult literature indicating that the use of hospitalists results in superior quality of care, there is less evidence for pediatric systems. The aforementioned previous review by Landrigan et al.9, in 2006 concluded that emerging research suggests that pediatric hospitalist systems decrease cost and length of stay, but also the quality of care in pediatric hospitalist systems is unclear, because rigorous metrics to evaluate quality are lacking. Data from the 6 additional studies presented here lend limited support to the first hypothesis, and the presence of only 1 negative study is not sufficient to undermine it.
While data on quality markers such as readmission rate or mortality remain elusive, the 2 studies by Conway et al.20, 22 attempt to evaluate quality by comparing the use of evidence‐based therapies by hospitalists and community pediatricians. Though the use of objective PHIS data for UTI in 2009 did not confirm the conclusion suggested by the 2006 provider survey study, the attempt to find measurable outcomes such as the use of evidence‐based therapies is a start but we need more metrics, including rigorous patient outcome metrics, to define the quality of our care systems. Before the effect of hospitalist systems on quality is fully understood, more work will need to be done defining metrics for comparison.
Unfortunately, over 5 years since the previous review by Landrigan et al.9 called for increased focus on inpatient quality and understanding how to improve, the sophistication of our measurement of pediatric inpatient quality and understanding of the mechanisms underlying improvement is still in its infancy. We propose a solution at multiple levels.
First, the investment in research comparing system‐level interventions (eg, discharge process A vs discharge process B) must be increased. This investment increased significantly due to the over $1 billion in Recovery Act funding for comparative effectiveness research.23 However, the future investment in comparative effectiveness research, often called patient‐centered outcomes research, and proportion of investment focused on delivery system interventions is unclear. We propose that the investment in comparing delivery system interventions is essential to improving not only hospital medicine systems, but, more importantly, the healthcare system broadly. In addition, research investment needs to focus on reliably implementing proven interventions in systems of care, and evaluating both the effects on patient outcomes and cost, and the contextual factors associated with successful implementation.24 A hospital medicine example would be the comparison of the implementation of a guideline for a common disease across a set of hospitals. One could perform a prospective observational design, in which one compares high intensity versus low intensity intervention and assesses the baseline characteristics of the hospital systems, to understand their association with successful implementation and, ultimately, patient outcomes. One could also perform a clustered randomized design.
Second, the development and implementation of pediatric quality of care measures, including in the inpatient setting, needs to increase rapidly. The Children's Health Insurance Program (CHIP) and its focus on an initial core set of quality measures that expands over time, through an investment in measure development and validation, is an opportunity for pediatric hospital medicine. Inpatient measures should be a focus of measure development and implementation. We must move beyond a limited set of inpatient measures to a broader set focused on issues such as patient safety, hospital‐acquired infections, outcomes for common illnesses, and transitions of care. We also need better measures for important pediatric populations, such as children with complex medical conditions.25
Third, our understanding of the mechanisms leading to improvement in hospital medicine systems needs to be developed. Studies of hospital medicine systems should move past simple binary comparisons of hospitalist systems versus traditional systems to understand the effect on patient outcomes and cost of factors such as years of experience, volume of patients seen overall and with a specific condition, staffing model, training, quality improvement knowledge and application, and health information systems. These factors may be additive or multiplicative to the performance of inpatient systems once put into place, but these hypotheses need to be tested.
Fourth, individual hospitalists and their groups must focus on quality measurement and improvement in quality and value delivered. At Cincinnati, we have a portfolio of quality and value projects derived from our strategic objectives, illustrated in Figure 2. The projects have leaders and teams to drive improvement and measure results. Increasingly, we are able to publish these results in peer‐reviewed journals. On a quarterly basis, we review the portfolio via a dashboard and/or run and control charts. We establish new projects and set new goals on at least an annual basis. It is important to note that at the beginning of the 2010‐2011 fiscal year, almost all initiatives identified as priorities were yellow or red. Our group is now planning new initiatives and goals for next year. This is one method applicable to our setting, but a focus on quality and value and measuring results needs to be part of every hospital medicine program. As payer focus on value increases, this will be essential to demonstrate how a hospitalist group improves outcomes and adds value.
CONCLUSION
This review suggests that the use of hospitalists can improve the quality of inpatient care in the pediatric population, but this is not a universal finding and, most importantly, the mechanisms of improvement are poorly understood. We propose 4 components to address these issues so that a systematic review 5 years from now would be much more robust. These are: 1) increased investment in research comparing system‐level interventions and reliable implementation; 2) further development and implementation of pediatric quality of care measures in the inpatient setting; 3) understanding the mechanisms and factors leading to improvement in hospital medicine systems; and 4) an increased focus on quality measurement, and improvement in quality and value delivered by all individual hospitalists and their groups.
- ,.The emerging role of “hospitalists” in the American health care system.N Engl J Med.1996;335(7):514–517.
- ,,, et al.Pediatric hospitalists: report of a leadership conference.Pediatrics.2006;117(4):1122–1130.
- Institute of Medicine.Crossing the Quality Chasm: A New Health System for the 21st Century.Washington, DC:National Academy Press;2001.
- ,.The hospitalist movement 5 years later.JAMA.2002;287(4):487–494.
- ,.The impact of hospitalists on the cost and quality of inpatient care in the United States: a research synthesis.Med Care Res Rev.2005;62(4):379–406.
- .A systematic review of outcomes and quality measures in adult patients cared for by hospitalists vs nonhospitalists.Mayo Clin Proc.2009;84(3):248–254.
- ,,,,,.Outcomes of care by hospitalists, general internists, and family physicians.N Engl J Med.2007;375(25):2589–2600.
- ,,, et al.Effects of physician experience on costs and outcomes on an academic general medicine service: results of a trial of hospitalists.Ann Intern Med.2002;137(11):866–875.
- ,,,.Pediatric hospitalists: a systematic review of the literature.Pediatrics.2006;117(5):1736–1744.
- Society of Hospital Medicine. Measuring hospitalist performance: metrics, reports, and dashboards. Available at: http://www.hospitalmedicine.org/AM/Template.cfm?Section=Publications; April2007.
- Oxford Centre for Evidence‐Based Medicine levels of evidence. Updated March 2009. Available at: http://www.cebm.net/index.aspx?o=1025. Accessed March 14,2011.
- ,,,.Evaluation of a staff‐only hospitalist system in a tertiary care, academic children's hospital.Pediatrics.2004;114(6):1545–1549.
- ,.Evaluation of a pediatric hospitalist service: impact on length of stay and hospital charges.Pediatrics.2000;105(3 pt 1):478–484.
- ,,, et al.Impact of a health maintenance organization hospitalist system in academic pediatrics.Pediatrics.2002;110(4):720–728.
- ,,.Pediatric hospitalists: quality care for the underserved?Am J Med Qual.2001;16(5):174–180.
- ,,,,,.Restructuring an academic pediatric inpatient service using concepts developed by hospitalists.Clin Pediatr (Phila).2001;40(12):653–662.
- ,,, et al.Impact of a hospitalist system on length of stay and cost for children with common conditions.Pediatrics.2007;120(2):267–274.
- ,,.Staff‐only pediatric hospitalist care of patients with medically complex subspecialty conditions in a major teaching hospital.Arch Pediatr Adolesc Med.2008;162(10):975–980.
- ,,,,,.Pediatric hospitalist comanagement of spinal fusion surgery patients.J Hosp Med.2007;2(1):23–30.
- ,.Factors associated with variability in outcomes for children hospitalized with urinary tract infection.J Pediatr.2009;154(6):789–796.
- ,,,,.Comparison of outcome measures for a traditional pediatric faculty service and nonfaculty hospitalist services in a community teaching hospital.Pediatrics.2006;118(4):1327–1331.
- ,,,,,.Variations in management of common inpatient pediatric illnesses: hospitalists and community pediatricians.Pediatrics.2006;118(2):441–447.
- ,.Comparative‐effectiveness research—implications of the federal coordinating council's report.N Engl J Med.2009;361(4):328–330.
- ,.Charting a path from comparative effectiveness funding to improved patient‐centered health care.JAMA.2010;303(10):985–986.
- ,,, et al.Children with medical complexity: an emerging population for clinical and research initiatives.Pediatrics.2011;127(3):529–538.
