User login
Quantifying Treatment Intensity
Healthcare spending exceeded $2.5 trillion in 2007, and payments to hospitals represented the largest portion of this spending (more than 30%), equaling the combined cost of physician services and prescription drugs.[1, 2] Researchers and policymakers have emphasized the need to improve the value of hospital care in the United States, but this has been challenging, in part because of the difficulty in identifying hospitals that have high resource utilization relative to their peers.[3, 4, 5, 6, 7, 8, 9, 10, 11]
Most hospitals calculate their costs using internal accounting systems that determine resource utilization via relative value units (RVUs).[7, 8] RVU‐derived costs, also known as hospital reported costs, have proven to be an excellent method for quantifying what it costs a given hospital to provide a treatment, test, or procedure. However, RVU‐based costs are less useful for comparing resource utilization across hospitals because the cost to provide a treatment or service varies widely across hospitals. The cost of an item calculated using RVUs includes not just the item itself, but also a portion of the fixed costs of the hospital (overhead, labor, and infrastructure investments such as electronic records, new buildings, or expensive radiological or surgical equipment).[12] These costs vary by institution, patient population, region of the country, teaching status, and many other variables, making it difficult to identify resource utilization across hospitals.[13, 14]
Recently, a few claims‐based multi‐institutional datasets have begun incorporating item‐level RVU‐based costs derived directly from the cost accounting systems of participating institutions.[15] Such datasets allow researchers to compare reported costs of care from hospital to hospital, but because of the limitations we described above, they still cannot be used to answer the question: Which hospitals with higher costs of care are actually providing more treatments and services to patients?
To better facilitate the comparison of resource utilization patterns across hospitals, we standardized the unit costs of all treatments and services across hospitals by applying a single cost to every item across hospitals. This standardized cost allowed to compare utilization of that item (and the 15,000 other items in the database) across hospitals. We then compared estimates of resource utilization as measured by the 2 approaches: standardized and RVU‐based costs.
METHODS
Ethics Statement
All data were deidentified, by Premier, Inc., at both the hospital and patient level in accordance with the Health Insurance Portability and Accountability Act. The Yale University Human Investigation Committee reviewed the protocol for this study and determined that it is not considered to be human subjects research as defined by the Office of Human Research Protections.
Data Source
We conducted a cross‐sectional study using data from hospitals that participated in the database maintained by Premier Healthcare Informatics (Charlotte, NC) in the years 2009 to 2010. The Premier database is a voluntary, fee‐supported database created to measure quality and healthcare utilization.[3, 16, 17, 18] In 2010, it included detailed billing data from 500 hospitals in the United States, with more than 130 million cumulative hospital discharges. The detailed billing data includes all elements found in hospital claims derived from the uniform billing‐04 form, as well as an itemized, date‐stamped log of all items and services charged to the patient or insurer, such as medications, laboratory tests, and diagnostic and therapeutic services. The database includes approximately 15% of all US hospitalizations. Participating hospitals are similar to the composition of acute care hospitals nationwide. They represent all regions of the United States, and represent predominantly small‐ to mid‐sized nonteaching facilities that serve a largely urban population. The database also contains hospital reported costs at the item level as well as the total cost of the hospitalization. Approximately 75% of hospitals that participate submit RVU‐based costs taken from internal cost accounting systems. Because of our focus on comparing standardized costs to reported costs, we included only data from hospitals that use RVU‐based costs in this study.
Study Subjects
We included adult patients with a hospitalization recorded in the Premier database between January 1, 2009 and December 31, 2010, and a principal discharge diagnosis of heart failure (HF) (International Classification of Diseases, Ninth Revision, Clinical Modification codes: 402.01, 402.11, 402.91, 404.01, 404.03, 404.11, 404.13, 404.91, 404.93, 428.xx). We excluded transfers, patients assigned a pediatrician as the attending of record, and those who received a heart transplant or ventricular assist device during their stay. Because cost data are prone to extreme outliers, we excluded hospitalizations that were in the top 0.1% of length of stay, number of billing records, quantity of items billed, or total standardized cost. We also excluded hospitals that admitted fewer than 25 HF patients during the study period to reduce the possibility that a single high‐cost patient affected the hospital's cost profile.
Hospital Information
For each hospital included in the study, we recorded number of beds, teaching status, geographic region, and whether it served an urban or rural population.
Assignment of Standardized Costs
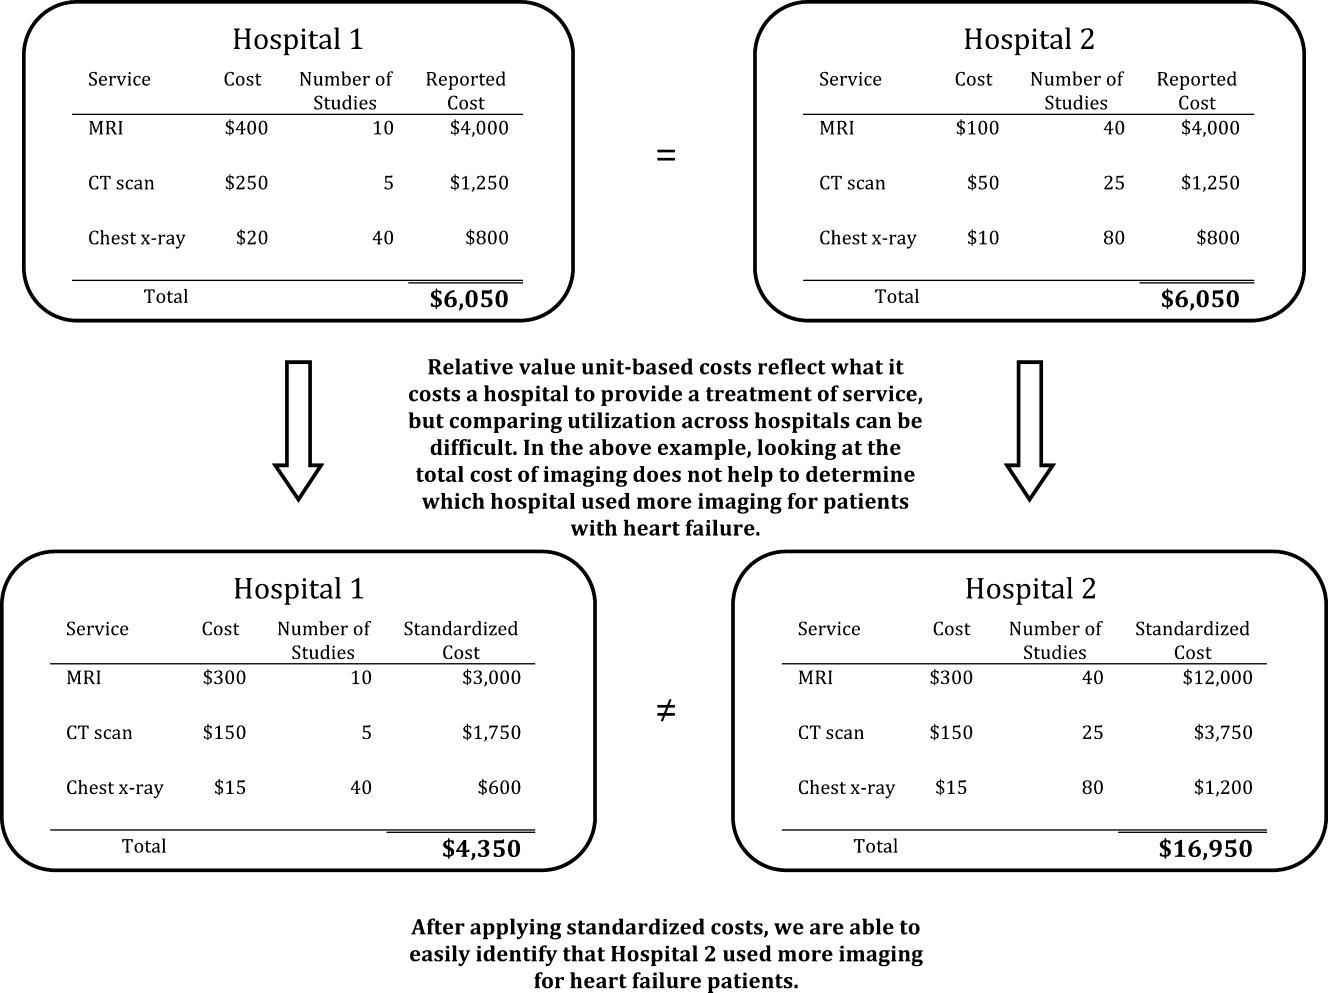
We defined reported cost as the RVU‐based cost per item in the database. We then calculated the median across hospitals for each item in the database and set this as the standardized unit cost of that item at every hospital (Figure 1). Once standardized costs were assigned at the item level, we summed the costs of all items assigned to each patient and calculated the standardized cost of a hospitalization per patient at each hospital.

Examination of Cost Variation
We compared the standardized and reported costs of hospitalizations using medians, interquartile ranges, and interquartile ratios (Q75/Q25). To examine whether standardized costs can reduce the noise due to differences in overhead and other fixed costs, we calculated, for each hospital, the coefficients of variation (CV) for per‐day reported and standardized costs and per‐hospitalization reported and standardized costs. We used the Fligner‐Killeen test to determine whether the variance of CVs was different for reported and standardized costs.[19]
Creation of Basket of Goods
Because there can be differences in the costs of items, the number and types of items administered during hospitalizations, 2 hospitals with similar reported costs for a hospitalization might deliver different quantities and combinations of treatments (Figure 1). We wished to demonstrate that there is variation in reported costs of items when the quantity and type of item is held constant, so we created a basket of items. We chose items that are commonly administered to patients with heart failure, but could have chosen any combination of items. The basket included a day of medical room and board, a day of intensive care unit (ICU) room and board, a single dose of ‐blocker, a single dose of angiotensin‐converting enzyme inhibitor, complete blood count, a B‐natriuretic peptide level, a chest radiograph, a chest computed tomography, and an echocardiogram. We then examined the range of hospitals' reported costs for this basket of goods using percentiles, medians, and interquartile ranges.
Reported to Standardized Cost Ratio
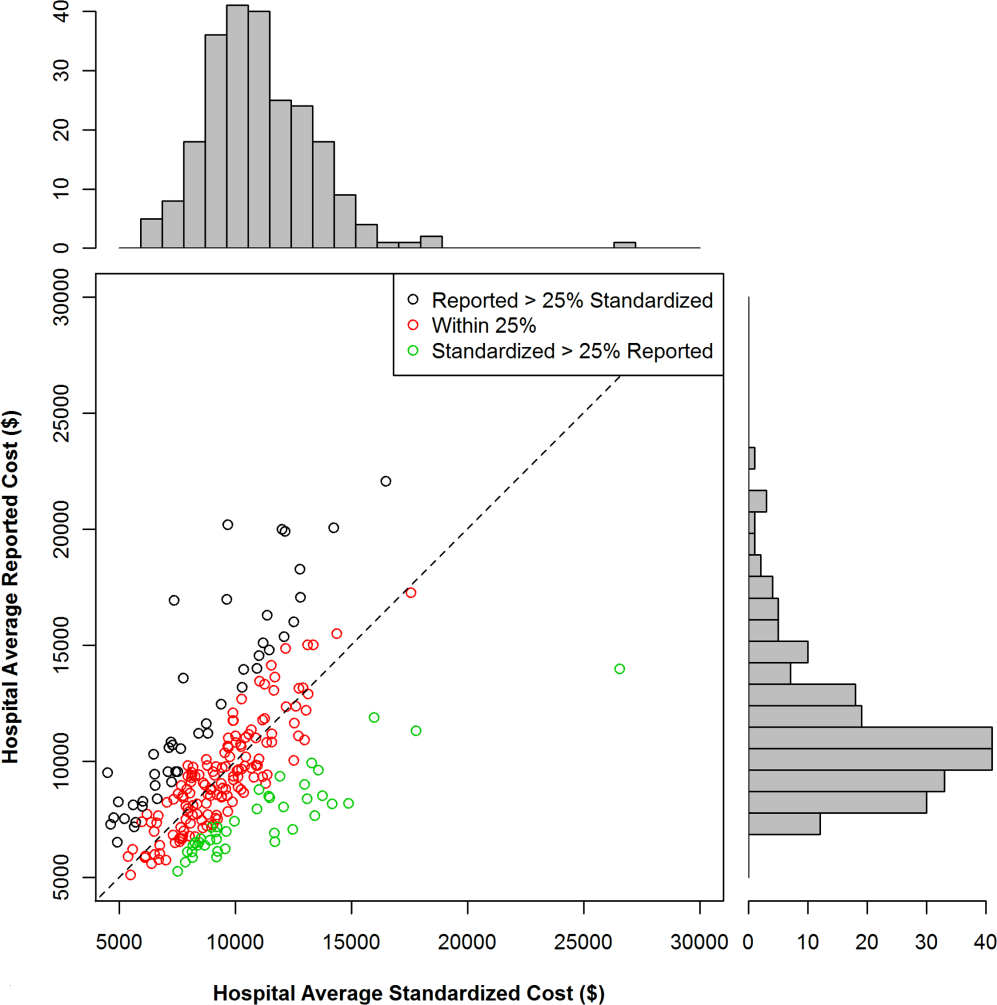
Next, we calculated standardized costs of hospitalizations for included hospitals and examined the relationship between hospitals' mean reported costs and mean standardized costs. This ratio could help diagnose the mechanism of high reported costs for a hospital, because high reported costs with low utilization would indicate high fixed costs, while high reported costs with high utilization would indicate greater use of tests and treatments. We assigned hospitals to strata based on reported costs greater than standardized costs by more than 25%, reported costs within 25% of standardized costs, and reported costs less than standardized costs by more than 25%. We examined the association between hospital characteristics and strata using a 2 test. All analyses were carried out using SAS version 9.3 (SAS Institute Inc., Cary, NC).
RESULTS
The 234 hospitals included in the analysis contributed a total of 165,647 hospitalizations, with the number of hospitalizations ranging from 33 to 2,772 hospitalizations per hospital (see Supporting Table 1 in the online version of this article). Most were located in urban areas (84%), and many were in the southern United States (42%). The median hospital reported cost per hospitalization was $6,535, with an interquartile range of $5,541 to $7,454. The median standardized cost per hospitalization was $6,602, with a range of $5,866 to $7,386. The interquartile ratio (Q75/Q25) of the reported costs of a hospitalization was 1.35. After costs were standardized, the interquartile ratio fell to 1.26, indicating that variation decreased. We found that the median hospital reported cost per day was $1,651, with an IQR of $1,400 to $1,933 (ratio 1.38), whereas the median standardized cost per day was $1,640, with an IQR of $1,511 to $1,812 (ratio 1.20).
There were more than 15,000 items (eg, treatments, tests, and supplies) that received a standardized charge code in our cohort. These were divided into 11 summary departments and 40 standard departments (see Supporting Table 2 in the online version of this article). We observed a high level of variation in the reported costs of individual items: the reported costs of a day of room and board in an ICU ranged from $773 at hospitals at the 10th percentile to $2,471 at the 90th percentile (Table 1.). The standardized cost of a day of ICU room and board was $1,577. We also observed variation in the reported costs of items across item categories. Although a day of medical room and board showed a 3‐fold difference between the 10th and 90th percentile, we observed a more than 10‐fold difference in the reported cost of an echocardiogram, from $31 at the 10th percentile to $356 at the 90th percentile. After examining the hospital‐level cost for a basket of goods, we found variation in the reported costs for these items across hospitals, with a 10th percentile cost of $1,552 and a 90th percentile cost of $3,967.
| Reported Costs | 10th Percentile | 25th Percentile | 75th Percentile | 90th Percentile | Median (Standardized Cost) |
|---|---|---|---|---|---|
| |||||
| Item | |||||
| Day of medical | 490.03 | 586.41 | 889.95 | 1121.20 | 722.59 |
| Day of ICU | 773.01 | 1275.84 | 1994.81 | 2471.75 | 1577.93 |
| Complete blood count | 6.87 | 9.34 | 18.34 | 23.46 | 13.07 |
| B‐natriuretic peptide | 12.13 | 19.22 | 44.19 | 60.56 | 28.23 |
| Metoprolol | 0.20 | 0.68 | 2.67 | 3.74 | 1.66 |
| Lisinopril | 0.28 | 1.02 | 2.79 | 4.06 | 1.72 |
| Spironolactone | 0.22 | 0.53 | 2.68 | 3.83 | 1.63 |
| Furosemide | 1.27 | 2.45 | 5.73 | 8.12 | 3.82 |
| Chest x‐ray | 43.88 | 51.54 | 89.96 | 117.16 | 67.45 |
| Echocardiogram | 31.53 | 98.63 | 244.63 | 356.50 | 159.07 |
| Chest CT (w & w/o contrast) | 65.17 | 83.99 | 157.23 | 239.27 | 110.76 |
| Noninvasive positive pressure ventilation | 126.23 | 127.25 | 370.44 | 514.67 | 177.24 |
| Electrocardiogram | 12.08 | 18.77 | 42.74 | 64.94 | 29.78 |
| Total basket | 1552.50 | 2157.85 | 3417.34 | 3967.78 | 2710.49 |
We found that 46 (20%) hospitals had reported costs of hospitalizations that were 25% greater than standardized costs (Figure 2). This group of hospitals had overestimated reported costs of utilization; 146 (62%) had reported costs within 25% of standardized costs, and 42 (17%) had reported costs that were 25% less than standardized costs (indicating that reported costs underestimated utilization). We examined the relationship between hospital characteristics and strata and found no significant association between the reported to standardized cost ratio and number of beds, teaching status, or urban location (Table 2). Hospitals in the Midwest and South were more likely to have a lower reported cost of hospitalizations, whereas hospitals in the West were more likely to have higher reported costs (P<0.001). When using the CV to compare reported costs to standardized costs, we found that per‐day standardized costs showed reduced variance (P=0.0238), but there was no significant difference in variance of the reported and standardized costs when examining the entire hospitalization (P=0.1423). At the level of the hospitalization, the Spearman correlation coefficient between reported and standardized cost was 0.89.
| Reported Greater Than Standardized by >25%, n (%) | Reported Within 25% (2‐tailed) of Standardized, n (%) | Reported Less Than Standardized by >25%, n (%) | P for 2 Test | |
|---|---|---|---|---|
| Total | 46 (19.7) | 146 (62.4) | 42 (17.0) | |
| No. of beds | 0.2313 | |||
| <200 | 19 (41.3) | 40 (27.4) | 12 (28.6) | |
| 200400 | 14 (30.4) | 67 (45.9) | 15 (35.7) | |
| >400 | 13 (28.3) | 39 (26.7) | 15 (35.7) | |
| Teaching | 0.8278 | |||
| Yes | 13 (28.3) | 45 (30.8) | 11 (26.2) | |
| No | 33 (71.7) | 101 (69.2) | 31 (73.8) | |
| Region | <0.0001 | |||
| Midwest | 7 (15.2) | 43 (29.5) | 19 (45.2) | |
| Northeast | 6 (13.0) | 18 (12.3) | 3 (7.1) | |
| South | 14 (30.4) | 64 (43.8) | 20 (47.6) | |
| West | 19 (41.3) | 21 (14.4) | 0 (0) | |
| Urban vs rural | 36 (78.3) | 128 (87.7) | 33 (78.6) | 0.1703 |
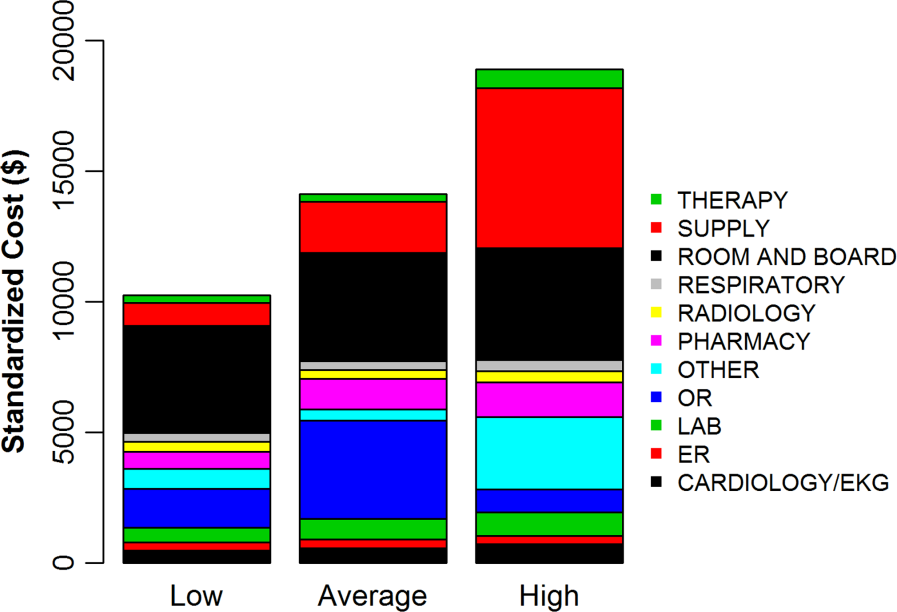
To better understand how hospitals can achieve high reported costs through different mechanisms, we more closely examined 3 hospitals with similar reported costs (Figure 3). These hospitals represented low, average, and high utilization according to their standardized costs, but had similar average per‐hospitalization reported costs: $11,643, $11,787, and $11,892, respectively. The corresponding standardized costs were $8,757, $11,169, and $15,978. The hospital with high utilization ($15,978 in standardized costs) was accounted for by increased use of supplies and other services. In contrast, the low‐ and average‐utilization hospitals had proportionally lower standardized costs across categories, with the greatest percentage of spending going toward room and board (includes nursing).
DISCUSSION
In a large national sample of hospitals, we observed variation in the reported costs for a uniform basket of goods, with a more than 2‐fold difference in cost between the 10th and 90th percentile hospitals. These findings suggest that reported costs have limited ability to reliably describe differences in utilization across hospitals. In contrast, when we applied standardized costs, the variance of per‐day costs decreased significantly, and the interquartile ratio of per‐day and hospitalization costs decreased as well, suggesting less variation in utilization across hospitals than would have been inferred from a comparison of reported costs. Applying a single, standard cost to all items can facilitate comparisons of utilization between hospitals (Figure 1). Standardized costs will give hospitals the potential to compare their utilization to their competitors and will facilitate research that examines the comparative effectiveness of high and low utilization in the management of medical and surgical conditions.
The reported to standardized cost ratio is another useful tool. It indicates whether the hospital's reported costs exaggerate its utilization relative to other hospitals. In this study, we found that a significant proportion of hospitals (20%) had reported costs that exceeded standardized costs by more than 25%. These hospitals have higher infrastructure, labor, or acquisition costs relative to their peers. To the extent that these hospitals might wish to lower the cost of care at their institution, they could focus on renegotiating purchasing or labor contracts, identifying areas where they may be overstaffed, or holding off on future infrastructure investments (Table 3).[14] In contrast, 17% of hospitals had reported costs that were 25% less than standardized costs. High‐cost hospitals in this group are therefore providing more treatments and testing to patients relative to their peers and could focus cost‐control efforts on reducing unnecessary utilization and duplicative testing.[20] Our examination of the hospital with high reported costs and very high utilization revealed a high percentage of supplies and other items, which is a category used primarily for nursing expenditures (Figure 3). Because the use of nursing services is directly related to days spent in the hospital, this hospital may wish to more closely examine specific strategies for reducing length of stay.
| High Reported Costs/High Standardized Costs | High Reported Costs/Low Standardized Costs | Low Reported Costs/High Standardized Costs | Low Reported Costs/Low Standardized Costs | |
|---|---|---|---|---|
| Utilization | High | Low | High | Low |
| Severity of illness | Likely to be higher | Likely to be lower | Likely to be higher | Likely to be lower |
| Practice style | Likely to be more intense | Likely to be less intense | Likely to be more intense | Likely to be less intense |
| Fixed costs | High or average | High | Low | Low |
| Infrastructure costs | Likely to be higher | Likely to be higher | Likely to be lower | Likely to be lower |
| Labor costs | Likely to be higher | Likely to be higher | Likely to be lower | Likely to be lower |
| Reported‐to‐standardized cost ratio | Close to 1 | >1 | <1 | Close to 1 |
| Causes of high costs | High utilization, high fixed costs, or both | High acquisition costs, high labor costs, or expensive infrastructure | High utilization | |
| Interventions to reduce costs | Work with clinicians to alter practice style, consider renegotiating cost of acquisitions, hold off on new infrastructure investments | Consider renegotiating cost of acquisitions, hold off on new infrastructure investments, consider reducing size of labor force | Work with clinicians to alter practice style | |
| Usefulness of reported‐ to‐standardized cost ratio | Less useful | More useful | More useful | Less useful |
We did not find a consistent association between the reported to standardized cost ratio and hospital characteristics. This is an important finding that contradicts prior work examining associations between hospital characteristics and costs for heart failure patients,[21] further indicating the complexity of the relationship between fixed costs and variable costs and the difficulty in adjusting reported costs to calculate utilization. For example, small hospitals may have higher acquisition costs and more supply chain difficulties, but they may also have less technology, lower overhead costs, and fewer specialists to order tests and procedures. Hospital characteristics, such as urban location and teaching status, are commonly used as adjustors in cost studies because hospitals in urban areas with teaching missions (which often provide care to low‐income populations) are assumed to have higher fixed costs,[3, 4, 5, 6] but the lack of a consistent relationship between these characteristics and the standardized cost ratio may indicate that using these factors as adjustors for cost may not be effective and could even obscure differences in utilization between hospitals. Notably, we did find an association between hospital region and the reported to standardized cost ratio, but we hesitate to draw conclusions from this finding because the Premier database is imbalanced in terms of regional representation, with fewer hospitals in the Midwest and West and the bulk of the hospitals in the South.
Although standardized costs have great potential, this method has limitations as well. Standardized costs can only be applied when detailed billing data with item‐level costs are available. This is because calculation of standardized costs requires taking the median of item costs and applying the median cost across the database, maintaining the integrity of the relative cost of items to one another. The relative cost of items is preserved (ie, magnetic resonance imaging still costs more than an aspirin), which maintains the general scheme of RVU‐based costs while removing the noise of varying RVU‐based costs across hospitals.[7] Application of an arbitrary item cost would result in the loss of this relative cost difference. Because item costs are not available in traditional administrative datasets, these datasets would not be amenable to this method. However, highly detailed billing data are now being shared by hundreds of hospitals in the Premier network and the University Health System Consortium. These data are widely available to investigators, meaning that the generalizability of this method will only improve over time. It was also a limitation of the study that we chose a limited basket of items common to patients with heart failure to describe the range of reported costs and to provide a standardized snapshot by which to compare hospitals. Because we only included a few items, we may have overestimated or underestimated the range of reported costs for such a basket.
Standardized costs are a novel method for comparing utilization across hospitals. Used properly, they will help identify high‐ and low‐intensity providers of hospital care.
- Health care costs–a primer. Kaiser Family Foundation Web site. Available at: http://www.kff.org/insurance/7670.cfm. Accessed July 20, 2012.
- . Explaining high health care spending in the United States: an international comparison of supply, utilization, prices, and quality. The Commonwealth Fund. 2012. Available at: http://www.commonwealthfund.org/Publications/Issue‐Briefs/2012/May/High‐Health‐Care‐Spending. aspx. Accessed on July 20, 2012.
- , , , , , . The relationship between hospital spending and mortality in patients with sepsis. Arch Intern Med. 2011;171(4):292–299.
- , , , . The elusive connection between health care spending and quality. Health Aff (Millwood). 2009;28(1):w119–w123.
- , , , . Hospital quality and intensity of spending: is there an association? Health Aff (Millwood). 2009;28(4):w566–w572.
- , , , , . Measuring efficiency: the association of hospital costs and quality of care. Health Aff (Millwood). 2009;28(3):897–906.
- , . Assigning resources to health care use for health services research: options and consequences. Med Care. 2009;47(7 suppl 1):S70–S75.
- , , , , . Health care costing: data, methods, current applications. Med Care. 2009;47(7 suppl 1):S1–S6.
- . Determination of VA health care costs. Med Care Res Rev. 2003;60(3 suppl):124S–141S.
- . An improved set of standards for finding cost for cost‐effectiveness analysis. Med Care. 2009;47(7 suppl 1):S82–S88.
- , , , et al. Comparison of approaches for estimating prevalence costs of care for cancer patients: what is the impact of data source? Med Care. 2009;47(7 suppl 1):S64–S69.
- . Principles involved in costing. Med J Aust. 1990;153Suppl:S10–S12.
- . Spending more through “cost control:” our obsessive quest to gut the hospital. Health Aff (Millwood). 1996;15(2):145–154.
- , , , et al. Distribution of variable vs. fixed costs of hospital care. JAMA. 1999;281(7):644–649.
- . Administrative and claims records as sources of health care cost data. Med Care. 2009;47(7 suppl 1):S51–S55.
- , , , , , . Perioperative beta‐blocker therapy and mortality after major noncardiac surgery. N Engl J Med. 2005;353(4):349–361.
- , , , et al. Public reporting and pay for performance in hospital quality improvement. N Engl J Med. 2007;356(5):486–496.
- , , , et al. Procedure intensity and the cost of care. Circ Cardiovasc Qual Outcomes. 2012;5(3):308–313.
- , , . A comparative study of tests for homogeneity of variances, with applications to the outer continental shelf bidding data. Technometrics. 1981;23:351–361.
- , , . Beyond the efficiency index: finding a better way to reduce overuse and increase efficiency in physician care. Health Aff (Millwood). 2008;27(4):w250–w259.
- , , . The association between hospital volume and processes, outcomes, and costs of care for congestive heart failure. Ann Intern Med. 2011;154(2):94–102.
Healthcare spending exceeded $2.5 trillion in 2007, and payments to hospitals represented the largest portion of this spending (more than 30%), equaling the combined cost of physician services and prescription drugs.[1, 2] Researchers and policymakers have emphasized the need to improve the value of hospital care in the United States, but this has been challenging, in part because of the difficulty in identifying hospitals that have high resource utilization relative to their peers.[3, 4, 5, 6, 7, 8, 9, 10, 11]
Most hospitals calculate their costs using internal accounting systems that determine resource utilization via relative value units (RVUs).[7, 8] RVU‐derived costs, also known as hospital reported costs, have proven to be an excellent method for quantifying what it costs a given hospital to provide a treatment, test, or procedure. However, RVU‐based costs are less useful for comparing resource utilization across hospitals because the cost to provide a treatment or service varies widely across hospitals. The cost of an item calculated using RVUs includes not just the item itself, but also a portion of the fixed costs of the hospital (overhead, labor, and infrastructure investments such as electronic records, new buildings, or expensive radiological or surgical equipment).[12] These costs vary by institution, patient population, region of the country, teaching status, and many other variables, making it difficult to identify resource utilization across hospitals.[13, 14]
Recently, a few claims‐based multi‐institutional datasets have begun incorporating item‐level RVU‐based costs derived directly from the cost accounting systems of participating institutions.[15] Such datasets allow researchers to compare reported costs of care from hospital to hospital, but because of the limitations we described above, they still cannot be used to answer the question: Which hospitals with higher costs of care are actually providing more treatments and services to patients?
To better facilitate the comparison of resource utilization patterns across hospitals, we standardized the unit costs of all treatments and services across hospitals by applying a single cost to every item across hospitals. This standardized cost allowed to compare utilization of that item (and the 15,000 other items in the database) across hospitals. We then compared estimates of resource utilization as measured by the 2 approaches: standardized and RVU‐based costs.
METHODS
Ethics Statement
All data were deidentified, by Premier, Inc., at both the hospital and patient level in accordance with the Health Insurance Portability and Accountability Act. The Yale University Human Investigation Committee reviewed the protocol for this study and determined that it is not considered to be human subjects research as defined by the Office of Human Research Protections.
Data Source
We conducted a cross‐sectional study using data from hospitals that participated in the database maintained by Premier Healthcare Informatics (Charlotte, NC) in the years 2009 to 2010. The Premier database is a voluntary, fee‐supported database created to measure quality and healthcare utilization.[3, 16, 17, 18] In 2010, it included detailed billing data from 500 hospitals in the United States, with more than 130 million cumulative hospital discharges. The detailed billing data includes all elements found in hospital claims derived from the uniform billing‐04 form, as well as an itemized, date‐stamped log of all items and services charged to the patient or insurer, such as medications, laboratory tests, and diagnostic and therapeutic services. The database includes approximately 15% of all US hospitalizations. Participating hospitals are similar to the composition of acute care hospitals nationwide. They represent all regions of the United States, and represent predominantly small‐ to mid‐sized nonteaching facilities that serve a largely urban population. The database also contains hospital reported costs at the item level as well as the total cost of the hospitalization. Approximately 75% of hospitals that participate submit RVU‐based costs taken from internal cost accounting systems. Because of our focus on comparing standardized costs to reported costs, we included only data from hospitals that use RVU‐based costs in this study.
Study Subjects
We included adult patients with a hospitalization recorded in the Premier database between January 1, 2009 and December 31, 2010, and a principal discharge diagnosis of heart failure (HF) (International Classification of Diseases, Ninth Revision, Clinical Modification codes: 402.01, 402.11, 402.91, 404.01, 404.03, 404.11, 404.13, 404.91, 404.93, 428.xx). We excluded transfers, patients assigned a pediatrician as the attending of record, and those who received a heart transplant or ventricular assist device during their stay. Because cost data are prone to extreme outliers, we excluded hospitalizations that were in the top 0.1% of length of stay, number of billing records, quantity of items billed, or total standardized cost. We also excluded hospitals that admitted fewer than 25 HF patients during the study period to reduce the possibility that a single high‐cost patient affected the hospital's cost profile.
Hospital Information
For each hospital included in the study, we recorded number of beds, teaching status, geographic region, and whether it served an urban or rural population.
Assignment of Standardized Costs
We defined reported cost as the RVU‐based cost per item in the database. We then calculated the median across hospitals for each item in the database and set this as the standardized unit cost of that item at every hospital (Figure 1). Once standardized costs were assigned at the item level, we summed the costs of all items assigned to each patient and calculated the standardized cost of a hospitalization per patient at each hospital.
Examination of Cost Variation
We compared the standardized and reported costs of hospitalizations using medians, interquartile ranges, and interquartile ratios (Q75/Q25). To examine whether standardized costs can reduce the noise due to differences in overhead and other fixed costs, we calculated, for each hospital, the coefficients of variation (CV) for per‐day reported and standardized costs and per‐hospitalization reported and standardized costs. We used the Fligner‐Killeen test to determine whether the variance of CVs was different for reported and standardized costs.[19]
Creation of Basket of Goods
Because there can be differences in the costs of items, the number and types of items administered during hospitalizations, 2 hospitals with similar reported costs for a hospitalization might deliver different quantities and combinations of treatments (Figure 1). We wished to demonstrate that there is variation in reported costs of items when the quantity and type of item is held constant, so we created a basket of items. We chose items that are commonly administered to patients with heart failure, but could have chosen any combination of items. The basket included a day of medical room and board, a day of intensive care unit (ICU) room and board, a single dose of ‐blocker, a single dose of angiotensin‐converting enzyme inhibitor, complete blood count, a B‐natriuretic peptide level, a chest radiograph, a chest computed tomography, and an echocardiogram. We then examined the range of hospitals' reported costs for this basket of goods using percentiles, medians, and interquartile ranges.
Reported to Standardized Cost Ratio
Next, we calculated standardized costs of hospitalizations for included hospitals and examined the relationship between hospitals' mean reported costs and mean standardized costs. This ratio could help diagnose the mechanism of high reported costs for a hospital, because high reported costs with low utilization would indicate high fixed costs, while high reported costs with high utilization would indicate greater use of tests and treatments. We assigned hospitals to strata based on reported costs greater than standardized costs by more than 25%, reported costs within 25% of standardized costs, and reported costs less than standardized costs by more than 25%. We examined the association between hospital characteristics and strata using a 2 test. All analyses were carried out using SAS version 9.3 (SAS Institute Inc., Cary, NC).
RESULTS
The 234 hospitals included in the analysis contributed a total of 165,647 hospitalizations, with the number of hospitalizations ranging from 33 to 2,772 hospitalizations per hospital (see Supporting Table 1 in the online version of this article). Most were located in urban areas (84%), and many were in the southern United States (42%). The median hospital reported cost per hospitalization was $6,535, with an interquartile range of $5,541 to $7,454. The median standardized cost per hospitalization was $6,602, with a range of $5,866 to $7,386. The interquartile ratio (Q75/Q25) of the reported costs of a hospitalization was 1.35. After costs were standardized, the interquartile ratio fell to 1.26, indicating that variation decreased. We found that the median hospital reported cost per day was $1,651, with an IQR of $1,400 to $1,933 (ratio 1.38), whereas the median standardized cost per day was $1,640, with an IQR of $1,511 to $1,812 (ratio 1.20).
There were more than 15,000 items (eg, treatments, tests, and supplies) that received a standardized charge code in our cohort. These were divided into 11 summary departments and 40 standard departments (see Supporting Table 2 in the online version of this article). We observed a high level of variation in the reported costs of individual items: the reported costs of a day of room and board in an ICU ranged from $773 at hospitals at the 10th percentile to $2,471 at the 90th percentile (Table 1.). The standardized cost of a day of ICU room and board was $1,577. We also observed variation in the reported costs of items across item categories. Although a day of medical room and board showed a 3‐fold difference between the 10th and 90th percentile, we observed a more than 10‐fold difference in the reported cost of an echocardiogram, from $31 at the 10th percentile to $356 at the 90th percentile. After examining the hospital‐level cost for a basket of goods, we found variation in the reported costs for these items across hospitals, with a 10th percentile cost of $1,552 and a 90th percentile cost of $3,967.
| Reported Costs | 10th Percentile | 25th Percentile | 75th Percentile | 90th Percentile | Median (Standardized Cost) |
|---|---|---|---|---|---|
| |||||
| Item | |||||
| Day of medical | 490.03 | 586.41 | 889.95 | 1121.20 | 722.59 |
| Day of ICU | 773.01 | 1275.84 | 1994.81 | 2471.75 | 1577.93 |
| Complete blood count | 6.87 | 9.34 | 18.34 | 23.46 | 13.07 |
| B‐natriuretic peptide | 12.13 | 19.22 | 44.19 | 60.56 | 28.23 |
| Metoprolol | 0.20 | 0.68 | 2.67 | 3.74 | 1.66 |
| Lisinopril | 0.28 | 1.02 | 2.79 | 4.06 | 1.72 |
| Spironolactone | 0.22 | 0.53 | 2.68 | 3.83 | 1.63 |
| Furosemide | 1.27 | 2.45 | 5.73 | 8.12 | 3.82 |
| Chest x‐ray | 43.88 | 51.54 | 89.96 | 117.16 | 67.45 |
| Echocardiogram | 31.53 | 98.63 | 244.63 | 356.50 | 159.07 |
| Chest CT (w & w/o contrast) | 65.17 | 83.99 | 157.23 | 239.27 | 110.76 |
| Noninvasive positive pressure ventilation | 126.23 | 127.25 | 370.44 | 514.67 | 177.24 |
| Electrocardiogram | 12.08 | 18.77 | 42.74 | 64.94 | 29.78 |
| Total basket | 1552.50 | 2157.85 | 3417.34 | 3967.78 | 2710.49 |
We found that 46 (20%) hospitals had reported costs of hospitalizations that were 25% greater than standardized costs (Figure 2). This group of hospitals had overestimated reported costs of utilization; 146 (62%) had reported costs within 25% of standardized costs, and 42 (17%) had reported costs that were 25% less than standardized costs (indicating that reported costs underestimated utilization). We examined the relationship between hospital characteristics and strata and found no significant association between the reported to standardized cost ratio and number of beds, teaching status, or urban location (Table 2). Hospitals in the Midwest and South were more likely to have a lower reported cost of hospitalizations, whereas hospitals in the West were more likely to have higher reported costs (P<0.001). When using the CV to compare reported costs to standardized costs, we found that per‐day standardized costs showed reduced variance (P=0.0238), but there was no significant difference in variance of the reported and standardized costs when examining the entire hospitalization (P=0.1423). At the level of the hospitalization, the Spearman correlation coefficient between reported and standardized cost was 0.89.
| Reported Greater Than Standardized by >25%, n (%) | Reported Within 25% (2‐tailed) of Standardized, n (%) | Reported Less Than Standardized by >25%, n (%) | P for 2 Test | |
|---|---|---|---|---|
| Total | 46 (19.7) | 146 (62.4) | 42 (17.0) | |
| No. of beds | 0.2313 | |||
| <200 | 19 (41.3) | 40 (27.4) | 12 (28.6) | |
| 200400 | 14 (30.4) | 67 (45.9) | 15 (35.7) | |
| >400 | 13 (28.3) | 39 (26.7) | 15 (35.7) | |
| Teaching | 0.8278 | |||
| Yes | 13 (28.3) | 45 (30.8) | 11 (26.2) | |
| No | 33 (71.7) | 101 (69.2) | 31 (73.8) | |
| Region | <0.0001 | |||
| Midwest | 7 (15.2) | 43 (29.5) | 19 (45.2) | |
| Northeast | 6 (13.0) | 18 (12.3) | 3 (7.1) | |
| South | 14 (30.4) | 64 (43.8) | 20 (47.6) | |
| West | 19 (41.3) | 21 (14.4) | 0 (0) | |
| Urban vs rural | 36 (78.3) | 128 (87.7) | 33 (78.6) | 0.1703 |
To better understand how hospitals can achieve high reported costs through different mechanisms, we more closely examined 3 hospitals with similar reported costs (Figure 3). These hospitals represented low, average, and high utilization according to their standardized costs, but had similar average per‐hospitalization reported costs: $11,643, $11,787, and $11,892, respectively. The corresponding standardized costs were $8,757, $11,169, and $15,978. The hospital with high utilization ($15,978 in standardized costs) was accounted for by increased use of supplies and other services. In contrast, the low‐ and average‐utilization hospitals had proportionally lower standardized costs across categories, with the greatest percentage of spending going toward room and board (includes nursing).
DISCUSSION
In a large national sample of hospitals, we observed variation in the reported costs for a uniform basket of goods, with a more than 2‐fold difference in cost between the 10th and 90th percentile hospitals. These findings suggest that reported costs have limited ability to reliably describe differences in utilization across hospitals. In contrast, when we applied standardized costs, the variance of per‐day costs decreased significantly, and the interquartile ratio of per‐day and hospitalization costs decreased as well, suggesting less variation in utilization across hospitals than would have been inferred from a comparison of reported costs. Applying a single, standard cost to all items can facilitate comparisons of utilization between hospitals (Figure 1). Standardized costs will give hospitals the potential to compare their utilization to their competitors and will facilitate research that examines the comparative effectiveness of high and low utilization in the management of medical and surgical conditions.
The reported to standardized cost ratio is another useful tool. It indicates whether the hospital's reported costs exaggerate its utilization relative to other hospitals. In this study, we found that a significant proportion of hospitals (20%) had reported costs that exceeded standardized costs by more than 25%. These hospitals have higher infrastructure, labor, or acquisition costs relative to their peers. To the extent that these hospitals might wish to lower the cost of care at their institution, they could focus on renegotiating purchasing or labor contracts, identifying areas where they may be overstaffed, or holding off on future infrastructure investments (Table 3).[14] In contrast, 17% of hospitals had reported costs that were 25% less than standardized costs. High‐cost hospitals in this group are therefore providing more treatments and testing to patients relative to their peers and could focus cost‐control efforts on reducing unnecessary utilization and duplicative testing.[20] Our examination of the hospital with high reported costs and very high utilization revealed a high percentage of supplies and other items, which is a category used primarily for nursing expenditures (Figure 3). Because the use of nursing services is directly related to days spent in the hospital, this hospital may wish to more closely examine specific strategies for reducing length of stay.
| High Reported Costs/High Standardized Costs | High Reported Costs/Low Standardized Costs | Low Reported Costs/High Standardized Costs | Low Reported Costs/Low Standardized Costs | |
|---|---|---|---|---|
| Utilization | High | Low | High | Low |
| Severity of illness | Likely to be higher | Likely to be lower | Likely to be higher | Likely to be lower |
| Practice style | Likely to be more intense | Likely to be less intense | Likely to be more intense | Likely to be less intense |
| Fixed costs | High or average | High | Low | Low |
| Infrastructure costs | Likely to be higher | Likely to be higher | Likely to be lower | Likely to be lower |
| Labor costs | Likely to be higher | Likely to be higher | Likely to be lower | Likely to be lower |
| Reported‐to‐standardized cost ratio | Close to 1 | >1 | <1 | Close to 1 |
| Causes of high costs | High utilization, high fixed costs, or both | High acquisition costs, high labor costs, or expensive infrastructure | High utilization | |
| Interventions to reduce costs | Work with clinicians to alter practice style, consider renegotiating cost of acquisitions, hold off on new infrastructure investments | Consider renegotiating cost of acquisitions, hold off on new infrastructure investments, consider reducing size of labor force | Work with clinicians to alter practice style | |
| Usefulness of reported‐ to‐standardized cost ratio | Less useful | More useful | More useful | Less useful |
We did not find a consistent association between the reported to standardized cost ratio and hospital characteristics. This is an important finding that contradicts prior work examining associations between hospital characteristics and costs for heart failure patients,[21] further indicating the complexity of the relationship between fixed costs and variable costs and the difficulty in adjusting reported costs to calculate utilization. For example, small hospitals may have higher acquisition costs and more supply chain difficulties, but they may also have less technology, lower overhead costs, and fewer specialists to order tests and procedures. Hospital characteristics, such as urban location and teaching status, are commonly used as adjustors in cost studies because hospitals in urban areas with teaching missions (which often provide care to low‐income populations) are assumed to have higher fixed costs,[3, 4, 5, 6] but the lack of a consistent relationship between these characteristics and the standardized cost ratio may indicate that using these factors as adjustors for cost may not be effective and could even obscure differences in utilization between hospitals. Notably, we did find an association between hospital region and the reported to standardized cost ratio, but we hesitate to draw conclusions from this finding because the Premier database is imbalanced in terms of regional representation, with fewer hospitals in the Midwest and West and the bulk of the hospitals in the South.
Although standardized costs have great potential, this method has limitations as well. Standardized costs can only be applied when detailed billing data with item‐level costs are available. This is because calculation of standardized costs requires taking the median of item costs and applying the median cost across the database, maintaining the integrity of the relative cost of items to one another. The relative cost of items is preserved (ie, magnetic resonance imaging still costs more than an aspirin), which maintains the general scheme of RVU‐based costs while removing the noise of varying RVU‐based costs across hospitals.[7] Application of an arbitrary item cost would result in the loss of this relative cost difference. Because item costs are not available in traditional administrative datasets, these datasets would not be amenable to this method. However, highly detailed billing data are now being shared by hundreds of hospitals in the Premier network and the University Health System Consortium. These data are widely available to investigators, meaning that the generalizability of this method will only improve over time. It was also a limitation of the study that we chose a limited basket of items common to patients with heart failure to describe the range of reported costs and to provide a standardized snapshot by which to compare hospitals. Because we only included a few items, we may have overestimated or underestimated the range of reported costs for such a basket.
Standardized costs are a novel method for comparing utilization across hospitals. Used properly, they will help identify high‐ and low‐intensity providers of hospital care.
- Health care costs–a primer. Kaiser Family Foundation Web site. Available at: http://www.kff.org/insurance/7670.cfm. Accessed July 20, 2012.
- . Explaining high health care spending in the United States: an international comparison of supply, utilization, prices, and quality. The Commonwealth Fund. 2012. Available at: http://www.commonwealthfund.org/Publications/Issue‐Briefs/2012/May/High‐Health‐Care‐Spending. aspx. Accessed on July 20, 2012.
- , , , , , . The relationship between hospital spending and mortality in patients with sepsis. Arch Intern Med. 2011;171(4):292–299.
- , , , . The elusive connection between health care spending and quality. Health Aff (Millwood). 2009;28(1):w119–w123.
- , , , . Hospital quality and intensity of spending: is there an association? Health Aff (Millwood). 2009;28(4):w566–w572.
- , , , , . Measuring efficiency: the association of hospital costs and quality of care. Health Aff (Millwood). 2009;28(3):897–906.
- , . Assigning resources to health care use for health services research: options and consequences. Med Care. 2009;47(7 suppl 1):S70–S75.
- , , , , . Health care costing: data, methods, current applications. Med Care. 2009;47(7 suppl 1):S1–S6.
- . Determination of VA health care costs. Med Care Res Rev. 2003;60(3 suppl):124S–141S.
- . An improved set of standards for finding cost for cost‐effectiveness analysis. Med Care. 2009;47(7 suppl 1):S82–S88.
- , , , et al. Comparison of approaches for estimating prevalence costs of care for cancer patients: what is the impact of data source? Med Care. 2009;47(7 suppl 1):S64–S69.
- . Principles involved in costing. Med J Aust. 1990;153Suppl:S10–S12.
- . Spending more through “cost control:” our obsessive quest to gut the hospital. Health Aff (Millwood). 1996;15(2):145–154.
- , , , et al. Distribution of variable vs. fixed costs of hospital care. JAMA. 1999;281(7):644–649.
- . Administrative and claims records as sources of health care cost data. Med Care. 2009;47(7 suppl 1):S51–S55.
- , , , , , . Perioperative beta‐blocker therapy and mortality after major noncardiac surgery. N Engl J Med. 2005;353(4):349–361.
- , , , et al. Public reporting and pay for performance in hospital quality improvement. N Engl J Med. 2007;356(5):486–496.
- , , , et al. Procedure intensity and the cost of care. Circ Cardiovasc Qual Outcomes. 2012;5(3):308–313.
- , , . A comparative study of tests for homogeneity of variances, with applications to the outer continental shelf bidding data. Technometrics. 1981;23:351–361.
- , , . Beyond the efficiency index: finding a better way to reduce overuse and increase efficiency in physician care. Health Aff (Millwood). 2008;27(4):w250–w259.
- , , . The association between hospital volume and processes, outcomes, and costs of care for congestive heart failure. Ann Intern Med. 2011;154(2):94–102.
© 2013 Society of Hospital Medicine