User login
Introducing Point-Counterpoint Perspectives in the Journal of Hospital Medicine
Providing high-quality, efficient, and evidence-based healthcare is a complicated and complex process. The right approach or path forward is not always clear. In medicine, decision-making inherently involves uncertainty; evidence may be lacking, or values or context may differ, and thus, reasonable clinicians may choose to make different decisions based on the same data.
In this spirit of fostering education and healthy debate to improve understanding of challenges relevant to the field of hospital medicine, we are pleased to introduce our Point-Counterpoint series within the Perspectives in Hospital Medicine section of the journal. Point-Counterpoint Perspectives presents a debate by content experts. Each provides an interpretation of evidence regarding patient management or other controversial issues relating to hospital-based care. The format consists of an overview of the topic with an original point followed by a counterpoint response and, finally, a rebuttal (Table). We ask contributors to be as outspoken in their points and counterpoints as the evidence allows in order to fully elaborate the questions and uncertainties that may otherwise be familiar only to experts in the field or to those in other disciplines.

Our inaugural point-counterpoint articles address whether healthcare workers should receive priority for scarce drugs and therapies during the coronavirus disease 2019 (COVID-19) pandemic. The intermittent shortage of medical supplies and protective equipment has made it not only difficult but also at times dangerous for healthcare workers to care for infected patients.1 The risks of developing COVID-19 and fear of transmitting it to loved ones has led to stress, fatigue, and burnout among healthcare workers, leading some to quit and even attempt suicide. The downstream effects of this stress may adversely affect patients and exacerbate staffing challenges in an already taxed healthcare system.2 Do we have a special obligation to those on the front lines? We are grateful to Drs Kirk R Daffner, Armand Antommaria, and Ndidi I Unaka, for addressing this controversial topic.3-5
1. Lagu T, Artenstein AW, Werner RM. Fool me twice: the role for hospitals and health systems in fixing the broken PPE supply chain. J Hosp Med. 2020;15(9):570-571. https://doi.org/10.12788/jhm.3489
2. Ali SS. Why some nurses have quit during the coronavirus pandemic. NBC News. May,10, 2020. Accessed January 18, 2021. https://www.nbcnews.com/news/us-news/why-some-nurses-have-quit-during-coronavirus-pandemic-n1201796
3. Daffner KR. Point: healthcare providers should receive treatment priority during a pandemic. J Hosp Med. 2021;16(3):180-181. https://doi.org/10.12788/jhm.3596
4. Antommaria A, Unaka NI. Counterpoint: prioritizing healthcare workers for scarce critical resources is impractical and unjust. J Hosp Med. 2021;16(3):182-183. https://doi.org/10.12788/jhm.3597
5. Daffner KR. Rebuttal: accounting for the community’s reciprocal obligations during a pandemic. J Hosp Med. 2021;16(3):184. https://doi.org/10.12788/jhm.3600
Providing high-quality, efficient, and evidence-based healthcare is a complicated and complex process. The right approach or path forward is not always clear. In medicine, decision-making inherently involves uncertainty; evidence may be lacking, or values or context may differ, and thus, reasonable clinicians may choose to make different decisions based on the same data.
In this spirit of fostering education and healthy debate to improve understanding of challenges relevant to the field of hospital medicine, we are pleased to introduce our Point-Counterpoint series within the Perspectives in Hospital Medicine section of the journal. Point-Counterpoint Perspectives presents a debate by content experts. Each provides an interpretation of evidence regarding patient management or other controversial issues relating to hospital-based care. The format consists of an overview of the topic with an original point followed by a counterpoint response and, finally, a rebuttal (Table). We ask contributors to be as outspoken in their points and counterpoints as the evidence allows in order to fully elaborate the questions and uncertainties that may otherwise be familiar only to experts in the field or to those in other disciplines.
Our inaugural point-counterpoint articles address whether healthcare workers should receive priority for scarce drugs and therapies during the coronavirus disease 2019 (COVID-19) pandemic. The intermittent shortage of medical supplies and protective equipment has made it not only difficult but also at times dangerous for healthcare workers to care for infected patients.1 The risks of developing COVID-19 and fear of transmitting it to loved ones has led to stress, fatigue, and burnout among healthcare workers, leading some to quit and even attempt suicide. The downstream effects of this stress may adversely affect patients and exacerbate staffing challenges in an already taxed healthcare system.2 Do we have a special obligation to those on the front lines? We are grateful to Drs Kirk R Daffner, Armand Antommaria, and Ndidi I Unaka, for addressing this controversial topic.3-5
1. Lagu T, Artenstein AW, Werner RM. Fool me twice: the role for hospitals and health systems in fixing the broken PPE supply chain. J Hosp Med. 2020;15(9):570-571. https://doi.org/10.12788/jhm.3489
2. Ali SS. Why some nurses have quit during the coronavirus pandemic. NBC News. May,10, 2020. Accessed January 18, 2021. https://www.nbcnews.com/news/us-news/why-some-nurses-have-quit-during-coronavirus-pandemic-n1201796
3. Daffner KR. Point: healthcare providers should receive treatment priority during a pandemic. J Hosp Med. 2021;16(3):180-181. https://doi.org/10.12788/jhm.3596
4. Antommaria A, Unaka NI. Counterpoint: prioritizing healthcare workers for scarce critical resources is impractical and unjust. J Hosp Med. 2021;16(3):182-183. https://doi.org/10.12788/jhm.3597
5. Daffner KR. Rebuttal: accounting for the community’s reciprocal obligations during a pandemic. J Hosp Med. 2021;16(3):184. https://doi.org/10.12788/jhm.3600
© 2021 Society of Hospital Medicine
The Light at the End of the Tunnel: Reflections on 2020 and Hopes for 2021
We enter the new year still in the midst of the coronavirus disease 2019 (COVID-19) pandemic and remain humbled by its impact. It is remarkable how much, and how little, has changed. Hospitalists in the early days of the COVID-19 pandemic were struggling. We were caring for patients who were suffering and dying from a new and mysterious disease. There weren’t enough tests (or, if there were tests, there weren’t swabs).1 We were using protocols for managing respiratory failure that, we would learn later, may not have been the best for improving outcomes. Rumors of unproven therapies came from everywhere: our patients, our colleagues, and even the highest realms of the federal government. We also knew very little about how best to protect ourselves. In many cases, we did not have enough personal protective equipment (PPE). There were no face shields, or “zoom rounds,” or even awareness that we probably shouldn’t sit in the tiny conference room (maskless) discussing patients with the large team of doctors, nurses, respiratory therapists, and social workers.
Perhaps worst of all, we were haunted. We were alarmed by the large numbers of young patients who were ill, and our elderly patients, many of whom we knew and had cared for many times, had suddenly just stopped showing up.2 In our free moments, we worried about them; maybe they were afraid to come to the hospital, maybe they were home sick with COVID-19, or maybe they had died alone. And children, initially thought to be spared the most serious consequences of COVID-19, started coming to the hospital with a rare but severe new COVID-19-associated complication, termed multisystem inflammatory syndrome in children (MIS-C). We had to learn to manage yet another manifestation of COVID-19, largely through trial and error.
And, of course, clinical care was only one of our many responsibilities. We were also busy hunting for ventilators, setting up makeshift medical wards and intensive care units, revamping medical education, and scouring the literature for any information to help guide patient care. We worried about getting sick ourselves and bringing the disease home to our families. Our impatience grew as day after day there was no (and still is no) coordinated federal response.
A glimmer of hope slowly emerged. Our colleagues designed and rapidly evaluated respiratory protocols and provided early evidence about the strategies (eg, proning) that were associated with improved outcomes.3 Researchers began to generate knowledge and move us beyond rumors regarding potential therapies. We cheered as our administrators concocted unusual strategies to remedy the PPE and testing shortages.4
At the Journal of Hospital Medicine, we were faced with another challenge: How would we describe the chaos and the challenges of being a physician during the COVID-19 era? How would we document the way our colleagues were rising to the challenge and identifying opportunities to rethink hospital care in the United States?
In April, we began to receive a deluge of personal essays from frontline physicians about their experiences with COVID-19. Generally, medical journals publish and disseminate original, high-impact research. Personal essays rarely fit this model. Given the unprecedented circumstances, however, we decided these essays could help chronicle an important moment in medical history. In our May 2020 issue, we published only these essays. We continue to publish them online almost daily.
Some of the essays described how the healthcare system—previously thought to be hyperspecialized, profit-driven, and resistant to change—pivoted within days, as hospitalist physicians trained other physicians to “unspecialize” and pediatricians began to care for adults in an otherwise overwhelmed hospital system.5,6 Another essay focused on the need to trust that medical students who had graduated early would be able to function as physicians.7 And yet another essay expressed concern about the widespread use of unproven therapies in hospitalized patients. “Even in times of global pandemic, we need to consider potential harms and adverse consequences of novel treatments,’’ the physicians wrote. “Sometimes inaction is preferable to action.”8
Several essays reflected on the impact of the pandemic on healthcare disparities, suggesting that the pandemic had made (the well-known but often ignored) differences in health outcomes between White patients and racial minorities more obvious. Still another essay reflected on the intersection between structural racism, poor access to care, and interpersonal racism, describing the grief caused by losses of Black lives to both police violence and COVID-19.9
There also were personal stories of hardship and survival. One hospitalist physician with asthma described coughing as ``the new leprosy.”10 She wrote, “This is a particularly unpropitious time in history to be a Chinese-American doctor who can’t stop coughing.”
There were drawbacks to our decision to focus on personal essays. Although it was clear even before the pandemic, COVID-19 has highlighted that a path for quick dissemination of original peer-reviewed research is needed. If existing medical journals do not fill that role, websites that publish and disseminate non–peer-reviewed work (aka, “preprints”) will become the preferred method for distribution of high-impact, timely original research.11 The journal’s pivot to reviewing and publishing personal essays may have kept us from improving our approach to rapid peer review and dissemination. In those early days, however, there was no peer-reviewed work to publish, but there was an intense desire (from our members and physicians generally) for information and stories from the front lines. In a way, the essays we published were early “case reports,” that hypothesized about how we might rethink healthcare delivery in pandemic conditions.
Furthermore, our decision to solicit and publish personal essays addressing shortcomings of the federal response and consequences of the pandemic meant that the Journal of Hospital Medicine became part of the pandemic’s political discourse. As editors, we have historically kept the journal away from political arguments or endorsements. In this case, however, we decided that even if some of the opinions were political, they were an appropriate response to the widespread anti-science rhetoric endorsed by the current administration. The resultant erosion of trust in public health has undoubtedly contributed to persistence of the pandemic.12 A stance against masks, for example, rejects the recommendations of nearly all scientists in favor of (a selfish and problematic idea of) “self-determination.” Those who proclaim that such a mandate infringes on their personal freedom reject evidence-based recommendations of scientists and disregard public health strategies meant to protect everyone.
As we reflect on the past year, our most important lesson may be that our previous emphasis on publishing high-impact original research likely missed important personal and professional insights, insights that could have changed practice, improved patient experience, and reduced physician burnout. Anecdotes are not scientific evidence, but we have discovered their incredible power to help us learn, empathize, commiserate, and survive. Hospitals learned that they must adapt in the moment, a notion that runs counter to the notoriously slow pace of change in paradigms of healthcare. Hospitalists learned to “find their battle buddies” to ward off isolation and to cherish their teams in the face of overwhelming trauma, an approach requiring empathy, humility, and compassion.13 We won’t soon forget that, when things were most dire, it was stories—not data—that gave us hope. We look forward to 2021 with great optimism. New vaccines and new federal leaders who value and respect science give us hope that the end of the pandemic is in sight. We are indebted to all frontline workers who have transformed care delivery and remained courageous in the face of great personal risk. As a journal, we will continue, as one scientist noted, to use our “platform for advocacy, unabashedly.”14
1. Shuren J, Stenzel T. Covid-19 molecular diagnostic testing - lessons learned. N Engl J Med. 2020;383:e97. https://doi.org/10.1056/NEJMp2023830
2. Rosenbaum L. The untold toll - the pandemic’s effects on patients without Covid-19. N Engl J Med. 2020;382:2368-2371. https://doi.org/10.1056/NEJMms2009984
3. Westafer LM, Elia T, Medarametla V, Lagu T. A transdisciplinary COVID-19 early respiratory intervention protocol: an implementation story. J Hosp Med. 2020;15:372-374. https://doi.org/10.12788/jhm.3456
4. Lagu T, Artenstein AW, Werner RM. Fool me twice: the role for hospitals and health systems in fixing the broken PPE supply chain. J Hosp Med. 2020;15:570-571. https://doi.org/10.12788/jhm.3489
5. Cram P, Anderson ML, Shaughnessy EE. All hands on deck: learning to “un-specialize” in the COVID-19 pandemic. J Hosp Med. 2020;15:314-315. https://doi.org/10.12788/jhm.3426
6. Biala D, Siegel EJ, Silver L, Schindel B, Smith KM. Deployed: pediatric residents caring for adults during COVID-19’s first wave in New York City. J Hosp Med. 2020; Published ahead of print. https://doi.org/10.12788/jhm.3527
7. Kinnear B, Kelleher M, Olson AP, Sall D, Schumacher DJ. Developing trust with early medical school graduates during the COVID-19 pandemic. J Hosp Med. 2020;15:367-369. https://doi.org/10.12788/jhm.3463
8. Canfield GS, Schultz JS, Windham S, et al. Empiric therapies for covid-19: destined to fail by ignoring the lessons of history. J Hosp Med. 2020;15:434-436. https://doi.org/10.12788/jhm.3469
9. Manning KD. When grief and crises intersect: perspectives of a Black physician in the time of two pandemics. J Hosp Med. 2020;15:566-567. https://doi.org/10.12788/jhm.3481
10. Chang T. Do I have coronavirus? J Hosp Med. 2020;15:277-278. https://doi.org/10.12788/jhm.3430
11. Guterman EL, Braunstein LZ. Preprints during the COVID-19 pandemic: public health emergencies and medical literature. J Hosp Med. 2020;15:634-636. https://doi.org/10.12788/jhm.3491
12. Udow-Phillips M, Lantz PM. Trust in public health is essential amid the COVID-19 pandemic. J Hosp Med. 2020;15:431-433. https://doi.org/10.12788/jhm.3474
13. Hertling M. Ten tips for a crisis: lessons from a soldier. J Hosp Med. 2020;15:275-276. https://doi.org/10.12788/jhm.3424
14. O’Glasser A [@aoglasser]. #JHMChat I also need to readily admit that part of the reason I’m a loyal, enthusiastic @JHospMedicine reader is because [Tweet]. November 16, 2020. Accessed November 28, 2020. https://twitter.com/aoglasser/status/1328529564595720192
We enter the new year still in the midst of the coronavirus disease 2019 (COVID-19) pandemic and remain humbled by its impact. It is remarkable how much, and how little, has changed. Hospitalists in the early days of the COVID-19 pandemic were struggling. We were caring for patients who were suffering and dying from a new and mysterious disease. There weren’t enough tests (or, if there were tests, there weren’t swabs).1 We were using protocols for managing respiratory failure that, we would learn later, may not have been the best for improving outcomes. Rumors of unproven therapies came from everywhere: our patients, our colleagues, and even the highest realms of the federal government. We also knew very little about how best to protect ourselves. In many cases, we did not have enough personal protective equipment (PPE). There were no face shields, or “zoom rounds,” or even awareness that we probably shouldn’t sit in the tiny conference room (maskless) discussing patients with the large team of doctors, nurses, respiratory therapists, and social workers.
Perhaps worst of all, we were haunted. We were alarmed by the large numbers of young patients who were ill, and our elderly patients, many of whom we knew and had cared for many times, had suddenly just stopped showing up.2 In our free moments, we worried about them; maybe they were afraid to come to the hospital, maybe they were home sick with COVID-19, or maybe they had died alone. And children, initially thought to be spared the most serious consequences of COVID-19, started coming to the hospital with a rare but severe new COVID-19-associated complication, termed multisystem inflammatory syndrome in children (MIS-C). We had to learn to manage yet another manifestation of COVID-19, largely through trial and error.
And, of course, clinical care was only one of our many responsibilities. We were also busy hunting for ventilators, setting up makeshift medical wards and intensive care units, revamping medical education, and scouring the literature for any information to help guide patient care. We worried about getting sick ourselves and bringing the disease home to our families. Our impatience grew as day after day there was no (and still is no) coordinated federal response.
A glimmer of hope slowly emerged. Our colleagues designed and rapidly evaluated respiratory protocols and provided early evidence about the strategies (eg, proning) that were associated with improved outcomes.3 Researchers began to generate knowledge and move us beyond rumors regarding potential therapies. We cheered as our administrators concocted unusual strategies to remedy the PPE and testing shortages.4
At the Journal of Hospital Medicine, we were faced with another challenge: How would we describe the chaos and the challenges of being a physician during the COVID-19 era? How would we document the way our colleagues were rising to the challenge and identifying opportunities to rethink hospital care in the United States?
In April, we began to receive a deluge of personal essays from frontline physicians about their experiences with COVID-19. Generally, medical journals publish and disseminate original, high-impact research. Personal essays rarely fit this model. Given the unprecedented circumstances, however, we decided these essays could help chronicle an important moment in medical history. In our May 2020 issue, we published only these essays. We continue to publish them online almost daily.
Some of the essays described how the healthcare system—previously thought to be hyperspecialized, profit-driven, and resistant to change—pivoted within days, as hospitalist physicians trained other physicians to “unspecialize” and pediatricians began to care for adults in an otherwise overwhelmed hospital system.5,6 Another essay focused on the need to trust that medical students who had graduated early would be able to function as physicians.7 And yet another essay expressed concern about the widespread use of unproven therapies in hospitalized patients. “Even in times of global pandemic, we need to consider potential harms and adverse consequences of novel treatments,’’ the physicians wrote. “Sometimes inaction is preferable to action.”8
Several essays reflected on the impact of the pandemic on healthcare disparities, suggesting that the pandemic had made (the well-known but often ignored) differences in health outcomes between White patients and racial minorities more obvious. Still another essay reflected on the intersection between structural racism, poor access to care, and interpersonal racism, describing the grief caused by losses of Black lives to both police violence and COVID-19.9
There also were personal stories of hardship and survival. One hospitalist physician with asthma described coughing as ``the new leprosy.”10 She wrote, “This is a particularly unpropitious time in history to be a Chinese-American doctor who can’t stop coughing.”
There were drawbacks to our decision to focus on personal essays. Although it was clear even before the pandemic, COVID-19 has highlighted that a path for quick dissemination of original peer-reviewed research is needed. If existing medical journals do not fill that role, websites that publish and disseminate non–peer-reviewed work (aka, “preprints”) will become the preferred method for distribution of high-impact, timely original research.11 The journal’s pivot to reviewing and publishing personal essays may have kept us from improving our approach to rapid peer review and dissemination. In those early days, however, there was no peer-reviewed work to publish, but there was an intense desire (from our members and physicians generally) for information and stories from the front lines. In a way, the essays we published were early “case reports,” that hypothesized about how we might rethink healthcare delivery in pandemic conditions.
Furthermore, our decision to solicit and publish personal essays addressing shortcomings of the federal response and consequences of the pandemic meant that the Journal of Hospital Medicine became part of the pandemic’s political discourse. As editors, we have historically kept the journal away from political arguments or endorsements. In this case, however, we decided that even if some of the opinions were political, they were an appropriate response to the widespread anti-science rhetoric endorsed by the current administration. The resultant erosion of trust in public health has undoubtedly contributed to persistence of the pandemic.12 A stance against masks, for example, rejects the recommendations of nearly all scientists in favor of (a selfish and problematic idea of) “self-determination.” Those who proclaim that such a mandate infringes on their personal freedom reject evidence-based recommendations of scientists and disregard public health strategies meant to protect everyone.
As we reflect on the past year, our most important lesson may be that our previous emphasis on publishing high-impact original research likely missed important personal and professional insights, insights that could have changed practice, improved patient experience, and reduced physician burnout. Anecdotes are not scientific evidence, but we have discovered their incredible power to help us learn, empathize, commiserate, and survive. Hospitals learned that they must adapt in the moment, a notion that runs counter to the notoriously slow pace of change in paradigms of healthcare. Hospitalists learned to “find their battle buddies” to ward off isolation and to cherish their teams in the face of overwhelming trauma, an approach requiring empathy, humility, and compassion.13 We won’t soon forget that, when things were most dire, it was stories—not data—that gave us hope. We look forward to 2021 with great optimism. New vaccines and new federal leaders who value and respect science give us hope that the end of the pandemic is in sight. We are indebted to all frontline workers who have transformed care delivery and remained courageous in the face of great personal risk. As a journal, we will continue, as one scientist noted, to use our “platform for advocacy, unabashedly.”14
1. Shuren J, Stenzel T. Covid-19 molecular diagnostic testing - lessons learned. N Engl J Med. 2020;383:e97. https://doi.org/10.1056/NEJMp2023830
2. Rosenbaum L. The untold toll - the pandemic’s effects on patients without Covid-19. N Engl J Med. 2020;382:2368-2371. https://doi.org/10.1056/NEJMms2009984
3. Westafer LM, Elia T, Medarametla V, Lagu T. A transdisciplinary COVID-19 early respiratory intervention protocol: an implementation story. J Hosp Med. 2020;15:372-374. https://doi.org/10.12788/jhm.3456
4. Lagu T, Artenstein AW, Werner RM. Fool me twice: the role for hospitals and health systems in fixing the broken PPE supply chain. J Hosp Med. 2020;15:570-571. https://doi.org/10.12788/jhm.3489
5. Cram P, Anderson ML, Shaughnessy EE. All hands on deck: learning to “un-specialize” in the COVID-19 pandemic. J Hosp Med. 2020;15:314-315. https://doi.org/10.12788/jhm.3426
6. Biala D, Siegel EJ, Silver L, Schindel B, Smith KM. Deployed: pediatric residents caring for adults during COVID-19’s first wave in New York City. J Hosp Med. 2020; Published ahead of print. https://doi.org/10.12788/jhm.3527
7. Kinnear B, Kelleher M, Olson AP, Sall D, Schumacher DJ. Developing trust with early medical school graduates during the COVID-19 pandemic. J Hosp Med. 2020;15:367-369. https://doi.org/10.12788/jhm.3463
8. Canfield GS, Schultz JS, Windham S, et al. Empiric therapies for covid-19: destined to fail by ignoring the lessons of history. J Hosp Med. 2020;15:434-436. https://doi.org/10.12788/jhm.3469
9. Manning KD. When grief and crises intersect: perspectives of a Black physician in the time of two pandemics. J Hosp Med. 2020;15:566-567. https://doi.org/10.12788/jhm.3481
10. Chang T. Do I have coronavirus? J Hosp Med. 2020;15:277-278. https://doi.org/10.12788/jhm.3430
11. Guterman EL, Braunstein LZ. Preprints during the COVID-19 pandemic: public health emergencies and medical literature. J Hosp Med. 2020;15:634-636. https://doi.org/10.12788/jhm.3491
12. Udow-Phillips M, Lantz PM. Trust in public health is essential amid the COVID-19 pandemic. J Hosp Med. 2020;15:431-433. https://doi.org/10.12788/jhm.3474
13. Hertling M. Ten tips for a crisis: lessons from a soldier. J Hosp Med. 2020;15:275-276. https://doi.org/10.12788/jhm.3424
14. O’Glasser A [@aoglasser]. #JHMChat I also need to readily admit that part of the reason I’m a loyal, enthusiastic @JHospMedicine reader is because [Tweet]. November 16, 2020. Accessed November 28, 2020. https://twitter.com/aoglasser/status/1328529564595720192
© 2021 Society of Hospital Medicine
Email: Samir.Shah@cchmc.org; Telephone: 513-636-6222; Twitter: @SamirShahMD.
Fool Me Twice: The Role for Hospitals and Health Systems in Fixing the Broken PPE Supply Chain
The story of the coronavirus disease 2019 (COVID-19) pandemic in the United States has been defined, in part, by a persistent shortage of medical supplies that has made it difficult and dangerous for healthcare workers to care for infected patients. States, health systems, and even individual hospitals are currently competing against one another—sometimes at auction—to obtain personal protective equipment (PPE). This “Wild West” scenario has resulted in bizarre stories involving attempts to obtain PPE. One health system recently described a James Bond–like pursuit of essential PPE, complete with a covert trip to an industrial warehouse, trucks filled with masks but labeled as food delivery vehicles, and an intervention by a United States congressman.1 Many states have experienced analogous, but still atypical, stories: masks flown in from China using the private jet of a professional sports team owner,2 widespread use of novel sterilization modalities to allow PPE reuse,3 and one attempt to purchase price-gouged PPE from the host of the show “Shark Tank.”4 In some cases, hospitals and healthcare workers have pleaded for PPE on fundraising and social media sites.5
These profound deviations from operations of contemporary health system supply chains would have seemed beyond belief just a few months ago. Instead, they now echo the collective experiences of healthcare stakeholders trying to obtain PPE to protect their frontline healthcare workers during the COVID-19 pandemic.
HEALTHCARE MARKETS DURING A PANDEMIC
How did we get into this situation? The manufacture of medical supplies like gowns and masks is a highly competitive business with very slim margins, and as a result, medical equipment manufacturers aim to match their supply with the market’s demand, with hospitals and health systems using just-in-time ordering to limit excess inventory.6 While this approach adds efficiency and reduces costs, it also renders manufacturers and customers vulnerable to supply disruptions and shortages when need surges. The COVID-19 pandemic represents perhaps the most extreme example of a massive, widespread surge in demand that occurred multifocally and in a highly compressed time frame. Unlike other industries (eg, consumer paper products), however, in which demand exceeding supply causes inconvenience, the lack of PPE has led to critical public health consequences, with lives of both healthcare workers and vulnerable patients lost because of these shortages of medical equipment.
THE SPECIAL CASE OF PPE
There are many reasons for the PPE crisis. As noted above, manufacturers have prioritized efficiency over the ability to quickly increase production. They adhere to just-in-time ordering rather than planning for a surge in demand with extra production capacity, all to avoid having warehouses filled with unsold products if surges never occur. This strategy, compounded by the fact that most PPE in the United States is imported from areas in Asia that were profoundly affected early on by COVID-19, led to the observed widespread shortages. When PPE became unavailable from usual suppliers, hospitals were unable to locate other sources of existing PPE because of a lack of transparency about where PPE could be found and how it could be obtained. The Food and Drug Administration and other federal regulatory agencies maintained strict regulations around PPE production and, despite the crisis, made few exceptions.7 The FDA did grant a few Emergency Use Authorizations (EUAs) for certain improvised, decontaminated, or alternative respirators (eg, the Chinese-made KN95), but it has only very infrequently issued EUAs to allow domestic manufacturers to ramp up production.8 These failures were accompanied by an serious increase in PPE use, leading to spikes in price, price gouging, and hoarding,9 problems that were further magnified as health systems and hospitals were forced to compete with nonhealthcare businesses for PPE.
LACK OF FEDERAL GOVERNMENT RESPONSE
The Defense Production Act (DPA) gives the federal government the power to increase production of goods needed during a crisis8 to offer purchasing guarantees, coordinate federal agencies, and regulate distribution and pricing. However, the current administration’s failure to mount a coordinated federal response has contributed to the observed market instability, medical supply shortages, and public health crisis we face. We have previously recommended that the federal government use the power of the DPA to reduce manufacturers’ risk of being uncompensated for excess supply, support temporary reductions in regulatory barriers, and create mandatory centralized reporting of PPE supply, including completed PPE and its components.10 We stand by these recommendations but also acknowledge that hospitals and health systems may be simultaneously considering how to best prepare for future crises and even surges in demand over the next 18 months as the COVID-19 pandemic continues.
RECOMMENDATIONS FOR HEALTH SYSTEMS AND HOSPITALS
1. Encourage mandates at the hospital, health system, and state level regarding minimum inventory levels for essential equipment. Stockpiles are essential for emergency preparedness. In the long term, these sorts of stockpiles are economically infeasible without government help to maintain them. In the near term, however, it is sensible that hospitals and health systems would maintain a minimum of 2 weeks’ worth of PPE to prepare for expected regional spikes in COVID-19 cases. However, a soon-to-published study suggests that over 40% of hospitals had a PPE stockpile of less than 2 weeks.11 Although this survey was conducted at the height of the shortage, it suggests that there is opportunity for improvement.
2. Coordinate efforts among states and health systems to collect and report inventory, regionalize resources, and coordinate their distribution. The best example of this is the seven-state purchasing consortium announced by New York Governor Andrew Cuomo in early May.12 Unfortunately, since the announcement, there have been few details about whether the states were successful in their effort to reduce prices or to obtain PPE in bulk. Still, hospitals and health systems could join or emulate purchasing collaboratives to allow resources to be better allocated according to need. There are barriers to such collaboratives because the market is currently set up to encourage competition among health systems and hospitals. During the pandemic, however, cooperation has increasingly been favored over competition in science and healthcare delivery. There are also existing hospital purchasing collaboratives (eg, Premier, Inc13), which have taken steps to vet suppliers and improve access to PPE, but it is not clear how successful these efforts have been to date.
3. Advocate for strong federal leadership, including support for increased domestic manufacturing; replenishment and maintenance of state and health system stockpiles of PPE, ventilators, and medications; and development of a centrally coordinated PPE allocation and distribution process. While hospitals and health systems may favor remaining as apolitical as possible, the need for a federal response to stabilize the PPE market may be too urgent and necessary to ignore.
CONCLUSION
As hospitals and health systems prepare for continued surges in COVID-19 cases, they face challenges in providing PPE for frontline clinicians and staff. A federal plan to enhance nimbleness in responding to multifocal, geographic outbreaks and ensure awareness regarding inventory would improve our chances to successfully navigate the next pandemic and optimize the protection of our health workers, patients, and public health. In the absence of such a plan, hospitals should maintain a minimum of 2 weeks’ worth of PPE to prepare for expected regional spikes in COVID-19 cases and should continue to attempt to coordinate efforts among states and health systems to collect and report inventory, regionalize resources, and coordinate their distribution.
1. Artenstein AW. In pursuit of PPE. N Engl J Med. 2020;382(18):e46. https://doi.org/10.1056/nejmc2010025
2. McGrane V, Ellement JR. A Patriots plane full of 1 million N95 masks from China arrived Thursday. Here’s how the plan came together. Boston Globe. Updated April 2, 2020. Accessed April 27, 2020. https://www.bostonglobe.com/2020/04/02/nation/kraft-family-used-patriots-team-plane-shuttle-protective-masks-china-boston-wsj-reports/
3. Kolodny L. California plans to decontaminate 80,000 masks a day for health workers amid the COVID-19 pandemic. CNBC. April 8, 2020. Updated April 9, 2020. Accessed April 27, 2020. https://www.cnbc.com/2020/04/08/california-plans-to-sanitize-80000-n95-masks-a-day-for-health-workers.html
4. Levenson M. Company questions deal by ‘Shark Tank’ star to sell N95 masks to Florida. New York Times. April 22, 2020. Accessed May 20, 2020. https://www.nytimes.com/2020/04/22/us/daymond-john-n95-masks-florida-3m.html
5. Padilla M. ‘It feels like a war zone’: doctors and nurses plead for masks on social media. New York Times. March 19, 2020. Updated March 22, 2020. Accessed April 27, 2020. https://www.nytimes.com/2020/03/19/us/hospitals-coronavirus-ppe-shortage.html
6. Lee HL, Billington C. Managing supply chain inventory: pitfalls and opportunities. MIT Sloan Management Review. April 15, 1992. Accessed April 27, 2020. https://sloanreview.mit.edu/article/managing-supply-chain-inventory-pitfalls-and-opportunities/
7. Emergency Situations (Medical Devices): Emergency Use Authorizations. Food and Drug Administration. Accessed May 10, 2020. https://www.fda.gov/medical-devices/emergency-situations-medical-devices/emergency-use-authorizations
8. Watney C, Stapp A. Masks for All: Using Purchase Guarantees and Targeted Deregulation to Boost Production of Essential Medical Equipment. Mercatus Center: George Mason University. April 8, 2020. Accessed June 23, 2020. https://www.mercatus.org/publications/covid-19-crisis-response/masks-all-using-purchase-guarantees-and-targeted-deregulation
9. Volkov M. DOJ hoarding and price gouging task force seizes critical medical supplies and distributes to New York and New Jersey hospitals. Corruption, Crime & Compliance blog. April 2, 2020. Accessed April 27, 2020. https://blog.volkovlaw.com/2020/04/doj-hoarding-and-price-gouging-task-force-seizes-critical-medical-supplies-and-distributes-to-new-york-and-new-jersey-hospitals/
10. Lagu T, Werner R, Artenstein AW. Why don’t hospitals have enough masks? Because coronavirus broke the market. Washington Post. May 21, 2020. Accessed May 25, 2020. https://www.washingtonpost.com/outlook/2020/05/21/why-dont-hospitals-have-enough-masks-because-coronavirus-broke-market/
11. Auerbach A, O’Leary KJ, Harrison JD, et al. Hospital ward adaptation during the COVID-19 Pandemic: a national survey of academic medical centers. J Hosp Med. 2020;15:483-488.
12. Voytko L. NY will team up with 6 states to buy medical supplies, Cuomo says. Forbes. May 3, 2020. Accessed May 26, 2020. https://www.forbes.com/sites/lisettevoytko/2020/05/03/ny-will-team-up-with-6-states-to-buy-medical-supplies-cuomo-says/
13. Premier. Supply Chain Solutions. Accessed May 26, 2020. https://www.premierinc.com/solutions/supply-chain
The story of the coronavirus disease 2019 (COVID-19) pandemic in the United States has been defined, in part, by a persistent shortage of medical supplies that has made it difficult and dangerous for healthcare workers to care for infected patients. States, health systems, and even individual hospitals are currently competing against one another—sometimes at auction—to obtain personal protective equipment (PPE). This “Wild West” scenario has resulted in bizarre stories involving attempts to obtain PPE. One health system recently described a James Bond–like pursuit of essential PPE, complete with a covert trip to an industrial warehouse, trucks filled with masks but labeled as food delivery vehicles, and an intervention by a United States congressman.1 Many states have experienced analogous, but still atypical, stories: masks flown in from China using the private jet of a professional sports team owner,2 widespread use of novel sterilization modalities to allow PPE reuse,3 and one attempt to purchase price-gouged PPE from the host of the show “Shark Tank.”4 In some cases, hospitals and healthcare workers have pleaded for PPE on fundraising and social media sites.5
These profound deviations from operations of contemporary health system supply chains would have seemed beyond belief just a few months ago. Instead, they now echo the collective experiences of healthcare stakeholders trying to obtain PPE to protect their frontline healthcare workers during the COVID-19 pandemic.
HEALTHCARE MARKETS DURING A PANDEMIC
How did we get into this situation? The manufacture of medical supplies like gowns and masks is a highly competitive business with very slim margins, and as a result, medical equipment manufacturers aim to match their supply with the market’s demand, with hospitals and health systems using just-in-time ordering to limit excess inventory.6 While this approach adds efficiency and reduces costs, it also renders manufacturers and customers vulnerable to supply disruptions and shortages when need surges. The COVID-19 pandemic represents perhaps the most extreme example of a massive, widespread surge in demand that occurred multifocally and in a highly compressed time frame. Unlike other industries (eg, consumer paper products), however, in which demand exceeding supply causes inconvenience, the lack of PPE has led to critical public health consequences, with lives of both healthcare workers and vulnerable patients lost because of these shortages of medical equipment.
THE SPECIAL CASE OF PPE
There are many reasons for the PPE crisis. As noted above, manufacturers have prioritized efficiency over the ability to quickly increase production. They adhere to just-in-time ordering rather than planning for a surge in demand with extra production capacity, all to avoid having warehouses filled with unsold products if surges never occur. This strategy, compounded by the fact that most PPE in the United States is imported from areas in Asia that were profoundly affected early on by COVID-19, led to the observed widespread shortages. When PPE became unavailable from usual suppliers, hospitals were unable to locate other sources of existing PPE because of a lack of transparency about where PPE could be found and how it could be obtained. The Food and Drug Administration and other federal regulatory agencies maintained strict regulations around PPE production and, despite the crisis, made few exceptions.7 The FDA did grant a few Emergency Use Authorizations (EUAs) for certain improvised, decontaminated, or alternative respirators (eg, the Chinese-made KN95), but it has only very infrequently issued EUAs to allow domestic manufacturers to ramp up production.8 These failures were accompanied by an serious increase in PPE use, leading to spikes in price, price gouging, and hoarding,9 problems that were further magnified as health systems and hospitals were forced to compete with nonhealthcare businesses for PPE.
LACK OF FEDERAL GOVERNMENT RESPONSE
The Defense Production Act (DPA) gives the federal government the power to increase production of goods needed during a crisis8 to offer purchasing guarantees, coordinate federal agencies, and regulate distribution and pricing. However, the current administration’s failure to mount a coordinated federal response has contributed to the observed market instability, medical supply shortages, and public health crisis we face. We have previously recommended that the federal government use the power of the DPA to reduce manufacturers’ risk of being uncompensated for excess supply, support temporary reductions in regulatory barriers, and create mandatory centralized reporting of PPE supply, including completed PPE and its components.10 We stand by these recommendations but also acknowledge that hospitals and health systems may be simultaneously considering how to best prepare for future crises and even surges in demand over the next 18 months as the COVID-19 pandemic continues.
RECOMMENDATIONS FOR HEALTH SYSTEMS AND HOSPITALS
1. Encourage mandates at the hospital, health system, and state level regarding minimum inventory levels for essential equipment. Stockpiles are essential for emergency preparedness. In the long term, these sorts of stockpiles are economically infeasible without government help to maintain them. In the near term, however, it is sensible that hospitals and health systems would maintain a minimum of 2 weeks’ worth of PPE to prepare for expected regional spikes in COVID-19 cases. However, a soon-to-published study suggests that over 40% of hospitals had a PPE stockpile of less than 2 weeks.11 Although this survey was conducted at the height of the shortage, it suggests that there is opportunity for improvement.
2. Coordinate efforts among states and health systems to collect and report inventory, regionalize resources, and coordinate their distribution. The best example of this is the seven-state purchasing consortium announced by New York Governor Andrew Cuomo in early May.12 Unfortunately, since the announcement, there have been few details about whether the states were successful in their effort to reduce prices or to obtain PPE in bulk. Still, hospitals and health systems could join or emulate purchasing collaboratives to allow resources to be better allocated according to need. There are barriers to such collaboratives because the market is currently set up to encourage competition among health systems and hospitals. During the pandemic, however, cooperation has increasingly been favored over competition in science and healthcare delivery. There are also existing hospital purchasing collaboratives (eg, Premier, Inc13), which have taken steps to vet suppliers and improve access to PPE, but it is not clear how successful these efforts have been to date.
3. Advocate for strong federal leadership, including support for increased domestic manufacturing; replenishment and maintenance of state and health system stockpiles of PPE, ventilators, and medications; and development of a centrally coordinated PPE allocation and distribution process. While hospitals and health systems may favor remaining as apolitical as possible, the need for a federal response to stabilize the PPE market may be too urgent and necessary to ignore.
CONCLUSION
As hospitals and health systems prepare for continued surges in COVID-19 cases, they face challenges in providing PPE for frontline clinicians and staff. A federal plan to enhance nimbleness in responding to multifocal, geographic outbreaks and ensure awareness regarding inventory would improve our chances to successfully navigate the next pandemic and optimize the protection of our health workers, patients, and public health. In the absence of such a plan, hospitals should maintain a minimum of 2 weeks’ worth of PPE to prepare for expected regional spikes in COVID-19 cases and should continue to attempt to coordinate efforts among states and health systems to collect and report inventory, regionalize resources, and coordinate their distribution.
1. Artenstein AW. In pursuit of PPE. N Engl J Med. 2020;382(18):e46. https://doi.org/10.1056/nejmc2010025
2. McGrane V, Ellement JR. A Patriots plane full of 1 million N95 masks from China arrived Thursday. Here’s how the plan came together. Boston Globe. Updated April 2, 2020. Accessed April 27, 2020. https://www.bostonglobe.com/2020/04/02/nation/kraft-family-used-patriots-team-plane-shuttle-protective-masks-china-boston-wsj-reports/
3. Kolodny L. California plans to decontaminate 80,000 masks a day for health workers amid the COVID-19 pandemic. CNBC. April 8, 2020. Updated April 9, 2020. Accessed April 27, 2020. https://www.cnbc.com/2020/04/08/california-plans-to-sanitize-80000-n95-masks-a-day-for-health-workers.html
4. Levenson M. Company questions deal by ‘Shark Tank’ star to sell N95 masks to Florida. New York Times. April 22, 2020. Accessed May 20, 2020. https://www.nytimes.com/2020/04/22/us/daymond-john-n95-masks-florida-3m.html
5. Padilla M. ‘It feels like a war zone’: doctors and nurses plead for masks on social media. New York Times. March 19, 2020. Updated March 22, 2020. Accessed April 27, 2020. https://www.nytimes.com/2020/03/19/us/hospitals-coronavirus-ppe-shortage.html
6. Lee HL, Billington C. Managing supply chain inventory: pitfalls and opportunities. MIT Sloan Management Review. April 15, 1992. Accessed April 27, 2020. https://sloanreview.mit.edu/article/managing-supply-chain-inventory-pitfalls-and-opportunities/
7. Emergency Situations (Medical Devices): Emergency Use Authorizations. Food and Drug Administration. Accessed May 10, 2020. https://www.fda.gov/medical-devices/emergency-situations-medical-devices/emergency-use-authorizations
8. Watney C, Stapp A. Masks for All: Using Purchase Guarantees and Targeted Deregulation to Boost Production of Essential Medical Equipment. Mercatus Center: George Mason University. April 8, 2020. Accessed June 23, 2020. https://www.mercatus.org/publications/covid-19-crisis-response/masks-all-using-purchase-guarantees-and-targeted-deregulation
9. Volkov M. DOJ hoarding and price gouging task force seizes critical medical supplies and distributes to New York and New Jersey hospitals. Corruption, Crime & Compliance blog. April 2, 2020. Accessed April 27, 2020. https://blog.volkovlaw.com/2020/04/doj-hoarding-and-price-gouging-task-force-seizes-critical-medical-supplies-and-distributes-to-new-york-and-new-jersey-hospitals/
10. Lagu T, Werner R, Artenstein AW. Why don’t hospitals have enough masks? Because coronavirus broke the market. Washington Post. May 21, 2020. Accessed May 25, 2020. https://www.washingtonpost.com/outlook/2020/05/21/why-dont-hospitals-have-enough-masks-because-coronavirus-broke-market/
11. Auerbach A, O’Leary KJ, Harrison JD, et al. Hospital ward adaptation during the COVID-19 Pandemic: a national survey of academic medical centers. J Hosp Med. 2020;15:483-488.
12. Voytko L. NY will team up with 6 states to buy medical supplies, Cuomo says. Forbes. May 3, 2020. Accessed May 26, 2020. https://www.forbes.com/sites/lisettevoytko/2020/05/03/ny-will-team-up-with-6-states-to-buy-medical-supplies-cuomo-says/
13. Premier. Supply Chain Solutions. Accessed May 26, 2020. https://www.premierinc.com/solutions/supply-chain
© 2020 Society of Hospital Medicine
The Importance of Compassion as the Default in Times of Crisis: The Curious Case of “Vertical Interdiction”
Each night, while my 2-year-old is having her dinner of macaroni and cheese or chicken nuggets, we video chat with my elderly parents. It used to be that this time was mainly my daughter showing off her newfound fork skills, but lately it has become “elderly parent education hour.”
“Well, we’re trying to decide if we should go to the bridge club,” announced my mother early in the week of March 13th.
“No, mom! Under no circumstances should you go to the bridge club! Social distance! Stay home! If I’ve given up restaurants and babysitters and am sitting here every night holding a phone covered in mac and cheese grease, you can give up the bridge club!”
I am all for keeping my elderly parents as isolated as possible during these pandemic times. I wasn’t alone in my fear that they weren’t taking my advice seriously: My social media feed was subsequently filled with posts from other physicians who had also been educating their parents about the need for social distancing.
ECONOMIC FEARS AND POLICY PROPOSALS
Then, just as we were all settling into “social distancing,” on March 20, a debate emerged on the opinion pages of The New York Times that took the argument to the next level: A former professor of mine suggested a move from a policy of “horizontal interdiction” (one that restricts the movement of the entire population, without taking risk into consideration) to a “vertical interdiction” strategy that focuses on sequestering those among us most likely to experience poor outcomes from coronavirus infection (eg, the elderly, people with chronic diseases, and the immunologically compromised).1
This first piece was followed 2 days later on March 22 by an article from a regular New York Times contributor who called social distancing “groupthink” and then seconded the vertical interdiction proposal.2 Both pieces referred to the downturn in the economy as the reason the policy would be an improvement on social distancing; they argued that lost jobs and services would cause less suffering and loss than a policy that required extended isolation of the elderly.
NOT A FEASIBLE OPTION
On closer inspection, however, vertical interdiction is different and much scarier than “social distancing.” The words used by the author of the original article gave a clue: “If we were to focus on the especially vulnerable, there would be resources to keep them at home, provide them with needed services and coronavirus testing, and direct our medical system to their early care. I would favor proactive rather than reactive testing.” This was not just a plan to keep my parents from the bridge club. This was a plan for forced quarantine, mandatory testing, and months of isolation. Almost immediately, physicians and policy makers identified feasibility problems with the idea.3 To name a few, it is not clear that the death rate in young people is all that low; even with removing elders from the equation, the demand for hospital and critical care services is rapidly overwhelming supply; testing the “herd immunity” hypothesis in real time with a virus that has a death rate of 1%-3% still runs the risk of causing millions of deaths.
I will add a few more reasons why this idea of vertical interdiction was never feasible: There is no existing structure to facilitate mandatory isolation and quarantine of elders. We have no mechanism for caring for elders who are isolated at home. We cannot rapidly design the digital health monitoring needed. We cannot provide the mobile testing proposed. In the case of seniors who require nursing care, the problems would be even greater. Our recent efforts to protect patients in nursing facilities have proven to be extremely difficult. The greatest problem is finding a way to keep the staff from bringing the virus into the facility (and there are many staff: nutrition services, nursing, patient care technicians, physical therapy, social work). The only possible answer to this issue might mean wearing extensive protective equipment, similar to physicians in Wuhan4 (full-head hood plus goggles). Imagine being a patient in this scenario: months of being bathed, dressed, fed, and helped to the bathroom by a person in an isolation suit.
A CRITICAL NEED TO MAINTAIN A DEFAULT OF COMPASSION
Now, just a few weeks later, with the virus spreading and many nonelders on ventilators, the idea of “elderly sequestration” as it was presented in mid-March feels dated and irrelevant. However, the episode can and should teach us a more important lesson: The idea was fatally flawed not only because it was not feasible but primarily because it was so lacking in compassion.
The lack of compassion was not just related to the fact that patients with end-stage dementia will undoubtedly be confused and frightened when confronted with months of care administered by people in hazmat suits. It is also that the proposed policy, by creating pockets of isolation, felt like a setup for missteps and subsequent rampant infection. My first thought was that these policies would not protect vulnerable elders but hide them from view, causing another situation like the one at Lifecare in Kirkland, Washington, which resulted in more than 35 deaths.5 This time, our policies (and not just our carelessness) would be responsible for creating it.
While writing this article, sadly, such a thing has happened, just miles from my home. The Soldiers Home in Holyoke, Massachusetts, is a skilled nursing facility that has generally been very highly regarded by veterans and their families. Unfortunately, a lack of responsiveness to the current pandemic, including failure to provide protective equipment, failure to remove symptomatic staff from frontline care, and a lack of transparency about symptomatic staff and patients has resulted in a scandal and a tragedy.6 Over 5 days at the end of March, eight veterans died of coronavirus without patients being sent to hospitals and without the cases being reported to either Massachusetts or local officials. Many other patients in the facility also tested positive for coronavirus, as did staff members. While this incident was not driven by a vertical interdiction policy, it was the result of actions taken to isolate and sequester elders from the community. The worst (and most symbolic) injustice was the fact that, because of rules about disposing of bodies with coronavirus (and possibly to cover up the incompetence that led to the deaths), the bodies of deceased veterans were piled into a refrigeration truck sitting in the parking lot of the facility as the tragedy unfolded.
This is a defining moment for physicians, for the healthcare system, and for our society. I am so proud of my colleagues who have stepped up, shown up, worn their (sometimes improvised) personal protective equipment and kept seeing patients because it is our job and it is part of the contract we entered into when we became physicians. Our policy choices in this moment are just as important, and it is not our ability to “get the economy started again” but our sacrifices now (or lack thereof) that will be remembered for a hundred years. Choosing patients over profit, compassion over callousness, are important not just for controlling hospital volumes and reserving intensive care unit beds, but also for preserving our professional integrity and saving our humanity.
1. Katz DL. Is our fight against coronavirus worse than the disease? New York Times. March 20, 2020. https://www.nytimes.com/2020/03/20/opinion/coronavirus-pandemic-social-distancing.html. Accessed April 3, 2020.
2. Friedman TL. A plan to get America back to work. New York Times. March 22, 2020. https://www.nytimes.com/2020/03/22/opinion/coronavirus-economy.html. Accessed April 3, 2020.
3. Apkon M, Forman HP, Sonnenfeld J. Why isolating older Americans would be a huge mistake in fighting the coronavirus. Fortune. March 24, 2020. https://fortune.com/2020/03/24/coronavirus-curve-herd-immunity-deaths/?fbclid=IwAR0K3_40MDmwrP4djtqkcAZBXFaJViIv1_2GGgZBQ269oLcTkJmptuR5G0Q. Accessed April 3, 2020
4. Gawande A. Keeping the coronavirus from infecting health-care workers. New Yorker. March 21, 2020. https://www.newyorker.com/news/news-desk/keeping-the-coronavirus-from-infecting-health-care-workers. Accessed April 3, 2020.5. Read R. Nursing home staff spread coronavirus to other facilities, CDC investigation finds. Los Angeles Times. March 18, 2020. https://www.latimes.com/world-nation/story/2020-03-18/coronavirus-spread-nursing-homes. Accessed April 3, 2020.
6. Christensen D. ‘Just complete chaos’: Soldiers’ Home staff cite dangerous conditions fueling COVID-19 outbreak. Daily Hampshire Gazette. March 31, 2020. https://www.gazettenet.com/Employees-allege-lax-COVID-19-safety-protocols-at-Holyoke-Soldiers-Home-33631412. Accessed April 3, 2020.
Each night, while my 2-year-old is having her dinner of macaroni and cheese or chicken nuggets, we video chat with my elderly parents. It used to be that this time was mainly my daughter showing off her newfound fork skills, but lately it has become “elderly parent education hour.”
“Well, we’re trying to decide if we should go to the bridge club,” announced my mother early in the week of March 13th.
“No, mom! Under no circumstances should you go to the bridge club! Social distance! Stay home! If I’ve given up restaurants and babysitters and am sitting here every night holding a phone covered in mac and cheese grease, you can give up the bridge club!”
I am all for keeping my elderly parents as isolated as possible during these pandemic times. I wasn’t alone in my fear that they weren’t taking my advice seriously: My social media feed was subsequently filled with posts from other physicians who had also been educating their parents about the need for social distancing.
ECONOMIC FEARS AND POLICY PROPOSALS
Then, just as we were all settling into “social distancing,” on March 20, a debate emerged on the opinion pages of The New York Times that took the argument to the next level: A former professor of mine suggested a move from a policy of “horizontal interdiction” (one that restricts the movement of the entire population, without taking risk into consideration) to a “vertical interdiction” strategy that focuses on sequestering those among us most likely to experience poor outcomes from coronavirus infection (eg, the elderly, people with chronic diseases, and the immunologically compromised).1
This first piece was followed 2 days later on March 22 by an article from a regular New York Times contributor who called social distancing “groupthink” and then seconded the vertical interdiction proposal.2 Both pieces referred to the downturn in the economy as the reason the policy would be an improvement on social distancing; they argued that lost jobs and services would cause less suffering and loss than a policy that required extended isolation of the elderly.
NOT A FEASIBLE OPTION
On closer inspection, however, vertical interdiction is different and much scarier than “social distancing.” The words used by the author of the original article gave a clue: “If we were to focus on the especially vulnerable, there would be resources to keep them at home, provide them with needed services and coronavirus testing, and direct our medical system to their early care. I would favor proactive rather than reactive testing.” This was not just a plan to keep my parents from the bridge club. This was a plan for forced quarantine, mandatory testing, and months of isolation. Almost immediately, physicians and policy makers identified feasibility problems with the idea.3 To name a few, it is not clear that the death rate in young people is all that low; even with removing elders from the equation, the demand for hospital and critical care services is rapidly overwhelming supply; testing the “herd immunity” hypothesis in real time with a virus that has a death rate of 1%-3% still runs the risk of causing millions of deaths.
I will add a few more reasons why this idea of vertical interdiction was never feasible: There is no existing structure to facilitate mandatory isolation and quarantine of elders. We have no mechanism for caring for elders who are isolated at home. We cannot rapidly design the digital health monitoring needed. We cannot provide the mobile testing proposed. In the case of seniors who require nursing care, the problems would be even greater. Our recent efforts to protect patients in nursing facilities have proven to be extremely difficult. The greatest problem is finding a way to keep the staff from bringing the virus into the facility (and there are many staff: nutrition services, nursing, patient care technicians, physical therapy, social work). The only possible answer to this issue might mean wearing extensive protective equipment, similar to physicians in Wuhan4 (full-head hood plus goggles). Imagine being a patient in this scenario: months of being bathed, dressed, fed, and helped to the bathroom by a person in an isolation suit.
A CRITICAL NEED TO MAINTAIN A DEFAULT OF COMPASSION
Now, just a few weeks later, with the virus spreading and many nonelders on ventilators, the idea of “elderly sequestration” as it was presented in mid-March feels dated and irrelevant. However, the episode can and should teach us a more important lesson: The idea was fatally flawed not only because it was not feasible but primarily because it was so lacking in compassion.
The lack of compassion was not just related to the fact that patients with end-stage dementia will undoubtedly be confused and frightened when confronted with months of care administered by people in hazmat suits. It is also that the proposed policy, by creating pockets of isolation, felt like a setup for missteps and subsequent rampant infection. My first thought was that these policies would not protect vulnerable elders but hide them from view, causing another situation like the one at Lifecare in Kirkland, Washington, which resulted in more than 35 deaths.5 This time, our policies (and not just our carelessness) would be responsible for creating it.
While writing this article, sadly, such a thing has happened, just miles from my home. The Soldiers Home in Holyoke, Massachusetts, is a skilled nursing facility that has generally been very highly regarded by veterans and their families. Unfortunately, a lack of responsiveness to the current pandemic, including failure to provide protective equipment, failure to remove symptomatic staff from frontline care, and a lack of transparency about symptomatic staff and patients has resulted in a scandal and a tragedy.6 Over 5 days at the end of March, eight veterans died of coronavirus without patients being sent to hospitals and without the cases being reported to either Massachusetts or local officials. Many other patients in the facility also tested positive for coronavirus, as did staff members. While this incident was not driven by a vertical interdiction policy, it was the result of actions taken to isolate and sequester elders from the community. The worst (and most symbolic) injustice was the fact that, because of rules about disposing of bodies with coronavirus (and possibly to cover up the incompetence that led to the deaths), the bodies of deceased veterans were piled into a refrigeration truck sitting in the parking lot of the facility as the tragedy unfolded.
This is a defining moment for physicians, for the healthcare system, and for our society. I am so proud of my colleagues who have stepped up, shown up, worn their (sometimes improvised) personal protective equipment and kept seeing patients because it is our job and it is part of the contract we entered into when we became physicians. Our policy choices in this moment are just as important, and it is not our ability to “get the economy started again” but our sacrifices now (or lack thereof) that will be remembered for a hundred years. Choosing patients over profit, compassion over callousness, are important not just for controlling hospital volumes and reserving intensive care unit beds, but also for preserving our professional integrity and saving our humanity.
1. Katz DL. Is our fight against coronavirus worse than the disease? New York Times. March 20, 2020. https://www.nytimes.com/2020/03/20/opinion/coronavirus-pandemic-social-distancing.html. Accessed April 3, 2020.
2. Friedman TL. A plan to get America back to work. New York Times. March 22, 2020. https://www.nytimes.com/2020/03/22/opinion/coronavirus-economy.html. Accessed April 3, 2020.
3. Apkon M, Forman HP, Sonnenfeld J. Why isolating older Americans would be a huge mistake in fighting the coronavirus. Fortune. March 24, 2020. https://fortune.com/2020/03/24/coronavirus-curve-herd-immunity-deaths/?fbclid=IwAR0K3_40MDmwrP4djtqkcAZBXFaJViIv1_2GGgZBQ269oLcTkJmptuR5G0Q. Accessed April 3, 2020
4. Gawande A. Keeping the coronavirus from infecting health-care workers. New Yorker. March 21, 2020. https://www.newyorker.com/news/news-desk/keeping-the-coronavirus-from-infecting-health-care-workers. Accessed April 3, 2020.5. Read R. Nursing home staff spread coronavirus to other facilities, CDC investigation finds. Los Angeles Times. March 18, 2020. https://www.latimes.com/world-nation/story/2020-03-18/coronavirus-spread-nursing-homes. Accessed April 3, 2020.
6. Christensen D. ‘Just complete chaos’: Soldiers’ Home staff cite dangerous conditions fueling COVID-19 outbreak. Daily Hampshire Gazette. March 31, 2020. https://www.gazettenet.com/Employees-allege-lax-COVID-19-safety-protocols-at-Holyoke-Soldiers-Home-33631412. Accessed April 3, 2020.
© 2020 Society of Hospital Medicine
Utility of ICD Codes for Stress Cardiomyopathy in Hospital Administrative Databases: What Do They Signify?
Stress cardiomyopathy (SCM), also known as takotsubo cardiomyopathy, is a nonischemic cardiomyopathy initially identified in Japan in 1990. In 2006, SCM gained an International Classification of Diseases code at the 9th Clinical Modification (ICD-9 CM). Subsequently, several epidemiological studies have used ICD codes to evaluate trends in the diagnosis of SCM;1-8 however, to our knowledge, no previous studies have validated ICD-9 or -10 codes using chart review. We aimed to determine the positive predictive value (PPV) and the limitations of these ICD codes among hospitalized patients.
METHODS
We performed a retrospective cohort study at a single tertiary care center, identifying all adults aged ≥18 years from 2010 to 2016 who were hospitalized with a first known diagnosis of SCM in our Electronic Health Records (EHR) system (Cerner, Stoltenberg Consulting, Inc., Bethel Park, Pennsylvania), which includes both inpatient and outpatient records. We included patients hospitalized with a principal or secondary ICD-9 discharge diagnosis code of 429.83 (for those hospitalized before October 2015) or an ICD-10 discharge diagnosis code of I51.81 (for those hospitalized from October 1, 2015 through December 2016). We excluded hospital readmissions and patients with recurrent SCM, but we could not administratively remove patients who carried a prior diagnosis of SCM made previously at other institutions. One investigator (KW) then reviewed our EHR for a documentation of SCM anywhere in the chart by performing a systematic review of discharge, admission, consultation, daily progress notes, as well as biomarkers, electrocardiograms, echocardiograms, and coronary angiograms. If the first reviewer did not find documentation of SCM anywhere in the EHR, this finding was confirmed by a second chart review by a cardiologist (QP).
Principal and secondary discharge diagnoses were entered into our administrative database by hospital coders using standard coding practices. Because ICD codes also record comorbidities that were present prior to admission, we determined whether each patient had a new diagnosis of SCM during the hospitalization. If not, we considered their ICD code as a preexisting comorbidity and labeled these as chronic cases.
We recorded age, sex, race, ethnicity, and frequency of echocardiogram and cardiac catheterization among all patients. To determine the burden of other comorbidities, we used the Charlson Comorbidity Index and the Elixhauser Comorbidity Index,9,10 but limited our reporting to comorbidities with >5% prevalence.
Our primary aim was to measure the PPV of these ICD codes to determine a diagnosis of SCM. This was done by dividing the total number of cases with a clinical documentation of SCM by the total number of patients with an ICD diagnosis of SCM. As secondary aims, we noted the percentage of new and chronic SCM, the proportion of patients who underwent echocardiography and/or cardiac catheterization and recorded the annual number of total cases of confirmed SCM from 2010 to 2016. Trends were evaluated using the Cochran-Armitage test. To better understand the difference between patients given a principal and secondary code for SCM, we compared these two groups using summary statistics using t tests and chi-squared tests as appropriate, noted the PPV, and determined the 95% confidence intervals of ICD codes in these subgroups. This study was approved by the institutional review board of Baystate Medical Center (#1109756-4). Statistical analysis was done using JMP version12.0.1 (SAS Institute, Cary, North Carolina, 2015).
RESULTS
During 2010-2016, a total of 592 patients with a first known ICD code in our EHR for SCM were hospitalized, comprising 242 (41.0%) with a principal diagnosis code. Upon chart review, we were unable to confirm a clinical diagnosis of SCM among 12 (2.0%) patients. In addition, 38 (6.4%) were chronic cases of SCM, without evidence of active disease at the time of hospitalization. In general, chronic cases typically carried an SCM diagnosis from a hospitalization at a non-Baystate hospital (outside our EHR), or from an outpatient setting. Occasionally, we also found cases where the diagnosis of SCM was mentioned but testing was not pursued, and the patient had no symptoms that were attributed to SCM. Overall use of echocardiogram and cardiac angiography was 91.5% and 66.8%, respectively, and was lower in chronic than in new cases of SCM.
Compared with patients with a secondary diagnosis code, patients with a principal diagnosis of SCM underwent more cardiac angiography and echocardiography (Table 1). When comparing the difference between those with principal and secondary ICD codes, we found that 237 (98%) vs 305 (87%) were new cases of SCM, respectively, and all 12 patients without any clinical diagnosis of SCM had been given a secondary ICD code. Between 2010 and 2016, we noted a significant increase in the number of cases of SCM (Cochrane–Armitage, P < .0001).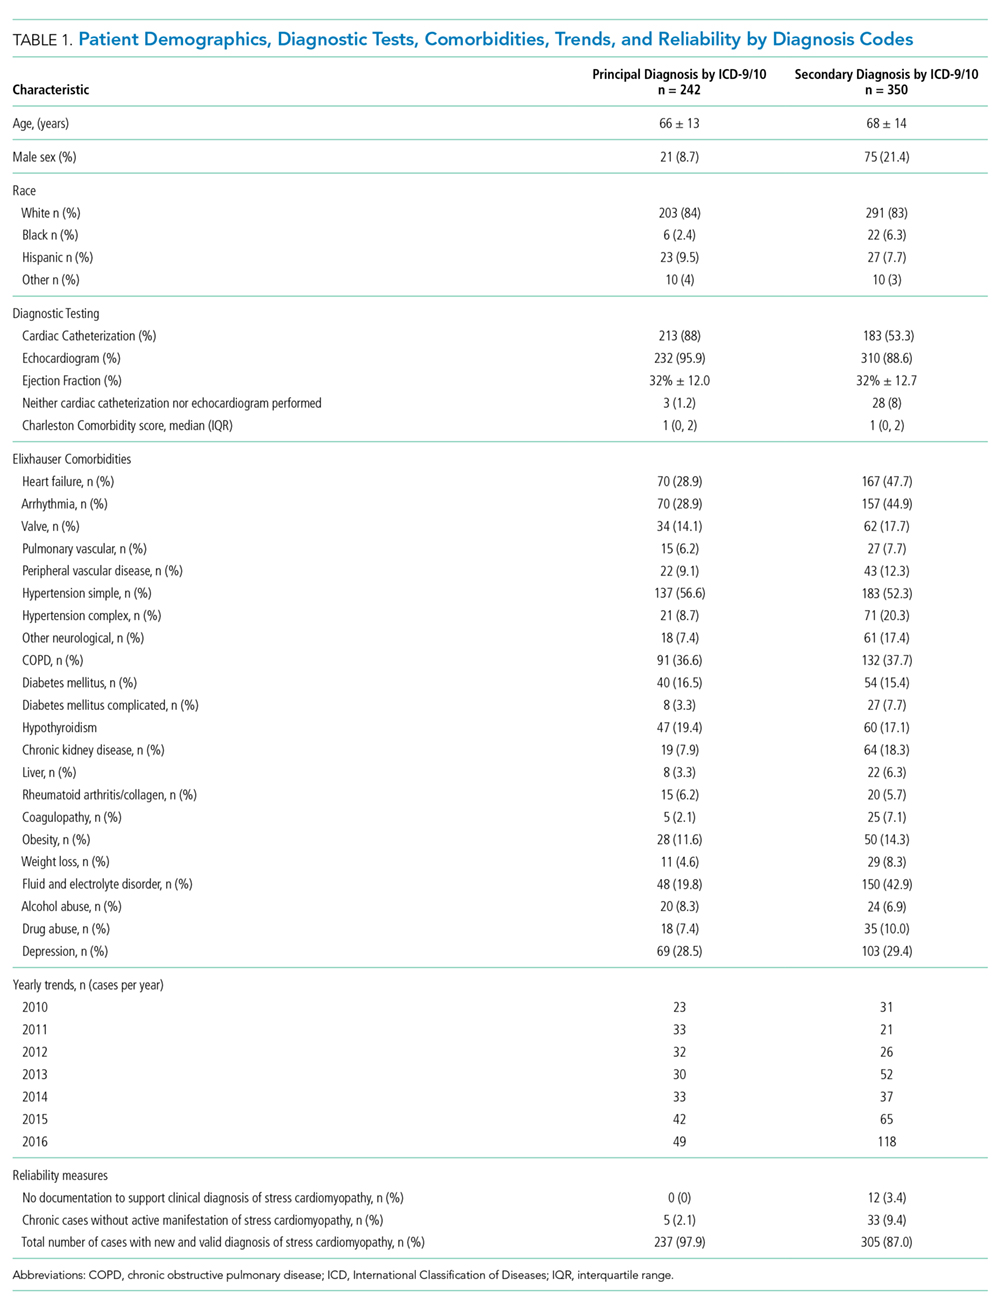
The overall PPV (95% CI) of either principal or secondary ICD codes for any form or presentation of SCM was 98.0% (96.4-98.8) with no difference in PPV between the coding systems (ICD-9, 66% of cases, PPV 98% [96.0-99.0] vs ICD-10, PPV 98% [94.9-99.2; P = .98]). Because all patients without a diagnosis of SCM were given secondary ICD codes, this changed the PPV (95% CI) for principal and secondary SCM to 100% (98.4-100.0) and 96.6% (94.1-98.0), respectively. When chronic cases were included as noncases, the PPV (95% CI) to detect a new case of SCM decreased to 97.9% (95.2-99.1) and 87.1% (83.0-90.2) for principal and secondary SCM, respectively (Table 1).
DISCUSSION
In this study, we found a strong relationship between the receipt of an ICD code for SCM and the clinical documentation of a diagnosis of SCM, with an overall PPV of 98%. The PPV was higher when the sample was limited to those assigned a principal ICD code for SCM, but it was lower when considering that some ICD codes represented chronic SCM from prior hospitalizations, despite our attempts to exclude these cases administratively prior to chart review. Furthermore, cardiac catheterization and echocardiography were used inconsistently and were less frequent among secondary compared with a principal diagnosis of SCM. Thus, although a principal ICD diagnosis code for SCM appears to accurately reflect a diagnosis of SCM, a secondary code for SCM appears less reliable. These findings suggest that future epidemiological studies can rely on principal diagnosis codes for use in research studies, but that they should use caution when including patients with secondary codes for SCM.
Our study makes an important contribution to the literature because it quantitates the reliability of ICD codes to identify patients with SCM. This finding is important because multiple studies have used this code to study trends in the incidence of this disease,1-8 and futures studies will almost certainly continue to do so. Our results also showed similar demographics and trends in the incidence of SCM compared with those of prior studies1-3,11 but additionally revealed that these codes also have some important limitations.
A key factor to remember is that neither a clinical diagnosis nor an ICD code at the time of hospital discharge is based upon formal diagnostic criteria for SCM. Importantly, all currently proposed diagnostic criteria require resolution of typical regional wall motion abnormalities before finalizing a research-grade diagnosis of SCM (Table 2).12,13 However, because the median time to recovery of ejection fraction in SCM is between three and four weeks after hospital discharge (with some recovery extending much longer),6 it is almost impossible to make a research-grade diagnosis of SCM after a three- to four-day hospitalization. Moreover, 33% of our patients did not undergo cardiac catheterization, 8.5% did not undergo echocardiography, and it is our experience that testing for pheochromocytoma and myocarditis is rarely done. Thus, we emphasize that ICD codes for SCM assigned at the time of hospital discharge represent a clinical diagnosis of SCM and not research-grade criteria for this disease. This is a significant limitation of prior epidemiologic studies that consider only the short time frame of hospitalization.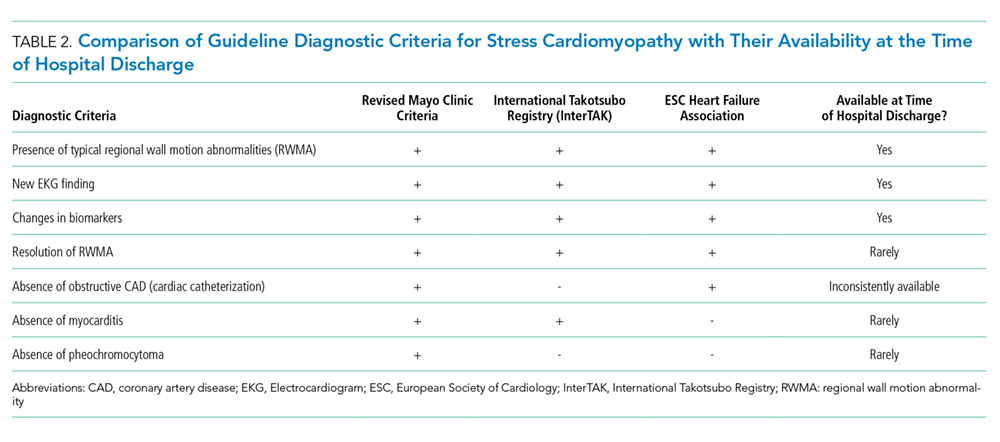
A limitation of our study is that we did not attempt to measure sensitivity, specificity, or the negative predictive value of these codes. This is because measurement of these diagnostic features would require sampling some of our hospital’s 53,000 annual hospital admissions to find cases where SCM was present but not recognized. This did not seem practical, particularly because it might also require directly overreading imaging studies. Moreover, we believe that for the purposes of future epidemiology research, the PPV is the most important feature of these codes because a high PPV indicates that when a principal ICD code is present, it almost always represents a new case of SCM. Other limitations include this being a single-center study; the rates of echocardiograms, cardiac angiography, clinical diagnosis, and coding may differ at other institutions.
In conclusion, we found a high PPV of ICD codes for SCM, particularly among patients with a principal discharge diagnosis of SCM. However, we also found that approximately 8% of cases were either wrongly coded or were chronic cases. Moreover, because of the need to document resolution of wall motion abnormalities, essentially no patients met the research-grade diagnostic criteria at the time of hospital discharge. Although this increases our confidence in the results of past studies, it also provides some caution to researchers who may use these codes in the future.
1. Khera R, Light-McGroary K, Zahr F, Horwitz PA, Girotra S. Trends in hospitalization for takotsubo cardiomyopathy in the United States. Am Heart J. 2016;172:53-63. https://doi.org/10.1016/j.ahj.2015.10.022.
2. Murugiah K, Wang Y, Desai NR, et al. Trends in short- and long-term outcomes for takotsubo cardiomyopathy among medicare fee-for-service beneficiaries, 2007 to 2012. JACC Heart Fail. 2016;4(3):197-205. https://doi.org/10.1016/j.jchf.2015.09.013.
3. Brinjikji W, El-Sayed AM, Salka S. In-hospital mortality among patients with takotsubo cardiomyopathy: a study of the National Inpatient Sample 2008 to 2009. Am Heart J. 2012;164(2):215-221. https://doi.org/10.1016/j.ahj.2012.04.010.
4. Smilowitz NR, Hausvater A, Reynolds HR. Hospital readmission following takotsubo syndrome. Eur Heart J Qual Care Clin Outcomes. 2018;5(2):114-120. https://doi.org/10.1093/ehjqcco/qcy045.
5. Vallabhajosyula S, Deshmukh AJ, Kashani K, Prasad A, Sakhuja A. Tako-Tsubo cardiomyopathy in severe sepsis: nationwide trends, predictors, and outcomes. J Am Heart Assoc. 2018;7(18):e009160. https://doi.org/10.1161/JAHA.118.009160.
6. Shaikh N, Sardar M, Jacob A, et al. Possible predictive factors for recovery of left ventricular systolic function in takotsubo cardiomyopathy. Intractable Rare Dis Res. 2018;7(2):100-105. https://doi.org/10.5582/irdr.2018.01042.
7. Shah M, Ram P, Lo KBU, et al. Etiologies, predictors, and economic impact of readmission within 1 month among patients with takotsubo cardiomyopathy. Clin Cardiol. 2018;41(7):916-923. https://doi.org/10.1002/clc.22974.
8. Misumida N, Ogunbayo GO, Kim SM, Abdel-Latif A, Ziada KM, Sorrell VL. Clinical outcome of takotsubo cardiomyopathy diagnosed with or without coronary angiography. Angiology. 2019;70(1):56-61. https://doi.org/10.1177/0003319718782049.
9. Charlson ME, Pompei P, Ales KL, MacKenzie CR. A new method of classifying prognostic comorbidity in longitudinal studies: development and validation. J Chronic Dis. 1987;40(5):373-383. https://doi.org/10.1016/0021-9681(87)90171-8.
10. Elixhauser A, Steiner C, Harris DR, Coffey RM. Comorbidity measures for use with administrative data. Med Care. 1998;36(1):8-27. https://doi.org/10.1097/00005650-199801000-00004.
11. Templin C, Ghadri JR, Diekmann J, et al. Clinical features and outcomes of takotsubo (stress) cardiomyopathy. N Engl J Med. Sep 3 2015;373(10):929-938. https://doi.org/10.1056/NEJMoa1406761.
12. Medina de Chazal H, Del Buono MG, Keyser-Marcus L, et al. Stress cardiomyopathy diagnosis and treatment: JACC state-of-the-art review. J Am Coll Cardiol. 2018;72(16):1955-1971. https://doi.org/10.1016/j.jacc.2018.07.072.
13. Ghadri JR, Wittstein IS, Prasad A, et al. international expert consensus document on takotsubo syndrome (part I): clinical characteristics, diagnostic criteria, and pathophysiology. Eur Heart J. 2018;39(22):2032-2046. https://doi.org/10.1093/eurheartj/ehy076.
Stress cardiomyopathy (SCM), also known as takotsubo cardiomyopathy, is a nonischemic cardiomyopathy initially identified in Japan in 1990. In 2006, SCM gained an International Classification of Diseases code at the 9th Clinical Modification (ICD-9 CM). Subsequently, several epidemiological studies have used ICD codes to evaluate trends in the diagnosis of SCM;1-8 however, to our knowledge, no previous studies have validated ICD-9 or -10 codes using chart review. We aimed to determine the positive predictive value (PPV) and the limitations of these ICD codes among hospitalized patients.
METHODS
We performed a retrospective cohort study at a single tertiary care center, identifying all adults aged ≥18 years from 2010 to 2016 who were hospitalized with a first known diagnosis of SCM in our Electronic Health Records (EHR) system (Cerner, Stoltenberg Consulting, Inc., Bethel Park, Pennsylvania), which includes both inpatient and outpatient records. We included patients hospitalized with a principal or secondary ICD-9 discharge diagnosis code of 429.83 (for those hospitalized before October 2015) or an ICD-10 discharge diagnosis code of I51.81 (for those hospitalized from October 1, 2015 through December 2016). We excluded hospital readmissions and patients with recurrent SCM, but we could not administratively remove patients who carried a prior diagnosis of SCM made previously at other institutions. One investigator (KW) then reviewed our EHR for a documentation of SCM anywhere in the chart by performing a systematic review of discharge, admission, consultation, daily progress notes, as well as biomarkers, electrocardiograms, echocardiograms, and coronary angiograms. If the first reviewer did not find documentation of SCM anywhere in the EHR, this finding was confirmed by a second chart review by a cardiologist (QP).
Principal and secondary discharge diagnoses were entered into our administrative database by hospital coders using standard coding practices. Because ICD codes also record comorbidities that were present prior to admission, we determined whether each patient had a new diagnosis of SCM during the hospitalization. If not, we considered their ICD code as a preexisting comorbidity and labeled these as chronic cases.
We recorded age, sex, race, ethnicity, and frequency of echocardiogram and cardiac catheterization among all patients. To determine the burden of other comorbidities, we used the Charlson Comorbidity Index and the Elixhauser Comorbidity Index,9,10 but limited our reporting to comorbidities with >5% prevalence.
Our primary aim was to measure the PPV of these ICD codes to determine a diagnosis of SCM. This was done by dividing the total number of cases with a clinical documentation of SCM by the total number of patients with an ICD diagnosis of SCM. As secondary aims, we noted the percentage of new and chronic SCM, the proportion of patients who underwent echocardiography and/or cardiac catheterization and recorded the annual number of total cases of confirmed SCM from 2010 to 2016. Trends were evaluated using the Cochran-Armitage test. To better understand the difference between patients given a principal and secondary code for SCM, we compared these two groups using summary statistics using t tests and chi-squared tests as appropriate, noted the PPV, and determined the 95% confidence intervals of ICD codes in these subgroups. This study was approved by the institutional review board of Baystate Medical Center (#1109756-4). Statistical analysis was done using JMP version12.0.1 (SAS Institute, Cary, North Carolina, 2015).
RESULTS
During 2010-2016, a total of 592 patients with a first known ICD code in our EHR for SCM were hospitalized, comprising 242 (41.0%) with a principal diagnosis code. Upon chart review, we were unable to confirm a clinical diagnosis of SCM among 12 (2.0%) patients. In addition, 38 (6.4%) were chronic cases of SCM, without evidence of active disease at the time of hospitalization. In general, chronic cases typically carried an SCM diagnosis from a hospitalization at a non-Baystate hospital (outside our EHR), or from an outpatient setting. Occasionally, we also found cases where the diagnosis of SCM was mentioned but testing was not pursued, and the patient had no symptoms that were attributed to SCM. Overall use of echocardiogram and cardiac angiography was 91.5% and 66.8%, respectively, and was lower in chronic than in new cases of SCM.
Compared with patients with a secondary diagnosis code, patients with a principal diagnosis of SCM underwent more cardiac angiography and echocardiography (Table 1). When comparing the difference between those with principal and secondary ICD codes, we found that 237 (98%) vs 305 (87%) were new cases of SCM, respectively, and all 12 patients without any clinical diagnosis of SCM had been given a secondary ICD code. Between 2010 and 2016, we noted a significant increase in the number of cases of SCM (Cochrane–Armitage, P < .0001).
The overall PPV (95% CI) of either principal or secondary ICD codes for any form or presentation of SCM was 98.0% (96.4-98.8) with no difference in PPV between the coding systems (ICD-9, 66% of cases, PPV 98% [96.0-99.0] vs ICD-10, PPV 98% [94.9-99.2; P = .98]). Because all patients without a diagnosis of SCM were given secondary ICD codes, this changed the PPV (95% CI) for principal and secondary SCM to 100% (98.4-100.0) and 96.6% (94.1-98.0), respectively. When chronic cases were included as noncases, the PPV (95% CI) to detect a new case of SCM decreased to 97.9% (95.2-99.1) and 87.1% (83.0-90.2) for principal and secondary SCM, respectively (Table 1).
DISCUSSION
In this study, we found a strong relationship between the receipt of an ICD code for SCM and the clinical documentation of a diagnosis of SCM, with an overall PPV of 98%. The PPV was higher when the sample was limited to those assigned a principal ICD code for SCM, but it was lower when considering that some ICD codes represented chronic SCM from prior hospitalizations, despite our attempts to exclude these cases administratively prior to chart review. Furthermore, cardiac catheterization and echocardiography were used inconsistently and were less frequent among secondary compared with a principal diagnosis of SCM. Thus, although a principal ICD diagnosis code for SCM appears to accurately reflect a diagnosis of SCM, a secondary code for SCM appears less reliable. These findings suggest that future epidemiological studies can rely on principal diagnosis codes for use in research studies, but that they should use caution when including patients with secondary codes for SCM.
Our study makes an important contribution to the literature because it quantitates the reliability of ICD codes to identify patients with SCM. This finding is important because multiple studies have used this code to study trends in the incidence of this disease,1-8 and futures studies will almost certainly continue to do so. Our results also showed similar demographics and trends in the incidence of SCM compared with those of prior studies1-3,11 but additionally revealed that these codes also have some important limitations.
A key factor to remember is that neither a clinical diagnosis nor an ICD code at the time of hospital discharge is based upon formal diagnostic criteria for SCM. Importantly, all currently proposed diagnostic criteria require resolution of typical regional wall motion abnormalities before finalizing a research-grade diagnosis of SCM (Table 2).12,13 However, because the median time to recovery of ejection fraction in SCM is between three and four weeks after hospital discharge (with some recovery extending much longer),6 it is almost impossible to make a research-grade diagnosis of SCM after a three- to four-day hospitalization. Moreover, 33% of our patients did not undergo cardiac catheterization, 8.5% did not undergo echocardiography, and it is our experience that testing for pheochromocytoma and myocarditis is rarely done. Thus, we emphasize that ICD codes for SCM assigned at the time of hospital discharge represent a clinical diagnosis of SCM and not research-grade criteria for this disease. This is a significant limitation of prior epidemiologic studies that consider only the short time frame of hospitalization.
A limitation of our study is that we did not attempt to measure sensitivity, specificity, or the negative predictive value of these codes. This is because measurement of these diagnostic features would require sampling some of our hospital’s 53,000 annual hospital admissions to find cases where SCM was present but not recognized. This did not seem practical, particularly because it might also require directly overreading imaging studies. Moreover, we believe that for the purposes of future epidemiology research, the PPV is the most important feature of these codes because a high PPV indicates that when a principal ICD code is present, it almost always represents a new case of SCM. Other limitations include this being a single-center study; the rates of echocardiograms, cardiac angiography, clinical diagnosis, and coding may differ at other institutions.
In conclusion, we found a high PPV of ICD codes for SCM, particularly among patients with a principal discharge diagnosis of SCM. However, we also found that approximately 8% of cases were either wrongly coded or were chronic cases. Moreover, because of the need to document resolution of wall motion abnormalities, essentially no patients met the research-grade diagnostic criteria at the time of hospital discharge. Although this increases our confidence in the results of past studies, it also provides some caution to researchers who may use these codes in the future.
1. Khera R, Light-McGroary K, Zahr F, Horwitz PA, Girotra S. Trends in hospitalization for takotsubo cardiomyopathy in the United States. Am Heart J. 2016;172:53-63. https://doi.org/10.1016/j.ahj.2015.10.022.
2. Murugiah K, Wang Y, Desai NR, et al. Trends in short- and long-term outcomes for takotsubo cardiomyopathy among medicare fee-for-service beneficiaries, 2007 to 2012. JACC Heart Fail. 2016;4(3):197-205. https://doi.org/10.1016/j.jchf.2015.09.013.
3. Brinjikji W, El-Sayed AM, Salka S. In-hospital mortality among patients with takotsubo cardiomyopathy: a study of the National Inpatient Sample 2008 to 2009. Am Heart J. 2012;164(2):215-221. https://doi.org/10.1016/j.ahj.2012.04.010.
4. Smilowitz NR, Hausvater A, Reynolds HR. Hospital readmission following takotsubo syndrome. Eur Heart J Qual Care Clin Outcomes. 2018;5(2):114-120. https://doi.org/10.1093/ehjqcco/qcy045.
5. Vallabhajosyula S, Deshmukh AJ, Kashani K, Prasad A, Sakhuja A. Tako-Tsubo cardiomyopathy in severe sepsis: nationwide trends, predictors, and outcomes. J Am Heart Assoc. 2018;7(18):e009160. https://doi.org/10.1161/JAHA.118.009160.
6. Shaikh N, Sardar M, Jacob A, et al. Possible predictive factors for recovery of left ventricular systolic function in takotsubo cardiomyopathy. Intractable Rare Dis Res. 2018;7(2):100-105. https://doi.org/10.5582/irdr.2018.01042.
7. Shah M, Ram P, Lo KBU, et al. Etiologies, predictors, and economic impact of readmission within 1 month among patients with takotsubo cardiomyopathy. Clin Cardiol. 2018;41(7):916-923. https://doi.org/10.1002/clc.22974.
8. Misumida N, Ogunbayo GO, Kim SM, Abdel-Latif A, Ziada KM, Sorrell VL. Clinical outcome of takotsubo cardiomyopathy diagnosed with or without coronary angiography. Angiology. 2019;70(1):56-61. https://doi.org/10.1177/0003319718782049.
9. Charlson ME, Pompei P, Ales KL, MacKenzie CR. A new method of classifying prognostic comorbidity in longitudinal studies: development and validation. J Chronic Dis. 1987;40(5):373-383. https://doi.org/10.1016/0021-9681(87)90171-8.
10. Elixhauser A, Steiner C, Harris DR, Coffey RM. Comorbidity measures for use with administrative data. Med Care. 1998;36(1):8-27. https://doi.org/10.1097/00005650-199801000-00004.
11. Templin C, Ghadri JR, Diekmann J, et al. Clinical features and outcomes of takotsubo (stress) cardiomyopathy. N Engl J Med. Sep 3 2015;373(10):929-938. https://doi.org/10.1056/NEJMoa1406761.
12. Medina de Chazal H, Del Buono MG, Keyser-Marcus L, et al. Stress cardiomyopathy diagnosis and treatment: JACC state-of-the-art review. J Am Coll Cardiol. 2018;72(16):1955-1971. https://doi.org/10.1016/j.jacc.2018.07.072.
13. Ghadri JR, Wittstein IS, Prasad A, et al. international expert consensus document on takotsubo syndrome (part I): clinical characteristics, diagnostic criteria, and pathophysiology. Eur Heart J. 2018;39(22):2032-2046. https://doi.org/10.1093/eurheartj/ehy076.
© 2020 Society of Hospital Medicine
Are Pediatric Readmission Reduction Efforts Falling Flat?
In an effort to improve healthcare for Americans by linking hospital payments to quality of care, Medicare’s Hospital Readmission Reduction Program (HRRP) began penalizing hospitals with “excess” readmission rates in 2012. The decision sparked widespread debate about the definition of a preventable readmission and whether a patient’s socioeconomic status should be considered for risk adjustment. Although coming back to the hospital after an admission is an undesirable outcome for any patient, the suitability of readmission as a quality measure remains a hot and debated topic. Research on the subject skyrocketed; over 12000 articles about hospital readmissions have been indexed in PubMed since 2000, and the number of publications has steadily increased since 2010 (Figure).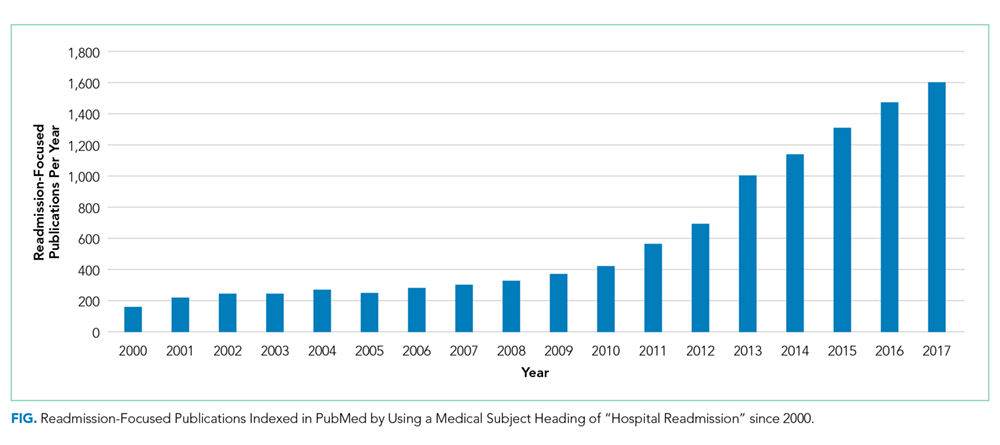
Although the HRRP is a Medicare initiative, there has been a substantial focus on readmissions in pediatrics as well. The National Quality Forum has endorsed three quality measures specific to readmission in children: (1) the rate of unplanned readmissions to the pediatric intensive care unit within 24 hours after discharge or transfer, (2) the pediatric lower respiratory infection readmission measure, defined as the percentage of admissions followed by one or more readmissions within 30 days of hospitalization for lower respiratory infection, and (3) the pediatric all-cause readmission measure, defined as the percentage of admissions followed by one or more readmissions within 30 days. These endorsements were preceded by studies showing that pediatric readmission rates varied substantially across hospitals and clinical conditions, and that children with chronic illnesses were at the highest risk.
Readmission is an attractive pediatric quality measure for a number of reasons. This measure is easy to apply to data at the hospital, health system, and payor levels at relatively low cost. Relatedly, the all-condition measure can be applied to all pediatric hospitalizations, overcoming the very real challenge in pediatric quality measurement of inadequate sample sizes to discern differences in healthcare quality at the hospital level for many disease-specific measures.1 In addition, this measure moves beyond process measurement to quantify an outcome relevant to families as well as healthcare systems. Finally, the measure is founded on a compelling conceptual framework (albeit one that remains challenging to prove) that efforts to improve a patient’s hospital-to-home transition and discharge readiness will reduce their likelihood of readmission.
In this issue of the Journal of Hospital Medicine, Katherine Auger and colleagues present their analysis of pediatric readmission rates from 2010 to 2016 across 66 children’s hospitals.2 They found that the median seven-day all-cause pediatric readmission rate was 5.1%, with no change in rates over the seven-year study period. Applying proprietary software to identify potentially preventable readmissions (PPR), they reported that approximately 40% of these readmissions may be preventable, a proportion that was also unchanged over time. Interestingly, 88% of the hospitals represented in their data were participating in the Solutions for Patient Safety national learning collaborative during the study period, making efforts to reduce seven-day readmission rates. Despite this, the figures presented in this paper of all-condition and potentially preventable readmission rates over time are very, very flat.
This work by Auger et al. contributes to our understanding about the preventability, or lack thereof, of pediatric all-condition readmissions. If 40% of these readmissions are indeed preventable, then why did Auger et al. not observe a declining proportion of PPR over time as a result of hospital participation in a national collaborative? Past quantitative and qualitative studies provide important context. First, the 40% rate of readmission preventability is twofold higher than that reported in past studies that relied on physician judgement to determine readmission preventability;3,4 the authors’ use of proprietary software to categorize the preventability of a readmission limits our ability to explain the differences in these rates. However, in these past studies, the rates of initial agreement between physician reviewers about readmission preventability were poor, highlighting the challenges associated with determining readmission preventability. Moreover, qualitative studies suggest that physicians and families lack a shared understanding of the preventability of readmissions.5 Finally, a systematic review of pediatric hospital discharge interventions did not identify any one intervention that was consistently effective in reducing hospital readmission rates.6 The following important questions remain: Were hospitals’ efforts to reduce PPR targeting the wrong patients? Were the interventions insufficient or ineffective? Or are readmission measures insufficiently sensitive to improved processes of care?
Recognizing that the majority of research on readmission as well as HRRP penalties focuses on adult populations, perhaps we can apply some lessons learned from the HRRP to pediatrics. Recent analyses by Medicare Payment Advisory Commission (MedPAC) suggest that raw and risk-adjusted readmission rates have declined for conditions covered by the HRRP, with readmission rates for HRRP target conditions declining more quickly than that for nontarget conditions.7 Just as the HRRP has focused on target conditions with relatively high readmission rates, analogous efforts to focus pediatric readmission reduction on children at greatest risk may enable measurement of change over time. For example, although children with complex chronic medical conditions represent a small proportion of the pediatric population, they account for 60% of all pediatric readmissions in the United States. However, similar to the above-described meta-analysis of readmission reduction efforts in children, at least one meta-analysis has demonstrated that there is no one intervention or even bundle of interventions that has consistently reduced readmissions in adults.8 Although the readmission rates for HRRP target conditions have decreased, the results of clinical trials evaluating readmission reduction efforts are difficult to translate into practice given substantial heterogeneity in study designs, interventions, and patient populations.
Does this study by Auger et al. suggest that pediatric readmission reduction efforts are misguided or futile? No. But it does provide compelling data that efforts to reduce all-cause readmissions for all children may not yield measureable changes using the current measures. A narrowed focus on children with chronic illnesses, who account for approximately half of all pediatric admissions, may be warranted. A number of studies have summarized families’ preferences regarding their hospital-to-home transitions; the results indicate that families of children with chronic illness have unique desires and needs.9,10 Perhaps it is time to take a step back from pediatric readmission reduction efforts, largely inspired by the HRRP, and redirect our resources to implement and evaluate processes and outcomes most valued by children and their families.
Disclosures
Drs. Lagu and Lindenauer have served as consultants for the Yale Center for Outcomes Research and Evaluation (under contract to the Centers for Medicare and Medicaid Services) providing clinical and methodological expertise and input on the development, reevaluation, and implementation of hospital outcome and efficiency measures.
Funding
Dr. Lagu is supported by the National Heart, Lung, and Blood Institute of the National Institutes of Health under Award R01 HL139985-01A1 and 1R01HL146884-01. Dr. Lindenauer was supported by the National Heart, Lung, and Blood Institute of the National Institutes of Health under Award Number K24HL132008.
Disclaimer
The views expressed in this manuscript do not necessarily reflect those of the Yale Center for Outcomes Research and Evaluation or the Centers for Medicare and Medicaid Services. The content is solely the responsibility of the authors and does not necessarily represent the official views of the NIH.
1. Berry JG, Zaslavsky AM, Toomey SL, et al. Recognizing differences in hospital quality performance for pediatric inpatient care. Pediatrics. 2015;136(2):251-262. https://doi.org/10.1542/peds.2014-3131.
2. Auger K, Harris M, Gay J, et al. Progress (?) towards reducing pediatric readmissions. J Hosp Med. 2019;14(10):618-621. https://doi.org/10.12788/jhm.3210
3. Hain PD, Gay JC, Berutti TW, Whitney GM, Wang W, Saville BR. Preventability of early readmissions at a children’s hospital. Pediatrics. 2013;131(1):e171-e181. https://doi.org/10.1542/peds.2012-0820.
4. Wallace SS, Keller SL, Falco CN, et al. An examination of physician-, caregiver-, and disease-related factors associated with readmission from a pediatric hospital medicine service. Hosp Pediatr. 2015;5(11):566-573. https://doi.org/10.1542/hpeds.2015-0015.
5. Brittan M, Albright K, Cifuentes M, Jimenez-Zambrano A, Kempe A. Parent and provider perspectives on pediatric readmissions: what can we learn about readiness for discharge?. Hosp Pediatr. 2015;5(11):559-565. https://doi.org/10.1542/hpeds.2015-0034.
6. Auger K, Kenyon CC, Feudtner C, Davis MM. Pediatric hospital discharge interventions to reduce subsequent utilization: a systematic review. J Hosp Med. 2014;9(4):251-260. https://doi.org/10.1002/jhm.2134.
7. NEJM Catalyst. Hospital Readmissions Reduction Program (HRRP). Available at: https://catalyst.nejm.org/hospital-readmissions-reduction-program-hrrp/. Accessed May 21, 2019.
8. Hansen L, Young R, Hinami K, Leung A, Williams M. Interventions to reduce 30-day rehospitalization: a systematic review. Ann Intern Med. 2011;155(8):520-528. https://doi.org/10.7326/0003-4819-155-8-201110180-00008.
9. Leyenaar J, O’Brien E, Leslie L, Lindenauer P, Mangione-Smith R. Families’ priorities regarding hospital-to-home transitions for children with medical complexity. Pediatrics. 2017;139(1): e20161581. https://doi.org/10.1542/peds.2016-1581.
10. Desai AD, Durkin LK, Jacob-Files EA, Mangione-Smith R. Caregiver perceptions of hospital to home transitions according to medical complexity: a qualitative study. Acad Pediatr. 2016;16(2):136-144. https://doi.org/10.1016/j.acap.2015.08.003.
In an effort to improve healthcare for Americans by linking hospital payments to quality of care, Medicare’s Hospital Readmission Reduction Program (HRRP) began penalizing hospitals with “excess” readmission rates in 2012. The decision sparked widespread debate about the definition of a preventable readmission and whether a patient’s socioeconomic status should be considered for risk adjustment. Although coming back to the hospital after an admission is an undesirable outcome for any patient, the suitability of readmission as a quality measure remains a hot and debated topic. Research on the subject skyrocketed; over 12000 articles about hospital readmissions have been indexed in PubMed since 2000, and the number of publications has steadily increased since 2010 (Figure).
Although the HRRP is a Medicare initiative, there has been a substantial focus on readmissions in pediatrics as well. The National Quality Forum has endorsed three quality measures specific to readmission in children: (1) the rate of unplanned readmissions to the pediatric intensive care unit within 24 hours after discharge or transfer, (2) the pediatric lower respiratory infection readmission measure, defined as the percentage of admissions followed by one or more readmissions within 30 days of hospitalization for lower respiratory infection, and (3) the pediatric all-cause readmission measure, defined as the percentage of admissions followed by one or more readmissions within 30 days. These endorsements were preceded by studies showing that pediatric readmission rates varied substantially across hospitals and clinical conditions, and that children with chronic illnesses were at the highest risk.
Readmission is an attractive pediatric quality measure for a number of reasons. This measure is easy to apply to data at the hospital, health system, and payor levels at relatively low cost. Relatedly, the all-condition measure can be applied to all pediatric hospitalizations, overcoming the very real challenge in pediatric quality measurement of inadequate sample sizes to discern differences in healthcare quality at the hospital level for many disease-specific measures.1 In addition, this measure moves beyond process measurement to quantify an outcome relevant to families as well as healthcare systems. Finally, the measure is founded on a compelling conceptual framework (albeit one that remains challenging to prove) that efforts to improve a patient’s hospital-to-home transition and discharge readiness will reduce their likelihood of readmission.
In this issue of the Journal of Hospital Medicine, Katherine Auger and colleagues present their analysis of pediatric readmission rates from 2010 to 2016 across 66 children’s hospitals.2 They found that the median seven-day all-cause pediatric readmission rate was 5.1%, with no change in rates over the seven-year study period. Applying proprietary software to identify potentially preventable readmissions (PPR), they reported that approximately 40% of these readmissions may be preventable, a proportion that was also unchanged over time. Interestingly, 88% of the hospitals represented in their data were participating in the Solutions for Patient Safety national learning collaborative during the study period, making efforts to reduce seven-day readmission rates. Despite this, the figures presented in this paper of all-condition and potentially preventable readmission rates over time are very, very flat.
This work by Auger et al. contributes to our understanding about the preventability, or lack thereof, of pediatric all-condition readmissions. If 40% of these readmissions are indeed preventable, then why did Auger et al. not observe a declining proportion of PPR over time as a result of hospital participation in a national collaborative? Past quantitative and qualitative studies provide important context. First, the 40% rate of readmission preventability is twofold higher than that reported in past studies that relied on physician judgement to determine readmission preventability;3,4 the authors’ use of proprietary software to categorize the preventability of a readmission limits our ability to explain the differences in these rates. However, in these past studies, the rates of initial agreement between physician reviewers about readmission preventability were poor, highlighting the challenges associated with determining readmission preventability. Moreover, qualitative studies suggest that physicians and families lack a shared understanding of the preventability of readmissions.5 Finally, a systematic review of pediatric hospital discharge interventions did not identify any one intervention that was consistently effective in reducing hospital readmission rates.6 The following important questions remain: Were hospitals’ efforts to reduce PPR targeting the wrong patients? Were the interventions insufficient or ineffective? Or are readmission measures insufficiently sensitive to improved processes of care?
Recognizing that the majority of research on readmission as well as HRRP penalties focuses on adult populations, perhaps we can apply some lessons learned from the HRRP to pediatrics. Recent analyses by Medicare Payment Advisory Commission (MedPAC) suggest that raw and risk-adjusted readmission rates have declined for conditions covered by the HRRP, with readmission rates for HRRP target conditions declining more quickly than that for nontarget conditions.7 Just as the HRRP has focused on target conditions with relatively high readmission rates, analogous efforts to focus pediatric readmission reduction on children at greatest risk may enable measurement of change over time. For example, although children with complex chronic medical conditions represent a small proportion of the pediatric population, they account for 60% of all pediatric readmissions in the United States. However, similar to the above-described meta-analysis of readmission reduction efforts in children, at least one meta-analysis has demonstrated that there is no one intervention or even bundle of interventions that has consistently reduced readmissions in adults.8 Although the readmission rates for HRRP target conditions have decreased, the results of clinical trials evaluating readmission reduction efforts are difficult to translate into practice given substantial heterogeneity in study designs, interventions, and patient populations.
Does this study by Auger et al. suggest that pediatric readmission reduction efforts are misguided or futile? No. But it does provide compelling data that efforts to reduce all-cause readmissions for all children may not yield measureable changes using the current measures. A narrowed focus on children with chronic illnesses, who account for approximately half of all pediatric admissions, may be warranted. A number of studies have summarized families’ preferences regarding their hospital-to-home transitions; the results indicate that families of children with chronic illness have unique desires and needs.9,10 Perhaps it is time to take a step back from pediatric readmission reduction efforts, largely inspired by the HRRP, and redirect our resources to implement and evaluate processes and outcomes most valued by children and their families.
Disclosures
Drs. Lagu and Lindenauer have served as consultants for the Yale Center for Outcomes Research and Evaluation (under contract to the Centers for Medicare and Medicaid Services) providing clinical and methodological expertise and input on the development, reevaluation, and implementation of hospital outcome and efficiency measures.
Funding
Dr. Lagu is supported by the National Heart, Lung, and Blood Institute of the National Institutes of Health under Award R01 HL139985-01A1 and 1R01HL146884-01. Dr. Lindenauer was supported by the National Heart, Lung, and Blood Institute of the National Institutes of Health under Award Number K24HL132008.
Disclaimer
The views expressed in this manuscript do not necessarily reflect those of the Yale Center for Outcomes Research and Evaluation or the Centers for Medicare and Medicaid Services. The content is solely the responsibility of the authors and does not necessarily represent the official views of the NIH.
1. Berry JG, Zaslavsky AM, Toomey SL, et al. Recognizing differences in hospital quality performance for pediatric inpatient care. Pediatrics. 2015;136(2):251-262. https://doi.org/10.1542/peds.2014-3131.
2. Auger K, Harris M, Gay J, et al. Progress (?) towards reducing pediatric readmissions. J Hosp Med. 2019;14(10):618-621. https://doi.org/10.12788/jhm.3210
3. Hain PD, Gay JC, Berutti TW, Whitney GM, Wang W, Saville BR. Preventability of early readmissions at a children’s hospital. Pediatrics. 2013;131(1):e171-e181. https://doi.org/10.1542/peds.2012-0820.
4. Wallace SS, Keller SL, Falco CN, et al. An examination of physician-, caregiver-, and disease-related factors associated with readmission from a pediatric hospital medicine service. Hosp Pediatr. 2015;5(11):566-573. https://doi.org/10.1542/hpeds.2015-0015.
5. Brittan M, Albright K, Cifuentes M, Jimenez-Zambrano A, Kempe A. Parent and provider perspectives on pediatric readmissions: what can we learn about readiness for discharge?. Hosp Pediatr. 2015;5(11):559-565. https://doi.org/10.1542/hpeds.2015-0034.
6. Auger K, Kenyon CC, Feudtner C, Davis MM. Pediatric hospital discharge interventions to reduce subsequent utilization: a systematic review. J Hosp Med. 2014;9(4):251-260. https://doi.org/10.1002/jhm.2134.
7. NEJM Catalyst. Hospital Readmissions Reduction Program (HRRP). Available at: https://catalyst.nejm.org/hospital-readmissions-reduction-program-hrrp/. Accessed May 21, 2019.
8. Hansen L, Young R, Hinami K, Leung A, Williams M. Interventions to reduce 30-day rehospitalization: a systematic review. Ann Intern Med. 2011;155(8):520-528. https://doi.org/10.7326/0003-4819-155-8-201110180-00008.
9. Leyenaar J, O’Brien E, Leslie L, Lindenauer P, Mangione-Smith R. Families’ priorities regarding hospital-to-home transitions for children with medical complexity. Pediatrics. 2017;139(1): e20161581. https://doi.org/10.1542/peds.2016-1581.
10. Desai AD, Durkin LK, Jacob-Files EA, Mangione-Smith R. Caregiver perceptions of hospital to home transitions according to medical complexity: a qualitative study. Acad Pediatr. 2016;16(2):136-144. https://doi.org/10.1016/j.acap.2015.08.003.
© 2019 Society of Hospital Medicine
Examining the “Repletion Reflex”: The Association between Serum Potassium and Outcomes in Hospitalized Patients with Heart Failure
Heart failure (HF) is a leading cause of hospital admission and mortality, accounting for approximately 900,000 discharges in 2014.1 One-year all-cause mortality risk has been estimated at 17% after hospitalization,2 and roughly 50% of deaths are related to sudden cardiac death, mostly due to ventricular arrhythmia.
The principles underlying potassium management in acute HF are complex. Both low and high values have been linked to fatal arrhythmias, notably ventricular fibrillation, and small serum changes often reflect large total body potassium fluctuations.11 Recent literature links hypokalemia to general membrane hypoexcitability, skeletal muscle hyporeflexia, and arrhythmias initiated by reduced sodium-potassium adenosine triphosphatase activity, leading to increased intracellular calcium and regional variations in action potential duration.12 Potassium abnormalities are common at admission and may be exacerbated by both acute illness and treatments given during hospitalization, including baseline potassium, acute kidney injury, aggressive diuretic therapy, or other potassium-related treatments and conditions.13 The success of potassium repletion may also be affected by the choice of HF therapies.14
The belief that patients with HF must maintain a potassium >4.0 mEq/L remains pervasive, with at least one family medicine guideline recommending that patients with HF maintain a serum potassium level >4.0 mEq/L.
METHODS
Data Sources and Cohort Definition
The Institutional Review Board at Baystate Medical Center approved this study. We identified patients with HF who were admitted for more than 72 hours between January 2010 and December 2012 to hospitals contributing to the HealthFacts database, a multihospital dataset derived from the comprehensive electronic health records of 116 geographically and structurally diverse hospitals throughout the United States (Cerner Corp.). HealthFacts—which includes date-stamped pharmacy, laboratory, and billing information—contains records of more than 84 million acute admissions, emergency room visits, and ambulatory visits. We limited the sample to hospitals that contributed to the pharmacy, laboratory, and diagnosis segments.
We included patients who had a principal International Classification of Disease (ICD-9-CM) diagnosis of HF or a principal diagnosis of respiratory failure with secondary diagnosis of HF (ICD-9-CM codes for HF: 402.01, 402.11, 402.91, 404.01, 404.03, 404.11, 404.13, 404.91, 404.93, 428.xx16 and for respiratory failure: 518.81, 518.82, 518.84) and were 18 years or older. We ensured that patients were treated for acute decompensated HF during the hospitalization by restricting the cohort to patients in whom at least one HF therapy (eg, loop diuretics, metolazone, inotropes, and intra-aortic balloon pump) was initiated within the first two days of hospitalization. We excluded patients with a pediatric or psychiatric attending physician, those with elective admissions, and those who were transferred from or to another acute care facility because we could not accurately determine the onset or subsequent course of their illness.
Definition of Variables Describing Serum Potassium Levels
We limited the sample to patients hospitalized for longer than 72 hours in order to observe how initial potassium values influenced outcomes over the course of hospitalization. We chose an exposure window of 72 hours because this allowed, on average, three potential observations of serum potassium per patient. We further restricted the sample to those who had a normal potassium value (3.5-5.0 mEq/L) at admission (defined as 24 hours prior to admission through midnight of the day of admission) to ensure that the included patients did not have abnormal potassium values upon presentation. We identified the period of time from 24 hours prior to admission through 72 hours following admission as “the exposure window” (the time during which patients were eligible to be classified into average serum potassium levels of <4.0, 4.0-4.5, or >4.5 mEq/L). We excluded patients who, during this window, had fewer than three serum potassium levels drawn (“exposure” levels could be disproportionately influenced by a single value) or received sodium polystyrene (as this would indicate that the physicians felt the potassium was dangerously high). For patients with repeated hospitalizations, we randomly selected one visit for inclusion to reduce the risk of survivor bias. We calculated the mean of all serum potassium levels during the exposure window, including the admission value, and then evaluated two different categorizations of mean serum potassium, based on categories of risk previously reported in the literature:8,17,18: (1) <4.0, 4.0-4.5, or >4.5 mEq/L and (2) <4.0 versus ≥4.0 mEq/L.
Outcomes
We assessed three outcomes: in-hospital mortality, transfer to an intensive care unit (ICU), and length of stay (LOS). Admission to the ICU was defined as any evidence, after the exposure window, that the patient received care in the ICU. We excluded patients with ICU admissions during the exposure window from the analysis of this outcome. We calculated LOS as the difference between discharge date/time and the admission date/time.
Covariates and Comorbidity Adjustment
We obtained information on patient demographics (age and race) and identified the presence of comorbid conditions using previously derived and validated models.19,20 We then further quantified these conditions into a single combined score to adjust for differences in presenting illness severity (including kidney disease) and help reduce confounding.21 To account for presenting severity of illness, we calculated the Laboratory-based Acute Physiology Score (LAPS-2).22,23 LAPS-2 was developed for predicting mortality risk in general medical patients, but we previously externally validated it against other published clinical HF models in a cohort of patients hospitalized with acute decompensated HF.5
Potassium Repletion
Analysis
We evaluated the differences in patient characteristics across serum potassium categories. Categorical variables are presented as frequencies and percentages, whereas continuous variables are presented as means and standard deviations. For binary outcomes, we used generalized estimating equations (with a binomial family and logit link and clustering by hospital) to estimate incidence and calculate unadjusted and adjusted odds ratios (ORs) and 95% confidence intervals (CIs). For LOS, we estimated the median and 95% CIs using quantile regression with clustered standard errors.24 We calculated all models using both a binary exposure (<4.0 versus ≥4.0 mEq/L) and a three-level categorization (<4.0, 4.0-4.5, and >4.5 mEq/L) to explore the effects at the highest potassium level. We adjusted all models for age, race, LAPS-2 score, and combined comorbidity score. We conducted two sensitivity analyses. First, we restricted our sample to those who never received potassium during the exposure window, as these patients may be different than patients who required potassium repletion. Second, we stratified our findings by the presence or absence of acute or chronic renal insufficiency (defined as an admission creatinine >1 or the presence of a diagnostic code for renal insufficiency, as defined by Elixhauser et al.).19,21 Statistical significance was set at an alpha of 0.05. Analysis was completed using Stata v15.1, StataCorp LP, College Station, Texas.
RESULTS
Cohort Description
We identified patients from 56 geographically diverse US hospitals, although most were located in either the northeast (n = 21; 38%) or south (n = 18; 32%). A total of 59% of the hospitals were teaching hospitals, and nearly 95% were in an urban setting. We identified 13,163 patients with HF, of which 4,995 (38.0%) met the inclusion criteria. We excluded 3,744 (28.4%) patients with LOS < 72 hours, 2,210 (16.8%) with admission potassium values outside of the defined range, and 896 (6.8%) with fewer than three potassium values during the exposure window. Of the patients who met the inclusion criteria, 2,080 (41.6%), 2,326 (46.6%), and 589 (11.8%) were categorized in the <4.0, 4.0-4.5, and >4.5 mEq/L groups, respectively (Table 1). The groups were clinically similar in terms of age, sex, illness severity (LAPS-2), and comorbidity score. Compared with other racial groups, black patients had higher potassium values. While the <4.0 and 4.0-4.5 mEq/L groups were relatively similar, the group with mean potassium >4.5 mEq/L had higher admission creatinine and a greater prevalence of chronic kidney disease, deficiency anemias, and chronic obstructive pulmonary disease (Table 1).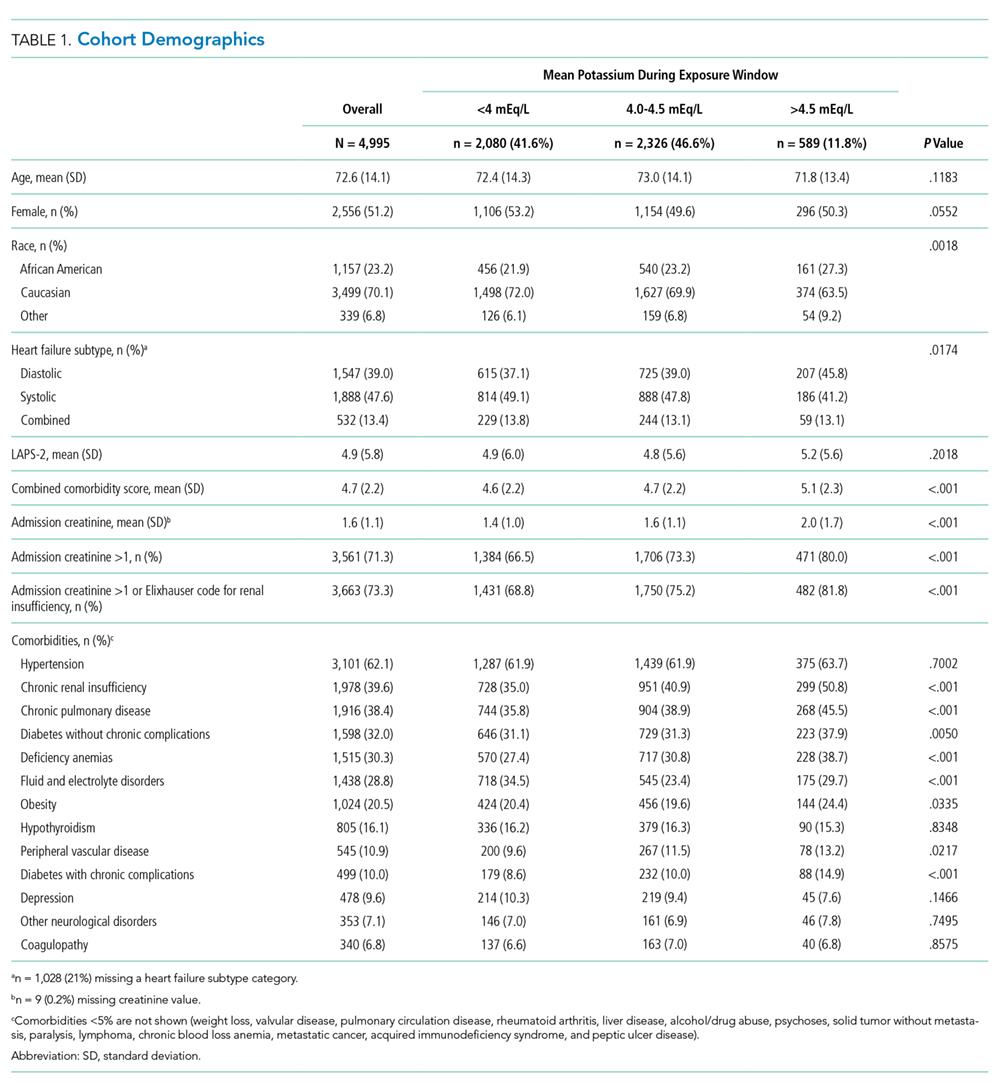
Serum Potassium Values
Individuals’ mean serum potassium within the 72-hour exposure window ranged from 2.9 to 5.8 mEq/L (Table 2). In the <4.0, 4-4.5, and >4.5 mEq/L cohorts respectively, patients had a median serum potassium of 3.8 mEq/L (2.9-3.9), 4.2 mEq/L (4.0-4.5), and 4.7 mEq/L (4.5-5.8) during the exposure window. Approximately half of the patients in the <4.0 mEq/L group had a serum potassium <3.5 mEq/L at some point during the exposure window. In contrast, <10% of the other groups had this low value during the exposure window.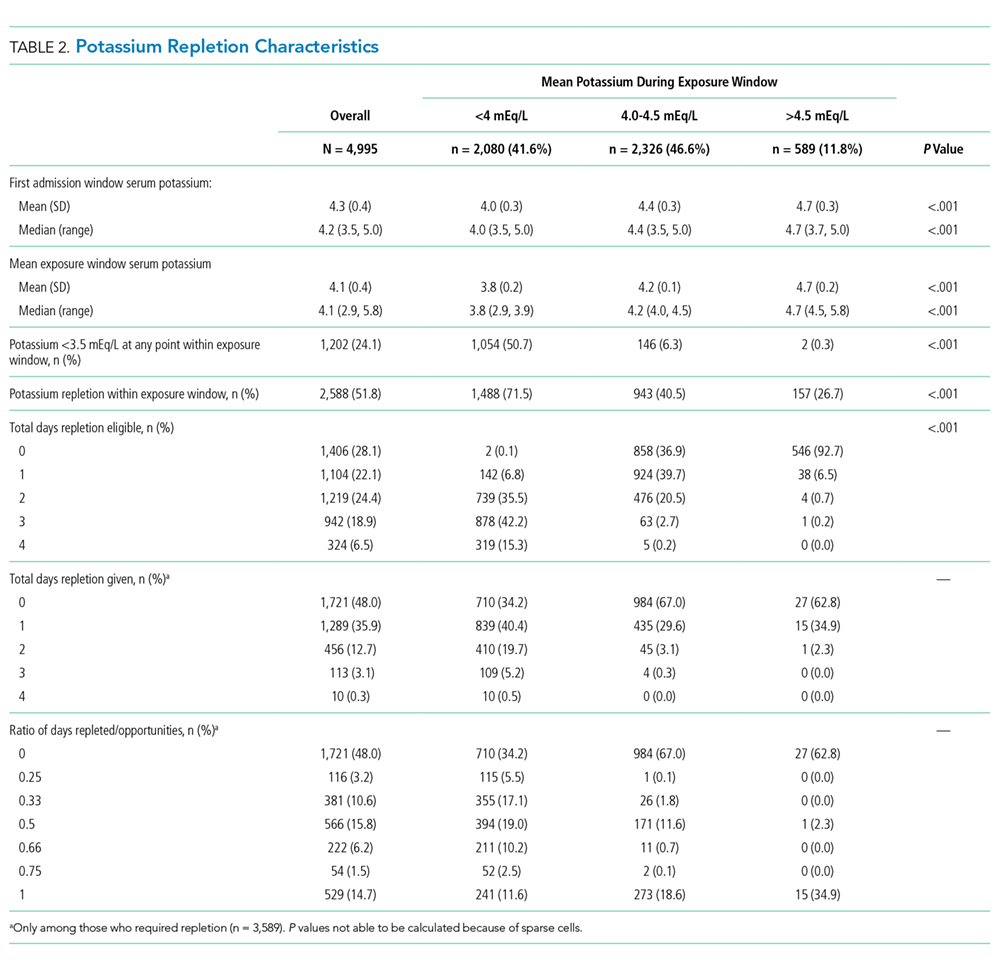
Potassium Repletion
Patients in the <4.0 mEq/L group were much more likely to receive potassium repletion during the exposure window when compared with the 4.0-4.5 mEq/L (71.5% vs 40.5%) and >4.5 mEq/L (71.5% vs 26.7%) groups. On days that they were eligible for repletion (defined as a daily potassium value <4.0 mEq/L), patients with mean serum potassium >4.0 mEq/L were less likely to receive potassium repletion compared with those with values <4.0 mEq/L. There were 592 (28.5%), 1,383 (59.5%), and 432 (73.3%) patients in the <4.0, 4-4.5, and >4,5 mEq/L groups, respectively, who did not receive potassium repletion therapy during the exposure window.
Relationship of Serum Potassium Levels and Outcomes
Overall, 3.7% (n = 187) of patients died during the hospitalization, 2.4% (n = 98) were admitted to the ICU after the exposure window, and the median LOS was 5.6 days. We did not observe a significant association between mean serum potassium of <4.0 or 4.0-4.5 mEq/L and increased risk of mortality, ICU transfer, or LOS (Table 3). Our unadjusted analysis showed that patients with values >4.5 mEq/L had worse outcomes, including more deaths (5.3%; OR = 1.55; 95% CI: 1.01 to 2.39) and ICU admission (3.8%; OR = 2.10; 95% CI: 1.16 to 3.80) compared with those with values <4.0 mEq/L (Table 3). We also found that, compared with the <4.0 mEq/L group, the >4.5 mEq/L group showed just over a half-day longer LOS (0.6 days; 95% CI: 0.0 to 1.0; Table 3). However, we found that mortality and ICU admission results were attenuated after adjustment for age, race, comorbidity score, and LAPS-2 and were no longer statistically significant, whereas the association with LOS was consistent after adjustment. When using a binary exposure (<4.0 versus ≥4.0 mEq/L), we observed no association between mean potassium value and increased risk of mortality, ICU transfer, or LOS both before and after adjustment for age, race, LAPS-2, and comorbidity score (data not shown).
Sensitivity Analyses
In the sensitivity analysis restricted to those who did not receive potassium repletion during the exposure window, we continued to observe no association between the <4.0 and 4.0-4.5 mEq/L groups and outcomes (Table 3). In adjusted models for the >4.5 versus <4.0 mEq/L groups, risk estimates for mortality were similar to the full sample, but statistical significance was lost (OR = 1.56; 95% CI: 0.81 to 3.01). Adjusted risk estimates for ICU transfer were attenuated and not statistically significant (OR = 1.40; 95% CI: 0.60 to 3.26). However, LOS estimates were very similar to that observed in the full dataset (0.6 days; 95% CI: 0.1 to 1.2).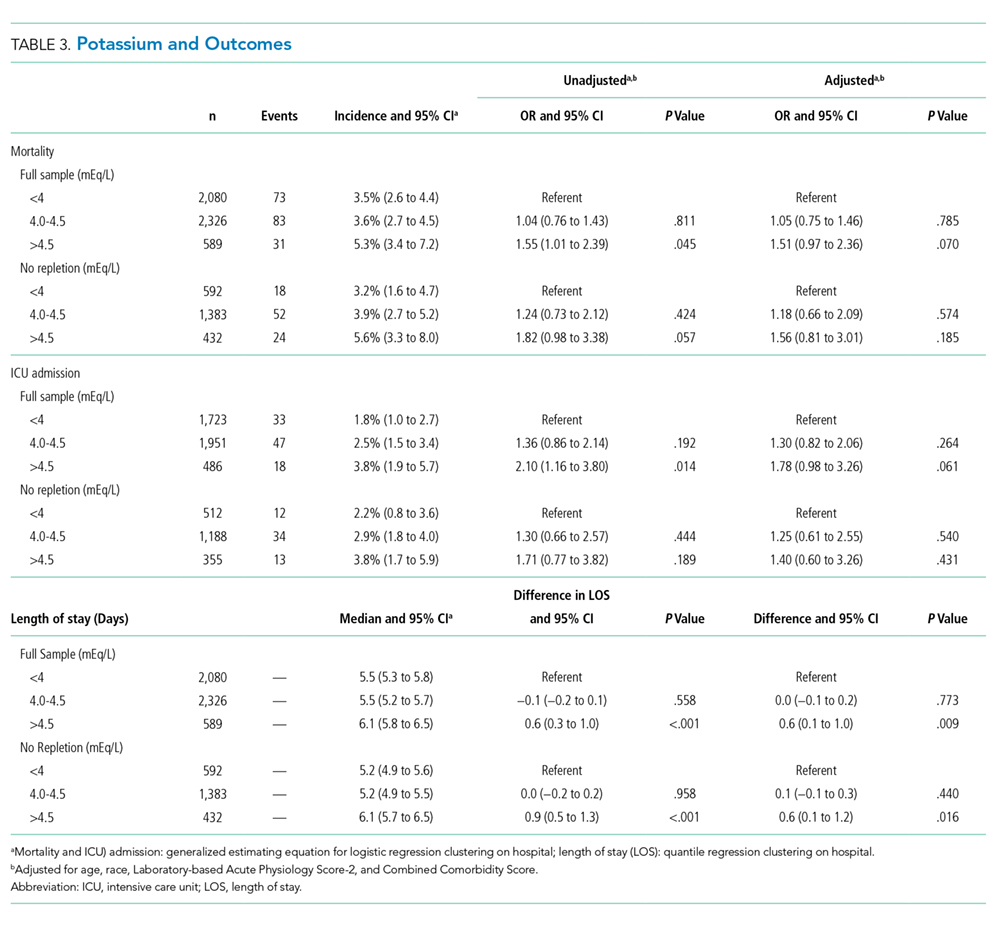
When stratifying our results by the presence or absence of acute or chronic renal insufficiency, we continued to observe no increased risk of any outcome in the 4.0-4.5 mEq/L compared with the <4.0 mEq/L groups across all strata (Table 4). Interestingly, even after adjustment, we did find that most of the increased risk of mortality and ICU admission in the >4.5 versus <4.0 mEq/L groups was among those without renal insufficiency (mortality OR = 3.03; ICU admission OR = 3.00) and was not statistically significant in those with renal insufficiency (mortality OR = 1.27; ICU admission OR = 1.63). Adjusted LOS estimates remained relatively similar in this stratified analysis.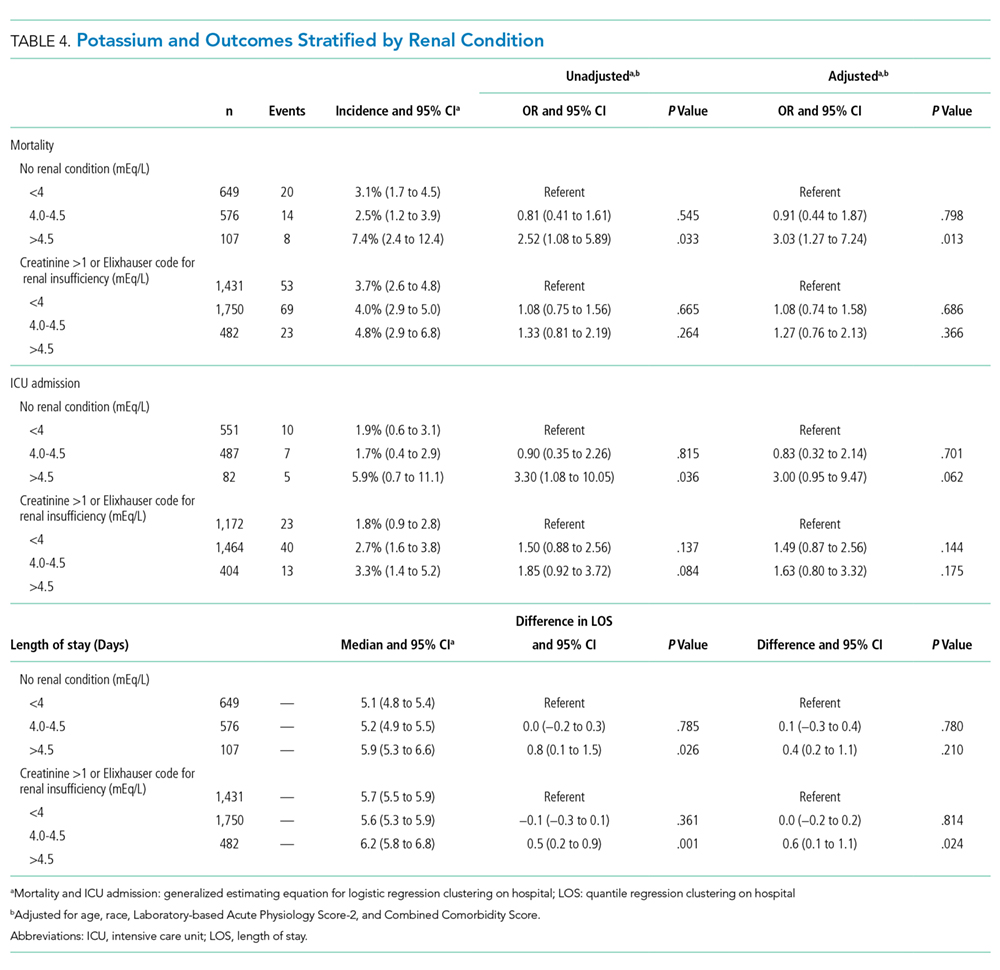
DISCUSSION
The best approach to mild serum potassium value abnormalities in patients hospitalized with HF remains unclear. Many physicians reflexively replete potassium to ensure all patients maintain a serum value of >4.0 mEq/L.15 Yet, in this large observational study of patients hospitalized with an acute HF exacerbation, we found little evidence of association between serum potassium <4.0 mEq/L and negative outcomes.
Compared with those with mean potassium values <4.0 mEq/L (in unadjusted models), there was an association between potassium values of >4.5 mEq/L and increased risk of mortality and ICU transfer. This association was attenuated after adjustment, suggesting that factors beyond potassium values influenced the observed relationship. These findings seem to suggest that unobserved differences in the >4.5 mEq/L group (there were observed differences in this group, eg, greater presenting severity and higher comorbidity scores, suggesting that there were also unobserved differences), and not average potassium value, were the reasons for the observed differences in outcomes. However, we cannot rule out the possibility that potassium >4.5 mEq/L has some associated increased risk compared with mean potassium values of <4.0 mEq/L for patients hospitalized with acute decompensated HF.
Patients in our study routinely received exogenous potassium: more than 70% of patients received repletion at least once, although it is notable that the majority of patients in the 4.0-4.5 and >4.5 mEq/L groups did not receive repletion. Despite this practice, the data supporting this approach to potassium management for patients hospitalized with HF remain mixed. A serum potassium decline of >15% during an acute HF hospital stay has been reported as a predictor of all-cause mortality after controlling for disease severity and associated comorbidities, including renal function.25 However, this study was focused on decline in admission potassium rather than an absolute cut-off (eg, >4.0 mEq/L). Additionally, potassium levels <3.9 mEq/L were associated with increased mortality in patients with acute HF following a myocardial infarction, but this study was not focused on patients with HF.26 Most of the prior literature in patients with HF was conducted in patients in outpatient settings and examined patients who were not experiencing acute exacerbations. MacDonald and Struthers advocate that patients with HF have their potassium maintained above 4.0 mEq/L but did not specify whether this included patients with acute HF exacerbations.10 Additionally, many studies evaluating potassium repletion were conducted before widespread availability of angiotensin-converting enzyme (ACE) inhibitors or potassium-sparing diuretics, including spironolactone. Prior work has consistently reported that hyperkalemia, defined as serum potassium >4.5 mEq/L, is associated with mortality in patients with acute HF over the course of hospitalization (which aligned with the results from our sensitivity analysis), but concurrent medication regimens and underlying impaired renal function likely accounted for most of this association.17 The picture is further complicated as patients with acute HF presenting with hypokalemia may be at risk for subsequent hyperkalemia, and potassium repletion can stimulate aldosterone secretion, potentially exacerbating underlying HF.27,28
These data are observational and are unlikely to change practice. However, daily potassium repletion represents a huge cost in time, money, and effort to the health system. Furthermore, the greatest burden occurs for the patients, who have labs drawn and values checked routinely and potassium administered orally or parenterally. While future randomized clinical trials (RCTs) would best examine the benefits of repletion, future pragmatic trials could attempt to disentangle the associated risks and benefits of potassium repletion in the absence of RCTs. Additionally, such studies could better take into account the role of concurrent medication use (like ACEs or angiotensin II receptor blockers), as well as assess the role of chronic renal insufficiency, acute kidney injury, and magnesium levels.29
This study has limitations. Its retrospective design leads to unmeasured confounding; however, we adjusted for multiple variables (including LAPS-2), which reflect the severity of disease at admission and underlying kidney function at presentation, as well as other comorbid conditions. In addition, data from the cohort only extend to 2012, so more recent changes in practice may not be completely reflected. The nature of the data did not allow us to directly investigate the relationship between serum potassium and arrhythmias, although ICU transfer and mortality were used as surrogates.
In conclusion, the benefit of a serum potassium level >4.0 mEq/L in patients admitted with HF remains unclear. We did not observe that mean potassium values <4.0 mEq/L were associated with worse outcomes, and, more concerning, there may be some risk for patients with mean values >4.5 mEq/L.
Acknowledgments
Dr. Lagu had full access to all the data in the study and takes responsibility for the integrity of the data and the accuracy of the data analysis.
Disclosures
The authors report no potential conflicts of interest. Dr. Lagu has served as a consultant for the Yale Center for Outcomes Research and Evaluation, under contract to the Centers for Medicare and Medicaid Services, for which she has provided clinical and methodological expertise and input on the development, reevaluation, and implementation of hospital outcome and efficiency measures.
Funding
Dr. Lagu is supported by the National Heart, Lung, and Blood Institute of the National Institutes of Health under Award Number K01HL114745 and R01 HL139985-01A1. Dr. Stefan is supported by the National Heart, Lung, and Blood Institute of the National Institutes of Health under Award Number K01HL114631-01A1. Dr. Pack is supported by NHLBI 1K23HL135440. Dr. Lindenauer is supported by the National Heart, Lung, and Blood Institute of the National Institutes of Health under Award Number 1K24HL132008.
Disclaimer
The views expressed in this manuscript do not necessarily reflect those of the Yale Center for Outcomes Research and Evaluation or the Centers for Medicare and Medicaid Services.
1. Benjamin EJ, Virani SS, Callaway CW, et al. Heart disease and stroke statistics–2018 update: a report from the American Heart Association. Circulation. 2018;137(12):e67-e492. https://doi.org/10.1161/CIR.0000000000000558.
2. Maggioni AP, Dahlström U, Filippatos G, et al. EURObservational Research Programme: regional differences and 1-year follow-up results of the Heart Failure Pilot Survey (ESC-HF Pilot). Eur J Heart Fail. 2013;15(7):808-817. https://doi.org/10.1093/eurjhf/hft050.
3. Tomaselli GF, Zipes DP. What causes sudden death in heart failure? Circ Res. 2004;95(8):754-763. https://doi.org/10.1161/01.RES.0000145047.
4. Bowen GS, Diop MS, Jiang L, Wu W-C, Rudolph JL. A multivariable prediction model for mortality in individuals admitted for heart failure. J Am Geriatr Soc. 2018;66(5):902-908. https://doi.org/10.1111/jgs.15319.
5. Lagu T, Pekow PS, Shieh M-S, et al. Validation and comparison of seven mortality prediction models for hospitalized patients with acute decompensated heart failure. Circ Heart Fail. 2016;9(8). https://doi.org/10.1161/CIRCHEARTFAILURE.115.002912.
6. Núñez J, Bayés-Genís A, Zannad F, et al. Long-term potassium monitoring and dynamics in heart failure and risk of mortality. Circulation. 2018;137(13):1320-1330. https://doi.org/10.1161/CIRCULATIONAHA.117.030576.
7. Vardeny O, Claggett B, Anand I, et al. Incidence, predictors, and outcomes related to hypo- and hyperkalemia in patients with severe heart failure treated with a mineralocorticoid receptor antagonist. Circ Heart Fail. 2014;7(4):573-579. https://doi.org/10.1161/CIRCHEARTFAILURE.114.00110.
8. Aldahl M, Jensen A-SC, Davidsen L, et al. Associations of serum potassium levels with mortality in chronic heart failure patients. Eur Heart J. 2017;38(38):2890-2896. https://doi.org/10.1093/eurheartj/ehx460.
9. Hoppe LK, Muhlack DC, Koenig W, Carr PR, Brenner H, Schöttker B. Association of abnormal serum potassium levels with arrhythmias and cardiovascular mortality: a systematic review and meta-analysis of observational studies. Cardiovasc Drugs Ther. 2018;32(2):197-212. https://doi.org/10.1007/s10557-018-6783-0.
10. Macdonald JE, Struthers AD. What is the optimal serum potassium level in cardiovascular patients? J Am Coll Cardiol. 2004;43(2):155-161. https://doi.org/10.1016/j.jacc.2003.06.021.
11. Hulting J. In-hospital ventricular fibrillation and its relation to serum potassium. Acta Med Scand Suppl. 1981;647(647):109-116. https://doi.org/10.1111/j.0954-6820.1981.tb02646.x.
12. Skogestad J, Aronsen JM. Hypokalemia-induced arrhythmias and heart failure: new insights and implications for therapy. Front Physiol. 2018;9:1500. https://doi.org/10.3389/fphys.2018.01500.
13. Tromp J, Ter Maaten JM, Damman K, et al. Serum potassium levels and outcome in acute heart failure (data from the PROTECT and COACH trials). Am J Cardiol. 2017;119(2):290-296. https://doi.org/10.1016/j.amjcard.2016.09.038.
14. Khan SS, Campia U, Chioncel O, et al. Changes in serum potassium levels during hospitalization in patients with worsening heart failure and reduced ejection fraction (from the EVEREST trial). Am J Cardiol. 2015;115(6):790-796. https://doi.org/10.1016/j.amjcard.2014.12.045
15. Viera AJ, Wouk N. Potassium disorders: hypokalemia and hyperkalemia. Am Fam Physician. 2015;92(6):487-495.
16. Krumholz HM, Wang Y, Mattera JA, et al. An administrative claims model suitable for profiling hospital performance based on 30-day mortality rates among patients with heart failure. Circulation. 2006;113(13):1693-1701. https://doi.org/10.1161/CIRCULATIONAHA.105.611194.
17. Legrand M, Ludes P-O, Massy Z, et al. Association between hypo- and hyperkalemia and outcome in acute heart failure patients: the role of medications. Clin Res Cardiol. 2018;107(3):214-221. https://doi.org/10.1007/s00392-017-1173-3.
18. Kok W, Salah K, Stienen S. Are changes in serum potassium levels during admissions for acute decompensated heart failure irrelevant for prognosis: the end of the story? Am J Cardiol. 2015;116(5):825. https://doi.org/10.1016/j.amjcard.2015.05.059.
19. Elixhauser A, Steiner C, Harris DR, Coffey RM. Comorbidity measures for use with administrative data. Med Care. 1998;36(1):8-27. https://doi.org/10.1097/00005650-199801000-00004.
20. Quan H, Parsons GA, Ghali WA. Validity of information on comorbidity derived from ICD-9-CCM administrative data. Med Care. 2002;40(8):675-685. https://doi.org/10.1097/01.MLR.0000020927.46398.5D.
21. Gagne JJ, Glynn RJ, Avorn J, Levin R, Schneeweiss S. A combined comorbidity score predicted mortality in elderly patients better than existing scores. J Clin Epidemiol. 2011;64(7):749-759. https://doi.org/10.1016/j.jclinepi.2010.10.004.
22. Escobar GJ, Gardner MN, Greene JD, Draper D, Kipnis P. Risk-adjusting hospital mortality using a comprehensive electronic record in an integrated health care delivery system. Med Care. 2013;51(5):446-453. https://doi.org/10.1097/MLR.0b013e3182881c8e.
23. Escobar GJ, Greene JD, Scheirer P, Gardner MN, Draper D, Kipnis P. Risk-adjusting hospital inpatient mortality using automated inpatient, outpatient, and laboratory databases. Med Care. 2008;46(3):232-239. https://doi.org/10.1097/MLR.0b013e3181589bb6.
24. Parente PMDC, Santos Silva JMC. Quantile regression with clustered data. J Econom Method. 2016;5(1):1-15. https://doi.org/10.1515/jem-2014-0011.
25. Salah K, Pinto YM, Eurlings LW, et al. Serum potassium decline during hospitalization for acute decompensated heart failure is a predictor of 6-month mortality, independent of N-terminal pro-B-type natriuretic peptide levels: An individual patient data analysis. Am Heart J. 2015;170(3):531-542.e1. https://doi.org/10.1016/j.ahj.2015.06.003.
26. Krogager ML, Eggers-Kaas L, Aasbjerg K, et al. Short-term mortality risk of serum potassium levels in acute heart failure following myocardial infarction. Eur Heart J Cardiovasc Pharmacother. 2015;1(4):245-251. https://doi.org/10.1093/ehjcvp/pvv026.
27. Crop MJ, Hoorn EJ, Lindemans J, Zietse R. Hypokalaemia and subsequent hyperkalaemia in hospitalized patients. Nephrol Dial Transplant. 2007;22(12):3471-3477.https://doi.org/10.1093/ndt/gfm471.
28. Kok W, Salah K, Stienen S. Serum potassium levels during admissions for acute decompensated heart failure: identifying possible threats to outcome. Am J Cardiol. 2018;121(1):141. https://doi.org/10.1016/j.amjcard.2017.09.032.
29. Freda BJ, Knee AB, Braden GL, Visintainer PF, Thakar CV. Effect of transient and sustained acute kidney injury on readmissions in acute decompensated heart failure. Am J Cardiol. 2017;119(11):1809-1814. https://doi.org/10.1016/j.amjcard.2017.02.044.
Heart failure (HF) is a leading cause of hospital admission and mortality, accounting for approximately 900,000 discharges in 2014.1 One-year all-cause mortality risk has been estimated at 17% after hospitalization,2 and roughly 50% of deaths are related to sudden cardiac death, mostly due to ventricular arrhythmia.
The principles underlying potassium management in acute HF are complex. Both low and high values have been linked to fatal arrhythmias, notably ventricular fibrillation, and small serum changes often reflect large total body potassium fluctuations.11 Recent literature links hypokalemia to general membrane hypoexcitability, skeletal muscle hyporeflexia, and arrhythmias initiated by reduced sodium-potassium adenosine triphosphatase activity, leading to increased intracellular calcium and regional variations in action potential duration.12 Potassium abnormalities are common at admission and may be exacerbated by both acute illness and treatments given during hospitalization, including baseline potassium, acute kidney injury, aggressive diuretic therapy, or other potassium-related treatments and conditions.13 The success of potassium repletion may also be affected by the choice of HF therapies.14
The belief that patients with HF must maintain a potassium >4.0 mEq/L remains pervasive, with at least one family medicine guideline recommending that patients with HF maintain a serum potassium level >4.0 mEq/L.
METHODS
Data Sources and Cohort Definition
The Institutional Review Board at Baystate Medical Center approved this study. We identified patients with HF who were admitted for more than 72 hours between January 2010 and December 2012 to hospitals contributing to the HealthFacts database, a multihospital dataset derived from the comprehensive electronic health records of 116 geographically and structurally diverse hospitals throughout the United States (Cerner Corp.). HealthFacts—which includes date-stamped pharmacy, laboratory, and billing information—contains records of more than 84 million acute admissions, emergency room visits, and ambulatory visits. We limited the sample to hospitals that contributed to the pharmacy, laboratory, and diagnosis segments.
We included patients who had a principal International Classification of Disease (ICD-9-CM) diagnosis of HF or a principal diagnosis of respiratory failure with secondary diagnosis of HF (ICD-9-CM codes for HF: 402.01, 402.11, 402.91, 404.01, 404.03, 404.11, 404.13, 404.91, 404.93, 428.xx16 and for respiratory failure: 518.81, 518.82, 518.84) and were 18 years or older. We ensured that patients were treated for acute decompensated HF during the hospitalization by restricting the cohort to patients in whom at least one HF therapy (eg, loop diuretics, metolazone, inotropes, and intra-aortic balloon pump) was initiated within the first two days of hospitalization. We excluded patients with a pediatric or psychiatric attending physician, those with elective admissions, and those who were transferred from or to another acute care facility because we could not accurately determine the onset or subsequent course of their illness.
Definition of Variables Describing Serum Potassium Levels
We limited the sample to patients hospitalized for longer than 72 hours in order to observe how initial potassium values influenced outcomes over the course of hospitalization. We chose an exposure window of 72 hours because this allowed, on average, three potential observations of serum potassium per patient. We further restricted the sample to those who had a normal potassium value (3.5-5.0 mEq/L) at admission (defined as 24 hours prior to admission through midnight of the day of admission) to ensure that the included patients did not have abnormal potassium values upon presentation. We identified the period of time from 24 hours prior to admission through 72 hours following admission as “the exposure window” (the time during which patients were eligible to be classified into average serum potassium levels of <4.0, 4.0-4.5, or >4.5 mEq/L). We excluded patients who, during this window, had fewer than three serum potassium levels drawn (“exposure” levels could be disproportionately influenced by a single value) or received sodium polystyrene (as this would indicate that the physicians felt the potassium was dangerously high). For patients with repeated hospitalizations, we randomly selected one visit for inclusion to reduce the risk of survivor bias. We calculated the mean of all serum potassium levels during the exposure window, including the admission value, and then evaluated two different categorizations of mean serum potassium, based on categories of risk previously reported in the literature:8,17,18: (1) <4.0, 4.0-4.5, or >4.5 mEq/L and (2) <4.0 versus ≥4.0 mEq/L.
Outcomes
We assessed three outcomes: in-hospital mortality, transfer to an intensive care unit (ICU), and length of stay (LOS). Admission to the ICU was defined as any evidence, after the exposure window, that the patient received care in the ICU. We excluded patients with ICU admissions during the exposure window from the analysis of this outcome. We calculated LOS as the difference between discharge date/time and the admission date/time.
Covariates and Comorbidity Adjustment
We obtained information on patient demographics (age and race) and identified the presence of comorbid conditions using previously derived and validated models.19,20 We then further quantified these conditions into a single combined score to adjust for differences in presenting illness severity (including kidney disease) and help reduce confounding.21 To account for presenting severity of illness, we calculated the Laboratory-based Acute Physiology Score (LAPS-2).22,23 LAPS-2 was developed for predicting mortality risk in general medical patients, but we previously externally validated it against other published clinical HF models in a cohort of patients hospitalized with acute decompensated HF.5
Potassium Repletion
Analysis
We evaluated the differences in patient characteristics across serum potassium categories. Categorical variables are presented as frequencies and percentages, whereas continuous variables are presented as means and standard deviations. For binary outcomes, we used generalized estimating equations (with a binomial family and logit link and clustering by hospital) to estimate incidence and calculate unadjusted and adjusted odds ratios (ORs) and 95% confidence intervals (CIs). For LOS, we estimated the median and 95% CIs using quantile regression with clustered standard errors.24 We calculated all models using both a binary exposure (<4.0 versus ≥4.0 mEq/L) and a three-level categorization (<4.0, 4.0-4.5, and >4.5 mEq/L) to explore the effects at the highest potassium level. We adjusted all models for age, race, LAPS-2 score, and combined comorbidity score. We conducted two sensitivity analyses. First, we restricted our sample to those who never received potassium during the exposure window, as these patients may be different than patients who required potassium repletion. Second, we stratified our findings by the presence or absence of acute or chronic renal insufficiency (defined as an admission creatinine >1 or the presence of a diagnostic code for renal insufficiency, as defined by Elixhauser et al.).19,21 Statistical significance was set at an alpha of 0.05. Analysis was completed using Stata v15.1, StataCorp LP, College Station, Texas.
RESULTS
Cohort Description
We identified patients from 56 geographically diverse US hospitals, although most were located in either the northeast (n = 21; 38%) or south (n = 18; 32%). A total of 59% of the hospitals were teaching hospitals, and nearly 95% were in an urban setting. We identified 13,163 patients with HF, of which 4,995 (38.0%) met the inclusion criteria. We excluded 3,744 (28.4%) patients with LOS < 72 hours, 2,210 (16.8%) with admission potassium values outside of the defined range, and 896 (6.8%) with fewer than three potassium values during the exposure window. Of the patients who met the inclusion criteria, 2,080 (41.6%), 2,326 (46.6%), and 589 (11.8%) were categorized in the <4.0, 4.0-4.5, and >4.5 mEq/L groups, respectively (Table 1). The groups were clinically similar in terms of age, sex, illness severity (LAPS-2), and comorbidity score. Compared with other racial groups, black patients had higher potassium values. While the <4.0 and 4.0-4.5 mEq/L groups were relatively similar, the group with mean potassium >4.5 mEq/L had higher admission creatinine and a greater prevalence of chronic kidney disease, deficiency anemias, and chronic obstructive pulmonary disease (Table 1).
Serum Potassium Values
Individuals’ mean serum potassium within the 72-hour exposure window ranged from 2.9 to 5.8 mEq/L (Table 2). In the <4.0, 4-4.5, and >4.5 mEq/L cohorts respectively, patients had a median serum potassium of 3.8 mEq/L (2.9-3.9), 4.2 mEq/L (4.0-4.5), and 4.7 mEq/L (4.5-5.8) during the exposure window. Approximately half of the patients in the <4.0 mEq/L group had a serum potassium <3.5 mEq/L at some point during the exposure window. In contrast, <10% of the other groups had this low value during the exposure window.
Potassium Repletion
Patients in the <4.0 mEq/L group were much more likely to receive potassium repletion during the exposure window when compared with the 4.0-4.5 mEq/L (71.5% vs 40.5%) and >4.5 mEq/L (71.5% vs 26.7%) groups. On days that they were eligible for repletion (defined as a daily potassium value <4.0 mEq/L), patients with mean serum potassium >4.0 mEq/L were less likely to receive potassium repletion compared with those with values <4.0 mEq/L. There were 592 (28.5%), 1,383 (59.5%), and 432 (73.3%) patients in the <4.0, 4-4.5, and >4,5 mEq/L groups, respectively, who did not receive potassium repletion therapy during the exposure window.
Relationship of Serum Potassium Levels and Outcomes
Overall, 3.7% (n = 187) of patients died during the hospitalization, 2.4% (n = 98) were admitted to the ICU after the exposure window, and the median LOS was 5.6 days. We did not observe a significant association between mean serum potassium of <4.0 or 4.0-4.5 mEq/L and increased risk of mortality, ICU transfer, or LOS (Table 3). Our unadjusted analysis showed that patients with values >4.5 mEq/L had worse outcomes, including more deaths (5.3%; OR = 1.55; 95% CI: 1.01 to 2.39) and ICU admission (3.8%; OR = 2.10; 95% CI: 1.16 to 3.80) compared with those with values <4.0 mEq/L (Table 3). We also found that, compared with the <4.0 mEq/L group, the >4.5 mEq/L group showed just over a half-day longer LOS (0.6 days; 95% CI: 0.0 to 1.0; Table 3). However, we found that mortality and ICU admission results were attenuated after adjustment for age, race, comorbidity score, and LAPS-2 and were no longer statistically significant, whereas the association with LOS was consistent after adjustment. When using a binary exposure (<4.0 versus ≥4.0 mEq/L), we observed no association between mean potassium value and increased risk of mortality, ICU transfer, or LOS both before and after adjustment for age, race, LAPS-2, and comorbidity score (data not shown).
Sensitivity Analyses
In the sensitivity analysis restricted to those who did not receive potassium repletion during the exposure window, we continued to observe no association between the <4.0 and 4.0-4.5 mEq/L groups and outcomes (Table 3). In adjusted models for the >4.5 versus <4.0 mEq/L groups, risk estimates for mortality were similar to the full sample, but statistical significance was lost (OR = 1.56; 95% CI: 0.81 to 3.01). Adjusted risk estimates for ICU transfer were attenuated and not statistically significant (OR = 1.40; 95% CI: 0.60 to 3.26). However, LOS estimates were very similar to that observed in the full dataset (0.6 days; 95% CI: 0.1 to 1.2).
When stratifying our results by the presence or absence of acute or chronic renal insufficiency, we continued to observe no increased risk of any outcome in the 4.0-4.5 mEq/L compared with the <4.0 mEq/L groups across all strata (Table 4). Interestingly, even after adjustment, we did find that most of the increased risk of mortality and ICU admission in the >4.5 versus <4.0 mEq/L groups was among those without renal insufficiency (mortality OR = 3.03; ICU admission OR = 3.00) and was not statistically significant in those with renal insufficiency (mortality OR = 1.27; ICU admission OR = 1.63). Adjusted LOS estimates remained relatively similar in this stratified analysis.
DISCUSSION
The best approach to mild serum potassium value abnormalities in patients hospitalized with HF remains unclear. Many physicians reflexively replete potassium to ensure all patients maintain a serum value of >4.0 mEq/L.15 Yet, in this large observational study of patients hospitalized with an acute HF exacerbation, we found little evidence of association between serum potassium <4.0 mEq/L and negative outcomes.
Compared with those with mean potassium values <4.0 mEq/L (in unadjusted models), there was an association between potassium values of >4.5 mEq/L and increased risk of mortality and ICU transfer. This association was attenuated after adjustment, suggesting that factors beyond potassium values influenced the observed relationship. These findings seem to suggest that unobserved differences in the >4.5 mEq/L group (there were observed differences in this group, eg, greater presenting severity and higher comorbidity scores, suggesting that there were also unobserved differences), and not average potassium value, were the reasons for the observed differences in outcomes. However, we cannot rule out the possibility that potassium >4.5 mEq/L has some associated increased risk compared with mean potassium values of <4.0 mEq/L for patients hospitalized with acute decompensated HF.
Patients in our study routinely received exogenous potassium: more than 70% of patients received repletion at least once, although it is notable that the majority of patients in the 4.0-4.5 and >4.5 mEq/L groups did not receive repletion. Despite this practice, the data supporting this approach to potassium management for patients hospitalized with HF remain mixed. A serum potassium decline of >15% during an acute HF hospital stay has been reported as a predictor of all-cause mortality after controlling for disease severity and associated comorbidities, including renal function.25 However, this study was focused on decline in admission potassium rather than an absolute cut-off (eg, >4.0 mEq/L). Additionally, potassium levels <3.9 mEq/L were associated with increased mortality in patients with acute HF following a myocardial infarction, but this study was not focused on patients with HF.26 Most of the prior literature in patients with HF was conducted in patients in outpatient settings and examined patients who were not experiencing acute exacerbations. MacDonald and Struthers advocate that patients with HF have their potassium maintained above 4.0 mEq/L but did not specify whether this included patients with acute HF exacerbations.10 Additionally, many studies evaluating potassium repletion were conducted before widespread availability of angiotensin-converting enzyme (ACE) inhibitors or potassium-sparing diuretics, including spironolactone. Prior work has consistently reported that hyperkalemia, defined as serum potassium >4.5 mEq/L, is associated with mortality in patients with acute HF over the course of hospitalization (which aligned with the results from our sensitivity analysis), but concurrent medication regimens and underlying impaired renal function likely accounted for most of this association.17 The picture is further complicated as patients with acute HF presenting with hypokalemia may be at risk for subsequent hyperkalemia, and potassium repletion can stimulate aldosterone secretion, potentially exacerbating underlying HF.27,28
These data are observational and are unlikely to change practice. However, daily potassium repletion represents a huge cost in time, money, and effort to the health system. Furthermore, the greatest burden occurs for the patients, who have labs drawn and values checked routinely and potassium administered orally or parenterally. While future randomized clinical trials (RCTs) would best examine the benefits of repletion, future pragmatic trials could attempt to disentangle the associated risks and benefits of potassium repletion in the absence of RCTs. Additionally, such studies could better take into account the role of concurrent medication use (like ACEs or angiotensin II receptor blockers), as well as assess the role of chronic renal insufficiency, acute kidney injury, and magnesium levels.29
This study has limitations. Its retrospective design leads to unmeasured confounding; however, we adjusted for multiple variables (including LAPS-2), which reflect the severity of disease at admission and underlying kidney function at presentation, as well as other comorbid conditions. In addition, data from the cohort only extend to 2012, so more recent changes in practice may not be completely reflected. The nature of the data did not allow us to directly investigate the relationship between serum potassium and arrhythmias, although ICU transfer and mortality were used as surrogates.
In conclusion, the benefit of a serum potassium level >4.0 mEq/L in patients admitted with HF remains unclear. We did not observe that mean potassium values <4.0 mEq/L were associated with worse outcomes, and, more concerning, there may be some risk for patients with mean values >4.5 mEq/L.
Acknowledgments
Dr. Lagu had full access to all the data in the study and takes responsibility for the integrity of the data and the accuracy of the data analysis.
Disclosures
The authors report no potential conflicts of interest. Dr. Lagu has served as a consultant for the Yale Center for Outcomes Research and Evaluation, under contract to the Centers for Medicare and Medicaid Services, for which she has provided clinical and methodological expertise and input on the development, reevaluation, and implementation of hospital outcome and efficiency measures.
Funding
Dr. Lagu is supported by the National Heart, Lung, and Blood Institute of the National Institutes of Health under Award Number K01HL114745 and R01 HL139985-01A1. Dr. Stefan is supported by the National Heart, Lung, and Blood Institute of the National Institutes of Health under Award Number K01HL114631-01A1. Dr. Pack is supported by NHLBI 1K23HL135440. Dr. Lindenauer is supported by the National Heart, Lung, and Blood Institute of the National Institutes of Health under Award Number 1K24HL132008.
Disclaimer
The views expressed in this manuscript do not necessarily reflect those of the Yale Center for Outcomes Research and Evaluation or the Centers for Medicare and Medicaid Services.
1. Benjamin EJ, Virani SS, Callaway CW, et al. Heart disease and stroke statistics–2018 update: a report from the American Heart Association. Circulation. 2018;137(12):e67-e492. https://doi.org/10.1161/CIR.0000000000000558.
2. Maggioni AP, Dahlström U, Filippatos G, et al. EURObservational Research Programme: regional differences and 1-year follow-up results of the Heart Failure Pilot Survey (ESC-HF Pilot). Eur J Heart Fail. 2013;15(7):808-817. https://doi.org/10.1093/eurjhf/hft050.
3. Tomaselli GF, Zipes DP. What causes sudden death in heart failure? Circ Res. 2004;95(8):754-763. https://doi.org/10.1161/01.RES.0000145047.
4. Bowen GS, Diop MS, Jiang L, Wu W-C, Rudolph JL. A multivariable prediction model for mortality in individuals admitted for heart failure. J Am Geriatr Soc. 2018;66(5):902-908. https://doi.org/10.1111/jgs.15319.
5. Lagu T, Pekow PS, Shieh M-S, et al. Validation and comparison of seven mortality prediction models for hospitalized patients with acute decompensated heart failure. Circ Heart Fail. 2016;9(8). https://doi.org/10.1161/CIRCHEARTFAILURE.115.002912.
6. Núñez J, Bayés-Genís A, Zannad F, et al. Long-term potassium monitoring and dynamics in heart failure and risk of mortality. Circulation. 2018;137(13):1320-1330. https://doi.org/10.1161/CIRCULATIONAHA.117.030576.
7. Vardeny O, Claggett B, Anand I, et al. Incidence, predictors, and outcomes related to hypo- and hyperkalemia in patients with severe heart failure treated with a mineralocorticoid receptor antagonist. Circ Heart Fail. 2014;7(4):573-579. https://doi.org/10.1161/CIRCHEARTFAILURE.114.00110.
8. Aldahl M, Jensen A-SC, Davidsen L, et al. Associations of serum potassium levels with mortality in chronic heart failure patients. Eur Heart J. 2017;38(38):2890-2896. https://doi.org/10.1093/eurheartj/ehx460.
9. Hoppe LK, Muhlack DC, Koenig W, Carr PR, Brenner H, Schöttker B. Association of abnormal serum potassium levels with arrhythmias and cardiovascular mortality: a systematic review and meta-analysis of observational studies. Cardiovasc Drugs Ther. 2018;32(2):197-212. https://doi.org/10.1007/s10557-018-6783-0.
10. Macdonald JE, Struthers AD. What is the optimal serum potassium level in cardiovascular patients? J Am Coll Cardiol. 2004;43(2):155-161. https://doi.org/10.1016/j.jacc.2003.06.021.
11. Hulting J. In-hospital ventricular fibrillation and its relation to serum potassium. Acta Med Scand Suppl. 1981;647(647):109-116. https://doi.org/10.1111/j.0954-6820.1981.tb02646.x.
12. Skogestad J, Aronsen JM. Hypokalemia-induced arrhythmias and heart failure: new insights and implications for therapy. Front Physiol. 2018;9:1500. https://doi.org/10.3389/fphys.2018.01500.
13. Tromp J, Ter Maaten JM, Damman K, et al. Serum potassium levels and outcome in acute heart failure (data from the PROTECT and COACH trials). Am J Cardiol. 2017;119(2):290-296. https://doi.org/10.1016/j.amjcard.2016.09.038.
14. Khan SS, Campia U, Chioncel O, et al. Changes in serum potassium levels during hospitalization in patients with worsening heart failure and reduced ejection fraction (from the EVEREST trial). Am J Cardiol. 2015;115(6):790-796. https://doi.org/10.1016/j.amjcard.2014.12.045
15. Viera AJ, Wouk N. Potassium disorders: hypokalemia and hyperkalemia. Am Fam Physician. 2015;92(6):487-495.
16. Krumholz HM, Wang Y, Mattera JA, et al. An administrative claims model suitable for profiling hospital performance based on 30-day mortality rates among patients with heart failure. Circulation. 2006;113(13):1693-1701. https://doi.org/10.1161/CIRCULATIONAHA.105.611194.
17. Legrand M, Ludes P-O, Massy Z, et al. Association between hypo- and hyperkalemia and outcome in acute heart failure patients: the role of medications. Clin Res Cardiol. 2018;107(3):214-221. https://doi.org/10.1007/s00392-017-1173-3.
18. Kok W, Salah K, Stienen S. Are changes in serum potassium levels during admissions for acute decompensated heart failure irrelevant for prognosis: the end of the story? Am J Cardiol. 2015;116(5):825. https://doi.org/10.1016/j.amjcard.2015.05.059.
19. Elixhauser A, Steiner C, Harris DR, Coffey RM. Comorbidity measures for use with administrative data. Med Care. 1998;36(1):8-27. https://doi.org/10.1097/00005650-199801000-00004.
20. Quan H, Parsons GA, Ghali WA. Validity of information on comorbidity derived from ICD-9-CCM administrative data. Med Care. 2002;40(8):675-685. https://doi.org/10.1097/01.MLR.0000020927.46398.5D.
21. Gagne JJ, Glynn RJ, Avorn J, Levin R, Schneeweiss S. A combined comorbidity score predicted mortality in elderly patients better than existing scores. J Clin Epidemiol. 2011;64(7):749-759. https://doi.org/10.1016/j.jclinepi.2010.10.004.
22. Escobar GJ, Gardner MN, Greene JD, Draper D, Kipnis P. Risk-adjusting hospital mortality using a comprehensive electronic record in an integrated health care delivery system. Med Care. 2013;51(5):446-453. https://doi.org/10.1097/MLR.0b013e3182881c8e.
23. Escobar GJ, Greene JD, Scheirer P, Gardner MN, Draper D, Kipnis P. Risk-adjusting hospital inpatient mortality using automated inpatient, outpatient, and laboratory databases. Med Care. 2008;46(3):232-239. https://doi.org/10.1097/MLR.0b013e3181589bb6.
24. Parente PMDC, Santos Silva JMC. Quantile regression with clustered data. J Econom Method. 2016;5(1):1-15. https://doi.org/10.1515/jem-2014-0011.
25. Salah K, Pinto YM, Eurlings LW, et al. Serum potassium decline during hospitalization for acute decompensated heart failure is a predictor of 6-month mortality, independent of N-terminal pro-B-type natriuretic peptide levels: An individual patient data analysis. Am Heart J. 2015;170(3):531-542.e1. https://doi.org/10.1016/j.ahj.2015.06.003.
26. Krogager ML, Eggers-Kaas L, Aasbjerg K, et al. Short-term mortality risk of serum potassium levels in acute heart failure following myocardial infarction. Eur Heart J Cardiovasc Pharmacother. 2015;1(4):245-251. https://doi.org/10.1093/ehjcvp/pvv026.
27. Crop MJ, Hoorn EJ, Lindemans J, Zietse R. Hypokalaemia and subsequent hyperkalaemia in hospitalized patients. Nephrol Dial Transplant. 2007;22(12):3471-3477.https://doi.org/10.1093/ndt/gfm471.
28. Kok W, Salah K, Stienen S. Serum potassium levels during admissions for acute decompensated heart failure: identifying possible threats to outcome. Am J Cardiol. 2018;121(1):141. https://doi.org/10.1016/j.amjcard.2017.09.032.
29. Freda BJ, Knee AB, Braden GL, Visintainer PF, Thakar CV. Effect of transient and sustained acute kidney injury on readmissions in acute decompensated heart failure. Am J Cardiol. 2017;119(11):1809-1814. https://doi.org/10.1016/j.amjcard.2017.02.044.
© 2019 Society of Hospital Medicine
Treatment Trends and Outcomes in Healthcare-Associated Pneumonia
Bacterial pneumonia remains an important cause of morbidity and mortality in the United States, and is the 8th leading cause of death with 55,227 deaths among adults annually.1 In 2005, the American Thoracic Society (ATS) and the Infectious Diseases Society of America (IDSA) collaborated to update guidelines for hospital-acquired pneumonia (HAP), ventilator-associated pneumonia, and healthcare-associated pneumonia (HCAP).2 This broad document outlines an evidence-based approach to diagnostic testing and antibiotic management based on the epidemiology and risk factors for these conditions. The guideline specifies the following criteria for HCAP: hospitalization in the past 90 days, residence in a skilled nursing facility (SNF), home infusion therapy, hemodialysis, home wound care, family members with multidrug resistant organisms (MDRO), and immunosuppressive diseases or medications, with the presumption that these patients are more likely to be harboring MDRO and should thus be treated empirically with broad-spectrum antibiotic therapy. Prior studies have shown that patients with HCAP have a more severe illness, are more likely to have MDRO, are more likely to be inadequately treated, and are at a higher risk for mortality than patients with community-acquired pneumonia (CAP).3,4
These guidelines are controversial, especially in regard to the recommendations to empirically treat broadly with 2 antibiotics targeting Pseudomonas species, whether patients with HCAP merit broader spectrum coverage than patients with CAP, and whether the criteria for defining HCAP are adequate to predict which patients are harboring MDRO. It has subsequently been proposed that HCAP is more related to CAP than to HAP, and a recent update to the guideline removed recommendations for treatment of HCAP and will be placing HCAP into the guidelines for CAP instead.5 We sought to investigate the degree of uptake of the ATS and IDSA guideline recommendations by physicians over time, and whether this led to a change in outcomes among patients who met the criteria for HCAP.
METHODS
Setting and Patients
We identified patients discharged between July 1, 2007, and November 30, 2011, from 488 US hospitals that participated in the Premier database (Premier Inc., Charlotte, North Carolina), an inpatient database developed for measuring quality and healthcare utilization. The database is frequently used for healthcare research and has been described previously.6 Member hospitals are in all regions of the US and are generally reflective of US hospitals. This database contains multiple data elements, including sociodemographic information, International Classification of Diseases, 9th Revision-Clinical Modification (ICD-9-CM) diagnosis and procedure codes, hospital and physician information, source of admission, and discharge status. It also includes a date-stamped log of all billed items and services, including diagnostic tests, medications, and other treatments. Because the data do not contain identifiable information, the institutional review board at our medical center determined that this study did not constitute human subjects research.
We included all patients aged ≥18 years with a principal diagnosis of pneumonia or with a secondary diagnosis of pneumonia paired with a principal diagnosis of respiratory failure, acute respiratory distress syndrome, respiratory arrest, sepsis, or influenza. Patients were excluded if they were transferred to or from another acute care institution, had a length of stay of 1 day or less, had cystic fibrosis, did not have a chest radiograph, or did not receive antibiotics within 48 hours of admission.
For each patient, we extracted age, gender, principal diagnosis, comorbidities, and the specialty of the attending physician. Comorbidities were identified from ICD-9-CM secondary diagnosis codes and Diagnosis Related Groups by using Healthcare Cost and Utilization Project Comorbidity Software, version 3.1, based on the work of Elixhauser (Agency for Healthcare Research and Quality, Rockville, Maryland).7 In order to ensure that patients had HCAP, we required the presence of ≥1 HCAP criteria, including hospitalization in the past 90 days, hemodialysis, admission from an SNF, or immune suppression (which was derived from either a secondary diagnosis for neutropenia, hematological malignancy, organ transplant, acquired immunodeficiency virus, or receiving immunosuppressant drugs or corticosteroids [equivalent to ≥20 mg/day of prednisone]).
Definitions of Guideline-Concordant and Discordant Antibiotic Therapy
The ATS and IDSA guidelines recommended the following antibiotic combinations for HCAP: an antipseudomonal cephalosporin or carbapenem or a beta-lactam/lactamase inhibitor, plus an antipseudomonal quinolone or aminoglycoside, plus an antibiotic with activity versus methicillin resistant Staphylococcus aureus (MRSA), such as vancomycin or linezolid. Based on these guidelines, we defined the receipt of fully guideline-concordant antibiotics as 2 recommended antibiotics for Pseudomonas species plus 1 for MRSA administered by the second day of admission. Partially guideline-concordant antibiotics were defined as 1 recommended antibiotic for Pseudomonas species plus 1 for MRSA by the second day of hospitalization. Guideline-discordant antibiotics were defined as all other combinations.
Statistical Analysis
Descriptive statistics on patient characteristics are presented as frequency, proportions for categorical factors, and median with interquartile range (IQR) for continuous variables for the full cohort and by treatment group, defined as fully or partially guideline-concordant antibiotic therapy or discordant therapy. Hospital rates of fully guideline-concordant treatment are presented overall and by hospital characteristics. The association of hospital characteristics with rates of fully guideline-concordant therapy were assessed by using 1-way analysis of variance tests.
To assess trends across hospitals for the association between the use of guideline-concordant therapy and mortality, progression to respiratory failure as measured by the late initiation of invasive mechanical ventilation (day 3 or later), and the length of stay among survivors, we divided the 4.5-year study period into 9 intervals of 6 months each; 292 hospitals that submitted data for all 9 time points were examined in this analysis. Based on the distribution of length of stay in the first time period, we created an indicator variable for extended length of stay with length of stay at or above the 75th percentile, defined as extended. For each hospital at each 6-month interval, we then computed risk-standardized guideline-concordant treatment (RS-treatment) rates and risk-standardized in-hospital outcome rates similar to methods used by the Centers for Medicare and Medicaid Services for public reporting.8 For each hospital at each time interval, we estimated a predicted rate of guideline-concordant treatment as the sum of predicted probabilities of guideline-concordant treatment from patient factors and the random intercept for the hospital in which they were admitted. We then calculated the expected rate of guideline-concordant treatment as the sum of expected probabilities of treatment received from patient factors only. RS-treatment was then calculated as the ratio of predicted to expected rates multiplied by the overall unadjusted mean treatment rate from all patients.9 We repeated the same modeling strategy to calculate risk-standardized outcome (RS-outcome) rates for each hospital across all time points. All models were adjusted for patient demographics and comorbidities. Similar models using administrative data have moderate discrimination for mortality.10
We then fit mixed-effects linear models with random hospital intercept and slope across time for the RS-treatment and outcome rates, respectively. From these models, we estimated the mean slope for RS-treatment and for RS-outcome over time. In addition, we estimated a slope or trend over time for each hospital for treatment and for outcome and evaluated the correlation between the treatment and outcome trends.
All analyses were performed using the Statistical Analysis System version 9.4 (SAS Institute Inc., Cary, NC) and STATA release 13 (StataCorp, LLC, College Station, Texas).
RESULTS
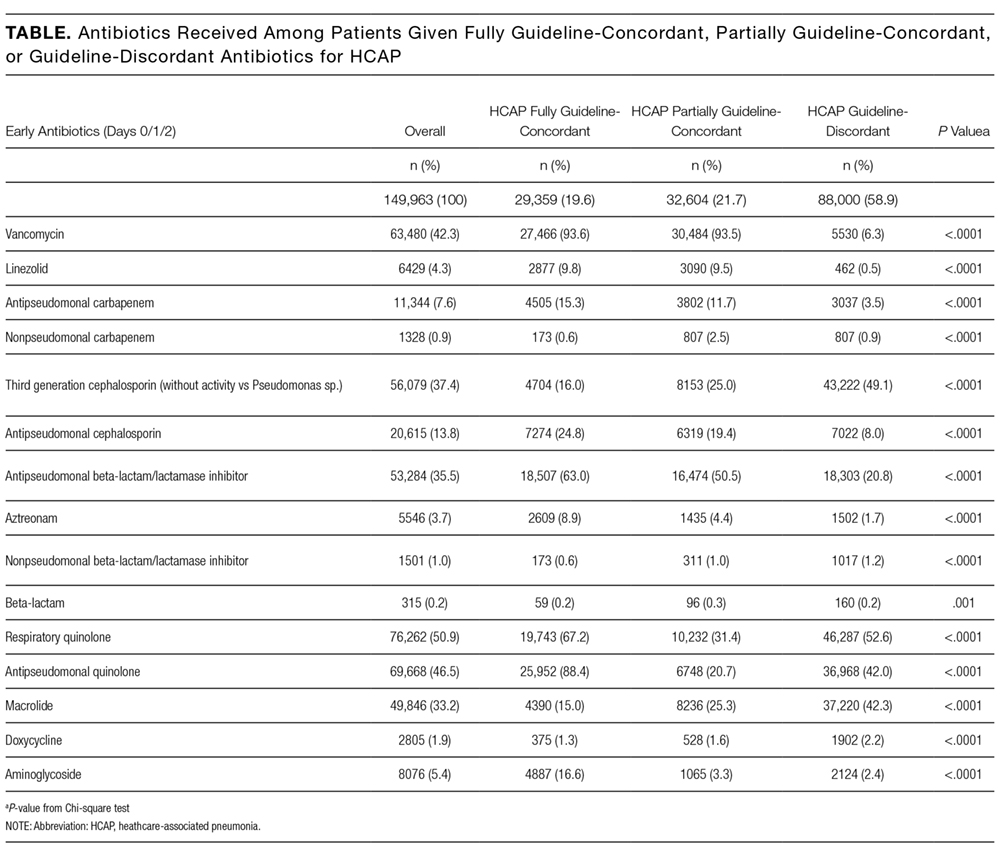

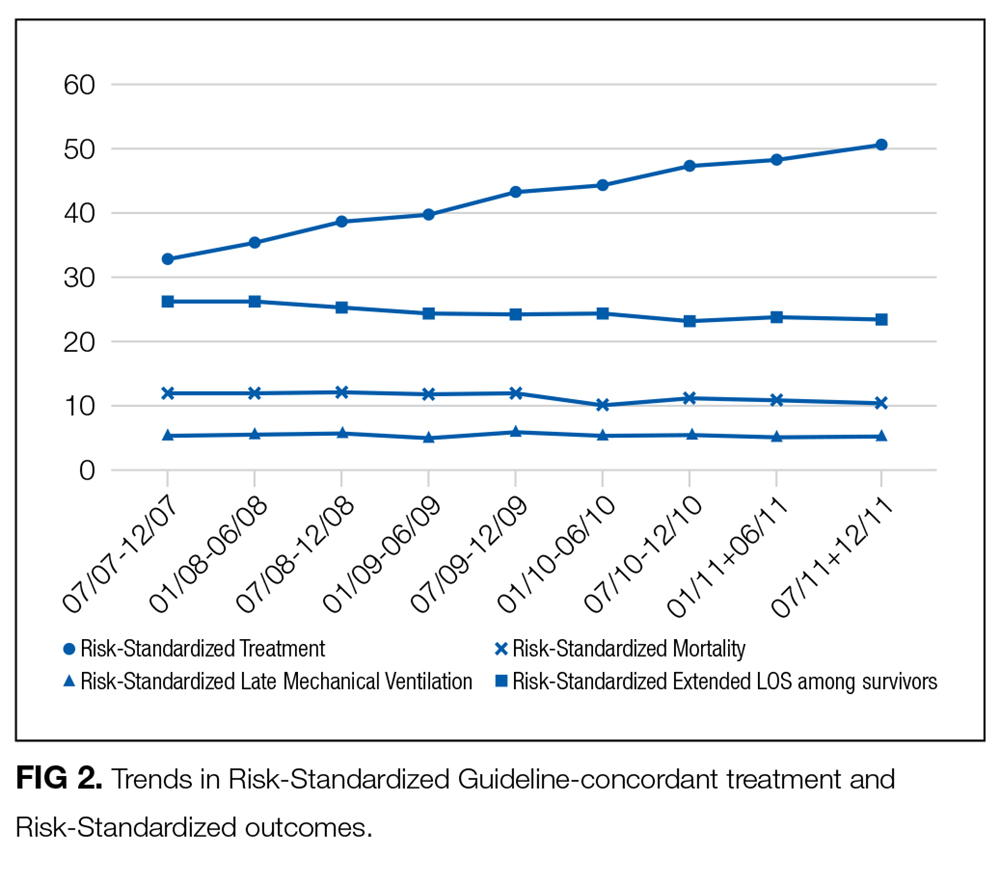
DISCUSSION
In this large, retrospective cohort study, we found that there was a substantial gap between the empiric antibiotics recommended by the ATS and IDSA guidelines and the empiric antibiotics that patients actually received. Over the study period, we saw an increased adherence to guidelines, in spite of growing evidence that HCAP risk factors do not adequately predict which patients are at risk for infection with an MDRO.11 We used this change in antibiotic prescribing behavior over time to determine if there was a clinical impact on patient outcomes and found that at the hospital level, there were no improvements in mortality, excess length of stay, or progression to respiratory failure despite a doubling in guideline-concordant antibiotic use.
At least 2 other large studies have assessed the association between guideline-concordant therapy and outcomes in HCAP.12,13 Both found that guideline-concordant therapy was associated with increased mortality, despite propensity matching. Both were conducted at the individual patient level by using administrative data, and results were likely affected by unmeasured clinical confounders, with sicker patients being more likely to receive guideline-concordant therapy. Our focus on the outcomes at the hospital level avoids this selection bias because the overall severity of illness of patients at any given hospital would not be expected to change over the study period, while physician uptake of antibiotic prescribing guidelines would be expected to increase over time. Determining the correlation between increases in guideline adherence and changes in patient outcome may offer a better assessment of the impact of guideline adherence. In this regard, our results are similar to those achieved by 1 quality improvement collaborative that was aimed at increasing guideline concordant therapy in ICUs. Despite an increase in guideline concordance from 33% to 47% of patients, they found no change in overall mortality.14
There were several limitations to our study. We did not have access to microbiologic data, so we were unable to determine which patients had MDRO infection or determine antibiotic-pathogen matching. However, the treating physicians in our study population presumably did not have access to this data at the time of treatment either because the time period we examined was within the first 48 hours of hospitalization, the interval during which cultures are incubating and the patients are being treated empirically. In addition, there may have been HCAP patients that we failed to identify, such as patients who were admitted in the past 90 days to a hospital that does not submit data to Premier. However, it is unlikely that prescribing for such patients should differ systematically from what we observed. While the database draws from 488 hospitals nationwide, it is possible that practices may be different at facilities that are not contained within the Premier database, such as Veterans Administration Hospitals. Similarly, we did not have readings for chest x-rays; hence, there could be some patients in the dataset who did not have pneumonia. However, we tried to overcome this by including only those patients with a principal diagnosis of pneumonia or sepsis with a secondary pneumonia diagnosis, a chest x-ray, and antibiotics administered within the first 48 hours of admission.
There are likely several reasons why so few HCAP patients in our study received guideline-concordant antibiotics. A lack of knowledge about the ATS and IDSA guidelines may have impacted the physicians in our study population. El-Solh et al.15 surveyed physicians about the ATS-IDSA guidelines 4 years after publication and found that only 45% were familiar with the document. We found that the rate of prescribing at least partially guideline-concordant antibiotics rose steadily over time, supporting the idea that the newness of the guidelines was 1 barrier. Additionally, prior studies have shown that many physicians may not agree with or choose to follow guidelines, with only 20% of physicians indicating that guidelines have a major impact on their clinical decision making,16 and the majority do not choose HCAP guideline-concordant antibiotics when tested.17 Alternatively, clinicians may not follow the guidelines because of a belief that the HCAP criteria do not adequately indicate patients who are at risk for MDRO. Previous studies have demonstrated the relative inability of HCAP risk factors to predict patients who harbor MDRO18 and suggest that better tools such as clinical scoring systems, which include not only the traditional HCAP risk factors but also prior exposure to antibiotics, prior culture data, and a cumulative assessment of both intrinsic and extrinsic factors, could more accurately predict MDRO and lead to a more judicious use of broad-spectrum antimicrobial agents.19-25 Indeed, these collective findings have led the authors of the recently updated guidelines to remove HCAP as a clinical entity from the hospital-acquired or ventilator-associated pneumonia guidelines and place them instead in the upcoming updated guidelines on the management of CAP.5 Of these 3 explanations, the lack of familiarity fits best with our observation that guideline-concordant therapy increased steadily over time with no evidence of reaching a plateau. Ironically, as consensus was building that HCAP is a poor marker for MDROs, routine empiric treatment with vancomycin and piperacillin-tazobactam (“vanco and zosyn”) have become routine in many hospitals. Additional studies are needed to know if this trend has stabilized or reversed.
CONCLUSIONS
In conclusion, clinicians in our large, nationally representative sample treated the majority of HCAP patients as though they had CAP. Although there was an increase in the administration of guideline-concordant therapy over time, this increase was not associated with improved outcomes. This study supports the growing consensus that HCAP criteria do not accurately predict which patients benefit from broad-spectrum antibiotics for pneumonia, and most patients fare well with antibiotics targeting common community-acquired organisms.
Disclosure
This work was supported by grant # R01HS018723 from the Agency for Healthcare Research and Quality. Dr. Lagu is also supported by the National Heart, Lung, and Blood Institute of the National Institutes of Health under award number K01HL114745. Dr. Lindenauer is supported by grant K24HL132008 from the National Heart, Lung, and Blood Institute. The funding agency had no role in the data acquisition, analysis, or manuscript preparation for this study. Drs. Haessler and Rothberg had full access to all the data in the study and take responsibility for the integrity of the data and the accuracy of the data analysis. Drs. Haessler, Lagu, Lindenauer, Skiest, Zilberberg, Higgins, and Rothberg conceived of the study and analyzed and interpreted the data. Dr. Lindenauer acquired the data. Dr. Pekow and Ms. Priya carried out the statistical analyses. Dr. Haessler drafted the manuscript. All authors critically reviewed the manuscript for accuracy and integrity. All authors certify no potential conflicts of interest. Preliminary results from this study were presented in oral and poster format at IDWeek in 2012 and 2013.
1. Kochanek KD, Murphy SL, Xu JQ, Tejada-Vera B. Deaths: Final data for 2014. National vital statistics reports; vol 65 no 4. Hyattsville, MD: National Center for Health Statistics. 2016. PubMed
2. American Thoracic Society, Infectious Diseases Society of America. Guidelines for the Management of Adults with Hospital-acquired, Ventilator-associated, and Healthcare-associated Pneumonia. Am J Respir Crit Care Med. 2005;171(4):388-416. PubMed
3. Zilberberg MD, Shorr A. Healthcare-associated pneumonia: the state of the evidence to date. Curr Opin Pulm Med. 2011;17(3):142-147. PubMed
4. Kollef MK, Shorr A, Tabak YP, Gupta V, Liu LZ, Johannes RS. Epidemiology and Outcomes of Health-care-associated pneumonia. Chest. 2005;128(6):3854-3862. PubMed
5. Kalil AC, Metersky ML, Klompas M, et al. Management of Adults With Hospital-acquired and Ventilator-associated Pneumonia: 2016 Clinical Practice Guidelines by the Infectious Diseases Society of America and the American Thoracic Society. Clin Infect Dis. 2016;63(5):575-582. PubMed
6. Lindenauer PK, Pekow PS, Lahti MC, Lee Y, Benjamin EM, Rothberg MB. Association of corticosteroid dose and route of administration with risk of treatment failure in acute exacerbation of chronic obstructive pulmonary disease. JAMA. 2010;303(23):2359-2367. PubMed
7. Elixhauser A, Steiner C, Harris DR, Coffey RM. Comorbidity measures for use with administrative data. Med Care. 1998;36(1):8-27. PubMed
8. Centers for Medicare & Medicaid Services. Frequently asked questions (FAQs): Implementation and maintenance of CMS mortality measures for AMI & HF. 2007. https://www.cms.gov/Medicare/Quality-Initiatives-Patient-Assessment-Instruments/HospitalQualityInits/downloads/HospitalMortalityAboutAMI_HF.pdf. Accessed November 1, 2016.
9. Normand SL, Shahian DM. Statistical and Clinical Aspects of Hospital Outcomes Profiling. Stat Sci. 2007;22(2):206-226.
10. Rothberg MB, Pekow PS, Priya A, et al. Using highly detailed administrative data to predict pneumonia mortality. PLoS One. 2014;9(1):e87382. PubMed
11. Jones BE, Jones MM, Huttner B, et al. Trends in antibiotic use and nosocomial pathogens in hospitalized veterans with pneumonia at 128 medical centers, 2006-2010. Clin Infect Dis. 2015;61(9):1403-1410. PubMed
12. Attridge RT, Frei CR, Restrepo MI, et al. Guideline-concordant therapy and outcomes in healthcare-associated pneumonia. Eur Respir J. 2011;38(4):878-887. PubMed
13. Rothberg MB, Zilberberg MD, Pekow PS, et al. Association of Guideline-based Antimicrobial Therapy and Outcomes in Healthcare-Associated Pneumonia. J Antimicrob Chemother. 2015;70(5):1573-1579. PubMed
14. Kett DH, Cano E, Quartin AA, et al. Improving Medicine through Pathway Assessment of Critical Therapy of Hospital-Acquired Pneumonia (IMPACT-HAP) Investigators. Implementation of guidelines for management of possible multidrug-resistant pneumonia in intensive care: an observational, multicentre cohort study. Lancet Infect Dis. 2011;11(3):181-189. PubMed
15. El-Solh AA, Alhajhusain A, Saliba RG, Drinka P. Physicians’ Attitudes Toward Guidelines for the Treatment of Hospitalized Nursing-Home -Acquired Pneumonia. J Am Med Dir Assoc. 2011;12(4):270-276. PubMed
16. Tunis S, Hayward R, Wilson M, et al. Internists’ Attitudes about Clinical Practice Guidelines. Ann Intern Med. 1994;120(11):956-963. PubMed
17. Seymann GB, Di Francesco L, Sharpe B, et al. The HCAP Gap: Differences between Self-Reported Practice Patterns and Published Guidelines for Health Care-Associated Pneumonia. Clin Infect Dis. 2009;49(12):1868-1874. PubMed
18. Chalmers JD, Rother C, Salih W, Ewig S. Healthcare associated pneumonia does not accurately identify potentially resistant pathogens: a systematic review and meta-analysis. Clin Infect Dis. 2014;58(3):330-339. PubMed
19. Shorr A, Zilberberg MD, Reichley R, et al. Validation of a Clinical Score for Assessing the Risk of Resistant Pathogens in Patients with Pneumonia Presenting to the Emergency Department. Clin Infect Dis. 2012;54(2):193-198. PubMed
20. Aliberti S, Pasquale MD, Zanaboni AM, et al. Stratifying Risk Factors for Multidrug-Resistant Pathogens in Hospitalized Patients Coming from the Community with Pneumonia. Clin Infect Dis. 2012;54(4):470-478. PubMed
21. Schreiber MP, Chan CM, Shorr AF. Resistant Pathogens in Nonnosocomial Pneumonia and Respiratory Failure: Is it Time to Refine the Definition of Health-care-Associated Pneumonia? Chest. 2010;137(6):1283-1288. PubMed
22. Madaras-Kelly KJ, Remington RE, Fan VS, Sloan KL. Predicting antibiotic resistance to community-acquired pneumonia antibiotics in culture-positive patients with healthcare-associated pneumonia. J Hosp Med. 2012;7(3):195-202. PubMed
23. Shindo Y, Ito R, Kobayashi D, et al. Risk factors for drug-resistant pathogens in community-acquired and healthcare-associated pneumonia. Am J Respir Crit Care Med. 2013;188(8):985-995. PubMed
24. Metersky ML, Frei CR, Mortensen EM. Predictors of Pseudomonas and methicillin-resistant Staphylococcus aureus in hospitalized patients with healthcare-associated pneumonia. Respirology. 2016;21(1):157-163. PubMed
25. Webb BJ, Dascomb K, Stenehjem E, Dean N. Predicting risk of drug-resistant organisms in pneumonia: moving beyond the HCAP model. Respir Med. 2015;109(1):1-10. PubMed
Bacterial pneumonia remains an important cause of morbidity and mortality in the United States, and is the 8th leading cause of death with 55,227 deaths among adults annually.1 In 2005, the American Thoracic Society (ATS) and the Infectious Diseases Society of America (IDSA) collaborated to update guidelines for hospital-acquired pneumonia (HAP), ventilator-associated pneumonia, and healthcare-associated pneumonia (HCAP).2 This broad document outlines an evidence-based approach to diagnostic testing and antibiotic management based on the epidemiology and risk factors for these conditions. The guideline specifies the following criteria for HCAP: hospitalization in the past 90 days, residence in a skilled nursing facility (SNF), home infusion therapy, hemodialysis, home wound care, family members with multidrug resistant organisms (MDRO), and immunosuppressive diseases or medications, with the presumption that these patients are more likely to be harboring MDRO and should thus be treated empirically with broad-spectrum antibiotic therapy. Prior studies have shown that patients with HCAP have a more severe illness, are more likely to have MDRO, are more likely to be inadequately treated, and are at a higher risk for mortality than patients with community-acquired pneumonia (CAP).3,4
These guidelines are controversial, especially in regard to the recommendations to empirically treat broadly with 2 antibiotics targeting Pseudomonas species, whether patients with HCAP merit broader spectrum coverage than patients with CAP, and whether the criteria for defining HCAP are adequate to predict which patients are harboring MDRO. It has subsequently been proposed that HCAP is more related to CAP than to HAP, and a recent update to the guideline removed recommendations for treatment of HCAP and will be placing HCAP into the guidelines for CAP instead.5 We sought to investigate the degree of uptake of the ATS and IDSA guideline recommendations by physicians over time, and whether this led to a change in outcomes among patients who met the criteria for HCAP.
METHODS
Setting and Patients
We identified patients discharged between July 1, 2007, and November 30, 2011, from 488 US hospitals that participated in the Premier database (Premier Inc., Charlotte, North Carolina), an inpatient database developed for measuring quality and healthcare utilization. The database is frequently used for healthcare research and has been described previously.6 Member hospitals are in all regions of the US and are generally reflective of US hospitals. This database contains multiple data elements, including sociodemographic information, International Classification of Diseases, 9th Revision-Clinical Modification (ICD-9-CM) diagnosis and procedure codes, hospital and physician information, source of admission, and discharge status. It also includes a date-stamped log of all billed items and services, including diagnostic tests, medications, and other treatments. Because the data do not contain identifiable information, the institutional review board at our medical center determined that this study did not constitute human subjects research.
We included all patients aged ≥18 years with a principal diagnosis of pneumonia or with a secondary diagnosis of pneumonia paired with a principal diagnosis of respiratory failure, acute respiratory distress syndrome, respiratory arrest, sepsis, or influenza. Patients were excluded if they were transferred to or from another acute care institution, had a length of stay of 1 day or less, had cystic fibrosis, did not have a chest radiograph, or did not receive antibiotics within 48 hours of admission.
For each patient, we extracted age, gender, principal diagnosis, comorbidities, and the specialty of the attending physician. Comorbidities were identified from ICD-9-CM secondary diagnosis codes and Diagnosis Related Groups by using Healthcare Cost and Utilization Project Comorbidity Software, version 3.1, based on the work of Elixhauser (Agency for Healthcare Research and Quality, Rockville, Maryland).7 In order to ensure that patients had HCAP, we required the presence of ≥1 HCAP criteria, including hospitalization in the past 90 days, hemodialysis, admission from an SNF, or immune suppression (which was derived from either a secondary diagnosis for neutropenia, hematological malignancy, organ transplant, acquired immunodeficiency virus, or receiving immunosuppressant drugs or corticosteroids [equivalent to ≥20 mg/day of prednisone]).
Definitions of Guideline-Concordant and Discordant Antibiotic Therapy
The ATS and IDSA guidelines recommended the following antibiotic combinations for HCAP: an antipseudomonal cephalosporin or carbapenem or a beta-lactam/lactamase inhibitor, plus an antipseudomonal quinolone or aminoglycoside, plus an antibiotic with activity versus methicillin resistant Staphylococcus aureus (MRSA), such as vancomycin or linezolid. Based on these guidelines, we defined the receipt of fully guideline-concordant antibiotics as 2 recommended antibiotics for Pseudomonas species plus 1 for MRSA administered by the second day of admission. Partially guideline-concordant antibiotics were defined as 1 recommended antibiotic for Pseudomonas species plus 1 for MRSA by the second day of hospitalization. Guideline-discordant antibiotics were defined as all other combinations.
Statistical Analysis
Descriptive statistics on patient characteristics are presented as frequency, proportions for categorical factors, and median with interquartile range (IQR) for continuous variables for the full cohort and by treatment group, defined as fully or partially guideline-concordant antibiotic therapy or discordant therapy. Hospital rates of fully guideline-concordant treatment are presented overall and by hospital characteristics. The association of hospital characteristics with rates of fully guideline-concordant therapy were assessed by using 1-way analysis of variance tests.
To assess trends across hospitals for the association between the use of guideline-concordant therapy and mortality, progression to respiratory failure as measured by the late initiation of invasive mechanical ventilation (day 3 or later), and the length of stay among survivors, we divided the 4.5-year study period into 9 intervals of 6 months each; 292 hospitals that submitted data for all 9 time points were examined in this analysis. Based on the distribution of length of stay in the first time period, we created an indicator variable for extended length of stay with length of stay at or above the 75th percentile, defined as extended. For each hospital at each 6-month interval, we then computed risk-standardized guideline-concordant treatment (RS-treatment) rates and risk-standardized in-hospital outcome rates similar to methods used by the Centers for Medicare and Medicaid Services for public reporting.8 For each hospital at each time interval, we estimated a predicted rate of guideline-concordant treatment as the sum of predicted probabilities of guideline-concordant treatment from patient factors and the random intercept for the hospital in which they were admitted. We then calculated the expected rate of guideline-concordant treatment as the sum of expected probabilities of treatment received from patient factors only. RS-treatment was then calculated as the ratio of predicted to expected rates multiplied by the overall unadjusted mean treatment rate from all patients.9 We repeated the same modeling strategy to calculate risk-standardized outcome (RS-outcome) rates for each hospital across all time points. All models were adjusted for patient demographics and comorbidities. Similar models using administrative data have moderate discrimination for mortality.10
We then fit mixed-effects linear models with random hospital intercept and slope across time for the RS-treatment and outcome rates, respectively. From these models, we estimated the mean slope for RS-treatment and for RS-outcome over time. In addition, we estimated a slope or trend over time for each hospital for treatment and for outcome and evaluated the correlation between the treatment and outcome trends.
All analyses were performed using the Statistical Analysis System version 9.4 (SAS Institute Inc., Cary, NC) and STATA release 13 (StataCorp, LLC, College Station, Texas).
RESULTS
DISCUSSION
In this large, retrospective cohort study, we found that there was a substantial gap between the empiric antibiotics recommended by the ATS and IDSA guidelines and the empiric antibiotics that patients actually received. Over the study period, we saw an increased adherence to guidelines, in spite of growing evidence that HCAP risk factors do not adequately predict which patients are at risk for infection with an MDRO.11 We used this change in antibiotic prescribing behavior over time to determine if there was a clinical impact on patient outcomes and found that at the hospital level, there were no improvements in mortality, excess length of stay, or progression to respiratory failure despite a doubling in guideline-concordant antibiotic use.
At least 2 other large studies have assessed the association between guideline-concordant therapy and outcomes in HCAP.12,13 Both found that guideline-concordant therapy was associated with increased mortality, despite propensity matching. Both were conducted at the individual patient level by using administrative data, and results were likely affected by unmeasured clinical confounders, with sicker patients being more likely to receive guideline-concordant therapy. Our focus on the outcomes at the hospital level avoids this selection bias because the overall severity of illness of patients at any given hospital would not be expected to change over the study period, while physician uptake of antibiotic prescribing guidelines would be expected to increase over time. Determining the correlation between increases in guideline adherence and changes in patient outcome may offer a better assessment of the impact of guideline adherence. In this regard, our results are similar to those achieved by 1 quality improvement collaborative that was aimed at increasing guideline concordant therapy in ICUs. Despite an increase in guideline concordance from 33% to 47% of patients, they found no change in overall mortality.14
There were several limitations to our study. We did not have access to microbiologic data, so we were unable to determine which patients had MDRO infection or determine antibiotic-pathogen matching. However, the treating physicians in our study population presumably did not have access to this data at the time of treatment either because the time period we examined was within the first 48 hours of hospitalization, the interval during which cultures are incubating and the patients are being treated empirically. In addition, there may have been HCAP patients that we failed to identify, such as patients who were admitted in the past 90 days to a hospital that does not submit data to Premier. However, it is unlikely that prescribing for such patients should differ systematically from what we observed. While the database draws from 488 hospitals nationwide, it is possible that practices may be different at facilities that are not contained within the Premier database, such as Veterans Administration Hospitals. Similarly, we did not have readings for chest x-rays; hence, there could be some patients in the dataset who did not have pneumonia. However, we tried to overcome this by including only those patients with a principal diagnosis of pneumonia or sepsis with a secondary pneumonia diagnosis, a chest x-ray, and antibiotics administered within the first 48 hours of admission.
There are likely several reasons why so few HCAP patients in our study received guideline-concordant antibiotics. A lack of knowledge about the ATS and IDSA guidelines may have impacted the physicians in our study population. El-Solh et al.15 surveyed physicians about the ATS-IDSA guidelines 4 years after publication and found that only 45% were familiar with the document. We found that the rate of prescribing at least partially guideline-concordant antibiotics rose steadily over time, supporting the idea that the newness of the guidelines was 1 barrier. Additionally, prior studies have shown that many physicians may not agree with or choose to follow guidelines, with only 20% of physicians indicating that guidelines have a major impact on their clinical decision making,16 and the majority do not choose HCAP guideline-concordant antibiotics when tested.17 Alternatively, clinicians may not follow the guidelines because of a belief that the HCAP criteria do not adequately indicate patients who are at risk for MDRO. Previous studies have demonstrated the relative inability of HCAP risk factors to predict patients who harbor MDRO18 and suggest that better tools such as clinical scoring systems, which include not only the traditional HCAP risk factors but also prior exposure to antibiotics, prior culture data, and a cumulative assessment of both intrinsic and extrinsic factors, could more accurately predict MDRO and lead to a more judicious use of broad-spectrum antimicrobial agents.19-25 Indeed, these collective findings have led the authors of the recently updated guidelines to remove HCAP as a clinical entity from the hospital-acquired or ventilator-associated pneumonia guidelines and place them instead in the upcoming updated guidelines on the management of CAP.5 Of these 3 explanations, the lack of familiarity fits best with our observation that guideline-concordant therapy increased steadily over time with no evidence of reaching a plateau. Ironically, as consensus was building that HCAP is a poor marker for MDROs, routine empiric treatment with vancomycin and piperacillin-tazobactam (“vanco and zosyn”) have become routine in many hospitals. Additional studies are needed to know if this trend has stabilized or reversed.
CONCLUSIONS
In conclusion, clinicians in our large, nationally representative sample treated the majority of HCAP patients as though they had CAP. Although there was an increase in the administration of guideline-concordant therapy over time, this increase was not associated with improved outcomes. This study supports the growing consensus that HCAP criteria do not accurately predict which patients benefit from broad-spectrum antibiotics for pneumonia, and most patients fare well with antibiotics targeting common community-acquired organisms.
Disclosure
This work was supported by grant # R01HS018723 from the Agency for Healthcare Research and Quality. Dr. Lagu is also supported by the National Heart, Lung, and Blood Institute of the National Institutes of Health under award number K01HL114745. Dr. Lindenauer is supported by grant K24HL132008 from the National Heart, Lung, and Blood Institute. The funding agency had no role in the data acquisition, analysis, or manuscript preparation for this study. Drs. Haessler and Rothberg had full access to all the data in the study and take responsibility for the integrity of the data and the accuracy of the data analysis. Drs. Haessler, Lagu, Lindenauer, Skiest, Zilberberg, Higgins, and Rothberg conceived of the study and analyzed and interpreted the data. Dr. Lindenauer acquired the data. Dr. Pekow and Ms. Priya carried out the statistical analyses. Dr. Haessler drafted the manuscript. All authors critically reviewed the manuscript for accuracy and integrity. All authors certify no potential conflicts of interest. Preliminary results from this study were presented in oral and poster format at IDWeek in 2012 and 2013.
1. Kochanek KD, Murphy SL, Xu JQ, Tejada-Vera B. Deaths: Final data for 2014. National vital statistics reports; vol 65 no 4. Hyattsville, MD: National Center for Health Statistics. 2016. PubMed
2. American Thoracic Society, Infectious Diseases Society of America. Guidelines for the Management of Adults with Hospital-acquired, Ventilator-associated, and Healthcare-associated Pneumonia. Am J Respir Crit Care Med. 2005;171(4):388-416. PubMed
3. Zilberberg MD, Shorr A. Healthcare-associated pneumonia: the state of the evidence to date. Curr Opin Pulm Med. 2011;17(3):142-147. PubMed
4. Kollef MK, Shorr A, Tabak YP, Gupta V, Liu LZ, Johannes RS. Epidemiology and Outcomes of Health-care-associated pneumonia. Chest. 2005;128(6):3854-3862. PubMed
5. Kalil AC, Metersky ML, Klompas M, et al. Management of Adults With Hospital-acquired and Ventilator-associated Pneumonia: 2016 Clinical Practice Guidelines by the Infectious Diseases Society of America and the American Thoracic Society. Clin Infect Dis. 2016;63(5):575-582. PubMed
6. Lindenauer PK, Pekow PS, Lahti MC, Lee Y, Benjamin EM, Rothberg MB. Association of corticosteroid dose and route of administration with risk of treatment failure in acute exacerbation of chronic obstructive pulmonary disease. JAMA. 2010;303(23):2359-2367. PubMed
7. Elixhauser A, Steiner C, Harris DR, Coffey RM. Comorbidity measures for use with administrative data. Med Care. 1998;36(1):8-27. PubMed
8. Centers for Medicare & Medicaid Services. Frequently asked questions (FAQs): Implementation and maintenance of CMS mortality measures for AMI & HF. 2007. https://www.cms.gov/Medicare/Quality-Initiatives-Patient-Assessment-Instruments/HospitalQualityInits/downloads/HospitalMortalityAboutAMI_HF.pdf. Accessed November 1, 2016.
9. Normand SL, Shahian DM. Statistical and Clinical Aspects of Hospital Outcomes Profiling. Stat Sci. 2007;22(2):206-226.
10. Rothberg MB, Pekow PS, Priya A, et al. Using highly detailed administrative data to predict pneumonia mortality. PLoS One. 2014;9(1):e87382. PubMed
11. Jones BE, Jones MM, Huttner B, et al. Trends in antibiotic use and nosocomial pathogens in hospitalized veterans with pneumonia at 128 medical centers, 2006-2010. Clin Infect Dis. 2015;61(9):1403-1410. PubMed
12. Attridge RT, Frei CR, Restrepo MI, et al. Guideline-concordant therapy and outcomes in healthcare-associated pneumonia. Eur Respir J. 2011;38(4):878-887. PubMed
13. Rothberg MB, Zilberberg MD, Pekow PS, et al. Association of Guideline-based Antimicrobial Therapy and Outcomes in Healthcare-Associated Pneumonia. J Antimicrob Chemother. 2015;70(5):1573-1579. PubMed
14. Kett DH, Cano E, Quartin AA, et al. Improving Medicine through Pathway Assessment of Critical Therapy of Hospital-Acquired Pneumonia (IMPACT-HAP) Investigators. Implementation of guidelines for management of possible multidrug-resistant pneumonia in intensive care: an observational, multicentre cohort study. Lancet Infect Dis. 2011;11(3):181-189. PubMed
15. El-Solh AA, Alhajhusain A, Saliba RG, Drinka P. Physicians’ Attitudes Toward Guidelines for the Treatment of Hospitalized Nursing-Home -Acquired Pneumonia. J Am Med Dir Assoc. 2011;12(4):270-276. PubMed
16. Tunis S, Hayward R, Wilson M, et al. Internists’ Attitudes about Clinical Practice Guidelines. Ann Intern Med. 1994;120(11):956-963. PubMed
17. Seymann GB, Di Francesco L, Sharpe B, et al. The HCAP Gap: Differences between Self-Reported Practice Patterns and Published Guidelines for Health Care-Associated Pneumonia. Clin Infect Dis. 2009;49(12):1868-1874. PubMed
18. Chalmers JD, Rother C, Salih W, Ewig S. Healthcare associated pneumonia does not accurately identify potentially resistant pathogens: a systematic review and meta-analysis. Clin Infect Dis. 2014;58(3):330-339. PubMed
19. Shorr A, Zilberberg MD, Reichley R, et al. Validation of a Clinical Score for Assessing the Risk of Resistant Pathogens in Patients with Pneumonia Presenting to the Emergency Department. Clin Infect Dis. 2012;54(2):193-198. PubMed
20. Aliberti S, Pasquale MD, Zanaboni AM, et al. Stratifying Risk Factors for Multidrug-Resistant Pathogens in Hospitalized Patients Coming from the Community with Pneumonia. Clin Infect Dis. 2012;54(4):470-478. PubMed
21. Schreiber MP, Chan CM, Shorr AF. Resistant Pathogens in Nonnosocomial Pneumonia and Respiratory Failure: Is it Time to Refine the Definition of Health-care-Associated Pneumonia? Chest. 2010;137(6):1283-1288. PubMed
22. Madaras-Kelly KJ, Remington RE, Fan VS, Sloan KL. Predicting antibiotic resistance to community-acquired pneumonia antibiotics in culture-positive patients with healthcare-associated pneumonia. J Hosp Med. 2012;7(3):195-202. PubMed
23. Shindo Y, Ito R, Kobayashi D, et al. Risk factors for drug-resistant pathogens in community-acquired and healthcare-associated pneumonia. Am J Respir Crit Care Med. 2013;188(8):985-995. PubMed
24. Metersky ML, Frei CR, Mortensen EM. Predictors of Pseudomonas and methicillin-resistant Staphylococcus aureus in hospitalized patients with healthcare-associated pneumonia. Respirology. 2016;21(1):157-163. PubMed
25. Webb BJ, Dascomb K, Stenehjem E, Dean N. Predicting risk of drug-resistant organisms in pneumonia: moving beyond the HCAP model. Respir Med. 2015;109(1):1-10. PubMed
© 2017 Society of Hospital Medicine
Quality of care of hospitalized infective endocarditis patients: Report from a tertiary medical center
Infective endocarditis (IE) affected an estimated 46,800 Americans in 2011, and its incidence is increasing due to greater numbers of invasive procedures and prevalence of IE risk factors.1-3 Despite recent advances in the treatment of IE, morbidity and mortality remain high: in-hospital mortality in IE patients is 15% to 20%, and the 1-year mortality rate is approximately 40%.2,4,5
Poor IE outcomes may be the result of difficulty in diagnosing IE and identifying its optimal treatments. The American Heart Association (AHA), the American College of Cardiology (ACC), and the European Society of Cardiology (ESC) have published guidelines to address these challenges. Recent guidelines recommend a multidisciplinary approach that includes cardiology, cardiac surgery, and infectious disease (ID) specialty involvement in decision-making.5,6
In the absence of published quality measures for IE management, guidelines can be used to evaluate the quality of care of IE. Studies have showed poor concordance with guideline recommendations but did not examine agreement with more recently published guidelines.7,8 Furthermore, few studies have examined the management, outcomes, and quality of care received by IE patients. Therefore, we aimed to describe a modern cohort of patients with IE admitted to a tertiary medical center over a 4-year period. In particular, we aimed to assess quality of care received by this cohort, as measured by concordance with AHA and ACC guidelines to identify gaps in care and spur quality improvement (QI) efforts.
METHODS
Design and Study Population
We conducted a retrospective cohort study of adult IE patients admitted to Baystate Medical Center (BMC), a 716-bed tertiary academic center that covers a population of 800,000 people throughout western New England. We used the International Classification of Diseases (ICD)–Ninth Revision, to identify IE patients discharged with a principal or secondary diagnosis of IE between 2007 and 2011 (codes 421.0, 421.1, 421.9, 424.9, 424.90, and 424.91). Three co-authors confirmed the diagnosis by conducting a review of the electronic health records.
We included only patients who met modified Duke criteria for definite or possible IE.5 Definite IE defines patients with pathological criteria (microorganisms demonstrated by culture or histologic examination or a histologic examination showing active endocarditis); or patients with 2 major criteria (positive blood culture and evidence of endocardial involvement by echocardiogram), 1 major criterion and 3 minor criteria (minor criteria: predisposing heart conditions or intravenous drug (IVD) use, fever, vascular phenomena, immunologic phenomena, and microbiologic evidence that do not meet the major criteria) or 5 minor criteria. Possible IE defines patients with 1 major and 1 minor criterion or 3 minor criteria.5
Data Collection
We used billing and clinical databases to collect demographics, comorbidities, antibiotic treatment, 6-month readmission and 1-year mortality. Comorbid conditions were classified into Elixhauser comorbidities using software provided by the Healthcare Costs and Utilization Project of the Agency for Healthcare Research and Quality.9,10
We obtained all other data through electronic health record abstraction. These included microbiology, type of endocarditis (native valve endocarditis [NVE] or prosthetic valve endocarditis [PVE]), echocardiographic location of the vegetation, and complications involving the valve (eg, valve perforation, ruptured chorda, perivalvular abscess, or valvular insufficiency).
Using 2006 AHA/ACC guidelines,11 we identified quality metrics, including the presence of at least 2 sets of blood cultures prior to start of antibiotics and use of transthoracic echocardiogram (TTE) and transesophageal echocardiogram (TEE). Guidelines recommend using TTE as first-line to detect valvular vegetations and assess IE complications. TEE is recommended if TTE is nondiagnostic and also as first-line to diagnose PVE. We assessed the rate of consultation with ID, cardiology, and cardiac surgery specialties. While these consultations were not explicitly emphasized in the 2006 AHA/ACC guidelines, there is a class I recommendation in 2014 AHA/ACC guidelines5 to manage IE patients with consultation of all these specialties.
We reported the number of patients with intracardiac leads (pacemaker or defibrillator) who had documentation of intracardiac lead removal. Complete removal of intracardiac leads is indicated in IE patients with infection of leads or device (class I) and suggested for IE caused by Staphylococcus aureus or fungi (even without evidence of device or lead infection), and for patients undergoing valve surgery (class IIa).5 We entered abstracted data elements into a RedCap database, hosted by Tufts Clinical and Translational Science Institute.12
Outcomes
Outcomes included embolic events, strokes, need for cardiac surgery, LOS, inhospital mortality, 6-month readmission, and 1-year mortality. We identified embolic events using documentation of clinical or imaging evidence of an embolic event to the cerebral, coronary, peripheral arterial, renal, splenic, or pulmonary vasculature. We used record extraction to identify incidence of valve surgery. Nearly all patients who require surgery at BMC have it done onsite. We compared outcomes among patients who received less than 3 vs. 3 consultations provided by ID, cardiology, and cardiac surgery specialties. We also compared outcomes among patients who received 0, 1, 2, or 3 consultations to look for a trend.
Statistical Analysis
We divided the cohort into patients with NVE and PVE because there are differences in pathophysiology, treatment, and outcomes of these groups. We calculated descriptive statistics, including means/standard deviation (SD) and n (%). We conducted univariable analyses using Fisher exact (categorical), unpaired t tests (Gaussian), or Kruskal-Wallis equality-of-populations rank test (non-Gaussian). Common language effect sizes were also calculated to quantify group differences without respect to sample size.13,14 Analyses were performed using Stata 14.1. (StataCorp LLC, College Station, Texas). The BMC Institutional Review Board approved the protocol.
RESULTS
We identified a total of 317 hospitalizations at BMC meeting criteria for IE. Of these, 147 hospitalizations were readmissions or did not meet the clinical criteria of definite or possible IE. Thus, we included a total of 170 patients in the final analysis. Definite IE was present in 135 (79.4%) and possible IE in 35 (20.6%) patients.
Patient Characteristics
Of 170 patients, 127 (74.7%) had NVE and 43 (25.3%) had PVE. Mean ± SD age was 60.0 ± 17.9 years, 66.5% (n = 113) of patients were male, and 79.4% (n = 135) were white (Table 1). Hypertension and chronic kidney disease were the most common comorbidities. The median Gagne score15 was 4, corresponding to a 1-year mortality risk of 15%. Predisposing factors for IE included previous history of IE (n = 14 or 8.2%), IVD use (n = 23 or 13.5%), and presence of long-term venous catheters (n = 19 or 11.2%). Intracardiac leads were present in 17.1% (n = 29) of patients. Bicuspid aortic valve was reported in 6.5% (n = 11) of patients with NVE. Patients with PVE were older (+11.5 years, 95% confidence interval [CI] 5.5, 17.5) and more likely to have intracardiac leads (44.2% vs. 7.9%; P < 0.001; Table 1).
Microbiology and Antibiotics
Staphylococcus aureus was isolated in 40.0% of patients (methicillin-sensitive: 21.2%, n = 36; methicillin-resistant: 18.8%, n = 32) and vancomycin (88.2%, n = 150) was the most common initial antibiotic used. Nearly half (44.7%, n = 76) of patients received gentamicin as part of their initial antibiotic regimen. Appendix 1 provides information on final blood culture results, prosthetic versus native valve IE, and antimicrobial agents that each patient received. PVE patients were more likely to receive gentamicin as their initial antibiotic regimen than NVE (58.1% vs. 40.2%; P = 0.051; Table 1).
Echocardiography and Affected Valves
As per study inclusion criteria, all patients received echocardiography (either TTE, TEE, or both). Overall, the most common infected valve was mitral (41.3%), n = 59), followed by aortic valve (28.7%), n = 41). Patients in whom the location of infected valve could not be determined (15.9%, n = 27) had echocardiographic features of intracardiac device infection or intracardiac mass (Table 1).
Quality of Care
Nearly all (n = 165, 97.1%) of patients had at least 2 sets of blood cultures drawn, most on the first day of admission (71.2%). The vast majority of patients (n = 152, 89.4%) also received their first dose of antibiotics on the day of admission. Ten (5.9%) patients did not receive any consults, and 160 (94.1%) received at least 1 consultation. An ID consultation was obtained for most (147, 86.5%) patients; cardiac surgery consultation was obtained for about half of patients (92, 54.1%), and cardiology consultation was also obtained for nearly half of patients (80, 47.1%). One-third (53, 31.2%) did not receive a cardiology or cardiac surgery consult, two-thirds (117, 68.8%) received either a cardiology or a cardiac surgery consult, and one-third (55, 32.4%) received both.
Of the 29 patients who had an intracardiac lead, 6 patients had documentation of the device removal during the index hospitalization (5 or 50.0% of patients with NVE and 1 or 5.3% of patients with PVE; P = 0.02; Table 2).

Outcomes
Evidence of any embolic events was seen in 27.7% (n = 47) of patients, including stroke in 17.1% (n = 29). Median LOS for all patients was 13.5 days, and 6-month readmission among patients who survived their index admission was 51.0% (n = 74/145; 95% CI, 45.9%-62.7%). Inhospital mortality was 14.7% (n = 25; 95% CI: 10.1%-20.9%) and 12-month mortality was 22.4% (n = 38; 95% CI, 16.7%-29.3%). Inhospital mortality was more frequent among patients with PVE than NVE (20.9% vs. 12.6%; P = 0.21), although this difference was not statistically significant. Complications were more common in NVE than PVE (any embolic event: 32.3% vs. 14.0%, P = 0.03; stroke, 20.5% vs. 7.0%, P = 0.06; Table 3).

Although there was a trend toward reduction in 6-month readmission and 12-month mortality with incremental increase in the number of specialties consulted (ID, cardiology and cardiac surgery), the difference was not statistically significant (Figure). In addition, comparing outcomes of embolic events, stroke, 6-month readmission, and 12-month mortality between those who received 3 consults (28.8%, n = 49) to those with fewer than 3 (71.2%, n = 121) did not show statistically significant differences.

Of 92 patients who received a cardiac surgery consult, 73 had NVE and 19 had PVE. Of these, 47 underwent valve surgery, 39 (of 73) with NVE (53.42%) and 8 (of 19) with PVE (42.1%). Most of the NVE patients (73.2%) had more than 1 indication for surgery. The most common indications for surgery among NVE patients were significant valvular dysfunction resulting in heart failure (65.9%), followed by mobile vegetation (56.1%) and recurrent embolic events (26.8%). The most common indication for surgery in PVE was persistent bacteremia or recurrent embolic events (75.0%).
DISCUSSION
In this study, we described the management, quality of care, and outcomes of IE patients in a tertiary medical center. We found that the majority of hospitalized patients with IE were older white men with comorbidities and IE risk factors. The complication rate was high (27.7% with embolic events) and the inhospital mortality rate was in the lower range reported by prior studies [14.7% vs. 15%-20%].5 Nearly one-third of patients (n = 47, 27.7%) received valve surgery. Quality of care received was generally good, with most patients receiving early blood cultures, echocardiograms, early antibiotics, and timely ID consultation. We identified important gaps in care, including a failure to consult cardiac surgery in nearly half of patients and failure to consult cardiology in more than half of patients.
Our findings support work suggesting that IE is no longer primarily a chronic or subacute disease of younger patients with IVD use, positive human immunodeficiency virus status, or bicuspid aortic valves.1,4,16,17 The International Collaboration on Endocarditis-Prospective Cohort Study,4 a multinational prospective cohort study (2000-2005) of 2781 adults with IE, reported a higher prevalence of patients with diabetes or on hemodialysis, IVD users, and patients with long-term venous catheter and intracardiac leads than we found. Yet both studies suggest that the demographics of IE are changing. This may partially explain why IE mortality has not improved in recent years:2,3 patients with older age and higher comorbidity burden may not be considered good surgical candidates.
This study is among the first to contribute information on concordance with IE guidelines in a cohort of U.S. patients. Our findings suggest that most patients received timely blood culture, same-day administration of empiric antibiotics, and ID consultation, which is similar to European studies.7,18 Guideline concordance could be improved in some areas. Overall documentation of the management plan regarding the intracardiac leads could be improved. Only 6 of 29 patients with intracardiac leads had documentation of their removal during the index hospitalization.
The 2014 AHA/ACC guidelines5 and the ESC guidelines6 emphasized the importance of multidisciplinary management of IE. As part of the Heart Valve Team at BMC, cardiologists provide expertise in diagnosis, imaging and clinical management of IE, and cardiac surgeons provide consultation on whether to pursue surgery and optimal timing of surgery. Early discussion with surgical team is considered mandatory in all complicated cases of IE.6,18 Infectious disease consultation has been shown to improve the rate of IE diagnosis, reduce the 6-month relapse rate,19 and improve outcomes in patients with S aureus bacteremia.20 In our study 86.5% of patients had documentation of an ID consultation; cardiac surgery consultation was obtained in 54.1% and cardiology consultation in 47.1% of patients.
We observed a trend towards lower rates of 6-month readmission and 12-month mortality among patients who received all 3 consults (Figure 1), despite the fact that rates of embolic events and stroke were higher in patients with 3 consults compared to those with fewer than 3. Obviously, the lack of confounder adjustment and lack of power limits our ability to make inferences about this association, but it generates hypotheses for future work. Because subjects in our study were cared for prior to 2014, multidisciplinary management of IE with involvement of cardiology, cardiac surgery, and ID physicians was observed in only one-third of patients. However, 117 (68.8%) patients received either cardiology or cardiac surgery consults. It is possible that some physicians considered involving both cardiology and cardiac surgery consultants as unnecessary and, therefore, did not consult both specialties. We will focus future QI efforts in our institution on educating physicians about the benefits of multidisciplinary care and the importance of fully implementing the 2014 AHA/ACC guidelines.
Our findings around quality of care should be placed in the context of 2 studies by González de Molina et al8 and Delahaye et al7 These studies described considerable discordance between guideline recommendations and real-world IE care. However, these studies were performed more than a decade ago and were conducted before current recommendations to consult cardiology and cardiac surgery were published.
In the 2014 AHA/ACC guidelines, surgery prior to completion of antibiotics is indicated in patients with valve dysfunction resulting in heart failure; left-sided IE caused by highly resistant organisms (including fungus or S aureus); IE complicated by heart block, aortic abscess, or penetrating lesions; and presence of persistent infection (bacteremia or fever lasting longer than 5 to 7 days) after onset of appropriate antimicrobial therapy. In addition, there is a Class IIa indication of early surgery in patients with recurrent emboli and persistent vegetation despite appropriate antibiotic therapy and a Class IIb indication of early surgery in patients with NVE with mobile vegetation greater than 10 mm in length. Surgery is recommended for patients with PVE and relapsing infection.
It is recommended that IE patients be cared for in centers with immediate access to cardiac surgery because the urgent need for surgical intervention can arise rapidly.5 We found that nearly one-third of included patients underwent surgery. Although we did not collect data on indications for surgery in patients who did not receive surgery, we observed that 50% had a surgery consult, suggesting the presence of 1 or more surgical indications. Of these, half underwent valve surgery. Most of the NVE patients who underwent surgery had more than 1 indication for surgery. Our surgical rate is similar to a study from Italy3 and overall in the lower range of reported surgical rate (25%-50%) from other studies.21 The low rate of surgery at our center may be related to the fact that the use of surgery for IE has been hotly debated in the literature,21 and may also be due to the low rate of cardiac surgery consultation.
Our study has several limitations. We identified eligible patients using a discharge ICD-9 coding of IE and then confirmed the presence of Duke criteria using record review. Using discharge diagnosis codes for endocarditis has been validated, and our additional manual chart review to confirm Duke criteria likely improved the specificity significantly. However, by excluding patients who did not have documented evidence of Duke criteria, we may have missed some cases, lowering sensitivity. The performance on selected quality metrics may also have been affected by our inclusion criteria. Because we included only patients who met Duke criteria, we tended to include patients who had received blood cultures and echocardiograms, which are part of the criteria. Thus, we cannot comment on use of diagnostic testing or specialty consultation in patients with suspected IE. This was a single-center study and may not represent patients or current practices seen in other institutions. We did not collect data on some of the predisposing factors to NVE (for example, baseline rheumatic heart disease or preexisting valvular heart disease) because it is estimated that less than 5% of IE in the U.S. is superimposed on rheumatic heart disease.4 We likely underestimated 12-month mortality rate because we did not cross-reference our findings again the National Death Index; however, this should not affect the comparison of this outcome between groups.
CONCLUSION
Our study confirms reports that IE epidemiology has changed significantly in recent years. It also suggests that concordance with guideline recommendations is good for some aspects of care (eg, echocardiogram, blood cultures), but can be improved in other areas, particularly in use of specialty consultation during the hospitalization. Future QI efforts should emphasize the role of the heart valve team or endocarditis team that consists of an internist, ID physician, cardiologist, cardiac surgeon, and nursing. Finally, efforts should be made to develop strategies for community hospitals that do not have access to all of these specialists (eg, early transfer, telehealth).
Disclosure
Nothing to report.
1. Pant S, Patel NJ, Deshmukh A, Golwala H, Patel N, Badheka A, et al. Trends in infective endocarditis incidence, microbiology, and valve replacement in the United States from 2000 to 2011. J Am Coll Cardiol. 2015;65(19):2070-2076. PubMed
2. Bor DH, Woolhandler S, Nardin R, Brusch J, Himmelstein DU. Infective endocarditis in the U.S., 1998-2009: a nationwide study. PloS One. 2013;8(3):e60033. PubMed
3. Fedeli U, Schievano E, Buonfrate D, Pellizzer G, Spolaore P. Increasing incidence and mortality of infective endocarditis: a population-based study through a record-linkage system. BMC Infect Dis. 2011;11:48. PubMed
4. Murdoch DR, Corey GR, Hoen B, Miró JM, Fowler VG, Bayer AS, et al. Clinical presentation, etiology, and outcome of infective endocarditis in the 21st century: the International Collaboration on Endocarditis-Prospective Cohort Study. Arch Intern Med. 2009;169(5):463-473. PubMed
5. Nishimura RA, Otto CM, Bonow RO, Carabello BA, Erwin JP, Guyton RA, et al. 2014 AHA/ACC guideline for the management of patients with valvular heart disease: executive summary: a report of the American College of Cardiology/American Heart Association Task Force on Practice Guidelines. J Am Coll Cardiol. 2014;63(22):2438-2488. PubMed
6. Habib G, Lancellotti P, Antunes MJ, Bongiorni MG, Casalta J-P, Del Zotti F, et al. 2015 ESC Guidelines for the management of infective endocarditis: The Task Force for the Management of Infective Endocarditis of the European Society of Cardiology (ESC). Endorsed by: European Association for Cardio-Thoracic Surgery (EACTS), the European Association of Nuclear Medicine (EANM). Eur Heart J. 2015;36(44):3075-3128. PubMed
7. Delahaye F, Rial MO, de Gevigney G, Ecochard R, Delaye J. A critical appraisal of the quality of the management of infective endocarditis. J Am Coll Cardiol. 1999;33(3):788-793. PubMed
8. González De Molina M, Fernández-Guerrero JC, Azpitarte J. [Infectious endocarditis: degree of discordance between clinical guidelines recommendations and clinical practice]. Rev Esp Cardiol. 2002;55(8):793-800. PubMed
9. Elixhauser A, Steiner C, Harris DR, Coffey RM. Comorbidity measures for use with administrative data. Med Care. 1998;36(1):8-27. PubMed
10. Quan H, Parsons GA, Ghali WA. Validity of information on comorbidity derived rom ICD-9-CCM administrative data. Med Care. 2002;40(8):675-685. PubMed
11. American College of Cardiology/American Heart Association Task Force on Practice Guidelines, Society of Cardiovascular Anesthesiologists, Society for Cardiovascular Angiography and Interventions, Society of Thoracic Surgeons, Bonow RO, Carabello BA, Kanu C, deLeon AC Jr, Faxon DP, Freed MD, et al. ACC/AHA 2006 guidelines for the management of patients with valvular heart disease: a report of the American College of Cardiology/American Heart Association Task Force on Practice Guidelines (writing committee to revise the 1998 Guidelines for the Management of Patients With Valvular Heart Disease): developed in collaboration with the Society of Cardiovascular Anesthesiologists: endorsed by the Society for Cardiovascular Angiography and Interventions and the Society of Thoracic Surgeons. Circulation. 2006;114(5):e84-e231.
12. REDCap [Internet]. [cited 2016 May 14]. Available from: https://collaborate.tuftsctsi.org/redcap/.
13. McGraw KO, Wong SP. A common language effect-size statistic. Psychol Bull. 1992;111:361-365.
14. Cohen J. The statistical power of abnormal-social psychological research: a review. J Abnorm Soc Psychol. 1962;65:145-153. PubMed
15. Gagne JJ, Glynn RJ, Avorn J, Levin R, Schneeweiss S. A combined comorbidity score predicted mortality in elderly patients better than existing scores. J Clin Epidemiol. 2011;64(7):749-759. PubMed
16. Baddour LM, Wilson WR, Bayer AS, Fowler VG Jr, Tleyjeh IM, Rybak MJ, et al. Infective endocarditis in adults: Diagnosis, antimicrobial therapy, and management of complications: A scientific statement for healthcare professionals from the American Heart Association. Circulation. 2015;132(15):1435-1486. PubMed
17. Cecchi E, Chirillo F, Castiglione A, Faggiano P, Cecconi M, Moreo A, et al. Clinical epidemiology in Italian Registry of Infective Endocarditis (RIEI): Focus on age, intravascular devices and enterococci. Int J Cardiol. 2015;190:151-156. PubMed
18. Tornos P, Iung B, Permanyer-Miralda G, Baron G, Delahaye F, Gohlke-Bärwolf Ch, et al. Infective endocarditis in Europe: lessons from the Euro heart survey. Heart. 2005;91(5):571-575. PubMed
19. Yamamoto S, Hosokawa N, Sogi M, Inakaku M, Imoto K, Ohji G, et al. Impact of infectious diseases service consultation on diagnosis of infective endocarditis. Scand J Infect Dis. 2012;44(4):270-275. PubMed
20. Rieg S, Küpper MF. Infectious diseases consultations can make the difference: a brief review and a plea for more infectious diseases specialists in Germany. Infection. 2016;(2):159-166. PubMed
21. Prendergast BD, Tornos P. Surgery for infective endocarditis: who and when? Circulation. 2010;121(9):11411152. PubMed
Infective endocarditis (IE) affected an estimated 46,800 Americans in 2011, and its incidence is increasing due to greater numbers of invasive procedures and prevalence of IE risk factors.1-3 Despite recent advances in the treatment of IE, morbidity and mortality remain high: in-hospital mortality in IE patients is 15% to 20%, and the 1-year mortality rate is approximately 40%.2,4,5
Poor IE outcomes may be the result of difficulty in diagnosing IE and identifying its optimal treatments. The American Heart Association (AHA), the American College of Cardiology (ACC), and the European Society of Cardiology (ESC) have published guidelines to address these challenges. Recent guidelines recommend a multidisciplinary approach that includes cardiology, cardiac surgery, and infectious disease (ID) specialty involvement in decision-making.5,6
In the absence of published quality measures for IE management, guidelines can be used to evaluate the quality of care of IE. Studies have showed poor concordance with guideline recommendations but did not examine agreement with more recently published guidelines.7,8 Furthermore, few studies have examined the management, outcomes, and quality of care received by IE patients. Therefore, we aimed to describe a modern cohort of patients with IE admitted to a tertiary medical center over a 4-year period. In particular, we aimed to assess quality of care received by this cohort, as measured by concordance with AHA and ACC guidelines to identify gaps in care and spur quality improvement (QI) efforts.
METHODS
Design and Study Population
We conducted a retrospective cohort study of adult IE patients admitted to Baystate Medical Center (BMC), a 716-bed tertiary academic center that covers a population of 800,000 people throughout western New England. We used the International Classification of Diseases (ICD)–Ninth Revision, to identify IE patients discharged with a principal or secondary diagnosis of IE between 2007 and 2011 (codes 421.0, 421.1, 421.9, 424.9, 424.90, and 424.91). Three co-authors confirmed the diagnosis by conducting a review of the electronic health records.
We included only patients who met modified Duke criteria for definite or possible IE.5 Definite IE defines patients with pathological criteria (microorganisms demonstrated by culture or histologic examination or a histologic examination showing active endocarditis); or patients with 2 major criteria (positive blood culture and evidence of endocardial involvement by echocardiogram), 1 major criterion and 3 minor criteria (minor criteria: predisposing heart conditions or intravenous drug (IVD) use, fever, vascular phenomena, immunologic phenomena, and microbiologic evidence that do not meet the major criteria) or 5 minor criteria. Possible IE defines patients with 1 major and 1 minor criterion or 3 minor criteria.5
Data Collection
We used billing and clinical databases to collect demographics, comorbidities, antibiotic treatment, 6-month readmission and 1-year mortality. Comorbid conditions were classified into Elixhauser comorbidities using software provided by the Healthcare Costs and Utilization Project of the Agency for Healthcare Research and Quality.9,10
We obtained all other data through electronic health record abstraction. These included microbiology, type of endocarditis (native valve endocarditis [NVE] or prosthetic valve endocarditis [PVE]), echocardiographic location of the vegetation, and complications involving the valve (eg, valve perforation, ruptured chorda, perivalvular abscess, or valvular insufficiency).
Using 2006 AHA/ACC guidelines,11 we identified quality metrics, including the presence of at least 2 sets of blood cultures prior to start of antibiotics and use of transthoracic echocardiogram (TTE) and transesophageal echocardiogram (TEE). Guidelines recommend using TTE as first-line to detect valvular vegetations and assess IE complications. TEE is recommended if TTE is nondiagnostic and also as first-line to diagnose PVE. We assessed the rate of consultation with ID, cardiology, and cardiac surgery specialties. While these consultations were not explicitly emphasized in the 2006 AHA/ACC guidelines, there is a class I recommendation in 2014 AHA/ACC guidelines5 to manage IE patients with consultation of all these specialties.
We reported the number of patients with intracardiac leads (pacemaker or defibrillator) who had documentation of intracardiac lead removal. Complete removal of intracardiac leads is indicated in IE patients with infection of leads or device (class I) and suggested for IE caused by Staphylococcus aureus or fungi (even without evidence of device or lead infection), and for patients undergoing valve surgery (class IIa).5 We entered abstracted data elements into a RedCap database, hosted by Tufts Clinical and Translational Science Institute.12
Outcomes
Outcomes included embolic events, strokes, need for cardiac surgery, LOS, inhospital mortality, 6-month readmission, and 1-year mortality. We identified embolic events using documentation of clinical or imaging evidence of an embolic event to the cerebral, coronary, peripheral arterial, renal, splenic, or pulmonary vasculature. We used record extraction to identify incidence of valve surgery. Nearly all patients who require surgery at BMC have it done onsite. We compared outcomes among patients who received less than 3 vs. 3 consultations provided by ID, cardiology, and cardiac surgery specialties. We also compared outcomes among patients who received 0, 1, 2, or 3 consultations to look for a trend.
Statistical Analysis
We divided the cohort into patients with NVE and PVE because there are differences in pathophysiology, treatment, and outcomes of these groups. We calculated descriptive statistics, including means/standard deviation (SD) and n (%). We conducted univariable analyses using Fisher exact (categorical), unpaired t tests (Gaussian), or Kruskal-Wallis equality-of-populations rank test (non-Gaussian). Common language effect sizes were also calculated to quantify group differences without respect to sample size.13,14 Analyses were performed using Stata 14.1. (StataCorp LLC, College Station, Texas). The BMC Institutional Review Board approved the protocol.
RESULTS
We identified a total of 317 hospitalizations at BMC meeting criteria for IE. Of these, 147 hospitalizations were readmissions or did not meet the clinical criteria of definite or possible IE. Thus, we included a total of 170 patients in the final analysis. Definite IE was present in 135 (79.4%) and possible IE in 35 (20.6%) patients.
Patient Characteristics
Of 170 patients, 127 (74.7%) had NVE and 43 (25.3%) had PVE. Mean ± SD age was 60.0 ± 17.9 years, 66.5% (n = 113) of patients were male, and 79.4% (n = 135) were white (Table 1). Hypertension and chronic kidney disease were the most common comorbidities. The median Gagne score15 was 4, corresponding to a 1-year mortality risk of 15%. Predisposing factors for IE included previous history of IE (n = 14 or 8.2%), IVD use (n = 23 or 13.5%), and presence of long-term venous catheters (n = 19 or 11.2%). Intracardiac leads were present in 17.1% (n = 29) of patients. Bicuspid aortic valve was reported in 6.5% (n = 11) of patients with NVE. Patients with PVE were older (+11.5 years, 95% confidence interval [CI] 5.5, 17.5) and more likely to have intracardiac leads (44.2% vs. 7.9%; P < 0.001; Table 1).
Microbiology and Antibiotics
Staphylococcus aureus was isolated in 40.0% of patients (methicillin-sensitive: 21.2%, n = 36; methicillin-resistant: 18.8%, n = 32) and vancomycin (88.2%, n = 150) was the most common initial antibiotic used. Nearly half (44.7%, n = 76) of patients received gentamicin as part of their initial antibiotic regimen. Appendix 1 provides information on final blood culture results, prosthetic versus native valve IE, and antimicrobial agents that each patient received. PVE patients were more likely to receive gentamicin as their initial antibiotic regimen than NVE (58.1% vs. 40.2%; P = 0.051; Table 1).
Echocardiography and Affected Valves
As per study inclusion criteria, all patients received echocardiography (either TTE, TEE, or both). Overall, the most common infected valve was mitral (41.3%), n = 59), followed by aortic valve (28.7%), n = 41). Patients in whom the location of infected valve could not be determined (15.9%, n = 27) had echocardiographic features of intracardiac device infection or intracardiac mass (Table 1).
Quality of Care
Nearly all (n = 165, 97.1%) of patients had at least 2 sets of blood cultures drawn, most on the first day of admission (71.2%). The vast majority of patients (n = 152, 89.4%) also received their first dose of antibiotics on the day of admission. Ten (5.9%) patients did not receive any consults, and 160 (94.1%) received at least 1 consultation. An ID consultation was obtained for most (147, 86.5%) patients; cardiac surgery consultation was obtained for about half of patients (92, 54.1%), and cardiology consultation was also obtained for nearly half of patients (80, 47.1%). One-third (53, 31.2%) did not receive a cardiology or cardiac surgery consult, two-thirds (117, 68.8%) received either a cardiology or a cardiac surgery consult, and one-third (55, 32.4%) received both.
Of the 29 patients who had an intracardiac lead, 6 patients had documentation of the device removal during the index hospitalization (5 or 50.0% of patients with NVE and 1 or 5.3% of patients with PVE; P = 0.02; Table 2).
Outcomes
Evidence of any embolic events was seen in 27.7% (n = 47) of patients, including stroke in 17.1% (n = 29). Median LOS for all patients was 13.5 days, and 6-month readmission among patients who survived their index admission was 51.0% (n = 74/145; 95% CI, 45.9%-62.7%). Inhospital mortality was 14.7% (n = 25; 95% CI: 10.1%-20.9%) and 12-month mortality was 22.4% (n = 38; 95% CI, 16.7%-29.3%). Inhospital mortality was more frequent among patients with PVE than NVE (20.9% vs. 12.6%; P = 0.21), although this difference was not statistically significant. Complications were more common in NVE than PVE (any embolic event: 32.3% vs. 14.0%, P = 0.03; stroke, 20.5% vs. 7.0%, P = 0.06; Table 3).
Although there was a trend toward reduction in 6-month readmission and 12-month mortality with incremental increase in the number of specialties consulted (ID, cardiology and cardiac surgery), the difference was not statistically significant (Figure). In addition, comparing outcomes of embolic events, stroke, 6-month readmission, and 12-month mortality between those who received 3 consults (28.8%, n = 49) to those with fewer than 3 (71.2%, n = 121) did not show statistically significant differences.
Of 92 patients who received a cardiac surgery consult, 73 had NVE and 19 had PVE. Of these, 47 underwent valve surgery, 39 (of 73) with NVE (53.42%) and 8 (of 19) with PVE (42.1%). Most of the NVE patients (73.2%) had more than 1 indication for surgery. The most common indications for surgery among NVE patients were significant valvular dysfunction resulting in heart failure (65.9%), followed by mobile vegetation (56.1%) and recurrent embolic events (26.8%). The most common indication for surgery in PVE was persistent bacteremia or recurrent embolic events (75.0%).
DISCUSSION
In this study, we described the management, quality of care, and outcomes of IE patients in a tertiary medical center. We found that the majority of hospitalized patients with IE were older white men with comorbidities and IE risk factors. The complication rate was high (27.7% with embolic events) and the inhospital mortality rate was in the lower range reported by prior studies [14.7% vs. 15%-20%].5 Nearly one-third of patients (n = 47, 27.7%) received valve surgery. Quality of care received was generally good, with most patients receiving early blood cultures, echocardiograms, early antibiotics, and timely ID consultation. We identified important gaps in care, including a failure to consult cardiac surgery in nearly half of patients and failure to consult cardiology in more than half of patients.
Our findings support work suggesting that IE is no longer primarily a chronic or subacute disease of younger patients with IVD use, positive human immunodeficiency virus status, or bicuspid aortic valves.1,4,16,17 The International Collaboration on Endocarditis-Prospective Cohort Study,4 a multinational prospective cohort study (2000-2005) of 2781 adults with IE, reported a higher prevalence of patients with diabetes or on hemodialysis, IVD users, and patients with long-term venous catheter and intracardiac leads than we found. Yet both studies suggest that the demographics of IE are changing. This may partially explain why IE mortality has not improved in recent years:2,3 patients with older age and higher comorbidity burden may not be considered good surgical candidates.
This study is among the first to contribute information on concordance with IE guidelines in a cohort of U.S. patients. Our findings suggest that most patients received timely blood culture, same-day administration of empiric antibiotics, and ID consultation, which is similar to European studies.7,18 Guideline concordance could be improved in some areas. Overall documentation of the management plan regarding the intracardiac leads could be improved. Only 6 of 29 patients with intracardiac leads had documentation of their removal during the index hospitalization.
The 2014 AHA/ACC guidelines5 and the ESC guidelines6 emphasized the importance of multidisciplinary management of IE. As part of the Heart Valve Team at BMC, cardiologists provide expertise in diagnosis, imaging and clinical management of IE, and cardiac surgeons provide consultation on whether to pursue surgery and optimal timing of surgery. Early discussion with surgical team is considered mandatory in all complicated cases of IE.6,18 Infectious disease consultation has been shown to improve the rate of IE diagnosis, reduce the 6-month relapse rate,19 and improve outcomes in patients with S aureus bacteremia.20 In our study 86.5% of patients had documentation of an ID consultation; cardiac surgery consultation was obtained in 54.1% and cardiology consultation in 47.1% of patients.
We observed a trend towards lower rates of 6-month readmission and 12-month mortality among patients who received all 3 consults (Figure 1), despite the fact that rates of embolic events and stroke were higher in patients with 3 consults compared to those with fewer than 3. Obviously, the lack of confounder adjustment and lack of power limits our ability to make inferences about this association, but it generates hypotheses for future work. Because subjects in our study were cared for prior to 2014, multidisciplinary management of IE with involvement of cardiology, cardiac surgery, and ID physicians was observed in only one-third of patients. However, 117 (68.8%) patients received either cardiology or cardiac surgery consults. It is possible that some physicians considered involving both cardiology and cardiac surgery consultants as unnecessary and, therefore, did not consult both specialties. We will focus future QI efforts in our institution on educating physicians about the benefits of multidisciplinary care and the importance of fully implementing the 2014 AHA/ACC guidelines.
Our findings around quality of care should be placed in the context of 2 studies by González de Molina et al8 and Delahaye et al7 These studies described considerable discordance between guideline recommendations and real-world IE care. However, these studies were performed more than a decade ago and were conducted before current recommendations to consult cardiology and cardiac surgery were published.
In the 2014 AHA/ACC guidelines, surgery prior to completion of antibiotics is indicated in patients with valve dysfunction resulting in heart failure; left-sided IE caused by highly resistant organisms (including fungus or S aureus); IE complicated by heart block, aortic abscess, or penetrating lesions; and presence of persistent infection (bacteremia or fever lasting longer than 5 to 7 days) after onset of appropriate antimicrobial therapy. In addition, there is a Class IIa indication of early surgery in patients with recurrent emboli and persistent vegetation despite appropriate antibiotic therapy and a Class IIb indication of early surgery in patients with NVE with mobile vegetation greater than 10 mm in length. Surgery is recommended for patients with PVE and relapsing infection.
It is recommended that IE patients be cared for in centers with immediate access to cardiac surgery because the urgent need for surgical intervention can arise rapidly.5 We found that nearly one-third of included patients underwent surgery. Although we did not collect data on indications for surgery in patients who did not receive surgery, we observed that 50% had a surgery consult, suggesting the presence of 1 or more surgical indications. Of these, half underwent valve surgery. Most of the NVE patients who underwent surgery had more than 1 indication for surgery. Our surgical rate is similar to a study from Italy3 and overall in the lower range of reported surgical rate (25%-50%) from other studies.21 The low rate of surgery at our center may be related to the fact that the use of surgery for IE has been hotly debated in the literature,21 and may also be due to the low rate of cardiac surgery consultation.
Our study has several limitations. We identified eligible patients using a discharge ICD-9 coding of IE and then confirmed the presence of Duke criteria using record review. Using discharge diagnosis codes for endocarditis has been validated, and our additional manual chart review to confirm Duke criteria likely improved the specificity significantly. However, by excluding patients who did not have documented evidence of Duke criteria, we may have missed some cases, lowering sensitivity. The performance on selected quality metrics may also have been affected by our inclusion criteria. Because we included only patients who met Duke criteria, we tended to include patients who had received blood cultures and echocardiograms, which are part of the criteria. Thus, we cannot comment on use of diagnostic testing or specialty consultation in patients with suspected IE. This was a single-center study and may not represent patients or current practices seen in other institutions. We did not collect data on some of the predisposing factors to NVE (for example, baseline rheumatic heart disease or preexisting valvular heart disease) because it is estimated that less than 5% of IE in the U.S. is superimposed on rheumatic heart disease.4 We likely underestimated 12-month mortality rate because we did not cross-reference our findings again the National Death Index; however, this should not affect the comparison of this outcome between groups.
CONCLUSION
Our study confirms reports that IE epidemiology has changed significantly in recent years. It also suggests that concordance with guideline recommendations is good for some aspects of care (eg, echocardiogram, blood cultures), but can be improved in other areas, particularly in use of specialty consultation during the hospitalization. Future QI efforts should emphasize the role of the heart valve team or endocarditis team that consists of an internist, ID physician, cardiologist, cardiac surgeon, and nursing. Finally, efforts should be made to develop strategies for community hospitals that do not have access to all of these specialists (eg, early transfer, telehealth).
Disclosure
Nothing to report.
1. Pant S, Patel NJ, Deshmukh A, Golwala H, Patel N, Badheka A, et al. Trends in infective endocarditis incidence, microbiology, and valve replacement in the United States from 2000 to 2011. J Am Coll Cardiol. 2015;65(19):2070-2076. PubMed
2. Bor DH, Woolhandler S, Nardin R, Brusch J, Himmelstein DU. Infective endocarditis in the U.S., 1998-2009: a nationwide study. PloS One. 2013;8(3):e60033. PubMed
3. Fedeli U, Schievano E, Buonfrate D, Pellizzer G, Spolaore P. Increasing incidence and mortality of infective endocarditis: a population-based study through a record-linkage system. BMC Infect Dis. 2011;11:48. PubMed
4. Murdoch DR, Corey GR, Hoen B, Miró JM, Fowler VG, Bayer AS, et al. Clinical presentation, etiology, and outcome of infective endocarditis in the 21st century: the International Collaboration on Endocarditis-Prospective Cohort Study. Arch Intern Med. 2009;169(5):463-473. PubMed
5. Nishimura RA, Otto CM, Bonow RO, Carabello BA, Erwin JP, Guyton RA, et al. 2014 AHA/ACC guideline for the management of patients with valvular heart disease: executive summary: a report of the American College of Cardiology/American Heart Association Task Force on Practice Guidelines. J Am Coll Cardiol. 2014;63(22):2438-2488. PubMed
6. Habib G, Lancellotti P, Antunes MJ, Bongiorni MG, Casalta J-P, Del Zotti F, et al. 2015 ESC Guidelines for the management of infective endocarditis: The Task Force for the Management of Infective Endocarditis of the European Society of Cardiology (ESC). Endorsed by: European Association for Cardio-Thoracic Surgery (EACTS), the European Association of Nuclear Medicine (EANM). Eur Heart J. 2015;36(44):3075-3128. PubMed
7. Delahaye F, Rial MO, de Gevigney G, Ecochard R, Delaye J. A critical appraisal of the quality of the management of infective endocarditis. J Am Coll Cardiol. 1999;33(3):788-793. PubMed
8. González De Molina M, Fernández-Guerrero JC, Azpitarte J. [Infectious endocarditis: degree of discordance between clinical guidelines recommendations and clinical practice]. Rev Esp Cardiol. 2002;55(8):793-800. PubMed
9. Elixhauser A, Steiner C, Harris DR, Coffey RM. Comorbidity measures for use with administrative data. Med Care. 1998;36(1):8-27. PubMed
10. Quan H, Parsons GA, Ghali WA. Validity of information on comorbidity derived rom ICD-9-CCM administrative data. Med Care. 2002;40(8):675-685. PubMed
11. American College of Cardiology/American Heart Association Task Force on Practice Guidelines, Society of Cardiovascular Anesthesiologists, Society for Cardiovascular Angiography and Interventions, Society of Thoracic Surgeons, Bonow RO, Carabello BA, Kanu C, deLeon AC Jr, Faxon DP, Freed MD, et al. ACC/AHA 2006 guidelines for the management of patients with valvular heart disease: a report of the American College of Cardiology/American Heart Association Task Force on Practice Guidelines (writing committee to revise the 1998 Guidelines for the Management of Patients With Valvular Heart Disease): developed in collaboration with the Society of Cardiovascular Anesthesiologists: endorsed by the Society for Cardiovascular Angiography and Interventions and the Society of Thoracic Surgeons. Circulation. 2006;114(5):e84-e231.
12. REDCap [Internet]. [cited 2016 May 14]. Available from: https://collaborate.tuftsctsi.org/redcap/.
13. McGraw KO, Wong SP. A common language effect-size statistic. Psychol Bull. 1992;111:361-365.
14. Cohen J. The statistical power of abnormal-social psychological research: a review. J Abnorm Soc Psychol. 1962;65:145-153. PubMed
15. Gagne JJ, Glynn RJ, Avorn J, Levin R, Schneeweiss S. A combined comorbidity score predicted mortality in elderly patients better than existing scores. J Clin Epidemiol. 2011;64(7):749-759. PubMed
16. Baddour LM, Wilson WR, Bayer AS, Fowler VG Jr, Tleyjeh IM, Rybak MJ, et al. Infective endocarditis in adults: Diagnosis, antimicrobial therapy, and management of complications: A scientific statement for healthcare professionals from the American Heart Association. Circulation. 2015;132(15):1435-1486. PubMed
17. Cecchi E, Chirillo F, Castiglione A, Faggiano P, Cecconi M, Moreo A, et al. Clinical epidemiology in Italian Registry of Infective Endocarditis (RIEI): Focus on age, intravascular devices and enterococci. Int J Cardiol. 2015;190:151-156. PubMed
18. Tornos P, Iung B, Permanyer-Miralda G, Baron G, Delahaye F, Gohlke-Bärwolf Ch, et al. Infective endocarditis in Europe: lessons from the Euro heart survey. Heart. 2005;91(5):571-575. PubMed
19. Yamamoto S, Hosokawa N, Sogi M, Inakaku M, Imoto K, Ohji G, et al. Impact of infectious diseases service consultation on diagnosis of infective endocarditis. Scand J Infect Dis. 2012;44(4):270-275. PubMed
20. Rieg S, Küpper MF. Infectious diseases consultations can make the difference: a brief review and a plea for more infectious diseases specialists in Germany. Infection. 2016;(2):159-166. PubMed
21. Prendergast BD, Tornos P. Surgery for infective endocarditis: who and when? Circulation. 2010;121(9):11411152. PubMed
© 2017 Society of Hospital Medicine
Long‐term Antipsychotics in Elders
Delirium, a clinical syndrome characterized by inattention and acute cognitive dysfunction, is very common in older hospitalized patients, with a reported incidence of 18% to 35% at time of admission and overall occurrence rates of 29% to 64%.[1] Previous studies have reported that a diagnosis of delirium is not benign and is associated with other adverse outcomes including prolonged hospitalization, institutionalization, increased cost, and mortality. These outcomes occurred independent of age, prior cognitive functioning, and comorbidities.[2] Guidelines recommend that management of inpatient delirium should be focused on addressing the underlying etiology and managed with nonpharmacological interventions whenever possible.[3, 4, 5] However, implementing these recommendations can prove to be very challenging in hospital settings. Providers frequently have to resort to medical therapies, including antipsychotics (APs). Although these medications are commonly used to treat delirium in elderly patients, there is limited evidence to support their efficacy, and there are currently no proven pharmacological alternatives to these medications.[6] Furthermore, previous studies have demonstrated an increased risk of stroke, infection, cognitive impairment, and mortality in elders with dementia who receive long‐term AP therapy.[7, 8, 9] Yet as many as 48% of hospitalized elders who were newly started on APs had these drugs continued at time of discharge.[10]
There have been few studies describing the long‐term outcomes of elderly patient who are started on APs in the hospital. Most information on outcomes comes from patients with dementia. Therefore, we studied the 1‐year outcomes of a cohort of patients with and without dementia who were started on APs in the hospital and then discharged on these medications. In this cohort, we aimed to describe the number of readmissions, reasons for readmissions, duration of AP therapy, use of other sedating medications such as anxiolytics, hypnotics, and antihistamines as well as the incidence of readmission and death 1 year after the index hospital discharge.
METHODS
We previously described a retrospective cohort of 300 elders (65 years old) admitted to a tertiary care hospital between October 1, 2012 and September 31, 2013 who were newly prescribed APs while hospitalized.[10] Of patients alive at the time of discharge (260), 56% (146 patients) were discharged on APs. Two investigators extracted these 148 patient charts independently to identify and quantify the number of readmissions to the index hospital. We then limited the sample to only the first readmission per patient following the index admission and extracted this readmission for each patient. We first determined if APs were present on the admission medication reconciliation. If APs were not present on admission, we examined whether they were resumed during the hospitalization using the electronic medication administration summary. If they were present on admission, we looked to see if they were discontinued during the readmission and if additional new APs were started during the hospitalizations. We documented the circumstances around APs use and identified patients who died during their hospitalizations. We identified delirium using the same terms that were described in our prior study on the same cohort of patients.[10] We determined if patients were delirious using a predetermined algorithm (Figure 1). Briefly, we first determined delirium was documented. We then examined whether there was a Confusion Assessment Method (CAM) instrument included in the record. If a CAM instrument was not documented, we then looked for documentation using specific terms (eg, disorientation, confusions). We identified patients with dementia by determining whether dementia was documented along with other admission medical comorbidities. If it was not, we determined whether dementia was newly diagnosed during the hospital stay using progress notes or consultation notes. We did not objectively define criteria for diagnosis of dementia. We used the National Death Index (NDI) to determine mortality for all patients 1 year after discharge from the index hospitalization. The NDI is a national database of death records maintained by the National Center for Health Statistics. It has shown consistently high sensitivity and specificity for detection of death.[11]

We used descriptive statistics (means, standard deviations, range, and percents as appropriate to the scale of measurement) to describe the patient sample. We then used multiple logistic regression to identify significant predictors of death within 1 year of discharge.[12] Univariate analysis was used to select candidates for the logistic model (t tests for continuous factors and 2 for discrete factors). All factors with a significance level <0.2 on univariate analysis were included in the logistic regression, in addition to age and sex (regardless of significance). A maximum likelihood procedure was used to calculate the regression coefficients for the logistic model. The likelihood ratio criterion was used to determine the significance of individual factors in the regression model.[13] Factors with a significance level of 0.15 or less were retained in the final model, in addition to age and sex.
RESULTS
The 260 patients discharged alive from their index admissions had a 1‐year mortality rate of 29% (75/260). Of the 146/260 patients discharged on APs, 60 (41%) patients experienced at least 1 readmission (mean = 2 readmissions per patient; range, 18, with 111 total readmissions for 60 patients) within 1 year from discharge (Figure 2). Most common diagnoses at the time of readmissions were related neurological and psychiatric disorders (14%), cardiovascular and circulation disorders (13%), renal injury and electrolyte disorders (11%), and infections (6%). Among patients with at least 1 readmission, the mean age was 81.3 (range, 65.599.7), 60% were male, and 45% were admitted from a skilled nursing facility or rehabilitation facility (Table 1). Median time to readmission was 43.5 days (range, 1343 days), and 79% were readmitted to a medical service. The remaining 20% were admitted to a surgical service. Inpatient mortality during first readmissions was 8% (5/60). At the time of first readmission, 39/60 (65%) of patients were still on the same APs on which they had been discharged, and the APs were continued during the hospitalization in 79% of the patients (61% quetiapine, 19% olanzapine, and 13% risperidone). About half of patients whose APs were discontinued prior to readmission received a new AP during their hospital stays (9/20; 45%). One patient had been started on quetiapine in the outpatient setting. No patients were found to have new benzodiazepines, nonbenzodiazepine hypnotic, or antihistamines on their admission medication list.
| Variables | Value* |
|---|---|
| |
| Age, mean (range), yr | 81.3 (65.599.7) |
| Gender, no. (%) | |
| Male | 36 (60) |
| Female | 24 (40) |
| Admitted from, no. (%) | |
| Home | 33 (55) |
| Rehabilitation facilities | 5 (8) |
| SNF | 22 (37) |
| Services, no. (%) | |
| Medicine | 48 (80) |
| Surgery | 12 (20) |
| Types of APs continued on readmission (from index admission), no. (%) | |
| Quetiapine | 19 (61) |
| Olanzapine | 6 (19) |
| Risperidone | 4 (13) |
| Haloperidol | 2 (7) |
| Types of APs started during readmission, no. (%) | |
| Quetiapine | 7 (39) |
| Risperidone | 2 (11) |
| Haloperidol | 16 (89) |
| Indications for AP use, no. (%) | |
| Delirium | 14 (77) |
| Undocumented | 3 (17) |
| Other | 1 (6) |
| ECG, no. (%) | |
| Prior to APs administration | 17 (94) |
| After APs administration | 4 (22) |
| QTc prolongation >500 ms, no. (%) | |
| Prior to APs administration | 3 (18) |
| After APs administration∥ | 2 (50) |
| Discharge destination, no. (%) | |
| Home | 23 (38) |
| Rehabilitation facilities | 4 (7) |
| SNF | 28 (47) |
| Death | 5 (8) |
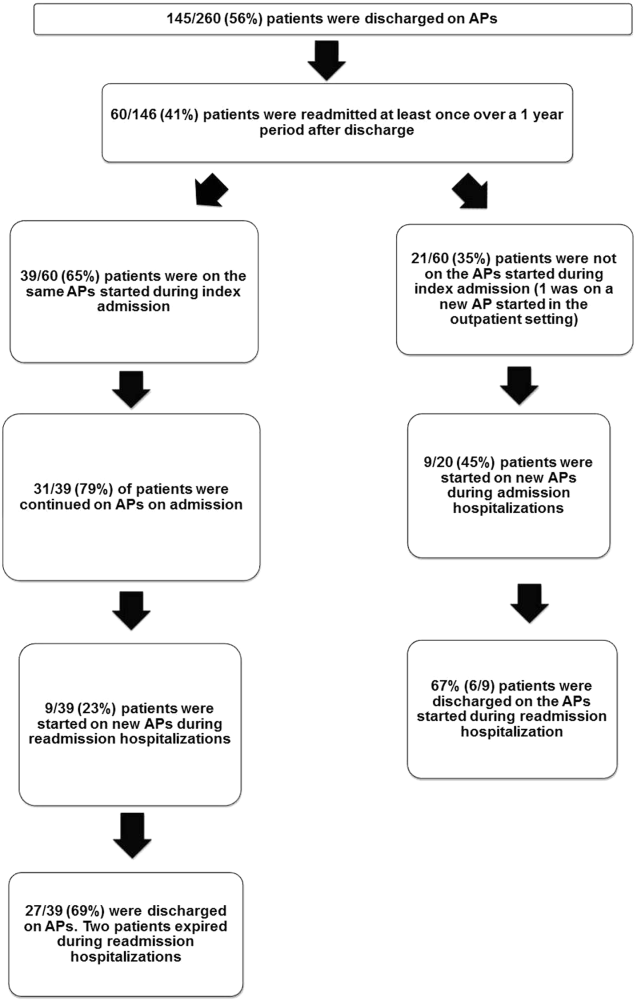
Eighteen patients received 1 or more new APs during the readmission hospitalizations. These included haloperidol (89%) and quetiapine (39%). Delirium was the main reported indication for starting APs (78%), but in 17% of cases no indication was documented. An electrocardiogram (ECG) was performed in 94% prior to APs administration and for 22% after APs administration. Corrected QT interval (QTc) of >500 ms was present in 18% of patients in pretreatment ECG and 50% of patients in post‐AP ECG. Of patients who survived readmission, 58% (32/55) were discharged to postacute facilities. Of the 39 patients who were on the same APs from index admission, 27 (69%) patients were eventually discharged on the same APs or new APs started during the readmission.
In the multivariable model (Table 2), predictors of death at 1 year included discharge to postacute facilities after index admission (odds ratio [OR]: 2.28; 95% confidence interval [CI]: 1.10‐4.73, P = 0.03) and QTc prolongation >500 ms during index admission (OR: 3.41; 95% CI: 1.34‐8.67, P = 0.01). Age and gender were not associated with 1‐year mortality.
| Odds Ratio | 95% Confidence Interval | P Value | |
|---|---|---|---|
| |||
| Age | 1.03 | 0.991.06 | 0.13 |
| Male sex | 0.87 | 0.501.52 | 0.63 |
| Risperdal | 3.53 | 0.6419.40 | 0.15 |
| QTc prolongation after AP administration* | 3.41 | 1.348.67 | 0.01 |
| Presence of geriatric psychiatry consult | 0.30 | 0.091.04 | 0.06 |
| Discharged to postacute facilities vs home | 2.28 | 1.104.73 | 0.03 |
DISCUSSION
In a cohort of elderly patients who were discharged on APs, nearly one‐third (29%) died within 1 year of the hospitalization in which APs were initiated. Nearly half of the survivors from the index admission (41%) experienced at least 1 admission within 1 year from discharge. Of readmitted patients, two‐thirds were taking the same APs that had been started during the index hospitalization. Half of the patients not on APs on readmission were started on an AP during the hospitalization, most often because they became delirious on return to the acute care setting. Compared to patients discharged home after an index admission, patients who were discharged to postacute facilities were almost 4 times as likely to die during the year subsequent to the admission. These data suggest that once patients are started on APs, most are continued on them until the next admission or are restarted during that readmission. Moreover, hospitalized elders who require an AP are at high risk for mortality in the coming year.
Prior studies have reported that patients with delirium have elevated 1‐year mortality rates.[14, 15, 16, 17, 18, 19] A secondary analysis of the Delirium Prevention Trial, which included 437 hospitalized older patients, revealed a 1‐year mortality rate of 20% in those who were never delirious during hospitalization, compared to 26% to 38% in patients with delirium.[19] Additionally, 1‐year mortality in hospitalized older patients with delirium (36%) was shown to be higher than patients with dementia (29%) or depression (26%).[17] Unlike these studies, not all of the patients in our study had documented delirium, but all received an AP. Still, it is notable that the 1‐year mortality rate for delirium in general is similar to what we found in this study.
The literature has also reported that long‐term AP use is associated with excess mortality in elder patients, especially those with dementia.[20, 21, 22] In a retrospective cohort study, older patients with dementia who were taking antipsychotics had significantly higher 1‐year mortality rates (23%29%) than patients not taking antipsychotic medications (15%). In a large Canadian propensity score‐matched cohort study that included over 13,000 demented older adults, the mortality was higher in the community‐dwelling elders who received atypical APs compared to no APs, with a difference of 1.1% in 180‐day mortality rate after initiation of APs.[21] The absolute mortality rate was 2.6% higher in patients who received typical compared to atypical APs. Unlike these studies, not every patient in our cohort had a diagnosis of dementia, but again, mortality rates in these studies appear similar to our cohort.
In contrast, other observational studies have not found an increased risk associated with receipt of APs. For example, a prospective study that enrolled approximately 950 patients with probable dementia showed that AP use was not associated with time to death after adjustment for comorbidities, demographic and cognitive variables.[23] These conflicting results highlight the difficulties of attributing outcomes in high‐risk populations. Although the excess mortality observed in patients taking APs may be related to the risks of APs, it is quite possible that patients who require APs (most often for delirium or agitated dementia) are at higher risk of death. This confounding by indication may be nearly impossible to adjust for retrospectively, even using techniques such as propensity matching.
Our report adds to the literature; we know of no studies to date describing a cohort of patients, most with delirium, who were started on APs in the hospital. We also attempted to identify the reasons that patients were started on APs, which have been infrequently reported. As noted above, our 1‐year mortality rate of 29% among older patients prescribed APs in the hospital was quite similar to mortality rates both for patients with delirium who were not necessarily treated with APs and patients with dementia who were treated with APs. This finding further supports the argument that risk factors for mortality, including dementia, delirium, and AP use are very difficult to tease apart. It is possible that the reasons that APs are prescribed (agitated delirium or dementia) have as much to do with the excess mortality reported in observational studies of APs as the use of APs themselves.
The high rate of continued AP use we observed (two‐thirds of readmitted patients) may reflect limited pharmacological alternatives to these medications with little evidence to support treating the symptoms of delirium with other drug classes, along with suboptimal environmental and behavioral modifications in postacute facilities and hospitals. This is unfortunate given that delirium is often preventable. Systematic implementation of well‐documented strategies to decrease delirium in hospitals and postacute facilities would likely reduce the prescription of APs and has the potential to slow the decline in this vulnerable population. A meta‐analysis incorporating both randomized and nonrandomized trials of medical and surgical patients showed that multicomponent nonpharmacologic interventions decreased delirium by 50%.[24] Thus, simple interventions such as reorientation, early mobilization, optimizing vision and hearing, sleepwake cycle preservation, and hydration might avoid roughly 1 million cases of delirium in hospitalized older adults annually.[24] The Hospital Elder Life Program and Acute Care for Elders units are examples of programs that have been shown to decrease the incidence of delirium.[25, 26]
Despite vigorous efforts to prevent delirium, a subgroup of patients still will become delirious. These patients are at high risk for death. Our mortality prediction model revealed that patients who were discharged to postacute facilities were 4 times more likely to die during the subsequent year compared to patients who were discharged home. Patients discharged to postacute facilities are likely to have a higher burden of disease, greater functional and cognitive impairment, and more frailty than those who are able to return to the community. Very ill and/or frail patients receiving APs in the hospital and requiring APs on discharge to postacute care facilities have limited survival and may benefit from expedited palliative care interventions to clarify prognosis and goals, and relieve suffering. At a minimum, our study identifies a need for further study to identify this very high‐risk group of elders. It is notable that 50% of patients were found to have a post‐treatment ECG with a QTc of >500 ms, a finding that has not been previously described. This would put these patients at higher risk of mortality, and as such we suggest that current guidelines should continue to emphasize the importance of post‐treatment ECGs and set clear criteria for discontinuation in elderly patients.
Our study is limited by its retrospective, single‐center design and small sample size, therefore limiting the interpretation and generalizability of the results to other hospitals. Quetiapine was the most common AP medication used in our hospital; therefore, our findings cannot be generalized to hospitals that utilize other AP agents. Future studies should examine antipsychotic use across hospitals to determine variation in prescribing patterns and outcomes. Nevertheless, the care of these patients were transitioned to a large number of geriatricians and primary care and nursing home physicians after discharge, and the reflected practice patterns extended beyond our hospital. Additionally, we were unable to determine when and why APs were discontinued or started in the outpatient setting. We were only able to detect readmissions to the 3 hospitals within our health system and therefore may have missed some readmissions to other institutions, although the majority of patients in our region tend to return to the same hospital. For patients who were not readmitted, we were also unable to identify whether they remained on the APs initiated during their index hospitalizations. Any retrospective study is limited by the difficulty of distinguishing delirium from the behavioral and psychiatric symptoms of dementia, but we identified delirium using standard terms described in previous literature.[10] We were unable to determine the types of delirium (hyperactive vs hypoactive) given that the documentations on behavioral symptoms were largely missing from the charts. The number of patients with preexisting diagnosis of dementia was likely underestimated, as we were only able to verify the diagnosis from the medical history. Additionally, the retrospective design based on chart review limited the factors that we could detect and grade accurately for inclusion in our mortality prediction model. Of note, our model did not contain objective measures of cognition, agitation, function, and markers for frailty such as walking speed, weak grip strength, weight loss, and low physical activity.
CONCLUSION
Initiating an AP (eg, haloperidol, quetiapine, olanzapine, and risperidone) in the hospital is likely to result in long‐term use of these medications despite the fact that AP use has been associated with multiple risks including falls, fractures, stroke, cardiovascular disease, and increased mortality in those with underlying dementia.[27] When possible, behavioral interventions to prevent delirium and slow the trajectory of decline should be implemented to reduce AP use. If patients with delirium are started on antipsychotics, it is important to monitor for prolonged QTc given the associated risk of mortality. In a subgroup of patients at high risk for death in the upcoming year, occurrence of delirium or use of APs during a hospitalization should both be considered triggers for early advance care planning and possibly palliative care and end‐of‐life discussions, with an emphasis on quality of life.
Disclosures: The research was supported by the Department of Medicine, Baystate Medical Center/Tufts University School of Medicine. Dr. Lagu is supported by the National Heart, Lung, and Blood Institute of the National Institutes of Health under award number K01HL114745. Drs. Lagu and Loh had full access to all of the data in the study. They take responsibility for the integrity of the data and the accuracy of the analysis. Drs. Loh, Brennan, Lindenauer, and Lagu conceived of the study. Drs. Loh, Ramdass, and Ms. Garb acquired the data. Ms Garb analyzed and interpreted the data. Drs. Loh, Ramdass, and Thim drafted the manuscript. Drs. Brennan, Lindenauer, and Lagu and Ms. Garb critically reviewed the manuscript for important intellectual content. Dr. Lagu has received consulting fees from the Institute for Healthcare Improvement, under contract to the Centers for Medicare and Medicaid Services, for her work on a project to help health systems achieve disability competence. Dr. Brennan is supported by a Geriatric Work Force Enhancement Grant from the US Department of Health and Human Services award number 1 U1QHP287020100. The authors report no conflicts of interest.
- , , . Delirium in elderly people. Lancet. 2014;383:911–922.
- , , , et al. Adverse outcomes after hospitalization and delirium in persons with Alzheimer disease. Ann Intern Med. 2012;156:848–856, W296.
- American Geriatrics Society Expert Panel on Postoperative Delirium in Older Adults. American Geriatrics Society abstracted clinical practice guideline for postoperative delirium in older adults. J Am Geriatr Soc. 2015;63:142–150.
- Practice guideline for the treatment of patients with delirium. American Psychiatric Association. Am J Psychiatry. 1999;156:1–20.
- , ; Guideline Development Group. The prevention, diagnosis and management of delirium in older people: concise guidelines. Clin Med (Lond). 2006;6:303–308.
- , , . Antipsychotics in the treatment of delirium: a systematic review. J Clin Psychiatry. 2007;68:11–21.
- , , , et al. Antipsychotics, other psychotropics, and the risk of death in patients with dementia: number needed to harm. JAMA Psychiatry. 2015;72:438–445.
- , . Safety and efficacy of antipsychotic drugs for the behavioral and psychological symptoms of dementia. Indian J Psychiatry. 2009;51(suppl 1):S87–S92.
- , , , . Use and safety of antipsychotics in behavioral disorders in elderly people with dementia. J Clin Psychopharmacol. 2014;34:109–123.
- , , , , , . From hospital to community: use of antipsychotics in hospitalized elders. J Hosp Med. 2014;9:802–804.
- , , . Comparison of National Death Index and World Wide Web Death Searches. Am J Epidemiol. 2000;152:107–111.
- . Analysis of Binary Data. London, United Kingdom: Methuen; 1970:76–99.
- . Statistical Methods for Survival Data Analysis. New York, NY: John Wiley 1992:233–236.
- , , , . The risk of adverse outcomes in hospitalized older patients in relation to a frailty index based on a comprehensive geriatric assessment. Age Ageing. 2014;43:127–132.
- , , , et al. Risk factors for delirium and inpatient mortality with delirium. J Postgrad Med. 2013;59:263–270.
- , , , , , . Comprehensive geriatric assessment predicts mortality and adverse outcomes in hospitalized older adults. BMC Geriatr. 2014;14:129.
- , , , , , . One‐year mortality of elderly inpatients with delirium, dementia, or depression seen by a consultation‐liaison service. Psychosomatics. 2012;53:433–438.
- , , , . Excess mortality in general hospital patients with delirium: a 5‐year follow‐up of 519 patients seen in psychiatric consultation. J Psychosom Res. 1994;38:339–346.
- , , , et al. Older adults discharged from the hospital with delirium: 1‐year outcomes. J Am Geriatr Soc. 2006;54:1245–1250.
- , , , et al. The dementia antipsychotic withdrawal trial (DART‐AD): long‐term follow‐up of a randomised placebo‐controlled trial. Lancet Neurol. 2009;8:151–157.
- , , , et al. Antipsychotic drug use and mortality in older adults with dementia. Ann Intern Med. 2007;146:775–786.
- , , , et al. Risk of death in elderly users of conventional vs. atypical antipsychotic medications. N Engl J Med. 2005;353:2335–2341.
- , , , et al. The long‐term effects of conventional and atypical antipsychotics in patients with probable Alzheimer's disease. Am J Psychiatry. 2013;170:1051–1058.
- , , , et al. Effectiveness of multicomponent nonpharmacological delirium interventions: a meta‐analysis. JAMA Intern Med. 2015;175:512–520.
- , , , , . Sustainability and scalability of the hospital elder life program at a community hospital. J Am Geriatr Soc. 2011;59:359–365.
- , , , et al. Effectiveness of acute geriatric unit care using acute care for elders components: a systematic review and meta‐analysis. J Am Geriatr Soc. 2012;60:2237–2245.
- , . Adverse effects of antipsychotic medications. Am Fam Physician. 2010;81:617–622.
Delirium, a clinical syndrome characterized by inattention and acute cognitive dysfunction, is very common in older hospitalized patients, with a reported incidence of 18% to 35% at time of admission and overall occurrence rates of 29% to 64%.[1] Previous studies have reported that a diagnosis of delirium is not benign and is associated with other adverse outcomes including prolonged hospitalization, institutionalization, increased cost, and mortality. These outcomes occurred independent of age, prior cognitive functioning, and comorbidities.[2] Guidelines recommend that management of inpatient delirium should be focused on addressing the underlying etiology and managed with nonpharmacological interventions whenever possible.[3, 4, 5] However, implementing these recommendations can prove to be very challenging in hospital settings. Providers frequently have to resort to medical therapies, including antipsychotics (APs). Although these medications are commonly used to treat delirium in elderly patients, there is limited evidence to support their efficacy, and there are currently no proven pharmacological alternatives to these medications.[6] Furthermore, previous studies have demonstrated an increased risk of stroke, infection, cognitive impairment, and mortality in elders with dementia who receive long‐term AP therapy.[7, 8, 9] Yet as many as 48% of hospitalized elders who were newly started on APs had these drugs continued at time of discharge.[10]
There have been few studies describing the long‐term outcomes of elderly patient who are started on APs in the hospital. Most information on outcomes comes from patients with dementia. Therefore, we studied the 1‐year outcomes of a cohort of patients with and without dementia who were started on APs in the hospital and then discharged on these medications. In this cohort, we aimed to describe the number of readmissions, reasons for readmissions, duration of AP therapy, use of other sedating medications such as anxiolytics, hypnotics, and antihistamines as well as the incidence of readmission and death 1 year after the index hospital discharge.
METHODS
We previously described a retrospective cohort of 300 elders (65 years old) admitted to a tertiary care hospital between October 1, 2012 and September 31, 2013 who were newly prescribed APs while hospitalized.[10] Of patients alive at the time of discharge (260), 56% (146 patients) were discharged on APs. Two investigators extracted these 148 patient charts independently to identify and quantify the number of readmissions to the index hospital. We then limited the sample to only the first readmission per patient following the index admission and extracted this readmission for each patient. We first determined if APs were present on the admission medication reconciliation. If APs were not present on admission, we examined whether they were resumed during the hospitalization using the electronic medication administration summary. If they were present on admission, we looked to see if they were discontinued during the readmission and if additional new APs were started during the hospitalizations. We documented the circumstances around APs use and identified patients who died during their hospitalizations. We identified delirium using the same terms that were described in our prior study on the same cohort of patients.[10] We determined if patients were delirious using a predetermined algorithm (Figure 1). Briefly, we first determined delirium was documented. We then examined whether there was a Confusion Assessment Method (CAM) instrument included in the record. If a CAM instrument was not documented, we then looked for documentation using specific terms (eg, disorientation, confusions). We identified patients with dementia by determining whether dementia was documented along with other admission medical comorbidities. If it was not, we determined whether dementia was newly diagnosed during the hospital stay using progress notes or consultation notes. We did not objectively define criteria for diagnosis of dementia. We used the National Death Index (NDI) to determine mortality for all patients 1 year after discharge from the index hospitalization. The NDI is a national database of death records maintained by the National Center for Health Statistics. It has shown consistently high sensitivity and specificity for detection of death.[11]
We used descriptive statistics (means, standard deviations, range, and percents as appropriate to the scale of measurement) to describe the patient sample. We then used multiple logistic regression to identify significant predictors of death within 1 year of discharge.[12] Univariate analysis was used to select candidates for the logistic model (t tests for continuous factors and 2 for discrete factors). All factors with a significance level <0.2 on univariate analysis were included in the logistic regression, in addition to age and sex (regardless of significance). A maximum likelihood procedure was used to calculate the regression coefficients for the logistic model. The likelihood ratio criterion was used to determine the significance of individual factors in the regression model.[13] Factors with a significance level of 0.15 or less were retained in the final model, in addition to age and sex.
RESULTS
The 260 patients discharged alive from their index admissions had a 1‐year mortality rate of 29% (75/260). Of the 146/260 patients discharged on APs, 60 (41%) patients experienced at least 1 readmission (mean = 2 readmissions per patient; range, 18, with 111 total readmissions for 60 patients) within 1 year from discharge (Figure 2). Most common diagnoses at the time of readmissions were related neurological and psychiatric disorders (14%), cardiovascular and circulation disorders (13%), renal injury and electrolyte disorders (11%), and infections (6%). Among patients with at least 1 readmission, the mean age was 81.3 (range, 65.599.7), 60% were male, and 45% were admitted from a skilled nursing facility or rehabilitation facility (Table 1). Median time to readmission was 43.5 days (range, 1343 days), and 79% were readmitted to a medical service. The remaining 20% were admitted to a surgical service. Inpatient mortality during first readmissions was 8% (5/60). At the time of first readmission, 39/60 (65%) of patients were still on the same APs on which they had been discharged, and the APs were continued during the hospitalization in 79% of the patients (61% quetiapine, 19% olanzapine, and 13% risperidone). About half of patients whose APs were discontinued prior to readmission received a new AP during their hospital stays (9/20; 45%). One patient had been started on quetiapine in the outpatient setting. No patients were found to have new benzodiazepines, nonbenzodiazepine hypnotic, or antihistamines on their admission medication list.
| Variables | Value* |
|---|---|
| |
| Age, mean (range), yr | 81.3 (65.599.7) |
| Gender, no. (%) | |
| Male | 36 (60) |
| Female | 24 (40) |
| Admitted from, no. (%) | |
| Home | 33 (55) |
| Rehabilitation facilities | 5 (8) |
| SNF | 22 (37) |
| Services, no. (%) | |
| Medicine | 48 (80) |
| Surgery | 12 (20) |
| Types of APs continued on readmission (from index admission), no. (%) | |
| Quetiapine | 19 (61) |
| Olanzapine | 6 (19) |
| Risperidone | 4 (13) |
| Haloperidol | 2 (7) |
| Types of APs started during readmission, no. (%) | |
| Quetiapine | 7 (39) |
| Risperidone | 2 (11) |
| Haloperidol | 16 (89) |
| Indications for AP use, no. (%) | |
| Delirium | 14 (77) |
| Undocumented | 3 (17) |
| Other | 1 (6) |
| ECG, no. (%) | |
| Prior to APs administration | 17 (94) |
| After APs administration | 4 (22) |
| QTc prolongation >500 ms, no. (%) | |
| Prior to APs administration | 3 (18) |
| After APs administration∥ | 2 (50) |
| Discharge destination, no. (%) | |
| Home | 23 (38) |
| Rehabilitation facilities | 4 (7) |
| SNF | 28 (47) |
| Death | 5 (8) |
Eighteen patients received 1 or more new APs during the readmission hospitalizations. These included haloperidol (89%) and quetiapine (39%). Delirium was the main reported indication for starting APs (78%), but in 17% of cases no indication was documented. An electrocardiogram (ECG) was performed in 94% prior to APs administration and for 22% after APs administration. Corrected QT interval (QTc) of >500 ms was present in 18% of patients in pretreatment ECG and 50% of patients in post‐AP ECG. Of patients who survived readmission, 58% (32/55) were discharged to postacute facilities. Of the 39 patients who were on the same APs from index admission, 27 (69%) patients were eventually discharged on the same APs or new APs started during the readmission.
In the multivariable model (Table 2), predictors of death at 1 year included discharge to postacute facilities after index admission (odds ratio [OR]: 2.28; 95% confidence interval [CI]: 1.10‐4.73, P = 0.03) and QTc prolongation >500 ms during index admission (OR: 3.41; 95% CI: 1.34‐8.67, P = 0.01). Age and gender were not associated with 1‐year mortality.
| Odds Ratio | 95% Confidence Interval | P Value | |
|---|---|---|---|
| |||
| Age | 1.03 | 0.991.06 | 0.13 |
| Male sex | 0.87 | 0.501.52 | 0.63 |
| Risperdal | 3.53 | 0.6419.40 | 0.15 |
| QTc prolongation after AP administration* | 3.41 | 1.348.67 | 0.01 |
| Presence of geriatric psychiatry consult | 0.30 | 0.091.04 | 0.06 |
| Discharged to postacute facilities vs home | 2.28 | 1.104.73 | 0.03 |
DISCUSSION
In a cohort of elderly patients who were discharged on APs, nearly one‐third (29%) died within 1 year of the hospitalization in which APs were initiated. Nearly half of the survivors from the index admission (41%) experienced at least 1 admission within 1 year from discharge. Of readmitted patients, two‐thirds were taking the same APs that had been started during the index hospitalization. Half of the patients not on APs on readmission were started on an AP during the hospitalization, most often because they became delirious on return to the acute care setting. Compared to patients discharged home after an index admission, patients who were discharged to postacute facilities were almost 4 times as likely to die during the year subsequent to the admission. These data suggest that once patients are started on APs, most are continued on them until the next admission or are restarted during that readmission. Moreover, hospitalized elders who require an AP are at high risk for mortality in the coming year.
Prior studies have reported that patients with delirium have elevated 1‐year mortality rates.[14, 15, 16, 17, 18, 19] A secondary analysis of the Delirium Prevention Trial, which included 437 hospitalized older patients, revealed a 1‐year mortality rate of 20% in those who were never delirious during hospitalization, compared to 26% to 38% in patients with delirium.[19] Additionally, 1‐year mortality in hospitalized older patients with delirium (36%) was shown to be higher than patients with dementia (29%) or depression (26%).[17] Unlike these studies, not all of the patients in our study had documented delirium, but all received an AP. Still, it is notable that the 1‐year mortality rate for delirium in general is similar to what we found in this study.
The literature has also reported that long‐term AP use is associated with excess mortality in elder patients, especially those with dementia.[20, 21, 22] In a retrospective cohort study, older patients with dementia who were taking antipsychotics had significantly higher 1‐year mortality rates (23%29%) than patients not taking antipsychotic medications (15%). In a large Canadian propensity score‐matched cohort study that included over 13,000 demented older adults, the mortality was higher in the community‐dwelling elders who received atypical APs compared to no APs, with a difference of 1.1% in 180‐day mortality rate after initiation of APs.[21] The absolute mortality rate was 2.6% higher in patients who received typical compared to atypical APs. Unlike these studies, not every patient in our cohort had a diagnosis of dementia, but again, mortality rates in these studies appear similar to our cohort.
In contrast, other observational studies have not found an increased risk associated with receipt of APs. For example, a prospective study that enrolled approximately 950 patients with probable dementia showed that AP use was not associated with time to death after adjustment for comorbidities, demographic and cognitive variables.[23] These conflicting results highlight the difficulties of attributing outcomes in high‐risk populations. Although the excess mortality observed in patients taking APs may be related to the risks of APs, it is quite possible that patients who require APs (most often for delirium or agitated dementia) are at higher risk of death. This confounding by indication may be nearly impossible to adjust for retrospectively, even using techniques such as propensity matching.
Our report adds to the literature; we know of no studies to date describing a cohort of patients, most with delirium, who were started on APs in the hospital. We also attempted to identify the reasons that patients were started on APs, which have been infrequently reported. As noted above, our 1‐year mortality rate of 29% among older patients prescribed APs in the hospital was quite similar to mortality rates both for patients with delirium who were not necessarily treated with APs and patients with dementia who were treated with APs. This finding further supports the argument that risk factors for mortality, including dementia, delirium, and AP use are very difficult to tease apart. It is possible that the reasons that APs are prescribed (agitated delirium or dementia) have as much to do with the excess mortality reported in observational studies of APs as the use of APs themselves.
The high rate of continued AP use we observed (two‐thirds of readmitted patients) may reflect limited pharmacological alternatives to these medications with little evidence to support treating the symptoms of delirium with other drug classes, along with suboptimal environmental and behavioral modifications in postacute facilities and hospitals. This is unfortunate given that delirium is often preventable. Systematic implementation of well‐documented strategies to decrease delirium in hospitals and postacute facilities would likely reduce the prescription of APs and has the potential to slow the decline in this vulnerable population. A meta‐analysis incorporating both randomized and nonrandomized trials of medical and surgical patients showed that multicomponent nonpharmacologic interventions decreased delirium by 50%.[24] Thus, simple interventions such as reorientation, early mobilization, optimizing vision and hearing, sleepwake cycle preservation, and hydration might avoid roughly 1 million cases of delirium in hospitalized older adults annually.[24] The Hospital Elder Life Program and Acute Care for Elders units are examples of programs that have been shown to decrease the incidence of delirium.[25, 26]
Despite vigorous efforts to prevent delirium, a subgroup of patients still will become delirious. These patients are at high risk for death. Our mortality prediction model revealed that patients who were discharged to postacute facilities were 4 times more likely to die during the subsequent year compared to patients who were discharged home. Patients discharged to postacute facilities are likely to have a higher burden of disease, greater functional and cognitive impairment, and more frailty than those who are able to return to the community. Very ill and/or frail patients receiving APs in the hospital and requiring APs on discharge to postacute care facilities have limited survival and may benefit from expedited palliative care interventions to clarify prognosis and goals, and relieve suffering. At a minimum, our study identifies a need for further study to identify this very high‐risk group of elders. It is notable that 50% of patients were found to have a post‐treatment ECG with a QTc of >500 ms, a finding that has not been previously described. This would put these patients at higher risk of mortality, and as such we suggest that current guidelines should continue to emphasize the importance of post‐treatment ECGs and set clear criteria for discontinuation in elderly patients.
Our study is limited by its retrospective, single‐center design and small sample size, therefore limiting the interpretation and generalizability of the results to other hospitals. Quetiapine was the most common AP medication used in our hospital; therefore, our findings cannot be generalized to hospitals that utilize other AP agents. Future studies should examine antipsychotic use across hospitals to determine variation in prescribing patterns and outcomes. Nevertheless, the care of these patients were transitioned to a large number of geriatricians and primary care and nursing home physicians after discharge, and the reflected practice patterns extended beyond our hospital. Additionally, we were unable to determine when and why APs were discontinued or started in the outpatient setting. We were only able to detect readmissions to the 3 hospitals within our health system and therefore may have missed some readmissions to other institutions, although the majority of patients in our region tend to return to the same hospital. For patients who were not readmitted, we were also unable to identify whether they remained on the APs initiated during their index hospitalizations. Any retrospective study is limited by the difficulty of distinguishing delirium from the behavioral and psychiatric symptoms of dementia, but we identified delirium using standard terms described in previous literature.[10] We were unable to determine the types of delirium (hyperactive vs hypoactive) given that the documentations on behavioral symptoms were largely missing from the charts. The number of patients with preexisting diagnosis of dementia was likely underestimated, as we were only able to verify the diagnosis from the medical history. Additionally, the retrospective design based on chart review limited the factors that we could detect and grade accurately for inclusion in our mortality prediction model. Of note, our model did not contain objective measures of cognition, agitation, function, and markers for frailty such as walking speed, weak grip strength, weight loss, and low physical activity.
CONCLUSION
Initiating an AP (eg, haloperidol, quetiapine, olanzapine, and risperidone) in the hospital is likely to result in long‐term use of these medications despite the fact that AP use has been associated with multiple risks including falls, fractures, stroke, cardiovascular disease, and increased mortality in those with underlying dementia.[27] When possible, behavioral interventions to prevent delirium and slow the trajectory of decline should be implemented to reduce AP use. If patients with delirium are started on antipsychotics, it is important to monitor for prolonged QTc given the associated risk of mortality. In a subgroup of patients at high risk for death in the upcoming year, occurrence of delirium or use of APs during a hospitalization should both be considered triggers for early advance care planning and possibly palliative care and end‐of‐life discussions, with an emphasis on quality of life.
Disclosures: The research was supported by the Department of Medicine, Baystate Medical Center/Tufts University School of Medicine. Dr. Lagu is supported by the National Heart, Lung, and Blood Institute of the National Institutes of Health under award number K01HL114745. Drs. Lagu and Loh had full access to all of the data in the study. They take responsibility for the integrity of the data and the accuracy of the analysis. Drs. Loh, Brennan, Lindenauer, and Lagu conceived of the study. Drs. Loh, Ramdass, and Ms. Garb acquired the data. Ms Garb analyzed and interpreted the data. Drs. Loh, Ramdass, and Thim drafted the manuscript. Drs. Brennan, Lindenauer, and Lagu and Ms. Garb critically reviewed the manuscript for important intellectual content. Dr. Lagu has received consulting fees from the Institute for Healthcare Improvement, under contract to the Centers for Medicare and Medicaid Services, for her work on a project to help health systems achieve disability competence. Dr. Brennan is supported by a Geriatric Work Force Enhancement Grant from the US Department of Health and Human Services award number 1 U1QHP287020100. The authors report no conflicts of interest.
- , , . Delirium in elderly people. Lancet. 2014;383:911–922.
- , , , et al. Adverse outcomes after hospitalization and delirium in persons with Alzheimer disease. Ann Intern Med. 2012;156:848–856, W296.
- American Geriatrics Society Expert Panel on Postoperative Delirium in Older Adults. American Geriatrics Society abstracted clinical practice guideline for postoperative delirium in older adults. J Am Geriatr Soc. 2015;63:142–150.
- Practice guideline for the treatment of patients with delirium. American Psychiatric Association. Am J Psychiatry. 1999;156:1–20.
- , ; Guideline Development Group. The prevention, diagnosis and management of delirium in older people: concise guidelines. Clin Med (Lond). 2006;6:303–308.
- , , . Antipsychotics in the treatment of delirium: a systematic review. J Clin Psychiatry. 2007;68:11–21.
- , , , et al. Antipsychotics, other psychotropics, and the risk of death in patients with dementia: number needed to harm. JAMA Psychiatry. 2015;72:438–445.
- , . Safety and efficacy of antipsychotic drugs for the behavioral and psychological symptoms of dementia. Indian J Psychiatry. 2009;51(suppl 1):S87–S92.
- , , , . Use and safety of antipsychotics in behavioral disorders in elderly people with dementia. J Clin Psychopharmacol. 2014;34:109–123.
- , , , , , . From hospital to community: use of antipsychotics in hospitalized elders. J Hosp Med. 2014;9:802–804.
- , , . Comparison of National Death Index and World Wide Web Death Searches. Am J Epidemiol. 2000;152:107–111.
- . Analysis of Binary Data. London, United Kingdom: Methuen; 1970:76–99.
- . Statistical Methods for Survival Data Analysis. New York, NY: John Wiley 1992:233–236.
- , , , . The risk of adverse outcomes in hospitalized older patients in relation to a frailty index based on a comprehensive geriatric assessment. Age Ageing. 2014;43:127–132.
- , , , et al. Risk factors for delirium and inpatient mortality with delirium. J Postgrad Med. 2013;59:263–270.
- , , , , , . Comprehensive geriatric assessment predicts mortality and adverse outcomes in hospitalized older adults. BMC Geriatr. 2014;14:129.
- , , , , , . One‐year mortality of elderly inpatients with delirium, dementia, or depression seen by a consultation‐liaison service. Psychosomatics. 2012;53:433–438.
- , , , . Excess mortality in general hospital patients with delirium: a 5‐year follow‐up of 519 patients seen in psychiatric consultation. J Psychosom Res. 1994;38:339–346.
- , , , et al. Older adults discharged from the hospital with delirium: 1‐year outcomes. J Am Geriatr Soc. 2006;54:1245–1250.
- , , , et al. The dementia antipsychotic withdrawal trial (DART‐AD): long‐term follow‐up of a randomised placebo‐controlled trial. Lancet Neurol. 2009;8:151–157.
- , , , et al. Antipsychotic drug use and mortality in older adults with dementia. Ann Intern Med. 2007;146:775–786.
- , , , et al. Risk of death in elderly users of conventional vs. atypical antipsychotic medications. N Engl J Med. 2005;353:2335–2341.
- , , , et al. The long‐term effects of conventional and atypical antipsychotics in patients with probable Alzheimer's disease. Am J Psychiatry. 2013;170:1051–1058.
- , , , et al. Effectiveness of multicomponent nonpharmacological delirium interventions: a meta‐analysis. JAMA Intern Med. 2015;175:512–520.
- , , , , . Sustainability and scalability of the hospital elder life program at a community hospital. J Am Geriatr Soc. 2011;59:359–365.
- , , , et al. Effectiveness of acute geriatric unit care using acute care for elders components: a systematic review and meta‐analysis. J Am Geriatr Soc. 2012;60:2237–2245.
- , . Adverse effects of antipsychotic medications. Am Fam Physician. 2010;81:617–622.