User login
Direct Admissions to the Hospital
Increasing use of emergency departments (EDs) throughout the United States has become a focus of national healthcare policy and reform efforts. ED growth continues to outpace population growth, with the Institute of Medicine describing our ED systems as fragmented, overburdened, and at the breaking point.[1] Associations between ED crowding and patient dissatisfaction, delays in treatment, medical errors, and patient mortality speak to the urgency of systems improvements.[2] One major factor contributing to ED volumes is the growing number of hospital admissions that begin in EDs. From 1993 to 2006, the proportion of hospitalizations originating in EDs increased from 33.5% to 43.8%, with more than 17 million hospital admissions originating in EDs annually.[3, 4] Despite these challenges, discussions about alternative approaches to hospital admission remain at the periphery of healthcare policy conversations.
Direct admission to the hospital, defined as hospitalization without first receiving care in the hospital's ED, is an alternative approach to hospital admission, and may be a vehicle to both observation and inpatient hospital stays. Direct admissions account for 25% of all nonelective pediatric hospitalizations and 15% of nonelective adult hospitalizations in the United States.[5, 6] This admission approach was considerably more common in the past, facilitated by primary care providers (PCPs) or specialists who provided both outpatient and hospital‐based care for their patients.[4] However, as the number of hospitalists in the United States has grown over the last 30 years, the number of direct admissions has decreased concurrently. In fact, from 2003 to 2009, the number of direct admissions from clinics and physicians' offices decreased by a total of 1.6 million.[4] Although this decline is undoubtedly multifactorial, hospitalists may have contributed, both deliberately and inadvertently, to the shifting epidemiology of hospital admissions. Although many factors influence the source of hospital admissions and admission processes, direct admission has 2 important prerequisites: patients require timely access to outpatient providers for acute care, and hospitals, in partnership with outpatient‐based clinics and practices, require systems to safely and efficiently facilitate admissions without ED involvement. However, we know little about hospital admission systems, developed in the era of hospital medicine, to facilitate admissions independent of the ED.
Direct admission offers a number of potential benefits for both patients and healthcare delivery systems including reductions in the number of sites and providers of care, improved communication and coordination between outpatient and hospital‐based healthcare providers, greater patient and referring physician satisfaction, and reduced ED volumes and subsequent costs.[7] However, there are also risks and potential harms associated with direct admission, including potential delays in initial evaluation and management, inconsistent admission processes, and difficulties determining direct admission appropriateness, all of which could adversely impact patient safety and quality of care.[7, 8, 9] One study of adults with sepsis found that direct admission was associated with increased mortality compared to ED admission, which the authors speculated to be related to less timely care.[9] Similarly, a study of unscheduled adult hospitalizations found that patients admitted directly had higher mortality for time‐sensitive conditions such as acute myocardial infarction and sepsis than patients admitted through EDs, differences not observed among adults admitted with pneumonia, asthma, cellulitis, and several other common, yet frequently less emergent, reasons for hospitalization.[8] Among children with pneumonia, the most common reason for pediatric hospitalization, direct admission has been associated with significantly lower costs than admissions originating in the ED, with no significant differences in rates of transfer to the intensive care unit or hospital readmission.[10]
There is significant variation across both diagnoses and hospitals in rates of direct admission, raising questions about the contextual factors unique to hospital medicine programs that perform a substantial proportion of direct admissions.[5] This variation also highlights opportunities to identify the populations, conditions, and systems that facilitate safe and effective direct admissions. Certainly, direct admission is unlikely to be appropriate for all populations or conditions. Patients requiring emergent care or rapid diagnostic imaging are likely to receive more timely care in the ED; sepsis, acute myocardial infarction, and trauma are but a few examples of conditions for which rapid ED care decreases morbidity and mortality. Similarly, patients for whom the need for hospitalization is uncertainfor example, dehydration, asthmamay be more appropriate for initial ED management followed by re‐evaluation to inform the need for hospitalization. Finally, patients for whom the admitting diagnosis is uncertain and who require consultation for several subspecialists may be more efficiently evaluated in EDs. In our national survey of pediatric direct admission guidelines, less than one‐third of hospitals reported having formal criteria to assess the appropriateness of direct admissions, and respondents' perspectives regarding populations and diagnoses appropriate for this admission approach varied considerably.[7] These results point to the need for further research and quality‐improvement initiatives to inform the development of direct admission guidelines and protocols.
During the last decade, hospitals' discharge processes have been the focus of tremendous research, policy, and quality improvement efforts. The phrase transition of care is now widely understood to describe the changes in patient care that begin with discharge planning and conclude when patients' have established care at home or another healthcare facility. Transitions of care have been a focus of the Journal of Hospital Medicine since its inception, including publication of the Transitions of Care Consensus Policy Statement in 2009, as well as numerous other studies highlighting both risks associated with transitions of care as well as methods to address these.[11, 12, 13, 14, 15, 16] Similar to hospital discharge, hospital admission is an inherent feature of every hospitalization, and admission and discharge processes share many commonalities. Both involve transitions in sites of care, and handoffs between healthcare providers. Most involve changes in medical therapies, including both the addition of new medications and changes to existing treatments. Moreover, both are associated with significant stress to patients and their families. As a result, hospital admissions expose patients to many of same risks that have been the focus of hospital discharge reform: unstructured patient handoffs, poor communication between healthcare providers, and costly, inefficient care. The Society of Hospital Medicine has been a leader in articulating the importance of patient‐centered, clinically relevant medication reconciliation across the healthcare continuum.[17] However, with the exception of this important work, research and policy focused on understanding and improving transitions of care into the hospital have received disproportionately little attention.
To facilitate research and quality improvement efforts focused on hospital admission, we suggest that the transitions of care framework, typically discussed in the context of hospital discharge, be expanded to reflect the different origins of hospitalizations and multiple transitions that can be experienced by patients as they enter the hospital. A broadening of the transitions of care framework to incorporate hospital admissions brings numerous questions previously addressed in hospital‐to‐home transitions to the forefront. How do transitions into the hospital impact patients and healthcare systems? When is direct admission safe and effective, and how does this vary across conditions and hospital settings? What protocols and tools might optimize the associated transitions and reduce the risks of error and harm? There are numerous stakeholders who will undoubtedly bring diverse perspectives to these questionspatients and their families, hospital‐based healthcare providers, PCPs and specialists, ED physicians, and payors.
Increasing ED volumes, long wait times, and rising ED costs speak to the importance of better understanding hospital admission alternatives and the associated risks and benefits. Encouraging more direct admissions may be a solution, but evidence to guide best practices must precede this. The growing presence of round‐the‐clock pediatric and adult hospitalists across the country creates unique opportunities to transform hospital admission systems for the vast number of patients who do not require emergent care. The Affordable Care Act's expansion of insurance coverage and incentivized coordinated care within patient‐centered medical homes creates a unique opportunity for this broadened view of transitions of care. This suggests that the time is ripe for pursuing strategies that will both improve patients' transitions from outpatient to inpatient care and reduce stress on our overburdened emergency departments.
Disclosure: Dr. Lagu was supported by the National Heart, Lung, and Blood Institute of the National Institutes of Health under award number K01HL114745. She has received consulting fees from the Institute for Healthcare Improvement, under contract to the Centers for Medicare and Medicaid Services (CMS), for her work on a project to help health systems achieve disability competence, and from the Island Peer Review Organization, under contract to CMS, for her work on development of episodes of care for CMS payment purposes (both unrelated to the current work). Dr. Leyenaar was supported by grant number K08HS024133 from the Agency for Healthcare Research and Quality. The content is solely the responsibility of the authors and does not necessarily represent the official views of the Agency for Healthcare Research and Quality. The authors report no conflicts of interest.
- Institute of Medicine. Hospital‐based emergency care: At the breaking point. Washington, DC: National Academies Press; 2006. Available at: http://www.nap.edu/openbook.php?record_id=11621. Accessed September 13, 2015.
- , , , . National trends in emergency department occupancy, 2001 to 2008: effect of inpatient admissions versus emergency department practice intensity. Ann Emerg Med. 2012;60(6):679–686.e3.
- , . The growing role of emergency departments in hospital admissions. N Engl J Med. 2012;367(5):391–393.
- , , , et al. The Evolving Role of Emergency Departments in the United States. Santa Monica, CA: RAND Corp.; 2013:1–79.
- , , , , . Direct admission to hospitals among children in the United States. JAMA Pediatr. 2015;169(5):500–502.
- Healthcare Cost and Utilization Project. National Inpatient Sample. 2012. Agency for Healthcare Research and Quality, Rockville, MD. Available at: www.hcup‐us.ahrq.gov/nisoverview.jsp. Accessed October 11, 2014.
- , , , , . Direct admission to hospital: a mixed methods survey of pediatric practices, benefits, and challenges [published online August 17, 2015]. Acad Pediatr.
- , , . Changes in the source of unscheduled hospitalizations in the United States. Med Care. 2013;51(8):689–698.
- , , , . Lower mortality in sepsis patients admitted through the ED vs direct admission. Am J Emerg Med. 2012;30(3):432–439.
- , , , , . Variation and outcomes associated with direct admission among children with pneumonia in the United States. JAMA Pediatr. 2014;168(9):829–836.
- , , , et al. Transitions of Care Consensus policy statement: American College of Physicians, Society of General Internal Medicine, Society of Hospital Medicine, American Geriatrics Society, American College Of Emergency Physicians, and Society for Academic Emergency Medicine. J Hosp Med. 2009;4(6):364–370.
- , , , . Promoting effective transitions of care at hospital discharge: a review of key issues for hospitalists. J Hosp Med. 2007;2(5):314–323.
- . Safety in numbers: physicians joining forces to seal the cracks during transitions. J Hosp Med. 2009;4(6):329–330.
- , , , et al. Development of a checklist of safe discharge practices for hospital patients. J Hosp Med. 2013;8(8):444–449.
- , , , et al. Project BOOST: effectiveness of a multihospital effort to reduce rehospitalization. J Hosp Med. 2013;8(8):421–427.
- , , . The successes and challenges of hospital to home transitions. J Hosp Med. 2014;9(4):271–273.
- , , , et al. Making inpatient medication reconciliation patient centered, clinically relevant and implementable: a consensus statement on key principles and necessary first steps. J Hosp Med. 2010;5(8):477–485.
Increasing use of emergency departments (EDs) throughout the United States has become a focus of national healthcare policy and reform efforts. ED growth continues to outpace population growth, with the Institute of Medicine describing our ED systems as fragmented, overburdened, and at the breaking point.[1] Associations between ED crowding and patient dissatisfaction, delays in treatment, medical errors, and patient mortality speak to the urgency of systems improvements.[2] One major factor contributing to ED volumes is the growing number of hospital admissions that begin in EDs. From 1993 to 2006, the proportion of hospitalizations originating in EDs increased from 33.5% to 43.8%, with more than 17 million hospital admissions originating in EDs annually.[3, 4] Despite these challenges, discussions about alternative approaches to hospital admission remain at the periphery of healthcare policy conversations.
Direct admission to the hospital, defined as hospitalization without first receiving care in the hospital's ED, is an alternative approach to hospital admission, and may be a vehicle to both observation and inpatient hospital stays. Direct admissions account for 25% of all nonelective pediatric hospitalizations and 15% of nonelective adult hospitalizations in the United States.[5, 6] This admission approach was considerably more common in the past, facilitated by primary care providers (PCPs) or specialists who provided both outpatient and hospital‐based care for their patients.[4] However, as the number of hospitalists in the United States has grown over the last 30 years, the number of direct admissions has decreased concurrently. In fact, from 2003 to 2009, the number of direct admissions from clinics and physicians' offices decreased by a total of 1.6 million.[4] Although this decline is undoubtedly multifactorial, hospitalists may have contributed, both deliberately and inadvertently, to the shifting epidemiology of hospital admissions. Although many factors influence the source of hospital admissions and admission processes, direct admission has 2 important prerequisites: patients require timely access to outpatient providers for acute care, and hospitals, in partnership with outpatient‐based clinics and practices, require systems to safely and efficiently facilitate admissions without ED involvement. However, we know little about hospital admission systems, developed in the era of hospital medicine, to facilitate admissions independent of the ED.
Direct admission offers a number of potential benefits for both patients and healthcare delivery systems including reductions in the number of sites and providers of care, improved communication and coordination between outpatient and hospital‐based healthcare providers, greater patient and referring physician satisfaction, and reduced ED volumes and subsequent costs.[7] However, there are also risks and potential harms associated with direct admission, including potential delays in initial evaluation and management, inconsistent admission processes, and difficulties determining direct admission appropriateness, all of which could adversely impact patient safety and quality of care.[7, 8, 9] One study of adults with sepsis found that direct admission was associated with increased mortality compared to ED admission, which the authors speculated to be related to less timely care.[9] Similarly, a study of unscheduled adult hospitalizations found that patients admitted directly had higher mortality for time‐sensitive conditions such as acute myocardial infarction and sepsis than patients admitted through EDs, differences not observed among adults admitted with pneumonia, asthma, cellulitis, and several other common, yet frequently less emergent, reasons for hospitalization.[8] Among children with pneumonia, the most common reason for pediatric hospitalization, direct admission has been associated with significantly lower costs than admissions originating in the ED, with no significant differences in rates of transfer to the intensive care unit or hospital readmission.[10]
There is significant variation across both diagnoses and hospitals in rates of direct admission, raising questions about the contextual factors unique to hospital medicine programs that perform a substantial proportion of direct admissions.[5] This variation also highlights opportunities to identify the populations, conditions, and systems that facilitate safe and effective direct admissions. Certainly, direct admission is unlikely to be appropriate for all populations or conditions. Patients requiring emergent care or rapid diagnostic imaging are likely to receive more timely care in the ED; sepsis, acute myocardial infarction, and trauma are but a few examples of conditions for which rapid ED care decreases morbidity and mortality. Similarly, patients for whom the need for hospitalization is uncertainfor example, dehydration, asthmamay be more appropriate for initial ED management followed by re‐evaluation to inform the need for hospitalization. Finally, patients for whom the admitting diagnosis is uncertain and who require consultation for several subspecialists may be more efficiently evaluated in EDs. In our national survey of pediatric direct admission guidelines, less than one‐third of hospitals reported having formal criteria to assess the appropriateness of direct admissions, and respondents' perspectives regarding populations and diagnoses appropriate for this admission approach varied considerably.[7] These results point to the need for further research and quality‐improvement initiatives to inform the development of direct admission guidelines and protocols.
During the last decade, hospitals' discharge processes have been the focus of tremendous research, policy, and quality improvement efforts. The phrase transition of care is now widely understood to describe the changes in patient care that begin with discharge planning and conclude when patients' have established care at home or another healthcare facility. Transitions of care have been a focus of the Journal of Hospital Medicine since its inception, including publication of the Transitions of Care Consensus Policy Statement in 2009, as well as numerous other studies highlighting both risks associated with transitions of care as well as methods to address these.[11, 12, 13, 14, 15, 16] Similar to hospital discharge, hospital admission is an inherent feature of every hospitalization, and admission and discharge processes share many commonalities. Both involve transitions in sites of care, and handoffs between healthcare providers. Most involve changes in medical therapies, including both the addition of new medications and changes to existing treatments. Moreover, both are associated with significant stress to patients and their families. As a result, hospital admissions expose patients to many of same risks that have been the focus of hospital discharge reform: unstructured patient handoffs, poor communication between healthcare providers, and costly, inefficient care. The Society of Hospital Medicine has been a leader in articulating the importance of patient‐centered, clinically relevant medication reconciliation across the healthcare continuum.[17] However, with the exception of this important work, research and policy focused on understanding and improving transitions of care into the hospital have received disproportionately little attention.
To facilitate research and quality improvement efforts focused on hospital admission, we suggest that the transitions of care framework, typically discussed in the context of hospital discharge, be expanded to reflect the different origins of hospitalizations and multiple transitions that can be experienced by patients as they enter the hospital. A broadening of the transitions of care framework to incorporate hospital admissions brings numerous questions previously addressed in hospital‐to‐home transitions to the forefront. How do transitions into the hospital impact patients and healthcare systems? When is direct admission safe and effective, and how does this vary across conditions and hospital settings? What protocols and tools might optimize the associated transitions and reduce the risks of error and harm? There are numerous stakeholders who will undoubtedly bring diverse perspectives to these questionspatients and their families, hospital‐based healthcare providers, PCPs and specialists, ED physicians, and payors.
Increasing ED volumes, long wait times, and rising ED costs speak to the importance of better understanding hospital admission alternatives and the associated risks and benefits. Encouraging more direct admissions may be a solution, but evidence to guide best practices must precede this. The growing presence of round‐the‐clock pediatric and adult hospitalists across the country creates unique opportunities to transform hospital admission systems for the vast number of patients who do not require emergent care. The Affordable Care Act's expansion of insurance coverage and incentivized coordinated care within patient‐centered medical homes creates a unique opportunity for this broadened view of transitions of care. This suggests that the time is ripe for pursuing strategies that will both improve patients' transitions from outpatient to inpatient care and reduce stress on our overburdened emergency departments.
Disclosure: Dr. Lagu was supported by the National Heart, Lung, and Blood Institute of the National Institutes of Health under award number K01HL114745. She has received consulting fees from the Institute for Healthcare Improvement, under contract to the Centers for Medicare and Medicaid Services (CMS), for her work on a project to help health systems achieve disability competence, and from the Island Peer Review Organization, under contract to CMS, for her work on development of episodes of care for CMS payment purposes (both unrelated to the current work). Dr. Leyenaar was supported by grant number K08HS024133 from the Agency for Healthcare Research and Quality. The content is solely the responsibility of the authors and does not necessarily represent the official views of the Agency for Healthcare Research and Quality. The authors report no conflicts of interest.
- Institute of Medicine. Hospital‐based emergency care: At the breaking point. Washington, DC: National Academies Press; 2006. Available at: http://www.nap.edu/openbook.php?record_id=11621. Accessed September 13, 2015.
- , , , . National trends in emergency department occupancy, 2001 to 2008: effect of inpatient admissions versus emergency department practice intensity. Ann Emerg Med. 2012;60(6):679–686.e3.
- , . The growing role of emergency departments in hospital admissions. N Engl J Med. 2012;367(5):391–393.
- , , , et al. The Evolving Role of Emergency Departments in the United States. Santa Monica, CA: RAND Corp.; 2013:1–79.
- , , , , . Direct admission to hospitals among children in the United States. JAMA Pediatr. 2015;169(5):500–502.
- Healthcare Cost and Utilization Project. National Inpatient Sample. 2012. Agency for Healthcare Research and Quality, Rockville, MD. Available at: www.hcup‐us.ahrq.gov/nisoverview.jsp. Accessed October 11, 2014.
- , , , , . Direct admission to hospital: a mixed methods survey of pediatric practices, benefits, and challenges [published online August 17, 2015]. Acad Pediatr.
- , , . Changes in the source of unscheduled hospitalizations in the United States. Med Care. 2013;51(8):689–698.
- , , , . Lower mortality in sepsis patients admitted through the ED vs direct admission. Am J Emerg Med. 2012;30(3):432–439.
- , , , , . Variation and outcomes associated with direct admission among children with pneumonia in the United States. JAMA Pediatr. 2014;168(9):829–836.
- , , , et al. Transitions of Care Consensus policy statement: American College of Physicians, Society of General Internal Medicine, Society of Hospital Medicine, American Geriatrics Society, American College Of Emergency Physicians, and Society for Academic Emergency Medicine. J Hosp Med. 2009;4(6):364–370.
- , , , . Promoting effective transitions of care at hospital discharge: a review of key issues for hospitalists. J Hosp Med. 2007;2(5):314–323.
- . Safety in numbers: physicians joining forces to seal the cracks during transitions. J Hosp Med. 2009;4(6):329–330.
- , , , et al. Development of a checklist of safe discharge practices for hospital patients. J Hosp Med. 2013;8(8):444–449.
- , , , et al. Project BOOST: effectiveness of a multihospital effort to reduce rehospitalization. J Hosp Med. 2013;8(8):421–427.
- , , . The successes and challenges of hospital to home transitions. J Hosp Med. 2014;9(4):271–273.
- , , , et al. Making inpatient medication reconciliation patient centered, clinically relevant and implementable: a consensus statement on key principles and necessary first steps. J Hosp Med. 2010;5(8):477–485.
Using Social Media as a Hospital QI Tool
Patient experience has become a major component of the Center for Medicare and Medicaid Services Value‐Based Purchasing initiative.[1] Hospitals have therefore focused quality improvement (QI) efforts on this area.[2] Hospital performance in the realm of patient experience is generally determined using systematic surveys with closed‐ended questions, but patient‐generated narrative feedback can help hospitals identify the components of care that contribute to patient satisfaction and or are in need of improvement.[3] Online narrative responses posted by patients on rating websites or social media have been criticized because they may not be representative of the population,[4] but they also have some advantages.[5] Any patient may leave a comment, not just those who are selected for a survey. Patients may also experience benefits through the act of sharing their story with others. Moreover, most US hospitals use some form of social media,[6] which they can theoretically use to self‐collect narrative data online. To realize the full potential of patient‐generated online narratives, we need a clearer understanding of the best practices for collecting and using these narratives. We therefore solicited patient feedback on the Facebook page of a large tertiary academic medical center to determine whether it is feasible to use social media platforms for learning about and improving hospital quality.
METHODS
Baystate Medical Center (BMC) is a tertiary care medical center in western Massachusetts. We identified key BMC stakeholders in the areas of QI and public affairs. Noting that patients have expressed interest in leaving comments via social media,[7] the group opted to perform a pilot study to obtain patient narratives via a Facebook prompt (Facebook is a social media site used by an estimated 58% of US adults[8]). The BMC public affairs department delivered a press release to the local media describing a 3‐week period during which patients were invited to leave narrative feedback on the BMC Facebook wall. The BMC Institutional Review Board deemed that this study did not constitute human subjects research.
During March 2014 (March 10, 2014March 24, 2014), we posted (once a week) an open‐ended prompt on BMC's Facebook wall. The prompt was designed to elicit novel descriptions of patient experience that could help to drive QI. It read: We want to hear about your experiences. In the comment section below, please tell us what we do well and how we can improve your care. Because of concerns about the potential reputational risks of allowing open feedback on a public social media page, the prompt also reminded patients of the social media ground rules: there should be no mention of specific physicians, nurses, or other caregivers by name (for liability reasons); and patients should not include details about their medical history (for privacy reasons).
We collected all posts to preserve comments and used directed qualitative content analysis to examine them.[9] Two research team members[3, 10, 11] independently coded the responses. Starting with an a priori codebook that was developed during a previous study,[3] they amended the codebook through an iterative process to incorporate new concepts. After independently coding all blocks of text, the coders reviewed their coding selections and resolved discrepancies through discussion. We then performed second‐level coding, in which codes were organized into major pertinent themes. We reviewed the coded text after applying secondary codes in order to check for accuracy of coding and theme assignment as well as completeness of second‐level coding. We calculated percent agreement, defined as both raters scoring a block of text with the same code divided by total number of codes. We also calculated the Spearman correlation between the 2 reviewers. We used descriptive statistics to assess the frequency of select codes and themes (see Supporting Information, Appendix 1 and Appendix 2, in the online version of this article).[9, 12, 13]
RESULTS
Over a 3‐week study period, 47 comments were submitted by 37 respondents. This yielded 148 codable statements (Table 1). Despite limited information on respondents, we ascertained from Facebook that 32 (86%) were women and 5 (14%) were men.
| Theme | Total Respondents, N (%) | % Positive | Positive Quotation | % Negative | Negative Quotation |
|---|---|---|---|---|---|
| |||||
| Staff | 17 (46) | 45% | The nurses in the pediatric unit, as well as the doctors in radiology and x‐ray department were AMAZING! | 55% | My 24‐year‐old daughter had to go for 5 days of IV treatmentwhile getting her infusion there was a fire alarm. She has a video showing the flashing of the light and the sound of the alarm and the closing of doors and NOT A SINGLE staff member to be found. Her infusions take about 2 hours. They set it and forget it. Luckily there wasn't a fire and someone did finally come to disconnect her. |
| Had a fabulous experience with Wesson women's this week! Had a C section and 3‐day admission. All staff from preoperative to inpatient were so helpful and really anticipated my needs before I could even ask for things. | My mother was hospitalized for at least 3 weeks right after the cardiovascular center openedwhen she went into cardiac arrest and in acute care and the step unit the care was great, very attentive nurses and doctors. When she was starting to recover and moved upstairs, downhill it went. She'd ring for assistance because she wanted to walk to the bathrooms and more times she was left to her own devices because no one would respond. | ||||
| Facility | 9 (24) | 25% | New buildings are beautiful and the new signs are way better. | 75% | The parking situation was disappointing and the waiting room was also very dirty. |
| I really like the individual pods in the ER. | I could have used a single room as my roommate was very annoying and demanding. | ||||
| Departments | 22 (60) | 44% | The NICU was great when my son was in there. The children's unit was great with my daughter and respected my needs. | 56% | Revamp maternity; it needs it desperately. |
| Labor and delivery was a great place. | Love Baystate but hate the ER. | ||||
| Technical aspects of care (eg, errors) | 9 (24) | 0 | 100% | Day 2 of my 24 year old getting her 2‐hour IV infusion....she was set up with her IV. When checked 2 hours later, the staff member was very upset to find that only the saline had run. She never opened the medication clamp. So now they gave her the medication in 1 hour instead of 2. | |
| If I had 1 suggestion it would be to re‐evaluate patient comfort when patients are waiting to be admitted. | |||||
From coded text, several broad themes were identified (see Table 1 for representative quotes): (1) comments about staff (17/37 respondents, 45.9%). These included positive descriptions of efficiency, caring behavior, good training, and good communication, whereas negative comments included descriptions of unfriendliness, apparent lack of caring, inattentiveness, poor training, unprofessional behavior, and poor communication; (2) comments about specific departments (22/37, 59.5%); (3) comments on technical aspects of care, including perceived errors, incorrect diagnoses, and inattention to pain control (9/37, 24.3%); and (4) comments describing the hospital physical plant, parking, and amenities (9/37, 24.3%). There were a few miscellaneous comments that did not fit into these broad themes, such as expressions of gratitude for our solicitation of narratives. Percent agreement between coders was 80% and Spearman's Rho was 0.82 (p<0.001).
A small number (n=3) of respondents repeatedly made comments over the 3‐week period, accounting for 30% (45/148) of codes. These repetitive commenters tended to dominate the Facebook conversation, at times describing the same experience more than once.
DISCUSSION
In this study evaluating the potential utility of social media as a hospital QI tool, several broad themes emerged. From these themes, we identified several areas that could be deemed as QI targets, including: training staff to be more responsive and sensitive to patients needs and concerns, improving patient and visitor parking, and reducing emergency department waiting times. However, the insight gained from solicited Facebook comments was similar to feedback gained from more traditional approaches of soliciting patient perspectives on care, such as patient experience surveys.[14]
Our findings should be viewed in the context of prior work focused on patient narratives in healthcare. Greaves et al. used sentiment analysis to describe the content of nearly 200,000 tweets (comments posted on the social networking website Twitter) sent to National Health Service (NHS) hospitals.[15] Themes were similar to those found in our study: (1) interaction with staff, (2) environment and facilities, and (3) issues of access and timeliness of service. Notably, these themes mirrored prior work examining narratives at NHS hospitals[3] and were similar to domains of commonly used surveys of patient experience.[14] The authors noted that there were issues with the signal to noise ratio (only about 10% of tweets were about quality) and the enforced brevity of Twitter (tweets must be 140 characters or less). These limitations suggest that using Twitter to identify QI targets would be difficult.
In contrast to Greaves et al., we chose to solicit feedback on our hospital's Facebook page. Facebook does not have Twitter's enforced brevity, allowing for more detailed narratives. In addition, we did not encounter the signal‐to‐noise problem, because our prompt was designed to request feedback that was relevant to recent experiences of care. However, a few respondents dominated the conversation, supporting the hypothesis that those most likely to comment may be the patients or families who have had the best or worst experiences. In the future, we will attempt to address this limitation and reduce the influence of repeat commenters by changing our prompt (eg, Please tell us about your experience, but please do not post descriptions of the same experience more than once.).
This pilot demonstrated some of the previously described benefits of online narratives.[5] First, there appears to be value in allowing patients to share their experiences and to read the experiences of others (as indicated in a few grateful patients comments). Second, soliciting online narratives offers a way for hospitals to demonstrate a commitment to transparency. Third, in contrast to closed‐ended survey questions, narrative comments help to identify why patients were satisfied or unsatisfied with their care. Although some surveys with closed‐ended questions also allow for narratives, these comments may or may not be carefully reviewed by the hospital. Using social media to solicit and respond to comments enhances existing methods for evaluating patient experience by engaging patients in a public space, which increases the likelihood that hospitals will attempt to improve care in response.
Notably, none of the identified areas for improvement could be considered novel QI targets for BMC. For example, our hospital has been very focused on training staff around patient experience, and emergency department wait times are the focus of a system‐wide improvement effort called Patient Progress.
This study has other limitations. We conducted this study over a 3‐week time period in a single center and on a single social media site whose members may not be representative of the overall patient population at BMC. Although we do not know how generalizable our findings are (in terms of identifying QI targets), we feel that we have demonstrated how using social media to collect data on patient experience is feasible and could be informative for other hospitals in other locations. It is possible that we did not allow the experiment to run long enough; a longer time or broader outreach (eg, a handout given to every discharged patient over a longer period) may be needed to allow patients adequate opportunity to comment. Of note, we did not specifically examine responses by time period, but it does seem, in post hoc analysis, that after 2 weeks of data collection we reached theoretical saturation with no new themes emerging in the third week (eg, third‐week comments included I heart your nurses. and Love Baystate but hate the ER.). More work is also needed that includes a broader range of social media platforms and more participating hospitals.
In conclusion, the opportunity to provide feedback on Facebook has the potential to engage and empower patients, and hospitals can use these online narratives to help to drive improvement efforts. Yet potential benefits must be weighed against reputational risks, a lack of representative respondents, and the paucity of novel QI targets obtained in this study.
Disclosures: Dr. Lagu is supported by the National Heart, Lung, and Blood Institute of the National Institutes of Health under award number K01HL114745. The authors report no conflicts of interest.
- Centers for Medicare 47(2):193–219.
- , , , , . A mixed‐methods analysis of patient reviews of hospital care in England: implications for public reporting of health care quality data in the United States. Jt Comm J Qual Patient Saf. 2013;39(1):7–15.
- , , , , , , , . Taking Patients' Narratives about Clinicians from Anecdote to Science. NEJM. 2015;373(7):675–679.
- , . Putting the public back in public reporting of health care quality. JAMA. 2010;304(15):1711–1712.
- , , , et al. Use of social media across US hospitals: descriptive analysis of adoption and utilization. J Med Internet Res. 2014;16(11):e264.
- , , , , , . Patient use of email, Facebook, and physician websites to communicate with physicians: a national online survey of retail pharmacy users [published online June 24, 2015]. J Gen Intern Med. doi:10.1007/s11606-015-3374-7.
- Pew Research Center. Social networking fact sheet. Available at: http://www.pewinternet.org/fact‐sheets/social‐networking‐fact‐sheet. Accessed March 4, 2015.
- , . Three approaches to qualitative content analysis. Qual Health Res. 2005;15(9):1277–1288.
- , , , . Patients’ evaluations of health care providers in the era of social networking: an analysis of physician‐rating websites. J Gen Intern Med. 2010;25(9):942–946.
- , , , , . Vaccine counseling: a content analysis of patient‐physician discussions regarding human papilloma virus vaccine. Vaccine. 2011;29(43):7343–7349.
- . Qualitative research methods. Int J Qual Health Care. 2002;14(4):329–336.
- , . Doing Qualitative Research. Vol 2. Thousand Oaks, CA: Sage Publications; 1999.
- , , , . Patients’ perception of hospital care in the United States. N Engl J Med. 2008;359(18):1921–1931.
- , , , et al. Tweets about hospital quality: a mixed methods study. BMJ Qual Saf. 2014;23(10):838–846.
Patient experience has become a major component of the Center for Medicare and Medicaid Services Value‐Based Purchasing initiative.[1] Hospitals have therefore focused quality improvement (QI) efforts on this area.[2] Hospital performance in the realm of patient experience is generally determined using systematic surveys with closed‐ended questions, but patient‐generated narrative feedback can help hospitals identify the components of care that contribute to patient satisfaction and or are in need of improvement.[3] Online narrative responses posted by patients on rating websites or social media have been criticized because they may not be representative of the population,[4] but they also have some advantages.[5] Any patient may leave a comment, not just those who are selected for a survey. Patients may also experience benefits through the act of sharing their story with others. Moreover, most US hospitals use some form of social media,[6] which they can theoretically use to self‐collect narrative data online. To realize the full potential of patient‐generated online narratives, we need a clearer understanding of the best practices for collecting and using these narratives. We therefore solicited patient feedback on the Facebook page of a large tertiary academic medical center to determine whether it is feasible to use social media platforms for learning about and improving hospital quality.
METHODS
Baystate Medical Center (BMC) is a tertiary care medical center in western Massachusetts. We identified key BMC stakeholders in the areas of QI and public affairs. Noting that patients have expressed interest in leaving comments via social media,[7] the group opted to perform a pilot study to obtain patient narratives via a Facebook prompt (Facebook is a social media site used by an estimated 58% of US adults[8]). The BMC public affairs department delivered a press release to the local media describing a 3‐week period during which patients were invited to leave narrative feedback on the BMC Facebook wall. The BMC Institutional Review Board deemed that this study did not constitute human subjects research.
During March 2014 (March 10, 2014March 24, 2014), we posted (once a week) an open‐ended prompt on BMC's Facebook wall. The prompt was designed to elicit novel descriptions of patient experience that could help to drive QI. It read: We want to hear about your experiences. In the comment section below, please tell us what we do well and how we can improve your care. Because of concerns about the potential reputational risks of allowing open feedback on a public social media page, the prompt also reminded patients of the social media ground rules: there should be no mention of specific physicians, nurses, or other caregivers by name (for liability reasons); and patients should not include details about their medical history (for privacy reasons).
We collected all posts to preserve comments and used directed qualitative content analysis to examine them.[9] Two research team members[3, 10, 11] independently coded the responses. Starting with an a priori codebook that was developed during a previous study,[3] they amended the codebook through an iterative process to incorporate new concepts. After independently coding all blocks of text, the coders reviewed their coding selections and resolved discrepancies through discussion. We then performed second‐level coding, in which codes were organized into major pertinent themes. We reviewed the coded text after applying secondary codes in order to check for accuracy of coding and theme assignment as well as completeness of second‐level coding. We calculated percent agreement, defined as both raters scoring a block of text with the same code divided by total number of codes. We also calculated the Spearman correlation between the 2 reviewers. We used descriptive statistics to assess the frequency of select codes and themes (see Supporting Information, Appendix 1 and Appendix 2, in the online version of this article).[9, 12, 13]
RESULTS
Over a 3‐week study period, 47 comments were submitted by 37 respondents. This yielded 148 codable statements (Table 1). Despite limited information on respondents, we ascertained from Facebook that 32 (86%) were women and 5 (14%) were men.
| Theme | Total Respondents, N (%) | % Positive | Positive Quotation | % Negative | Negative Quotation |
|---|---|---|---|---|---|
| |||||
| Staff | 17 (46) | 45% | The nurses in the pediatric unit, as well as the doctors in radiology and x‐ray department were AMAZING! | 55% | My 24‐year‐old daughter had to go for 5 days of IV treatmentwhile getting her infusion there was a fire alarm. She has a video showing the flashing of the light and the sound of the alarm and the closing of doors and NOT A SINGLE staff member to be found. Her infusions take about 2 hours. They set it and forget it. Luckily there wasn't a fire and someone did finally come to disconnect her. |
| Had a fabulous experience with Wesson women's this week! Had a C section and 3‐day admission. All staff from preoperative to inpatient were so helpful and really anticipated my needs before I could even ask for things. | My mother was hospitalized for at least 3 weeks right after the cardiovascular center openedwhen she went into cardiac arrest and in acute care and the step unit the care was great, very attentive nurses and doctors. When she was starting to recover and moved upstairs, downhill it went. She'd ring for assistance because she wanted to walk to the bathrooms and more times she was left to her own devices because no one would respond. | ||||
| Facility | 9 (24) | 25% | New buildings are beautiful and the new signs are way better. | 75% | The parking situation was disappointing and the waiting room was also very dirty. |
| I really like the individual pods in the ER. | I could have used a single room as my roommate was very annoying and demanding. | ||||
| Departments | 22 (60) | 44% | The NICU was great when my son was in there. The children's unit was great with my daughter and respected my needs. | 56% | Revamp maternity; it needs it desperately. |
| Labor and delivery was a great place. | Love Baystate but hate the ER. | ||||
| Technical aspects of care (eg, errors) | 9 (24) | 0 | 100% | Day 2 of my 24 year old getting her 2‐hour IV infusion....she was set up with her IV. When checked 2 hours later, the staff member was very upset to find that only the saline had run. She never opened the medication clamp. So now they gave her the medication in 1 hour instead of 2. | |
| If I had 1 suggestion it would be to re‐evaluate patient comfort when patients are waiting to be admitted. | |||||
From coded text, several broad themes were identified (see Table 1 for representative quotes): (1) comments about staff (17/37 respondents, 45.9%). These included positive descriptions of efficiency, caring behavior, good training, and good communication, whereas negative comments included descriptions of unfriendliness, apparent lack of caring, inattentiveness, poor training, unprofessional behavior, and poor communication; (2) comments about specific departments (22/37, 59.5%); (3) comments on technical aspects of care, including perceived errors, incorrect diagnoses, and inattention to pain control (9/37, 24.3%); and (4) comments describing the hospital physical plant, parking, and amenities (9/37, 24.3%). There were a few miscellaneous comments that did not fit into these broad themes, such as expressions of gratitude for our solicitation of narratives. Percent agreement between coders was 80% and Spearman's Rho was 0.82 (p<0.001).
A small number (n=3) of respondents repeatedly made comments over the 3‐week period, accounting for 30% (45/148) of codes. These repetitive commenters tended to dominate the Facebook conversation, at times describing the same experience more than once.
DISCUSSION
In this study evaluating the potential utility of social media as a hospital QI tool, several broad themes emerged. From these themes, we identified several areas that could be deemed as QI targets, including: training staff to be more responsive and sensitive to patients needs and concerns, improving patient and visitor parking, and reducing emergency department waiting times. However, the insight gained from solicited Facebook comments was similar to feedback gained from more traditional approaches of soliciting patient perspectives on care, such as patient experience surveys.[14]
Our findings should be viewed in the context of prior work focused on patient narratives in healthcare. Greaves et al. used sentiment analysis to describe the content of nearly 200,000 tweets (comments posted on the social networking website Twitter) sent to National Health Service (NHS) hospitals.[15] Themes were similar to those found in our study: (1) interaction with staff, (2) environment and facilities, and (3) issues of access and timeliness of service. Notably, these themes mirrored prior work examining narratives at NHS hospitals[3] and were similar to domains of commonly used surveys of patient experience.[14] The authors noted that there were issues with the signal to noise ratio (only about 10% of tweets were about quality) and the enforced brevity of Twitter (tweets must be 140 characters or less). These limitations suggest that using Twitter to identify QI targets would be difficult.
In contrast to Greaves et al., we chose to solicit feedback on our hospital's Facebook page. Facebook does not have Twitter's enforced brevity, allowing for more detailed narratives. In addition, we did not encounter the signal‐to‐noise problem, because our prompt was designed to request feedback that was relevant to recent experiences of care. However, a few respondents dominated the conversation, supporting the hypothesis that those most likely to comment may be the patients or families who have had the best or worst experiences. In the future, we will attempt to address this limitation and reduce the influence of repeat commenters by changing our prompt (eg, Please tell us about your experience, but please do not post descriptions of the same experience more than once.).
This pilot demonstrated some of the previously described benefits of online narratives.[5] First, there appears to be value in allowing patients to share their experiences and to read the experiences of others (as indicated in a few grateful patients comments). Second, soliciting online narratives offers a way for hospitals to demonstrate a commitment to transparency. Third, in contrast to closed‐ended survey questions, narrative comments help to identify why patients were satisfied or unsatisfied with their care. Although some surveys with closed‐ended questions also allow for narratives, these comments may or may not be carefully reviewed by the hospital. Using social media to solicit and respond to comments enhances existing methods for evaluating patient experience by engaging patients in a public space, which increases the likelihood that hospitals will attempt to improve care in response.
Notably, none of the identified areas for improvement could be considered novel QI targets for BMC. For example, our hospital has been very focused on training staff around patient experience, and emergency department wait times are the focus of a system‐wide improvement effort called Patient Progress.
This study has other limitations. We conducted this study over a 3‐week time period in a single center and on a single social media site whose members may not be representative of the overall patient population at BMC. Although we do not know how generalizable our findings are (in terms of identifying QI targets), we feel that we have demonstrated how using social media to collect data on patient experience is feasible and could be informative for other hospitals in other locations. It is possible that we did not allow the experiment to run long enough; a longer time or broader outreach (eg, a handout given to every discharged patient over a longer period) may be needed to allow patients adequate opportunity to comment. Of note, we did not specifically examine responses by time period, but it does seem, in post hoc analysis, that after 2 weeks of data collection we reached theoretical saturation with no new themes emerging in the third week (eg, third‐week comments included I heart your nurses. and Love Baystate but hate the ER.). More work is also needed that includes a broader range of social media platforms and more participating hospitals.
In conclusion, the opportunity to provide feedback on Facebook has the potential to engage and empower patients, and hospitals can use these online narratives to help to drive improvement efforts. Yet potential benefits must be weighed against reputational risks, a lack of representative respondents, and the paucity of novel QI targets obtained in this study.
Disclosures: Dr. Lagu is supported by the National Heart, Lung, and Blood Institute of the National Institutes of Health under award number K01HL114745. The authors report no conflicts of interest.
- Centers for Medicare 47(2):193–219.
- , , , , . A mixed‐methods analysis of patient reviews of hospital care in England: implications for public reporting of health care quality data in the United States. Jt Comm J Qual Patient Saf. 2013;39(1):7–15.
- , , , , , , , . Taking Patients' Narratives about Clinicians from Anecdote to Science. NEJM. 2015;373(7):675–679.
- , . Putting the public back in public reporting of health care quality. JAMA. 2010;304(15):1711–1712.
- , , , et al. Use of social media across US hospitals: descriptive analysis of adoption and utilization. J Med Internet Res. 2014;16(11):e264.
- , , , , , . Patient use of email, Facebook, and physician websites to communicate with physicians: a national online survey of retail pharmacy users [published online June 24, 2015]. J Gen Intern Med. doi:10.1007/s11606-015-3374-7.
- Pew Research Center. Social networking fact sheet. Available at: http://www.pewinternet.org/fact‐sheets/social‐networking‐fact‐sheet. Accessed March 4, 2015.
- , . Three approaches to qualitative content analysis. Qual Health Res. 2005;15(9):1277–1288.
- , , , . Patients’ evaluations of health care providers in the era of social networking: an analysis of physician‐rating websites. J Gen Intern Med. 2010;25(9):942–946.
- , , , , . Vaccine counseling: a content analysis of patient‐physician discussions regarding human papilloma virus vaccine. Vaccine. 2011;29(43):7343–7349.
- . Qualitative research methods. Int J Qual Health Care. 2002;14(4):329–336.
- , . Doing Qualitative Research. Vol 2. Thousand Oaks, CA: Sage Publications; 1999.
- , , , . Patients’ perception of hospital care in the United States. N Engl J Med. 2008;359(18):1921–1931.
- , , , et al. Tweets about hospital quality: a mixed methods study. BMJ Qual Saf. 2014;23(10):838–846.
Paracentesis in Cirrhosis Patients/
Ascites is the most common complication of cirrhosis leading to hospital admission.[1] Approximately 12% of hospitalized patients who present with decompensated cirrhosis and ascites have spontaneous bacterial peritonitis (SBP); half of these patients do not present with abdominal pain, fever, nausea, or vomiting.[2] Guidelines published by the American Association for the Study of Liver Diseases (AASLD) recommend paracentesis for all hospitalized patients with cirrhosis and ascites and also recommend long‐term antibiotic prophylaxis for survivors of an SBP episode.[3] Despite evidence that in‐hospital mortality is reduced in those patients who receive paracentesis in a timely manner,[4, 5] only 40% to 60% of eligible patients receive paracentesis.[4, 6, 7] We aimed to describe clinical predictors of paracentesis and use of antibiotics following an episode of SBP in patients with decompensated cirrhosis and ascites.
METHODS
We conducted a retrospective cohort study of adults admitted to a single tertiary care center between January 1, 2009 and December 31, 2009.7 We included patients with an International Classification of Diseases, Ninth Revision discharge code consistent with decompensated cirrhosis who met clinical criteria for decompensated cirrhosis (see
RESULTS
We identified 193 admissions for 103 patients with decompensated cirrhosis and ascites (Table 1). Of these, 41% (80/193) received diagnostic paracentesis. Mean/standard deviation for age was 53.6/12.4 years; 71% of patients were male and 63% were English speaking. Common comorbidities included diabetes mellitus (33%), psychiatric diagnosis (29%), substance abuse (18%), and renal failure (17%). Excluding SBP, 31% of patients had another documented infection. Gastroenterology was consulted in 50% of the admissions. Fever was present in 27% of patients, elevated white blood cell (WBC) count (ie, WBC >11 k/mm3) was present in 27% of patients, International Normalized Ratio (INR) was elevated (>1.1) in 92% of patients, and 16% of patients had a platelet count of <50,000/mm3. Patients who received paracentesis were less likely to have a fever on presentation (19% vs 32%, P=0.06), low (ie, <50,000/mm3) platelet count (11% vs 19%, P=0.14), or concurrent gastrointestinal (GI) bleed (6% vs 16%, P=0.05). In a multiple logistic regression model including characteristics associated at P0.2 with paracentesis, fever, low platelet count, and concurrent GI bleeding were associated with decreased odds of receiving paracentesis (Appendix 1).
| Overall, N=193, Mean/SD or N (%)* | Paracentesis (), n=113, Mean/SD or N (%) | Paracentesis (+), n=80, Mean/SD or N (%) | Odds Ratio (95% CI) | |
|---|---|---|---|---|
| ||||
| Age, y | 53.6/12.4 | 54.1/13.4 | 53.2/11.7 | 1.00 (0.981.03) |
| Sex (male) | 137 (71.0%) | 78 (69.0%) | 59 (73.8%) | 1.26 (0.672.39) |
| English speaking | 122 (63.2%) | 69 (61.1%) | 53 (66.3%) | 1.25 (0.692.28) |
| Etiology | ||||
| Alcohol | 120 (62.2%) | 74 (65.5%) | 46 (57.5%) | 0.71 (0.401.29) |
| Hepatitis C | 94 (48.7%) | 57 (50.4%) | 37 (46.3%) | 0.85 (0.481.50) |
| Hepatitis B | 16 (8.3%) | 7 (6.2%) | 9 (11.3%) | 1.92 (0.685.39) |
| NASH | 8 (4.2%) | 4 (3.5%) | 4 (5.0%) | 1.43 (0.355.91) |
| Cryptogenic | 11 (5.7%) | 6 (5.3%) | 5 (6.3%) | 1.19 (0.354.04) |
| Comorbidities | ||||
| Substance abuse | 34 (17.6%) | 22 (19.5%) | 12 (15.0%) | 0.73 (0.341.58) |
| Psychiatric diagnosis | 55 (28.5%) | 38 (33.6%) | 17 (21.3%) | 0.53 (0.271.03) |
| Diabetes mellitus | 63 (32.6%) | 37 (32.7%) | 26 (32.5%) | 0.99 (0.541.82) |
| Renal failure | 33 (17.1%) | 20 (17.7%) | 13 (16.3%) | 0.90 (0.421.94) |
| GI bleed | 23 (11.9%) | 18 (15.9%) | 5 (6.3%) | 0.35 (0.120.99) |
| Admission MELD | 17.3/7.3 | 17.5/7.3 | 17.0/7.3 | 0.99 (0.951.03) |
| Creatinine, median/IQR | 0.9/0.7 | 0.9/0.7 | 0.9/0.8 | 1.02 (0.821.27) |
| Gastroenterology consult | 97 (50.3%) | 46 (40.7%) | 51 (63.8%) | 2.56 (1.424.63) |
| Infection, UTI, pneumonia, other | 60 (31.1%) | 38 (33.6%) | 22 (27.5%) | 0.75 (0.401.40) |
| Temperature 100.4F | 49 (26.8%) | 34 (32.4%) | 15 (19.2%) | 0.50 (0.251.00) |
| WBC >11 k/mm3 | 50 (27.3%) | 28 (26.7%) | 22 (28.2%) | 1.08 (0.562.08) |
| WBC <4 k/mm3 | 43 (23.5%) | 23 (21.9%) | 20 (25.6%) | 1.23 (0.622.44) |
| INR >1.1 | 149 (92.0%) | 83 (93.3%) | 66 (90.4%) | 0.68 (0.222.13) |
| Highest temperature, F | 98.9/1.1 | 99.1/1.3 | 98.8/0.8 | 0.82 (0.621.09) |
| Highest HR | 98.2/20.4 | 97.4/22.4 | 99.2/17.4 | 1.00 (0.991.02) |
| Highest RR | 24.5/13.7 | 25.2/16.8 | 23.5/7.8 | 0.99 (0.961.02) |
| Lowest SBP | 101.0/20.0 | 99.4/20.3 | 102.2/19.7 | 0.99 (0.981.01) |
| Lowest MAP | 73.0/12.2 | 73.2/13.3 | 72.7/10.6 | 1.00 (0.971.02) |
| Lowest O2Sat | 92.6/13.6 | 91.0/17.7 | 94.9/2.8 | 1.04 (0.991.10) |
| Highest PT | 15.8/3.8 | 15.9/3.7 | 15.7/3.9 | 0.98 (0.901.08) |
| Platelets 50 k/mm3 | 30 (15.9%) | 21 (19.3%) | 9 (11.3%) | 0.53 (0.231.23) |
Of the patients who received paracentesis (n=80), 14% were diagnosed with SBP. Of these, 55% received prophylaxis on discharge. Among the patients who did not receive paracentesis (n=113), 38 (34%) received antibiotics for another documented infection (eg, pneumonia), and 25 patients (22%) received antibiotics with no other documented infection or evidence of variceal bleeding. Of these 25 patients who were presumed to be empirically treated for SBP (Figure 1), only 20% were prescribed prophylactic antibiotics on discharge.

CONCLUSION
We found that many patients with decompensated cirrhosis and ascites did not receive paracentesis when hospitalized, which is similar to previously published data.[4, 6, 7] Clinical evidence of infection, such as fever or elevated WBC count, did not increase the odds of receiving paracentesis. Many patients treated for SBP were not discharged on prophylaxis.
This study is limited by its small single‐center design. We could only use data from 1 year (2009), because study data collection was part of a quality‐improvement project that took place for that year only. We did not adjust for the number of red blood cells in the ascitic fluid samples. We were also unable to determine the timing of gastroenterology consultation (whether it was done prior to paracentesis), admission venue (floor vs intensive care), or patient history of SBP.
Despite these limitations, there are important implications. First, the decision to perform paracentesis was not associated with symptoms of infection, although some clinical factors (eg, low platelets or GI bleeding) were associated with reduced odds of receiving paracentesis. Second, a majority of patients treated for SBP did not receive prophylactic antibiotics at discharge. These findings suggest a clear opportunity to increase awareness and acceptance of AASLD guidelines among hospital medicine practitioners. Quality‐improvement efforts should focus on the education of providers, and future research should identify barriers to paracentesis at both the practitioner and system levels (eg, availability of interventional radiology). Checklists or decision support within electronic order entry systems may also help reduce the low rates of paracentesis seen in our and prior studies.[4, 6, 7]
Disclosures: Dr. Lagu is supported by the National Heart, Lung, and Blood Institute of the National Institutes of Health under award number K01HL114745. Drs. Lagu, Ghaoui, and Brooling had full access to all of the data in the study. They take responsibility for the integrity of the data and the accuracy of the data analysis. Drs. Lagu, Ghaoui, and Brooling conceived of the study. Dr. Ghaoui acquired the data. Ms. Friderici carried out the statistical analyses. Drs. Lagu, Ghaoui, Brooling, Lindenauer, and Ms. Friderici analyzed and interpreted the data, drafted the manuscript, and critically reviewed the manuscript for important intellectual content. The authors report no conflicts of interest.
- , , , , ; Spanish Collaborative Study Group On Therapeutic Management In Liver Disease. Multicenter hospital study on prescribing patterns for prophylaxis and treatment of complications of cirrhosis. Eur J Clin Pharmacol. 2002;58(6):435–440.
- , , , et al. Bacterial infection in patients with advanced cirrhosis: a multicentre prospective study. Dig Liver Dis. 2001;33(1):41–48.
- , AASLD. Introduction to the revised American Association for the Study of Liver Diseases Practice Guideline management of adult patients with ascites due to cirrhosis 2012. Hepatology. 2013;57(4):1651–1653.
- , , , . Paracentesis is associated with reduced mortality in patients hospitalized with cirrhosis and ascites. Clin Gastroenterol Hepatol. 2014;12(3):496–503.e1.
- , , , et al. Delayed paracentesis is associated with increased in‐hospital mortality in patients with spontaneous bacterial peritonitis. Am J Gastroenterol. 2014;109(9):1436–1442.
- , , , et al. The quality of care provided to patients with cirrhosis and ascites in the Department of Veterans Affairs. Gastroenterology. 2012;143(1):70–77.
- , , , , , . Measurement of the quality of care of patients admitted with decompensated cirrhosis. Liver Int. 2014;34(2):204–210.
Ascites is the most common complication of cirrhosis leading to hospital admission.[1] Approximately 12% of hospitalized patients who present with decompensated cirrhosis and ascites have spontaneous bacterial peritonitis (SBP); half of these patients do not present with abdominal pain, fever, nausea, or vomiting.[2] Guidelines published by the American Association for the Study of Liver Diseases (AASLD) recommend paracentesis for all hospitalized patients with cirrhosis and ascites and also recommend long‐term antibiotic prophylaxis for survivors of an SBP episode.[3] Despite evidence that in‐hospital mortality is reduced in those patients who receive paracentesis in a timely manner,[4, 5] only 40% to 60% of eligible patients receive paracentesis.[4, 6, 7] We aimed to describe clinical predictors of paracentesis and use of antibiotics following an episode of SBP in patients with decompensated cirrhosis and ascites.
METHODS
We conducted a retrospective cohort study of adults admitted to a single tertiary care center between January 1, 2009 and December 31, 2009.7 We included patients with an International Classification of Diseases, Ninth Revision discharge code consistent with decompensated cirrhosis who met clinical criteria for decompensated cirrhosis (see
RESULTS
We identified 193 admissions for 103 patients with decompensated cirrhosis and ascites (Table 1). Of these, 41% (80/193) received diagnostic paracentesis. Mean/standard deviation for age was 53.6/12.4 years; 71% of patients were male and 63% were English speaking. Common comorbidities included diabetes mellitus (33%), psychiatric diagnosis (29%), substance abuse (18%), and renal failure (17%). Excluding SBP, 31% of patients had another documented infection. Gastroenterology was consulted in 50% of the admissions. Fever was present in 27% of patients, elevated white blood cell (WBC) count (ie, WBC >11 k/mm3) was present in 27% of patients, International Normalized Ratio (INR) was elevated (>1.1) in 92% of patients, and 16% of patients had a platelet count of <50,000/mm3. Patients who received paracentesis were less likely to have a fever on presentation (19% vs 32%, P=0.06), low (ie, <50,000/mm3) platelet count (11% vs 19%, P=0.14), or concurrent gastrointestinal (GI) bleed (6% vs 16%, P=0.05). In a multiple logistic regression model including characteristics associated at P0.2 with paracentesis, fever, low platelet count, and concurrent GI bleeding were associated with decreased odds of receiving paracentesis (Appendix 1).
| Overall, N=193, Mean/SD or N (%)* | Paracentesis (), n=113, Mean/SD or N (%) | Paracentesis (+), n=80, Mean/SD or N (%) | Odds Ratio (95% CI) | |
|---|---|---|---|---|
| ||||
| Age, y | 53.6/12.4 | 54.1/13.4 | 53.2/11.7 | 1.00 (0.981.03) |
| Sex (male) | 137 (71.0%) | 78 (69.0%) | 59 (73.8%) | 1.26 (0.672.39) |
| English speaking | 122 (63.2%) | 69 (61.1%) | 53 (66.3%) | 1.25 (0.692.28) |
| Etiology | ||||
| Alcohol | 120 (62.2%) | 74 (65.5%) | 46 (57.5%) | 0.71 (0.401.29) |
| Hepatitis C | 94 (48.7%) | 57 (50.4%) | 37 (46.3%) | 0.85 (0.481.50) |
| Hepatitis B | 16 (8.3%) | 7 (6.2%) | 9 (11.3%) | 1.92 (0.685.39) |
| NASH | 8 (4.2%) | 4 (3.5%) | 4 (5.0%) | 1.43 (0.355.91) |
| Cryptogenic | 11 (5.7%) | 6 (5.3%) | 5 (6.3%) | 1.19 (0.354.04) |
| Comorbidities | ||||
| Substance abuse | 34 (17.6%) | 22 (19.5%) | 12 (15.0%) | 0.73 (0.341.58) |
| Psychiatric diagnosis | 55 (28.5%) | 38 (33.6%) | 17 (21.3%) | 0.53 (0.271.03) |
| Diabetes mellitus | 63 (32.6%) | 37 (32.7%) | 26 (32.5%) | 0.99 (0.541.82) |
| Renal failure | 33 (17.1%) | 20 (17.7%) | 13 (16.3%) | 0.90 (0.421.94) |
| GI bleed | 23 (11.9%) | 18 (15.9%) | 5 (6.3%) | 0.35 (0.120.99) |
| Admission MELD | 17.3/7.3 | 17.5/7.3 | 17.0/7.3 | 0.99 (0.951.03) |
| Creatinine, median/IQR | 0.9/0.7 | 0.9/0.7 | 0.9/0.8 | 1.02 (0.821.27) |
| Gastroenterology consult | 97 (50.3%) | 46 (40.7%) | 51 (63.8%) | 2.56 (1.424.63) |
| Infection, UTI, pneumonia, other | 60 (31.1%) | 38 (33.6%) | 22 (27.5%) | 0.75 (0.401.40) |
| Temperature 100.4F | 49 (26.8%) | 34 (32.4%) | 15 (19.2%) | 0.50 (0.251.00) |
| WBC >11 k/mm3 | 50 (27.3%) | 28 (26.7%) | 22 (28.2%) | 1.08 (0.562.08) |
| WBC <4 k/mm3 | 43 (23.5%) | 23 (21.9%) | 20 (25.6%) | 1.23 (0.622.44) |
| INR >1.1 | 149 (92.0%) | 83 (93.3%) | 66 (90.4%) | 0.68 (0.222.13) |
| Highest temperature, F | 98.9/1.1 | 99.1/1.3 | 98.8/0.8 | 0.82 (0.621.09) |
| Highest HR | 98.2/20.4 | 97.4/22.4 | 99.2/17.4 | 1.00 (0.991.02) |
| Highest RR | 24.5/13.7 | 25.2/16.8 | 23.5/7.8 | 0.99 (0.961.02) |
| Lowest SBP | 101.0/20.0 | 99.4/20.3 | 102.2/19.7 | 0.99 (0.981.01) |
| Lowest MAP | 73.0/12.2 | 73.2/13.3 | 72.7/10.6 | 1.00 (0.971.02) |
| Lowest O2Sat | 92.6/13.6 | 91.0/17.7 | 94.9/2.8 | 1.04 (0.991.10) |
| Highest PT | 15.8/3.8 | 15.9/3.7 | 15.7/3.9 | 0.98 (0.901.08) |
| Platelets 50 k/mm3 | 30 (15.9%) | 21 (19.3%) | 9 (11.3%) | 0.53 (0.231.23) |
Of the patients who received paracentesis (n=80), 14% were diagnosed with SBP. Of these, 55% received prophylaxis on discharge. Among the patients who did not receive paracentesis (n=113), 38 (34%) received antibiotics for another documented infection (eg, pneumonia), and 25 patients (22%) received antibiotics with no other documented infection or evidence of variceal bleeding. Of these 25 patients who were presumed to be empirically treated for SBP (Figure 1), only 20% were prescribed prophylactic antibiotics on discharge.
CONCLUSION
We found that many patients with decompensated cirrhosis and ascites did not receive paracentesis when hospitalized, which is similar to previously published data.[4, 6, 7] Clinical evidence of infection, such as fever or elevated WBC count, did not increase the odds of receiving paracentesis. Many patients treated for SBP were not discharged on prophylaxis.
This study is limited by its small single‐center design. We could only use data from 1 year (2009), because study data collection was part of a quality‐improvement project that took place for that year only. We did not adjust for the number of red blood cells in the ascitic fluid samples. We were also unable to determine the timing of gastroenterology consultation (whether it was done prior to paracentesis), admission venue (floor vs intensive care), or patient history of SBP.
Despite these limitations, there are important implications. First, the decision to perform paracentesis was not associated with symptoms of infection, although some clinical factors (eg, low platelets or GI bleeding) were associated with reduced odds of receiving paracentesis. Second, a majority of patients treated for SBP did not receive prophylactic antibiotics at discharge. These findings suggest a clear opportunity to increase awareness and acceptance of AASLD guidelines among hospital medicine practitioners. Quality‐improvement efforts should focus on the education of providers, and future research should identify barriers to paracentesis at both the practitioner and system levels (eg, availability of interventional radiology). Checklists or decision support within electronic order entry systems may also help reduce the low rates of paracentesis seen in our and prior studies.[4, 6, 7]
Disclosures: Dr. Lagu is supported by the National Heart, Lung, and Blood Institute of the National Institutes of Health under award number K01HL114745. Drs. Lagu, Ghaoui, and Brooling had full access to all of the data in the study. They take responsibility for the integrity of the data and the accuracy of the data analysis. Drs. Lagu, Ghaoui, and Brooling conceived of the study. Dr. Ghaoui acquired the data. Ms. Friderici carried out the statistical analyses. Drs. Lagu, Ghaoui, Brooling, Lindenauer, and Ms. Friderici analyzed and interpreted the data, drafted the manuscript, and critically reviewed the manuscript for important intellectual content. The authors report no conflicts of interest.
- , , , , ; Spanish Collaborative Study Group On Therapeutic Management In Liver Disease. Multicenter hospital study on prescribing patterns for prophylaxis and treatment of complications of cirrhosis. Eur J Clin Pharmacol. 2002;58(6):435–440.
- , , , et al. Bacterial infection in patients with advanced cirrhosis: a multicentre prospective study. Dig Liver Dis. 2001;33(1):41–48.
- , AASLD. Introduction to the revised American Association for the Study of Liver Diseases Practice Guideline management of adult patients with ascites due to cirrhosis 2012. Hepatology. 2013;57(4):1651–1653.
- , , , . Paracentesis is associated with reduced mortality in patients hospitalized with cirrhosis and ascites. Clin Gastroenterol Hepatol. 2014;12(3):496–503.e1.
- , , , et al. Delayed paracentesis is associated with increased in‐hospital mortality in patients with spontaneous bacterial peritonitis. Am J Gastroenterol. 2014;109(9):1436–1442.
- , , , et al. The quality of care provided to patients with cirrhosis and ascites in the Department of Veterans Affairs. Gastroenterology. 2012;143(1):70–77.
- , , , , , . Measurement of the quality of care of patients admitted with decompensated cirrhosis. Liver Int. 2014;34(2):204–210.
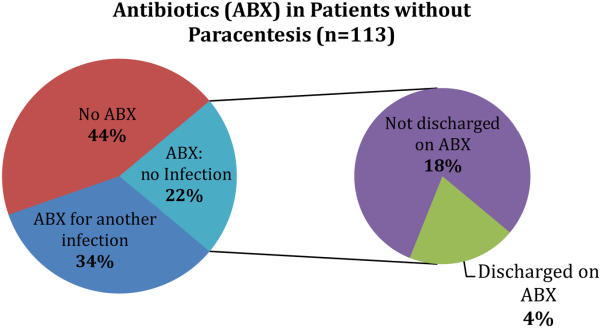
Antipsychotics in Hospitalized Elders
Antipsychotic (AP) medications are often used in the hospitalized geriatric population for the treatment of delirium.[1] Because of adverse events associated with APs, efforts have been made to reduce their use in hospitalized elders,[2] but it is not clear if these recommendations have been widely adopted. We studied the use of APs in a cohort of hospitalized elders to better understand why APs are started and how often they are continued on discharge.
METHODS
We conducted a retrospective cohort study of patients aged 65 years or older admitted to a tertiary care hospital between October 1, 2012 and September 31, 2013. Using Stata's (StataCorp., College Station, TX) sample command,[3] we included a subset of randomly selected inpatients who received more than 1 dose of oral APs (determined using the electronic medication administration summary). We excluded patients admitted under observation status or to the psychiatric service, those who were on APs prior to admission, and those who only received prochloperazine for nausea. Using prior literature to identify terms frequently used to describe delirium (Figure 1), we created an algorithm and a chart abstraction form (see Supporting Information, Appendix 1, in the online version of this article).[4] We tested these instruments in a preliminary chart review involving 30 patients. Disagreements were discussed with coauthors and resolved through consensus, resulting in some algorithm changes (eg, excluding a large number of patients who received only 1 dose of haloperidol postoperatively, because we hypothesized that this use could be a prophylactic measure).[5] Two investigators extracted the remaining charts independently. We used descriptive statistics and performed cross‐tabulations on the selected variables.

RESULTS
Of 12,817 geriatric hospitalizations during the study period, 1120 (9%) were treated with antipsychotics. We randomly selected 300 of these for extraction: 54% were male, and 67% were admitted to the medical service (Table 1). The inpatient mortality rate was 10% (30/300). The most frequent indication for AP use was delirium (83%, 249/300). Only 35% of delirious patients received a formal assessment with the Confusion Assessment Method (CAM). The most commonly used atypical antipsychotic was quetiapine (86%); 55% received more than 1 antipsychotic medication during hospitalization, and 48% (143/297) of patients were continued on APs at discharge (excluding 3 patients transferred to other acute care hospitals).
| Variable | N (%), Total=300 |
|---|---|
| |
| Gender | |
| Male | 161 (54) |
| Female | 139 (46) |
| Inpatient mortality rate | 30 (10) |
| Services | |
| Medicine | 202 (67) |
| Surgery | 98 (33) |
| Indication for APs use | |
| Delirium | 249 (83) |
| Hallucinations | 19 (6) |
| Anxiety | 20 (7) |
| Other | 38 (13) |
| Atypical APs | |
| Quetiapine | 257 (86) |
| Olanzapine | 29 (10) |
| Risperidone | 26 (9) |
| Typical APs | |
| Haloperidol | 166 (55) |
| Thorazine | 4 (1) |
| Use of CAM | 79 (32)a |
| Physical restraints | 89 (30) |
| Documented or suspected dementia | 134 (45) |
| Geriatrics consults | 120 (40) |
| Psychiatric consults | 29 (10) |
| ECG | |
| Prior to APs administration | 265 (88) |
| After APs administration | 157 (52) |
| QTc prolongation >500 ms | |
| Prior to APs administration | 41 (15)b |
| After APs administration | 39 (25)c |
| Admitted from SNF | 36 (12) |
| Discharge destination | |
| Home | 68 (23) |
| SNFs, short and long‐term rehabilitations | 199 (66) |
| Transfer to other acute care hospitals | 3 (1) |
| Continuation of APs at discharge | 143 (48)d |
Approximately 45% (134/300) had documented or suspected dementia, and 30% (89/300) were physically restrained during the hospital stay. Consultations with geriatrics were obtained in 40% (120/300) of the cases and with psychiatry in 10% (29/300) of the cases. Neurology is rarely consulted for delirium in our institution; thus, we did not collect data on those referrals. Electrocardiography (ECG) (recommended for patients at high cardiac risk[6]) was performed in 88% (265/300) of patients prior to AP administration and 52% (157/300) after. The corrected QT interval exceeded 500 ms in 15% (41/265) of patients prior to AP administration and 25% (39/157) after. Although few patients (12%) were admitted from nursing facilities, 66% (199/300) were eventually discharged to skilled nursing facilities (SNFs) or rehabilitation facilities; most of these patients (117/199, 59%) received AP treatment, compared to 38% of patients discharged to home (26/68).
DISCUSSION
In a cohort of hospitalized elders, we found that 9% were treated with APs. Most received APs for perceived delirium; in‐hospital ECG monitoring was suboptimal. Half of the patients started on APs remained on them at discharge; those discharged to SNFs were more likely to receive ongoing AP treatment.
Our study is limited by its retrospective, single‐center design, a lack of inter‐rater reliability measurement (although our training process was designed to standardize extraction methods), and the infrequent use of formal CAM assessment. Additionally, we were unable to determine how frequently APs were initiated in the intensive care unit. Any retrospective study is limited by the difficulty of distinguishing delirium from the behavioral and psychiatric symptoms of dementia, but we identified delirium using standard terms described in previous literature.
Our study also has a number of important implications. Because of a reported association between the use of APs and risk of death in the postacute setting,[7] national provider organizations have called for a reduction in AP initiation in hospitalized elders.[2] However, this study indicates that APs continue to be prescribed for delirium, which may be attributed to the lack of behavioral modification options in most hospitals, such as acute care for elders (ACE) units and hospital elder life programs (HELP).[8, 9] Our findings suggest that this problem would be further amplified in hospitals that lack access to geriatrics expertise.
Without alternative behavioral options, patients are at risk for prolonged delirium, which is associated with significant suffering and subsequent risk of further cognitive impairment and death.[10] Although evidence for the efficacy of APs in the treatment of delirium is limited and inconclusive, no better pharmacologic options exist. Hospitals that wish to reduce use of APs should therefore consider investing in environmental interventions (eg, ACE units, HELP), which lower the incidence of delirium and could, in turn, decrease the prescription and continuation of antipsychotics.[8, 9]
Acknowledgements
The authors acknowledge Mihaela Stefan, MD, FACP, for her comments on an earlier draft of this manuscript.
Disclosures: Drs. Lagu and Loh had full access to all of the data in the study. They take responsibility for the integrity of the data and the accuracy of the analysis. Drs. Loh, Brennan, Lindenauer, and Lagu conceived of the study. Drs. Loh and Ramdass acquired the data. Ms. Garb analyzed and interpreted the data. Dr. Loh drafted the manuscript. Drs Brennan, Lindenauer, and Lagu, and Ms. Garb critically reviewed the manuscript for important intellectual content. Dr. Lagu is supported by the National Heart, Lung, and Blood Institute of the National Institutes of Health under award number K01HL114745. The authors report no conflicts of interest.
- , , , , , . Delirium in elderly patients and the risk of postdischarge mortality, institutionalization, and dementia: a meta‐analysis. JAMA. 2010;304(4):443–451.
- . Off‐label use of antipsychotics for dementia patients discouraged. The Hospitalist. November 2012\http://www.the‐hospitalist.org/details/article/2785121/Off‐Label_Use_of_Antipsychotics_for_Dementia_Patients_Discouraged.html. Accessed June 29, 2014.
- STATA/MP [computer program]. Version 13.1 for Windows. College Station, TX: StataCorp; 2013.
- , , , , , . Association between sedating medications and delirium in older inpatients. J Am Geriatr Soc. 2013;61(6):923–930.
- , , , et al. Haloperidol prophylaxis decreases delirium incidence in elderly patients after noncardiac surgery: a randomized controlled trial. Crit Care Med. 2012;40(3):731–739.
- , , . QTc prolongation with antipsychotics: is routine ECG monitoring recommended? J Psychiatr Pract. 2014;20(3):196–206.
- , , , , . Risk of death associated with the use of conventional versus atypical antipsychotic drugs among elderly patients. CMAJ. 2007;176(5):627–632.
- , , , et al. Effectiveness of acute geriatric unit care using acute care for elders components: a systematic review and meta‐analysis. J Am Geriatr Soc. 2012;60(12):2237–2245.
- , , , , . The Hospital Elder Life Program: a model of care to prevent cognitive and functional decline in older hospitalized patients. J Am Geriatr Soc. 2000;48(12):1697–1706.
- , , , . Persistent delirium in older hospital patients: a systematic review of frequency and prognosis. Age Ageing. 2009;38(1):19–26.
Antipsychotic (AP) medications are often used in the hospitalized geriatric population for the treatment of delirium.[1] Because of adverse events associated with APs, efforts have been made to reduce their use in hospitalized elders,[2] but it is not clear if these recommendations have been widely adopted. We studied the use of APs in a cohort of hospitalized elders to better understand why APs are started and how often they are continued on discharge.
METHODS
We conducted a retrospective cohort study of patients aged 65 years or older admitted to a tertiary care hospital between October 1, 2012 and September 31, 2013. Using Stata's (StataCorp., College Station, TX) sample command,[3] we included a subset of randomly selected inpatients who received more than 1 dose of oral APs (determined using the electronic medication administration summary). We excluded patients admitted under observation status or to the psychiatric service, those who were on APs prior to admission, and those who only received prochloperazine for nausea. Using prior literature to identify terms frequently used to describe delirium (Figure 1), we created an algorithm and a chart abstraction form (see Supporting Information, Appendix 1, in the online version of this article).[4] We tested these instruments in a preliminary chart review involving 30 patients. Disagreements were discussed with coauthors and resolved through consensus, resulting in some algorithm changes (eg, excluding a large number of patients who received only 1 dose of haloperidol postoperatively, because we hypothesized that this use could be a prophylactic measure).[5] Two investigators extracted the remaining charts independently. We used descriptive statistics and performed cross‐tabulations on the selected variables.
RESULTS
Of 12,817 geriatric hospitalizations during the study period, 1120 (9%) were treated with antipsychotics. We randomly selected 300 of these for extraction: 54% were male, and 67% were admitted to the medical service (Table 1). The inpatient mortality rate was 10% (30/300). The most frequent indication for AP use was delirium (83%, 249/300). Only 35% of delirious patients received a formal assessment with the Confusion Assessment Method (CAM). The most commonly used atypical antipsychotic was quetiapine (86%); 55% received more than 1 antipsychotic medication during hospitalization, and 48% (143/297) of patients were continued on APs at discharge (excluding 3 patients transferred to other acute care hospitals).
| Variable | N (%), Total=300 |
|---|---|
| |
| Gender | |
| Male | 161 (54) |
| Female | 139 (46) |
| Inpatient mortality rate | 30 (10) |
| Services | |
| Medicine | 202 (67) |
| Surgery | 98 (33) |
| Indication for APs use | |
| Delirium | 249 (83) |
| Hallucinations | 19 (6) |
| Anxiety | 20 (7) |
| Other | 38 (13) |
| Atypical APs | |
| Quetiapine | 257 (86) |
| Olanzapine | 29 (10) |
| Risperidone | 26 (9) |
| Typical APs | |
| Haloperidol | 166 (55) |
| Thorazine | 4 (1) |
| Use of CAM | 79 (32)a |
| Physical restraints | 89 (30) |
| Documented or suspected dementia | 134 (45) |
| Geriatrics consults | 120 (40) |
| Psychiatric consults | 29 (10) |
| ECG | |
| Prior to APs administration | 265 (88) |
| After APs administration | 157 (52) |
| QTc prolongation >500 ms | |
| Prior to APs administration | 41 (15)b |
| After APs administration | 39 (25)c |
| Admitted from SNF | 36 (12) |
| Discharge destination | |
| Home | 68 (23) |
| SNFs, short and long‐term rehabilitations | 199 (66) |
| Transfer to other acute care hospitals | 3 (1) |
| Continuation of APs at discharge | 143 (48)d |
Approximately 45% (134/300) had documented or suspected dementia, and 30% (89/300) were physically restrained during the hospital stay. Consultations with geriatrics were obtained in 40% (120/300) of the cases and with psychiatry in 10% (29/300) of the cases. Neurology is rarely consulted for delirium in our institution; thus, we did not collect data on those referrals. Electrocardiography (ECG) (recommended for patients at high cardiac risk[6]) was performed in 88% (265/300) of patients prior to AP administration and 52% (157/300) after. The corrected QT interval exceeded 500 ms in 15% (41/265) of patients prior to AP administration and 25% (39/157) after. Although few patients (12%) were admitted from nursing facilities, 66% (199/300) were eventually discharged to skilled nursing facilities (SNFs) or rehabilitation facilities; most of these patients (117/199, 59%) received AP treatment, compared to 38% of patients discharged to home (26/68).
DISCUSSION
In a cohort of hospitalized elders, we found that 9% were treated with APs. Most received APs for perceived delirium; in‐hospital ECG monitoring was suboptimal. Half of the patients started on APs remained on them at discharge; those discharged to SNFs were more likely to receive ongoing AP treatment.
Our study is limited by its retrospective, single‐center design, a lack of inter‐rater reliability measurement (although our training process was designed to standardize extraction methods), and the infrequent use of formal CAM assessment. Additionally, we were unable to determine how frequently APs were initiated in the intensive care unit. Any retrospective study is limited by the difficulty of distinguishing delirium from the behavioral and psychiatric symptoms of dementia, but we identified delirium using standard terms described in previous literature.
Our study also has a number of important implications. Because of a reported association between the use of APs and risk of death in the postacute setting,[7] national provider organizations have called for a reduction in AP initiation in hospitalized elders.[2] However, this study indicates that APs continue to be prescribed for delirium, which may be attributed to the lack of behavioral modification options in most hospitals, such as acute care for elders (ACE) units and hospital elder life programs (HELP).[8, 9] Our findings suggest that this problem would be further amplified in hospitals that lack access to geriatrics expertise.
Without alternative behavioral options, patients are at risk for prolonged delirium, which is associated with significant suffering and subsequent risk of further cognitive impairment and death.[10] Although evidence for the efficacy of APs in the treatment of delirium is limited and inconclusive, no better pharmacologic options exist. Hospitals that wish to reduce use of APs should therefore consider investing in environmental interventions (eg, ACE units, HELP), which lower the incidence of delirium and could, in turn, decrease the prescription and continuation of antipsychotics.[8, 9]
Acknowledgements
The authors acknowledge Mihaela Stefan, MD, FACP, for her comments on an earlier draft of this manuscript.
Disclosures: Drs. Lagu and Loh had full access to all of the data in the study. They take responsibility for the integrity of the data and the accuracy of the analysis. Drs. Loh, Brennan, Lindenauer, and Lagu conceived of the study. Drs. Loh and Ramdass acquired the data. Ms. Garb analyzed and interpreted the data. Dr. Loh drafted the manuscript. Drs Brennan, Lindenauer, and Lagu, and Ms. Garb critically reviewed the manuscript for important intellectual content. Dr. Lagu is supported by the National Heart, Lung, and Blood Institute of the National Institutes of Health under award number K01HL114745. The authors report no conflicts of interest.
- , , , , , . Delirium in elderly patients and the risk of postdischarge mortality, institutionalization, and dementia: a meta‐analysis. JAMA. 2010;304(4):443–451.
- . Off‐label use of antipsychotics for dementia patients discouraged. The Hospitalist. November 2012\http://www.the‐hospitalist.org/details/article/2785121/Off‐Label_Use_of_Antipsychotics_for_Dementia_Patients_Discouraged.html. Accessed June 29, 2014.
- STATA/MP [computer program]. Version 13.1 for Windows. College Station, TX: StataCorp; 2013.
- , , , , , . Association between sedating medications and delirium in older inpatients. J Am Geriatr Soc. 2013;61(6):923–930.
- , , , et al. Haloperidol prophylaxis decreases delirium incidence in elderly patients after noncardiac surgery: a randomized controlled trial. Crit Care Med. 2012;40(3):731–739.
- , , . QTc prolongation with antipsychotics: is routine ECG monitoring recommended? J Psychiatr Pract. 2014;20(3):196–206.
- , , , , . Risk of death associated with the use of conventional versus atypical antipsychotic drugs among elderly patients. CMAJ. 2007;176(5):627–632.
- , , , et al. Effectiveness of acute geriatric unit care using acute care for elders components: a systematic review and meta‐analysis. J Am Geriatr Soc. 2012;60(12):2237–2245.
- , , , , . The Hospital Elder Life Program: a model of care to prevent cognitive and functional decline in older hospitalized patients. J Am Geriatr Soc. 2000;48(12):1697–1706.
- , , , . Persistent delirium in older hospital patients: a systematic review of frequency and prognosis. Age Ageing. 2009;38(1):19–26.
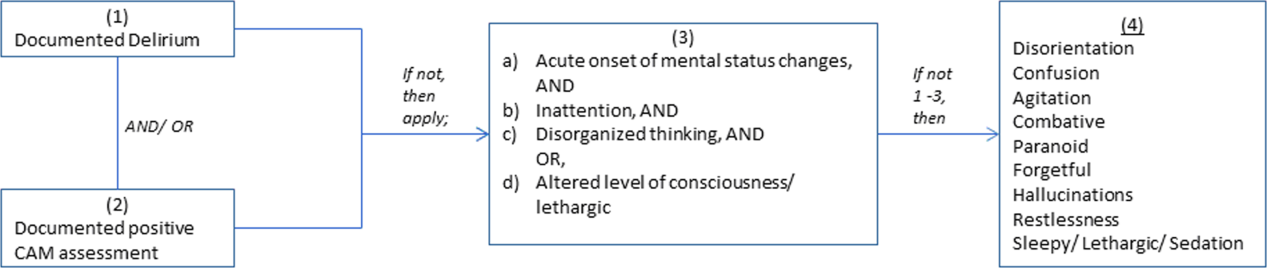
Hospitalists' Use of PPIs
Proton pump inhibitors (PPIs) are commonly used to treat acid‐related disorders but are associated with an increased risk of pneumonia and Clostridium difficile‐associated diarrhea.[1, 2] Initiation of PPIs in hospitalized patients should therefore be limited to specific clinical situations, such as upper gastrointestinal bleeding or stress ulcer prophylaxis in the critically ill.[3] Prior studies suggest significant overuse of PPIs in hospitalized patients exists,[4, 5, 6, 7] but these were published before the widespread implementation of local and national quality improvement efforts targeted at reducing PPI use in medical inpatients (eg, Society of Hospital Medicine's Choosing Wisely list[8]). We aimed to determine the frequency of inappropriate use of PPIs in a contemporary cohort of hospitalized patients in a tertiary care academic medical center.
METHODS
We conducted a retrospective cohort study of 297 patients admitted to a tertiary care center hospitalist service comprised of teaching and nonteaching medical patients who were not critically ill, were admitted between January 1, 2012 and March 31, 2012, and received a PPI during their hospital stay. Three internists used American College of Gastroenterology and the American Society for Gastrointestinal Endoscopy and prior studies to develop criteria to identify appropriate and inappropriate PPI use (Table 1).[4, 5, 6, 7] Appropriate indications included gastrointestinal (GI) bleeding, esophagitis, gastritis, gastroesophageal reflux (GERD), and continuation of home PPI (abrupt discontinuation can trigger reflux symptoms).[9] We extracted the medical records of included patients, applying our prespecified criteria to determine whether use was appropriate. In patients in whom PPI was a continued home medication, we also extracted 2 years of data prior to the index date to determine if the medication was started during a prior hospital admission and, if so, whether this initiation was appropriate. We used descriptive statistics and [2] tests to compare patient characteristics and indications for PPI use.
| Appropriate PPI use | Inappropriate PPI use |
|---|---|
| |
| History of upper GI bleeding | No reason given |
| Endoscopic evidence of peptic ulcer disease | Unspecified GI prophylaxis |
| Esophagitis | Nonspecific abdominal pain |
| Gastritis and duodenitis | Heartburn (nonchronic) |
| Eradication of H pylori | Acute pancreatitis |
| GERD | Anemia |
| Barrett's esophagus | Heparin use for DVT prophylaxis |
| Continued on home PPI | Use of aspirin, NSAID, steroids or Coumadin (as a single agent) |
| Acute esophageal variceal bleeding | |
| NSAID used in patient >65 years‐old | |
| High‐risk groups; combination of 2 or more of aspirin, NSAID, clopidogrel, or Coumadin | |
RESULTS
Of 297 patients, the mean age was 64.4 years (standard deviation 16.3 years), most were white (69%), and 56% were women (Table 2). PPI use was appropriate in 231 (78%, 95% confidence interval: 72.6%‐82.4%) patients. Of these, a majority (172, 75%) of patients received a PPI because it was a continued home medication. Only 40 of the 172 patients had the medication started during a recent hospitalization, and in half of those cases (20) the PPI use was appropriate.
| Demographics | PPI Not Indicated, N=66 | PPI Indicated, N=231 | Total=297 | |||
|---|---|---|---|---|---|---|
| ||||||
| Age, y, mean (SD) | 62.5 | (16.2) | 64.9 | (16.3) | 64.4 | (16.3) |
| Sex, % No. | ||||||
| Female | 51.5% | 34 | 56.7% | 131 | 55.6% | 165 |
| Male | 48.5% | 32 | 43.3% | 100 | 44.4% | 132 |
| Race, % No. | ||||||
| Asian | 0.0% | 0 | 0.9% | 2 | 0.7% | 2 |
| Black | 10.6% | 7 | 9.1% | 21 | 9.4% | 28 |
| Hispanic | 18.2% | 12 | 19.5% | 45 | 19.2% | 57 |
| Unknown | 0.0% | 0 | 2.2% | 5 | 1.7% | 5 |
| White | 71.2% | 47 | 68.4% | 158 | 69.0% | 205 |
| Insurance, % No. | ||||||
| Insured | 95.5% | 63 | 87.4% | 202 | 89.2% | 265 |
| Uninsured | 0.0% | 0 | 0.9% | 2 | 0.7% | 2 |
| Unknown | 4.5% | 3 | 11.7% | 27 | 10.1% | 30 |
| Service, % No. | ||||||
| Teaching | 25.8% | 17 | 32.9% | 76 | 31.3% | 93 |
| Nonteaching | 74.2% | 49 | 66.7% | 154 | 68.4% | 203 |
| Unknown | 0.0% | 0 | 0.4% | 1 | 0.3% | 1 |
| Chronic disease, % No. | ||||||
| Cardiac disease | 16.7% | 11 | 13.4% | 31 | 14.1% | 42 |
| Pulmonary disease | 16.7% | 11 | 14.7% | 34 | 15.2% | 45 |
| Gastrointestinal disease | 13.6% | 9 | 19.5% | 45 | 18.2% | 54 |
| Hepatic disease | 7.6% | 5 | 3.9% | 9 | 4.7% | 14 |
| Stroke | 1.5% | 1 | 5.2% | 12 | 4.4% | 13 |
| Sepsis | 12.1% | 8 | 13.0% | 30 | 12.8% | 38 |
| Other | 33.3% | 22 | 29.4% | 68 | 30.3% | 90 |
| PPI status, % No. | ||||||
| Continued home PPI | 0.0% | 0 | 74.5% | 172 | 58.1% | 172 |
| Started on PPI in hospital | 100% | 65 | 25.5% | 59 | 41.9% | 124 |
| Discharged on AST, % No. | ||||||
| Yes | 36.4% | 24 | 89.6% | 207 | 22.2% | 231 |
| PPI | 87.5% | 21 | 96.6% | 200 | 95.7% | 221 |
| Brand | 52.4% | 11 | 59.5% | 119 | 58.8% | 130 |
| Generic | 47.6% | 10 | 40.5% | 81 | 41.2% | 91 |
| H2 blocker | 12.5% | 3 | 3.4% | 7 | 4.3% | 10 |
| Brand | 0.0% | 0 | 71.4% | 5 | 50.0% | 5 |
| Generic | 100.0% | 3 | 28.6% | 2 | 50.0% | 5 |
| Medications, % No. | ||||||
| Aspirin | 36.4% | 24 | 43.7% | 101 | 42.1% | 125 |
| NSAID | 10.6% | 4 | 6.5% | 15 | 6.4% | 19 |
| Corticosteroids | 13.6% | 9 | 16.9% | 39 | 16.2% | 48 |
| Warfarin | 0.0% | 5 | 19.0% | 44 | 16.5% | 49 |
| Clopidogrel | 12.1% | 8 | 10.8% | 25 | 11.1% | 33 |
The second most common appropriate diagnosis was GERD (31%), followed by history of GI bleeding (19%) and treatment for esophagitis or gastritis (18%). Among the 66 patients receiving a PPI inappropriately, the majority of patients (56%) had no documented reason for PPI use, and only 11 patients (17%) were receiving PPI for stress ulcer prophylaxis (Figure 1). Five patients (8%) were treated prophylactically because of steroid or anticoagulant use. We observed no differences in age, gender, race, or reason for admission between the patients treated appropriately versus inappropriately.

DISCUSSION
In a contemporary cohort, chronic PPI use prior to admission was the most common reason PPIs were prescribed in the hospital. About 20% of hospitalized patients were started on a PPI for an inappropriate indication, the majority of whom lacked documentation concerning the reason for use. Among patients treated inappropriately, 36% were discharged on acid‐suppressive therapy.
The prior literature has reported a much higher percentages of unnecessary PPI use in hospitalized patients.[4, 5, 6, 7] Gupta et al. found that 70% of patients admitted to an internal medicine service received acid‐suppressive therapy, 73% of whom were treated unnecessarily.[5] Similarly, Nardino et al. found that 65% of acid‐suppressive therapy in hospitalized medical patients was not indicated.[4] If we had excluded patients on home PPIs from our study cohort, we would have found a higher rate of inappropriate use due to a smaller overall patient population. However, we chose to include these patients because they represented the vast majority of hospitalist‐prescribed PPIs. Notably, most of these prior prescriptions were not written during a recent hospital stay, indicating that the majority were initiated by outpatient physicians.
Our study is limited by its small sample size, single‐center design, and inability to determine the indications for outpatient PPI use. Still, it has important implications. Prior work has suggested that focusing efforts on PPI overuse may be premature in the absence of valid risk‐prediction models defining the patient populations that most benefit from PPI therapy.[10] Our work additionally suggests that hospital rates of inappropriate initiation may be relatively low, perhaps because hospitalist culture and practice have been affected by both local and national quality improvement efforts and by evidence dissemination.[8] Quality improvement efforts focused on reducing inpatient PPI use are likely to reveal diminishing returns, as admitting hospitalists are unlikely to abruptly discontinue PPIs prescribed in the outpatient setting.[9] Hospitalists should be encouraged to assess and document the need for PPIs during admission, hospitalization, and discharge processes. However, future efforts to reduce PPI overuse among hospitalized patients should predominately be focused on reducing inappropriate chronic PPI use in the outpatient setting.
Acknowledgements
The authors acknowledge Peter Lindenauer for his comments on an earlier draft of this manuscript.
Disclosures: The study was conducted with funding from the Department of Medicine at Baystate Medical Center. Dr. Lagu is supported by the National Heart, Lung, and Blood Institute of the National Institutes of Health under award number K01HL114745. Drs. Lagu and Albugeaey had full access to all of the data in the study, and they take responsibility for the integrity of the data and the accuracy of the data analysis. Drs. Lagu, Albugeaey, and Seiler conceived of the study. Drs. Albugeaey and Al Faraj acquired the data. Drs. Lagu, Albugeaey, Al Faraj, Seiler, and Ms. Garb analyzed and interpreted the data. Drs. Albugeaey and Lagu drafted the manuscript. Drs. Lagu, Albugeaey, Al Faraj, Seiler, and Ms. Garb critically reviewed the manuscript for important intellectual content. Dr. Albugeaey is a recipient of a scholarship from the Ministry of Higher Education, Kingdom of Saudi Arabia. The authors report no conflicts of interest.
- , , , , . Acid‐suppressive medication use and the risk for nosocomial gastrointestinal tract bleeding. Arch Intern Med. 2011;171(11):991–997.
- , , , . Acid‐suppressive medication use and the risk for hospital‐acquired pneumonia. JAMA. 2009;301(20):2120–2128.
- , . Management of patients with ulcer bleeding. Am J Gastroenterol. 2012;107(3):345–360; quiz 361.
- , , . Overuse of acid‐suppressive therapy in hospitalized patients. Am J Gastroenterol. 2000;95(11):3118–3122.
- , , , et al. Overuse of acid suppression therapy in hospitalized patients. South Med J. 2010;103(3):207–211.
- , , , , , . Inappropriate prescribing of proton pump inhibitors in hospitalized patients. J Hosp Med. 2012;7(5):421–425.
- , , , . Inappropriate utilization of intravenous proton pump inhibitors in hospital practice—a prospective study of the extent of the problem and predictive factors. QJM. 2010;103(5):327–335.
- Choosing Wisely, Society of Hospital Medicine, Adult Hospital Medicine. Available at:http://www.choosingwisely.org/doctor‐patient‐lists/society‐of‐hospital‐medicine‐adult‐hospital‐medicine. Accessed April 11, 2014.
- , , , . Safety of the long‐term use of proton pump inhibitors. World J Gastroenterol. 2010;16(19):2323–2330.
- , . Prophylaxis rates for venous thromboembolism and gastrointestinal bleeding in general medical patients: too low or too high? BMJ. 2012;344:e3248.
Proton pump inhibitors (PPIs) are commonly used to treat acid‐related disorders but are associated with an increased risk of pneumonia and Clostridium difficile‐associated diarrhea.[1, 2] Initiation of PPIs in hospitalized patients should therefore be limited to specific clinical situations, such as upper gastrointestinal bleeding or stress ulcer prophylaxis in the critically ill.[3] Prior studies suggest significant overuse of PPIs in hospitalized patients exists,[4, 5, 6, 7] but these were published before the widespread implementation of local and national quality improvement efforts targeted at reducing PPI use in medical inpatients (eg, Society of Hospital Medicine's Choosing Wisely list[8]). We aimed to determine the frequency of inappropriate use of PPIs in a contemporary cohort of hospitalized patients in a tertiary care academic medical center.
METHODS
We conducted a retrospective cohort study of 297 patients admitted to a tertiary care center hospitalist service comprised of teaching and nonteaching medical patients who were not critically ill, were admitted between January 1, 2012 and March 31, 2012, and received a PPI during their hospital stay. Three internists used American College of Gastroenterology and the American Society for Gastrointestinal Endoscopy and prior studies to develop criteria to identify appropriate and inappropriate PPI use (Table 1).[4, 5, 6, 7] Appropriate indications included gastrointestinal (GI) bleeding, esophagitis, gastritis, gastroesophageal reflux (GERD), and continuation of home PPI (abrupt discontinuation can trigger reflux symptoms).[9] We extracted the medical records of included patients, applying our prespecified criteria to determine whether use was appropriate. In patients in whom PPI was a continued home medication, we also extracted 2 years of data prior to the index date to determine if the medication was started during a prior hospital admission and, if so, whether this initiation was appropriate. We used descriptive statistics and [2] tests to compare patient characteristics and indications for PPI use.
| Appropriate PPI use | Inappropriate PPI use |
|---|---|
| |
| History of upper GI bleeding | No reason given |
| Endoscopic evidence of peptic ulcer disease | Unspecified GI prophylaxis |
| Esophagitis | Nonspecific abdominal pain |
| Gastritis and duodenitis | Heartburn (nonchronic) |
| Eradication of H pylori | Acute pancreatitis |
| GERD | Anemia |
| Barrett's esophagus | Heparin use for DVT prophylaxis |
| Continued on home PPI | Use of aspirin, NSAID, steroids or Coumadin (as a single agent) |
| Acute esophageal variceal bleeding | |
| NSAID used in patient >65 years‐old | |
| High‐risk groups; combination of 2 or more of aspirin, NSAID, clopidogrel, or Coumadin | |
RESULTS
Of 297 patients, the mean age was 64.4 years (standard deviation 16.3 years), most were white (69%), and 56% were women (Table 2). PPI use was appropriate in 231 (78%, 95% confidence interval: 72.6%‐82.4%) patients. Of these, a majority (172, 75%) of patients received a PPI because it was a continued home medication. Only 40 of the 172 patients had the medication started during a recent hospitalization, and in half of those cases (20) the PPI use was appropriate.
| Demographics | PPI Not Indicated, N=66 | PPI Indicated, N=231 | Total=297 | |||
|---|---|---|---|---|---|---|
| ||||||
| Age, y, mean (SD) | 62.5 | (16.2) | 64.9 | (16.3) | 64.4 | (16.3) |
| Sex, % No. | ||||||
| Female | 51.5% | 34 | 56.7% | 131 | 55.6% | 165 |
| Male | 48.5% | 32 | 43.3% | 100 | 44.4% | 132 |
| Race, % No. | ||||||
| Asian | 0.0% | 0 | 0.9% | 2 | 0.7% | 2 |
| Black | 10.6% | 7 | 9.1% | 21 | 9.4% | 28 |
| Hispanic | 18.2% | 12 | 19.5% | 45 | 19.2% | 57 |
| Unknown | 0.0% | 0 | 2.2% | 5 | 1.7% | 5 |
| White | 71.2% | 47 | 68.4% | 158 | 69.0% | 205 |
| Insurance, % No. | ||||||
| Insured | 95.5% | 63 | 87.4% | 202 | 89.2% | 265 |
| Uninsured | 0.0% | 0 | 0.9% | 2 | 0.7% | 2 |
| Unknown | 4.5% | 3 | 11.7% | 27 | 10.1% | 30 |
| Service, % No. | ||||||
| Teaching | 25.8% | 17 | 32.9% | 76 | 31.3% | 93 |
| Nonteaching | 74.2% | 49 | 66.7% | 154 | 68.4% | 203 |
| Unknown | 0.0% | 0 | 0.4% | 1 | 0.3% | 1 |
| Chronic disease, % No. | ||||||
| Cardiac disease | 16.7% | 11 | 13.4% | 31 | 14.1% | 42 |
| Pulmonary disease | 16.7% | 11 | 14.7% | 34 | 15.2% | 45 |
| Gastrointestinal disease | 13.6% | 9 | 19.5% | 45 | 18.2% | 54 |
| Hepatic disease | 7.6% | 5 | 3.9% | 9 | 4.7% | 14 |
| Stroke | 1.5% | 1 | 5.2% | 12 | 4.4% | 13 |
| Sepsis | 12.1% | 8 | 13.0% | 30 | 12.8% | 38 |
| Other | 33.3% | 22 | 29.4% | 68 | 30.3% | 90 |
| PPI status, % No. | ||||||
| Continued home PPI | 0.0% | 0 | 74.5% | 172 | 58.1% | 172 |
| Started on PPI in hospital | 100% | 65 | 25.5% | 59 | 41.9% | 124 |
| Discharged on AST, % No. | ||||||
| Yes | 36.4% | 24 | 89.6% | 207 | 22.2% | 231 |
| PPI | 87.5% | 21 | 96.6% | 200 | 95.7% | 221 |
| Brand | 52.4% | 11 | 59.5% | 119 | 58.8% | 130 |
| Generic | 47.6% | 10 | 40.5% | 81 | 41.2% | 91 |
| H2 blocker | 12.5% | 3 | 3.4% | 7 | 4.3% | 10 |
| Brand | 0.0% | 0 | 71.4% | 5 | 50.0% | 5 |
| Generic | 100.0% | 3 | 28.6% | 2 | 50.0% | 5 |
| Medications, % No. | ||||||
| Aspirin | 36.4% | 24 | 43.7% | 101 | 42.1% | 125 |
| NSAID | 10.6% | 4 | 6.5% | 15 | 6.4% | 19 |
| Corticosteroids | 13.6% | 9 | 16.9% | 39 | 16.2% | 48 |
| Warfarin | 0.0% | 5 | 19.0% | 44 | 16.5% | 49 |
| Clopidogrel | 12.1% | 8 | 10.8% | 25 | 11.1% | 33 |
The second most common appropriate diagnosis was GERD (31%), followed by history of GI bleeding (19%) and treatment for esophagitis or gastritis (18%). Among the 66 patients receiving a PPI inappropriately, the majority of patients (56%) had no documented reason for PPI use, and only 11 patients (17%) were receiving PPI for stress ulcer prophylaxis (Figure 1). Five patients (8%) were treated prophylactically because of steroid or anticoagulant use. We observed no differences in age, gender, race, or reason for admission between the patients treated appropriately versus inappropriately.
DISCUSSION
In a contemporary cohort, chronic PPI use prior to admission was the most common reason PPIs were prescribed in the hospital. About 20% of hospitalized patients were started on a PPI for an inappropriate indication, the majority of whom lacked documentation concerning the reason for use. Among patients treated inappropriately, 36% were discharged on acid‐suppressive therapy.
The prior literature has reported a much higher percentages of unnecessary PPI use in hospitalized patients.[4, 5, 6, 7] Gupta et al. found that 70% of patients admitted to an internal medicine service received acid‐suppressive therapy, 73% of whom were treated unnecessarily.[5] Similarly, Nardino et al. found that 65% of acid‐suppressive therapy in hospitalized medical patients was not indicated.[4] If we had excluded patients on home PPIs from our study cohort, we would have found a higher rate of inappropriate use due to a smaller overall patient population. However, we chose to include these patients because they represented the vast majority of hospitalist‐prescribed PPIs. Notably, most of these prior prescriptions were not written during a recent hospital stay, indicating that the majority were initiated by outpatient physicians.
Our study is limited by its small sample size, single‐center design, and inability to determine the indications for outpatient PPI use. Still, it has important implications. Prior work has suggested that focusing efforts on PPI overuse may be premature in the absence of valid risk‐prediction models defining the patient populations that most benefit from PPI therapy.[10] Our work additionally suggests that hospital rates of inappropriate initiation may be relatively low, perhaps because hospitalist culture and practice have been affected by both local and national quality improvement efforts and by evidence dissemination.[8] Quality improvement efforts focused on reducing inpatient PPI use are likely to reveal diminishing returns, as admitting hospitalists are unlikely to abruptly discontinue PPIs prescribed in the outpatient setting.[9] Hospitalists should be encouraged to assess and document the need for PPIs during admission, hospitalization, and discharge processes. However, future efforts to reduce PPI overuse among hospitalized patients should predominately be focused on reducing inappropriate chronic PPI use in the outpatient setting.
Acknowledgements
The authors acknowledge Peter Lindenauer for his comments on an earlier draft of this manuscript.
Disclosures: The study was conducted with funding from the Department of Medicine at Baystate Medical Center. Dr. Lagu is supported by the National Heart, Lung, and Blood Institute of the National Institutes of Health under award number K01HL114745. Drs. Lagu and Albugeaey had full access to all of the data in the study, and they take responsibility for the integrity of the data and the accuracy of the data analysis. Drs. Lagu, Albugeaey, and Seiler conceived of the study. Drs. Albugeaey and Al Faraj acquired the data. Drs. Lagu, Albugeaey, Al Faraj, Seiler, and Ms. Garb analyzed and interpreted the data. Drs. Albugeaey and Lagu drafted the manuscript. Drs. Lagu, Albugeaey, Al Faraj, Seiler, and Ms. Garb critically reviewed the manuscript for important intellectual content. Dr. Albugeaey is a recipient of a scholarship from the Ministry of Higher Education, Kingdom of Saudi Arabia. The authors report no conflicts of interest.
- , , , , . Acid‐suppressive medication use and the risk for nosocomial gastrointestinal tract bleeding. Arch Intern Med. 2011;171(11):991–997.
- , , , . Acid‐suppressive medication use and the risk for hospital‐acquired pneumonia. JAMA. 2009;301(20):2120–2128.
- , . Management of patients with ulcer bleeding. Am J Gastroenterol. 2012;107(3):345–360; quiz 361.
- , , . Overuse of acid‐suppressive therapy in hospitalized patients. Am J Gastroenterol. 2000;95(11):3118–3122.
- , , , et al. Overuse of acid suppression therapy in hospitalized patients. South Med J. 2010;103(3):207–211.
- , , , , , . Inappropriate prescribing of proton pump inhibitors in hospitalized patients. J Hosp Med. 2012;7(5):421–425.
- , , , . Inappropriate utilization of intravenous proton pump inhibitors in hospital practice—a prospective study of the extent of the problem and predictive factors. QJM. 2010;103(5):327–335.
- Choosing Wisely, Society of Hospital Medicine, Adult Hospital Medicine. Available at:http://www.choosingwisely.org/doctor‐patient‐lists/society‐of‐hospital‐medicine‐adult‐hospital‐medicine. Accessed April 11, 2014.
- , , , . Safety of the long‐term use of proton pump inhibitors. World J Gastroenterol. 2010;16(19):2323–2330.
- , . Prophylaxis rates for venous thromboembolism and gastrointestinal bleeding in general medical patients: too low or too high? BMJ. 2012;344:e3248.
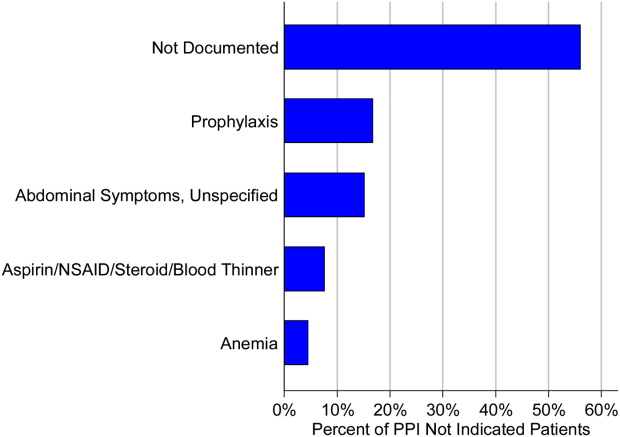
Impact of HOCDI on Sepsis Patients
There are approximately 3 million cases of Clostridium difficile infection (CDI) per year in the United States.[1, 2, 3, 4] Of these, 10% result in a hospitalization or occur as a consequence of the exposures and treatments associated with hospitalization.[1, 2, 3, 4] Some patients with CDI experience mild diarrhea that is responsive to therapy, but other patients experience severe, life‐threatening disease that is refractory to treatment, leading to pseudomembranous colitis, toxic megacolon, and sepsis with a 60‐day mortality rate that exceeds 12%.[5, 6, 7, 8, 9, 10, 11, 12, 13, 14]
Hospital‐onset CDI (HOCDI), defined as C difficile‐associated diarrhea and related symptoms with onset more than 48 hours after admission to a healthcare facility,[15] represents a unique marriage of CDI risk factors.[5] A vulnerable patient is introduced into an environment that contains both exposure to C difficile (through other patients or healthcare workers) and treatment with antibacterial agents that may diminish normal flora. Consequently, CDI is common among hospitalized patients.[16, 17, 18] A particularly important group for understanding the burden of disease is patients who initially present to the hospital with sepsis and subsequently develop HOCDI. Sepsis patients are often critically ill and are universally treated with antibiotics.
Determining the incremental cost and mortality risk attributable to HOCDI is methodologically challenging. Because HOCDI is associated with presenting severity, the sickest patients are also the most likely to contract the disease. HOCDI is also associated with time of exposure or length of stay (LOS). Because LOS is a risk factor, comparing LOS between those with and without HOCDI will overestimate the impact if the time to diagnosis is not taken into account.[16, 17, 19, 20] We aimed to examine the impact of HOCDI in hospitalized patients with sepsis using a large, multihospital database with statistical methods that took presenting severity and time to diagnosis into account.
METHODS
Data Source and Subjects
Permission to conduct this study was obtained from the institutional review board at Baystate Medical Center. We used the Premier Healthcare Informatics database, a voluntary, fee‐supported database created to measure quality and healthcare utilization, which has been used extensively in health services research.[21, 22, 23] In addition to the elements found in hospital claims derived from the uniform billing 04 form, Premier data include an itemized, date‐stamped log of all items and services charged to the patient or their insurer, including medications, laboratory tests, and diagnostic and therapeutic services. Approximately 75% of hospitals that submit data also provide information on actual hospital costs, taken from internal cost accounting systems. The rest provide cost estimates based on Medicare cost‐to‐charge ratios. Participating hospitals are similar to the composition of acute care hospitals nationwide, although they are more commonly small‐ to midsized nonteaching facilities and are more likely to be located in the southern United States.
We included medical (nonsurgical) adult patients with sepsis who were admitted to a participating hospital between July 1, 2004 and December 31, 2010. Because we sought to focus on the care of patients who present to the hospital with sepsis, we defined sepsis as the presence of a diagnosis of sepsis plus evidence of both blood cultures and antibiotic treatment within the first 2 days of hospitalization; we used the first 2 days of hospitalization rather than just the first day because, in administrative datasets, the duration of the first hospital day includes partial days that can vary in length. We excluded patients who died or were discharged prior to day 3, because HOCDI is defined as onset after 48 hours in a healthcare facility.[15] We also excluded surviving patients who received less than 3 consecutive days of antibiotics, and patients who were transferred from or to another acute‐care facility; the latter exclusion criterion was used because we could not accurately determine the onset or subsequent course of their illness.
Identification of Patients at Risk for and Diagnosed With HOCDI
Among eligible patients with sepsis, we aimed to identify a cohort at risk for developing CDI during the hospital stay. We excluded patients: (1) with a diagnosis indicating that diarrhea was present on admission, (2) with a diagnosis of CDI that was indicated to be present on admission, (3) who were tested for CDI on the first or second hospital day, and (4) who received an antibiotic that could be consistent with treatment for CDI (oral or intravenous [IV] metronidazole or oral vancomycin) on hospital days 1 or 2.
Next, we aimed to identify sepsis patients at risk for HOCDI who developed HOCDI during their hospital stay. Among eligible patients described above, we considered a patient to have HOCDI if they had an International Classification of Diseases, Ninth Revision, Clinical Modification diagnosis of CDI (primary or secondary but not present on admission), plus evidence of testing for CDI after hospital day 2, and treatment with oral vancomycin or oral or IV metronidazole that was started after hospital day 2 and within 2 days of the C difficile test, and evidence of treatment for CDI for at least 3 days unless the patient was discharged or died.
Patient Information
We recorded patient age, gender, marital status, insurance status, race, and ethnicity. Using software provided by the Healthcare Costs and Utilization Project of the Agency for Healthcare Research and Quality, we categorized information on 30 comorbid conditions. We also created a single numerical comorbidity score based on a previously published and validated combined comorbidity score that predicts 1‐year mortality.[24] Based on a previously described algorithm,[25] we used diagnosis codes to assess the source (lung, abdomen, urinary tract, blood, other) and type of sepsis (Gram positive, Gram negative, mixed, anaerobic, fungal). Because patients can have more than 1 potential source of sepsis (eg, pneumonia and urinary tract infection) and more than 1 organism causing infection (eg, urine with Gram negative rods and blood culture with Gram positive cocci), these categories are not mutually exclusive (see Supporting Table 1 in the online version of this article). We used billing codes to identify the use of therapies, monitoring devices, and pharmacologic treatments to characterize both initial severity of illness and severity at the time of CDI diagnosis. These therapies are included in a validated sepsis mortality prediction model (designed for administrative datasets) with similar discrimination and calibration to clinical intensive care unit (ICU) risk‐adjustment models such as the mortality probability model, version III.[26, 27]
Outcomes
Our primary outcome of interest was in‐hospital mortality. Secondary outcomes included LOS and costs for survivors only and for all patients.
Statistical Methods
We calculated patient‐level summary statistics for all patients using frequencies for binary variables and medians and interquartile percentiles for continuous variables. P values <0.05 were considered statistically significant.
To account for presenting severity and time to diagnosis, we used methods that have been described elsewhere.[12, 13, 18, 20, 28] First, we identified patients who were eligible to develop HOCDI. Second, for all eligible patients, we identified a date of disease onset (index date). For patients who met criteria for HOCDI, this was the date on which the patient was tested for CDI. For eligible patients without disease, this was a date randomly assigned to any time during the hospital stay.[29] Next, we developed a nonparsimonious propensity score model that included all patient characteristics (demographics, comorbidities, sepsis source, and severity of illness on presentation and on the index date; all variables listed in Table 1 were included in the propensity model). Some of the variables for this model (eg, mechanical ventilation and vasopressors) were derived from a validated severity model.[26] We adjusted for correlation within hospital when creating the propensity score using Huber‐White robust standard error estimators clustered at the hospital level.[30] We then created matched pairs with the same LOS prior to the index date and similar propensity for developing CDI. We first matched on index date, and then, within each index‐datematched subset, matched patients with and without HOCDI by their propensity score using a 5‐to‐1 greedy match algorithm.[31] We used the differences in LOS between the cases and controls after the index date to calculate the additional attributable LOS estimates; we also separately estimated the impact on cost and LOS in a group limited to those who survived after discharge because of concerns that death could shorten LOS and reduce costs.
| Before Matching | After Matching | |||||
|---|---|---|---|---|---|---|
| HOCDI, n=2,368, % | No CDI, n=216,547, % | P | HOCDI, n=2,368, % | No CDI, n=2,368, % | P | |
| ||||||
| Age, y | 70.9 (15.1) | 68.6 (16.8) | <0.01 | 70.9 (15.1) | 69.8 (15.9) | 0.02 |
| Male | 46.8 | 46.0 | 0.44 | 46.8 | 47.2 | 0.79 |
| Race | ||||||
| White | 61.0 | 63.3 | 61.0 | 58.1 | ||
| Black | 15.6 | 14.5 | <0.01 | 15.6 | 17.0 | 0.11 |
| Hispanic | 3.2 | 5.4 | 3.2 | 4.1 | ||
| Other race | 20.2 | 16.8 | 20.2 | 20.9 | ||
| Marital status | ||||||
| Married | 31.6 | 36.3 | <0.01 | 31.6 | 32.6 | 0.74 |
| Single/divorced | 52.8 | 51.1 | 52.8 | 52.0 | ||
| Other/unknown | 15.7 | 12.6 | 15.7 | 14.5 | ||
| Insurance status | ||||||
| Medicare traditional | 63.2 | 59.5 | 63.2 | 60.3 | ||
| Medicare managed | 10.6 | 10.1 | 10.6 | 10.9 | ||
| Medicaid traditional | 7.6 | 6.9 | 7.6 | 8.2 | ||
| Medicaid managed | 1.8 | 2.0 | <0.01 | 1.8 | 1.8 | 0.50 |
| Managed care | 10.8 | 12.3 | 10.8 | 12.0 | ||
| Commercial | 2.0 | 3.5 | 2.0 | 2.2 | ||
| Self‐pay/other/unknown | 4.0 | 5.7 | 4.0 | 4.7 | ||
| Infection source | ||||||
| Respiratory | 46.5 | 37.0 | <0.01 | 46.5 | 49.6 | 0.03 |
| Skin/bone | 10.1 | 8.6 | 0.01 | 10.1 | 11.2 | 0.21 |
| Urinary | 52.2 | 51.3 | 0.38 | 52.2 | 50.3 | 0.18 |
| Blood | 11.1 | 15.1 | <0.01 | 11.1 | 11.5 | 0.65 |
| Infecting organism | ||||||
| Gram negative | 35.0 | 36.6 | <0.01 | 35.0 | 33.1 | 0.18 |
| Anaerobe | 1.4 | 0.7 | <0.01 | 1.4 | 1.1 | 0.24 |
| Fungal | 17.5 | 7.5 | <0.01 | 17.5 | 18.3 | 0.44 |
| Most common comorbid conditions | ||||||
| Congestive heart failure | 35.1 | 24.6 | <0.01 | 35.1 | 37.5 | 0.06 |
| Chronic lung disease | 31.6 | 27.6 | <0.01 | 31.6 | 32.1 | 0.71 |
| Hypertension | 31.5 | 37.7 | <0.01 | 31.5 | 29.7 | 0.16 |
| Renal Failure | 29.7 | 23.8 | <0.01 | 29.7 | 31.2 | 0.28 |
| Weight Loss | 27.7 | 13.3 | <0.01 | 27.7 | 29.4 | 0.17 |
| Treatments by day 2 | ||||||
| ICU admission | 40.0 | 29.5 | <0.01 | 40.0 | 40.7 | 0.64 |
| Use of bicarbonate | 12.2 | 7.1 | <0.01 | 12.2 | 13.6 | 0.15 |
| Fresh frozen plasma | 1.4 | 1.0 | 0.03 | 1.4 | 1.1 | 0.36 |
| Inotropes | 1.4 | 0.9 | 0.01 | 1.4 | 2.2 | 0.04 |
| Hydrocortisone | 6.7 | 4.7 | <0.01 | 6.7 | 7.4 | 0.33 |
| Thiamine | 4.2 | 3.3 | 0.01 | 4.2 | 4.1 | 0.83 |
| Psychotropics (eg, haldol for delirium) | 10.0 | 9.2 | 0.21 | 10.0 | 10.8 | 0.36 |
| Restraints (eg, for delirium) | 2.0 | 1.5 | 0.05 | 2.0 | 2.5 | 0.29 |
| Angiotensin‐converting enzyme inhibitors | 12.1 | 13.2 | 0.12 | 12.1 | 10.9 | 0.20 |
| Statins | 18.8 | 21.1 | 0.01 | 18.8 | 16.9 | 0.09 |
| Drotrecogin alfa | 0.6 | 0.3 | 0.00 | 0.6 | 0.6 | 0.85 |
| Foley catheter | 19.2 | 19.8 | 0.50 | 19.2 | 22.0 | 0.02 |
| Diuretics | 28.5 | 25.4 | 0.01 | 28.5 | 29.6 | 0.42 |
| Red blood cells | 15.5 | 10.6 | <0.01 | 15.5 | 15.8 | 0.81 |
| Calcium channel blockers | 19.3 | 16.8 | 0.01 | 19.3 | 19.1 | 0.82 |
| ‐Blockers | 32.7 | 29.6 | 0.01 | 32.7 | 30.6 | 0.12 |
| Proton pump inhibitors | 59.6 | 53.1 | <0.01 | 59.6 | 61.0 | 0.31 |
Analysis Across Clinical Subgroups
In a secondary analysis, we examined heterogeneity in the association between HOCDI and outcomes within subsets of patients defined by age, combined comorbidity score, and admission to the ICU by day 2. We created separate propensity scores using the same covariates in the primary analysis, but limited matches to within these subsets. For each group, we examined how the covariates in the HOCDI and control groups differed after matching with inference tests that took the paired nature of the data into account. All analyses were carried out using Stata/SE 11.1 (StataCorp, College Station, TX).
RESULTS
We identified 486,943 adult sepsis admissions to a Premier hospital between July 1, 2004 and December 31, 2010. After applying all exclusion criteria, we had a final sample of 218,915 admissions with sepsis (from 400 hospitals) at risk for HOCDI (Figure 1). Of these, 2368 (1.08%) met criteria for diagnosis of CDI after hospital day 2 and were matched to controls using index date and propensity score.
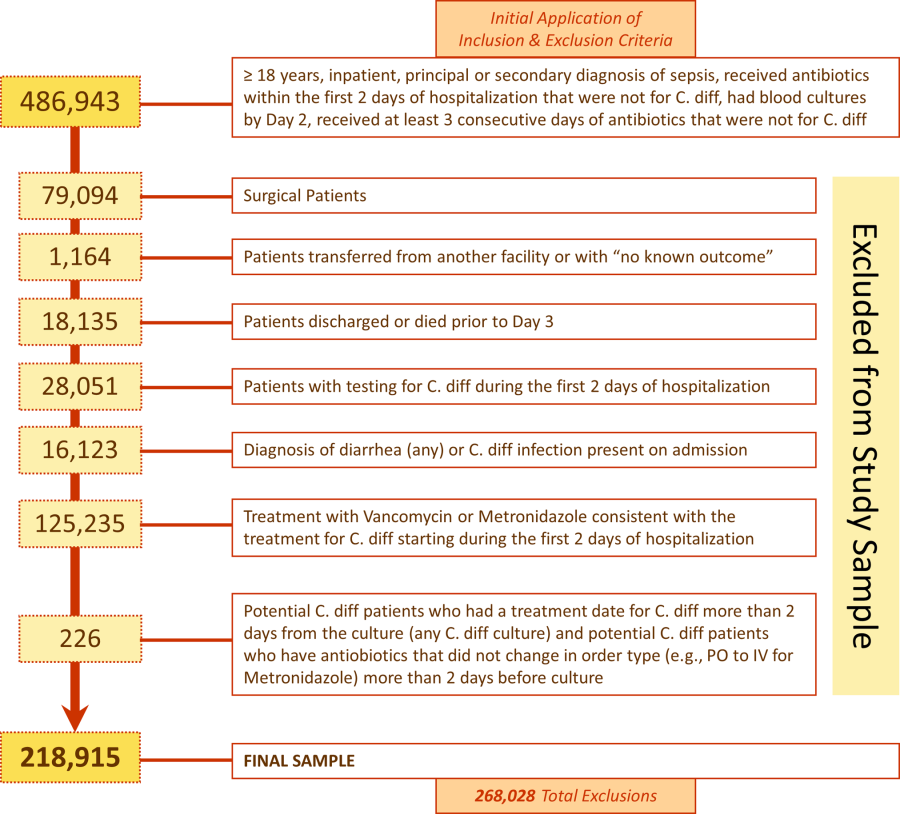
Patient and Hospital Factors
After matching, the median age was 71 years in cases and 70 years in controls (Table 1). Less than half (46%) of the population was male. Most cases (61%) and controls (58%) were white. Heart failure, hypertension, chronic lung disease, renal failure, and weight loss were the most common comorbid conditions. Our propensity model, which had a C statistic of 0.75, identified patients whose risk varied from a mean of 0.1% in the first decile to a mean of 3.8% in the tenth decile. Before matching, 40% of cases and 29% of controls were treated in the ICU by hospital day 2; after matching, 40% of both cases and controls were treated in the ICU by hospital day 2.
Distribution by LOS, Index Day, and Risk for Mortality
The unadjusted and unmatched LOS was longer for cases than controls (19 days vs 8 days, Table 2) (see Supporting Figure 1 in the online version of this article). Approximately 90% of the patients had an index day of 14 or less (Figure 2). Among patients both with and without CDI, the unadjusted mortality risk increased as the index day (and thus the total LOS) increased.
| Outcome | HOCDI | No HOCDI | Difference (95% CI) | P |
|---|---|---|---|---|
| ||||
| Length of stay, d | ||||
| Raw results | 19.2 | 8.3 | 8.4 (8.48.5) | <0.01 |
| Raw results for survivors only | 18.6 | 8.0 | 10.6 (10.311.0) | <0.01 |
| Matched results | 19.2 | 14.2 | 5.1(4.45.7) | <0.01 |
| Matched results for survivors only | 18.6 | 13.6 | 5.1 (4.45.8) | <0.01 |
| Mortality, % | ||||
| Raw results | 24.0 | 10.1 | 13.9 (12.615.1), RR=2.4 (2.22.5) | <0.01 |
| Matched results | 24.0 | 15.4 | 8.6 (6.410.9), RR=1.6 (1.41.8) | <0.01 |
| Costs, US$ | ||||
| Raw results median costs [interquartile range] | $26,187 [$15,117$46,273] | $9,988 [$6,296$17,351] | $16,190 ($15,826$16,555) | <0.01 |
| Raw results for survivors only [interquartile range] | $24,038 [$14,169$41,654] | $9,429 [$6,070$15,875] | $14,620 ($14,246$14,996) | <0.01 |
| Matched results [interquartile range] | $26,187 [$15,117$46,273] | $19,160 [$12,392$33,777] | $5,308 ($4,521$6,108) | |
| Matched results for survivors only [interquartile range] | $24,038 [$14,169$41,654] | $17,811 [$11,614$29,298] | $4,916 ($4,088$5,768) | <0.01 |
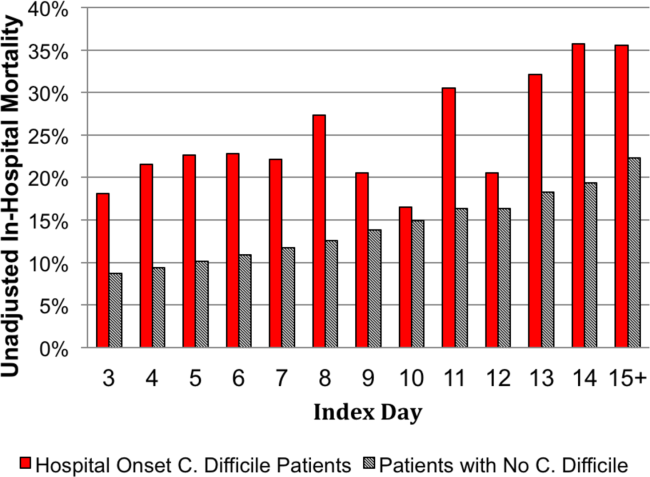
Adjusted Results
Compared to patients without disease, HOCDI patients had an increased unadjusted mortality (24% vs 10%, P<0.001). This translates into a relative risk of 2.4 (95% confidence interval [CI]: 2.2, 2.5). In the matched cohort, the difference in the mortality rates was attenuated, but still significantly higher in the HOCDI patients (24% versus 15%, P<0.001, an absolute difference of 9%; 95% CI: 6.410.8). The adjusted relative risk of mortality for HOCDI was 1.6 (95% CI: 1.41.8; Table 2). After matching, patients with CDI had a LOS of 19.2 days versus 14.2 days in matched controls (difference of 5.1 days; 95% CI: 4.45.7; P<0.001). When the LOS analysis was limited to survivors only, this difference of 5 days remained (P<0.001). In an analysis limited to survivors only, the difference in median costs between cases and controls was $4916 (95% CI: $4088$5768; P<0.001). In a secondary analysis examining heterogeneity between HOCDI and outcomes across clinical subgroups, the absolute difference in mortality and costs between cases and controls varied across demographics, comorbidity, and ICU admission, but the relative risks were similar (Figure 3) (see Supporting Figure 3 in the online version of this article).
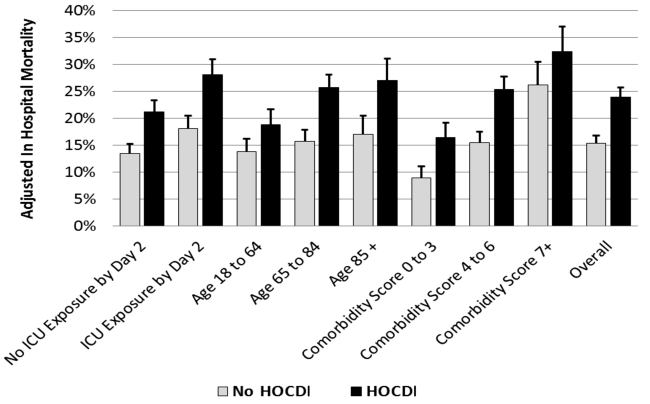
DISCUSSION
In this large cohort of patients with sepsis, we found that approximately 1 in 100 patients with sepsis developed HOCDI. Even after matching with controls based on the date of symptom onset and propensity score, patients who developed HOCDI were more than 1.6 times more likely to die in the hospital. HOCDI also added 5 days to the average hospitalization for patients with sepsis and increased median costs by approximately $5000. These findings suggest that a hospital that prevents 1 case of HOCDI per month in sepsis patients could avoid 1 death and 60 inpatient days annually, achieving an approximate yearly savings of $60,000.
Until now, the incremental cost and mortality attributable to HOCDI in sepsis patients have been poorly understood. Attributing outcomes can be methodologically challenging because patients who are at greatest risk for poor outcomes are the most likely to contract the disease and are at risk for longer periods of time. Therefore, it is necessary to take into account differences in severity of illness and time at risk between diseased and nondiseased populations and to ensure that outcomes attributed to the disease occur after disease onset.[28, 32] The majority of prior studies examining the impact of CDI on hospitalized patients have been limited by a lack of adequate matching to controls, small sample size, or failure to take into account time to infection.[16, 17, 19, 20]
A few studies have taken into account severity, time to infection, or both in estimating the impact of HOCDI. Using a time‐dependent Cox model that accounted for time to infection, Micek et al. found no difference in mortality but a longer LOS in mechanically ventilated patients (not limited to sepsis) with CDI.[33] However, their study was conducted at only 3 centers, did not take into account severity at the time of diagnosis, and did not clearly distinguish between community‐onset CDI and HOCDI. Oake et al. and Forster et al. examined the impact of CDI on patients hospitalized in a 2‐hospital health system in Canada.[12, 13] Using the baseline mortality estimate in a Cox multivariate proportional hazards regression model that accounted for the time‐varying nature of CDI, they found that HOCDI increased absolute risk of death by approximately 10%. Also, notably similar to our study were their findings that HOCDI occurred in approximately 1 in 100 patients and that the attributable median increase in LOS due to hospital‐onset CDI was 6 days. Although methodologically rigorous, these 2 small studies did not assess the impact of CDI on costs of care, were not focused on sepsis patients or even patients who received antibiotics, and also did not clearly distinguish between community‐onset CDI and HOCDI.
Our study therefore has important strengths. It is the first to examine the impact of HOCDI, including costs, on the outcomes of patients hospitalized with sepsis. The fact that we took into account both time to diagnosis and severity at the time of diagnosis (by using an index date for both cases and controls and determining severity on that date) prevented us from overestimating the impact of HOCDI on outcomes. The large differences in outcomes we observed in unadjusted and unmatched data were tempered after multivariate adjustment (eg, difference in LOS from 10.6 days to 5.1 additional days, costs from $14,620 to $4916 additional costs after adjustment). Our patient sample was derived from a large, multihospital database that contains actual hospital costs as derived from internal accounting systems. The fact that our study used data from hundreds of hospitals means that our estimates of cost, LOS, and mortality may be more generalizable than the work of Micek et al., Oake et al., and Forster et al.
This work also has important implications. First, hospital administrators, clinicians, and researchers can use our results to evaluate the cost‐effectiveness of HOCDI prevention measures (eg, hand hygiene programs, antibiotic stewardship). By quantifying the cost per case in sepsis patients, we allow administrators and researchers to compare the incremental costs of HOCDI prevention programs to the dollars and lives saved due to prevention efforts. Second, we found that our propensity model identified patients whose risk varied greatly. This suggests that an opportunity exists to identify subgroups of patients that are at highest risk. Identifying high‐risk subgroups will allow for targeted risk reduction interventions and the opportunity to reduce transmission (eg, by placing high‐risk patients in a private room). Finally, we have reaffirmed that time to diagnosis and presenting severity need to be rigorously addressed prior to making estimates of the impact of CDI burden and other hospital‐acquired conditions and injuries.
There are limitations to this study as well. We did not have access to microbiological data. However, we required a diagnosis code of CDI, evidence of testing, and treatment after the date of testing to confirm a diagnosis. We also adopted detailed exclusion criteria to ensure that CDI that was not present on admission and that controls did not have CDI. These stringent inclusion and exclusion criteria strengthened the internal validity of our estimates of disease impact. We used administrative claims data, which limited our ability to adjust for severity. However, the detailed nature of the database allowed us to use treatments, such as vasopressors and antibiotics, to identify cases; treatments were also used as a validated indicator of severity,[26] which may have helped to reduce some of this potential bias. Although our propensity model included many predictors of CDI, such as use of proton pump inhibitors and factors associated with mortality, not every confounder was completely balanced after propensity matching, although the statistical differences may have been related to our large sample size and therefore might not be clinically significant. We also may have failed to include all possible predictors of CDI in the propensity model.
In a large, diverse cohort of hospitalized patients with sepsis, we found that HOCDI lengthened hospital stay by approximately 5 days, increased risk of in‐hospital mortality by 9%, and increased hospital cost by approximately $5000 per patient. These findings highlight the importance of identifying effective prevention measures and of determining the patient populations at greatest risk for HOCDI.
Disclosures: The study was conducted with funding from the Division of Critical Care and the Center for Quality of Care Research at Baystate Medical Center. Dr. Lagu is supported by the National Heart, Lung, and Blood Institute of the National Institutes of Health under award number K01HL114745. Dr. Stefan is supported by the National Heart, Lung, and Blood Institute of the National Institutes of Health under award number K01HL114631. Drs. Lagu and Lindenauer had full access to all of the data in the study; they take responsibility for the integrity of the data and the accuracy of the data analysis. Drs. Lagu, Lindenauer, Steingrub, Higgins, Stefan, Haessler, and Rothberg conceived of the study. Dr. Lindenauer acquired the data. Drs. Lagu, Lindenauer, Rothberg, Steingrub, Nathanson, Stefan, Haessler, Higgins, and Mr. Hannon analyzed and interpreted the data. Dr. Lagu drafted the manuscript. Drs. Lagu, Lindenauer, Rothberg, Steingrub, Nathanson, Stefan, Haessler, Higgins, and Mr. Hannon critically reviewed the manuscript for important intellectual content. Dr. Nathanson carried out the statistical analyses. Dr. Nathanson, through his company OptiStatim LLC, was paid by the investigators with funding from the Department of Medicine at Baystate Medical Center to assist in conducting the statistical analyses in this study. The authors report no further conflicts of interest.
- , , , . Increasing prevalence and severity of Clostridium difficile colitis in hospitalized patients in the United States. Arch Surg. 2007;142(7):624–631; discussion 631.
- , , , et al. The changing epidemiology of Clostridium difficile infections. Clin Microbiol Rev. 2010;23(3):529–549.
- , . Clostridium Difficile‐Associated Disease in U.S. Hospitals, 1993–2005. HCUP Statistical Brief #50. April 2008. Agency for Healthcare Research and Quality, Rockville, MD. Available at: http://www.hcup‐us.ahrq.gov/reports/statbriefs/sb50.pdf. Accessed April 4, 2014.
- , , , . National point prevalence of Clostridium difficile in US health care facility inpatients, 2008. Am J Infect Control. 2009;37(4):263–270.
- . A 76‐year‐old man with recurrent Clostridium difficile‐associated diarrhea: review of C. difficile infection. JAMA. 2009;301(9):954–962.
- , , , , , . Recurrent Clostridium difficile disease: epidemiology and clinical characteristics. Infect Control Hosp Epidemiol. 1999;20(1):43–50.
- , , , , , . Recurrent Clostridium difficile diarrhea: characteristics of and risk factors for patients enrolled in a prospective, randomized, double‐blinded trial. Clin Infect Dis. 1997;24(3):324–333.
- . Narrative review: the new epidemic of Clostridium difficile‐associated enteric disease. Ann Intern Med. 2006;145(10):758–764.
- , , , et al. Impact of emergency colectomy on survival of patients with fulminant Clostridium difficile colitis during an epidemic caused by a hypervirulent strain. Ann Surg. 2007;245(2):267–272.
- , , , . Hospital‐acquired Clostridium difficile‐associated disease in the intensive care unit setting: epidemiology, clinical course and outcome. BMC Infect Dis. 2007;7:42.
- , , , , , . Factors associated with prolonged symptoms and severe disease due to Clostridium difficile. Age Ageing. 1999;28(2):107–113.
- , , , , , . The effect of hospital‐acquired Clostridium difficile infection on in‐hospital mortality. Arch Intern Med. 2010;170(20):1804–1810.
- , , , , , . The effect of hospital‐acquired infection with Clostridium difficile on length of stay in hospital. CMAJ. 2012;184(1):37–42.
- , . Clostridium difficile—more difficult than ever. N Engl J Med. 2008;359(18):1932–1940.
- , , , et al. Clinical practice guidelines for Clostridium difficile infection in adults: 2010 update by the society for healthcare epidemiology of America (SHEA) and the infectious diseases society of America (IDSA). Infect Control Hosp Epidemiol. 2010;31(5):431–455.
- , , , . Health care costs and mortality associated with nosocomial diarrhea due to Clostridium difficile. Clin Infect Dis. 2002;34(3):346–353.
- , , , , . Short‐ and long‐term attributable costs of Clostridium difficile‐associated disease in nonsurgical inpatients. Clin Infect Dis. 2008;46(4):497–504.
- , , , , . Estimation of extra hospital stay attributable to nosocomial infections: heterogeneity and timing of events. J Clin Epidemiol. 2000;53(4):409–417.
- , , , et al. Attributable outcomes of endemic Clostridium difficile‐associated disease in nonsurgical patients. Emerging Infect Dis. 2008;14(7):1031–1038.
- , . Excess length of stay, charges, and mortality attributable to medical injuries during hospitalization. JAMA. 2003;290(14):1868–1874.
- , , , , , . Association of corticosteroid dose and route of administration with risk of treatment failure in acute exacerbation of chronic obstructive pulmonary disease. JAMA. 2010;303(23):2359–2367.
- , , , , , . The relationship between hospital spending and mortality in patients with sepsis. Arch Intern Med. 2011;171(4):292–299.
- , , , , , . Comparative effectiveness of macrolides and quinolones for patients hospitalized with acute exacerbations of chronic obstructive pulmonary disease (AECOPD). J Hosp Med. 2010;5(5):261–267.
- , , , , . A combined comorbidity score predicted mortality in elderly patients better than existing scores. J Clin Epidemiol. 2011;64(7):749–759.
- , , , , , . Epidemiology of severe sepsis in the United States: analysis of incidence, outcome, and associated costs of care. Crit Care Med. 2001;29(7):1303–1310.
- , , , et al. Development and validation of a model that uses enhanced administrative data to predict mortality in patients with sepsis. Crit Care Med. 2011;39(11):2425–2430.
- , , , , . Incorporating initial treatments improves performance of a mortality prediction model for patients with sepsis. Pharmacoepidemiol Drug Saf. 2012;21(suppl 2):44–52.
- , , , . Nosocomial infection, length of stay, and time‐dependent bias. Infect Control Hosp Epidemiol. 2009;30(3):273–276.
- , , , , , . Length of stay and hospital costs among high‐risk patients with hospital‐origin Clostridium difficile‐associated diarrhea. J Med Econ. 2013;16(3):440–448.
- Rogers. Regression standard errors in clustered samples. Stata Technical Bulletin. 1993;13(13):19–23.
- . Reducing bias in a propensity score matched‐pair sample using greedy matching techniques. In: Proceedings of the 26th Annual SAS Users Group International Conference; April 22–25, 2001; Long Beach, CA. Paper 214‐26. Available at: http://www2.sas.com/proceedings/sugi26/p214‐26.pdf. Accessed April 4, 2014.
- , . Prolongation of length of stay and Clostridium difficile infection: a review of the methods used to examine length of stay due to healthcare associated infections. Antimicrob Resist Infect Control. 2012;1(1):14.
- , , , et al. Clostridium difficile Infection: a multicenter study of epidemiology and outcomes in mechanically ventilated patients. Crit Care Med. 2013;41(8):1968–1975.
There are approximately 3 million cases of Clostridium difficile infection (CDI) per year in the United States.[1, 2, 3, 4] Of these, 10% result in a hospitalization or occur as a consequence of the exposures and treatments associated with hospitalization.[1, 2, 3, 4] Some patients with CDI experience mild diarrhea that is responsive to therapy, but other patients experience severe, life‐threatening disease that is refractory to treatment, leading to pseudomembranous colitis, toxic megacolon, and sepsis with a 60‐day mortality rate that exceeds 12%.[5, 6, 7, 8, 9, 10, 11, 12, 13, 14]
Hospital‐onset CDI (HOCDI), defined as C difficile‐associated diarrhea and related symptoms with onset more than 48 hours after admission to a healthcare facility,[15] represents a unique marriage of CDI risk factors.[5] A vulnerable patient is introduced into an environment that contains both exposure to C difficile (through other patients or healthcare workers) and treatment with antibacterial agents that may diminish normal flora. Consequently, CDI is common among hospitalized patients.[16, 17, 18] A particularly important group for understanding the burden of disease is patients who initially present to the hospital with sepsis and subsequently develop HOCDI. Sepsis patients are often critically ill and are universally treated with antibiotics.
Determining the incremental cost and mortality risk attributable to HOCDI is methodologically challenging. Because HOCDI is associated with presenting severity, the sickest patients are also the most likely to contract the disease. HOCDI is also associated with time of exposure or length of stay (LOS). Because LOS is a risk factor, comparing LOS between those with and without HOCDI will overestimate the impact if the time to diagnosis is not taken into account.[16, 17, 19, 20] We aimed to examine the impact of HOCDI in hospitalized patients with sepsis using a large, multihospital database with statistical methods that took presenting severity and time to diagnosis into account.
METHODS
Data Source and Subjects
Permission to conduct this study was obtained from the institutional review board at Baystate Medical Center. We used the Premier Healthcare Informatics database, a voluntary, fee‐supported database created to measure quality and healthcare utilization, which has been used extensively in health services research.[21, 22, 23] In addition to the elements found in hospital claims derived from the uniform billing 04 form, Premier data include an itemized, date‐stamped log of all items and services charged to the patient or their insurer, including medications, laboratory tests, and diagnostic and therapeutic services. Approximately 75% of hospitals that submit data also provide information on actual hospital costs, taken from internal cost accounting systems. The rest provide cost estimates based on Medicare cost‐to‐charge ratios. Participating hospitals are similar to the composition of acute care hospitals nationwide, although they are more commonly small‐ to midsized nonteaching facilities and are more likely to be located in the southern United States.
We included medical (nonsurgical) adult patients with sepsis who were admitted to a participating hospital between July 1, 2004 and December 31, 2010. Because we sought to focus on the care of patients who present to the hospital with sepsis, we defined sepsis as the presence of a diagnosis of sepsis plus evidence of both blood cultures and antibiotic treatment within the first 2 days of hospitalization; we used the first 2 days of hospitalization rather than just the first day because, in administrative datasets, the duration of the first hospital day includes partial days that can vary in length. We excluded patients who died or were discharged prior to day 3, because HOCDI is defined as onset after 48 hours in a healthcare facility.[15] We also excluded surviving patients who received less than 3 consecutive days of antibiotics, and patients who were transferred from or to another acute‐care facility; the latter exclusion criterion was used because we could not accurately determine the onset or subsequent course of their illness.
Identification of Patients at Risk for and Diagnosed With HOCDI
Among eligible patients with sepsis, we aimed to identify a cohort at risk for developing CDI during the hospital stay. We excluded patients: (1) with a diagnosis indicating that diarrhea was present on admission, (2) with a diagnosis of CDI that was indicated to be present on admission, (3) who were tested for CDI on the first or second hospital day, and (4) who received an antibiotic that could be consistent with treatment for CDI (oral or intravenous [IV] metronidazole or oral vancomycin) on hospital days 1 or 2.
Next, we aimed to identify sepsis patients at risk for HOCDI who developed HOCDI during their hospital stay. Among eligible patients described above, we considered a patient to have HOCDI if they had an International Classification of Diseases, Ninth Revision, Clinical Modification diagnosis of CDI (primary or secondary but not present on admission), plus evidence of testing for CDI after hospital day 2, and treatment with oral vancomycin or oral or IV metronidazole that was started after hospital day 2 and within 2 days of the C difficile test, and evidence of treatment for CDI for at least 3 days unless the patient was discharged or died.
Patient Information
We recorded patient age, gender, marital status, insurance status, race, and ethnicity. Using software provided by the Healthcare Costs and Utilization Project of the Agency for Healthcare Research and Quality, we categorized information on 30 comorbid conditions. We also created a single numerical comorbidity score based on a previously published and validated combined comorbidity score that predicts 1‐year mortality.[24] Based on a previously described algorithm,[25] we used diagnosis codes to assess the source (lung, abdomen, urinary tract, blood, other) and type of sepsis (Gram positive, Gram negative, mixed, anaerobic, fungal). Because patients can have more than 1 potential source of sepsis (eg, pneumonia and urinary tract infection) and more than 1 organism causing infection (eg, urine with Gram negative rods and blood culture with Gram positive cocci), these categories are not mutually exclusive (see Supporting Table 1 in the online version of this article). We used billing codes to identify the use of therapies, monitoring devices, and pharmacologic treatments to characterize both initial severity of illness and severity at the time of CDI diagnosis. These therapies are included in a validated sepsis mortality prediction model (designed for administrative datasets) with similar discrimination and calibration to clinical intensive care unit (ICU) risk‐adjustment models such as the mortality probability model, version III.[26, 27]
Outcomes
Our primary outcome of interest was in‐hospital mortality. Secondary outcomes included LOS and costs for survivors only and for all patients.
Statistical Methods
We calculated patient‐level summary statistics for all patients using frequencies for binary variables and medians and interquartile percentiles for continuous variables. P values <0.05 were considered statistically significant.
To account for presenting severity and time to diagnosis, we used methods that have been described elsewhere.[12, 13, 18, 20, 28] First, we identified patients who were eligible to develop HOCDI. Second, for all eligible patients, we identified a date of disease onset (index date). For patients who met criteria for HOCDI, this was the date on which the patient was tested for CDI. For eligible patients without disease, this was a date randomly assigned to any time during the hospital stay.[29] Next, we developed a nonparsimonious propensity score model that included all patient characteristics (demographics, comorbidities, sepsis source, and severity of illness on presentation and on the index date; all variables listed in Table 1 were included in the propensity model). Some of the variables for this model (eg, mechanical ventilation and vasopressors) were derived from a validated severity model.[26] We adjusted for correlation within hospital when creating the propensity score using Huber‐White robust standard error estimators clustered at the hospital level.[30] We then created matched pairs with the same LOS prior to the index date and similar propensity for developing CDI. We first matched on index date, and then, within each index‐datematched subset, matched patients with and without HOCDI by their propensity score using a 5‐to‐1 greedy match algorithm.[31] We used the differences in LOS between the cases and controls after the index date to calculate the additional attributable LOS estimates; we also separately estimated the impact on cost and LOS in a group limited to those who survived after discharge because of concerns that death could shorten LOS and reduce costs.
| Before Matching | After Matching | |||||
|---|---|---|---|---|---|---|
| HOCDI, n=2,368, % | No CDI, n=216,547, % | P | HOCDI, n=2,368, % | No CDI, n=2,368, % | P | |
| ||||||
| Age, y | 70.9 (15.1) | 68.6 (16.8) | <0.01 | 70.9 (15.1) | 69.8 (15.9) | 0.02 |
| Male | 46.8 | 46.0 | 0.44 | 46.8 | 47.2 | 0.79 |
| Race | ||||||
| White | 61.0 | 63.3 | 61.0 | 58.1 | ||
| Black | 15.6 | 14.5 | <0.01 | 15.6 | 17.0 | 0.11 |
| Hispanic | 3.2 | 5.4 | 3.2 | 4.1 | ||
| Other race | 20.2 | 16.8 | 20.2 | 20.9 | ||
| Marital status | ||||||
| Married | 31.6 | 36.3 | <0.01 | 31.6 | 32.6 | 0.74 |
| Single/divorced | 52.8 | 51.1 | 52.8 | 52.0 | ||
| Other/unknown | 15.7 | 12.6 | 15.7 | 14.5 | ||
| Insurance status | ||||||
| Medicare traditional | 63.2 | 59.5 | 63.2 | 60.3 | ||
| Medicare managed | 10.6 | 10.1 | 10.6 | 10.9 | ||
| Medicaid traditional | 7.6 | 6.9 | 7.6 | 8.2 | ||
| Medicaid managed | 1.8 | 2.0 | <0.01 | 1.8 | 1.8 | 0.50 |
| Managed care | 10.8 | 12.3 | 10.8 | 12.0 | ||
| Commercial | 2.0 | 3.5 | 2.0 | 2.2 | ||
| Self‐pay/other/unknown | 4.0 | 5.7 | 4.0 | 4.7 | ||
| Infection source | ||||||
| Respiratory | 46.5 | 37.0 | <0.01 | 46.5 | 49.6 | 0.03 |
| Skin/bone | 10.1 | 8.6 | 0.01 | 10.1 | 11.2 | 0.21 |
| Urinary | 52.2 | 51.3 | 0.38 | 52.2 | 50.3 | 0.18 |
| Blood | 11.1 | 15.1 | <0.01 | 11.1 | 11.5 | 0.65 |
| Infecting organism | ||||||
| Gram negative | 35.0 | 36.6 | <0.01 | 35.0 | 33.1 | 0.18 |
| Anaerobe | 1.4 | 0.7 | <0.01 | 1.4 | 1.1 | 0.24 |
| Fungal | 17.5 | 7.5 | <0.01 | 17.5 | 18.3 | 0.44 |
| Most common comorbid conditions | ||||||
| Congestive heart failure | 35.1 | 24.6 | <0.01 | 35.1 | 37.5 | 0.06 |
| Chronic lung disease | 31.6 | 27.6 | <0.01 | 31.6 | 32.1 | 0.71 |
| Hypertension | 31.5 | 37.7 | <0.01 | 31.5 | 29.7 | 0.16 |
| Renal Failure | 29.7 | 23.8 | <0.01 | 29.7 | 31.2 | 0.28 |
| Weight Loss | 27.7 | 13.3 | <0.01 | 27.7 | 29.4 | 0.17 |
| Treatments by day 2 | ||||||
| ICU admission | 40.0 | 29.5 | <0.01 | 40.0 | 40.7 | 0.64 |
| Use of bicarbonate | 12.2 | 7.1 | <0.01 | 12.2 | 13.6 | 0.15 |
| Fresh frozen plasma | 1.4 | 1.0 | 0.03 | 1.4 | 1.1 | 0.36 |
| Inotropes | 1.4 | 0.9 | 0.01 | 1.4 | 2.2 | 0.04 |
| Hydrocortisone | 6.7 | 4.7 | <0.01 | 6.7 | 7.4 | 0.33 |
| Thiamine | 4.2 | 3.3 | 0.01 | 4.2 | 4.1 | 0.83 |
| Psychotropics (eg, haldol for delirium) | 10.0 | 9.2 | 0.21 | 10.0 | 10.8 | 0.36 |
| Restraints (eg, for delirium) | 2.0 | 1.5 | 0.05 | 2.0 | 2.5 | 0.29 |
| Angiotensin‐converting enzyme inhibitors | 12.1 | 13.2 | 0.12 | 12.1 | 10.9 | 0.20 |
| Statins | 18.8 | 21.1 | 0.01 | 18.8 | 16.9 | 0.09 |
| Drotrecogin alfa | 0.6 | 0.3 | 0.00 | 0.6 | 0.6 | 0.85 |
| Foley catheter | 19.2 | 19.8 | 0.50 | 19.2 | 22.0 | 0.02 |
| Diuretics | 28.5 | 25.4 | 0.01 | 28.5 | 29.6 | 0.42 |
| Red blood cells | 15.5 | 10.6 | <0.01 | 15.5 | 15.8 | 0.81 |
| Calcium channel blockers | 19.3 | 16.8 | 0.01 | 19.3 | 19.1 | 0.82 |
| ‐Blockers | 32.7 | 29.6 | 0.01 | 32.7 | 30.6 | 0.12 |
| Proton pump inhibitors | 59.6 | 53.1 | <0.01 | 59.6 | 61.0 | 0.31 |
Analysis Across Clinical Subgroups
In a secondary analysis, we examined heterogeneity in the association between HOCDI and outcomes within subsets of patients defined by age, combined comorbidity score, and admission to the ICU by day 2. We created separate propensity scores using the same covariates in the primary analysis, but limited matches to within these subsets. For each group, we examined how the covariates in the HOCDI and control groups differed after matching with inference tests that took the paired nature of the data into account. All analyses were carried out using Stata/SE 11.1 (StataCorp, College Station, TX).
RESULTS
We identified 486,943 adult sepsis admissions to a Premier hospital between July 1, 2004 and December 31, 2010. After applying all exclusion criteria, we had a final sample of 218,915 admissions with sepsis (from 400 hospitals) at risk for HOCDI (Figure 1). Of these, 2368 (1.08%) met criteria for diagnosis of CDI after hospital day 2 and were matched to controls using index date and propensity score.
Patient and Hospital Factors
After matching, the median age was 71 years in cases and 70 years in controls (Table 1). Less than half (46%) of the population was male. Most cases (61%) and controls (58%) were white. Heart failure, hypertension, chronic lung disease, renal failure, and weight loss were the most common comorbid conditions. Our propensity model, which had a C statistic of 0.75, identified patients whose risk varied from a mean of 0.1% in the first decile to a mean of 3.8% in the tenth decile. Before matching, 40% of cases and 29% of controls were treated in the ICU by hospital day 2; after matching, 40% of both cases and controls were treated in the ICU by hospital day 2.
Distribution by LOS, Index Day, and Risk for Mortality
The unadjusted and unmatched LOS was longer for cases than controls (19 days vs 8 days, Table 2) (see Supporting Figure 1 in the online version of this article). Approximately 90% of the patients had an index day of 14 or less (Figure 2). Among patients both with and without CDI, the unadjusted mortality risk increased as the index day (and thus the total LOS) increased.
| Outcome | HOCDI | No HOCDI | Difference (95% CI) | P |
|---|---|---|---|---|
| ||||
| Length of stay, d | ||||
| Raw results | 19.2 | 8.3 | 8.4 (8.48.5) | <0.01 |
| Raw results for survivors only | 18.6 | 8.0 | 10.6 (10.311.0) | <0.01 |
| Matched results | 19.2 | 14.2 | 5.1(4.45.7) | <0.01 |
| Matched results for survivors only | 18.6 | 13.6 | 5.1 (4.45.8) | <0.01 |
| Mortality, % | ||||
| Raw results | 24.0 | 10.1 | 13.9 (12.615.1), RR=2.4 (2.22.5) | <0.01 |
| Matched results | 24.0 | 15.4 | 8.6 (6.410.9), RR=1.6 (1.41.8) | <0.01 |
| Costs, US$ | ||||
| Raw results median costs [interquartile range] | $26,187 [$15,117$46,273] | $9,988 [$6,296$17,351] | $16,190 ($15,826$16,555) | <0.01 |
| Raw results for survivors only [interquartile range] | $24,038 [$14,169$41,654] | $9,429 [$6,070$15,875] | $14,620 ($14,246$14,996) | <0.01 |
| Matched results [interquartile range] | $26,187 [$15,117$46,273] | $19,160 [$12,392$33,777] | $5,308 ($4,521$6,108) | |
| Matched results for survivors only [interquartile range] | $24,038 [$14,169$41,654] | $17,811 [$11,614$29,298] | $4,916 ($4,088$5,768) | <0.01 |
Adjusted Results
Compared to patients without disease, HOCDI patients had an increased unadjusted mortality (24% vs 10%, P<0.001). This translates into a relative risk of 2.4 (95% confidence interval [CI]: 2.2, 2.5). In the matched cohort, the difference in the mortality rates was attenuated, but still significantly higher in the HOCDI patients (24% versus 15%, P<0.001, an absolute difference of 9%; 95% CI: 6.410.8). The adjusted relative risk of mortality for HOCDI was 1.6 (95% CI: 1.41.8; Table 2). After matching, patients with CDI had a LOS of 19.2 days versus 14.2 days in matched controls (difference of 5.1 days; 95% CI: 4.45.7; P<0.001). When the LOS analysis was limited to survivors only, this difference of 5 days remained (P<0.001). In an analysis limited to survivors only, the difference in median costs between cases and controls was $4916 (95% CI: $4088$5768; P<0.001). In a secondary analysis examining heterogeneity between HOCDI and outcomes across clinical subgroups, the absolute difference in mortality and costs between cases and controls varied across demographics, comorbidity, and ICU admission, but the relative risks were similar (Figure 3) (see Supporting Figure 3 in the online version of this article).
DISCUSSION
In this large cohort of patients with sepsis, we found that approximately 1 in 100 patients with sepsis developed HOCDI. Even after matching with controls based on the date of symptom onset and propensity score, patients who developed HOCDI were more than 1.6 times more likely to die in the hospital. HOCDI also added 5 days to the average hospitalization for patients with sepsis and increased median costs by approximately $5000. These findings suggest that a hospital that prevents 1 case of HOCDI per month in sepsis patients could avoid 1 death and 60 inpatient days annually, achieving an approximate yearly savings of $60,000.
Until now, the incremental cost and mortality attributable to HOCDI in sepsis patients have been poorly understood. Attributing outcomes can be methodologically challenging because patients who are at greatest risk for poor outcomes are the most likely to contract the disease and are at risk for longer periods of time. Therefore, it is necessary to take into account differences in severity of illness and time at risk between diseased and nondiseased populations and to ensure that outcomes attributed to the disease occur after disease onset.[28, 32] The majority of prior studies examining the impact of CDI on hospitalized patients have been limited by a lack of adequate matching to controls, small sample size, or failure to take into account time to infection.[16, 17, 19, 20]
A few studies have taken into account severity, time to infection, or both in estimating the impact of HOCDI. Using a time‐dependent Cox model that accounted for time to infection, Micek et al. found no difference in mortality but a longer LOS in mechanically ventilated patients (not limited to sepsis) with CDI.[33] However, their study was conducted at only 3 centers, did not take into account severity at the time of diagnosis, and did not clearly distinguish between community‐onset CDI and HOCDI. Oake et al. and Forster et al. examined the impact of CDI on patients hospitalized in a 2‐hospital health system in Canada.[12, 13] Using the baseline mortality estimate in a Cox multivariate proportional hazards regression model that accounted for the time‐varying nature of CDI, they found that HOCDI increased absolute risk of death by approximately 10%. Also, notably similar to our study were their findings that HOCDI occurred in approximately 1 in 100 patients and that the attributable median increase in LOS due to hospital‐onset CDI was 6 days. Although methodologically rigorous, these 2 small studies did not assess the impact of CDI on costs of care, were not focused on sepsis patients or even patients who received antibiotics, and also did not clearly distinguish between community‐onset CDI and HOCDI.
Our study therefore has important strengths. It is the first to examine the impact of HOCDI, including costs, on the outcomes of patients hospitalized with sepsis. The fact that we took into account both time to diagnosis and severity at the time of diagnosis (by using an index date for both cases and controls and determining severity on that date) prevented us from overestimating the impact of HOCDI on outcomes. The large differences in outcomes we observed in unadjusted and unmatched data were tempered after multivariate adjustment (eg, difference in LOS from 10.6 days to 5.1 additional days, costs from $14,620 to $4916 additional costs after adjustment). Our patient sample was derived from a large, multihospital database that contains actual hospital costs as derived from internal accounting systems. The fact that our study used data from hundreds of hospitals means that our estimates of cost, LOS, and mortality may be more generalizable than the work of Micek et al., Oake et al., and Forster et al.
This work also has important implications. First, hospital administrators, clinicians, and researchers can use our results to evaluate the cost‐effectiveness of HOCDI prevention measures (eg, hand hygiene programs, antibiotic stewardship). By quantifying the cost per case in sepsis patients, we allow administrators and researchers to compare the incremental costs of HOCDI prevention programs to the dollars and lives saved due to prevention efforts. Second, we found that our propensity model identified patients whose risk varied greatly. This suggests that an opportunity exists to identify subgroups of patients that are at highest risk. Identifying high‐risk subgroups will allow for targeted risk reduction interventions and the opportunity to reduce transmission (eg, by placing high‐risk patients in a private room). Finally, we have reaffirmed that time to diagnosis and presenting severity need to be rigorously addressed prior to making estimates of the impact of CDI burden and other hospital‐acquired conditions and injuries.
There are limitations to this study as well. We did not have access to microbiological data. However, we required a diagnosis code of CDI, evidence of testing, and treatment after the date of testing to confirm a diagnosis. We also adopted detailed exclusion criteria to ensure that CDI that was not present on admission and that controls did not have CDI. These stringent inclusion and exclusion criteria strengthened the internal validity of our estimates of disease impact. We used administrative claims data, which limited our ability to adjust for severity. However, the detailed nature of the database allowed us to use treatments, such as vasopressors and antibiotics, to identify cases; treatments were also used as a validated indicator of severity,[26] which may have helped to reduce some of this potential bias. Although our propensity model included many predictors of CDI, such as use of proton pump inhibitors and factors associated with mortality, not every confounder was completely balanced after propensity matching, although the statistical differences may have been related to our large sample size and therefore might not be clinically significant. We also may have failed to include all possible predictors of CDI in the propensity model.
In a large, diverse cohort of hospitalized patients with sepsis, we found that HOCDI lengthened hospital stay by approximately 5 days, increased risk of in‐hospital mortality by 9%, and increased hospital cost by approximately $5000 per patient. These findings highlight the importance of identifying effective prevention measures and of determining the patient populations at greatest risk for HOCDI.
Disclosures: The study was conducted with funding from the Division of Critical Care and the Center for Quality of Care Research at Baystate Medical Center. Dr. Lagu is supported by the National Heart, Lung, and Blood Institute of the National Institutes of Health under award number K01HL114745. Dr. Stefan is supported by the National Heart, Lung, and Blood Institute of the National Institutes of Health under award number K01HL114631. Drs. Lagu and Lindenauer had full access to all of the data in the study; they take responsibility for the integrity of the data and the accuracy of the data analysis. Drs. Lagu, Lindenauer, Steingrub, Higgins, Stefan, Haessler, and Rothberg conceived of the study. Dr. Lindenauer acquired the data. Drs. Lagu, Lindenauer, Rothberg, Steingrub, Nathanson, Stefan, Haessler, Higgins, and Mr. Hannon analyzed and interpreted the data. Dr. Lagu drafted the manuscript. Drs. Lagu, Lindenauer, Rothberg, Steingrub, Nathanson, Stefan, Haessler, Higgins, and Mr. Hannon critically reviewed the manuscript for important intellectual content. Dr. Nathanson carried out the statistical analyses. Dr. Nathanson, through his company OptiStatim LLC, was paid by the investigators with funding from the Department of Medicine at Baystate Medical Center to assist in conducting the statistical analyses in this study. The authors report no further conflicts of interest.
- , , , . Increasing prevalence and severity of Clostridium difficile colitis in hospitalized patients in the United States. Arch Surg. 2007;142(7):624–631; discussion 631.
- , , , et al. The changing epidemiology of Clostridium difficile infections. Clin Microbiol Rev. 2010;23(3):529–549.
- , . Clostridium Difficile‐Associated Disease in U.S. Hospitals, 1993–2005. HCUP Statistical Brief #50. April 2008. Agency for Healthcare Research and Quality, Rockville, MD. Available at: http://www.hcup‐us.ahrq.gov/reports/statbriefs/sb50.pdf. Accessed April 4, 2014.
- , , , . National point prevalence of Clostridium difficile in US health care facility inpatients, 2008. Am J Infect Control. 2009;37(4):263–270.
- . A 76‐year‐old man with recurrent Clostridium difficile‐associated diarrhea: review of C. difficile infection. JAMA. 2009;301(9):954–962.
- , , , , , . Recurrent Clostridium difficile disease: epidemiology and clinical characteristics. Infect Control Hosp Epidemiol. 1999;20(1):43–50.
- , , , , , . Recurrent Clostridium difficile diarrhea: characteristics of and risk factors for patients enrolled in a prospective, randomized, double‐blinded trial. Clin Infect Dis. 1997;24(3):324–333.
- . Narrative review: the new epidemic of Clostridium difficile‐associated enteric disease. Ann Intern Med. 2006;145(10):758–764.
- , , , et al. Impact of emergency colectomy on survival of patients with fulminant Clostridium difficile colitis during an epidemic caused by a hypervirulent strain. Ann Surg. 2007;245(2):267–272.
- , , , . Hospital‐acquired Clostridium difficile‐associated disease in the intensive care unit setting: epidemiology, clinical course and outcome. BMC Infect Dis. 2007;7:42.
- , , , , , . Factors associated with prolonged symptoms and severe disease due to Clostridium difficile. Age Ageing. 1999;28(2):107–113.
- , , , , , . The effect of hospital‐acquired Clostridium difficile infection on in‐hospital mortality. Arch Intern Med. 2010;170(20):1804–1810.
- , , , , , . The effect of hospital‐acquired infection with Clostridium difficile on length of stay in hospital. CMAJ. 2012;184(1):37–42.
- , . Clostridium difficile—more difficult than ever. N Engl J Med. 2008;359(18):1932–1940.
- , , , et al. Clinical practice guidelines for Clostridium difficile infection in adults: 2010 update by the society for healthcare epidemiology of America (SHEA) and the infectious diseases society of America (IDSA). Infect Control Hosp Epidemiol. 2010;31(5):431–455.
- , , , . Health care costs and mortality associated with nosocomial diarrhea due to Clostridium difficile. Clin Infect Dis. 2002;34(3):346–353.
- , , , , . Short‐ and long‐term attributable costs of Clostridium difficile‐associated disease in nonsurgical inpatients. Clin Infect Dis. 2008;46(4):497–504.
- , , , , . Estimation of extra hospital stay attributable to nosocomial infections: heterogeneity and timing of events. J Clin Epidemiol. 2000;53(4):409–417.
- , , , et al. Attributable outcomes of endemic Clostridium difficile‐associated disease in nonsurgical patients. Emerging Infect Dis. 2008;14(7):1031–1038.
- , . Excess length of stay, charges, and mortality attributable to medical injuries during hospitalization. JAMA. 2003;290(14):1868–1874.
- , , , , , . Association of corticosteroid dose and route of administration with risk of treatment failure in acute exacerbation of chronic obstructive pulmonary disease. JAMA. 2010;303(23):2359–2367.
- , , , , , . The relationship between hospital spending and mortality in patients with sepsis. Arch Intern Med. 2011;171(4):292–299.
- , , , , , . Comparative effectiveness of macrolides and quinolones for patients hospitalized with acute exacerbations of chronic obstructive pulmonary disease (AECOPD). J Hosp Med. 2010;5(5):261–267.
- , , , , . A combined comorbidity score predicted mortality in elderly patients better than existing scores. J Clin Epidemiol. 2011;64(7):749–759.
- , , , , , . Epidemiology of severe sepsis in the United States: analysis of incidence, outcome, and associated costs of care. Crit Care Med. 2001;29(7):1303–1310.
- , , , et al. Development and validation of a model that uses enhanced administrative data to predict mortality in patients with sepsis. Crit Care Med. 2011;39(11):2425–2430.
- , , , , . Incorporating initial treatments improves performance of a mortality prediction model for patients with sepsis. Pharmacoepidemiol Drug Saf. 2012;21(suppl 2):44–52.
- , , , . Nosocomial infection, length of stay, and time‐dependent bias. Infect Control Hosp Epidemiol. 2009;30(3):273–276.
- , , , , , . Length of stay and hospital costs among high‐risk patients with hospital‐origin Clostridium difficile‐associated diarrhea. J Med Econ. 2013;16(3):440–448.
- Rogers. Regression standard errors in clustered samples. Stata Technical Bulletin. 1993;13(13):19–23.
- . Reducing bias in a propensity score matched‐pair sample using greedy matching techniques. In: Proceedings of the 26th Annual SAS Users Group International Conference; April 22–25, 2001; Long Beach, CA. Paper 214‐26. Available at: http://www2.sas.com/proceedings/sugi26/p214‐26.pdf. Accessed April 4, 2014.
- , . Prolongation of length of stay and Clostridium difficile infection: a review of the methods used to examine length of stay due to healthcare associated infections. Antimicrob Resist Infect Control. 2012;1(1):14.
- , , , et al. Clostridium difficile Infection: a multicenter study of epidemiology and outcomes in mechanically ventilated patients. Crit Care Med. 2013;41(8):1968–1975.
© 2014 Society of Hospital Medicine

Quantifying Treatment Intensity
Healthcare spending exceeded $2.5 trillion in 2007, and payments to hospitals represented the largest portion of this spending (more than 30%), equaling the combined cost of physician services and prescription drugs.[1, 2] Researchers and policymakers have emphasized the need to improve the value of hospital care in the United States, but this has been challenging, in part because of the difficulty in identifying hospitals that have high resource utilization relative to their peers.[3, 4, 5, 6, 7, 8, 9, 10, 11]
Most hospitals calculate their costs using internal accounting systems that determine resource utilization via relative value units (RVUs).[7, 8] RVU‐derived costs, also known as hospital reported costs, have proven to be an excellent method for quantifying what it costs a given hospital to provide a treatment, test, or procedure. However, RVU‐based costs are less useful for comparing resource utilization across hospitals because the cost to provide a treatment or service varies widely across hospitals. The cost of an item calculated using RVUs includes not just the item itself, but also a portion of the fixed costs of the hospital (overhead, labor, and infrastructure investments such as electronic records, new buildings, or expensive radiological or surgical equipment).[12] These costs vary by institution, patient population, region of the country, teaching status, and many other variables, making it difficult to identify resource utilization across hospitals.[13, 14]
Recently, a few claims‐based multi‐institutional datasets have begun incorporating item‐level RVU‐based costs derived directly from the cost accounting systems of participating institutions.[15] Such datasets allow researchers to compare reported costs of care from hospital to hospital, but because of the limitations we described above, they still cannot be used to answer the question: Which hospitals with higher costs of care are actually providing more treatments and services to patients?
To better facilitate the comparison of resource utilization patterns across hospitals, we standardized the unit costs of all treatments and services across hospitals by applying a single cost to every item across hospitals. This standardized cost allowed to compare utilization of that item (and the 15,000 other items in the database) across hospitals. We then compared estimates of resource utilization as measured by the 2 approaches: standardized and RVU‐based costs.
METHODS
Ethics Statement
All data were deidentified, by Premier, Inc., at both the hospital and patient level in accordance with the Health Insurance Portability and Accountability Act. The Yale University Human Investigation Committee reviewed the protocol for this study and determined that it is not considered to be human subjects research as defined by the Office of Human Research Protections.
Data Source
We conducted a cross‐sectional study using data from hospitals that participated in the database maintained by Premier Healthcare Informatics (Charlotte, NC) in the years 2009 to 2010. The Premier database is a voluntary, fee‐supported database created to measure quality and healthcare utilization.[3, 16, 17, 18] In 2010, it included detailed billing data from 500 hospitals in the United States, with more than 130 million cumulative hospital discharges. The detailed billing data includes all elements found in hospital claims derived from the uniform billing‐04 form, as well as an itemized, date‐stamped log of all items and services charged to the patient or insurer, such as medications, laboratory tests, and diagnostic and therapeutic services. The database includes approximately 15% of all US hospitalizations. Participating hospitals are similar to the composition of acute care hospitals nationwide. They represent all regions of the United States, and represent predominantly small‐ to mid‐sized nonteaching facilities that serve a largely urban population. The database also contains hospital reported costs at the item level as well as the total cost of the hospitalization. Approximately 75% of hospitals that participate submit RVU‐based costs taken from internal cost accounting systems. Because of our focus on comparing standardized costs to reported costs, we included only data from hospitals that use RVU‐based costs in this study.
Study Subjects
We included adult patients with a hospitalization recorded in the Premier database between January 1, 2009 and December 31, 2010, and a principal discharge diagnosis of heart failure (HF) (International Classification of Diseases, Ninth Revision, Clinical Modification codes: 402.01, 402.11, 402.91, 404.01, 404.03, 404.11, 404.13, 404.91, 404.93, 428.xx). We excluded transfers, patients assigned a pediatrician as the attending of record, and those who received a heart transplant or ventricular assist device during their stay. Because cost data are prone to extreme outliers, we excluded hospitalizations that were in the top 0.1% of length of stay, number of billing records, quantity of items billed, or total standardized cost. We also excluded hospitals that admitted fewer than 25 HF patients during the study period to reduce the possibility that a single high‐cost patient affected the hospital's cost profile.
Hospital Information
For each hospital included in the study, we recorded number of beds, teaching status, geographic region, and whether it served an urban or rural population.
Assignment of Standardized Costs
We defined reported cost as the RVU‐based cost per item in the database. We then calculated the median across hospitals for each item in the database and set this as the standardized unit cost of that item at every hospital (Figure 1). Once standardized costs were assigned at the item level, we summed the costs of all items assigned to each patient and calculated the standardized cost of a hospitalization per patient at each hospital.

Examination of Cost Variation
We compared the standardized and reported costs of hospitalizations using medians, interquartile ranges, and interquartile ratios (Q75/Q25). To examine whether standardized costs can reduce the noise due to differences in overhead and other fixed costs, we calculated, for each hospital, the coefficients of variation (CV) for per‐day reported and standardized costs and per‐hospitalization reported and standardized costs. We used the Fligner‐Killeen test to determine whether the variance of CVs was different for reported and standardized costs.[19]
Creation of Basket of Goods
Because there can be differences in the costs of items, the number and types of items administered during hospitalizations, 2 hospitals with similar reported costs for a hospitalization might deliver different quantities and combinations of treatments (Figure 1). We wished to demonstrate that there is variation in reported costs of items when the quantity and type of item is held constant, so we created a basket of items. We chose items that are commonly administered to patients with heart failure, but could have chosen any combination of items. The basket included a day of medical room and board, a day of intensive care unit (ICU) room and board, a single dose of ‐blocker, a single dose of angiotensin‐converting enzyme inhibitor, complete blood count, a B‐natriuretic peptide level, a chest radiograph, a chest computed tomography, and an echocardiogram. We then examined the range of hospitals' reported costs for this basket of goods using percentiles, medians, and interquartile ranges.
Reported to Standardized Cost Ratio
Next, we calculated standardized costs of hospitalizations for included hospitals and examined the relationship between hospitals' mean reported costs and mean standardized costs. This ratio could help diagnose the mechanism of high reported costs for a hospital, because high reported costs with low utilization would indicate high fixed costs, while high reported costs with high utilization would indicate greater use of tests and treatments. We assigned hospitals to strata based on reported costs greater than standardized costs by more than 25%, reported costs within 25% of standardized costs, and reported costs less than standardized costs by more than 25%. We examined the association between hospital characteristics and strata using a 2 test. All analyses were carried out using SAS version 9.3 (SAS Institute Inc., Cary, NC).
RESULTS
The 234 hospitals included in the analysis contributed a total of 165,647 hospitalizations, with the number of hospitalizations ranging from 33 to 2,772 hospitalizations per hospital (see Supporting Table 1 in the online version of this article). Most were located in urban areas (84%), and many were in the southern United States (42%). The median hospital reported cost per hospitalization was $6,535, with an interquartile range of $5,541 to $7,454. The median standardized cost per hospitalization was $6,602, with a range of $5,866 to $7,386. The interquartile ratio (Q75/Q25) of the reported costs of a hospitalization was 1.35. After costs were standardized, the interquartile ratio fell to 1.26, indicating that variation decreased. We found that the median hospital reported cost per day was $1,651, with an IQR of $1,400 to $1,933 (ratio 1.38), whereas the median standardized cost per day was $1,640, with an IQR of $1,511 to $1,812 (ratio 1.20).
There were more than 15,000 items (eg, treatments, tests, and supplies) that received a standardized charge code in our cohort. These were divided into 11 summary departments and 40 standard departments (see Supporting Table 2 in the online version of this article). We observed a high level of variation in the reported costs of individual items: the reported costs of a day of room and board in an ICU ranged from $773 at hospitals at the 10th percentile to $2,471 at the 90th percentile (Table 1.). The standardized cost of a day of ICU room and board was $1,577. We also observed variation in the reported costs of items across item categories. Although a day of medical room and board showed a 3‐fold difference between the 10th and 90th percentile, we observed a more than 10‐fold difference in the reported cost of an echocardiogram, from $31 at the 10th percentile to $356 at the 90th percentile. After examining the hospital‐level cost for a basket of goods, we found variation in the reported costs for these items across hospitals, with a 10th percentile cost of $1,552 and a 90th percentile cost of $3,967.
| Reported Costs | 10th Percentile | 25th Percentile | 75th Percentile | 90th Percentile | Median (Standardized Cost) |
|---|---|---|---|---|---|
| |||||
| Item | |||||
| Day of medical | 490.03 | 586.41 | 889.95 | 1121.20 | 722.59 |
| Day of ICU | 773.01 | 1275.84 | 1994.81 | 2471.75 | 1577.93 |
| Complete blood count | 6.87 | 9.34 | 18.34 | 23.46 | 13.07 |
| B‐natriuretic peptide | 12.13 | 19.22 | 44.19 | 60.56 | 28.23 |
| Metoprolol | 0.20 | 0.68 | 2.67 | 3.74 | 1.66 |
| Lisinopril | 0.28 | 1.02 | 2.79 | 4.06 | 1.72 |
| Spironolactone | 0.22 | 0.53 | 2.68 | 3.83 | 1.63 |
| Furosemide | 1.27 | 2.45 | 5.73 | 8.12 | 3.82 |
| Chest x‐ray | 43.88 | 51.54 | 89.96 | 117.16 | 67.45 |
| Echocardiogram | 31.53 | 98.63 | 244.63 | 356.50 | 159.07 |
| Chest CT (w & w/o contrast) | 65.17 | 83.99 | 157.23 | 239.27 | 110.76 |
| Noninvasive positive pressure ventilation | 126.23 | 127.25 | 370.44 | 514.67 | 177.24 |
| Electrocardiogram | 12.08 | 18.77 | 42.74 | 64.94 | 29.78 |
| Total basket | 1552.50 | 2157.85 | 3417.34 | 3967.78 | 2710.49 |
We found that 46 (20%) hospitals had reported costs of hospitalizations that were 25% greater than standardized costs (Figure 2). This group of hospitals had overestimated reported costs of utilization; 146 (62%) had reported costs within 25% of standardized costs, and 42 (17%) had reported costs that were 25% less than standardized costs (indicating that reported costs underestimated utilization). We examined the relationship between hospital characteristics and strata and found no significant association between the reported to standardized cost ratio and number of beds, teaching status, or urban location (Table 2). Hospitals in the Midwest and South were more likely to have a lower reported cost of hospitalizations, whereas hospitals in the West were more likely to have higher reported costs (P<0.001). When using the CV to compare reported costs to standardized costs, we found that per‐day standardized costs showed reduced variance (P=0.0238), but there was no significant difference in variance of the reported and standardized costs when examining the entire hospitalization (P=0.1423). At the level of the hospitalization, the Spearman correlation coefficient between reported and standardized cost was 0.89.
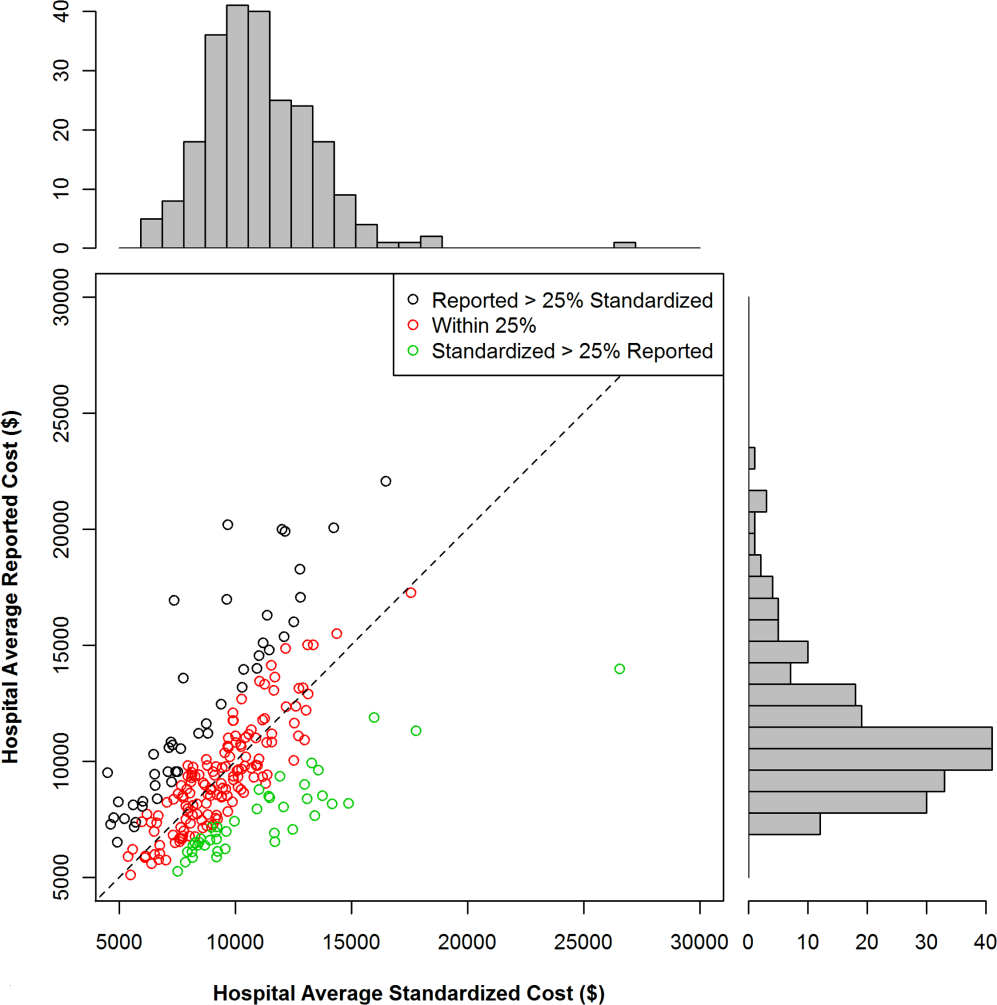
| Reported Greater Than Standardized by >25%, n (%) | Reported Within 25% (2‐tailed) of Standardized, n (%) | Reported Less Than Standardized by >25%, n (%) | P for 2 Test | |
|---|---|---|---|---|
| Total | 46 (19.7) | 146 (62.4) | 42 (17.0) | |
| No. of beds | 0.2313 | |||
| <200 | 19 (41.3) | 40 (27.4) | 12 (28.6) | |
| 200400 | 14 (30.4) | 67 (45.9) | 15 (35.7) | |
| >400 | 13 (28.3) | 39 (26.7) | 15 (35.7) | |
| Teaching | 0.8278 | |||
| Yes | 13 (28.3) | 45 (30.8) | 11 (26.2) | |
| No | 33 (71.7) | 101 (69.2) | 31 (73.8) | |
| Region | <0.0001 | |||
| Midwest | 7 (15.2) | 43 (29.5) | 19 (45.2) | |
| Northeast | 6 (13.0) | 18 (12.3) | 3 (7.1) | |
| South | 14 (30.4) | 64 (43.8) | 20 (47.6) | |
| West | 19 (41.3) | 21 (14.4) | 0 (0) | |
| Urban vs rural | 36 (78.3) | 128 (87.7) | 33 (78.6) | 0.1703 |
To better understand how hospitals can achieve high reported costs through different mechanisms, we more closely examined 3 hospitals with similar reported costs (Figure 3). These hospitals represented low, average, and high utilization according to their standardized costs, but had similar average per‐hospitalization reported costs: $11,643, $11,787, and $11,892, respectively. The corresponding standardized costs were $8,757, $11,169, and $15,978. The hospital with high utilization ($15,978 in standardized costs) was accounted for by increased use of supplies and other services. In contrast, the low‐ and average‐utilization hospitals had proportionally lower standardized costs across categories, with the greatest percentage of spending going toward room and board (includes nursing).
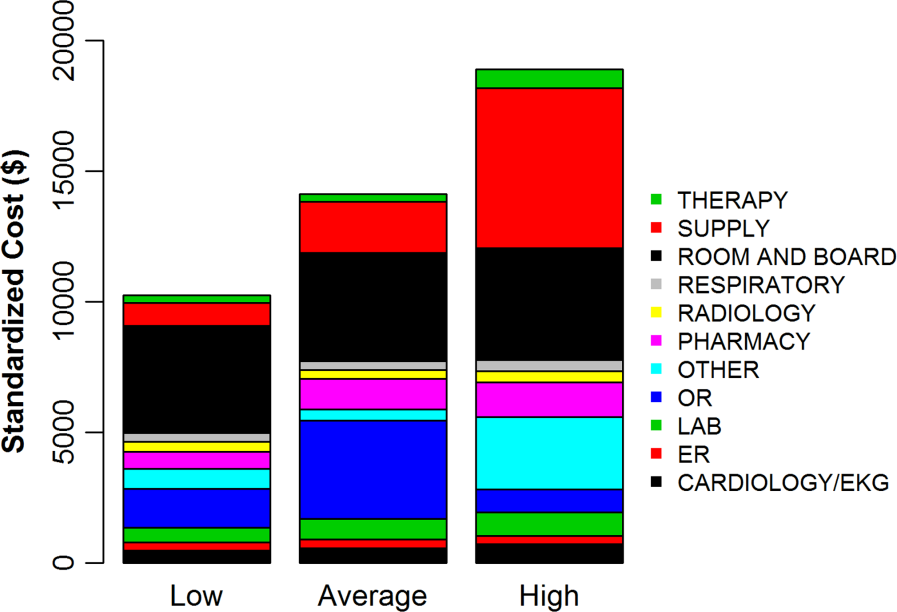
DISCUSSION
In a large national sample of hospitals, we observed variation in the reported costs for a uniform basket of goods, with a more than 2‐fold difference in cost between the 10th and 90th percentile hospitals. These findings suggest that reported costs have limited ability to reliably describe differences in utilization across hospitals. In contrast, when we applied standardized costs, the variance of per‐day costs decreased significantly, and the interquartile ratio of per‐day and hospitalization costs decreased as well, suggesting less variation in utilization across hospitals than would have been inferred from a comparison of reported costs. Applying a single, standard cost to all items can facilitate comparisons of utilization between hospitals (Figure 1). Standardized costs will give hospitals the potential to compare their utilization to their competitors and will facilitate research that examines the comparative effectiveness of high and low utilization in the management of medical and surgical conditions.
The reported to standardized cost ratio is another useful tool. It indicates whether the hospital's reported costs exaggerate its utilization relative to other hospitals. In this study, we found that a significant proportion of hospitals (20%) had reported costs that exceeded standardized costs by more than 25%. These hospitals have higher infrastructure, labor, or acquisition costs relative to their peers. To the extent that these hospitals might wish to lower the cost of care at their institution, they could focus on renegotiating purchasing or labor contracts, identifying areas where they may be overstaffed, or holding off on future infrastructure investments (Table 3).[14] In contrast, 17% of hospitals had reported costs that were 25% less than standardized costs. High‐cost hospitals in this group are therefore providing more treatments and testing to patients relative to their peers and could focus cost‐control efforts on reducing unnecessary utilization and duplicative testing.[20] Our examination of the hospital with high reported costs and very high utilization revealed a high percentage of supplies and other items, which is a category used primarily for nursing expenditures (Figure 3). Because the use of nursing services is directly related to days spent in the hospital, this hospital may wish to more closely examine specific strategies for reducing length of stay.
| High Reported Costs/High Standardized Costs | High Reported Costs/Low Standardized Costs | Low Reported Costs/High Standardized Costs | Low Reported Costs/Low Standardized Costs | |
|---|---|---|---|---|
| Utilization | High | Low | High | Low |
| Severity of illness | Likely to be higher | Likely to be lower | Likely to be higher | Likely to be lower |
| Practice style | Likely to be more intense | Likely to be less intense | Likely to be more intense | Likely to be less intense |
| Fixed costs | High or average | High | Low | Low |
| Infrastructure costs | Likely to be higher | Likely to be higher | Likely to be lower | Likely to be lower |
| Labor costs | Likely to be higher | Likely to be higher | Likely to be lower | Likely to be lower |
| Reported‐to‐standardized cost ratio | Close to 1 | >1 | <1 | Close to 1 |
| Causes of high costs | High utilization, high fixed costs, or both | High acquisition costs, high labor costs, or expensive infrastructure | High utilization | |
| Interventions to reduce costs | Work with clinicians to alter practice style, consider renegotiating cost of acquisitions, hold off on new infrastructure investments | Consider renegotiating cost of acquisitions, hold off on new infrastructure investments, consider reducing size of labor force | Work with clinicians to alter practice style | |
| Usefulness of reported‐ to‐standardized cost ratio | Less useful | More useful | More useful | Less useful |
We did not find a consistent association between the reported to standardized cost ratio and hospital characteristics. This is an important finding that contradicts prior work examining associations between hospital characteristics and costs for heart failure patients,[21] further indicating the complexity of the relationship between fixed costs and variable costs and the difficulty in adjusting reported costs to calculate utilization. For example, small hospitals may have higher acquisition costs and more supply chain difficulties, but they may also have less technology, lower overhead costs, and fewer specialists to order tests and procedures. Hospital characteristics, such as urban location and teaching status, are commonly used as adjustors in cost studies because hospitals in urban areas with teaching missions (which often provide care to low‐income populations) are assumed to have higher fixed costs,[3, 4, 5, 6] but the lack of a consistent relationship between these characteristics and the standardized cost ratio may indicate that using these factors as adjustors for cost may not be effective and could even obscure differences in utilization between hospitals. Notably, we did find an association between hospital region and the reported to standardized cost ratio, but we hesitate to draw conclusions from this finding because the Premier database is imbalanced in terms of regional representation, with fewer hospitals in the Midwest and West and the bulk of the hospitals in the South.
Although standardized costs have great potential, this method has limitations as well. Standardized costs can only be applied when detailed billing data with item‐level costs are available. This is because calculation of standardized costs requires taking the median of item costs and applying the median cost across the database, maintaining the integrity of the relative cost of items to one another. The relative cost of items is preserved (ie, magnetic resonance imaging still costs more than an aspirin), which maintains the general scheme of RVU‐based costs while removing the noise of varying RVU‐based costs across hospitals.[7] Application of an arbitrary item cost would result in the loss of this relative cost difference. Because item costs are not available in traditional administrative datasets, these datasets would not be amenable to this method. However, highly detailed billing data are now being shared by hundreds of hospitals in the Premier network and the University Health System Consortium. These data are widely available to investigators, meaning that the generalizability of this method will only improve over time. It was also a limitation of the study that we chose a limited basket of items common to patients with heart failure to describe the range of reported costs and to provide a standardized snapshot by which to compare hospitals. Because we only included a few items, we may have overestimated or underestimated the range of reported costs for such a basket.
Standardized costs are a novel method for comparing utilization across hospitals. Used properly, they will help identify high‐ and low‐intensity providers of hospital care.
- Health care costs–a primer. Kaiser Family Foundation Web site. Available at: http://www.kff.org/insurance/7670.cfm. Accessed July 20, 2012.
- . Explaining high health care spending in the United States: an international comparison of supply, utilization, prices, and quality. The Commonwealth Fund. 2012. Available at: http://www.commonwealthfund.org/Publications/Issue‐Briefs/2012/May/High‐Health‐Care‐Spending. aspx. Accessed on July 20, 2012.
- , , , , , . The relationship between hospital spending and mortality in patients with sepsis. Arch Intern Med. 2011;171(4):292–299.
- , , , . The elusive connection between health care spending and quality. Health Aff (Millwood). 2009;28(1):w119–w123.
- , , , . Hospital quality and intensity of spending: is there an association? Health Aff (Millwood). 2009;28(4):w566–w572.
- , , , , . Measuring efficiency: the association of hospital costs and quality of care. Health Aff (Millwood). 2009;28(3):897–906.
- , . Assigning resources to health care use for health services research: options and consequences. Med Care. 2009;47(7 suppl 1):S70–S75.
- , , , , . Health care costing: data, methods, current applications. Med Care. 2009;47(7 suppl 1):S1–S6.
- . Determination of VA health care costs. Med Care Res Rev. 2003;60(3 suppl):124S–141S.
- . An improved set of standards for finding cost for cost‐effectiveness analysis. Med Care. 2009;47(7 suppl 1):S82–S88.
- , , , et al. Comparison of approaches for estimating prevalence costs of care for cancer patients: what is the impact of data source? Med Care. 2009;47(7 suppl 1):S64–S69.
- . Principles involved in costing. Med J Aust. 1990;153Suppl:S10–S12.
- . Spending more through “cost control:” our obsessive quest to gut the hospital. Health Aff (Millwood). 1996;15(2):145–154.
- , , , et al. Distribution of variable vs. fixed costs of hospital care. JAMA. 1999;281(7):644–649.
- . Administrative and claims records as sources of health care cost data. Med Care. 2009;47(7 suppl 1):S51–S55.
- , , , , , . Perioperative beta‐blocker therapy and mortality after major noncardiac surgery. N Engl J Med. 2005;353(4):349–361.
- , , , et al. Public reporting and pay for performance in hospital quality improvement. N Engl J Med. 2007;356(5):486–496.
- , , , et al. Procedure intensity and the cost of care. Circ Cardiovasc Qual Outcomes. 2012;5(3):308–313.
- , , . A comparative study of tests for homogeneity of variances, with applications to the outer continental shelf bidding data. Technometrics. 1981;23:351–361.
- , , . Beyond the efficiency index: finding a better way to reduce overuse and increase efficiency in physician care. Health Aff (Millwood). 2008;27(4):w250–w259.
- , , . The association between hospital volume and processes, outcomes, and costs of care for congestive heart failure. Ann Intern Med. 2011;154(2):94–102.
Healthcare spending exceeded $2.5 trillion in 2007, and payments to hospitals represented the largest portion of this spending (more than 30%), equaling the combined cost of physician services and prescription drugs.[1, 2] Researchers and policymakers have emphasized the need to improve the value of hospital care in the United States, but this has been challenging, in part because of the difficulty in identifying hospitals that have high resource utilization relative to their peers.[3, 4, 5, 6, 7, 8, 9, 10, 11]
Most hospitals calculate their costs using internal accounting systems that determine resource utilization via relative value units (RVUs).[7, 8] RVU‐derived costs, also known as hospital reported costs, have proven to be an excellent method for quantifying what it costs a given hospital to provide a treatment, test, or procedure. However, RVU‐based costs are less useful for comparing resource utilization across hospitals because the cost to provide a treatment or service varies widely across hospitals. The cost of an item calculated using RVUs includes not just the item itself, but also a portion of the fixed costs of the hospital (overhead, labor, and infrastructure investments such as electronic records, new buildings, or expensive radiological or surgical equipment).[12] These costs vary by institution, patient population, region of the country, teaching status, and many other variables, making it difficult to identify resource utilization across hospitals.[13, 14]
Recently, a few claims‐based multi‐institutional datasets have begun incorporating item‐level RVU‐based costs derived directly from the cost accounting systems of participating institutions.[15] Such datasets allow researchers to compare reported costs of care from hospital to hospital, but because of the limitations we described above, they still cannot be used to answer the question: Which hospitals with higher costs of care are actually providing more treatments and services to patients?
To better facilitate the comparison of resource utilization patterns across hospitals, we standardized the unit costs of all treatments and services across hospitals by applying a single cost to every item across hospitals. This standardized cost allowed to compare utilization of that item (and the 15,000 other items in the database) across hospitals. We then compared estimates of resource utilization as measured by the 2 approaches: standardized and RVU‐based costs.
METHODS
Ethics Statement
All data were deidentified, by Premier, Inc., at both the hospital and patient level in accordance with the Health Insurance Portability and Accountability Act. The Yale University Human Investigation Committee reviewed the protocol for this study and determined that it is not considered to be human subjects research as defined by the Office of Human Research Protections.
Data Source
We conducted a cross‐sectional study using data from hospitals that participated in the database maintained by Premier Healthcare Informatics (Charlotte, NC) in the years 2009 to 2010. The Premier database is a voluntary, fee‐supported database created to measure quality and healthcare utilization.[3, 16, 17, 18] In 2010, it included detailed billing data from 500 hospitals in the United States, with more than 130 million cumulative hospital discharges. The detailed billing data includes all elements found in hospital claims derived from the uniform billing‐04 form, as well as an itemized, date‐stamped log of all items and services charged to the patient or insurer, such as medications, laboratory tests, and diagnostic and therapeutic services. The database includes approximately 15% of all US hospitalizations. Participating hospitals are similar to the composition of acute care hospitals nationwide. They represent all regions of the United States, and represent predominantly small‐ to mid‐sized nonteaching facilities that serve a largely urban population. The database also contains hospital reported costs at the item level as well as the total cost of the hospitalization. Approximately 75% of hospitals that participate submit RVU‐based costs taken from internal cost accounting systems. Because of our focus on comparing standardized costs to reported costs, we included only data from hospitals that use RVU‐based costs in this study.
Study Subjects
We included adult patients with a hospitalization recorded in the Premier database between January 1, 2009 and December 31, 2010, and a principal discharge diagnosis of heart failure (HF) (International Classification of Diseases, Ninth Revision, Clinical Modification codes: 402.01, 402.11, 402.91, 404.01, 404.03, 404.11, 404.13, 404.91, 404.93, 428.xx). We excluded transfers, patients assigned a pediatrician as the attending of record, and those who received a heart transplant or ventricular assist device during their stay. Because cost data are prone to extreme outliers, we excluded hospitalizations that were in the top 0.1% of length of stay, number of billing records, quantity of items billed, or total standardized cost. We also excluded hospitals that admitted fewer than 25 HF patients during the study period to reduce the possibility that a single high‐cost patient affected the hospital's cost profile.
Hospital Information
For each hospital included in the study, we recorded number of beds, teaching status, geographic region, and whether it served an urban or rural population.
Assignment of Standardized Costs
We defined reported cost as the RVU‐based cost per item in the database. We then calculated the median across hospitals for each item in the database and set this as the standardized unit cost of that item at every hospital (Figure 1). Once standardized costs were assigned at the item level, we summed the costs of all items assigned to each patient and calculated the standardized cost of a hospitalization per patient at each hospital.
Examination of Cost Variation
We compared the standardized and reported costs of hospitalizations using medians, interquartile ranges, and interquartile ratios (Q75/Q25). To examine whether standardized costs can reduce the noise due to differences in overhead and other fixed costs, we calculated, for each hospital, the coefficients of variation (CV) for per‐day reported and standardized costs and per‐hospitalization reported and standardized costs. We used the Fligner‐Killeen test to determine whether the variance of CVs was different for reported and standardized costs.[19]
Creation of Basket of Goods
Because there can be differences in the costs of items, the number and types of items administered during hospitalizations, 2 hospitals with similar reported costs for a hospitalization might deliver different quantities and combinations of treatments (Figure 1). We wished to demonstrate that there is variation in reported costs of items when the quantity and type of item is held constant, so we created a basket of items. We chose items that are commonly administered to patients with heart failure, but could have chosen any combination of items. The basket included a day of medical room and board, a day of intensive care unit (ICU) room and board, a single dose of ‐blocker, a single dose of angiotensin‐converting enzyme inhibitor, complete blood count, a B‐natriuretic peptide level, a chest radiograph, a chest computed tomography, and an echocardiogram. We then examined the range of hospitals' reported costs for this basket of goods using percentiles, medians, and interquartile ranges.
Reported to Standardized Cost Ratio
Next, we calculated standardized costs of hospitalizations for included hospitals and examined the relationship between hospitals' mean reported costs and mean standardized costs. This ratio could help diagnose the mechanism of high reported costs for a hospital, because high reported costs with low utilization would indicate high fixed costs, while high reported costs with high utilization would indicate greater use of tests and treatments. We assigned hospitals to strata based on reported costs greater than standardized costs by more than 25%, reported costs within 25% of standardized costs, and reported costs less than standardized costs by more than 25%. We examined the association between hospital characteristics and strata using a 2 test. All analyses were carried out using SAS version 9.3 (SAS Institute Inc., Cary, NC).
RESULTS
The 234 hospitals included in the analysis contributed a total of 165,647 hospitalizations, with the number of hospitalizations ranging from 33 to 2,772 hospitalizations per hospital (see Supporting Table 1 in the online version of this article). Most were located in urban areas (84%), and many were in the southern United States (42%). The median hospital reported cost per hospitalization was $6,535, with an interquartile range of $5,541 to $7,454. The median standardized cost per hospitalization was $6,602, with a range of $5,866 to $7,386. The interquartile ratio (Q75/Q25) of the reported costs of a hospitalization was 1.35. After costs were standardized, the interquartile ratio fell to 1.26, indicating that variation decreased. We found that the median hospital reported cost per day was $1,651, with an IQR of $1,400 to $1,933 (ratio 1.38), whereas the median standardized cost per day was $1,640, with an IQR of $1,511 to $1,812 (ratio 1.20).
There were more than 15,000 items (eg, treatments, tests, and supplies) that received a standardized charge code in our cohort. These were divided into 11 summary departments and 40 standard departments (see Supporting Table 2 in the online version of this article). We observed a high level of variation in the reported costs of individual items: the reported costs of a day of room and board in an ICU ranged from $773 at hospitals at the 10th percentile to $2,471 at the 90th percentile (Table 1.). The standardized cost of a day of ICU room and board was $1,577. We also observed variation in the reported costs of items across item categories. Although a day of medical room and board showed a 3‐fold difference between the 10th and 90th percentile, we observed a more than 10‐fold difference in the reported cost of an echocardiogram, from $31 at the 10th percentile to $356 at the 90th percentile. After examining the hospital‐level cost for a basket of goods, we found variation in the reported costs for these items across hospitals, with a 10th percentile cost of $1,552 and a 90th percentile cost of $3,967.
| Reported Costs | 10th Percentile | 25th Percentile | 75th Percentile | 90th Percentile | Median (Standardized Cost) |
|---|---|---|---|---|---|
| |||||
| Item | |||||
| Day of medical | 490.03 | 586.41 | 889.95 | 1121.20 | 722.59 |
| Day of ICU | 773.01 | 1275.84 | 1994.81 | 2471.75 | 1577.93 |
| Complete blood count | 6.87 | 9.34 | 18.34 | 23.46 | 13.07 |
| B‐natriuretic peptide | 12.13 | 19.22 | 44.19 | 60.56 | 28.23 |
| Metoprolol | 0.20 | 0.68 | 2.67 | 3.74 | 1.66 |
| Lisinopril | 0.28 | 1.02 | 2.79 | 4.06 | 1.72 |
| Spironolactone | 0.22 | 0.53 | 2.68 | 3.83 | 1.63 |
| Furosemide | 1.27 | 2.45 | 5.73 | 8.12 | 3.82 |
| Chest x‐ray | 43.88 | 51.54 | 89.96 | 117.16 | 67.45 |
| Echocardiogram | 31.53 | 98.63 | 244.63 | 356.50 | 159.07 |
| Chest CT (w & w/o contrast) | 65.17 | 83.99 | 157.23 | 239.27 | 110.76 |
| Noninvasive positive pressure ventilation | 126.23 | 127.25 | 370.44 | 514.67 | 177.24 |
| Electrocardiogram | 12.08 | 18.77 | 42.74 | 64.94 | 29.78 |
| Total basket | 1552.50 | 2157.85 | 3417.34 | 3967.78 | 2710.49 |
We found that 46 (20%) hospitals had reported costs of hospitalizations that were 25% greater than standardized costs (Figure 2). This group of hospitals had overestimated reported costs of utilization; 146 (62%) had reported costs within 25% of standardized costs, and 42 (17%) had reported costs that were 25% less than standardized costs (indicating that reported costs underestimated utilization). We examined the relationship between hospital characteristics and strata and found no significant association between the reported to standardized cost ratio and number of beds, teaching status, or urban location (Table 2). Hospitals in the Midwest and South were more likely to have a lower reported cost of hospitalizations, whereas hospitals in the West were more likely to have higher reported costs (P<0.001). When using the CV to compare reported costs to standardized costs, we found that per‐day standardized costs showed reduced variance (P=0.0238), but there was no significant difference in variance of the reported and standardized costs when examining the entire hospitalization (P=0.1423). At the level of the hospitalization, the Spearman correlation coefficient between reported and standardized cost was 0.89.
| Reported Greater Than Standardized by >25%, n (%) | Reported Within 25% (2‐tailed) of Standardized, n (%) | Reported Less Than Standardized by >25%, n (%) | P for 2 Test | |
|---|---|---|---|---|
| Total | 46 (19.7) | 146 (62.4) | 42 (17.0) | |
| No. of beds | 0.2313 | |||
| <200 | 19 (41.3) | 40 (27.4) | 12 (28.6) | |
| 200400 | 14 (30.4) | 67 (45.9) | 15 (35.7) | |
| >400 | 13 (28.3) | 39 (26.7) | 15 (35.7) | |
| Teaching | 0.8278 | |||
| Yes | 13 (28.3) | 45 (30.8) | 11 (26.2) | |
| No | 33 (71.7) | 101 (69.2) | 31 (73.8) | |
| Region | <0.0001 | |||
| Midwest | 7 (15.2) | 43 (29.5) | 19 (45.2) | |
| Northeast | 6 (13.0) | 18 (12.3) | 3 (7.1) | |
| South | 14 (30.4) | 64 (43.8) | 20 (47.6) | |
| West | 19 (41.3) | 21 (14.4) | 0 (0) | |
| Urban vs rural | 36 (78.3) | 128 (87.7) | 33 (78.6) | 0.1703 |
To better understand how hospitals can achieve high reported costs through different mechanisms, we more closely examined 3 hospitals with similar reported costs (Figure 3). These hospitals represented low, average, and high utilization according to their standardized costs, but had similar average per‐hospitalization reported costs: $11,643, $11,787, and $11,892, respectively. The corresponding standardized costs were $8,757, $11,169, and $15,978. The hospital with high utilization ($15,978 in standardized costs) was accounted for by increased use of supplies and other services. In contrast, the low‐ and average‐utilization hospitals had proportionally lower standardized costs across categories, with the greatest percentage of spending going toward room and board (includes nursing).
DISCUSSION
In a large national sample of hospitals, we observed variation in the reported costs for a uniform basket of goods, with a more than 2‐fold difference in cost between the 10th and 90th percentile hospitals. These findings suggest that reported costs have limited ability to reliably describe differences in utilization across hospitals. In contrast, when we applied standardized costs, the variance of per‐day costs decreased significantly, and the interquartile ratio of per‐day and hospitalization costs decreased as well, suggesting less variation in utilization across hospitals than would have been inferred from a comparison of reported costs. Applying a single, standard cost to all items can facilitate comparisons of utilization between hospitals (Figure 1). Standardized costs will give hospitals the potential to compare their utilization to their competitors and will facilitate research that examines the comparative effectiveness of high and low utilization in the management of medical and surgical conditions.
The reported to standardized cost ratio is another useful tool. It indicates whether the hospital's reported costs exaggerate its utilization relative to other hospitals. In this study, we found that a significant proportion of hospitals (20%) had reported costs that exceeded standardized costs by more than 25%. These hospitals have higher infrastructure, labor, or acquisition costs relative to their peers. To the extent that these hospitals might wish to lower the cost of care at their institution, they could focus on renegotiating purchasing or labor contracts, identifying areas where they may be overstaffed, or holding off on future infrastructure investments (Table 3).[14] In contrast, 17% of hospitals had reported costs that were 25% less than standardized costs. High‐cost hospitals in this group are therefore providing more treatments and testing to patients relative to their peers and could focus cost‐control efforts on reducing unnecessary utilization and duplicative testing.[20] Our examination of the hospital with high reported costs and very high utilization revealed a high percentage of supplies and other items, which is a category used primarily for nursing expenditures (Figure 3). Because the use of nursing services is directly related to days spent in the hospital, this hospital may wish to more closely examine specific strategies for reducing length of stay.
| High Reported Costs/High Standardized Costs | High Reported Costs/Low Standardized Costs | Low Reported Costs/High Standardized Costs | Low Reported Costs/Low Standardized Costs | |
|---|---|---|---|---|
| Utilization | High | Low | High | Low |
| Severity of illness | Likely to be higher | Likely to be lower | Likely to be higher | Likely to be lower |
| Practice style | Likely to be more intense | Likely to be less intense | Likely to be more intense | Likely to be less intense |
| Fixed costs | High or average | High | Low | Low |
| Infrastructure costs | Likely to be higher | Likely to be higher | Likely to be lower | Likely to be lower |
| Labor costs | Likely to be higher | Likely to be higher | Likely to be lower | Likely to be lower |
| Reported‐to‐standardized cost ratio | Close to 1 | >1 | <1 | Close to 1 |
| Causes of high costs | High utilization, high fixed costs, or both | High acquisition costs, high labor costs, or expensive infrastructure | High utilization | |
| Interventions to reduce costs | Work with clinicians to alter practice style, consider renegotiating cost of acquisitions, hold off on new infrastructure investments | Consider renegotiating cost of acquisitions, hold off on new infrastructure investments, consider reducing size of labor force | Work with clinicians to alter practice style | |
| Usefulness of reported‐ to‐standardized cost ratio | Less useful | More useful | More useful | Less useful |
We did not find a consistent association between the reported to standardized cost ratio and hospital characteristics. This is an important finding that contradicts prior work examining associations between hospital characteristics and costs for heart failure patients,[21] further indicating the complexity of the relationship between fixed costs and variable costs and the difficulty in adjusting reported costs to calculate utilization. For example, small hospitals may have higher acquisition costs and more supply chain difficulties, but they may also have less technology, lower overhead costs, and fewer specialists to order tests and procedures. Hospital characteristics, such as urban location and teaching status, are commonly used as adjustors in cost studies because hospitals in urban areas with teaching missions (which often provide care to low‐income populations) are assumed to have higher fixed costs,[3, 4, 5, 6] but the lack of a consistent relationship between these characteristics and the standardized cost ratio may indicate that using these factors as adjustors for cost may not be effective and could even obscure differences in utilization between hospitals. Notably, we did find an association between hospital region and the reported to standardized cost ratio, but we hesitate to draw conclusions from this finding because the Premier database is imbalanced in terms of regional representation, with fewer hospitals in the Midwest and West and the bulk of the hospitals in the South.
Although standardized costs have great potential, this method has limitations as well. Standardized costs can only be applied when detailed billing data with item‐level costs are available. This is because calculation of standardized costs requires taking the median of item costs and applying the median cost across the database, maintaining the integrity of the relative cost of items to one another. The relative cost of items is preserved (ie, magnetic resonance imaging still costs more than an aspirin), which maintains the general scheme of RVU‐based costs while removing the noise of varying RVU‐based costs across hospitals.[7] Application of an arbitrary item cost would result in the loss of this relative cost difference. Because item costs are not available in traditional administrative datasets, these datasets would not be amenable to this method. However, highly detailed billing data are now being shared by hundreds of hospitals in the Premier network and the University Health System Consortium. These data are widely available to investigators, meaning that the generalizability of this method will only improve over time. It was also a limitation of the study that we chose a limited basket of items common to patients with heart failure to describe the range of reported costs and to provide a standardized snapshot by which to compare hospitals. Because we only included a few items, we may have overestimated or underestimated the range of reported costs for such a basket.
Standardized costs are a novel method for comparing utilization across hospitals. Used properly, they will help identify high‐ and low‐intensity providers of hospital care.
- Health care costs–a primer. Kaiser Family Foundation Web site. Available at: http://www.kff.org/insurance/7670.cfm. Accessed July 20, 2012.
- . Explaining high health care spending in the United States: an international comparison of supply, utilization, prices, and quality. The Commonwealth Fund. 2012. Available at: http://www.commonwealthfund.org/Publications/Issue‐Briefs/2012/May/High‐Health‐Care‐Spending. aspx. Accessed on July 20, 2012.
- , , , , , . The relationship between hospital spending and mortality in patients with sepsis. Arch Intern Med. 2011;171(4):292–299.
- , , , . The elusive connection between health care spending and quality. Health Aff (Millwood). 2009;28(1):w119–w123.
- , , , . Hospital quality and intensity of spending: is there an association? Health Aff (Millwood). 2009;28(4):w566–w572.
- , , , , . Measuring efficiency: the association of hospital costs and quality of care. Health Aff (Millwood). 2009;28(3):897–906.
- , . Assigning resources to health care use for health services research: options and consequences. Med Care. 2009;47(7 suppl 1):S70–S75.
- , , , , . Health care costing: data, methods, current applications. Med Care. 2009;47(7 suppl 1):S1–S6.
- . Determination of VA health care costs. Med Care Res Rev. 2003;60(3 suppl):124S–141S.
- . An improved set of standards for finding cost for cost‐effectiveness analysis. Med Care. 2009;47(7 suppl 1):S82–S88.
- , , , et al. Comparison of approaches for estimating prevalence costs of care for cancer patients: what is the impact of data source? Med Care. 2009;47(7 suppl 1):S64–S69.
- . Principles involved in costing. Med J Aust. 1990;153Suppl:S10–S12.
- . Spending more through “cost control:” our obsessive quest to gut the hospital. Health Aff (Millwood). 1996;15(2):145–154.
- , , , et al. Distribution of variable vs. fixed costs of hospital care. JAMA. 1999;281(7):644–649.
- . Administrative and claims records as sources of health care cost data. Med Care. 2009;47(7 suppl 1):S51–S55.
- , , , , , . Perioperative beta‐blocker therapy and mortality after major noncardiac surgery. N Engl J Med. 2005;353(4):349–361.
- , , , et al. Public reporting and pay for performance in hospital quality improvement. N Engl J Med. 2007;356(5):486–496.
- , , , et al. Procedure intensity and the cost of care. Circ Cardiovasc Qual Outcomes. 2012;5(3):308–313.
- , , . A comparative study of tests for homogeneity of variances, with applications to the outer continental shelf bidding data. Technometrics. 1981;23:351–361.
- , , . Beyond the efficiency index: finding a better way to reduce overuse and increase efficiency in physician care. Health Aff (Millwood). 2008;27(4):w250–w259.
- , , . The association between hospital volume and processes, outcomes, and costs of care for congestive heart failure. Ann Intern Med. 2011;154(2):94–102.
© 2013 Society of Hospital Medicine
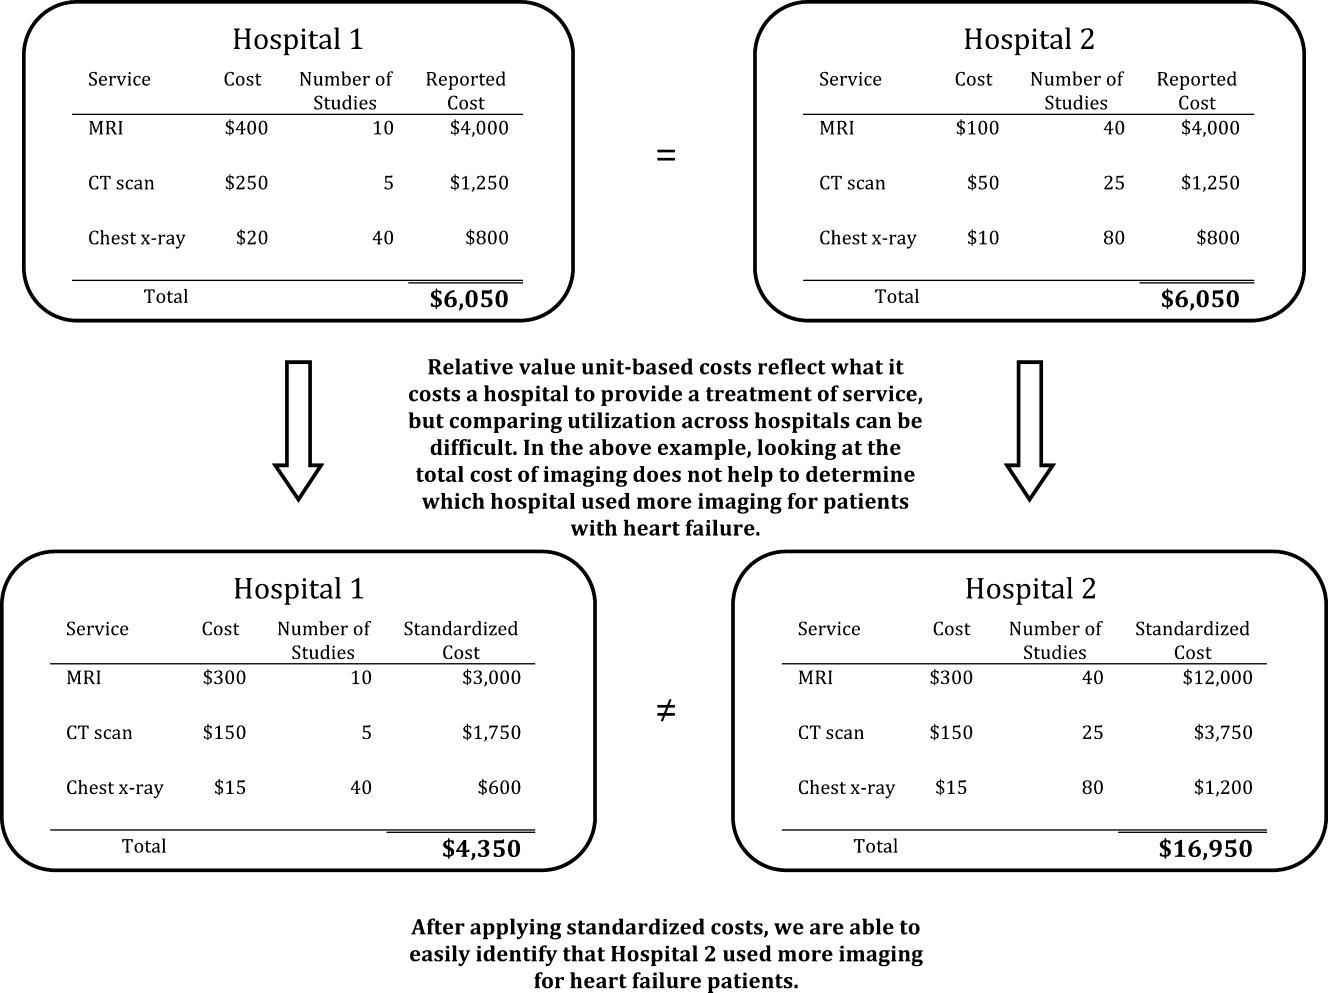
Acute Respiratory Failure Epidemiology
Acute respiratory failure (ARF), a common and serious complication in hospitalized patients, may be caused by several conditions including pneumonia, chronic obstructive pulmonary disease (COPD), adult respiratory distress syndrome (ARDS), and congestive heart failure (CHF). Although ARF is conventionally defined by an arterial oxygen tension of <60 mm Hg, an arterial carbon dioxide tension of >45 mm Hg, or both, these thresholds serve as a guide to be used in combination with history and clinical assessment of the patient.[1, 2] Supplemental oxygen and treatment of the underlying cause is the mainstay of therapy for ARF, but in severe cases patients are treated with invasive mechanical ventilation (IMV) or noninvasive ventilation (NIV). ARF is the most frequent reason for admission to the intensive care unit (ICU)[3, 4] and has an in‐hospital mortality rate of 33% to 37% among those who require IMV.[5, 6] The majority of epidemiologic studies of ARF have been limited to patients requiring mechanical ventilation or those admitted to the ICU, and information about the characteristics and outcomes of patients across the full spectrum of severity is much more limited.[5, 7, 8, 9, 10, 11] General improvements in the management of underlying conditions, implementation of more effective ventilation strategies,[12, 13] and increasing use of NIV[14, 15] may have led to better outcomes for patients with ARF, yet empirical evidence of a change in the adjusted mortality rate over time is lacking.
The objective of this study was to provide a broad characterization of the epidemiology of ARF among adults hospitalized in the United States using a large nationally representative database. We sought to evaluate whether incidence, mortality, cost, or ventilation practice associated with ARF in the United States changed over the period of 2001 to 2009.
METHODS
Data Source
We utilized data from the Nationwide Inpatient Sample (NIS) of the Health Care Cost and Utilization Project,[16] which is a 20% stratified probability sample of all US acute‐care hospitals each year. These data are drawn from a sampling frame that contains close to 95% of all discharges in the United States, with the hospital discharge record as the unit of analysis. The NIS has been used to study trends in many different diagnoses.[17, 18, 19] The database contains demographic information, payer information, principal and secondary diagnoses, cost, discharge disposition, and death during hospitalization. It also contains information on hospital characteristics including ownership, size, teaching status, and geographic region.
Definitions
We included patients 18 years old discharged between 2001 and 2009 with a primary or secondary diagnosis of ARF. We identified cases of ARF using diagnostic codes (International Classification of Diseases, Ninth Revision, Clinical Modification [ICD‐9‐CM]) previously used in studies of acute organ dysfunction in sepsis (518.81, 518.82, 518.84, 518.4, 799.1, 786.09).[17, 20, 21] To define ARDS we relied on ICD‐9‐CM codes (518.4, 518.82, 518.5, 786.09) used in prior studies that showed good sensitivity and specificity.[22, 23] The use of ventilatory support was identified using the ICD‐9‐CM procedure codes[24] (93.90, 93.70, 93.71, 93.76). Comorbidities were classified using the Agency for Healthcare Research and Quality's (Rockville, MD) Healthcare Cost and Utilization Project's (HCUP) Comorbidity Software version 3.103.5.[25]
Outcomes
The primary outcomes included the annual number of hospitalizations, population incidence, hospital mortality, and costs of care. Secondary outcomes included length of stay, most common diagnoses associated with ARF, disposition at discharge, and use and type of ventilatory support.
Analysis
We estimated the number of hospitalizations with a diagnosis of ARF/year, and we calculated the weighted frequencies following HCUP‐NIS recommendations using SAS/STAT survey procedures. Using population estimates for the years 2001 to 2009 from the US Census Bureau, we employed direct standardization to calculate age‐, gender‐, and race‐adjusted population incidence and mortality rates of ARF per 100,000 population. Hospital mortality was defined as the ratio of ARF hospitalizations ending in death divided by total number of ARF hospitalizations. Mechanical ventilation rates and rates of selected comorbidities were similarly defined.
We employed indirect standardization to adjust hospital mortality rates for age, sex, race/ethnicity, comorbidities, and hospital characteristics using logistic regression models from 2001 to predict hospital mortality for 2002 to 2009. We used linear regression models to test whether the slope of year was significant for trends in outcomes overtime. Costs were calculated using hospital‐specific cost‐to‐charge ratios when available and a weighted group average at the state level for remaining hospitals. We converted all costs to 2009 US dollars using the Consumer Price Index. Costs and lengths of stay were not normally distributed, so we calculated weighted geometric means (the average of all logarithmic values), then converted back to a base‐10 number. Using a Taylor series expansion, we then calculated standard errors. All analyses were performed using SAS version 9.2 (SAS Institute, Inc., Cary, NC).
The Baystate Medical Center institutional review board determined that the project did not constitute human subjects research.
RESULTS
Hospitalization Trends
The number of hospitalizations with an ARF diagnosis code increased at an average annual rate of 11.3% from 1,007,549 (standard deviation [SD] = 19,268) in 2001 to 1,917,910 (SD = 47,558) in 2009. More than two‐thirds of ARF admissions were associated with medical, rather than surgical, conditions (69.5% in 2001 and 71.2% in 2009). The median age, racial make‐up, and gender did not change significantly. Over the study period we observed an increase in ARF‐related hospitalizations in large, urban, teaching hospitals and in hospitals located in the Midwest (Table 1).
| 2001 | 2003 | 2005 | 2007 | 2009 | |
|---|---|---|---|---|---|
| |||||
| Patient characteristics | |||||
| All, N (SD) | 1,007,549 (19,268) | 1,184,928 (25,542) | 1,288,594 (30,493) | 1,480,270 (32,002) | 1,917,910 (47,558) |
| Age, mean (SE), y | 66.6 (0.2) | 66.0 (0.2) | 66.1 (0.2) | 65.8 (0.2) | 65.8 (0.2) |
| Age group, % | |||||
| 1844 | 11.5 | 12.0 | 11.5 | 11.6 | 10.9 |
| 4564* | 26.7 | 28.9 | 29.6 | 30.7 | 31.7 |
| 6584* | 50.2 | 47.8 | 47.0 | 45.7 | 45.3 |
| 85+ | 11.5 | 11.4 | 11.9 | 12.0 | 12.1 |
| Male* | 48.1 | 48.2 | 48.6 | 49.3 | 49.2 |
| Race | |||||
| White | 75.8 | 71.9 | 76.5 | 71.8 | 73.4 |
| Black | 12.7 | 13.6 | 11.2 | 14.2 | 12.5 |
| Hispanic | 7.2 | 9.8 | 7.7 | 8.5 | 7.8 |
| Other | 4.2 | 4.7 | 4.7 | 5.5 | 6.3 |
| Primary ARF | 20.7 | 20.9 | 25.9 | 26.1 | 19.9 |
| Secondary ARF | 79.3 | 79.1 | 74.1 | 73.9 | 80.1 |
| Medical* | 69.5 | 69.1 | 69.9 | 70.2 | 71.2 |
| Surgical* | 30.5 | 30.8 | 30.1 | 29.8 | 28.8 |
| Hospital characteristics, % | |||||
| Number of beds | |||||
| Small | 10.0 | 10.1 | 10.5 | 10.8 | 11.3 |
| Medium | 25.2 | 25.3 | 24.6 | 24.0 | 22.7 |
| Large | 64.7 | 64.6 | 64.9 | 65.2 | 66.0 |
| Region | |||||
| South* | 18.5 | 18.5 | 17.6 | 17.0 | 16.3 |
| Midwest | 21.4 | 22.0 | 23.6 | 23.2 | 23.5 |
| Northeast | 42.6 | 41.7 | 41.4 | 42.2 | 42.1 |
| West* | 17.5 | 17.8 | 17.3 | 17.6 | 18.1 |
| Hospital type | |||||
| Rural | 13.6 | 13.0 | 11.8 | 11.0 | 10.8 |
| Urban nonteaching | 45.5 | 44.5 | 50.1 | 45.3 | 45.7 |
| Urban teaching | 40.9 | 42.5 | 38.1 | 43.7 | 43.6 |
| Patient outcomes | |||||
| Ventilation strategy | |||||
| IMV* | 48.5 | 48.4 | 47.5 | 46.5 | 42.1 |
| NIV* | 3.8 | 5.3 | 6.9 | 9.4 | 10.1 |
| IMV or NIV | 50.9 | 51.7 | 52.1 | 52.9 | 49.7 |
| Disposition | |||||
| Home/home healthcare* | 42.1 | 43.8 | 42.8 | 43.4 | 45.7 |
| Transfer to acute care | 5.2 | 4.7 | 4.6 | 4.6 | 4.4 |
| Nursing facility* | 24.4 | 24.9 | 27.4 | 28.6 | 29.0 |
| Other | 0.7 | 0.8 | 0.9 | 0.9 | 1.0 |
| Adjusted mortality, % (SE)* | 27.6 (0.3) | 26.4 (0.4) | 24.9 (0.4) | 22.7 (0.4) | 20.6 (0.3) |
| Adjusted mean, LOS/case, d (SE)* | 7.8 (0.1) | 7.9 (0.1) | 7.7 (0.1) | 7.5 (0.1) | 7.1 (0.1) |
| Adjusted mean cost/case, 2009 US$, (SE) | 15,818 (251) | 16,981 (419) | 17,236 (411) | 16,941 (436) | 15,987 (402) |
After adjusting for age and sex, the population incidence of ARF increased from 502 (standard error [SE] = 10) cases per 100,000 in 2001 to 784 (SE = 19) cases per 100,000 in 2009 (a 56% increase, P < 0.0001). Hispanics had the lowest rates of ARF, with both black and white groups having similar rates (Table 2).
| 2001 | 2003 | 2005 | 2007 | 2009 | |
|---|---|---|---|---|---|
| |||||
| All* | 502 (10) | 569 (12) | 595 (14) | 627 (14) | 784 (19) |
| Age group | |||||
| 1844* | 107 (3) | 130 (4) | 137 (4) | 153 (5) | 189 (6) |
| 4564* | 422 (9) | 500 (12) | 521 (13) | 580 (14) | 739 (19) |
| 6584* | 1697 (35) | 1863 (42) | 1950 (50) | 2066 (46) | 2578 (69) |
| 85+ | 3449 (86) | 3792 (106) | 3981 (120) | 3429 (97) | 4163 (123) |
| Sex | |||||
| Male* | 491 (10) | 553 (13) | 582 (14) | 629 (14) | 782 (20) |
| Female* | 512 (10) | 583 (12) | 607 (15) | 625 (13) | 786 (19) |
| Race/ethnicity | |||||
| White* | 398 (11) | 427 (12) | 466 (16) | 450 (13) | 699 (21) |
| Black* | 423 (27) | 513 (33) | 432 (26) | 574 (38) | 738 (37) |
| Hispanic* | 247 (24) | 381 (42) | 307 (27) | 353 (34) | 478 (42) |
| Other* | 268 (20) | 342 (29) | 347 (26) | 424 (29) | 713 (77) |
| In‐hospital mortality | 140 (3) | 148 (3) | 146 (3) | 140 (3) | 154 (4) |
The most common etiologies of ARF among medical patients were pneumonia, CHF, ARDS, COPD exacerbation, and sepsis. Over the 9‐year study, the proportion of cases secondary to pneumonia and sepsis rose significantly: from 39% to 46% and 13% to 21%, respectively (Figure 1).

Mortality and Other Outcomes
The number of in‐hospital deaths related to ARF increased from 277,407 deaths in 2001 to 381,155 in 2009 (a 37% increase, P < 0.001). Standardized to the population, deaths increased from 140 in 2001 to 154 cases per 100,000 in 2009 (a 10% increase, P = 0.027). Despite slightly increasing mortality rates at a population level, adjusted in‐hospital mortality improved from 27.6% in 2001 to 20.6% in 2009 (P < 0.001). Mortality declined for both IMV and NIV patients from 35.3% in 2001 to 30.2% in 2009 and from 23.5% to 19%, respectively, but increased for those who required both NIV and IMV (from 26.9% in 2001 to 28% in 2009).
Adjusted hospital length of stay decreased from 7.8 days per patient in 2001 to 7.1 days in 2009 (P < 0.001), with a concomitant increase in discharges to nursing facilities, from 24% in 2001 to 29% in 2009. There was no linear trend in adjusted cost per case, with $15,818 in 2001 and $15,987 in 2009 (in 2009 US dollars) (Table 1).
Ventilation Practices
Overall, 50.9% patients received ventilatory support (NIV or IMV or both) in 2001 and 49.7% in 2009 (P= 0.25). The use of NIV increased from 3.8% to 10.1% (P < 0.001), a 169% increase, whereas the utilization of IMV decreased from 48.5% in 2001 to 42.1% in 2009 (P for trend < 0.0001), a 13% decrease. Uses of both NIV and IMV during hospitalization were seen in 1.4% of cases in 2001 and 2.5% of cases in 2009.
2009 Data Analysis
In 2009 the 1,917,910 hospitalizations with ARF resulted in 381,155 (SD = 8965) deaths and a total inpatient cost of $54 billion. The most common etiologies in patients over 65 years old were pneumonia, CHF, COPD, ARDS, and sepsis. In patients younger than 45 years the most frequent diagnoses were pneumonia, ARDS, sepsis, asthma, drug ingestion, and trauma. Stratified analysis by gender and by age groups showed that mortality rates among men were higher than for women and were highest in patients older than 85 years (Table 3).
| Disease | Total | Age <45 Years | 4565 Years | 6584 Years | 85+ Years | Male | Female |
|---|---|---|---|---|---|---|---|
| |||||||
| Medical | |||||||
| Total, N (%) | 1,364,624 (71.2) | 144,715 (10.6) | 416,922 (30.6) | 615,009 (45.1) | 187,977 (13.8) | 647,894 (47.5) | 716,635 (52.5) |
| Pneumonia, %* | 46.1 | 41.7 | 42.8 | 46.9 | 54.3 | 48.8 | 43.7 |
| CHF, %* | 36.6 | 10.4 | 27.3 | 43.6 | 54.8 | 35.0 | 38.1 |
| ARDS, %* | 16.1 | 22.9 | 16.2 | 14.5 | 15.9 | 15.5 | 16.7 |
| Sepsis, %* | 21.2 | 18.1 | 21.3 | 21.3 | 23.1 | 22.8 | 19.8 |
| COPD, %* | 25.4 | 4.2 | 25.6 | 32.3 | 18.3 | 25.0 | 25.7 |
| AMI, %* | 9.0 | 2.6 | 7.1 | 10.5 | 13.3 | 9.3 | 8.8 |
| Asthma, %* | 9.2 | 18.1 | 11.6 | 6.7 | 5.4 | 6.2 | 12.0 |
| Stroke, %* | 4.8 | 2.3 | 4.1 | 5.5 | 6.0 | 5.0 | 4.7 |
| Trauma or burns, %* | 3.4 | 5.4 | 2.9 | 3.0 | 4.1 | 4.3 | 2.5 |
| Cardiorespiratory arrest, %* | 4.1 | 3.9 | 4.4 | 4.1 | 3.8 | 4.6 | 3.7 |
| Drug, %* | 3.7 | 16.6 | 5.1 | 0.8 | 0.3 | 3.8 | 3.6 |
| IMV, %* | 37.7 | 54.6 | 43.7 | 33.5 | 24.8 | 41.1 | 34.5 |
| NIV, %* | 11.9 | 7.1 | 11.5 | 13.0 | 12.7 | 11.4 | 12.3 |
| In‐hospital mortality (CI) | 22 (21.322.7) | 12.9 (11.913.9) | 18.5 (17.619.4) | 23.9 (23.024.9) | 31.8 (30.633.1) | 24.2 (23.325.1) | 20.9 (20.121.7) |
| Surgical | |||||||
| Total, N (%) | 552971 (28.8) | 64983 (11.8) | 190225 (34.4) | 254336 (46) | 43426 (7.9) | 295660 (53.5) | 257287 (46.5) |
| Pneumonia, %* | 34.9 | 33.0 | 34.0 | 35.0 | 40.5 | 37.1 | 32.2 |
| CHF, %* | 27.2 | 8.9 | 21.7 | 33.3 | 42.6 | 26.7 | 27.7 |
| ARDS, %* | 45.5 | 51.5 | 45.2 | 44.7 | 42.7 | 45.0 | 46.1 |
| Sepsis, %* | 25.1 | 22.8 | 25.4 | 25.2 | 26.1 | 25.4 | 24.7 |
| COPD, %* | 8.2 | 1.1 | 7.4 | 10.8 | 7.5 | 8.3 | 8.1 |
| AMI, %* | 16.9 | 4.9 | 17.0 | 19.8 | 17.9 | 19.1 | 14.4 |
| Asthma, %* | 6.1 | 7.6 | 7.2 | 5.4 | 3.6 | 4.1 | 8.5 |
| Stroke, %* | 8.9 | 6.6 | 9.2 | 9.4 | 7.2 | 8.9 | 8.8 |
| Trauma or burns, %* | 12.2 | 26.5 | 9.6 | 9.2 | 20.3 | 13.8 | 10.4 |
| Cardiorespiratory arrest, %* | 5.5 | 4.4 | 6.0 | 5.4 | 5.2 | 6.1 | 4.7 |
| Drug, %* | 0.5 | 1.3 | 0.7 | 0.2 | 0.2 | 0.4 | 0.6 |
| IMV, %* | 52.9 | 57.1 | 54.3 | 51.3 | 50.0 | 54.5 | 51.0 |
| NIV, %* | 5.8 | 3.5 | 5.5 | 6.4 | 6.4 | 5.6 | 6.0 |
| In‐hospital mortality, % (CI) | 18.6 (17.819.5) | 10.7 (9.312.0) | 15.5 (14.216.8) | 20.8 (19.821.9) | 29.4 (27.831.1) | 19.0 (18.219.8) | 18.3 (17.319.2) |
When we examined ventilation practices among medical patients we found that patients older than 85 years, when compared to patients younger than 45 years, were less likely to be treated with IMV (25% vs 55%) and more likely to be treated with NIV (12.7% vs 7%). At the same time, the average cost per case was lowest among patients 85 years and older, and hospital costs per case fell sharply after age 70 years. Costs were considerably higher for those who did not survive during hospitalization, particularly for patients younger than 45 years (Figure 2).
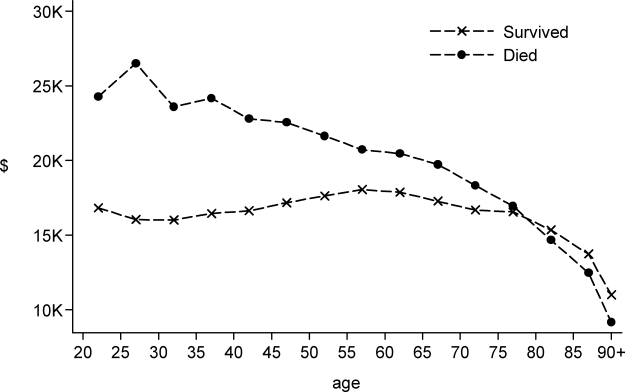
DISCUSSION
In this large population‐based study, we found that the number of hospitalizations associated with a diagnosis of ARF almost doubled over a 9‐year period. In 2009 there were nearly 2 million hospitalizations with ARF in the United States, resulting in approximately 380,000 deaths and inpatient costs of over $54 billion. The population‐adjusted ARF hospitalization rates increased in all age groups, and patients 85 years and older had the highest age‐specific hospitalization rate. Although overall rates of mechanical ventilation (NIV or IMV) remained stable over the 9‐year period, there was an important shift away from IMV (which decreased from 48% in 2001 to 42% in 2009) toward NIV (which increased from 4% in 2001 to 10% in 2009). Overall, there was a significant increase in the number of total deaths despite a decline in adjusted in‐hospital mortality rates. In‐hospital mortality rates decreased for all cases of ARF regardless of ventilation choice.
The findings of this study mirror results of others that have shown that although the incidence of critical care illnesses like sepsis[17, 20, 21, 26] and acute renal failure[27] has increased over the last decade, in‐hospital mortality rates have decreased.[20, 21, 28] Our results also compliment the results of a recent study that looked at hospitalizations for noncardiogenic ARF, which observed a 3.7‐fold increase in the number of cases and a steady decline in case fatality.[11]
Most prior studies addressing the incidence of ARF have included only patients receiving mechanical ventilation. In 1994, the estimated number of cases of ARF requiring IMV was 329,766,[9] which increased to 790,257 in 2005.[10] In our study we found that in 2009, the number of patients with ARF hospitalizations with IMV increased to 806,538. The increase in the overall number of cases with ARF was mainly driven by a surge in cases of sepsis and pneumonia. Our findings are consistent with national trends over time in noncardiogenic ARF[11] and in conditions that predispose patients to ARF such as sepsis[17, 20, 28] and acute renal failure.[27] As the number of claims for ARF doubled and the number of deaths increased, we found that adjusted hospital mortality improved from 27.6% in 2001 to 20.6% in 2009. This decline in hospital mortality was observed among all patients groups, regardless of ventilation choice. The decline in overall case fatality is consistent with prior findings in noncardiogenic ARF,[11] sepsis,[17, 28] and CHF.[29]
There are a number of potential explanations for the reduction in mortality observed over the study period, including improvements in hospital management of the underlying conditions leading to ARF, an increase in the proportion of patients being treated with NIV,[30] and advances in the care of critically ill patients such as the use of low‐tidal volume ventilation.[31, 32] Another contributor may be an increase in the proportion of discharges to nursing facilities, although this change in discharge disposition cannot fully explain our findings. For example, from 2007 to 2009, mortality decreased by 2 percentage points, and nursing home discharges increased by only 0.4 percentage points. Growth and aging of the US population only partially explain the increase we observed in the incidence of ARF, as age‐ and sex‐adjusted population rates increased by 56% from 2001 to 2009. In addition, the NIS captures data on hospital discharges and not individual patients; thus, a patient may have had multiple admissions. Over the last decade adoption of a more intensive practice style has been associated with improved in‐hospital mortality,[33, 34] and although these patients may be living longer they may have multiple readmissions.[35, 36]
We also observed that older patients were less likely to be treated with IMV, had a higher mortality rate, and less expensive care. These results are consistent with other studies and suggest that the intensity of treatment decreases with increasing age, and decisions to withhold or withdraw life‐supporting treatments are more frequent in the elderly.[26, 37] Prior research has shown that severity of illness is more important than age on patients' prognosis,[38, 39] and aggressive treatment strategies are not less cost‐effective when provided to older patients.[40]
Another important finding of this study is the marked increase in the use of NIV paired with a modest reduction in the use of IMV in the treatment of patients with ARF. This finding adds to evidence from other studies, which have similarly reported a dramatic increase in the use of NIV and a decrease in the use of IMV in patients with COPD as well as in ARF of other etiologies.[30, 41]
Our work has several limitations. First, we identified ARF based on ICD‐9‐CM codes and therefore cannot exclude disease misclassification. We did not find any studies in the literature addressing the accuracy and the completeness of ARF coding. However, we employed the same codes used to define ARF as has been used to define organ dysfunction in studies of severe sepsis,[17, 20] and the ICD‐9‐CM codes that we used to identify cases of ARDS have been used in prior studies.[11, 22, 23] Another limitation is that it is not clear to what extent the trends we observed may be due to changes over time in documentation and coding practices. Although this should be considered given the additional reimbursement associated with the diagnosis of ARF, our observation that rates of assisted ventilation have remained almost flat over the 9‐year period of the study suggest that would not wholly account for the rise in ARF. Second, because we did not have access to physiological data such as results of blood gas testing, we could not determine whether the threshold for applying the diagnosis of ARF or for delivering ventilatory support has changed over time. Third, for the purpose of this study we employed a broad definition of ARF, not limiting cases to those requiring mechanical ventilation, and this led to a more heterogeneous cohort including less severe cases of ARF. However, this is not dissimilar to the heterogeneity in disease severity observed among patients who receive a diagnosis of heart failure or acute renal failure. Fourth, survivors of ARF remain at high risk of death in the months after hospitalization,[42] but we assessed only in‐hospital mortality. It is possible that although in‐hospital mortality has improved, 30‐day mortality remained stable. Finally, as the NIS contains only discharge‐level data, we could not distinguish between patients admitted for ARF from those who developed ARF (potentially iatrogenic) after admission.
In summary, over the period of 2001 to 2009, there was a large increase in the number of patients given a diagnosis of ARF and a concomitant reduction in inpatient mortality. Although rates of mechanical ventilation remained relatively constant, there was a significant shift toward greater use of NIV at the expense of IMV.
Disclosures
Dr. Stefan is supported by KM1 CA156726 from the National Cancer Institute (NCI) and by the National Center for Research Resources and the National Center for Advancing Translational Sciences, National Institutes of Health (NIH), through grant UL1 RR025752. The work on this study was supported by a Charlton grant from Tufts University School of Medicine. Dr. Lindenauer and Dr. Pekow are supported by 1R18HL108810‐01 from the National Heart, Lung, and Blood Institute (NHLBI). The content of this publication is solely the responsibility of the authors and does not represent the official views of the NIH, NHLBI, or NCI.
All authors have read and approved the manuscript and none of them have any potential conflicts of interest to report.
Dr. Stefan had full access to all of the data in the study and takes responsibility for the integrity of the data and the accuracy of the data analysis. Conception and design: Mihaela S. Stefan, Penelope S. Pekow, Michael B. Rothberg, Jay Steingrub, Peter K. Lindenauer; analysis and interpretation: Meng‐Shiou Shieh, Mihaela S. Stefan, Penelope S. Pekow, Michael B. Rothberg, Tara Lagu, Peter K. Lindenauer; drafting the manuscript for important intellectual content: Mihaela S. Stefan, Penelope S. Pekow, Michael B. Rothberg, Jay Steingrub, Tara Lagu, and Peter K. Lindenauer.
- , . Goldman's Cecil Medicine. 24th ed. Amsterdam, the Netherlands: Elsevier Inc.; 2012.
- , . Textbook of Respiratory Medicine. 5th ed. Philadelphia, PA: Saunders; 2010.
- , , . Epidemiology and outcome of acute respiratory failure in intensive care unit patients. Crit Care Med. 2003;31(4 suppl):S296–S299.
- , , , et al. Epidemiology of critical care syndromes, organ failures, and life‐support interventions in a suburban US community. Chest. 2011;140(6):1447–1455.
- , , , , . The changing epidemiology of mechanical ventilation: a population‐based study. J Intensive Care Med. 2006;21(3):173–182.
- , , , , . Mechanical ventilation in Ontario, 1992–2000: incidence, survival, and hospital bed utilization of noncardiac surgery adult patients. Crit Care Med. 2004;32(7):1504–1509.
- . Contributions to the epidemiology of acute respiratory failure. Crit Care. 2003;7(4):288–290.
- , , , et al. Incidence, severity, and mortality of acute respiratory failure in Berlin, Germany. Am J Respir Crit Care Med. 1995;151(4):1121–1125.
- . Acute respiratory failure in the United States: incidence and 31‐day survival. Chest. 2000;118(4):1100–1105.
- , , , , , . The epidemiology of mechanical ventilation use in the United States. Crit Care Med. 2010;38(10):1947–1953.
- , , , . Trends in the incidence of noncardiogenic acute respiratory failure: the role of race. Crit Care Med. 2012;40(5):1532–1538.
- , , , , . Secular trends in nosocomial infections and mortality associated with noninvasive ventilation in patients with exacerbation of COPD and pulmonary edema. JAMA. 2003;290(22):2985–2991.
- , , , et al. Association of noninvasive ventilation with nosocomial infections and survival in critically ill patients. JAMA. 2000;284(18):2361–2367.
- , , , , . Noninvasive versus conventional mechanical ventilation. An epidemiologic survey. Am J Respir Crit Care Med. 2001;163(4):874–880.
- , , , , , . Does noninvasive ventilation reduce the ICU nosocomial infection risk? A prospective clinical survey. Intensive Care Med. 1999;25(6):567–573.
- Heathcare Cost and Utilization Project (HCUP). Overview of the Nationwide Inpatient Sample. Available at: http://www.hcup‐us.ahrq.gov/nisoverview.jsp. Accessed December 6, 2011.
- , , , , , . Hospitalizations, costs, and outcomes of severe sepsis in the United States 2003 to 2007. Crit Care Med. 2011;40(3):754–761.
- , , , , . Association of diagnostic coding with trends in hospitalizations and mortality of patients with pneumonia, 2003–2009. JAMA. 2012;307(13):1405–1413.
- , , , , . Little evidence of correlation between growth in health care spending and reduced mortality. Health Aff (Millwood). 2010;29(8):1523–1531.
- , , , . The epidemiology of sepsis in the United States from 1979 through 2000. N Engl J Med. 2003;348(16):1546–1554.
- , , , . Rapid increase in hospitalization and mortality rates for severe sepsis in the United States: a trend analysis from 1993 to 2003. Crit Care Med. 2007;35(5):1244–1250.
- , , . Risk factors for ARDS in the United States: analysis of the 1993 National Mortality Followback Study. Chest. 2001;119(4):1179–1184.
- , , , , , . Acute respiratory distress syndrome: estimated incidence and mortality rate in a 5 million‐person population base. Crit Care. 1998;2(1):29–34.
- , , . Validity of procedure codes in International Classification of Diseases, 9th Revision, Clinical Modification administrative data. Med Care. 2004;42(8):801–809.
- , , , . Comorbidity measures for use with administrative data. Med Care. 1998;36(1):8–27.
- , . Epidemiology of sepsis: an update. Crit Care Med. 2001;29(7 suppl):S109–S116.
- , , , , , . Epidemiology and outcomes of acute renal failure in hospitalized patients: a national survey. Clin J Am Soc Nephrol. 2006;1(1):43–51.
- , , , . Facing the challenge: decreasing case fatality rates in severe sepsis despite increasing hospitalizations. Crit Care Med. 2005;33(11):2555–2562.
- , , , . National and regional trends in heart failure hospitalization and mortality rates for Medicare beneficiaries,1998–2008. JAMA. 2011;306(15):1669–1678.
- , , , et al. Outcomes of noninvasive ventilation for acute exacerbations of chronic obstructive pulmonary disease in the United States, 1998–2008. Am J Respir Crit Care Med. 2011;185(2):152–159.
- , , , et al. A trial of goal‐oriented hemodynamic therapy in critically ill patients. SvO2 Collaborative Group. N Engl J Med. 1995;333(16):1025–1032.
- , . Ventilation with lower tidal volumes as compared with traditional tidal volumes for acute lung injury. N Engl J Med. 2000;343(11):813; author reply 813–814.
- , , . Short‐ and long‐term survival of nonsurgical intensive care patients and its relation to diagnosis, severity of disease, age and comorbidities. Curr Aging Sci. 2009;2(3):240–248.
- , , , , , . The impact of COPD on management and outcomes of patients hospitalized with acute myocardial infarction—a ten‐year retrospective observational study. Chest. 2012;141(6):1441–1448.
- . The paradox of health. N Engl J Med. 1988;318(7):414–418.
- , , . Rehospitalizations among patients in the Medicare fee‐for‐service program. N Engl J Med. 2009;360(14):1418–1428.
- , , , et al. Outcomes and cost‐effectiveness of ventilator support and aggressive care for patients with acute respiratory failure due to pneumonia or acute respiratory distress syndrome. Am J Med. 2000;109(8):614–620.
- , , , et al. Older age, aggressiveness of care, and survival for seriously ill, hospitalized adults. SUPPORT Investigators. Study to Understand Prognoses and Preferences for Outcomes and Risks of Treatments. Ann Intern Med. 1999;131(10):721–728.
- , , , et al. Patient age and decisions to withhold life‐sustaining treatments from seriously ill, hospitalized adults. SUPPORT Investigators. Study to Understand Prognoses and Preferences for Outcomes and Risks of Treatment. Ann Intern Med. 1999;130(2):116–125.
- , , , et al. Are aggressive treatment strategies less cost‐effective for older patients? The case of ventilator support and aggressive care for patients with acute respiratory failure. J Am Geriatr Soc. 2001;49(4):382–390.
- , . Utilization of non‐invasive ventilation in patients with acute respiratory failure from 2000–2009: a population‐based study. Am J Respir Crit Care Med. 2012;185:A6488.
- , , , et al. One‐year outcomes in survivors of the acute respiratory distress syndrome. N Engl J Med. 2003;348(8):683–693.
Acute respiratory failure (ARF), a common and serious complication in hospitalized patients, may be caused by several conditions including pneumonia, chronic obstructive pulmonary disease (COPD), adult respiratory distress syndrome (ARDS), and congestive heart failure (CHF). Although ARF is conventionally defined by an arterial oxygen tension of <60 mm Hg, an arterial carbon dioxide tension of >45 mm Hg, or both, these thresholds serve as a guide to be used in combination with history and clinical assessment of the patient.[1, 2] Supplemental oxygen and treatment of the underlying cause is the mainstay of therapy for ARF, but in severe cases patients are treated with invasive mechanical ventilation (IMV) or noninvasive ventilation (NIV). ARF is the most frequent reason for admission to the intensive care unit (ICU)[3, 4] and has an in‐hospital mortality rate of 33% to 37% among those who require IMV.[5, 6] The majority of epidemiologic studies of ARF have been limited to patients requiring mechanical ventilation or those admitted to the ICU, and information about the characteristics and outcomes of patients across the full spectrum of severity is much more limited.[5, 7, 8, 9, 10, 11] General improvements in the management of underlying conditions, implementation of more effective ventilation strategies,[12, 13] and increasing use of NIV[14, 15] may have led to better outcomes for patients with ARF, yet empirical evidence of a change in the adjusted mortality rate over time is lacking.
The objective of this study was to provide a broad characterization of the epidemiology of ARF among adults hospitalized in the United States using a large nationally representative database. We sought to evaluate whether incidence, mortality, cost, or ventilation practice associated with ARF in the United States changed over the period of 2001 to 2009.
METHODS
Data Source
We utilized data from the Nationwide Inpatient Sample (NIS) of the Health Care Cost and Utilization Project,[16] which is a 20% stratified probability sample of all US acute‐care hospitals each year. These data are drawn from a sampling frame that contains close to 95% of all discharges in the United States, with the hospital discharge record as the unit of analysis. The NIS has been used to study trends in many different diagnoses.[17, 18, 19] The database contains demographic information, payer information, principal and secondary diagnoses, cost, discharge disposition, and death during hospitalization. It also contains information on hospital characteristics including ownership, size, teaching status, and geographic region.
Definitions
We included patients 18 years old discharged between 2001 and 2009 with a primary or secondary diagnosis of ARF. We identified cases of ARF using diagnostic codes (International Classification of Diseases, Ninth Revision, Clinical Modification [ICD‐9‐CM]) previously used in studies of acute organ dysfunction in sepsis (518.81, 518.82, 518.84, 518.4, 799.1, 786.09).[17, 20, 21] To define ARDS we relied on ICD‐9‐CM codes (518.4, 518.82, 518.5, 786.09) used in prior studies that showed good sensitivity and specificity.[22, 23] The use of ventilatory support was identified using the ICD‐9‐CM procedure codes[24] (93.90, 93.70, 93.71, 93.76). Comorbidities were classified using the Agency for Healthcare Research and Quality's (Rockville, MD) Healthcare Cost and Utilization Project's (HCUP) Comorbidity Software version 3.103.5.[25]
Outcomes
The primary outcomes included the annual number of hospitalizations, population incidence, hospital mortality, and costs of care. Secondary outcomes included length of stay, most common diagnoses associated with ARF, disposition at discharge, and use and type of ventilatory support.
Analysis
We estimated the number of hospitalizations with a diagnosis of ARF/year, and we calculated the weighted frequencies following HCUP‐NIS recommendations using SAS/STAT survey procedures. Using population estimates for the years 2001 to 2009 from the US Census Bureau, we employed direct standardization to calculate age‐, gender‐, and race‐adjusted population incidence and mortality rates of ARF per 100,000 population. Hospital mortality was defined as the ratio of ARF hospitalizations ending in death divided by total number of ARF hospitalizations. Mechanical ventilation rates and rates of selected comorbidities were similarly defined.
We employed indirect standardization to adjust hospital mortality rates for age, sex, race/ethnicity, comorbidities, and hospital characteristics using logistic regression models from 2001 to predict hospital mortality for 2002 to 2009. We used linear regression models to test whether the slope of year was significant for trends in outcomes overtime. Costs were calculated using hospital‐specific cost‐to‐charge ratios when available and a weighted group average at the state level for remaining hospitals. We converted all costs to 2009 US dollars using the Consumer Price Index. Costs and lengths of stay were not normally distributed, so we calculated weighted geometric means (the average of all logarithmic values), then converted back to a base‐10 number. Using a Taylor series expansion, we then calculated standard errors. All analyses were performed using SAS version 9.2 (SAS Institute, Inc., Cary, NC).
The Baystate Medical Center institutional review board determined that the project did not constitute human subjects research.
RESULTS
Hospitalization Trends
The number of hospitalizations with an ARF diagnosis code increased at an average annual rate of 11.3% from 1,007,549 (standard deviation [SD] = 19,268) in 2001 to 1,917,910 (SD = 47,558) in 2009. More than two‐thirds of ARF admissions were associated with medical, rather than surgical, conditions (69.5% in 2001 and 71.2% in 2009). The median age, racial make‐up, and gender did not change significantly. Over the study period we observed an increase in ARF‐related hospitalizations in large, urban, teaching hospitals and in hospitals located in the Midwest (Table 1).
| 2001 | 2003 | 2005 | 2007 | 2009 | |
|---|---|---|---|---|---|
| |||||
| Patient characteristics | |||||
| All, N (SD) | 1,007,549 (19,268) | 1,184,928 (25,542) | 1,288,594 (30,493) | 1,480,270 (32,002) | 1,917,910 (47,558) |
| Age, mean (SE), y | 66.6 (0.2) | 66.0 (0.2) | 66.1 (0.2) | 65.8 (0.2) | 65.8 (0.2) |
| Age group, % | |||||
| 1844 | 11.5 | 12.0 | 11.5 | 11.6 | 10.9 |
| 4564* | 26.7 | 28.9 | 29.6 | 30.7 | 31.7 |
| 6584* | 50.2 | 47.8 | 47.0 | 45.7 | 45.3 |
| 85+ | 11.5 | 11.4 | 11.9 | 12.0 | 12.1 |
| Male* | 48.1 | 48.2 | 48.6 | 49.3 | 49.2 |
| Race | |||||
| White | 75.8 | 71.9 | 76.5 | 71.8 | 73.4 |
| Black | 12.7 | 13.6 | 11.2 | 14.2 | 12.5 |
| Hispanic | 7.2 | 9.8 | 7.7 | 8.5 | 7.8 |
| Other | 4.2 | 4.7 | 4.7 | 5.5 | 6.3 |
| Primary ARF | 20.7 | 20.9 | 25.9 | 26.1 | 19.9 |
| Secondary ARF | 79.3 | 79.1 | 74.1 | 73.9 | 80.1 |
| Medical* | 69.5 | 69.1 | 69.9 | 70.2 | 71.2 |
| Surgical* | 30.5 | 30.8 | 30.1 | 29.8 | 28.8 |
| Hospital characteristics, % | |||||
| Number of beds | |||||
| Small | 10.0 | 10.1 | 10.5 | 10.8 | 11.3 |
| Medium | 25.2 | 25.3 | 24.6 | 24.0 | 22.7 |
| Large | 64.7 | 64.6 | 64.9 | 65.2 | 66.0 |
| Region | |||||
| South* | 18.5 | 18.5 | 17.6 | 17.0 | 16.3 |
| Midwest | 21.4 | 22.0 | 23.6 | 23.2 | 23.5 |
| Northeast | 42.6 | 41.7 | 41.4 | 42.2 | 42.1 |
| West* | 17.5 | 17.8 | 17.3 | 17.6 | 18.1 |
| Hospital type | |||||
| Rural | 13.6 | 13.0 | 11.8 | 11.0 | 10.8 |
| Urban nonteaching | 45.5 | 44.5 | 50.1 | 45.3 | 45.7 |
| Urban teaching | 40.9 | 42.5 | 38.1 | 43.7 | 43.6 |
| Patient outcomes | |||||
| Ventilation strategy | |||||
| IMV* | 48.5 | 48.4 | 47.5 | 46.5 | 42.1 |
| NIV* | 3.8 | 5.3 | 6.9 | 9.4 | 10.1 |
| IMV or NIV | 50.9 | 51.7 | 52.1 | 52.9 | 49.7 |
| Disposition | |||||
| Home/home healthcare* | 42.1 | 43.8 | 42.8 | 43.4 | 45.7 |
| Transfer to acute care | 5.2 | 4.7 | 4.6 | 4.6 | 4.4 |
| Nursing facility* | 24.4 | 24.9 | 27.4 | 28.6 | 29.0 |
| Other | 0.7 | 0.8 | 0.9 | 0.9 | 1.0 |
| Adjusted mortality, % (SE)* | 27.6 (0.3) | 26.4 (0.4) | 24.9 (0.4) | 22.7 (0.4) | 20.6 (0.3) |
| Adjusted mean, LOS/case, d (SE)* | 7.8 (0.1) | 7.9 (0.1) | 7.7 (0.1) | 7.5 (0.1) | 7.1 (0.1) |
| Adjusted mean cost/case, 2009 US$, (SE) | 15,818 (251) | 16,981 (419) | 17,236 (411) | 16,941 (436) | 15,987 (402) |
After adjusting for age and sex, the population incidence of ARF increased from 502 (standard error [SE] = 10) cases per 100,000 in 2001 to 784 (SE = 19) cases per 100,000 in 2009 (a 56% increase, P < 0.0001). Hispanics had the lowest rates of ARF, with both black and white groups having similar rates (Table 2).
| 2001 | 2003 | 2005 | 2007 | 2009 | |
|---|---|---|---|---|---|
| |||||
| All* | 502 (10) | 569 (12) | 595 (14) | 627 (14) | 784 (19) |
| Age group | |||||
| 1844* | 107 (3) | 130 (4) | 137 (4) | 153 (5) | 189 (6) |
| 4564* | 422 (9) | 500 (12) | 521 (13) | 580 (14) | 739 (19) |
| 6584* | 1697 (35) | 1863 (42) | 1950 (50) | 2066 (46) | 2578 (69) |
| 85+ | 3449 (86) | 3792 (106) | 3981 (120) | 3429 (97) | 4163 (123) |
| Sex | |||||
| Male* | 491 (10) | 553 (13) | 582 (14) | 629 (14) | 782 (20) |
| Female* | 512 (10) | 583 (12) | 607 (15) | 625 (13) | 786 (19) |
| Race/ethnicity | |||||
| White* | 398 (11) | 427 (12) | 466 (16) | 450 (13) | 699 (21) |
| Black* | 423 (27) | 513 (33) | 432 (26) | 574 (38) | 738 (37) |
| Hispanic* | 247 (24) | 381 (42) | 307 (27) | 353 (34) | 478 (42) |
| Other* | 268 (20) | 342 (29) | 347 (26) | 424 (29) | 713 (77) |
| In‐hospital mortality | 140 (3) | 148 (3) | 146 (3) | 140 (3) | 154 (4) |
The most common etiologies of ARF among medical patients were pneumonia, CHF, ARDS, COPD exacerbation, and sepsis. Over the 9‐year study, the proportion of cases secondary to pneumonia and sepsis rose significantly: from 39% to 46% and 13% to 21%, respectively (Figure 1).
Mortality and Other Outcomes
The number of in‐hospital deaths related to ARF increased from 277,407 deaths in 2001 to 381,155 in 2009 (a 37% increase, P < 0.001). Standardized to the population, deaths increased from 140 in 2001 to 154 cases per 100,000 in 2009 (a 10% increase, P = 0.027). Despite slightly increasing mortality rates at a population level, adjusted in‐hospital mortality improved from 27.6% in 2001 to 20.6% in 2009 (P < 0.001). Mortality declined for both IMV and NIV patients from 35.3% in 2001 to 30.2% in 2009 and from 23.5% to 19%, respectively, but increased for those who required both NIV and IMV (from 26.9% in 2001 to 28% in 2009).
Adjusted hospital length of stay decreased from 7.8 days per patient in 2001 to 7.1 days in 2009 (P < 0.001), with a concomitant increase in discharges to nursing facilities, from 24% in 2001 to 29% in 2009. There was no linear trend in adjusted cost per case, with $15,818 in 2001 and $15,987 in 2009 (in 2009 US dollars) (Table 1).
Ventilation Practices
Overall, 50.9% patients received ventilatory support (NIV or IMV or both) in 2001 and 49.7% in 2009 (P= 0.25). The use of NIV increased from 3.8% to 10.1% (P < 0.001), a 169% increase, whereas the utilization of IMV decreased from 48.5% in 2001 to 42.1% in 2009 (P for trend < 0.0001), a 13% decrease. Uses of both NIV and IMV during hospitalization were seen in 1.4% of cases in 2001 and 2.5% of cases in 2009.
2009 Data Analysis
In 2009 the 1,917,910 hospitalizations with ARF resulted in 381,155 (SD = 8965) deaths and a total inpatient cost of $54 billion. The most common etiologies in patients over 65 years old were pneumonia, CHF, COPD, ARDS, and sepsis. In patients younger than 45 years the most frequent diagnoses were pneumonia, ARDS, sepsis, asthma, drug ingestion, and trauma. Stratified analysis by gender and by age groups showed that mortality rates among men were higher than for women and were highest in patients older than 85 years (Table 3).
| Disease | Total | Age <45 Years | 4565 Years | 6584 Years | 85+ Years | Male | Female |
|---|---|---|---|---|---|---|---|
| |||||||
| Medical | |||||||
| Total, N (%) | 1,364,624 (71.2) | 144,715 (10.6) | 416,922 (30.6) | 615,009 (45.1) | 187,977 (13.8) | 647,894 (47.5) | 716,635 (52.5) |
| Pneumonia, %* | 46.1 | 41.7 | 42.8 | 46.9 | 54.3 | 48.8 | 43.7 |
| CHF, %* | 36.6 | 10.4 | 27.3 | 43.6 | 54.8 | 35.0 | 38.1 |
| ARDS, %* | 16.1 | 22.9 | 16.2 | 14.5 | 15.9 | 15.5 | 16.7 |
| Sepsis, %* | 21.2 | 18.1 | 21.3 | 21.3 | 23.1 | 22.8 | 19.8 |
| COPD, %* | 25.4 | 4.2 | 25.6 | 32.3 | 18.3 | 25.0 | 25.7 |
| AMI, %* | 9.0 | 2.6 | 7.1 | 10.5 | 13.3 | 9.3 | 8.8 |
| Asthma, %* | 9.2 | 18.1 | 11.6 | 6.7 | 5.4 | 6.2 | 12.0 |
| Stroke, %* | 4.8 | 2.3 | 4.1 | 5.5 | 6.0 | 5.0 | 4.7 |
| Trauma or burns, %* | 3.4 | 5.4 | 2.9 | 3.0 | 4.1 | 4.3 | 2.5 |
| Cardiorespiratory arrest, %* | 4.1 | 3.9 | 4.4 | 4.1 | 3.8 | 4.6 | 3.7 |
| Drug, %* | 3.7 | 16.6 | 5.1 | 0.8 | 0.3 | 3.8 | 3.6 |
| IMV, %* | 37.7 | 54.6 | 43.7 | 33.5 | 24.8 | 41.1 | 34.5 |
| NIV, %* | 11.9 | 7.1 | 11.5 | 13.0 | 12.7 | 11.4 | 12.3 |
| In‐hospital mortality (CI) | 22 (21.322.7) | 12.9 (11.913.9) | 18.5 (17.619.4) | 23.9 (23.024.9) | 31.8 (30.633.1) | 24.2 (23.325.1) | 20.9 (20.121.7) |
| Surgical | |||||||
| Total, N (%) | 552971 (28.8) | 64983 (11.8) | 190225 (34.4) | 254336 (46) | 43426 (7.9) | 295660 (53.5) | 257287 (46.5) |
| Pneumonia, %* | 34.9 | 33.0 | 34.0 | 35.0 | 40.5 | 37.1 | 32.2 |
| CHF, %* | 27.2 | 8.9 | 21.7 | 33.3 | 42.6 | 26.7 | 27.7 |
| ARDS, %* | 45.5 | 51.5 | 45.2 | 44.7 | 42.7 | 45.0 | 46.1 |
| Sepsis, %* | 25.1 | 22.8 | 25.4 | 25.2 | 26.1 | 25.4 | 24.7 |
| COPD, %* | 8.2 | 1.1 | 7.4 | 10.8 | 7.5 | 8.3 | 8.1 |
| AMI, %* | 16.9 | 4.9 | 17.0 | 19.8 | 17.9 | 19.1 | 14.4 |
| Asthma, %* | 6.1 | 7.6 | 7.2 | 5.4 | 3.6 | 4.1 | 8.5 |
| Stroke, %* | 8.9 | 6.6 | 9.2 | 9.4 | 7.2 | 8.9 | 8.8 |
| Trauma or burns, %* | 12.2 | 26.5 | 9.6 | 9.2 | 20.3 | 13.8 | 10.4 |
| Cardiorespiratory arrest, %* | 5.5 | 4.4 | 6.0 | 5.4 | 5.2 | 6.1 | 4.7 |
| Drug, %* | 0.5 | 1.3 | 0.7 | 0.2 | 0.2 | 0.4 | 0.6 |
| IMV, %* | 52.9 | 57.1 | 54.3 | 51.3 | 50.0 | 54.5 | 51.0 |
| NIV, %* | 5.8 | 3.5 | 5.5 | 6.4 | 6.4 | 5.6 | 6.0 |
| In‐hospital mortality, % (CI) | 18.6 (17.819.5) | 10.7 (9.312.0) | 15.5 (14.216.8) | 20.8 (19.821.9) | 29.4 (27.831.1) | 19.0 (18.219.8) | 18.3 (17.319.2) |
When we examined ventilation practices among medical patients we found that patients older than 85 years, when compared to patients younger than 45 years, were less likely to be treated with IMV (25% vs 55%) and more likely to be treated with NIV (12.7% vs 7%). At the same time, the average cost per case was lowest among patients 85 years and older, and hospital costs per case fell sharply after age 70 years. Costs were considerably higher for those who did not survive during hospitalization, particularly for patients younger than 45 years (Figure 2).
DISCUSSION
In this large population‐based study, we found that the number of hospitalizations associated with a diagnosis of ARF almost doubled over a 9‐year period. In 2009 there were nearly 2 million hospitalizations with ARF in the United States, resulting in approximately 380,000 deaths and inpatient costs of over $54 billion. The population‐adjusted ARF hospitalization rates increased in all age groups, and patients 85 years and older had the highest age‐specific hospitalization rate. Although overall rates of mechanical ventilation (NIV or IMV) remained stable over the 9‐year period, there was an important shift away from IMV (which decreased from 48% in 2001 to 42% in 2009) toward NIV (which increased from 4% in 2001 to 10% in 2009). Overall, there was a significant increase in the number of total deaths despite a decline in adjusted in‐hospital mortality rates. In‐hospital mortality rates decreased for all cases of ARF regardless of ventilation choice.
The findings of this study mirror results of others that have shown that although the incidence of critical care illnesses like sepsis[17, 20, 21, 26] and acute renal failure[27] has increased over the last decade, in‐hospital mortality rates have decreased.[20, 21, 28] Our results also compliment the results of a recent study that looked at hospitalizations for noncardiogenic ARF, which observed a 3.7‐fold increase in the number of cases and a steady decline in case fatality.[11]
Most prior studies addressing the incidence of ARF have included only patients receiving mechanical ventilation. In 1994, the estimated number of cases of ARF requiring IMV was 329,766,[9] which increased to 790,257 in 2005.[10] In our study we found that in 2009, the number of patients with ARF hospitalizations with IMV increased to 806,538. The increase in the overall number of cases with ARF was mainly driven by a surge in cases of sepsis and pneumonia. Our findings are consistent with national trends over time in noncardiogenic ARF[11] and in conditions that predispose patients to ARF such as sepsis[17, 20, 28] and acute renal failure.[27] As the number of claims for ARF doubled and the number of deaths increased, we found that adjusted hospital mortality improved from 27.6% in 2001 to 20.6% in 2009. This decline in hospital mortality was observed among all patients groups, regardless of ventilation choice. The decline in overall case fatality is consistent with prior findings in noncardiogenic ARF,[11] sepsis,[17, 28] and CHF.[29]
There are a number of potential explanations for the reduction in mortality observed over the study period, including improvements in hospital management of the underlying conditions leading to ARF, an increase in the proportion of patients being treated with NIV,[30] and advances in the care of critically ill patients such as the use of low‐tidal volume ventilation.[31, 32] Another contributor may be an increase in the proportion of discharges to nursing facilities, although this change in discharge disposition cannot fully explain our findings. For example, from 2007 to 2009, mortality decreased by 2 percentage points, and nursing home discharges increased by only 0.4 percentage points. Growth and aging of the US population only partially explain the increase we observed in the incidence of ARF, as age‐ and sex‐adjusted population rates increased by 56% from 2001 to 2009. In addition, the NIS captures data on hospital discharges and not individual patients; thus, a patient may have had multiple admissions. Over the last decade adoption of a more intensive practice style has been associated with improved in‐hospital mortality,[33, 34] and although these patients may be living longer they may have multiple readmissions.[35, 36]
We also observed that older patients were less likely to be treated with IMV, had a higher mortality rate, and less expensive care. These results are consistent with other studies and suggest that the intensity of treatment decreases with increasing age, and decisions to withhold or withdraw life‐supporting treatments are more frequent in the elderly.[26, 37] Prior research has shown that severity of illness is more important than age on patients' prognosis,[38, 39] and aggressive treatment strategies are not less cost‐effective when provided to older patients.[40]
Another important finding of this study is the marked increase in the use of NIV paired with a modest reduction in the use of IMV in the treatment of patients with ARF. This finding adds to evidence from other studies, which have similarly reported a dramatic increase in the use of NIV and a decrease in the use of IMV in patients with COPD as well as in ARF of other etiologies.[30, 41]
Our work has several limitations. First, we identified ARF based on ICD‐9‐CM codes and therefore cannot exclude disease misclassification. We did not find any studies in the literature addressing the accuracy and the completeness of ARF coding. However, we employed the same codes used to define ARF as has been used to define organ dysfunction in studies of severe sepsis,[17, 20] and the ICD‐9‐CM codes that we used to identify cases of ARDS have been used in prior studies.[11, 22, 23] Another limitation is that it is not clear to what extent the trends we observed may be due to changes over time in documentation and coding practices. Although this should be considered given the additional reimbursement associated with the diagnosis of ARF, our observation that rates of assisted ventilation have remained almost flat over the 9‐year period of the study suggest that would not wholly account for the rise in ARF. Second, because we did not have access to physiological data such as results of blood gas testing, we could not determine whether the threshold for applying the diagnosis of ARF or for delivering ventilatory support has changed over time. Third, for the purpose of this study we employed a broad definition of ARF, not limiting cases to those requiring mechanical ventilation, and this led to a more heterogeneous cohort including less severe cases of ARF. However, this is not dissimilar to the heterogeneity in disease severity observed among patients who receive a diagnosis of heart failure or acute renal failure. Fourth, survivors of ARF remain at high risk of death in the months after hospitalization,[42] but we assessed only in‐hospital mortality. It is possible that although in‐hospital mortality has improved, 30‐day mortality remained stable. Finally, as the NIS contains only discharge‐level data, we could not distinguish between patients admitted for ARF from those who developed ARF (potentially iatrogenic) after admission.
In summary, over the period of 2001 to 2009, there was a large increase in the number of patients given a diagnosis of ARF and a concomitant reduction in inpatient mortality. Although rates of mechanical ventilation remained relatively constant, there was a significant shift toward greater use of NIV at the expense of IMV.
Disclosures
Dr. Stefan is supported by KM1 CA156726 from the National Cancer Institute (NCI) and by the National Center for Research Resources and the National Center for Advancing Translational Sciences, National Institutes of Health (NIH), through grant UL1 RR025752. The work on this study was supported by a Charlton grant from Tufts University School of Medicine. Dr. Lindenauer and Dr. Pekow are supported by 1R18HL108810‐01 from the National Heart, Lung, and Blood Institute (NHLBI). The content of this publication is solely the responsibility of the authors and does not represent the official views of the NIH, NHLBI, or NCI.
All authors have read and approved the manuscript and none of them have any potential conflicts of interest to report.
Dr. Stefan had full access to all of the data in the study and takes responsibility for the integrity of the data and the accuracy of the data analysis. Conception and design: Mihaela S. Stefan, Penelope S. Pekow, Michael B. Rothberg, Jay Steingrub, Peter K. Lindenauer; analysis and interpretation: Meng‐Shiou Shieh, Mihaela S. Stefan, Penelope S. Pekow, Michael B. Rothberg, Tara Lagu, Peter K. Lindenauer; drafting the manuscript for important intellectual content: Mihaela S. Stefan, Penelope S. Pekow, Michael B. Rothberg, Jay Steingrub, Tara Lagu, and Peter K. Lindenauer.
- , . Goldman's Cecil Medicine. 24th ed. Amsterdam, the Netherlands: Elsevier Inc.; 2012.
- , . Textbook of Respiratory Medicine. 5th ed. Philadelphia, PA: Saunders; 2010.
- , , . Epidemiology and outcome of acute respiratory failure in intensive care unit patients. Crit Care Med. 2003;31(4 suppl):S296–S299.
- , , , et al. Epidemiology of critical care syndromes, organ failures, and life‐support interventions in a suburban US community. Chest. 2011;140(6):1447–1455.
- , , , , . The changing epidemiology of mechanical ventilation: a population‐based study. J Intensive Care Med. 2006;21(3):173–182.
- , , , , . Mechanical ventilation in Ontario, 1992–2000: incidence, survival, and hospital bed utilization of noncardiac surgery adult patients. Crit Care Med. 2004;32(7):1504–1509.
- . Contributions to the epidemiology of acute respiratory failure. Crit Care. 2003;7(4):288–290.
- , , , et al. Incidence, severity, and mortality of acute respiratory failure in Berlin, Germany. Am J Respir Crit Care Med. 1995;151(4):1121–1125.
- . Acute respiratory failure in the United States: incidence and 31‐day survival. Chest. 2000;118(4):1100–1105.
- , , , , , . The epidemiology of mechanical ventilation use in the United States. Crit Care Med. 2010;38(10):1947–1953.
- , , , . Trends in the incidence of noncardiogenic acute respiratory failure: the role of race. Crit Care Med. 2012;40(5):1532–1538.
- , , , , . Secular trends in nosocomial infections and mortality associated with noninvasive ventilation in patients with exacerbation of COPD and pulmonary edema. JAMA. 2003;290(22):2985–2991.
- , , , et al. Association of noninvasive ventilation with nosocomial infections and survival in critically ill patients. JAMA. 2000;284(18):2361–2367.
- , , , , . Noninvasive versus conventional mechanical ventilation. An epidemiologic survey. Am J Respir Crit Care Med. 2001;163(4):874–880.
- , , , , , . Does noninvasive ventilation reduce the ICU nosocomial infection risk? A prospective clinical survey. Intensive Care Med. 1999;25(6):567–573.
- Heathcare Cost and Utilization Project (HCUP). Overview of the Nationwide Inpatient Sample. Available at: http://www.hcup‐us.ahrq.gov/nisoverview.jsp. Accessed December 6, 2011.
- , , , , , . Hospitalizations, costs, and outcomes of severe sepsis in the United States 2003 to 2007. Crit Care Med. 2011;40(3):754–761.
- , , , , . Association of diagnostic coding with trends in hospitalizations and mortality of patients with pneumonia, 2003–2009. JAMA. 2012;307(13):1405–1413.
- , , , , . Little evidence of correlation between growth in health care spending and reduced mortality. Health Aff (Millwood). 2010;29(8):1523–1531.
- , , , . The epidemiology of sepsis in the United States from 1979 through 2000. N Engl J Med. 2003;348(16):1546–1554.
- , , , . Rapid increase in hospitalization and mortality rates for severe sepsis in the United States: a trend analysis from 1993 to 2003. Crit Care Med. 2007;35(5):1244–1250.
- , , . Risk factors for ARDS in the United States: analysis of the 1993 National Mortality Followback Study. Chest. 2001;119(4):1179–1184.
- , , , , , . Acute respiratory distress syndrome: estimated incidence and mortality rate in a 5 million‐person population base. Crit Care. 1998;2(1):29–34.
- , , . Validity of procedure codes in International Classification of Diseases, 9th Revision, Clinical Modification administrative data. Med Care. 2004;42(8):801–809.
- , , , . Comorbidity measures for use with administrative data. Med Care. 1998;36(1):8–27.
- , . Epidemiology of sepsis: an update. Crit Care Med. 2001;29(7 suppl):S109–S116.
- , , , , , . Epidemiology and outcomes of acute renal failure in hospitalized patients: a national survey. Clin J Am Soc Nephrol. 2006;1(1):43–51.
- , , , . Facing the challenge: decreasing case fatality rates in severe sepsis despite increasing hospitalizations. Crit Care Med. 2005;33(11):2555–2562.
- , , , . National and regional trends in heart failure hospitalization and mortality rates for Medicare beneficiaries,1998–2008. JAMA. 2011;306(15):1669–1678.
- , , , et al. Outcomes of noninvasive ventilation for acute exacerbations of chronic obstructive pulmonary disease in the United States, 1998–2008. Am J Respir Crit Care Med. 2011;185(2):152–159.
- , , , et al. A trial of goal‐oriented hemodynamic therapy in critically ill patients. SvO2 Collaborative Group. N Engl J Med. 1995;333(16):1025–1032.
- , . Ventilation with lower tidal volumes as compared with traditional tidal volumes for acute lung injury. N Engl J Med. 2000;343(11):813; author reply 813–814.
- , , . Short‐ and long‐term survival of nonsurgical intensive care patients and its relation to diagnosis, severity of disease, age and comorbidities. Curr Aging Sci. 2009;2(3):240–248.
- , , , , , . The impact of COPD on management and outcomes of patients hospitalized with acute myocardial infarction—a ten‐year retrospective observational study. Chest. 2012;141(6):1441–1448.
- . The paradox of health. N Engl J Med. 1988;318(7):414–418.
- , , . Rehospitalizations among patients in the Medicare fee‐for‐service program. N Engl J Med. 2009;360(14):1418–1428.
- , , , et al. Outcomes and cost‐effectiveness of ventilator support and aggressive care for patients with acute respiratory failure due to pneumonia or acute respiratory distress syndrome. Am J Med. 2000;109(8):614–620.
- , , , et al. Older age, aggressiveness of care, and survival for seriously ill, hospitalized adults. SUPPORT Investigators. Study to Understand Prognoses and Preferences for Outcomes and Risks of Treatments. Ann Intern Med. 1999;131(10):721–728.
- , , , et al. Patient age and decisions to withhold life‐sustaining treatments from seriously ill, hospitalized adults. SUPPORT Investigators. Study to Understand Prognoses and Preferences for Outcomes and Risks of Treatment. Ann Intern Med. 1999;130(2):116–125.
- , , , et al. Are aggressive treatment strategies less cost‐effective for older patients? The case of ventilator support and aggressive care for patients with acute respiratory failure. J Am Geriatr Soc. 2001;49(4):382–390.
- , . Utilization of non‐invasive ventilation in patients with acute respiratory failure from 2000–2009: a population‐based study. Am J Respir Crit Care Med. 2012;185:A6488.
- , , , et al. One‐year outcomes in survivors of the acute respiratory distress syndrome. N Engl J Med. 2003;348(8):683–693.
Copyright © 2012 Society of Hospital Medicine