User login
Using Social Media as a Hospital QI Tool
Patient experience has become a major component of the Center for Medicare and Medicaid Services Value‐Based Purchasing initiative.[1] Hospitals have therefore focused quality improvement (QI) efforts on this area.[2] Hospital performance in the realm of patient experience is generally determined using systematic surveys with closed‐ended questions, but patient‐generated narrative feedback can help hospitals identify the components of care that contribute to patient satisfaction and or are in need of improvement.[3] Online narrative responses posted by patients on rating websites or social media have been criticized because they may not be representative of the population,[4] but they also have some advantages.[5] Any patient may leave a comment, not just those who are selected for a survey. Patients may also experience benefits through the act of sharing their story with others. Moreover, most US hospitals use some form of social media,[6] which they can theoretically use to self‐collect narrative data online. To realize the full potential of patient‐generated online narratives, we need a clearer understanding of the best practices for collecting and using these narratives. We therefore solicited patient feedback on the Facebook page of a large tertiary academic medical center to determine whether it is feasible to use social media platforms for learning about and improving hospital quality.
METHODS
Baystate Medical Center (BMC) is a tertiary care medical center in western Massachusetts. We identified key BMC stakeholders in the areas of QI and public affairs. Noting that patients have expressed interest in leaving comments via social media,[7] the group opted to perform a pilot study to obtain patient narratives via a Facebook prompt (Facebook is a social media site used by an estimated 58% of US adults[8]). The BMC public affairs department delivered a press release to the local media describing a 3‐week period during which patients were invited to leave narrative feedback on the BMC Facebook wall. The BMC Institutional Review Board deemed that this study did not constitute human subjects research.
During March 2014 (March 10, 2014March 24, 2014), we posted (once a week) an open‐ended prompt on BMC's Facebook wall. The prompt was designed to elicit novel descriptions of patient experience that could help to drive QI. It read: We want to hear about your experiences. In the comment section below, please tell us what we do well and how we can improve your care. Because of concerns about the potential reputational risks of allowing open feedback on a public social media page, the prompt also reminded patients of the social media ground rules: there should be no mention of specific physicians, nurses, or other caregivers by name (for liability reasons); and patients should not include details about their medical history (for privacy reasons).
We collected all posts to preserve comments and used directed qualitative content analysis to examine them.[9] Two research team members[3, 10, 11] independently coded the responses. Starting with an a priori codebook that was developed during a previous study,[3] they amended the codebook through an iterative process to incorporate new concepts. After independently coding all blocks of text, the coders reviewed their coding selections and resolved discrepancies through discussion. We then performed second‐level coding, in which codes were organized into major pertinent themes. We reviewed the coded text after applying secondary codes in order to check for accuracy of coding and theme assignment as well as completeness of second‐level coding. We calculated percent agreement, defined as both raters scoring a block of text with the same code divided by total number of codes. We also calculated the Spearman correlation between the 2 reviewers. We used descriptive statistics to assess the frequency of select codes and themes (see Supporting Information, Appendix 1 and Appendix 2, in the online version of this article).[9, 12, 13]
RESULTS
Over a 3‐week study period, 47 comments were submitted by 37 respondents. This yielded 148 codable statements (Table 1). Despite limited information on respondents, we ascertained from Facebook that 32 (86%) were women and 5 (14%) were men.
| Theme | Total Respondents, N (%) | % Positive | Positive Quotation | % Negative | Negative Quotation |
|---|---|---|---|---|---|
| |||||
| Staff | 17 (46) | 45% | The nurses in the pediatric unit, as well as the doctors in radiology and x‐ray department were AMAZING! | 55% | My 24‐year‐old daughter had to go for 5 days of IV treatmentwhile getting her infusion there was a fire alarm. She has a video showing the flashing of the light and the sound of the alarm and the closing of doors and NOT A SINGLE staff member to be found. Her infusions take about 2 hours. They set it and forget it. Luckily there wasn't a fire and someone did finally come to disconnect her. |
| Had a fabulous experience with Wesson women's this week! Had a C section and 3‐day admission. All staff from preoperative to inpatient were so helpful and really anticipated my needs before I could even ask for things. | My mother was hospitalized for at least 3 weeks right after the cardiovascular center openedwhen she went into cardiac arrest and in acute care and the step unit the care was great, very attentive nurses and doctors. When she was starting to recover and moved upstairs, downhill it went. She'd ring for assistance because she wanted to walk to the bathrooms and more times she was left to her own devices because no one would respond. | ||||
| Facility | 9 (24) | 25% | New buildings are beautiful and the new signs are way better. | 75% | The parking situation was disappointing and the waiting room was also very dirty. |
| I really like the individual pods in the ER. | I could have used a single room as my roommate was very annoying and demanding. | ||||
| Departments | 22 (60) | 44% | The NICU was great when my son was in there. The children's unit was great with my daughter and respected my needs. | 56% | Revamp maternity; it needs it desperately. |
| Labor and delivery was a great place. | Love Baystate but hate the ER. | ||||
| Technical aspects of care (eg, errors) | 9 (24) | 0 | 100% | Day 2 of my 24 year old getting her 2‐hour IV infusion....she was set up with her IV. When checked 2 hours later, the staff member was very upset to find that only the saline had run. She never opened the medication clamp. So now they gave her the medication in 1 hour instead of 2. | |
| If I had 1 suggestion it would be to re‐evaluate patient comfort when patients are waiting to be admitted. | |||||
From coded text, several broad themes were identified (see Table 1 for representative quotes): (1) comments about staff (17/37 respondents, 45.9%). These included positive descriptions of efficiency, caring behavior, good training, and good communication, whereas negative comments included descriptions of unfriendliness, apparent lack of caring, inattentiveness, poor training, unprofessional behavior, and poor communication; (2) comments about specific departments (22/37, 59.5%); (3) comments on technical aspects of care, including perceived errors, incorrect diagnoses, and inattention to pain control (9/37, 24.3%); and (4) comments describing the hospital physical plant, parking, and amenities (9/37, 24.3%). There were a few miscellaneous comments that did not fit into these broad themes, such as expressions of gratitude for our solicitation of narratives. Percent agreement between coders was 80% and Spearman's Rho was 0.82 (p<0.001).
A small number (n=3) of respondents repeatedly made comments over the 3‐week period, accounting for 30% (45/148) of codes. These repetitive commenters tended to dominate the Facebook conversation, at times describing the same experience more than once.
DISCUSSION
In this study evaluating the potential utility of social media as a hospital QI tool, several broad themes emerged. From these themes, we identified several areas that could be deemed as QI targets, including: training staff to be more responsive and sensitive to patients needs and concerns, improving patient and visitor parking, and reducing emergency department waiting times. However, the insight gained from solicited Facebook comments was similar to feedback gained from more traditional approaches of soliciting patient perspectives on care, such as patient experience surveys.[14]
Our findings should be viewed in the context of prior work focused on patient narratives in healthcare. Greaves et al. used sentiment analysis to describe the content of nearly 200,000 tweets (comments posted on the social networking website Twitter) sent to National Health Service (NHS) hospitals.[15] Themes were similar to those found in our study: (1) interaction with staff, (2) environment and facilities, and (3) issues of access and timeliness of service. Notably, these themes mirrored prior work examining narratives at NHS hospitals[3] and were similar to domains of commonly used surveys of patient experience.[14] The authors noted that there were issues with the signal to noise ratio (only about 10% of tweets were about quality) and the enforced brevity of Twitter (tweets must be 140 characters or less). These limitations suggest that using Twitter to identify QI targets would be difficult.
In contrast to Greaves et al., we chose to solicit feedback on our hospital's Facebook page. Facebook does not have Twitter's enforced brevity, allowing for more detailed narratives. In addition, we did not encounter the signal‐to‐noise problem, because our prompt was designed to request feedback that was relevant to recent experiences of care. However, a few respondents dominated the conversation, supporting the hypothesis that those most likely to comment may be the patients or families who have had the best or worst experiences. In the future, we will attempt to address this limitation and reduce the influence of repeat commenters by changing our prompt (eg, Please tell us about your experience, but please do not post descriptions of the same experience more than once.).
This pilot demonstrated some of the previously described benefits of online narratives.[5] First, there appears to be value in allowing patients to share their experiences and to read the experiences of others (as indicated in a few grateful patients comments). Second, soliciting online narratives offers a way for hospitals to demonstrate a commitment to transparency. Third, in contrast to closed‐ended survey questions, narrative comments help to identify why patients were satisfied or unsatisfied with their care. Although some surveys with closed‐ended questions also allow for narratives, these comments may or may not be carefully reviewed by the hospital. Using social media to solicit and respond to comments enhances existing methods for evaluating patient experience by engaging patients in a public space, which increases the likelihood that hospitals will attempt to improve care in response.
Notably, none of the identified areas for improvement could be considered novel QI targets for BMC. For example, our hospital has been very focused on training staff around patient experience, and emergency department wait times are the focus of a system‐wide improvement effort called Patient Progress.
This study has other limitations. We conducted this study over a 3‐week time period in a single center and on a single social media site whose members may not be representative of the overall patient population at BMC. Although we do not know how generalizable our findings are (in terms of identifying QI targets), we feel that we have demonstrated how using social media to collect data on patient experience is feasible and could be informative for other hospitals in other locations. It is possible that we did not allow the experiment to run long enough; a longer time or broader outreach (eg, a handout given to every discharged patient over a longer period) may be needed to allow patients adequate opportunity to comment. Of note, we did not specifically examine responses by time period, but it does seem, in post hoc analysis, that after 2 weeks of data collection we reached theoretical saturation with no new themes emerging in the third week (eg, third‐week comments included I heart your nurses. and Love Baystate but hate the ER.). More work is also needed that includes a broader range of social media platforms and more participating hospitals.
In conclusion, the opportunity to provide feedback on Facebook has the potential to engage and empower patients, and hospitals can use these online narratives to help to drive improvement efforts. Yet potential benefits must be weighed against reputational risks, a lack of representative respondents, and the paucity of novel QI targets obtained in this study.
Disclosures: Dr. Lagu is supported by the National Heart, Lung, and Blood Institute of the National Institutes of Health under award number K01HL114745. The authors report no conflicts of interest.
- Centers for Medicare 47(2):193–219.
- , , , , . A mixed‐methods analysis of patient reviews of hospital care in England: implications for public reporting of health care quality data in the United States. Jt Comm J Qual Patient Saf. 2013;39(1):7–15.
- , , , , , , , . Taking Patients' Narratives about Clinicians from Anecdote to Science. NEJM. 2015;373(7):675–679.
- , . Putting the public back in public reporting of health care quality. JAMA. 2010;304(15):1711–1712.
- , , , et al. Use of social media across US hospitals: descriptive analysis of adoption and utilization. J Med Internet Res. 2014;16(11):e264.
- , , , , , . Patient use of email, Facebook, and physician websites to communicate with physicians: a national online survey of retail pharmacy users [published online June 24, 2015]. J Gen Intern Med. doi:10.1007/s11606-015-3374-7.
- Pew Research Center. Social networking fact sheet. Available at: http://www.pewinternet.org/fact‐sheets/social‐networking‐fact‐sheet. Accessed March 4, 2015.
- , . Three approaches to qualitative content analysis. Qual Health Res. 2005;15(9):1277–1288.
- , , , . Patients’ evaluations of health care providers in the era of social networking: an analysis of physician‐rating websites. J Gen Intern Med. 2010;25(9):942–946.
- , , , , . Vaccine counseling: a content analysis of patient‐physician discussions regarding human papilloma virus vaccine. Vaccine. 2011;29(43):7343–7349.
- . Qualitative research methods. Int J Qual Health Care. 2002;14(4):329–336.
- , . Doing Qualitative Research. Vol 2. Thousand Oaks, CA: Sage Publications; 1999.
- , , , . Patients’ perception of hospital care in the United States. N Engl J Med. 2008;359(18):1921–1931.
- , , , et al. Tweets about hospital quality: a mixed methods study. BMJ Qual Saf. 2014;23(10):838–846.
Patient experience has become a major component of the Center for Medicare and Medicaid Services Value‐Based Purchasing initiative.[1] Hospitals have therefore focused quality improvement (QI) efforts on this area.[2] Hospital performance in the realm of patient experience is generally determined using systematic surveys with closed‐ended questions, but patient‐generated narrative feedback can help hospitals identify the components of care that contribute to patient satisfaction and or are in need of improvement.[3] Online narrative responses posted by patients on rating websites or social media have been criticized because they may not be representative of the population,[4] but they also have some advantages.[5] Any patient may leave a comment, not just those who are selected for a survey. Patients may also experience benefits through the act of sharing their story with others. Moreover, most US hospitals use some form of social media,[6] which they can theoretically use to self‐collect narrative data online. To realize the full potential of patient‐generated online narratives, we need a clearer understanding of the best practices for collecting and using these narratives. We therefore solicited patient feedback on the Facebook page of a large tertiary academic medical center to determine whether it is feasible to use social media platforms for learning about and improving hospital quality.
METHODS
Baystate Medical Center (BMC) is a tertiary care medical center in western Massachusetts. We identified key BMC stakeholders in the areas of QI and public affairs. Noting that patients have expressed interest in leaving comments via social media,[7] the group opted to perform a pilot study to obtain patient narratives via a Facebook prompt (Facebook is a social media site used by an estimated 58% of US adults[8]). The BMC public affairs department delivered a press release to the local media describing a 3‐week period during which patients were invited to leave narrative feedback on the BMC Facebook wall. The BMC Institutional Review Board deemed that this study did not constitute human subjects research.
During March 2014 (March 10, 2014March 24, 2014), we posted (once a week) an open‐ended prompt on BMC's Facebook wall. The prompt was designed to elicit novel descriptions of patient experience that could help to drive QI. It read: We want to hear about your experiences. In the comment section below, please tell us what we do well and how we can improve your care. Because of concerns about the potential reputational risks of allowing open feedback on a public social media page, the prompt also reminded patients of the social media ground rules: there should be no mention of specific physicians, nurses, or other caregivers by name (for liability reasons); and patients should not include details about their medical history (for privacy reasons).
We collected all posts to preserve comments and used directed qualitative content analysis to examine them.[9] Two research team members[3, 10, 11] independently coded the responses. Starting with an a priori codebook that was developed during a previous study,[3] they amended the codebook through an iterative process to incorporate new concepts. After independently coding all blocks of text, the coders reviewed their coding selections and resolved discrepancies through discussion. We then performed second‐level coding, in which codes were organized into major pertinent themes. We reviewed the coded text after applying secondary codes in order to check for accuracy of coding and theme assignment as well as completeness of second‐level coding. We calculated percent agreement, defined as both raters scoring a block of text with the same code divided by total number of codes. We also calculated the Spearman correlation between the 2 reviewers. We used descriptive statistics to assess the frequency of select codes and themes (see Supporting Information, Appendix 1 and Appendix 2, in the online version of this article).[9, 12, 13]
RESULTS
Over a 3‐week study period, 47 comments were submitted by 37 respondents. This yielded 148 codable statements (Table 1). Despite limited information on respondents, we ascertained from Facebook that 32 (86%) were women and 5 (14%) were men.
| Theme | Total Respondents, N (%) | % Positive | Positive Quotation | % Negative | Negative Quotation |
|---|---|---|---|---|---|
| |||||
| Staff | 17 (46) | 45% | The nurses in the pediatric unit, as well as the doctors in radiology and x‐ray department were AMAZING! | 55% | My 24‐year‐old daughter had to go for 5 days of IV treatmentwhile getting her infusion there was a fire alarm. She has a video showing the flashing of the light and the sound of the alarm and the closing of doors and NOT A SINGLE staff member to be found. Her infusions take about 2 hours. They set it and forget it. Luckily there wasn't a fire and someone did finally come to disconnect her. |
| Had a fabulous experience with Wesson women's this week! Had a C section and 3‐day admission. All staff from preoperative to inpatient were so helpful and really anticipated my needs before I could even ask for things. | My mother was hospitalized for at least 3 weeks right after the cardiovascular center openedwhen she went into cardiac arrest and in acute care and the step unit the care was great, very attentive nurses and doctors. When she was starting to recover and moved upstairs, downhill it went. She'd ring for assistance because she wanted to walk to the bathrooms and more times she was left to her own devices because no one would respond. | ||||
| Facility | 9 (24) | 25% | New buildings are beautiful and the new signs are way better. | 75% | The parking situation was disappointing and the waiting room was also very dirty. |
| I really like the individual pods in the ER. | I could have used a single room as my roommate was very annoying and demanding. | ||||
| Departments | 22 (60) | 44% | The NICU was great when my son was in there. The children's unit was great with my daughter and respected my needs. | 56% | Revamp maternity; it needs it desperately. |
| Labor and delivery was a great place. | Love Baystate but hate the ER. | ||||
| Technical aspects of care (eg, errors) | 9 (24) | 0 | 100% | Day 2 of my 24 year old getting her 2‐hour IV infusion....she was set up with her IV. When checked 2 hours later, the staff member was very upset to find that only the saline had run. She never opened the medication clamp. So now they gave her the medication in 1 hour instead of 2. | |
| If I had 1 suggestion it would be to re‐evaluate patient comfort when patients are waiting to be admitted. | |||||
From coded text, several broad themes were identified (see Table 1 for representative quotes): (1) comments about staff (17/37 respondents, 45.9%). These included positive descriptions of efficiency, caring behavior, good training, and good communication, whereas negative comments included descriptions of unfriendliness, apparent lack of caring, inattentiveness, poor training, unprofessional behavior, and poor communication; (2) comments about specific departments (22/37, 59.5%); (3) comments on technical aspects of care, including perceived errors, incorrect diagnoses, and inattention to pain control (9/37, 24.3%); and (4) comments describing the hospital physical plant, parking, and amenities (9/37, 24.3%). There were a few miscellaneous comments that did not fit into these broad themes, such as expressions of gratitude for our solicitation of narratives. Percent agreement between coders was 80% and Spearman's Rho was 0.82 (p<0.001).
A small number (n=3) of respondents repeatedly made comments over the 3‐week period, accounting for 30% (45/148) of codes. These repetitive commenters tended to dominate the Facebook conversation, at times describing the same experience more than once.
DISCUSSION
In this study evaluating the potential utility of social media as a hospital QI tool, several broad themes emerged. From these themes, we identified several areas that could be deemed as QI targets, including: training staff to be more responsive and sensitive to patients needs and concerns, improving patient and visitor parking, and reducing emergency department waiting times. However, the insight gained from solicited Facebook comments was similar to feedback gained from more traditional approaches of soliciting patient perspectives on care, such as patient experience surveys.[14]
Our findings should be viewed in the context of prior work focused on patient narratives in healthcare. Greaves et al. used sentiment analysis to describe the content of nearly 200,000 tweets (comments posted on the social networking website Twitter) sent to National Health Service (NHS) hospitals.[15] Themes were similar to those found in our study: (1) interaction with staff, (2) environment and facilities, and (3) issues of access and timeliness of service. Notably, these themes mirrored prior work examining narratives at NHS hospitals[3] and were similar to domains of commonly used surveys of patient experience.[14] The authors noted that there were issues with the signal to noise ratio (only about 10% of tweets were about quality) and the enforced brevity of Twitter (tweets must be 140 characters or less). These limitations suggest that using Twitter to identify QI targets would be difficult.
In contrast to Greaves et al., we chose to solicit feedback on our hospital's Facebook page. Facebook does not have Twitter's enforced brevity, allowing for more detailed narratives. In addition, we did not encounter the signal‐to‐noise problem, because our prompt was designed to request feedback that was relevant to recent experiences of care. However, a few respondents dominated the conversation, supporting the hypothesis that those most likely to comment may be the patients or families who have had the best or worst experiences. In the future, we will attempt to address this limitation and reduce the influence of repeat commenters by changing our prompt (eg, Please tell us about your experience, but please do not post descriptions of the same experience more than once.).
This pilot demonstrated some of the previously described benefits of online narratives.[5] First, there appears to be value in allowing patients to share their experiences and to read the experiences of others (as indicated in a few grateful patients comments). Second, soliciting online narratives offers a way for hospitals to demonstrate a commitment to transparency. Third, in contrast to closed‐ended survey questions, narrative comments help to identify why patients were satisfied or unsatisfied with their care. Although some surveys with closed‐ended questions also allow for narratives, these comments may or may not be carefully reviewed by the hospital. Using social media to solicit and respond to comments enhances existing methods for evaluating patient experience by engaging patients in a public space, which increases the likelihood that hospitals will attempt to improve care in response.
Notably, none of the identified areas for improvement could be considered novel QI targets for BMC. For example, our hospital has been very focused on training staff around patient experience, and emergency department wait times are the focus of a system‐wide improvement effort called Patient Progress.
This study has other limitations. We conducted this study over a 3‐week time period in a single center and on a single social media site whose members may not be representative of the overall patient population at BMC. Although we do not know how generalizable our findings are (in terms of identifying QI targets), we feel that we have demonstrated how using social media to collect data on patient experience is feasible and could be informative for other hospitals in other locations. It is possible that we did not allow the experiment to run long enough; a longer time or broader outreach (eg, a handout given to every discharged patient over a longer period) may be needed to allow patients adequate opportunity to comment. Of note, we did not specifically examine responses by time period, but it does seem, in post hoc analysis, that after 2 weeks of data collection we reached theoretical saturation with no new themes emerging in the third week (eg, third‐week comments included I heart your nurses. and Love Baystate but hate the ER.). More work is also needed that includes a broader range of social media platforms and more participating hospitals.
In conclusion, the opportunity to provide feedback on Facebook has the potential to engage and empower patients, and hospitals can use these online narratives to help to drive improvement efforts. Yet potential benefits must be weighed against reputational risks, a lack of representative respondents, and the paucity of novel QI targets obtained in this study.
Disclosures: Dr. Lagu is supported by the National Heart, Lung, and Blood Institute of the National Institutes of Health under award number K01HL114745. The authors report no conflicts of interest.
- Centers for Medicare 47(2):193–219.
- , , , , . A mixed‐methods analysis of patient reviews of hospital care in England: implications for public reporting of health care quality data in the United States. Jt Comm J Qual Patient Saf. 2013;39(1):7–15.
- , , , , , , , . Taking Patients' Narratives about Clinicians from Anecdote to Science. NEJM. 2015;373(7):675–679.
- , . Putting the public back in public reporting of health care quality. JAMA. 2010;304(15):1711–1712.
- , , , et al. Use of social media across US hospitals: descriptive analysis of adoption and utilization. J Med Internet Res. 2014;16(11):e264.
- , , , , , . Patient use of email, Facebook, and physician websites to communicate with physicians: a national online survey of retail pharmacy users [published online June 24, 2015]. J Gen Intern Med. doi:10.1007/s11606-015-3374-7.
- Pew Research Center. Social networking fact sheet. Available at: http://www.pewinternet.org/fact‐sheets/social‐networking‐fact‐sheet. Accessed March 4, 2015.
- , . Three approaches to qualitative content analysis. Qual Health Res. 2005;15(9):1277–1288.
- , , , . Patients’ evaluations of health care providers in the era of social networking: an analysis of physician‐rating websites. J Gen Intern Med. 2010;25(9):942–946.
- , , , , . Vaccine counseling: a content analysis of patient‐physician discussions regarding human papilloma virus vaccine. Vaccine. 2011;29(43):7343–7349.
- . Qualitative research methods. Int J Qual Health Care. 2002;14(4):329–336.
- , . Doing Qualitative Research. Vol 2. Thousand Oaks, CA: Sage Publications; 1999.
- , , , . Patients’ perception of hospital care in the United States. N Engl J Med. 2008;359(18):1921–1931.
- , , , et al. Tweets about hospital quality: a mixed methods study. BMJ Qual Saf. 2014;23(10):838–846.
Reporting Hospital Quality
Acknowledging striking deficiencies in the quality and safety of healthcare, the Institute of Medicine, policy makers, and payors have called for transformation of the US healthcare system.1 Public reporting of hospital performance is one key strategy for accelerating improvement2 and may improve quality in several ways. First, feedback about performance relative to peers may stimulate quality improvement activities by appealing to professionalism. Second, the desire to preserve one's reputation by not appearing on a list of poor performers may be a powerful incentive. Finally, patients and referring providers could use reports to select high‐quality hospitals, thereby shifting care from low‐quality to high‐quality hospitals and stimulating quality improvement efforts to maintain or enhance market share.
Almost 20 years after New York and Pennsylvania began reporting cardiac surgery outcomes,3 the evidence that public reporting improves healthcare quality is equivocal.4 Moreover, stakeholders have embraced public reporting to differing degrees. Public reporting does lead to greater engagement in quality improvement activities,58 and additional financial incentives provide modest incremental benefits.9 Purchasers, too, are starting to pay attention.10 In New York State, payors appear to contract more with high‐quality surgeons and avoid poorly performing outliers.11 Some payors are creating tiered systems, assigning higher patient copayments for hospitals with poor quality metrics. These new systems have not been rigorously studied and should raise concern among hospitals.12
In contrast to hospitals and payors, patients have been slow to embrace public reporting. In a survey of coronary artery bypass graft (CABG) patients in Pennsylvania, only 2% said that public reporting of mortality rates affected their decision making.13 Eight years later, only 11% of patients sought information about hospitals before deciding on elective major surgery,14 although a majority of patients in both studies expressed interest in the information. It is not clear whether recent proliferation of information on the internet will change patient behavior, but to date public reporting appears not to effect market share.5, 15, 16
Barriers to patients' use of public reporting include difficulty accessing the information, lack of trust, information that is not salient, and data that are difficult to interpret.17 In the absence of consensus on what or how to report, a growing number of organizations, including state and federal government, accrediting bodies, private foundations, and for‐profit companies report a variety of measures relating to structure, processes, and outcomes. Although these sites purport to target consumers, they sometimes offer conflicting information18 and are not easily interpreted by lay readers.19
To realize the benefits of public reporting, and minimize the unintended consequences, rating systems must report salient information in a way that is comprehensible to patients and trusted by the doctors who advise them. At the same time, they should be fair to hospitals and offer useful data for quality improvement. We offer 10 recommendations for improving the public reporting of healthcare quality information: 5 describing what to report and 5 detailing how it should be reported (Figure 1). We also examine 3 leading performance reporting programs to see how well they implement these recommendations.
Recommendations to Make Data Salient for Patients
1. Prioritize Elective Procedures
Hospital quality is not uniform across conditions.2 For data to be salient, then, it should be disease‐specific and focus on common elective procedures, for which consumer choice is possible. Table 1 compares 3 popular reporting services. Hospital Compare, produced by the Center for Medicare Services (CMS, US Department of Health and Human Services, Washington, DC), provides process of care measures for 4 conditions, 3 of which are not elective. The fourth, surgical infection prevention, contains 5 measures3 related to perioperative antibiotics and 2 related to thromboembolism prophylaxisfor all surgical cases. Recently, more conditions have been added, but reports are limited to the number of cases and mean Medicare charge. By year 2011, however, Hospital Compare will offer many new measures, including rates of central line infection, ventilator‐associated pneumonia, and surgical site infection. HealthGrades, a private company, offers comparative mortality rates on over 30 diagnoses, of which 15 can be considered elective, at least some of the time. Only the Leapfrog group, an industry consortium, focuses exclusively on elective procedures, offering volume measures on 7 and outcome measures on 2.
| Rule | Hospital Compare | HealthGrades | Leapfrog | |||
|---|---|---|---|---|---|---|
| ||||||
| 1. Prioritize elective procedures | Yes | 22/28 at least partially elective | Yes | 15/31 at least partially elective | Yes | 7/8 elective |
| 2. Include quality of life and outcome data, if possible | Yes | Mortality for AMI and CHF | Yes | Mortality or complications* | Yes | Outcomes for CABG, PCI, and AVR |
| 3. Include standardized patient satisfaction and service measures | Yes | HCAHPS | No | No | ||
| 4. Offer composite measures that are weighted and evidence‐based | No | No | Specialty excellence award, not evidence‐based | No | ||
| 5. Costs comparisons should include patient prices | Yes | Average Medicare payment | Yes | Charges, health plan and Medicare costs available for a fee | No | |
| 6. Adjust outcomes for severity and risk | Yes | Methodology published on website | Yes | Methodology not public | Yes | Various methodologies published or referenced on website |
| 7. Identify differences not due to chance | Yes | Compares mortality to national mean | Yes | Compares mortality or complications to mean | Yes | Compares mortality to national mean |
| 8. Standardize reporting periods | October 2005 to September 2006 | 2004‐2006 | 12‐24 months, ending 12/31/07 or 6/30/08 | |||
| 9. Avoid use of nonvalidated administrative data | Yes | None used | No | Uses PSIs for safety rating | Yes | None used |
| 10. Utilization rates should be evidence‐based | No | Surgical case volume of Medicare patients | No | Includes Caesarian‐section rates | Yes | Some case volume rates are evidence‐based |
2. Include Quality of Life and Outcome Data
Outcomes are more valuable to patients than process measures, but the risk adjustment needed to compare outcomes requires considerable effort. So far, public reporting of risk‐adjusted outcomes has been limited almost exclusively to mortality. Yet a patient contemplating knee replacement surgery would find no meaningful difference in mortalitythere were only 510 deaths nationally in year 200620but might be interested in whether patients return to full mobility after surgery, and all patients should compare rates of nosocomial infections. For some low‐risk procedures, HealthGrades Inc. (Golden, CO) includes a composite measure of major complications, including complication of an orthopedic implant, stroke, cardiac arrest, excessive bleeding, and some types of infection; CMS will soon add rates of infection and readmission.
3. Include Measures of Patient Experience, Such as Satisfaction and Service Measures
Beyond outcomes, patients want to know about the experience of others.21 Satisfaction surveys should be standardized and made disease‐specific, since patients' experiences may differ between the cardiology suite and the delivery unit. Questions could address the attentiveness of the nursing staff, how well privacy was respected, how easy it was to deal with insurance issues, whether patients were promptly informed of test results, and whether the care team answered questions fully. Medicare has begun reporting patient satisfaction using the Hospital Consumer Assessment of Healthcare Providers (HCAHPS) survey on Hospital Compare, but the data are not disease‐specific and audit a very small number of patients from each institution. Other services are unlikely to perform their own surveys, as multiple surveys would prove burdensome. Social networking sites that allow patients to post their own personal reviews of hospitals and doctors offer an additional if less reliable dimension to traditional public reporting. Such sites are already transforming the market for other industries, such as travel.22
4. Offer Composite Measures That Are Weighted and Evidence‐Based
Interpreting multiple measures, some of which are more important than others, and some of which have better evidence than others, is difficult for health care providers and may be impossible for patients. Is it more important to get aspirin on arrival or at discharge? Also, how does a patient weigh a 1% difference in the number of heart attack patients who get aspirin on arrival against a 14% difference in those who are offered smoking cessation? Because patients may be overwhelmed by data,23 public reports should include evidence‐based, weighted measures of overall care for a given condition, with higher weights attached to those process measures most likely to have clinical benefit, and careful attention to visual representations that convey relative differences.19, 23 More sophisticated measures should be developed to guard against overuse. For example, while hospitals should be rewarded for providing vaccination, they should be penalized for vaccinating the same patient twice.
None of the services we examined provides weighted outcomes. Leapfrog (The Leapfrog Group, Washington, DC) offers a composite snapshot containing 9 pie charts, divided into 4 leaps. The 6 pies representing high‐risk procedures are of equal size, even though 2 of these, esophagectomy and pancreatic resection represent very rare surgeries, even at major medical centers. From a visual perspective, however, these are equivalent to having computerized physician order entry and full‐time intensive care unit staffing, which affect thousands more patients. Similarly, in determining pay‐for‐performance measures, CMS created a composite based on the total number of opportunities of all interventions, weighting all measures equally. Because no validated weighting measures exist, future research will be necessary to achieve this goal. Also, none of the evidence‐based measures contained safeguards against overtreatment.
5. Cost Comparisons Should Include Patient Prices
In an era of patient copayments and deductibles, consumers are increasingly aware of costs. For patients with very high deductible plans or no health insurance, hospital fees are a common cause of bankruptcy.24 Several public reporting agencies, including Hospital Compare and HealthGrades have incorporated Medicare costs into their reported measures, but these have little connection to what patients actually pay. Health sites aimed at consumers should publish the average patient copayment.
Recommendations to Ensure That Data Reflects Hospital Quality
6. Adjust Outcomes for Severity and Risk
Not all bypass operations are the same and not all patients are at equal risk. More difficult operations (eg, CABG for a patient with a previous bypass) will have more complications; similarly, patients with serious comorbidities will experience worse outcomes. Since hospitals which specialize in a procedure will attract complicated cases and higher risk patients, it is important to adjust outcomes to account for these differences. Otherwise, hospitals and surgeons may be discouraged from taking difficult cases. Outside of cardiac surgery, most risk adjustment systems use administrative claims data but vary dramatically in the numbers of variables considered and the underlying proprietary models, which are often criticized as being black boxes that yield discordant results.25 Thus, a hospital's mortality may appear below expected by 1 system and above expected by another. Instead, risk adjustment systems should include clinical data abstracted from patient records using standardized data definitions. Although costly to collect, clinical data offer more predictive information than do administrative data. For example, for heart failure patients undergoing CABG, the ejection fraction predicts mortality better than many stable comorbid diagnoses. A single transparent risk‐adjustment system should be recognized as the industry standard. The American College of Surgeons' standardized risk‐adjusted outcome reporting for the National Surgical Quality Improvement Program (NSQIP) is a good example of such an effort.
7. Identify Differences Not Due to Chance
As a result of random variation, during any period, some hospitals will appear better than average and others worse. Statistical tests should be employed to identify hospitals that differ from the mean, and to allow consumers to compare 2 hospitals directly, with appropriate caveats when the hospitals serve very different patient populations. Medicare's mortality rating system for myocardial infarction identifies only 17 hospitals in the nation as better than average and 7 as worse, out of 4,500 institutions. HealthGrades compares hospitals' actual mortality or complication rates to their predicted rates based on disease‐specific logistic regression models and reports whether the hospital is statistically better or worse than predicted. Hospitals are not compared directly to one another. Given the rarity of mortality in most procedures, other outcome measures will be necessary to distinguish among hospitals.26
8. Standardize Reporting Periods
In a world of continuous quality improvement, public reporting should represent a hospital's recent performance, but reporting periods also need to be long enough to provide a stable estimate of infrequent events, especially at low‐volume institutions. In contrast, the lag time between the end of the reporting period and public availability should be kept to a minimum. We found that reporting periods varied from 1 to 3 years, and did not always cover the same years for all conditions, even on the same website. Some data were 3 years old. Patients will have a hard time making decisions on data that is 1 year old, and hospitals will have little incentive to make improvements that will not be acknowledged for years.
9. Avoid Use of Nonvalidated Administrative Data
Administrative data collected for billing purposes, unlike most clinical data, are already in electronic format, and can inexpensively produce quality rankings using validated models.27 In contrast, screening tools, such as the Agency for Healthcare Research and Quality's patient safety indicators (PSIs), were designed to identify potential quality problems, such as postoperative deep vein thrombosis, for internal quality improvement. Cases identified by the PSI software require additional chart review,28, 29 and should not be used as quality indicators. Even so, HealthGrades reports PSIs and some insurers use them in pay‐for‐performance initiatives. Improvements in PSIs, including present‐on‐admission coding, may increase accuracy,30 but these measures need to be validated before they can be adopted for public reporting.
10. Utilization Rates Should Be Evidence‐Based
Although utilization rates for most procedures vary as much as 2‐fold by state or institution, there is little evidence for a best rate. Nevertheless, HealthGrades reports utilization rates for several obstetrical procedures. At present, there are no standards for these, and it is possible that utilization could be too low in some places. Further research is needed; until then, utilization should not purport to measure quality.
Discussion
The growing commitment to making hospital performance data public could transform the quality and safety of care in the US, introducing competition on quality and price and fostering informed consumer choice. To date, the promise of public reporting remains only partially fulfilled. Few hospitals have done more than comply with regulatory mandates and payer incentives, and consumers have failed to respond. To capture the full benefits of public reporting, we have made 10 recommendations to benefit patients and better engage hospitals. We suggest that reporting be patient‐centered, with an emphasis on making the data useful, meaningful, important, interpretable, and relevant. At the same time, hospitals, which are being judged on their performance, should have a level playing field, with measures that are timely, consistent, severity‐adjusted, evidence‐based, and which foster good clinical care. Of the 3 services we examined, Hospital Compare came closest to meeting these recommendations.
Although this blueprint for public reporting is easy to draft, it is challenging to implement. In particular, some of our suggestions, such as the one regarding risk adjustment, may not currently be feasible, because the complexity and cost of collecting clinical data, even in the era of electronic medical records, may be prohibitive. Until such data are readily available, it may be preferable to report nothing at all, rather than report data that are misleading. In the rush to make hospitals accountable, enthusiasm has often outstripped science,31 and several measures have had to be revised for unintended consequences.32
Any initiative to improve public reporting should have the buy‐in of all stakeholders, but particularly hospitals, which stand to benefit in several ways. By receiving regular feedback, they can focus on improving care, becoming better organizations. These improvements may be rewarded through direct compensation (pay‐for‐performance), decreased costs from complications, or increased market share. Hospitals will be more engaged if the data reflect actual quality, are adequately adjusted for severity, and acknowledge the role of chance. Otherwise, they will merely comply, or worse, look for opportunities to game the system. To succeed, public reporting needs to involve hospitals in establishing standards for reporting and validation, as well as auditing procedures to prevent fraud.33 The Hospital Quality Alliance (HQA, Washington, DC), a first step in this direction, at present has few measures. NSQIP (American College of Surgeons, Chicago, IL) is perhaps a better example of hospitals cooperating to set measurement standards to promote best‐practices. Public release of NSQIP data might accelerate progress. Alternatively, the National Quality Forum (NQF, Washington, DC) could expand its role from endorsing quality measures to include standardizing the way these measures are used in public reporting.
Still, if you build it, will they come? To date, public reporting has not been embraced by the public, despite its stated interest in the information. Several explanations could be offered. First, we may be presenting the wrong data. Process measures and mortality rates are important but represent abstract concepts for most patients. Surveys tell us that patients value most the experiences of other patients.14, 21 They want to know whether their pain will be controlled, whether the doctor will listen to them, whether the nurse will come when they call. The recent advent of the HCAHPS survey (AHRQ, Washington, DC) is another positive step. Stratifying the results by diagnosis and adding a few diagnosis‐specific questions would make HCAHPS even more valuable. Second, the data may not be readily available. Although most public reporting is done on the web, older patients who are deciding about hospitals may not have Internet access. Some reports are still proprietary, and cost could present another obstacle. Finally, even if freely‐available and patient‐centered, the results may not be interpretable by physicians, let alone patients.34
If public reporting is to succeed, it will require measures that better reflect patients' concerns. In order to collect the massive amounts of data required and present them in a timely fashion, better electronic record systems will be necessary. But these are no panacea; others have noted that the Department of Veterans Affairs, a leader in electronic records, still invests considerable time and money to review charts for NSQIP.35 Given the value that Americans place on transparency in other facets of their lives, it is clear that public reporting is here to stay. While much progress has been made over the past 5 years, additional research is needed to better measure quality from the patient's perspective, and to determine how this information can be used to help guide decision‐making, and to reward hospitals for offering the highest‐quality care.
Acknowledgements
The authors thank Kenneth Flax for his help with an earlier version of this manuscript.
- Committee on Quality of Health Care in America IoM.Crossing the Quality Chasm: A New Health System for the 21st Century.Washington, DC:National Academy Press;2001.
- ,,,.Care in U.S. hospitals: the Hospital Quality Alliance program.N Engl J Med.2005;353(3):265–274.
- .Achieving and sustaining improved quality: lessons from New York state and cardiac surgery.Health Aff. 20022002;21(4):40–51.
- ,,,,.Systematic review: the evidence that publishing patient care performance data improves quality of care.Ann Intern Med.2008;148(2):111–123.
- ,,.Hospital performance reports: impact on quality, market share, and reputation.Health Aff (Millwood).2005;24(4):1150–1160.
- ,,.Does publicizing hospital performance stimulate quality improvement efforts?Health Aff (Millwood).2003;22(2):84–94.
- ,,,,.Improving the outcomes of coronary artery bypass surgery in New York State.JAMA.1994;271(10):761–766.
- ,,.Declines in hospital mortality associated with a regional initiative to measure hospital performance.Am J Med Qual.1997;12(2):103–112.
- ,,, et al.Public reporting and pay for performance in hospital quality improvement.N Engl J Med.2007;356(5):486–496.
- ,,,,,.Do quality report cards play a role in HMOs' contracting practices? Evidence from New York State.Health Serv Res.2000;35(1 Pt 2):319–332.
- ,,,.Quality of cardiac surgeons and managed care contracting practices.Health Serv Res.2002;37(5):1129–1144.
- ,,,,,.Using performance data to identify preferred hospitals.Health Serv Res.2007;42(6 Pt 1):2109–2119; discussion 2294–2323.
- ,.Use of public performance reports: a survey of patients undergoing cardiac surgery.JAMA.1998;279(20):1638–1642.
- ,,.How do elderly patients decide where to go for major surgery? Telephone interview survey.BMJ.2005;331(7520):821.
- ,,,,,.The effect of publicly reporting hospital performance on market share and risk‐adjusted mortality at high‐mortality hospitals.Med Care.2003;41(6):729–740.
- ,.The predictive accuracy of the New York State coronary artery bypass surgery report‐card system.Health Aff (Millwood).2006;25(3):844–855.
- ,.Publicly disclosed information about the quality of health care: response of the US public.Qual Saf Health Care.2001;10(2):96–103.
- ,,,,.Choosing the best hospital: the limitations of public reporting of hospital quality.Health Aff (Millwood).2008;27(6):1680–1687.
- ,.Will quality report cards help consumers?Health Aff (Millwood).1997;16(3):218–228.
- Agency for Healthcare Research and Quality. HCUPnet, Healthcare Cost and Utilization Project. Available at: http://hcupnet.ahrq.gov. Accessed January 2009.
- ,,.Recovering from cardiac surgery: what patients want you to know.Am J Crit Care.2002;11(4):333–343.
- Trip Advisor. Available at: http://www.tripadvisor.com. Accessed January 2009.
- ,,,,.Less is more in presenting quality information to consumers.Med Care Res Rev.2007;64(2):169–190.
- ,,,.MarketWatch: illness and injury as contributors to bankruptcy.Health Aff (Millwood)2005;(Suppl Web Exclusives):W5‐63–W5‐73.
- .The Lake Wobegon effect: when all the patients are sicker.Am J Med Qual.2006;21(6):365–366.
- ,,.Surgical mortality as an indicator of hospital quality: the problem with small sample size.JAMA.2004;292(7):847–851.
- ,,, et al.An administrative claims model suitable for profiling hospital performance based on 30‐day mortality rates among patients with heart failure.Circulation.2006;113(13):1693–1701.
- ,,,.Can administrative data be used to compare postoperative complication rates across hospitals?Med Care.2002;40(10):856–867.
- ,,,,.Impact of diagnosis‐timing indicators on measures of safety, comorbidity, and case mix groupings from administrative data sources.Med Care.2007;45(8):781–788.
- ,,,,.Do the AHRQ patient safety indicators flag conditions that are present at the time of hospital admission?Med Care.2008;46(5):516–522.
- ,,.The tension between needing to improve care and knowing how to do it.N Engl J Med.2007;357(6):608–613.
- ,,,.Public reporting of antibiotic timing in patients with pneumonia: lessons from a flawed performance measure.Ann Intern Med.2008;149(1):29–32.
- ,,.The GAAP in quality measurement and reporting.JAMA.2007;298(15):1800–1802.
- ,,,.Consumer competencies and the use of comparative quality information: it isn't just about literacy.Med Care Res Rev.2007;64(4):379–394.
- .Performance measurement in search of a path.N Engl J Med.2007;356(9):951–953.
Acknowledging striking deficiencies in the quality and safety of healthcare, the Institute of Medicine, policy makers, and payors have called for transformation of the US healthcare system.1 Public reporting of hospital performance is one key strategy for accelerating improvement2 and may improve quality in several ways. First, feedback about performance relative to peers may stimulate quality improvement activities by appealing to professionalism. Second, the desire to preserve one's reputation by not appearing on a list of poor performers may be a powerful incentive. Finally, patients and referring providers could use reports to select high‐quality hospitals, thereby shifting care from low‐quality to high‐quality hospitals and stimulating quality improvement efforts to maintain or enhance market share.
Almost 20 years after New York and Pennsylvania began reporting cardiac surgery outcomes,3 the evidence that public reporting improves healthcare quality is equivocal.4 Moreover, stakeholders have embraced public reporting to differing degrees. Public reporting does lead to greater engagement in quality improvement activities,58 and additional financial incentives provide modest incremental benefits.9 Purchasers, too, are starting to pay attention.10 In New York State, payors appear to contract more with high‐quality surgeons and avoid poorly performing outliers.11 Some payors are creating tiered systems, assigning higher patient copayments for hospitals with poor quality metrics. These new systems have not been rigorously studied and should raise concern among hospitals.12
In contrast to hospitals and payors, patients have been slow to embrace public reporting. In a survey of coronary artery bypass graft (CABG) patients in Pennsylvania, only 2% said that public reporting of mortality rates affected their decision making.13 Eight years later, only 11% of patients sought information about hospitals before deciding on elective major surgery,14 although a majority of patients in both studies expressed interest in the information. It is not clear whether recent proliferation of information on the internet will change patient behavior, but to date public reporting appears not to effect market share.5, 15, 16
Barriers to patients' use of public reporting include difficulty accessing the information, lack of trust, information that is not salient, and data that are difficult to interpret.17 In the absence of consensus on what or how to report, a growing number of organizations, including state and federal government, accrediting bodies, private foundations, and for‐profit companies report a variety of measures relating to structure, processes, and outcomes. Although these sites purport to target consumers, they sometimes offer conflicting information18 and are not easily interpreted by lay readers.19
To realize the benefits of public reporting, and minimize the unintended consequences, rating systems must report salient information in a way that is comprehensible to patients and trusted by the doctors who advise them. At the same time, they should be fair to hospitals and offer useful data for quality improvement. We offer 10 recommendations for improving the public reporting of healthcare quality information: 5 describing what to report and 5 detailing how it should be reported (Figure 1). We also examine 3 leading performance reporting programs to see how well they implement these recommendations.
Recommendations to Make Data Salient for Patients
1. Prioritize Elective Procedures
Hospital quality is not uniform across conditions.2 For data to be salient, then, it should be disease‐specific and focus on common elective procedures, for which consumer choice is possible. Table 1 compares 3 popular reporting services. Hospital Compare, produced by the Center for Medicare Services (CMS, US Department of Health and Human Services, Washington, DC), provides process of care measures for 4 conditions, 3 of which are not elective. The fourth, surgical infection prevention, contains 5 measures3 related to perioperative antibiotics and 2 related to thromboembolism prophylaxisfor all surgical cases. Recently, more conditions have been added, but reports are limited to the number of cases and mean Medicare charge. By year 2011, however, Hospital Compare will offer many new measures, including rates of central line infection, ventilator‐associated pneumonia, and surgical site infection. HealthGrades, a private company, offers comparative mortality rates on over 30 diagnoses, of which 15 can be considered elective, at least some of the time. Only the Leapfrog group, an industry consortium, focuses exclusively on elective procedures, offering volume measures on 7 and outcome measures on 2.
| Rule | Hospital Compare | HealthGrades | Leapfrog | |||
|---|---|---|---|---|---|---|
| ||||||
| 1. Prioritize elective procedures | Yes | 22/28 at least partially elective | Yes | 15/31 at least partially elective | Yes | 7/8 elective |
| 2. Include quality of life and outcome data, if possible | Yes | Mortality for AMI and CHF | Yes | Mortality or complications* | Yes | Outcomes for CABG, PCI, and AVR |
| 3. Include standardized patient satisfaction and service measures | Yes | HCAHPS | No | No | ||
| 4. Offer composite measures that are weighted and evidence‐based | No | No | Specialty excellence award, not evidence‐based | No | ||
| 5. Costs comparisons should include patient prices | Yes | Average Medicare payment | Yes | Charges, health plan and Medicare costs available for a fee | No | |
| 6. Adjust outcomes for severity and risk | Yes | Methodology published on website | Yes | Methodology not public | Yes | Various methodologies published or referenced on website |
| 7. Identify differences not due to chance | Yes | Compares mortality to national mean | Yes | Compares mortality or complications to mean | Yes | Compares mortality to national mean |
| 8. Standardize reporting periods | October 2005 to September 2006 | 2004‐2006 | 12‐24 months, ending 12/31/07 or 6/30/08 | |||
| 9. Avoid use of nonvalidated administrative data | Yes | None used | No | Uses PSIs for safety rating | Yes | None used |
| 10. Utilization rates should be evidence‐based | No | Surgical case volume of Medicare patients | No | Includes Caesarian‐section rates | Yes | Some case volume rates are evidence‐based |
2. Include Quality of Life and Outcome Data
Outcomes are more valuable to patients than process measures, but the risk adjustment needed to compare outcomes requires considerable effort. So far, public reporting of risk‐adjusted outcomes has been limited almost exclusively to mortality. Yet a patient contemplating knee replacement surgery would find no meaningful difference in mortalitythere were only 510 deaths nationally in year 200620but might be interested in whether patients return to full mobility after surgery, and all patients should compare rates of nosocomial infections. For some low‐risk procedures, HealthGrades Inc. (Golden, CO) includes a composite measure of major complications, including complication of an orthopedic implant, stroke, cardiac arrest, excessive bleeding, and some types of infection; CMS will soon add rates of infection and readmission.
3. Include Measures of Patient Experience, Such as Satisfaction and Service Measures
Beyond outcomes, patients want to know about the experience of others.21 Satisfaction surveys should be standardized and made disease‐specific, since patients' experiences may differ between the cardiology suite and the delivery unit. Questions could address the attentiveness of the nursing staff, how well privacy was respected, how easy it was to deal with insurance issues, whether patients were promptly informed of test results, and whether the care team answered questions fully. Medicare has begun reporting patient satisfaction using the Hospital Consumer Assessment of Healthcare Providers (HCAHPS) survey on Hospital Compare, but the data are not disease‐specific and audit a very small number of patients from each institution. Other services are unlikely to perform their own surveys, as multiple surveys would prove burdensome. Social networking sites that allow patients to post their own personal reviews of hospitals and doctors offer an additional if less reliable dimension to traditional public reporting. Such sites are already transforming the market for other industries, such as travel.22
4. Offer Composite Measures That Are Weighted and Evidence‐Based
Interpreting multiple measures, some of which are more important than others, and some of which have better evidence than others, is difficult for health care providers and may be impossible for patients. Is it more important to get aspirin on arrival or at discharge? Also, how does a patient weigh a 1% difference in the number of heart attack patients who get aspirin on arrival against a 14% difference in those who are offered smoking cessation? Because patients may be overwhelmed by data,23 public reports should include evidence‐based, weighted measures of overall care for a given condition, with higher weights attached to those process measures most likely to have clinical benefit, and careful attention to visual representations that convey relative differences.19, 23 More sophisticated measures should be developed to guard against overuse. For example, while hospitals should be rewarded for providing vaccination, they should be penalized for vaccinating the same patient twice.
None of the services we examined provides weighted outcomes. Leapfrog (The Leapfrog Group, Washington, DC) offers a composite snapshot containing 9 pie charts, divided into 4 leaps. The 6 pies representing high‐risk procedures are of equal size, even though 2 of these, esophagectomy and pancreatic resection represent very rare surgeries, even at major medical centers. From a visual perspective, however, these are equivalent to having computerized physician order entry and full‐time intensive care unit staffing, which affect thousands more patients. Similarly, in determining pay‐for‐performance measures, CMS created a composite based on the total number of opportunities of all interventions, weighting all measures equally. Because no validated weighting measures exist, future research will be necessary to achieve this goal. Also, none of the evidence‐based measures contained safeguards against overtreatment.
5. Cost Comparisons Should Include Patient Prices
In an era of patient copayments and deductibles, consumers are increasingly aware of costs. For patients with very high deductible plans or no health insurance, hospital fees are a common cause of bankruptcy.24 Several public reporting agencies, including Hospital Compare and HealthGrades have incorporated Medicare costs into their reported measures, but these have little connection to what patients actually pay. Health sites aimed at consumers should publish the average patient copayment.
Recommendations to Ensure That Data Reflects Hospital Quality
6. Adjust Outcomes for Severity and Risk
Not all bypass operations are the same and not all patients are at equal risk. More difficult operations (eg, CABG for a patient with a previous bypass) will have more complications; similarly, patients with serious comorbidities will experience worse outcomes. Since hospitals which specialize in a procedure will attract complicated cases and higher risk patients, it is important to adjust outcomes to account for these differences. Otherwise, hospitals and surgeons may be discouraged from taking difficult cases. Outside of cardiac surgery, most risk adjustment systems use administrative claims data but vary dramatically in the numbers of variables considered and the underlying proprietary models, which are often criticized as being black boxes that yield discordant results.25 Thus, a hospital's mortality may appear below expected by 1 system and above expected by another. Instead, risk adjustment systems should include clinical data abstracted from patient records using standardized data definitions. Although costly to collect, clinical data offer more predictive information than do administrative data. For example, for heart failure patients undergoing CABG, the ejection fraction predicts mortality better than many stable comorbid diagnoses. A single transparent risk‐adjustment system should be recognized as the industry standard. The American College of Surgeons' standardized risk‐adjusted outcome reporting for the National Surgical Quality Improvement Program (NSQIP) is a good example of such an effort.
7. Identify Differences Not Due to Chance
As a result of random variation, during any period, some hospitals will appear better than average and others worse. Statistical tests should be employed to identify hospitals that differ from the mean, and to allow consumers to compare 2 hospitals directly, with appropriate caveats when the hospitals serve very different patient populations. Medicare's mortality rating system for myocardial infarction identifies only 17 hospitals in the nation as better than average and 7 as worse, out of 4,500 institutions. HealthGrades compares hospitals' actual mortality or complication rates to their predicted rates based on disease‐specific logistic regression models and reports whether the hospital is statistically better or worse than predicted. Hospitals are not compared directly to one another. Given the rarity of mortality in most procedures, other outcome measures will be necessary to distinguish among hospitals.26
8. Standardize Reporting Periods
In a world of continuous quality improvement, public reporting should represent a hospital's recent performance, but reporting periods also need to be long enough to provide a stable estimate of infrequent events, especially at low‐volume institutions. In contrast, the lag time between the end of the reporting period and public availability should be kept to a minimum. We found that reporting periods varied from 1 to 3 years, and did not always cover the same years for all conditions, even on the same website. Some data were 3 years old. Patients will have a hard time making decisions on data that is 1 year old, and hospitals will have little incentive to make improvements that will not be acknowledged for years.
9. Avoid Use of Nonvalidated Administrative Data
Administrative data collected for billing purposes, unlike most clinical data, are already in electronic format, and can inexpensively produce quality rankings using validated models.27 In contrast, screening tools, such as the Agency for Healthcare Research and Quality's patient safety indicators (PSIs), were designed to identify potential quality problems, such as postoperative deep vein thrombosis, for internal quality improvement. Cases identified by the PSI software require additional chart review,28, 29 and should not be used as quality indicators. Even so, HealthGrades reports PSIs and some insurers use them in pay‐for‐performance initiatives. Improvements in PSIs, including present‐on‐admission coding, may increase accuracy,30 but these measures need to be validated before they can be adopted for public reporting.
10. Utilization Rates Should Be Evidence‐Based
Although utilization rates for most procedures vary as much as 2‐fold by state or institution, there is little evidence for a best rate. Nevertheless, HealthGrades reports utilization rates for several obstetrical procedures. At present, there are no standards for these, and it is possible that utilization could be too low in some places. Further research is needed; until then, utilization should not purport to measure quality.
Discussion
The growing commitment to making hospital performance data public could transform the quality and safety of care in the US, introducing competition on quality and price and fostering informed consumer choice. To date, the promise of public reporting remains only partially fulfilled. Few hospitals have done more than comply with regulatory mandates and payer incentives, and consumers have failed to respond. To capture the full benefits of public reporting, we have made 10 recommendations to benefit patients and better engage hospitals. We suggest that reporting be patient‐centered, with an emphasis on making the data useful, meaningful, important, interpretable, and relevant. At the same time, hospitals, which are being judged on their performance, should have a level playing field, with measures that are timely, consistent, severity‐adjusted, evidence‐based, and which foster good clinical care. Of the 3 services we examined, Hospital Compare came closest to meeting these recommendations.
Although this blueprint for public reporting is easy to draft, it is challenging to implement. In particular, some of our suggestions, such as the one regarding risk adjustment, may not currently be feasible, because the complexity and cost of collecting clinical data, even in the era of electronic medical records, may be prohibitive. Until such data are readily available, it may be preferable to report nothing at all, rather than report data that are misleading. In the rush to make hospitals accountable, enthusiasm has often outstripped science,31 and several measures have had to be revised for unintended consequences.32
Any initiative to improve public reporting should have the buy‐in of all stakeholders, but particularly hospitals, which stand to benefit in several ways. By receiving regular feedback, they can focus on improving care, becoming better organizations. These improvements may be rewarded through direct compensation (pay‐for‐performance), decreased costs from complications, or increased market share. Hospitals will be more engaged if the data reflect actual quality, are adequately adjusted for severity, and acknowledge the role of chance. Otherwise, they will merely comply, or worse, look for opportunities to game the system. To succeed, public reporting needs to involve hospitals in establishing standards for reporting and validation, as well as auditing procedures to prevent fraud.33 The Hospital Quality Alliance (HQA, Washington, DC), a first step in this direction, at present has few measures. NSQIP (American College of Surgeons, Chicago, IL) is perhaps a better example of hospitals cooperating to set measurement standards to promote best‐practices. Public release of NSQIP data might accelerate progress. Alternatively, the National Quality Forum (NQF, Washington, DC) could expand its role from endorsing quality measures to include standardizing the way these measures are used in public reporting.
Still, if you build it, will they come? To date, public reporting has not been embraced by the public, despite its stated interest in the information. Several explanations could be offered. First, we may be presenting the wrong data. Process measures and mortality rates are important but represent abstract concepts for most patients. Surveys tell us that patients value most the experiences of other patients.14, 21 They want to know whether their pain will be controlled, whether the doctor will listen to them, whether the nurse will come when they call. The recent advent of the HCAHPS survey (AHRQ, Washington, DC) is another positive step. Stratifying the results by diagnosis and adding a few diagnosis‐specific questions would make HCAHPS even more valuable. Second, the data may not be readily available. Although most public reporting is done on the web, older patients who are deciding about hospitals may not have Internet access. Some reports are still proprietary, and cost could present another obstacle. Finally, even if freely‐available and patient‐centered, the results may not be interpretable by physicians, let alone patients.34
If public reporting is to succeed, it will require measures that better reflect patients' concerns. In order to collect the massive amounts of data required and present them in a timely fashion, better electronic record systems will be necessary. But these are no panacea; others have noted that the Department of Veterans Affairs, a leader in electronic records, still invests considerable time and money to review charts for NSQIP.35 Given the value that Americans place on transparency in other facets of their lives, it is clear that public reporting is here to stay. While much progress has been made over the past 5 years, additional research is needed to better measure quality from the patient's perspective, and to determine how this information can be used to help guide decision‐making, and to reward hospitals for offering the highest‐quality care.
Acknowledgements
The authors thank Kenneth Flax for his help with an earlier version of this manuscript.
- Committee on Quality of Health Care in America IoM.Crossing the Quality Chasm: A New Health System for the 21st Century.Washington, DC:National Academy Press;2001.
- ,,,.Care in U.S. hospitals: the Hospital Quality Alliance program.N Engl J Med.2005;353(3):265–274.
- .Achieving and sustaining improved quality: lessons from New York state and cardiac surgery.Health Aff. 20022002;21(4):40–51.
- ,,,,.Systematic review: the evidence that publishing patient care performance data improves quality of care.Ann Intern Med.2008;148(2):111–123.
- ,,.Hospital performance reports: impact on quality, market share, and reputation.Health Aff (Millwood).2005;24(4):1150–1160.
- ,,.Does publicizing hospital performance stimulate quality improvement efforts?Health Aff (Millwood).2003;22(2):84–94.
- ,,,,.Improving the outcomes of coronary artery bypass surgery in New York State.JAMA.1994;271(10):761–766.
- ,,.Declines in hospital mortality associated with a regional initiative to measure hospital performance.Am J Med Qual.1997;12(2):103–112.
- ,,, et al.Public reporting and pay for performance in hospital quality improvement.N Engl J Med.2007;356(5):486–496.
- ,,,,,.Do quality report cards play a role in HMOs' contracting practices? Evidence from New York State.Health Serv Res.2000;35(1 Pt 2):319–332.
- ,,,.Quality of cardiac surgeons and managed care contracting practices.Health Serv Res.2002;37(5):1129–1144.
- ,,,,,.Using performance data to identify preferred hospitals.Health Serv Res.2007;42(6 Pt 1):2109–2119; discussion 2294–2323.
- ,.Use of public performance reports: a survey of patients undergoing cardiac surgery.JAMA.1998;279(20):1638–1642.
- ,,.How do elderly patients decide where to go for major surgery? Telephone interview survey.BMJ.2005;331(7520):821.
- ,,,,,.The effect of publicly reporting hospital performance on market share and risk‐adjusted mortality at high‐mortality hospitals.Med Care.2003;41(6):729–740.
- ,.The predictive accuracy of the New York State coronary artery bypass surgery report‐card system.Health Aff (Millwood).2006;25(3):844–855.
- ,.Publicly disclosed information about the quality of health care: response of the US public.Qual Saf Health Care.2001;10(2):96–103.
- ,,,,.Choosing the best hospital: the limitations of public reporting of hospital quality.Health Aff (Millwood).2008;27(6):1680–1687.
- ,.Will quality report cards help consumers?Health Aff (Millwood).1997;16(3):218–228.
- Agency for Healthcare Research and Quality. HCUPnet, Healthcare Cost and Utilization Project. Available at: http://hcupnet.ahrq.gov. Accessed January 2009.
- ,,.Recovering from cardiac surgery: what patients want you to know.Am J Crit Care.2002;11(4):333–343.
- Trip Advisor. Available at: http://www.tripadvisor.com. Accessed January 2009.
- ,,,,.Less is more in presenting quality information to consumers.Med Care Res Rev.2007;64(2):169–190.
- ,,,.MarketWatch: illness and injury as contributors to bankruptcy.Health Aff (Millwood)2005;(Suppl Web Exclusives):W5‐63–W5‐73.
- .The Lake Wobegon effect: when all the patients are sicker.Am J Med Qual.2006;21(6):365–366.
- ,,.Surgical mortality as an indicator of hospital quality: the problem with small sample size.JAMA.2004;292(7):847–851.
- ,,, et al.An administrative claims model suitable for profiling hospital performance based on 30‐day mortality rates among patients with heart failure.Circulation.2006;113(13):1693–1701.
- ,,,.Can administrative data be used to compare postoperative complication rates across hospitals?Med Care.2002;40(10):856–867.
- ,,,,.Impact of diagnosis‐timing indicators on measures of safety, comorbidity, and case mix groupings from administrative data sources.Med Care.2007;45(8):781–788.
- ,,,,.Do the AHRQ patient safety indicators flag conditions that are present at the time of hospital admission?Med Care.2008;46(5):516–522.
- ,,.The tension between needing to improve care and knowing how to do it.N Engl J Med.2007;357(6):608–613.
- ,,,.Public reporting of antibiotic timing in patients with pneumonia: lessons from a flawed performance measure.Ann Intern Med.2008;149(1):29–32.
- ,,.The GAAP in quality measurement and reporting.JAMA.2007;298(15):1800–1802.
- ,,,.Consumer competencies and the use of comparative quality information: it isn't just about literacy.Med Care Res Rev.2007;64(4):379–394.
- .Performance measurement in search of a path.N Engl J Med.2007;356(9):951–953.
Copyright © 2009 Society of Hospital Medicine

Physician Attitudes and Use of Computerized Order Entry
It is widely acknowledged that the U.S. health care system is plagued by error and inefficiency and that these factors contribute to as many as 44,000‐98,000 deaths each year in U.S. hospitals. In To Err Is Human: Building a Safer Health System, the Institute of Medicine1 outlined the critical role that information technology can play in improving patient safety and highlighted computerized physician order entry (CPOE) systems for their potential to reduce the frequency of medication errors and to improve the quality of medical care.
Computerized physician order entry systems are specialized software applications that allow physicians to place orders directly into a computer. This process has a number of potential advantages over traditional handwritten ordering, including the ability to structure the ordering process to ensure the completeness of individual orders, to provide clinical decision support through diagnosis‐based order sets, and to automatically check orders for potential drugallergy, drugdrug, and drugfood interactions.2 Finally, entering orders directly into a computer eliminates the problem of transcription‐related errors that stem from the difficulty of interpreting handwriting. In clinical trials, the introduction of CPOE has been shown to reduce the frequency of medication errors, to improve the use of preventive services, and to reduce costs.36 Recognition of the benefits of these systems has not been confined to the medical community. The Leapfrog Organization, a coalition of large businesses in the United States, has chosen CPOE as one of its 3 initial safety leaps and has established a threshold that 70% of medication orders should be entered directly by physicians.7
Although the benefits of CPOE systems are widely recognized, few hospitals have implemented these systems successfully.8, 9 Those that have, have often developed the applications internally, and many have relied on house staff to do most or all of the actual ordering.10 However, most hospitals do not have the expertise for internal development and instead rely on commercially available products. Moreover, most patients hospitalized in the United States are cared for by attending physicians working without the assistance of house staff.11 In light of the importance of successfully implementing CPOE systems in such settings, we assessed the adoption of CPOE by attending physicians at 2 community hospitals where its use was voluntary and examined the characteristics and attitudes associated with use of the system to place orders.
METHODS
Setting and Participants
Baystate Medical Center is a 600‐bed teaching hospital in Springfield, Massachusetts, where approximately 50% of patients are cared for with the assistance of house staff. Franklin Medical Center is a 125‐bed community hospital in rural Greenfield, Massachusetts, and is not a house staff training site. Medical staff membership at the 2 hospitals is largely voluntary. Both institutions share a vendor‐supplied computerized order entry system that was implemented in the early 1990s (E7000, Eclipsys Corporation, Boca Raton, FL). The system provides a structured format for the creation of medication, laboratory, and radiology orders and contains thousands of preconstructed medication order sentences and hundreds of order sets designed to standardize ordering for common diagnoses and procedures. Pharmacists are alerted of potential drugallergy and drugdrug interactions and use clinical judgment about whether to communicate this information to the physician. Although the house staff at Baystate Medical Center is mandated to place orders in the system, attending physicians have no such requirement at either institution. Access to the system is provided though the many fixed workstations located on nursing units, in operating rooms, and in the health sciences library. On a typical medical‐surgical patient care unit most computers are behind the nurses' station, though some are distributed along hallways and in physician charting rooms. No computers are in patient rooms. Although the number varies slightly across units, the average ratio of computers to patient beds is roughly 1 to 1.
Survey
In June 2003 we mailed a 20‐item survey to attending physicians who had been responsible for a minimum of 25 orders during the preceding month at either Baystate or Franklin Medical Center. Orders counted toward this minimum if they had been written, given verbally in person or by phone, or entered directly into the computer by the physician. The survey consisted of 20 questions focused on the topic of computerized order entry. In addition to collecting information about sex and specialty, we asked respondents to describe their use of CPOE during training, their use of computers at home, and, where applicable, their use of computers in their outpatient practices. The survey included questions about how often respondents used the order entry system when caring for hospitalized patients and which features of the system they used. To assess physician attitudes about the order entry process, we asked respondents to consider whether it was faster to place orders directly into the system than it was by handwriting them, whether orders placed in the system were carried out more rapidly, whether placing orders in the system led to fewer medication and other errors, whether order sets were important for the efficient use of the system, whether order sets helped to ensure that important aspects of care did not slip through the cracks, whether the system's user interface supported their work flow, and whether the encouragement of nurses was an important factor in their use of the system. Questions that assessed physician attitudes were presented on a 5‐point Likert scale. Nonrespondents were sent reminder letters along with duplicate surveys twice, approximately 1 and 2 months after the initial mailing. No financial incentive was offered for participation. The study protocol was approved by the Institutional Review Board of Baystate Health System.
Order Entry Rates
Regardless of whether an order is placed directly by a physician into a computer, given verbally, or handwritten, all orders are ultimately entered into the CPOE system. Working with our hospitals' Departments of Information Services, we developed a report that provided physician‐specific information about order entry patterns. For each physician in the study, we determined the total number of orders generated during the month preceding the initial June mailing, as well as the absolute number and percentage of orders of each of the following categories: directly entered, telephone, verbal, and written. Because verbal and telephone orders are required during urgent situations and when physicians give orders from outside the hospital, we calculated and report an adjusted order entry rate as the total number of orders placed directly into the system divided by the sum of the orders entered directly and the number of written orders.
Analysis
Summary statistics for the overall sample were constructed using simple frequencies and proportions for categorical variables and medians and interquartile ranges for continuous variables. We compared characteristics of respondents from the 2 hospitals using chi‐square tests of association for categorical factors and Wilcoxon rank‐sum tests for continuous scale data. We compared the total number of orders placed during the study month and the order entry rates of responders and nonresponders using the Wilcoxon rank‐sum test. We categorized physicians as low (20%), intermediate (21%‐79%), and high (80%) users of the system based on their calculated order entry rate. Responses to each of the attitude questions in the survey were tabulated, and the responses strongly agree and agree were combined for analyses comparing responses. Demographic variables and physician attitudes were tested for associations with order entry rate categories via the Pearson chi‐square for categorical factors, the Mantel‐Haenszel chi‐square for ordered factors, and Kruskal‐Wallis analysis of variance for continuous variables. Initial analyses were stratified by hospital; where no differences in association were found across strata, the data were combined. Statistical tests were performed using SAS version 9.1 (SAS Institute, Cary, NC)
RESULTS
During the study period the target group of physicians placed a total of 135,692 orders, of which 69,654 (51%) were placed directly into the CPOE system, 38,878 (29%) were made using pen and paper, 7,208 (5%) were made verbally, and 19,952 (15%) were placed by telephone. Three hundred and fifty‐six (71%) of the 502 surveys sent out to physicians at the 2 hospitals were returned. Thirteen surveys were excluded from analysis because the respondent was not a physician, and 2 because we were unable to match the survey to system usage data, leaving a total of 341 surveys for analysis. Order entry rates were not computed for an additional 3 physicians who only placed verbal and telephone orders during the study period. Response rates did not differ by clinician specialty (P = .53); compared to those of nonresponders, respondents had a similar median total number of orders (111 vs. 101, P = .67) and a higher median order entry rate (66% vs. 48%, P = .03).
Characteristics of Respondents
Seventy‐two percent of physicians who completed the survey were men; half had graduated from medical school at least 20 years ago, and the median duration of practice at the study institution was 11 years (Table 1). Forty percent practiced internal medicine, 18% were surgeons, and 16% were pediatricians. Thirty‐five percent completed training at an institution that had computerized physician order entry, and 86% cared for patients primarily at Baystate Medical Center. More than half reported they used the system many times each day for patient care, and the features they used most commonly were retrieval of results (95%), placing of orders (78%), and viewing and printing of patient lists (75%). Among those with outpatient practices, 81% used computers in their outpatient practice, and more than half used computers for personal activities at home at least once a day. On average, respondents from Franklin Medical Center had graduated from medical school farther in the past and reported less reliance on the system to carry out all activities other than viewing results.
| Overall n (%) | Baystate n (%) 293 (85.9) | Franklin n (%) 48 (14.1) | Chi square P value | |
|---|---|---|---|---|
| ||||
| Sex | .64 | |||
| Male | 244 (71.6) | 211 (72.0) | 33 (68.8) | |
| Specialty | .24 | |||
| Anesthesia | 23 (6.7) | 23 (7.9) | 0 (0.0) | |
| Internal medicine | 135 (39.6) | 112 (38.2) | 23 (47.9) | |
| Medicine/pediatrics | 13 (3.8) | 6 (2.0) | 7 (14.6) | |
| OB/GYN | 36 (10.6) | 30 (10.2) | 6 (12.5) | |
| Pediatrics | 54 (15.8) | 51 (17.4) | 3 (6.3) | |
| Surgery | 61 (17.9) | 55 (18.8) | 6 (12.5) | |
| Other | 19 (5.6) | 16 (5.5) | 3 (6.3) | |
| Use of CPOE systema | .09 | |||
| Many times a day | 176 (52.2) | 160 (55.0) | 16 (34.8) | |
| At least once a day | 77 (22.9) | 61 (21.0) | 16 (34.8) | |
| A few times a week | 55 (16.3) | 45 (15.5) | 10 (21.7) | |
| Once a week or less | 29 (8.6) | 25 (8.6) | 4 (8.7) | |
| Features useda | ||||
| Viewing and printing patient lists | 254 (75.2) | 212 (72.6) | 42 (91.3) | .01 |
| Looking up results | 320 (94.7) | 277 (94.9) | 43 (93.5) | .70 |
| Viewing current medications | 218 (64.5) | 204 (69.9) | 14 (30.4) | < .01 |
| Placing orders | 263 (77.8) | 244 (83.6) | 19 (41.3) | < .01 |
| Entering discharge summaries | 72 (21.3) | 70 (24.0) | 2 (4.4) | < .01 |
| Use of order setsa | ||||
| Rarely or never | 98 (29.0) | 74 (25.3) | 24 (52.2) | < .01 |
| Minority of patients | 92 (27.2) | 78 (26.7) | 14 (30.4) | |
| Majority of patients | 104 (30.8) | 97 (33.2) | 7 (15.2) | |
| For all or nearly all patients | 44 (13.0) | 43 (14.7) | 1 (2.2) | |
| Percentage of orders placed using order setsa | < .01 | |||
| None | 46 (13.7) | 26 (9.0) | 20 (44.4) | |
| 1%‐25% | 62 (18.5) | 50 (17.2) | 12 (26.7) | |
| 26%‐50% | 29 (8.7) | 23 (7.9) | 6 (13.3) | |
| 51%‐75% | 45 (13.4) | 43 (14.9) | 2 (4.4) | |
| 76%‐99% | 103 (30.8) | 98 (33.8) | 5 (11.1) | |
| All | 50 (14.9) | 50 (17.2) | 0 (0.0) | |
| Use of computer in outpatient practiceab | 243 (81.3) | 206 (80.8) | 37 (84.1) | .60 |
| Personal computer usea | .47 | |||
| At least once a day | 209 (61.7) | 185 (63.4) | 24 (51.1) | |
| Several times a week | 84 (24.8) | 67 (23.0) | 17 (36.2) | |
| A few times a month | 21 (6.2) | 18 (6.2) | 3 (6.4) | |
| Rarely | 25 (7.4) | 22 (7.5) | 3 (6.4) | |
| Training at an institution that had CPOE | 117 (34.7) | 105 (36.1) | 12 (26.1) | 0.19 |
| Use of system to enter orders should be mandatorya | ||||
| Yes | 113 (35.2) | 106 (38.4) | 7 (15.6) | <.01 |
| Median (IQR) | Median (IQR) | Median (IQR) | WilcoxonPvalue | |
| Years since medical school graduationa | 20 (13, 26) | 20 (13, 26) | 24 (17, 28) | .02 |
| Years in practice at study institutiona | 11 (5, 18) | 11 (5, 18) | 13 (7, 19) | .39 |
| Orders directly enteredc | 23 (2, 99) | 27 (5, 108) | 1 (0, 27) | < .01 |
| Orders placed by telephonec | 14 (5, 49) | 12 (3, 38) | 49.5 (16, 123.5) | < .01 |
| Orders placed verballyc | 2 (0, 11) | 3 (0, 13) | 1 (0,3) | < .01 |
| Orders placed in writingc | 21 (4, 73) | 14 (3, 45) | 220 (106.5, 391) | < .01 |
| CPOE ratebc | 66% (3%, 94%) | 76% (19%, 96%) | 0.25% (0%, 17%) | < .01 |
Attitudes Toward Computerized Physician Order Entry
Physicians who completed the survey offered diverse opinions about the impact of computerized order entry on work flow, patient safety, and quality of care. Only 22% believed the system's user interface supported their work flow (Q7), 34% believed it was faster to enter orders directly into the system than to handwrite them (Q1), and 41% believed orders placed into the system were carried out more rapidly (Q2) (Table 2). On the other hand, 63% of respondents believed that placing orders directly into the system led to fewer medication errors (Q3), and 51% stated the system generally reduced medical errors (Q4). Sixty‐nine percent stated order sets were important for efficient use of the system (Q5), and 71% believed order sets served an important decision support role (Q6). Twenty‐six percent stated that the encouragement of nurses was an important factor in their use of the system (Q8). Finally, 35% of attending physicians believed use of the system to place orders should be mandatory.
Characteristics and Attitudes of High, Intermediate, and Low Users
The median order entry rate of respondents was 66%. One hundred and forty‐one (42%) placed at least 80% of their orders directly into the system, whereas 109 (32%) placed no more than 20% of their orders directly in the system (Fig. 1). There was not a significant difference between the low, intermediate, and high use groups in the total number of orders that each physician placed during the study period (Table 3). Sex, years since graduation from medical school, years in practice at the study institution, and use of computers in the outpatient setting were not meaningfully different between the 3 categories of users (Table 3). On the other hand, medical specialty was strongly associated with use of the system, with anesthesiologists, pediatricians, and surgeons the specialties with the largest proportion of high users. Furthermore, physicians who were trained in a CPOE environment and those who reported daily use of computers for personal activities showed the highest levels of adoption. Physicians at Franklin Medical Center showed lower levels of order entry than their counterparts at Baystate.
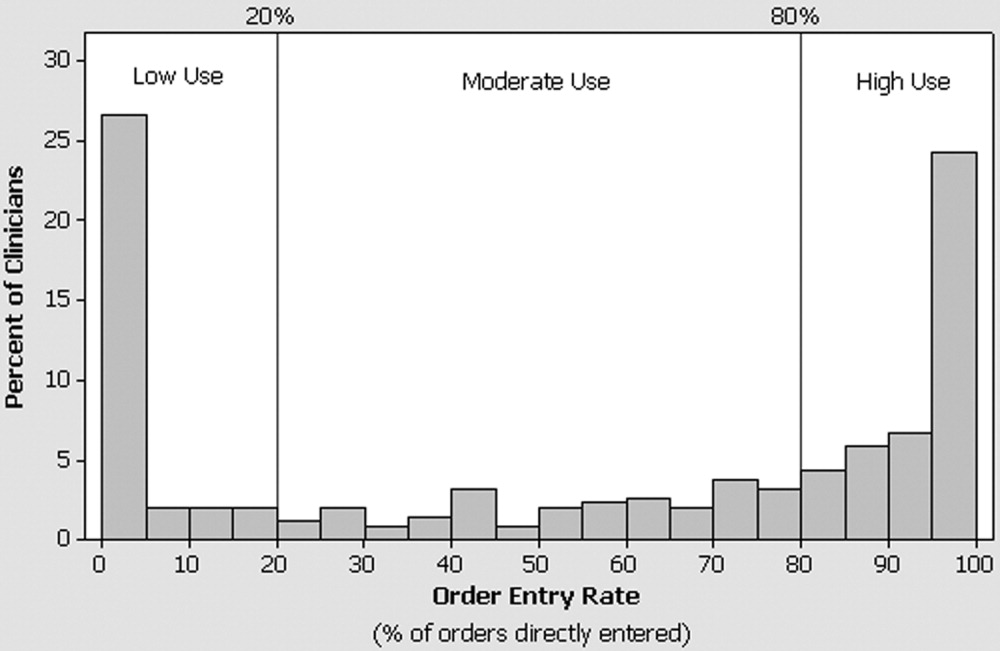
| Low (20%) n (row %) | Intermediate (20%‐79%) n (row %) | High (80%) n (row %) | P value | |
|---|---|---|---|---|
| ||||
| n = 109 | n = 88 | n = 141 | ||
| Hospital | < .01c | |||
| Baystate | 73 (25) | 79 (27) | 138 (48) | |
| Franklin | 36 (75) | 9 (19) | 3 (6) | |
| Sex | .69c | |||
| Female | 28 (29) | 24 (25) | 43 (45) | |
| Male | 81 (33) | 64 (26) | 98 (40) | |
| Specialty | .0001c | |||
| Anesthesia | 8 (35) | 3 (13) | 12 (52) | |
| Internal medicine | 45 (33) | 37 (27) | 53 (39) | |
| Medicine/pediatrics | 6 (46) | 5 (38) | 2 (15) | |
| OB/GYN | 20 (56) | 12 (33) | 4 (11) | |
| Pediatrics | 13 (24) | 9 (17) | 32 (59) | |
| Surgery | 14 (23) | 21 (34) | 26 (43) | |
| Other | 3 (19) | 1 (6) | 12 (75) | |
| Do you use a computer in your outpatient practice?a | ||||
| Yes | 75 (31) | 61 (25) | 105 (44) | .22c |
| No | 20 (36) | 18 (33) | 17 (31) | |
| Level of personal computer useb | .045d | |||
| Rarely | 11 (44) | 8 (32) | 6 (24) | |
| A few times a month | 7 (33) | 4 (19) | 10 (48) | |
| Several times a week | 28 (35) | 25 (31) | 28 (35) | |
| At least once a day | 62 (30) | 50 (24) | 97 (46) | |
| Training at an institution that had CPOE | .037c | |||
| Yes | 30 (26) | 40 (34) | 46 (40) | |
| No | 76 (35) | 48 (22) | 94 (43) | |
| Median (IQR) | Median (IQR) | Median (IQR) | ||
| Years since graduation from medical school | 21 (16, 28) | 18 (14, 25) | 19 (12, 25) | .06e |
| Years in practice at study institution | 12 (5, 19) | 12 (6, 19) | 12 (6, 17) | .84e |
| Total number of orders placed | 112 (45, 306) | 105 (56, 254) | 113 (44, 382) | .92e |
Use of the system was highly associated with physician attitudes toward CPOE, with the views of intermediate and high users consistently different than those of low users (Fig. 2). The associations found held true regardless of hospital: low, intermediate, and high users from Franklin had similar responses to those from Baystate (P > .05 for all questions), and the data from the 2 hospitals therefore were combined for presentation. Although few physicians believed that the user interface of the system supported their work flow, high and intermediate users were 3 times as likely to share this view than were low users (Q7; Fig. 2). Similarly, 19% of low users, 31% of intermediate users, and 45% of high users believed that entering orders into the system was faster than writing orders (Q1). High and intermediate users of the system were more likely than low users to believe that orders entered into the system were carried out more rapidly (Q2) and led to fewer medication (Q3) and nonmedication (Q4) errors. Regardless of their utilization pattern, most physicians believed that order sets played an important role in promoting efficiency and quality.
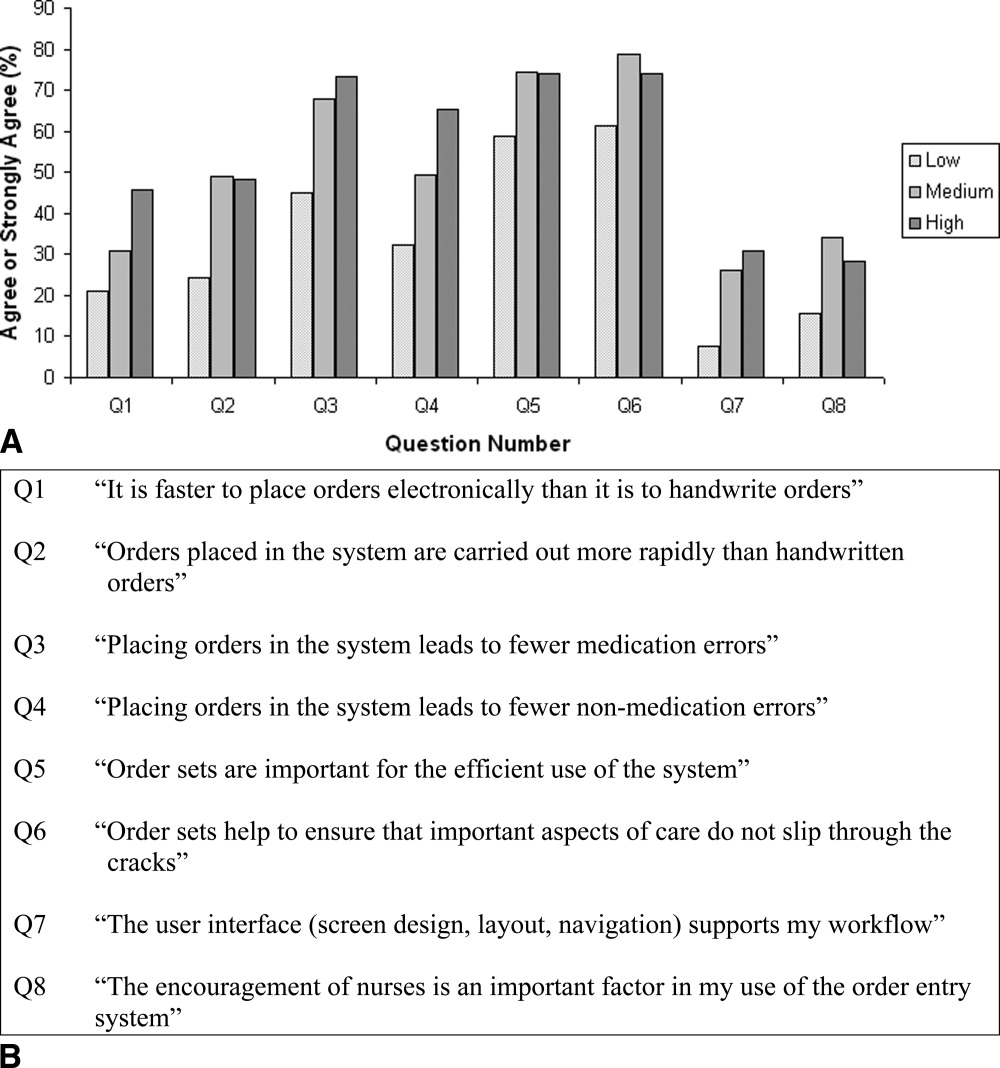
DISCUSSION
In this study of the clinical computing practices of physicians at 2 community hospitals, we observed wide variation in the adoption of CPOE by individual attendings. Although roughly one‐third rarely placed orders directly into the system, 42% had an order entry rate of at least 80%. Contrary to our initial expectation, we found little association between a physician's order entry rate with years in practice, duration of exposure to CPOE, or use of computers in the outpatient setting. On the other hand, we observed marked differences in use of the CPOE system across specialty lines and found that physicians who were exposed to CPOE during training and those who were regular users of computers for personal activities were more likely to embrace this technology. Further, we observed important differences between physicians who used the system to place some or most of their orders and those who did so only rarely in their beliefs and attitudes about the impact and benefits of CPOE. Physicians with higher order entry rates were more likely than their colleagues to believe that placing orders electronically was faster than handwriting and that use of the system led to fewer medical errors. These findings should be encouraging to hospitals hoping to implement CPOE because they suggest that successful adoption of CPOE is not limited to physicians who have just completed their residencies or to hospitals with the capability of designing and building their own systems. On the contrary, we documented that women, older physicians, and those with limited CPOE experience were as likely to be frequent users, especially if they perceived CPOE to be safer than handwriting and if they believed the user interface supported the efficient entering of orders.
On the basis of these results we recommend that in addition to purchasing systems that meet physician work‐flow needs and support the efficient entry of orders, hospital leaders should emphasize the quality and safety benefits of CPOE as part of a comprehensive change management strategy. The differences we observed in order entry rates across specialties may have resulted from several factors, including inherent differences in personality type associated with choice of specialty and in the level of customization of a system reflected in which and how many order sets are included. Such findings suggest that when it comes to CPOE, one size does not fit all, and implementation planning should be carried out at the specialty level. Finally, our observation that physicians who had exposure to CPOE during training were more likely to use the system to place orders suggests that the nation's training institutions will play an important role in fostering universal adoption of this technology.
Several earlier studies have reported on physician experiences with CPOE systems. Murff and Kannry12 surveyed 94 internal medicine house staff to compare experiences with 2 CPOE systems: the Department of Veterans Affairs Computerized Patient Record System (CPRS) and a commercially available product. They found striking differences in user satisfaction with numerous aspects of the systems, however they did not address attitudes toward safety or quality, and because house staff were required to place orders electronically they were unable to correlate responses with actual usage patterns. Weiner et al.13 compared the opinions of internal medicine house staff, attendings, fellows, and nurses about the benefits and challenges of using a computerized provider order entry system. In contrast to the findings from our study, Weiner et al. reported that more than half of physicians believed that provider order entry led to a greater number of errors, and only a minority believed the system increased quality of care overall. Finally, Lee et al.14 surveyed medical and surgical house officers and nurses at a large academic medical center about their satisfaction with a locally developed order entry system. They found that attitudes about the impact of the system on productivity and ease of use were more strongly associated with overall satisfaction than having undergone training or experience with personal computers. These findings are congruous with our own observation that beliefs about the speed with which orders are placed are closely associated with actual use of the system. They reported, as have we, that physicians placed a high value on order sets.
Our study had a number of strengths. First, we were able to offer insight into the attitudes and behaviors of a previously neglected, but critically important groupattending physicians who care for patients at community hospitals without the assistance of house staff. Second, whereas previous studies primarily assessed physician satisfaction with CPOE, we explored how physician attitudes about the impact of CPOE on work flow and on safety were associated with actual ordering habits. Information about ordering was obtained directly from the order entry system and not through self‐report. We conducted the study at 2 hospitals, a large urban community teaching hospital and a smaller rural hospital, and focused on a CPOE system that is in use at many institutions throughout the country, thereby increasing the generalizability of our findings. Although adoption of the system by physicians at the 2 hospitals differed, factors that associated with the use of CPOE to place orders were similar. Finally, we surveyed a large number of physicians, had a high response rate, and found only small differences in the utilization patterns of responders and nonresponders, suggesting that our portrayal of the attitudes of physicians was representative of the views of physicians practicing in our community.
The study had a number of weaknesses. First, we cannot be sure whether preexisting beliefs about the benefits of CPOE directly influenced physicians' use of the system or, conversely, if these attitudes developed in response to experience as users. Nevertheless, it seems practical to suggest that hospitals focus on purchasing systems that support the efficient entering of orders while simultaneously adopting a communication and change management strategy that emphasizes the safety and quality benefits of CPOE more broadly. Second, we did not attempt to validate the opinions expressed by physicians about the usability or safety benefits of the system. That said, the purpose of the study was to determine whether physician attitudes toward these issues was associated with the use of the system to place orders. Whether or not this particular CPOE system actually prevented medication errors, most physicians believed it did, a belief strongly associated with the observed order entry rates. Third, we studied a single CPOE system implemented approximately 10 years ago that does not reflect state‐of‐the‐art user interface design or functionality. Nevertheless, our observation about the importance of the user experience is probably no less relevant today. Fourth, we were unable to ascertain every order given by physicians, as some so‐called MD to RN orders may never have made it into the system. Finally, there is a small risk that some written, telephone, and verbal orders may have been randomly or systematically assigned to incorrect physicians, which would have led us to calculate inaccurate utilization rates.
CONCLUSIONS
In a voluntary community hospital environment the adoption of CPOE by attending physicians varies widely. While placing a premium on the purchase of systems that meet the work‐flow needs of physicians and support the efficient entry of orders, hospital leaders can enhance physician adoption of this technology by communicating the role of CPOE in improving quality and safety.
Acknowledgements
The authors thank Gilad Kuperman, MD, PhD, for his thoughtful comments on an earlier version of the manuscript.
- Kohn LT,Corrigan JM,Donaldson MS, eds.To Err Is Human: Building a Safer Health System.Washington, DC:National Academy Press,2000.
- ,.Computer physician order entry: benefits, costs, and issues.Ann Intern Med.2003;139:31–39.
- ,,, et al.Effect of computerized physician order entry and a team intervention on prevention of serious medication errors.JAMA.1998;280:1311–1316.
- ,,,,,.A computerized reminder system to increase the use of preventive care for hospitalized patients.N Engl J Med.2001;345:965–970.
- ,,,.A randomized trial of “corollary orders” to prevent errors of omission.J Am Med Inform Assoc.1997;4:364–375.
- ,,, et al.A computer‐assisted management program for antibiotics and other antiinfective agents.N Engl J Med.1998;338:232–238.
- The Leapfrog Group. Patient Safety Fact Sheet. Available at: http://www.leapfroggroup.org/FactSheets/LF_FactSheet.pdf. Accessed October 6,2004.
- ,,,.Computerized physician order entry in U.S. hospitals: results of a 2002 survey.J Am Med Inform Assoc.2004;11:95–99.
- ,,.U.S. adoption of computerized physician order entry systems.Health Aff.2005;24:1654–1663.
- ,,.Effects of computerized physician order entry and clinical decision support systems on medication safety: a systematic review.Arch Intern Med.2003;163:1409–1416.
- HCUPnet, Healthcare Cost and Utilization Project. Agency for Healthcare Research and Quality, Rockville, MD. Available at: http://www.ahrq.gov/data/hcup/hcupnet.htm. Accessed October 6,2004.
- ,.Physician satisfaction with two order entry systems.J Am Med Inform Assoc.2001;8:499–509.
- ,,, et al.Contrasting views of physicians and nurses about an inpatient computer‐based provider order‐entry system.J Am Med Inform Assoc.1999;6:234–244.
- ,,,.Implementation of physician order entry: user satisfaction and self‐reported usage patterns.J Am Med Inform Assoc.1996;3:42–55.
It is widely acknowledged that the U.S. health care system is plagued by error and inefficiency and that these factors contribute to as many as 44,000‐98,000 deaths each year in U.S. hospitals. In To Err Is Human: Building a Safer Health System, the Institute of Medicine1 outlined the critical role that information technology can play in improving patient safety and highlighted computerized physician order entry (CPOE) systems for their potential to reduce the frequency of medication errors and to improve the quality of medical care.
Computerized physician order entry systems are specialized software applications that allow physicians to place orders directly into a computer. This process has a number of potential advantages over traditional handwritten ordering, including the ability to structure the ordering process to ensure the completeness of individual orders, to provide clinical decision support through diagnosis‐based order sets, and to automatically check orders for potential drugallergy, drugdrug, and drugfood interactions.2 Finally, entering orders directly into a computer eliminates the problem of transcription‐related errors that stem from the difficulty of interpreting handwriting. In clinical trials, the introduction of CPOE has been shown to reduce the frequency of medication errors, to improve the use of preventive services, and to reduce costs.36 Recognition of the benefits of these systems has not been confined to the medical community. The Leapfrog Organization, a coalition of large businesses in the United States, has chosen CPOE as one of its 3 initial safety leaps and has established a threshold that 70% of medication orders should be entered directly by physicians.7
Although the benefits of CPOE systems are widely recognized, few hospitals have implemented these systems successfully.8, 9 Those that have, have often developed the applications internally, and many have relied on house staff to do most or all of the actual ordering.10 However, most hospitals do not have the expertise for internal development and instead rely on commercially available products. Moreover, most patients hospitalized in the United States are cared for by attending physicians working without the assistance of house staff.11 In light of the importance of successfully implementing CPOE systems in such settings, we assessed the adoption of CPOE by attending physicians at 2 community hospitals where its use was voluntary and examined the characteristics and attitudes associated with use of the system to place orders.
METHODS
Setting and Participants
Baystate Medical Center is a 600‐bed teaching hospital in Springfield, Massachusetts, where approximately 50% of patients are cared for with the assistance of house staff. Franklin Medical Center is a 125‐bed community hospital in rural Greenfield, Massachusetts, and is not a house staff training site. Medical staff membership at the 2 hospitals is largely voluntary. Both institutions share a vendor‐supplied computerized order entry system that was implemented in the early 1990s (E7000, Eclipsys Corporation, Boca Raton, FL). The system provides a structured format for the creation of medication, laboratory, and radiology orders and contains thousands of preconstructed medication order sentences and hundreds of order sets designed to standardize ordering for common diagnoses and procedures. Pharmacists are alerted of potential drugallergy and drugdrug interactions and use clinical judgment about whether to communicate this information to the physician. Although the house staff at Baystate Medical Center is mandated to place orders in the system, attending physicians have no such requirement at either institution. Access to the system is provided though the many fixed workstations located on nursing units, in operating rooms, and in the health sciences library. On a typical medical‐surgical patient care unit most computers are behind the nurses' station, though some are distributed along hallways and in physician charting rooms. No computers are in patient rooms. Although the number varies slightly across units, the average ratio of computers to patient beds is roughly 1 to 1.
Survey
In June 2003 we mailed a 20‐item survey to attending physicians who had been responsible for a minimum of 25 orders during the preceding month at either Baystate or Franklin Medical Center. Orders counted toward this minimum if they had been written, given verbally in person or by phone, or entered directly into the computer by the physician. The survey consisted of 20 questions focused on the topic of computerized order entry. In addition to collecting information about sex and specialty, we asked respondents to describe their use of CPOE during training, their use of computers at home, and, where applicable, their use of computers in their outpatient practices. The survey included questions about how often respondents used the order entry system when caring for hospitalized patients and which features of the system they used. To assess physician attitudes about the order entry process, we asked respondents to consider whether it was faster to place orders directly into the system than it was by handwriting them, whether orders placed in the system were carried out more rapidly, whether placing orders in the system led to fewer medication and other errors, whether order sets were important for the efficient use of the system, whether order sets helped to ensure that important aspects of care did not slip through the cracks, whether the system's user interface supported their work flow, and whether the encouragement of nurses was an important factor in their use of the system. Questions that assessed physician attitudes were presented on a 5‐point Likert scale. Nonrespondents were sent reminder letters along with duplicate surveys twice, approximately 1 and 2 months after the initial mailing. No financial incentive was offered for participation. The study protocol was approved by the Institutional Review Board of Baystate Health System.
Order Entry Rates
Regardless of whether an order is placed directly by a physician into a computer, given verbally, or handwritten, all orders are ultimately entered into the CPOE system. Working with our hospitals' Departments of Information Services, we developed a report that provided physician‐specific information about order entry patterns. For each physician in the study, we determined the total number of orders generated during the month preceding the initial June mailing, as well as the absolute number and percentage of orders of each of the following categories: directly entered, telephone, verbal, and written. Because verbal and telephone orders are required during urgent situations and when physicians give orders from outside the hospital, we calculated and report an adjusted order entry rate as the total number of orders placed directly into the system divided by the sum of the orders entered directly and the number of written orders.
Analysis
Summary statistics for the overall sample were constructed using simple frequencies and proportions for categorical variables and medians and interquartile ranges for continuous variables. We compared characteristics of respondents from the 2 hospitals using chi‐square tests of association for categorical factors and Wilcoxon rank‐sum tests for continuous scale data. We compared the total number of orders placed during the study month and the order entry rates of responders and nonresponders using the Wilcoxon rank‐sum test. We categorized physicians as low (20%), intermediate (21%‐79%), and high (80%) users of the system based on their calculated order entry rate. Responses to each of the attitude questions in the survey were tabulated, and the responses strongly agree and agree were combined for analyses comparing responses. Demographic variables and physician attitudes were tested for associations with order entry rate categories via the Pearson chi‐square for categorical factors, the Mantel‐Haenszel chi‐square for ordered factors, and Kruskal‐Wallis analysis of variance for continuous variables. Initial analyses were stratified by hospital; where no differences in association were found across strata, the data were combined. Statistical tests were performed using SAS version 9.1 (SAS Institute, Cary, NC)
RESULTS
During the study period the target group of physicians placed a total of 135,692 orders, of which 69,654 (51%) were placed directly into the CPOE system, 38,878 (29%) were made using pen and paper, 7,208 (5%) were made verbally, and 19,952 (15%) were placed by telephone. Three hundred and fifty‐six (71%) of the 502 surveys sent out to physicians at the 2 hospitals were returned. Thirteen surveys were excluded from analysis because the respondent was not a physician, and 2 because we were unable to match the survey to system usage data, leaving a total of 341 surveys for analysis. Order entry rates were not computed for an additional 3 physicians who only placed verbal and telephone orders during the study period. Response rates did not differ by clinician specialty (P = .53); compared to those of nonresponders, respondents had a similar median total number of orders (111 vs. 101, P = .67) and a higher median order entry rate (66% vs. 48%, P = .03).
Characteristics of Respondents
Seventy‐two percent of physicians who completed the survey were men; half had graduated from medical school at least 20 years ago, and the median duration of practice at the study institution was 11 years (Table 1). Forty percent practiced internal medicine, 18% were surgeons, and 16% were pediatricians. Thirty‐five percent completed training at an institution that had computerized physician order entry, and 86% cared for patients primarily at Baystate Medical Center. More than half reported they used the system many times each day for patient care, and the features they used most commonly were retrieval of results (95%), placing of orders (78%), and viewing and printing of patient lists (75%). Among those with outpatient practices, 81% used computers in their outpatient practice, and more than half used computers for personal activities at home at least once a day. On average, respondents from Franklin Medical Center had graduated from medical school farther in the past and reported less reliance on the system to carry out all activities other than viewing results.
| Overall n (%) | Baystate n (%) 293 (85.9) | Franklin n (%) 48 (14.1) | Chi square P value | |
|---|---|---|---|---|
| ||||
| Sex | .64 | |||
| Male | 244 (71.6) | 211 (72.0) | 33 (68.8) | |
| Specialty | .24 | |||
| Anesthesia | 23 (6.7) | 23 (7.9) | 0 (0.0) | |
| Internal medicine | 135 (39.6) | 112 (38.2) | 23 (47.9) | |
| Medicine/pediatrics | 13 (3.8) | 6 (2.0) | 7 (14.6) | |
| OB/GYN | 36 (10.6) | 30 (10.2) | 6 (12.5) | |
| Pediatrics | 54 (15.8) | 51 (17.4) | 3 (6.3) | |
| Surgery | 61 (17.9) | 55 (18.8) | 6 (12.5) | |
| Other | 19 (5.6) | 16 (5.5) | 3 (6.3) | |
| Use of CPOE systema | .09 | |||
| Many times a day | 176 (52.2) | 160 (55.0) | 16 (34.8) | |
| At least once a day | 77 (22.9) | 61 (21.0) | 16 (34.8) | |
| A few times a week | 55 (16.3) | 45 (15.5) | 10 (21.7) | |
| Once a week or less | 29 (8.6) | 25 (8.6) | 4 (8.7) | |
| Features useda | ||||
| Viewing and printing patient lists | 254 (75.2) | 212 (72.6) | 42 (91.3) | .01 |
| Looking up results | 320 (94.7) | 277 (94.9) | 43 (93.5) | .70 |
| Viewing current medications | 218 (64.5) | 204 (69.9) | 14 (30.4) | < .01 |
| Placing orders | 263 (77.8) | 244 (83.6) | 19 (41.3) | < .01 |
| Entering discharge summaries | 72 (21.3) | 70 (24.0) | 2 (4.4) | < .01 |
| Use of order setsa | ||||
| Rarely or never | 98 (29.0) | 74 (25.3) | 24 (52.2) | < .01 |
| Minority of patients | 92 (27.2) | 78 (26.7) | 14 (30.4) | |
| Majority of patients | 104 (30.8) | 97 (33.2) | 7 (15.2) | |
| For all or nearly all patients | 44 (13.0) | 43 (14.7) | 1 (2.2) | |
| Percentage of orders placed using order setsa | < .01 | |||
| None | 46 (13.7) | 26 (9.0) | 20 (44.4) | |
| 1%‐25% | 62 (18.5) | 50 (17.2) | 12 (26.7) | |
| 26%‐50% | 29 (8.7) | 23 (7.9) | 6 (13.3) | |
| 51%‐75% | 45 (13.4) | 43 (14.9) | 2 (4.4) | |
| 76%‐99% | 103 (30.8) | 98 (33.8) | 5 (11.1) | |
| All | 50 (14.9) | 50 (17.2) | 0 (0.0) | |
| Use of computer in outpatient practiceab | 243 (81.3) | 206 (80.8) | 37 (84.1) | .60 |
| Personal computer usea | .47 | |||
| At least once a day | 209 (61.7) | 185 (63.4) | 24 (51.1) | |
| Several times a week | 84 (24.8) | 67 (23.0) | 17 (36.2) | |
| A few times a month | 21 (6.2) | 18 (6.2) | 3 (6.4) | |
| Rarely | 25 (7.4) | 22 (7.5) | 3 (6.4) | |
| Training at an institution that had CPOE | 117 (34.7) | 105 (36.1) | 12 (26.1) | 0.19 |
| Use of system to enter orders should be mandatorya | ||||
| Yes | 113 (35.2) | 106 (38.4) | 7 (15.6) | <.01 |
| Median (IQR) | Median (IQR) | Median (IQR) | WilcoxonPvalue | |
| Years since medical school graduationa | 20 (13, 26) | 20 (13, 26) | 24 (17, 28) | .02 |
| Years in practice at study institutiona | 11 (5, 18) | 11 (5, 18) | 13 (7, 19) | .39 |
| Orders directly enteredc | 23 (2, 99) | 27 (5, 108) | 1 (0, 27) | < .01 |
| Orders placed by telephonec | 14 (5, 49) | 12 (3, 38) | 49.5 (16, 123.5) | < .01 |
| Orders placed verballyc | 2 (0, 11) | 3 (0, 13) | 1 (0,3) | < .01 |
| Orders placed in writingc | 21 (4, 73) | 14 (3, 45) | 220 (106.5, 391) | < .01 |
| CPOE ratebc | 66% (3%, 94%) | 76% (19%, 96%) | 0.25% (0%, 17%) | < .01 |
Attitudes Toward Computerized Physician Order Entry
Physicians who completed the survey offered diverse opinions about the impact of computerized order entry on work flow, patient safety, and quality of care. Only 22% believed the system's user interface supported their work flow (Q7), 34% believed it was faster to enter orders directly into the system than to handwrite them (Q1), and 41% believed orders placed into the system were carried out more rapidly (Q2) (Table 2). On the other hand, 63% of respondents believed that placing orders directly into the system led to fewer medication errors (Q3), and 51% stated the system generally reduced medical errors (Q4). Sixty‐nine percent stated order sets were important for efficient use of the system (Q5), and 71% believed order sets served an important decision support role (Q6). Twenty‐six percent stated that the encouragement of nurses was an important factor in their use of the system (Q8). Finally, 35% of attending physicians believed use of the system to place orders should be mandatory.
Characteristics and Attitudes of High, Intermediate, and Low Users
The median order entry rate of respondents was 66%. One hundred and forty‐one (42%) placed at least 80% of their orders directly into the system, whereas 109 (32%) placed no more than 20% of their orders directly in the system (Fig. 1). There was not a significant difference between the low, intermediate, and high use groups in the total number of orders that each physician placed during the study period (Table 3). Sex, years since graduation from medical school, years in practice at the study institution, and use of computers in the outpatient setting were not meaningfully different between the 3 categories of users (Table 3). On the other hand, medical specialty was strongly associated with use of the system, with anesthesiologists, pediatricians, and surgeons the specialties with the largest proportion of high users. Furthermore, physicians who were trained in a CPOE environment and those who reported daily use of computers for personal activities showed the highest levels of adoption. Physicians at Franklin Medical Center showed lower levels of order entry than their counterparts at Baystate.
| Low (20%) n (row %) | Intermediate (20%‐79%) n (row %) | High (80%) n (row %) | P value | |
|---|---|---|---|---|
| ||||
| n = 109 | n = 88 | n = 141 | ||
| Hospital | < .01c | |||
| Baystate | 73 (25) | 79 (27) | 138 (48) | |
| Franklin | 36 (75) | 9 (19) | 3 (6) | |
| Sex | .69c | |||
| Female | 28 (29) | 24 (25) | 43 (45) | |
| Male | 81 (33) | 64 (26) | 98 (40) | |
| Specialty | .0001c | |||
| Anesthesia | 8 (35) | 3 (13) | 12 (52) | |
| Internal medicine | 45 (33) | 37 (27) | 53 (39) | |
| Medicine/pediatrics | 6 (46) | 5 (38) | 2 (15) | |
| OB/GYN | 20 (56) | 12 (33) | 4 (11) | |
| Pediatrics | 13 (24) | 9 (17) | 32 (59) | |
| Surgery | 14 (23) | 21 (34) | 26 (43) | |
| Other | 3 (19) | 1 (6) | 12 (75) | |
| Do you use a computer in your outpatient practice?a | ||||
| Yes | 75 (31) | 61 (25) | 105 (44) | .22c |
| No | 20 (36) | 18 (33) | 17 (31) | |
| Level of personal computer useb | .045d | |||
| Rarely | 11 (44) | 8 (32) | 6 (24) | |
| A few times a month | 7 (33) | 4 (19) | 10 (48) | |
| Several times a week | 28 (35) | 25 (31) | 28 (35) | |
| At least once a day | 62 (30) | 50 (24) | 97 (46) | |
| Training at an institution that had CPOE | .037c | |||
| Yes | 30 (26) | 40 (34) | 46 (40) | |
| No | 76 (35) | 48 (22) | 94 (43) | |
| Median (IQR) | Median (IQR) | Median (IQR) | ||
| Years since graduation from medical school | 21 (16, 28) | 18 (14, 25) | 19 (12, 25) | .06e |
| Years in practice at study institution | 12 (5, 19) | 12 (6, 19) | 12 (6, 17) | .84e |
| Total number of orders placed | 112 (45, 306) | 105 (56, 254) | 113 (44, 382) | .92e |
Use of the system was highly associated with physician attitudes toward CPOE, with the views of intermediate and high users consistently different than those of low users (Fig. 2). The associations found held true regardless of hospital: low, intermediate, and high users from Franklin had similar responses to those from Baystate (P > .05 for all questions), and the data from the 2 hospitals therefore were combined for presentation. Although few physicians believed that the user interface of the system supported their work flow, high and intermediate users were 3 times as likely to share this view than were low users (Q7; Fig. 2). Similarly, 19% of low users, 31% of intermediate users, and 45% of high users believed that entering orders into the system was faster than writing orders (Q1). High and intermediate users of the system were more likely than low users to believe that orders entered into the system were carried out more rapidly (Q2) and led to fewer medication (Q3) and nonmedication (Q4) errors. Regardless of their utilization pattern, most physicians believed that order sets played an important role in promoting efficiency and quality.
DISCUSSION
In this study of the clinical computing practices of physicians at 2 community hospitals, we observed wide variation in the adoption of CPOE by individual attendings. Although roughly one‐third rarely placed orders directly into the system, 42% had an order entry rate of at least 80%. Contrary to our initial expectation, we found little association between a physician's order entry rate with years in practice, duration of exposure to CPOE, or use of computers in the outpatient setting. On the other hand, we observed marked differences in use of the CPOE system across specialty lines and found that physicians who were exposed to CPOE during training and those who were regular users of computers for personal activities were more likely to embrace this technology. Further, we observed important differences between physicians who used the system to place some or most of their orders and those who did so only rarely in their beliefs and attitudes about the impact and benefits of CPOE. Physicians with higher order entry rates were more likely than their colleagues to believe that placing orders electronically was faster than handwriting and that use of the system led to fewer medical errors. These findings should be encouraging to hospitals hoping to implement CPOE because they suggest that successful adoption of CPOE is not limited to physicians who have just completed their residencies or to hospitals with the capability of designing and building their own systems. On the contrary, we documented that women, older physicians, and those with limited CPOE experience were as likely to be frequent users, especially if they perceived CPOE to be safer than handwriting and if they believed the user interface supported the efficient entering of orders.
On the basis of these results we recommend that in addition to purchasing systems that meet physician work‐flow needs and support the efficient entry of orders, hospital leaders should emphasize the quality and safety benefits of CPOE as part of a comprehensive change management strategy. The differences we observed in order entry rates across specialties may have resulted from several factors, including inherent differences in personality type associated with choice of specialty and in the level of customization of a system reflected in which and how many order sets are included. Such findings suggest that when it comes to CPOE, one size does not fit all, and implementation planning should be carried out at the specialty level. Finally, our observation that physicians who had exposure to CPOE during training were more likely to use the system to place orders suggests that the nation's training institutions will play an important role in fostering universal adoption of this technology.
Several earlier studies have reported on physician experiences with CPOE systems. Murff and Kannry12 surveyed 94 internal medicine house staff to compare experiences with 2 CPOE systems: the Department of Veterans Affairs Computerized Patient Record System (CPRS) and a commercially available product. They found striking differences in user satisfaction with numerous aspects of the systems, however they did not address attitudes toward safety or quality, and because house staff were required to place orders electronically they were unable to correlate responses with actual usage patterns. Weiner et al.13 compared the opinions of internal medicine house staff, attendings, fellows, and nurses about the benefits and challenges of using a computerized provider order entry system. In contrast to the findings from our study, Weiner et al. reported that more than half of physicians believed that provider order entry led to a greater number of errors, and only a minority believed the system increased quality of care overall. Finally, Lee et al.14 surveyed medical and surgical house officers and nurses at a large academic medical center about their satisfaction with a locally developed order entry system. They found that attitudes about the impact of the system on productivity and ease of use were more strongly associated with overall satisfaction than having undergone training or experience with personal computers. These findings are congruous with our own observation that beliefs about the speed with which orders are placed are closely associated with actual use of the system. They reported, as have we, that physicians placed a high value on order sets.
Our study had a number of strengths. First, we were able to offer insight into the attitudes and behaviors of a previously neglected, but critically important groupattending physicians who care for patients at community hospitals without the assistance of house staff. Second, whereas previous studies primarily assessed physician satisfaction with CPOE, we explored how physician attitudes about the impact of CPOE on work flow and on safety were associated with actual ordering habits. Information about ordering was obtained directly from the order entry system and not through self‐report. We conducted the study at 2 hospitals, a large urban community teaching hospital and a smaller rural hospital, and focused on a CPOE system that is in use at many institutions throughout the country, thereby increasing the generalizability of our findings. Although adoption of the system by physicians at the 2 hospitals differed, factors that associated with the use of CPOE to place orders were similar. Finally, we surveyed a large number of physicians, had a high response rate, and found only small differences in the utilization patterns of responders and nonresponders, suggesting that our portrayal of the attitudes of physicians was representative of the views of physicians practicing in our community.
The study had a number of weaknesses. First, we cannot be sure whether preexisting beliefs about the benefits of CPOE directly influenced physicians' use of the system or, conversely, if these attitudes developed in response to experience as users. Nevertheless, it seems practical to suggest that hospitals focus on purchasing systems that support the efficient entering of orders while simultaneously adopting a communication and change management strategy that emphasizes the safety and quality benefits of CPOE more broadly. Second, we did not attempt to validate the opinions expressed by physicians about the usability or safety benefits of the system. That said, the purpose of the study was to determine whether physician attitudes toward these issues was associated with the use of the system to place orders. Whether or not this particular CPOE system actually prevented medication errors, most physicians believed it did, a belief strongly associated with the observed order entry rates. Third, we studied a single CPOE system implemented approximately 10 years ago that does not reflect state‐of‐the‐art user interface design or functionality. Nevertheless, our observation about the importance of the user experience is probably no less relevant today. Fourth, we were unable to ascertain every order given by physicians, as some so‐called MD to RN orders may never have made it into the system. Finally, there is a small risk that some written, telephone, and verbal orders may have been randomly or systematically assigned to incorrect physicians, which would have led us to calculate inaccurate utilization rates.
CONCLUSIONS
In a voluntary community hospital environment the adoption of CPOE by attending physicians varies widely. While placing a premium on the purchase of systems that meet the work‐flow needs of physicians and support the efficient entry of orders, hospital leaders can enhance physician adoption of this technology by communicating the role of CPOE in improving quality and safety.
Acknowledgements
The authors thank Gilad Kuperman, MD, PhD, for his thoughtful comments on an earlier version of the manuscript.
- Kohn LT,Corrigan JM,Donaldson MS, eds.To Err Is Human: Building a Safer Health System.Washington, DC:National Academy Press,2000.
- ,.Computer physician order entry: benefits, costs, and issues.Ann Intern Med.2003;139:31–39.
- ,,, et al.Effect of computerized physician order entry and a team intervention on prevention of serious medication errors.JAMA.1998;280:1311–1316.
- ,,,,,.A computerized reminder system to increase the use of preventive care for hospitalized patients.N Engl J Med.2001;345:965–970.
- ,,,.A randomized trial of “corollary orders” to prevent errors of omission.J Am Med Inform Assoc.1997;4:364–375.
- ,,, et al.A computer‐assisted management program for antibiotics and other antiinfective agents.N Engl J Med.1998;338:232–238.
- The Leapfrog Group. Patient Safety Fact Sheet. Available at: http://www.leapfroggroup.org/FactSheets/LF_FactSheet.pdf. Accessed October 6,2004.
- ,,,.Computerized physician order entry in U.S. hospitals: results of a 2002 survey.J Am Med Inform Assoc.2004;11:95–99.
- ,,.U.S. adoption of computerized physician order entry systems.Health Aff.2005;24:1654–1663.
- ,,.Effects of computerized physician order entry and clinical decision support systems on medication safety: a systematic review.Arch Intern Med.2003;163:1409–1416.
- HCUPnet, Healthcare Cost and Utilization Project. Agency for Healthcare Research and Quality, Rockville, MD. Available at: http://www.ahrq.gov/data/hcup/hcupnet.htm. Accessed October 6,2004.
- ,.Physician satisfaction with two order entry systems.J Am Med Inform Assoc.2001;8:499–509.
- ,,, et al.Contrasting views of physicians and nurses about an inpatient computer‐based provider order‐entry system.J Am Med Inform Assoc.1999;6:234–244.
- ,,,.Implementation of physician order entry: user satisfaction and self‐reported usage patterns.J Am Med Inform Assoc.1996;3:42–55.
Copyright © 2006 Society of Hospital Medicine
