User login
Acute respiratory failure (ARF), a common and serious complication in hospitalized patients, may be caused by several conditions including pneumonia, chronic obstructive pulmonary disease (COPD), adult respiratory distress syndrome (ARDS), and congestive heart failure (CHF). Although ARF is conventionally defined by an arterial oxygen tension of <60 mm Hg, an arterial carbon dioxide tension of >45 mm Hg, or both, these thresholds serve as a guide to be used in combination with history and clinical assessment of the patient.[1, 2] Supplemental oxygen and treatment of the underlying cause is the mainstay of therapy for ARF, but in severe cases patients are treated with invasive mechanical ventilation (IMV) or noninvasive ventilation (NIV). ARF is the most frequent reason for admission to the intensive care unit (ICU)[3, 4] and has an in‐hospital mortality rate of 33% to 37% among those who require IMV.[5, 6] The majority of epidemiologic studies of ARF have been limited to patients requiring mechanical ventilation or those admitted to the ICU, and information about the characteristics and outcomes of patients across the full spectrum of severity is much more limited.[5, 7, 8, 9, 10, 11] General improvements in the management of underlying conditions, implementation of more effective ventilation strategies,[12, 13] and increasing use of NIV[14, 15] may have led to better outcomes for patients with ARF, yet empirical evidence of a change in the adjusted mortality rate over time is lacking.
The objective of this study was to provide a broad characterization of the epidemiology of ARF among adults hospitalized in the United States using a large nationally representative database. We sought to evaluate whether incidence, mortality, cost, or ventilation practice associated with ARF in the United States changed over the period of 2001 to 2009.
METHODS
Data Source
We utilized data from the Nationwide Inpatient Sample (NIS) of the Health Care Cost and Utilization Project,[16] which is a 20% stratified probability sample of all US acute‐care hospitals each year. These data are drawn from a sampling frame that contains close to 95% of all discharges in the United States, with the hospital discharge record as the unit of analysis. The NIS has been used to study trends in many different diagnoses.[17, 18, 19] The database contains demographic information, payer information, principal and secondary diagnoses, cost, discharge disposition, and death during hospitalization. It also contains information on hospital characteristics including ownership, size, teaching status, and geographic region.
Definitions
We included patients 18 years old discharged between 2001 and 2009 with a primary or secondary diagnosis of ARF. We identified cases of ARF using diagnostic codes (International Classification of Diseases, Ninth Revision, Clinical Modification [ICD‐9‐CM]) previously used in studies of acute organ dysfunction in sepsis (518.81, 518.82, 518.84, 518.4, 799.1, 786.09).[17, 20, 21] To define ARDS we relied on ICD‐9‐CM codes (518.4, 518.82, 518.5, 786.09) used in prior studies that showed good sensitivity and specificity.[22, 23] The use of ventilatory support was identified using the ICD‐9‐CM procedure codes[24] (93.90, 93.70, 93.71, 93.76). Comorbidities were classified using the Agency for Healthcare Research and Quality's (Rockville, MD) Healthcare Cost and Utilization Project's (HCUP) Comorbidity Software version 3.103.5.[25]
Outcomes
The primary outcomes included the annual number of hospitalizations, population incidence, hospital mortality, and costs of care. Secondary outcomes included length of stay, most common diagnoses associated with ARF, disposition at discharge, and use and type of ventilatory support.
Analysis
We estimated the number of hospitalizations with a diagnosis of ARF/year, and we calculated the weighted frequencies following HCUP‐NIS recommendations using SAS/STAT survey procedures. Using population estimates for the years 2001 to 2009 from the US Census Bureau, we employed direct standardization to calculate age‐, gender‐, and race‐adjusted population incidence and mortality rates of ARF per 100,000 population. Hospital mortality was defined as the ratio of ARF hospitalizations ending in death divided by total number of ARF hospitalizations. Mechanical ventilation rates and rates of selected comorbidities were similarly defined.
We employed indirect standardization to adjust hospital mortality rates for age, sex, race/ethnicity, comorbidities, and hospital characteristics using logistic regression models from 2001 to predict hospital mortality for 2002 to 2009. We used linear regression models to test whether the slope of year was significant for trends in outcomes overtime. Costs were calculated using hospital‐specific cost‐to‐charge ratios when available and a weighted group average at the state level for remaining hospitals. We converted all costs to 2009 US dollars using the Consumer Price Index. Costs and lengths of stay were not normally distributed, so we calculated weighted geometric means (the average of all logarithmic values), then converted back to a base‐10 number. Using a Taylor series expansion, we then calculated standard errors. All analyses were performed using SAS version 9.2 (SAS Institute, Inc., Cary, NC).
The Baystate Medical Center institutional review board determined that the project did not constitute human subjects research.
RESULTS
Hospitalization Trends
The number of hospitalizations with an ARF diagnosis code increased at an average annual rate of 11.3% from 1,007,549 (standard deviation [SD] = 19,268) in 2001 to 1,917,910 (SD = 47,558) in 2009. More than two‐thirds of ARF admissions were associated with medical, rather than surgical, conditions (69.5% in 2001 and 71.2% in 2009). The median age, racial make‐up, and gender did not change significantly. Over the study period we observed an increase in ARF‐related hospitalizations in large, urban, teaching hospitals and in hospitals located in the Midwest (Table 1).
| 2001 | 2003 | 2005 | 2007 | 2009 | |
|---|---|---|---|---|---|
| |||||
| Patient characteristics | |||||
| All, N (SD) | 1,007,549 (19,268) | 1,184,928 (25,542) | 1,288,594 (30,493) | 1,480,270 (32,002) | 1,917,910 (47,558) |
| Age, mean (SE), y | 66.6 (0.2) | 66.0 (0.2) | 66.1 (0.2) | 65.8 (0.2) | 65.8 (0.2) |
| Age group, % | |||||
| 1844 | 11.5 | 12.0 | 11.5 | 11.6 | 10.9 |
| 4564* | 26.7 | 28.9 | 29.6 | 30.7 | 31.7 |
| 6584* | 50.2 | 47.8 | 47.0 | 45.7 | 45.3 |
| 85+ | 11.5 | 11.4 | 11.9 | 12.0 | 12.1 |
| Male* | 48.1 | 48.2 | 48.6 | 49.3 | 49.2 |
| Race | |||||
| White | 75.8 | 71.9 | 76.5 | 71.8 | 73.4 |
| Black | 12.7 | 13.6 | 11.2 | 14.2 | 12.5 |
| Hispanic | 7.2 | 9.8 | 7.7 | 8.5 | 7.8 |
| Other | 4.2 | 4.7 | 4.7 | 5.5 | 6.3 |
| Primary ARF | 20.7 | 20.9 | 25.9 | 26.1 | 19.9 |
| Secondary ARF | 79.3 | 79.1 | 74.1 | 73.9 | 80.1 |
| Medical* | 69.5 | 69.1 | 69.9 | 70.2 | 71.2 |
| Surgical* | 30.5 | 30.8 | 30.1 | 29.8 | 28.8 |
| Hospital characteristics, % | |||||
| Number of beds | |||||
| Small | 10.0 | 10.1 | 10.5 | 10.8 | 11.3 |
| Medium | 25.2 | 25.3 | 24.6 | 24.0 | 22.7 |
| Large | 64.7 | 64.6 | 64.9 | 65.2 | 66.0 |
| Region | |||||
| South* | 18.5 | 18.5 | 17.6 | 17.0 | 16.3 |
| Midwest | 21.4 | 22.0 | 23.6 | 23.2 | 23.5 |
| Northeast | 42.6 | 41.7 | 41.4 | 42.2 | 42.1 |
| West* | 17.5 | 17.8 | 17.3 | 17.6 | 18.1 |
| Hospital type | |||||
| Rural | 13.6 | 13.0 | 11.8 | 11.0 | 10.8 |
| Urban nonteaching | 45.5 | 44.5 | 50.1 | 45.3 | 45.7 |
| Urban teaching | 40.9 | 42.5 | 38.1 | 43.7 | 43.6 |
| Patient outcomes | |||||
| Ventilation strategy | |||||
| IMV* | 48.5 | 48.4 | 47.5 | 46.5 | 42.1 |
| NIV* | 3.8 | 5.3 | 6.9 | 9.4 | 10.1 |
| IMV or NIV | 50.9 | 51.7 | 52.1 | 52.9 | 49.7 |
| Disposition | |||||
| Home/home healthcare* | 42.1 | 43.8 | 42.8 | 43.4 | 45.7 |
| Transfer to acute care | 5.2 | 4.7 | 4.6 | 4.6 | 4.4 |
| Nursing facility* | 24.4 | 24.9 | 27.4 | 28.6 | 29.0 |
| Other | 0.7 | 0.8 | 0.9 | 0.9 | 1.0 |
| Adjusted mortality, % (SE)* | 27.6 (0.3) | 26.4 (0.4) | 24.9 (0.4) | 22.7 (0.4) | 20.6 (0.3) |
| Adjusted mean, LOS/case, d (SE)* | 7.8 (0.1) | 7.9 (0.1) | 7.7 (0.1) | 7.5 (0.1) | 7.1 (0.1) |
| Adjusted mean cost/case, 2009 US$, (SE) | 15,818 (251) | 16,981 (419) | 17,236 (411) | 16,941 (436) | 15,987 (402) |
After adjusting for age and sex, the population incidence of ARF increased from 502 (standard error [SE] = 10) cases per 100,000 in 2001 to 784 (SE = 19) cases per 100,000 in 2009 (a 56% increase, P < 0.0001). Hispanics had the lowest rates of ARF, with both black and white groups having similar rates (Table 2).
| 2001 | 2003 | 2005 | 2007 | 2009 | |
|---|---|---|---|---|---|
| |||||
| All* | 502 (10) | 569 (12) | 595 (14) | 627 (14) | 784 (19) |
| Age group | |||||
| 1844* | 107 (3) | 130 (4) | 137 (4) | 153 (5) | 189 (6) |
| 4564* | 422 (9) | 500 (12) | 521 (13) | 580 (14) | 739 (19) |
| 6584* | 1697 (35) | 1863 (42) | 1950 (50) | 2066 (46) | 2578 (69) |
| 85+ | 3449 (86) | 3792 (106) | 3981 (120) | 3429 (97) | 4163 (123) |
| Sex | |||||
| Male* | 491 (10) | 553 (13) | 582 (14) | 629 (14) | 782 (20) |
| Female* | 512 (10) | 583 (12) | 607 (15) | 625 (13) | 786 (19) |
| Race/ethnicity | |||||
| White* | 398 (11) | 427 (12) | 466 (16) | 450 (13) | 699 (21) |
| Black* | 423 (27) | 513 (33) | 432 (26) | 574 (38) | 738 (37) |
| Hispanic* | 247 (24) | 381 (42) | 307 (27) | 353 (34) | 478 (42) |
| Other* | 268 (20) | 342 (29) | 347 (26) | 424 (29) | 713 (77) |
| In‐hospital mortality | 140 (3) | 148 (3) | 146 (3) | 140 (3) | 154 (4) |
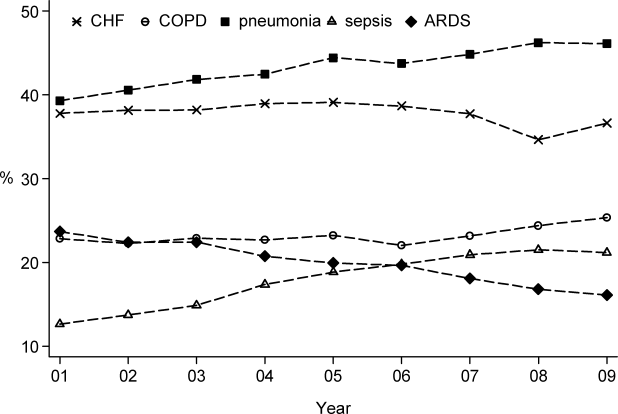
The most common etiologies of ARF among medical patients were pneumonia, CHF, ARDS, COPD exacerbation, and sepsis. Over the 9‐year study, the proportion of cases secondary to pneumonia and sepsis rose significantly: from 39% to 46% and 13% to 21%, respectively (Figure 1).

Mortality and Other Outcomes
The number of in‐hospital deaths related to ARF increased from 277,407 deaths in 2001 to 381,155 in 2009 (a 37% increase, P < 0.001). Standardized to the population, deaths increased from 140 in 2001 to 154 cases per 100,000 in 2009 (a 10% increase, P = 0.027). Despite slightly increasing mortality rates at a population level, adjusted in‐hospital mortality improved from 27.6% in 2001 to 20.6% in 2009 (P < 0.001). Mortality declined for both IMV and NIV patients from 35.3% in 2001 to 30.2% in 2009 and from 23.5% to 19%, respectively, but increased for those who required both NIV and IMV (from 26.9% in 2001 to 28% in 2009).
Adjusted hospital length of stay decreased from 7.8 days per patient in 2001 to 7.1 days in 2009 (P < 0.001), with a concomitant increase in discharges to nursing facilities, from 24% in 2001 to 29% in 2009. There was no linear trend in adjusted cost per case, with $15,818 in 2001 and $15,987 in 2009 (in 2009 US dollars) (Table 1).
Ventilation Practices
Overall, 50.9% patients received ventilatory support (NIV or IMV or both) in 2001 and 49.7% in 2009 (P= 0.25). The use of NIV increased from 3.8% to 10.1% (P < 0.001), a 169% increase, whereas the utilization of IMV decreased from 48.5% in 2001 to 42.1% in 2009 (P for trend < 0.0001), a 13% decrease. Uses of both NIV and IMV during hospitalization were seen in 1.4% of cases in 2001 and 2.5% of cases in 2009.
2009 Data Analysis
In 2009 the 1,917,910 hospitalizations with ARF resulted in 381,155 (SD = 8965) deaths and a total inpatient cost of $54 billion. The most common etiologies in patients over 65 years old were pneumonia, CHF, COPD, ARDS, and sepsis. In patients younger than 45 years the most frequent diagnoses were pneumonia, ARDS, sepsis, asthma, drug ingestion, and trauma. Stratified analysis by gender and by age groups showed that mortality rates among men were higher than for women and were highest in patients older than 85 years (Table 3).
| Disease | Total | Age <45 Years | 4565 Years | 6584 Years | 85+ Years | Male | Female |
|---|---|---|---|---|---|---|---|
| |||||||
| Medical | |||||||
| Total, N (%) | 1,364,624 (71.2) | 144,715 (10.6) | 416,922 (30.6) | 615,009 (45.1) | 187,977 (13.8) | 647,894 (47.5) | 716,635 (52.5) |
| Pneumonia, %* | 46.1 | 41.7 | 42.8 | 46.9 | 54.3 | 48.8 | 43.7 |
| CHF, %* | 36.6 | 10.4 | 27.3 | 43.6 | 54.8 | 35.0 | 38.1 |
| ARDS, %* | 16.1 | 22.9 | 16.2 | 14.5 | 15.9 | 15.5 | 16.7 |
| Sepsis, %* | 21.2 | 18.1 | 21.3 | 21.3 | 23.1 | 22.8 | 19.8 |
| COPD, %* | 25.4 | 4.2 | 25.6 | 32.3 | 18.3 | 25.0 | 25.7 |
| AMI, %* | 9.0 | 2.6 | 7.1 | 10.5 | 13.3 | 9.3 | 8.8 |
| Asthma, %* | 9.2 | 18.1 | 11.6 | 6.7 | 5.4 | 6.2 | 12.0 |
| Stroke, %* | 4.8 | 2.3 | 4.1 | 5.5 | 6.0 | 5.0 | 4.7 |
| Trauma or burns, %* | 3.4 | 5.4 | 2.9 | 3.0 | 4.1 | 4.3 | 2.5 |
| Cardiorespiratory arrest, %* | 4.1 | 3.9 | 4.4 | 4.1 | 3.8 | 4.6 | 3.7 |
| Drug, %* | 3.7 | 16.6 | 5.1 | 0.8 | 0.3 | 3.8 | 3.6 |
| IMV, %* | 37.7 | 54.6 | 43.7 | 33.5 | 24.8 | 41.1 | 34.5 |
| NIV, %* | 11.9 | 7.1 | 11.5 | 13.0 | 12.7 | 11.4 | 12.3 |
| In‐hospital mortality (CI) | 22 (21.322.7) | 12.9 (11.913.9) | 18.5 (17.619.4) | 23.9 (23.024.9) | 31.8 (30.633.1) | 24.2 (23.325.1) | 20.9 (20.121.7) |
| Surgical | |||||||
| Total, N (%) | 552971 (28.8) | 64983 (11.8) | 190225 (34.4) | 254336 (46) | 43426 (7.9) | 295660 (53.5) | 257287 (46.5) |
| Pneumonia, %* | 34.9 | 33.0 | 34.0 | 35.0 | 40.5 | 37.1 | 32.2 |
| CHF, %* | 27.2 | 8.9 | 21.7 | 33.3 | 42.6 | 26.7 | 27.7 |
| ARDS, %* | 45.5 | 51.5 | 45.2 | 44.7 | 42.7 | 45.0 | 46.1 |
| Sepsis, %* | 25.1 | 22.8 | 25.4 | 25.2 | 26.1 | 25.4 | 24.7 |
| COPD, %* | 8.2 | 1.1 | 7.4 | 10.8 | 7.5 | 8.3 | 8.1 |
| AMI, %* | 16.9 | 4.9 | 17.0 | 19.8 | 17.9 | 19.1 | 14.4 |
| Asthma, %* | 6.1 | 7.6 | 7.2 | 5.4 | 3.6 | 4.1 | 8.5 |
| Stroke, %* | 8.9 | 6.6 | 9.2 | 9.4 | 7.2 | 8.9 | 8.8 |
| Trauma or burns, %* | 12.2 | 26.5 | 9.6 | 9.2 | 20.3 | 13.8 | 10.4 |
| Cardiorespiratory arrest, %* | 5.5 | 4.4 | 6.0 | 5.4 | 5.2 | 6.1 | 4.7 |
| Drug, %* | 0.5 | 1.3 | 0.7 | 0.2 | 0.2 | 0.4 | 0.6 |
| IMV, %* | 52.9 | 57.1 | 54.3 | 51.3 | 50.0 | 54.5 | 51.0 |
| NIV, %* | 5.8 | 3.5 | 5.5 | 6.4 | 6.4 | 5.6 | 6.0 |
| In‐hospital mortality, % (CI) | 18.6 (17.819.5) | 10.7 (9.312.0) | 15.5 (14.216.8) | 20.8 (19.821.9) | 29.4 (27.831.1) | 19.0 (18.219.8) | 18.3 (17.319.2) |
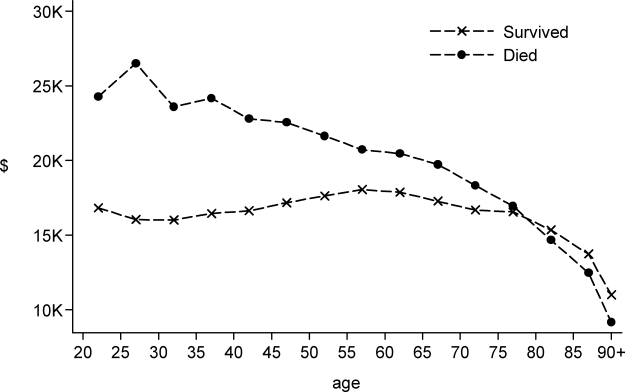
When we examined ventilation practices among medical patients we found that patients older than 85 years, when compared to patients younger than 45 years, were less likely to be treated with IMV (25% vs 55%) and more likely to be treated with NIV (12.7% vs 7%). At the same time, the average cost per case was lowest among patients 85 years and older, and hospital costs per case fell sharply after age 70 years. Costs were considerably higher for those who did not survive during hospitalization, particularly for patients younger than 45 years (Figure 2).
DISCUSSION
In this large population‐based study, we found that the number of hospitalizations associated with a diagnosis of ARF almost doubled over a 9‐year period. In 2009 there were nearly 2 million hospitalizations with ARF in the United States, resulting in approximately 380,000 deaths and inpatient costs of over $54 billion. The population‐adjusted ARF hospitalization rates increased in all age groups, and patients 85 years and older had the highest age‐specific hospitalization rate. Although overall rates of mechanical ventilation (NIV or IMV) remained stable over the 9‐year period, there was an important shift away from IMV (which decreased from 48% in 2001 to 42% in 2009) toward NIV (which increased from 4% in 2001 to 10% in 2009). Overall, there was a significant increase in the number of total deaths despite a decline in adjusted in‐hospital mortality rates. In‐hospital mortality rates decreased for all cases of ARF regardless of ventilation choice.
The findings of this study mirror results of others that have shown that although the incidence of critical care illnesses like sepsis[17, 20, 21, 26] and acute renal failure[27] has increased over the last decade, in‐hospital mortality rates have decreased.[20, 21, 28] Our results also compliment the results of a recent study that looked at hospitalizations for noncardiogenic ARF, which observed a 3.7‐fold increase in the number of cases and a steady decline in case fatality.[11]
Most prior studies addressing the incidence of ARF have included only patients receiving mechanical ventilation. In 1994, the estimated number of cases of ARF requiring IMV was 329,766,[9] which increased to 790,257 in 2005.[10] In our study we found that in 2009, the number of patients with ARF hospitalizations with IMV increased to 806,538. The increase in the overall number of cases with ARF was mainly driven by a surge in cases of sepsis and pneumonia. Our findings are consistent with national trends over time in noncardiogenic ARF[11] and in conditions that predispose patients to ARF such as sepsis[17, 20, 28] and acute renal failure.[27] As the number of claims for ARF doubled and the number of deaths increased, we found that adjusted hospital mortality improved from 27.6% in 2001 to 20.6% in 2009. This decline in hospital mortality was observed among all patients groups, regardless of ventilation choice. The decline in overall case fatality is consistent with prior findings in noncardiogenic ARF,[11] sepsis,[17, 28] and CHF.[29]
There are a number of potential explanations for the reduction in mortality observed over the study period, including improvements in hospital management of the underlying conditions leading to ARF, an increase in the proportion of patients being treated with NIV,[30] and advances in the care of critically ill patients such as the use of low‐tidal volume ventilation.[31, 32] Another contributor may be an increase in the proportion of discharges to nursing facilities, although this change in discharge disposition cannot fully explain our findings. For example, from 2007 to 2009, mortality decreased by 2 percentage points, and nursing home discharges increased by only 0.4 percentage points. Growth and aging of the US population only partially explain the increase we observed in the incidence of ARF, as age‐ and sex‐adjusted population rates increased by 56% from 2001 to 2009. In addition, the NIS captures data on hospital discharges and not individual patients; thus, a patient may have had multiple admissions. Over the last decade adoption of a more intensive practice style has been associated with improved in‐hospital mortality,[33, 34] and although these patients may be living longer they may have multiple readmissions.[35, 36]
We also observed that older patients were less likely to be treated with IMV, had a higher mortality rate, and less expensive care. These results are consistent with other studies and suggest that the intensity of treatment decreases with increasing age, and decisions to withhold or withdraw life‐supporting treatments are more frequent in the elderly.[26, 37] Prior research has shown that severity of illness is more important than age on patients' prognosis,[38, 39] and aggressive treatment strategies are not less cost‐effective when provided to older patients.[40]
Another important finding of this study is the marked increase in the use of NIV paired with a modest reduction in the use of IMV in the treatment of patients with ARF. This finding adds to evidence from other studies, which have similarly reported a dramatic increase in the use of NIV and a decrease in the use of IMV in patients with COPD as well as in ARF of other etiologies.[30, 41]
Our work has several limitations. First, we identified ARF based on ICD‐9‐CM codes and therefore cannot exclude disease misclassification. We did not find any studies in the literature addressing the accuracy and the completeness of ARF coding. However, we employed the same codes used to define ARF as has been used to define organ dysfunction in studies of severe sepsis,[17, 20] and the ICD‐9‐CM codes that we used to identify cases of ARDS have been used in prior studies.[11, 22, 23] Another limitation is that it is not clear to what extent the trends we observed may be due to changes over time in documentation and coding practices. Although this should be considered given the additional reimbursement associated with the diagnosis of ARF, our observation that rates of assisted ventilation have remained almost flat over the 9‐year period of the study suggest that would not wholly account for the rise in ARF. Second, because we did not have access to physiological data such as results of blood gas testing, we could not determine whether the threshold for applying the diagnosis of ARF or for delivering ventilatory support has changed over time. Third, for the purpose of this study we employed a broad definition of ARF, not limiting cases to those requiring mechanical ventilation, and this led to a more heterogeneous cohort including less severe cases of ARF. However, this is not dissimilar to the heterogeneity in disease severity observed among patients who receive a diagnosis of heart failure or acute renal failure. Fourth, survivors of ARF remain at high risk of death in the months after hospitalization,[42] but we assessed only in‐hospital mortality. It is possible that although in‐hospital mortality has improved, 30‐day mortality remained stable. Finally, as the NIS contains only discharge‐level data, we could not distinguish between patients admitted for ARF from those who developed ARF (potentially iatrogenic) after admission.
In summary, over the period of 2001 to 2009, there was a large increase in the number of patients given a diagnosis of ARF and a concomitant reduction in inpatient mortality. Although rates of mechanical ventilation remained relatively constant, there was a significant shift toward greater use of NIV at the expense of IMV.
Disclosures
Dr. Stefan is supported by KM1 CA156726 from the National Cancer Institute (NCI) and by the National Center for Research Resources and the National Center for Advancing Translational Sciences, National Institutes of Health (NIH), through grant UL1 RR025752. The work on this study was supported by a Charlton grant from Tufts University School of Medicine. Dr. Lindenauer and Dr. Pekow are supported by 1R18HL108810‐01 from the National Heart, Lung, and Blood Institute (NHLBI). The content of this publication is solely the responsibility of the authors and does not represent the official views of the NIH, NHLBI, or NCI.
All authors have read and approved the manuscript and none of them have any potential conflicts of interest to report.
Dr. Stefan had full access to all of the data in the study and takes responsibility for the integrity of the data and the accuracy of the data analysis. Conception and design: Mihaela S. Stefan, Penelope S. Pekow, Michael B. Rothberg, Jay Steingrub, Peter K. Lindenauer; analysis and interpretation: Meng‐Shiou Shieh, Mihaela S. Stefan, Penelope S. Pekow, Michael B. Rothberg, Tara Lagu, Peter K. Lindenauer; drafting the manuscript for important intellectual content: Mihaela S. Stefan, Penelope S. Pekow, Michael B. Rothberg, Jay Steingrub, Tara Lagu, and Peter K. Lindenauer.
- , . Goldman's Cecil Medicine. 24th ed. Amsterdam, the Netherlands: Elsevier Inc.; 2012.
- , . Textbook of Respiratory Medicine. 5th ed. Philadelphia, PA: Saunders; 2010.
- , , . Epidemiology and outcome of acute respiratory failure in intensive care unit patients. Crit Care Med. 2003;31(4 suppl):S296–S299.
- , , , et al. Epidemiology of critical care syndromes, organ failures, and life‐support interventions in a suburban US community. Chest. 2011;140(6):1447–1455.
- , , , , . The changing epidemiology of mechanical ventilation: a population‐based study. J Intensive Care Med. 2006;21(3):173–182.
- , , , , . Mechanical ventilation in Ontario, 1992–2000: incidence, survival, and hospital bed utilization of noncardiac surgery adult patients. Crit Care Med. 2004;32(7):1504–1509.
- . Contributions to the epidemiology of acute respiratory failure. Crit Care. 2003;7(4):288–290.
- , , , et al. Incidence, severity, and mortality of acute respiratory failure in Berlin, Germany. Am J Respir Crit Care Med. 1995;151(4):1121–1125.
- . Acute respiratory failure in the United States: incidence and 31‐day survival. Chest. 2000;118(4):1100–1105.
- , , , , , . The epidemiology of mechanical ventilation use in the United States. Crit Care Med. 2010;38(10):1947–1953.
- , , , . Trends in the incidence of noncardiogenic acute respiratory failure: the role of race. Crit Care Med. 2012;40(5):1532–1538.
- , , , , . Secular trends in nosocomial infections and mortality associated with noninvasive ventilation in patients with exacerbation of COPD and pulmonary edema. JAMA. 2003;290(22):2985–2991.
- , , , et al. Association of noninvasive ventilation with nosocomial infections and survival in critically ill patients. JAMA. 2000;284(18):2361–2367.
- , , , , . Noninvasive versus conventional mechanical ventilation. An epidemiologic survey. Am J Respir Crit Care Med. 2001;163(4):874–880.
- , , , , , . Does noninvasive ventilation reduce the ICU nosocomial infection risk? A prospective clinical survey. Intensive Care Med. 1999;25(6):567–573.
- Heathcare Cost and Utilization Project (HCUP). Overview of the Nationwide Inpatient Sample. Available at: http://www.hcup‐us.ahrq.gov/nisoverview.jsp. Accessed December 6, 2011.
- , , , , , . Hospitalizations, costs, and outcomes of severe sepsis in the United States 2003 to 2007. Crit Care Med. 2011;40(3):754–761.
- , , , , . Association of diagnostic coding with trends in hospitalizations and mortality of patients with pneumonia, 2003–2009. JAMA. 2012;307(13):1405–1413.
- , , , , . Little evidence of correlation between growth in health care spending and reduced mortality. Health Aff (Millwood). 2010;29(8):1523–1531.
- , , , . The epidemiology of sepsis in the United States from 1979 through 2000. N Engl J Med. 2003;348(16):1546–1554.
- , , , . Rapid increase in hospitalization and mortality rates for severe sepsis in the United States: a trend analysis from 1993 to 2003. Crit Care Med. 2007;35(5):1244–1250.
- , , . Risk factors for ARDS in the United States: analysis of the 1993 National Mortality Followback Study. Chest. 2001;119(4):1179–1184.
- , , , , , . Acute respiratory distress syndrome: estimated incidence and mortality rate in a 5 million‐person population base. Crit Care. 1998;2(1):29–34.
- , , . Validity of procedure codes in International Classification of Diseases, 9th Revision, Clinical Modification administrative data. Med Care. 2004;42(8):801–809.
- , , , . Comorbidity measures for use with administrative data. Med Care. 1998;36(1):8–27.
- , . Epidemiology of sepsis: an update. Crit Care Med. 2001;29(7 suppl):S109–S116.
- , , , , , . Epidemiology and outcomes of acute renal failure in hospitalized patients: a national survey. Clin J Am Soc Nephrol. 2006;1(1):43–51.
- , , , . Facing the challenge: decreasing case fatality rates in severe sepsis despite increasing hospitalizations. Crit Care Med. 2005;33(11):2555–2562.
- , , , . National and regional trends in heart failure hospitalization and mortality rates for Medicare beneficiaries,1998–2008. JAMA. 2011;306(15):1669–1678.
- , , , et al. Outcomes of noninvasive ventilation for acute exacerbations of chronic obstructive pulmonary disease in the United States, 1998–2008. Am J Respir Crit Care Med. 2011;185(2):152–159.
- , , , et al. A trial of goal‐oriented hemodynamic therapy in critically ill patients. SvO2 Collaborative Group. N Engl J Med. 1995;333(16):1025–1032.
- , . Ventilation with lower tidal volumes as compared with traditional tidal volumes for acute lung injury. N Engl J Med. 2000;343(11):813; author reply 813–814.
- , , . Short‐ and long‐term survival of nonsurgical intensive care patients and its relation to diagnosis, severity of disease, age and comorbidities. Curr Aging Sci. 2009;2(3):240–248.
- , , , , , . The impact of COPD on management and outcomes of patients hospitalized with acute myocardial infarction—a ten‐year retrospective observational study. Chest. 2012;141(6):1441–1448.
- . The paradox of health. N Engl J Med. 1988;318(7):414–418.
- , , . Rehospitalizations among patients in the Medicare fee‐for‐service program. N Engl J Med. 2009;360(14):1418–1428.
- , , , et al. Outcomes and cost‐effectiveness of ventilator support and aggressive care for patients with acute respiratory failure due to pneumonia or acute respiratory distress syndrome. Am J Med. 2000;109(8):614–620.
- , , , et al. Older age, aggressiveness of care, and survival for seriously ill, hospitalized adults. SUPPORT Investigators. Study to Understand Prognoses and Preferences for Outcomes and Risks of Treatments. Ann Intern Med. 1999;131(10):721–728.
- , , , et al. Patient age and decisions to withhold life‐sustaining treatments from seriously ill, hospitalized adults. SUPPORT Investigators. Study to Understand Prognoses and Preferences for Outcomes and Risks of Treatment. Ann Intern Med. 1999;130(2):116–125.
- , , , et al. Are aggressive treatment strategies less cost‐effective for older patients? The case of ventilator support and aggressive care for patients with acute respiratory failure. J Am Geriatr Soc. 2001;49(4):382–390.
- , . Utilization of non‐invasive ventilation in patients with acute respiratory failure from 2000–2009: a population‐based study. Am J Respir Crit Care Med. 2012;185:A6488.
- , , , et al. One‐year outcomes in survivors of the acute respiratory distress syndrome. N Engl J Med. 2003;348(8):683–693.
Acute respiratory failure (ARF), a common and serious complication in hospitalized patients, may be caused by several conditions including pneumonia, chronic obstructive pulmonary disease (COPD), adult respiratory distress syndrome (ARDS), and congestive heart failure (CHF). Although ARF is conventionally defined by an arterial oxygen tension of <60 mm Hg, an arterial carbon dioxide tension of >45 mm Hg, or both, these thresholds serve as a guide to be used in combination with history and clinical assessment of the patient.[1, 2] Supplemental oxygen and treatment of the underlying cause is the mainstay of therapy for ARF, but in severe cases patients are treated with invasive mechanical ventilation (IMV) or noninvasive ventilation (NIV). ARF is the most frequent reason for admission to the intensive care unit (ICU)[3, 4] and has an in‐hospital mortality rate of 33% to 37% among those who require IMV.[5, 6] The majority of epidemiologic studies of ARF have been limited to patients requiring mechanical ventilation or those admitted to the ICU, and information about the characteristics and outcomes of patients across the full spectrum of severity is much more limited.[5, 7, 8, 9, 10, 11] General improvements in the management of underlying conditions, implementation of more effective ventilation strategies,[12, 13] and increasing use of NIV[14, 15] may have led to better outcomes for patients with ARF, yet empirical evidence of a change in the adjusted mortality rate over time is lacking.
The objective of this study was to provide a broad characterization of the epidemiology of ARF among adults hospitalized in the United States using a large nationally representative database. We sought to evaluate whether incidence, mortality, cost, or ventilation practice associated with ARF in the United States changed over the period of 2001 to 2009.
METHODS
Data Source
We utilized data from the Nationwide Inpatient Sample (NIS) of the Health Care Cost and Utilization Project,[16] which is a 20% stratified probability sample of all US acute‐care hospitals each year. These data are drawn from a sampling frame that contains close to 95% of all discharges in the United States, with the hospital discharge record as the unit of analysis. The NIS has been used to study trends in many different diagnoses.[17, 18, 19] The database contains demographic information, payer information, principal and secondary diagnoses, cost, discharge disposition, and death during hospitalization. It also contains information on hospital characteristics including ownership, size, teaching status, and geographic region.
Definitions
We included patients 18 years old discharged between 2001 and 2009 with a primary or secondary diagnosis of ARF. We identified cases of ARF using diagnostic codes (International Classification of Diseases, Ninth Revision, Clinical Modification [ICD‐9‐CM]) previously used in studies of acute organ dysfunction in sepsis (518.81, 518.82, 518.84, 518.4, 799.1, 786.09).[17, 20, 21] To define ARDS we relied on ICD‐9‐CM codes (518.4, 518.82, 518.5, 786.09) used in prior studies that showed good sensitivity and specificity.[22, 23] The use of ventilatory support was identified using the ICD‐9‐CM procedure codes[24] (93.90, 93.70, 93.71, 93.76). Comorbidities were classified using the Agency for Healthcare Research and Quality's (Rockville, MD) Healthcare Cost and Utilization Project's (HCUP) Comorbidity Software version 3.103.5.[25]
Outcomes
The primary outcomes included the annual number of hospitalizations, population incidence, hospital mortality, and costs of care. Secondary outcomes included length of stay, most common diagnoses associated with ARF, disposition at discharge, and use and type of ventilatory support.
Analysis
We estimated the number of hospitalizations with a diagnosis of ARF/year, and we calculated the weighted frequencies following HCUP‐NIS recommendations using SAS/STAT survey procedures. Using population estimates for the years 2001 to 2009 from the US Census Bureau, we employed direct standardization to calculate age‐, gender‐, and race‐adjusted population incidence and mortality rates of ARF per 100,000 population. Hospital mortality was defined as the ratio of ARF hospitalizations ending in death divided by total number of ARF hospitalizations. Mechanical ventilation rates and rates of selected comorbidities were similarly defined.
We employed indirect standardization to adjust hospital mortality rates for age, sex, race/ethnicity, comorbidities, and hospital characteristics using logistic regression models from 2001 to predict hospital mortality for 2002 to 2009. We used linear regression models to test whether the slope of year was significant for trends in outcomes overtime. Costs were calculated using hospital‐specific cost‐to‐charge ratios when available and a weighted group average at the state level for remaining hospitals. We converted all costs to 2009 US dollars using the Consumer Price Index. Costs and lengths of stay were not normally distributed, so we calculated weighted geometric means (the average of all logarithmic values), then converted back to a base‐10 number. Using a Taylor series expansion, we then calculated standard errors. All analyses were performed using SAS version 9.2 (SAS Institute, Inc., Cary, NC).
The Baystate Medical Center institutional review board determined that the project did not constitute human subjects research.
RESULTS
Hospitalization Trends
The number of hospitalizations with an ARF diagnosis code increased at an average annual rate of 11.3% from 1,007,549 (standard deviation [SD] = 19,268) in 2001 to 1,917,910 (SD = 47,558) in 2009. More than two‐thirds of ARF admissions were associated with medical, rather than surgical, conditions (69.5% in 2001 and 71.2% in 2009). The median age, racial make‐up, and gender did not change significantly. Over the study period we observed an increase in ARF‐related hospitalizations in large, urban, teaching hospitals and in hospitals located in the Midwest (Table 1).
| 2001 | 2003 | 2005 | 2007 | 2009 | |
|---|---|---|---|---|---|
| |||||
| Patient characteristics | |||||
| All, N (SD) | 1,007,549 (19,268) | 1,184,928 (25,542) | 1,288,594 (30,493) | 1,480,270 (32,002) | 1,917,910 (47,558) |
| Age, mean (SE), y | 66.6 (0.2) | 66.0 (0.2) | 66.1 (0.2) | 65.8 (0.2) | 65.8 (0.2) |
| Age group, % | |||||
| 1844 | 11.5 | 12.0 | 11.5 | 11.6 | 10.9 |
| 4564* | 26.7 | 28.9 | 29.6 | 30.7 | 31.7 |
| 6584* | 50.2 | 47.8 | 47.0 | 45.7 | 45.3 |
| 85+ | 11.5 | 11.4 | 11.9 | 12.0 | 12.1 |
| Male* | 48.1 | 48.2 | 48.6 | 49.3 | 49.2 |
| Race | |||||
| White | 75.8 | 71.9 | 76.5 | 71.8 | 73.4 |
| Black | 12.7 | 13.6 | 11.2 | 14.2 | 12.5 |
| Hispanic | 7.2 | 9.8 | 7.7 | 8.5 | 7.8 |
| Other | 4.2 | 4.7 | 4.7 | 5.5 | 6.3 |
| Primary ARF | 20.7 | 20.9 | 25.9 | 26.1 | 19.9 |
| Secondary ARF | 79.3 | 79.1 | 74.1 | 73.9 | 80.1 |
| Medical* | 69.5 | 69.1 | 69.9 | 70.2 | 71.2 |
| Surgical* | 30.5 | 30.8 | 30.1 | 29.8 | 28.8 |
| Hospital characteristics, % | |||||
| Number of beds | |||||
| Small | 10.0 | 10.1 | 10.5 | 10.8 | 11.3 |
| Medium | 25.2 | 25.3 | 24.6 | 24.0 | 22.7 |
| Large | 64.7 | 64.6 | 64.9 | 65.2 | 66.0 |
| Region | |||||
| South* | 18.5 | 18.5 | 17.6 | 17.0 | 16.3 |
| Midwest | 21.4 | 22.0 | 23.6 | 23.2 | 23.5 |
| Northeast | 42.6 | 41.7 | 41.4 | 42.2 | 42.1 |
| West* | 17.5 | 17.8 | 17.3 | 17.6 | 18.1 |
| Hospital type | |||||
| Rural | 13.6 | 13.0 | 11.8 | 11.0 | 10.8 |
| Urban nonteaching | 45.5 | 44.5 | 50.1 | 45.3 | 45.7 |
| Urban teaching | 40.9 | 42.5 | 38.1 | 43.7 | 43.6 |
| Patient outcomes | |||||
| Ventilation strategy | |||||
| IMV* | 48.5 | 48.4 | 47.5 | 46.5 | 42.1 |
| NIV* | 3.8 | 5.3 | 6.9 | 9.4 | 10.1 |
| IMV or NIV | 50.9 | 51.7 | 52.1 | 52.9 | 49.7 |
| Disposition | |||||
| Home/home healthcare* | 42.1 | 43.8 | 42.8 | 43.4 | 45.7 |
| Transfer to acute care | 5.2 | 4.7 | 4.6 | 4.6 | 4.4 |
| Nursing facility* | 24.4 | 24.9 | 27.4 | 28.6 | 29.0 |
| Other | 0.7 | 0.8 | 0.9 | 0.9 | 1.0 |
| Adjusted mortality, % (SE)* | 27.6 (0.3) | 26.4 (0.4) | 24.9 (0.4) | 22.7 (0.4) | 20.6 (0.3) |
| Adjusted mean, LOS/case, d (SE)* | 7.8 (0.1) | 7.9 (0.1) | 7.7 (0.1) | 7.5 (0.1) | 7.1 (0.1) |
| Adjusted mean cost/case, 2009 US$, (SE) | 15,818 (251) | 16,981 (419) | 17,236 (411) | 16,941 (436) | 15,987 (402) |
After adjusting for age and sex, the population incidence of ARF increased from 502 (standard error [SE] = 10) cases per 100,000 in 2001 to 784 (SE = 19) cases per 100,000 in 2009 (a 56% increase, P < 0.0001). Hispanics had the lowest rates of ARF, with both black and white groups having similar rates (Table 2).
| 2001 | 2003 | 2005 | 2007 | 2009 | |
|---|---|---|---|---|---|
| |||||
| All* | 502 (10) | 569 (12) | 595 (14) | 627 (14) | 784 (19) |
| Age group | |||||
| 1844* | 107 (3) | 130 (4) | 137 (4) | 153 (5) | 189 (6) |
| 4564* | 422 (9) | 500 (12) | 521 (13) | 580 (14) | 739 (19) |
| 6584* | 1697 (35) | 1863 (42) | 1950 (50) | 2066 (46) | 2578 (69) |
| 85+ | 3449 (86) | 3792 (106) | 3981 (120) | 3429 (97) | 4163 (123) |
| Sex | |||||
| Male* | 491 (10) | 553 (13) | 582 (14) | 629 (14) | 782 (20) |
| Female* | 512 (10) | 583 (12) | 607 (15) | 625 (13) | 786 (19) |
| Race/ethnicity | |||||
| White* | 398 (11) | 427 (12) | 466 (16) | 450 (13) | 699 (21) |
| Black* | 423 (27) | 513 (33) | 432 (26) | 574 (38) | 738 (37) |
| Hispanic* | 247 (24) | 381 (42) | 307 (27) | 353 (34) | 478 (42) |
| Other* | 268 (20) | 342 (29) | 347 (26) | 424 (29) | 713 (77) |
| In‐hospital mortality | 140 (3) | 148 (3) | 146 (3) | 140 (3) | 154 (4) |
The most common etiologies of ARF among medical patients were pneumonia, CHF, ARDS, COPD exacerbation, and sepsis. Over the 9‐year study, the proportion of cases secondary to pneumonia and sepsis rose significantly: from 39% to 46% and 13% to 21%, respectively (Figure 1).
Mortality and Other Outcomes
The number of in‐hospital deaths related to ARF increased from 277,407 deaths in 2001 to 381,155 in 2009 (a 37% increase, P < 0.001). Standardized to the population, deaths increased from 140 in 2001 to 154 cases per 100,000 in 2009 (a 10% increase, P = 0.027). Despite slightly increasing mortality rates at a population level, adjusted in‐hospital mortality improved from 27.6% in 2001 to 20.6% in 2009 (P < 0.001). Mortality declined for both IMV and NIV patients from 35.3% in 2001 to 30.2% in 2009 and from 23.5% to 19%, respectively, but increased for those who required both NIV and IMV (from 26.9% in 2001 to 28% in 2009).
Adjusted hospital length of stay decreased from 7.8 days per patient in 2001 to 7.1 days in 2009 (P < 0.001), with a concomitant increase in discharges to nursing facilities, from 24% in 2001 to 29% in 2009. There was no linear trend in adjusted cost per case, with $15,818 in 2001 and $15,987 in 2009 (in 2009 US dollars) (Table 1).
Ventilation Practices
Overall, 50.9% patients received ventilatory support (NIV or IMV or both) in 2001 and 49.7% in 2009 (P= 0.25). The use of NIV increased from 3.8% to 10.1% (P < 0.001), a 169% increase, whereas the utilization of IMV decreased from 48.5% in 2001 to 42.1% in 2009 (P for trend < 0.0001), a 13% decrease. Uses of both NIV and IMV during hospitalization were seen in 1.4% of cases in 2001 and 2.5% of cases in 2009.
2009 Data Analysis
In 2009 the 1,917,910 hospitalizations with ARF resulted in 381,155 (SD = 8965) deaths and a total inpatient cost of $54 billion. The most common etiologies in patients over 65 years old were pneumonia, CHF, COPD, ARDS, and sepsis. In patients younger than 45 years the most frequent diagnoses were pneumonia, ARDS, sepsis, asthma, drug ingestion, and trauma. Stratified analysis by gender and by age groups showed that mortality rates among men were higher than for women and were highest in patients older than 85 years (Table 3).
| Disease | Total | Age <45 Years | 4565 Years | 6584 Years | 85+ Years | Male | Female |
|---|---|---|---|---|---|---|---|
| |||||||
| Medical | |||||||
| Total, N (%) | 1,364,624 (71.2) | 144,715 (10.6) | 416,922 (30.6) | 615,009 (45.1) | 187,977 (13.8) | 647,894 (47.5) | 716,635 (52.5) |
| Pneumonia, %* | 46.1 | 41.7 | 42.8 | 46.9 | 54.3 | 48.8 | 43.7 |
| CHF, %* | 36.6 | 10.4 | 27.3 | 43.6 | 54.8 | 35.0 | 38.1 |
| ARDS, %* | 16.1 | 22.9 | 16.2 | 14.5 | 15.9 | 15.5 | 16.7 |
| Sepsis, %* | 21.2 | 18.1 | 21.3 | 21.3 | 23.1 | 22.8 | 19.8 |
| COPD, %* | 25.4 | 4.2 | 25.6 | 32.3 | 18.3 | 25.0 | 25.7 |
| AMI, %* | 9.0 | 2.6 | 7.1 | 10.5 | 13.3 | 9.3 | 8.8 |
| Asthma, %* | 9.2 | 18.1 | 11.6 | 6.7 | 5.4 | 6.2 | 12.0 |
| Stroke, %* | 4.8 | 2.3 | 4.1 | 5.5 | 6.0 | 5.0 | 4.7 |
| Trauma or burns, %* | 3.4 | 5.4 | 2.9 | 3.0 | 4.1 | 4.3 | 2.5 |
| Cardiorespiratory arrest, %* | 4.1 | 3.9 | 4.4 | 4.1 | 3.8 | 4.6 | 3.7 |
| Drug, %* | 3.7 | 16.6 | 5.1 | 0.8 | 0.3 | 3.8 | 3.6 |
| IMV, %* | 37.7 | 54.6 | 43.7 | 33.5 | 24.8 | 41.1 | 34.5 |
| NIV, %* | 11.9 | 7.1 | 11.5 | 13.0 | 12.7 | 11.4 | 12.3 |
| In‐hospital mortality (CI) | 22 (21.322.7) | 12.9 (11.913.9) | 18.5 (17.619.4) | 23.9 (23.024.9) | 31.8 (30.633.1) | 24.2 (23.325.1) | 20.9 (20.121.7) |
| Surgical | |||||||
| Total, N (%) | 552971 (28.8) | 64983 (11.8) | 190225 (34.4) | 254336 (46) | 43426 (7.9) | 295660 (53.5) | 257287 (46.5) |
| Pneumonia, %* | 34.9 | 33.0 | 34.0 | 35.0 | 40.5 | 37.1 | 32.2 |
| CHF, %* | 27.2 | 8.9 | 21.7 | 33.3 | 42.6 | 26.7 | 27.7 |
| ARDS, %* | 45.5 | 51.5 | 45.2 | 44.7 | 42.7 | 45.0 | 46.1 |
| Sepsis, %* | 25.1 | 22.8 | 25.4 | 25.2 | 26.1 | 25.4 | 24.7 |
| COPD, %* | 8.2 | 1.1 | 7.4 | 10.8 | 7.5 | 8.3 | 8.1 |
| AMI, %* | 16.9 | 4.9 | 17.0 | 19.8 | 17.9 | 19.1 | 14.4 |
| Asthma, %* | 6.1 | 7.6 | 7.2 | 5.4 | 3.6 | 4.1 | 8.5 |
| Stroke, %* | 8.9 | 6.6 | 9.2 | 9.4 | 7.2 | 8.9 | 8.8 |
| Trauma or burns, %* | 12.2 | 26.5 | 9.6 | 9.2 | 20.3 | 13.8 | 10.4 |
| Cardiorespiratory arrest, %* | 5.5 | 4.4 | 6.0 | 5.4 | 5.2 | 6.1 | 4.7 |
| Drug, %* | 0.5 | 1.3 | 0.7 | 0.2 | 0.2 | 0.4 | 0.6 |
| IMV, %* | 52.9 | 57.1 | 54.3 | 51.3 | 50.0 | 54.5 | 51.0 |
| NIV, %* | 5.8 | 3.5 | 5.5 | 6.4 | 6.4 | 5.6 | 6.0 |
| In‐hospital mortality, % (CI) | 18.6 (17.819.5) | 10.7 (9.312.0) | 15.5 (14.216.8) | 20.8 (19.821.9) | 29.4 (27.831.1) | 19.0 (18.219.8) | 18.3 (17.319.2) |
When we examined ventilation practices among medical patients we found that patients older than 85 years, when compared to patients younger than 45 years, were less likely to be treated with IMV (25% vs 55%) and more likely to be treated with NIV (12.7% vs 7%). At the same time, the average cost per case was lowest among patients 85 years and older, and hospital costs per case fell sharply after age 70 years. Costs were considerably higher for those who did not survive during hospitalization, particularly for patients younger than 45 years (Figure 2).
DISCUSSION
In this large population‐based study, we found that the number of hospitalizations associated with a diagnosis of ARF almost doubled over a 9‐year period. In 2009 there were nearly 2 million hospitalizations with ARF in the United States, resulting in approximately 380,000 deaths and inpatient costs of over $54 billion. The population‐adjusted ARF hospitalization rates increased in all age groups, and patients 85 years and older had the highest age‐specific hospitalization rate. Although overall rates of mechanical ventilation (NIV or IMV) remained stable over the 9‐year period, there was an important shift away from IMV (which decreased from 48% in 2001 to 42% in 2009) toward NIV (which increased from 4% in 2001 to 10% in 2009). Overall, there was a significant increase in the number of total deaths despite a decline in adjusted in‐hospital mortality rates. In‐hospital mortality rates decreased for all cases of ARF regardless of ventilation choice.
The findings of this study mirror results of others that have shown that although the incidence of critical care illnesses like sepsis[17, 20, 21, 26] and acute renal failure[27] has increased over the last decade, in‐hospital mortality rates have decreased.[20, 21, 28] Our results also compliment the results of a recent study that looked at hospitalizations for noncardiogenic ARF, which observed a 3.7‐fold increase in the number of cases and a steady decline in case fatality.[11]
Most prior studies addressing the incidence of ARF have included only patients receiving mechanical ventilation. In 1994, the estimated number of cases of ARF requiring IMV was 329,766,[9] which increased to 790,257 in 2005.[10] In our study we found that in 2009, the number of patients with ARF hospitalizations with IMV increased to 806,538. The increase in the overall number of cases with ARF was mainly driven by a surge in cases of sepsis and pneumonia. Our findings are consistent with national trends over time in noncardiogenic ARF[11] and in conditions that predispose patients to ARF such as sepsis[17, 20, 28] and acute renal failure.[27] As the number of claims for ARF doubled and the number of deaths increased, we found that adjusted hospital mortality improved from 27.6% in 2001 to 20.6% in 2009. This decline in hospital mortality was observed among all patients groups, regardless of ventilation choice. The decline in overall case fatality is consistent with prior findings in noncardiogenic ARF,[11] sepsis,[17, 28] and CHF.[29]
There are a number of potential explanations for the reduction in mortality observed over the study period, including improvements in hospital management of the underlying conditions leading to ARF, an increase in the proportion of patients being treated with NIV,[30] and advances in the care of critically ill patients such as the use of low‐tidal volume ventilation.[31, 32] Another contributor may be an increase in the proportion of discharges to nursing facilities, although this change in discharge disposition cannot fully explain our findings. For example, from 2007 to 2009, mortality decreased by 2 percentage points, and nursing home discharges increased by only 0.4 percentage points. Growth and aging of the US population only partially explain the increase we observed in the incidence of ARF, as age‐ and sex‐adjusted population rates increased by 56% from 2001 to 2009. In addition, the NIS captures data on hospital discharges and not individual patients; thus, a patient may have had multiple admissions. Over the last decade adoption of a more intensive practice style has been associated with improved in‐hospital mortality,[33, 34] and although these patients may be living longer they may have multiple readmissions.[35, 36]
We also observed that older patients were less likely to be treated with IMV, had a higher mortality rate, and less expensive care. These results are consistent with other studies and suggest that the intensity of treatment decreases with increasing age, and decisions to withhold or withdraw life‐supporting treatments are more frequent in the elderly.[26, 37] Prior research has shown that severity of illness is more important than age on patients' prognosis,[38, 39] and aggressive treatment strategies are not less cost‐effective when provided to older patients.[40]
Another important finding of this study is the marked increase in the use of NIV paired with a modest reduction in the use of IMV in the treatment of patients with ARF. This finding adds to evidence from other studies, which have similarly reported a dramatic increase in the use of NIV and a decrease in the use of IMV in patients with COPD as well as in ARF of other etiologies.[30, 41]
Our work has several limitations. First, we identified ARF based on ICD‐9‐CM codes and therefore cannot exclude disease misclassification. We did not find any studies in the literature addressing the accuracy and the completeness of ARF coding. However, we employed the same codes used to define ARF as has been used to define organ dysfunction in studies of severe sepsis,[17, 20] and the ICD‐9‐CM codes that we used to identify cases of ARDS have been used in prior studies.[11, 22, 23] Another limitation is that it is not clear to what extent the trends we observed may be due to changes over time in documentation and coding practices. Although this should be considered given the additional reimbursement associated with the diagnosis of ARF, our observation that rates of assisted ventilation have remained almost flat over the 9‐year period of the study suggest that would not wholly account for the rise in ARF. Second, because we did not have access to physiological data such as results of blood gas testing, we could not determine whether the threshold for applying the diagnosis of ARF or for delivering ventilatory support has changed over time. Third, for the purpose of this study we employed a broad definition of ARF, not limiting cases to those requiring mechanical ventilation, and this led to a more heterogeneous cohort including less severe cases of ARF. However, this is not dissimilar to the heterogeneity in disease severity observed among patients who receive a diagnosis of heart failure or acute renal failure. Fourth, survivors of ARF remain at high risk of death in the months after hospitalization,[42] but we assessed only in‐hospital mortality. It is possible that although in‐hospital mortality has improved, 30‐day mortality remained stable. Finally, as the NIS contains only discharge‐level data, we could not distinguish between patients admitted for ARF from those who developed ARF (potentially iatrogenic) after admission.
In summary, over the period of 2001 to 2009, there was a large increase in the number of patients given a diagnosis of ARF and a concomitant reduction in inpatient mortality. Although rates of mechanical ventilation remained relatively constant, there was a significant shift toward greater use of NIV at the expense of IMV.
Disclosures
Dr. Stefan is supported by KM1 CA156726 from the National Cancer Institute (NCI) and by the National Center for Research Resources and the National Center for Advancing Translational Sciences, National Institutes of Health (NIH), through grant UL1 RR025752. The work on this study was supported by a Charlton grant from Tufts University School of Medicine. Dr. Lindenauer and Dr. Pekow are supported by 1R18HL108810‐01 from the National Heart, Lung, and Blood Institute (NHLBI). The content of this publication is solely the responsibility of the authors and does not represent the official views of the NIH, NHLBI, or NCI.
All authors have read and approved the manuscript and none of them have any potential conflicts of interest to report.
Dr. Stefan had full access to all of the data in the study and takes responsibility for the integrity of the data and the accuracy of the data analysis. Conception and design: Mihaela S. Stefan, Penelope S. Pekow, Michael B. Rothberg, Jay Steingrub, Peter K. Lindenauer; analysis and interpretation: Meng‐Shiou Shieh, Mihaela S. Stefan, Penelope S. Pekow, Michael B. Rothberg, Tara Lagu, Peter K. Lindenauer; drafting the manuscript for important intellectual content: Mihaela S. Stefan, Penelope S. Pekow, Michael B. Rothberg, Jay Steingrub, Tara Lagu, and Peter K. Lindenauer.
- , . Goldman's Cecil Medicine. 24th ed. Amsterdam, the Netherlands: Elsevier Inc.; 2012.
- , . Textbook of Respiratory Medicine. 5th ed. Philadelphia, PA: Saunders; 2010.
- , , . Epidemiology and outcome of acute respiratory failure in intensive care unit patients. Crit Care Med. 2003;31(4 suppl):S296–S299.
- , , , et al. Epidemiology of critical care syndromes, organ failures, and life‐support interventions in a suburban US community. Chest. 2011;140(6):1447–1455.
- , , , , . The changing epidemiology of mechanical ventilation: a population‐based study. J Intensive Care Med. 2006;21(3):173–182.
- , , , , . Mechanical ventilation in Ontario, 1992–2000: incidence, survival, and hospital bed utilization of noncardiac surgery adult patients. Crit Care Med. 2004;32(7):1504–1509.
- . Contributions to the epidemiology of acute respiratory failure. Crit Care. 2003;7(4):288–290.
- , , , et al. Incidence, severity, and mortality of acute respiratory failure in Berlin, Germany. Am J Respir Crit Care Med. 1995;151(4):1121–1125.
- . Acute respiratory failure in the United States: incidence and 31‐day survival. Chest. 2000;118(4):1100–1105.
- , , , , , . The epidemiology of mechanical ventilation use in the United States. Crit Care Med. 2010;38(10):1947–1953.
- , , , . Trends in the incidence of noncardiogenic acute respiratory failure: the role of race. Crit Care Med. 2012;40(5):1532–1538.
- , , , , . Secular trends in nosocomial infections and mortality associated with noninvasive ventilation in patients with exacerbation of COPD and pulmonary edema. JAMA. 2003;290(22):2985–2991.
- , , , et al. Association of noninvasive ventilation with nosocomial infections and survival in critically ill patients. JAMA. 2000;284(18):2361–2367.
- , , , , . Noninvasive versus conventional mechanical ventilation. An epidemiologic survey. Am J Respir Crit Care Med. 2001;163(4):874–880.
- , , , , , . Does noninvasive ventilation reduce the ICU nosocomial infection risk? A prospective clinical survey. Intensive Care Med. 1999;25(6):567–573.
- Heathcare Cost and Utilization Project (HCUP). Overview of the Nationwide Inpatient Sample. Available at: http://www.hcup‐us.ahrq.gov/nisoverview.jsp. Accessed December 6, 2011.
- , , , , , . Hospitalizations, costs, and outcomes of severe sepsis in the United States 2003 to 2007. Crit Care Med. 2011;40(3):754–761.
- , , , , . Association of diagnostic coding with trends in hospitalizations and mortality of patients with pneumonia, 2003–2009. JAMA. 2012;307(13):1405–1413.
- , , , , . Little evidence of correlation between growth in health care spending and reduced mortality. Health Aff (Millwood). 2010;29(8):1523–1531.
- , , , . The epidemiology of sepsis in the United States from 1979 through 2000. N Engl J Med. 2003;348(16):1546–1554.
- , , , . Rapid increase in hospitalization and mortality rates for severe sepsis in the United States: a trend analysis from 1993 to 2003. Crit Care Med. 2007;35(5):1244–1250.
- , , . Risk factors for ARDS in the United States: analysis of the 1993 National Mortality Followback Study. Chest. 2001;119(4):1179–1184.
- , , , , , . Acute respiratory distress syndrome: estimated incidence and mortality rate in a 5 million‐person population base. Crit Care. 1998;2(1):29–34.
- , , . Validity of procedure codes in International Classification of Diseases, 9th Revision, Clinical Modification administrative data. Med Care. 2004;42(8):801–809.
- , , , . Comorbidity measures for use with administrative data. Med Care. 1998;36(1):8–27.
- , . Epidemiology of sepsis: an update. Crit Care Med. 2001;29(7 suppl):S109–S116.
- , , , , , . Epidemiology and outcomes of acute renal failure in hospitalized patients: a national survey. Clin J Am Soc Nephrol. 2006;1(1):43–51.
- , , , . Facing the challenge: decreasing case fatality rates in severe sepsis despite increasing hospitalizations. Crit Care Med. 2005;33(11):2555–2562.
- , , , . National and regional trends in heart failure hospitalization and mortality rates for Medicare beneficiaries,1998–2008. JAMA. 2011;306(15):1669–1678.
- , , , et al. Outcomes of noninvasive ventilation for acute exacerbations of chronic obstructive pulmonary disease in the United States, 1998–2008. Am J Respir Crit Care Med. 2011;185(2):152–159.
- , , , et al. A trial of goal‐oriented hemodynamic therapy in critically ill patients. SvO2 Collaborative Group. N Engl J Med. 1995;333(16):1025–1032.
- , . Ventilation with lower tidal volumes as compared with traditional tidal volumes for acute lung injury. N Engl J Med. 2000;343(11):813; author reply 813–814.
- , , . Short‐ and long‐term survival of nonsurgical intensive care patients and its relation to diagnosis, severity of disease, age and comorbidities. Curr Aging Sci. 2009;2(3):240–248.
- , , , , , . The impact of COPD on management and outcomes of patients hospitalized with acute myocardial infarction—a ten‐year retrospective observational study. Chest. 2012;141(6):1441–1448.
- . The paradox of health. N Engl J Med. 1988;318(7):414–418.
- , , . Rehospitalizations among patients in the Medicare fee‐for‐service program. N Engl J Med. 2009;360(14):1418–1428.
- , , , et al. Outcomes and cost‐effectiveness of ventilator support and aggressive care for patients with acute respiratory failure due to pneumonia or acute respiratory distress syndrome. Am J Med. 2000;109(8):614–620.
- , , , et al. Older age, aggressiveness of care, and survival for seriously ill, hospitalized adults. SUPPORT Investigators. Study to Understand Prognoses and Preferences for Outcomes and Risks of Treatments. Ann Intern Med. 1999;131(10):721–728.
- , , , et al. Patient age and decisions to withhold life‐sustaining treatments from seriously ill, hospitalized adults. SUPPORT Investigators. Study to Understand Prognoses and Preferences for Outcomes and Risks of Treatment. Ann Intern Med. 1999;130(2):116–125.
- , , , et al. Are aggressive treatment strategies less cost‐effective for older patients? The case of ventilator support and aggressive care for patients with acute respiratory failure. J Am Geriatr Soc. 2001;49(4):382–390.
- , . Utilization of non‐invasive ventilation in patients with acute respiratory failure from 2000–2009: a population‐based study. Am J Respir Crit Care Med. 2012;185:A6488.
- , , , et al. One‐year outcomes in survivors of the acute respiratory distress syndrome. N Engl J Med. 2003;348(8):683–693.
Copyright © 2012 Society of Hospital Medicine