User login
Pediatric Hospitalization Epidemiology
Improvement in the quality of hospital care in the United States is a national priority, both to advance patient safety and because our expenditures exceed any other nation's, but our health outcomes lag behind.[1, 2] Healthcare spending for children is growing at a faster rate than any other age group, with hospital care accounting for more than 40% of pediatric healthcare expenditures.[3] Inpatient healthcare comprises a greater proportion of healthcare costs for children than for adults, yet we have limited knowledge about where this care is provided.[4]
There is substantial variability in the settings in which children are hospitalized. Children may be hospitalized in freestanding children's hospitals, where all services are designed for children and which operate independently of adult‐focused institutions. They may also be hospitalized in general hospitals where care may be provided in a general inpatient bed, on a dedicated pediatric ward, or in a children's hospital nested within a hospital, which may have specialized nursing and physician care but often shares other resources such as laboratory and radiology with the primarily adult‐focused institution. Medical students and residents may be trained in all of these settings. We know little about how these hospital types differ with respect to patient populations, disease volumes, and resource utilization, and this knowledge is important to inform clinical programs, implementation research, and quality improvement (QI) priorities. To this end, we aimed to describe the volume and characteristics of pediatric hospitalizations at acute care general hospitals and freestanding children's hospitals in the United States.
METHODS
Study Design and Eligibility
The data source for this analysis was the Healthcare Cost and Utilization Project's (HCUP) 2012 Kids' Inpatient Database (KID). We conducted a cross‐sectional study of hospitalizations in children and adolescents less than 18 years of age, excluding in‐hospital births and hospitalizations for pregnancy and delivery (identified using All Patient Refined‐Diagnostic Related Groups [APR‐DRGs]).[5] Neonatal hospitalizations not representing in‐hospital births but resulting from transfers or new admissions were retained. Because the dataset does not contain identifiable information, the institutional review board at Baystate Medical Center determined that our study did not constitute human subjects research.
The KID is released every 3 years and is the only publicly available, nationally representative database developed to study pediatric hospitalizations, including an 80% sample of noninborn pediatric discharges from all community, nonrehabilitation hospitals from 44 participating states.[6] Short‐term rehabilitation hospitals, long‐term nonacute care hospitals, psychiatric hospitals, and alcoholism/chemical dependency treatment facilities are excluded. The KID contains information on all patients, regardless of payer, and provides discharge weights to calculate national estimates.[6] It contains both hospital‐level and patient‐level variables, including demographic characteristics, charges, and other clinical and resource use data available from discharge abstracts. Beginning in 2012, freestanding children's hospitals (FCHs) are assigned to a separate stratum in the KID, with data from the Children's Hospital Association used by HCUP to verify the American Hospital Association's (AHA) list of FCHs.[6] Hospitals that are not FCHs were categorized as general hospitals (GHs). We were interested in examining patterns of care at acute care hospitals and not specialty hospitals; unlike previous years, the KID 2012 does not include a specialty hospital identifier.[6] Therefore, as a proxy for specialty hospital status, we excluded hospitals that had 2% hospitalizations for 12 common medical conditions (pneumonia, asthma, bronchiolitis, cellulitis, dehydration, urinary tract infection, neonatal hyperbilirubinemia, fever, upper respiratory infection, infectious gastroenteritis, unspecified viral infection, and croup). These medical conditions were the 12 most common reasons for medical hospitalizations identified using Keren's pediatric diagnosis code grouper,[7] excluding chronic diseases, and represented 26.2% of all pediatric hospitalizations. This 2% threshold was developed empirically, based on visual analysis of the distribution of cases across hospitals and was limited to hospitals with total pediatric volumes >25/year, allowing for stable case‐mix estimates.
Descriptor Variables
Hospital level characteristics included US Census region; teaching status classified in the KID based on results of the AHA Annual Survey; urban/rural location; hospital ownership, classified as public, private nonprofit and private investor‐owned; and total volume of pediatric hospitalizations, in deciles.[6] At the patient level, we examined age, gender, race/ethnicity, expected primary payer, and median household income (in quartiles) for patient's zip code. Medical complexity was categorized as (1) nonchronic disease, (2) complex chronic disease, or (3) noncomplex chronic disease, using the previously validated Pediatric Medical Complexity Algorithm (PMCA) based on International Classification of Diseases, 9th Revision, Clinical Modification (ICD‐9‐CM) codes.[8] Disease severity was classified based on APR‐DRG severity of illness coding, which classifies illnesses severity as minor, moderate, major, or extreme.[9]
We examined the following characteristics of the hospitalizations: (1) length of hospital stay (LOS) measured in calendar days; (2) high‐turnover hospitalization defined as LOS less than 2 days[10, 11, 12]; (3) long LOS, defined as greater than 4 days, equivalent to LOS greater than the 75th percentile; (4) neonatal versus non‐neonatal hospitalization, identified using APR‐DRGs; (5) admission type categorized as elective and nonelective; (6) admission source, categorized as transfer from another acute care hospital, admission from the emergency department, or direct admission; (7) discharge status, categorized as routine discharge, transfer to another hospital or healthcare facility, and discharge against medical advice; and (8) total hospital costs, calculated by applying the cost‐to‐charge ratios available in the KID to total hospital charges.
Reasons for hospitalization were categorized using the pediatric diagnosis code grouper by Keren, which uses ICD‐9‐CM codes to group common and costly principal diagnoses into distinct conditions (eg, pneumonia, idiopathic scoliosis), excluding children who have ICD‐9‐CM principal procedure codes unlikely related to their principal diagnosis (for example, appendectomy for a child with a principal diagnosis of pneumonia).[7] This pediatric grouper classifies diagnoses as medical, surgical, or medical‐surgical based on whether <20% (medical), >80% (surgical) or between 20% and 80% (medical‐surgical) of encounters for the condition had an ICD‐9‐CM principal procedure code for a surgery related to that condition. We further characterized medical hospitalizations as either medical or mental health hospitalizations.
Statistical Analysis
We categorized each discharge record as a hospitalization at a GH or an FCH. We then calculated patient‐level summary statistics, applying weights to calculate national estimates with an associated standard deviation (SD). We assessed differences in characteristics of hospitalizations at GHs and FCHs using Rao‐Scott 2 tests for categorical variables and Wald F tests for continuous variables.[6] We identified the most common reasons for hospitalization, including those responsible for at least 2% of all medical or surgical hospitalizations and at least 0.5% of medical hospitalizations for mental health diagnoses, given the lower prevalence of these conditions and our desire to include mental health diagnoses in our analysis. For these common conditions, we calculated the proportion of condition‐specific hospitalizations and aggregate hospital costs at GHs and FCHs. We also determined the number of hospitalizations at each hospital and calculated the median and interquartile range for the number of hospitalizations for each of these conditions according to hospital type, assessing for differences using Kruskal‐Wallis tests. Finally, we identified the most common and costly conditions at GHs and FCHs by ranking frequency and aggregate costs for each condition according to hospital type, limited to the 20 most costly and/or prevalent pediatric diagnoses. Because we used a novel method to identify specialty hospitals in this dataset, we repeated these analyses using all hospitals classified as a GH and FCH as a sensitivity analysis.
RESULTS
Overall, 3866 hospitals were categorized as a GH, whereas 70 hospitals were categorized as FCHs. Following exclusion of specialty hospitals, 3758 GHs and 50 FCHs were retained in this study. The geographic distribution of hospitals was similar, but although GHs included those in both urban and rural regions, all FCHs were located in urban regions (Table 1).
| General Hospitals, n = 3,758 | Children's Hospitals, n = 50 | ||||
|---|---|---|---|---|---|
| Hospital characteristics | n | % | n | % | P Value |
| |||||
| Geographic region | |||||
| Northeast | 458 | 12.2 | 4 | 8.0 | 0.50 |
| Midwest | 1,209 | 32.2 | 15 | 30.0 | |
| South | 1,335 | 35.6 | 17 | 34.0 | |
| West | 753 | 20.1 | 14 | 28.0 | |
| Location and teaching status | |||||
| Rural | 1,524 | 40.6 | 0 | 0 | <0.0001 |
| Urban nonteaching | 1,506 | 40.1 | 7 | 14.0 | |
| Urban teaching | 725 | 19.3 | 43 | 86.0 | |
| Hospital ownership | |||||
| Government, nonfederal | 741 | 19.7 | 0 | 0 | <0.0001 |
| Private, nonprofit | 2,364 | 63.0 | 48 | 96.0 | |
| Private, investor‐owned | 650 | 17.3 | 2 | 4.0 | |
| Volume of pediatric hospitalizations (deciles) | |||||
| <185 hospitalizations/year (<8th decile) | 2,664 | 71.0 | 0 | 0 | <0.0001 |
| 186375 hospitalizations/year (8th decile) | 378 | 10.1 | 2 | 4.0 | |
| 376996 hospitalizations/year (9th decile) | 380 | 10.1 | 1 | 2.0 | |
| >986 hospitalizations/year (10th decile) | 333 | 8.9 | 47 | 94.0 | |
| Volume of pediatric hospitalizations, median [IQR] | 56 | [14240] | 12,001 | [5,83815,448] | <0.0001 |
A total of 1,407,822 (SD 50,456) hospitalizations occurred at GHs, representing 71.7% of pediatric hospitalizations, whereas 554,458 (SD 45,046) hospitalizations occurred at FCHs. Hospitalizations at GHs accounted for 63.6% of days in hospital and 50.0% of pediatric inpatient healthcare costs. Eighty percent of the GHs had total pediatric patient volumes of less than 375 hospitalizations yearly; 11.1% of pediatric hospitalizations occurred at these lower‐volume centers. At FCHs, the median volume of pediatric hospitalizations was 12,001 (interquartile range [IQR]: 583815,448). A total of 36 GHs had pediatric hospitalization volumes in this IQR.
The median age for pediatric patients was slightly higher at GHs, whereas gender, race/ethnicity, primary payer, and median household income for zip code did not differ significantly between hospital types (Table 2). Medical complexity differed between hospital types: children with complex chronic diseases represented 20.2% of hospitalizations at GHs and 35.6% of hospitalizations at FCHs. Severity of illness differed between hospital types, with fewer hospitalizations categorized at the highest level of severity at GHs than FCHs. There were no significant differences between hospital types with respect to the proportion of hospitalizations categorized as neonatal hospitalizations or as elective hospitalizations. The median LOS was shorter at GHs than FCHs. Approximately 1 in 5 children hospitalized at GHs had LOS greater than 4 days, whereas almost 30% of children hospitalized at FCHs had LOS of this duration.
| Patient Characteristics |
General Hospitals,1,407,822 (50,456), 71.7% |
Children's Hospitals,554,458 (45,046), 28.3% |
P Value | ||||
|---|---|---|---|---|---|---|---|
| n | (SD Weighted Frequency) | (%) | n | (SD Weighted Frequency) | % | ||
| |||||||
| Age, y, median [IQR] | 3.6 [011.7] | 3.4 [010.8] | 0.001 | ||||
| Gender (% female) | 644,250 | (23,089) | 45.8 | 254,505 | (20,688) | 45.9 | 0.50 |
| Race* | |||||||
| White | 668,876 | (27,741) | 47.5 | 233,930 | (26,349) | 42.2 | 0.05 |
| Black | 231,586 | (12,890) | 16.5 | 80,568 | (11,739) | 14.5 | |
| Hispanic | 279,021 | (16,843) | 19.8 | 12,1425 | (21,183) | 21.9 | |
| Other | 133,062 | (8,572) | 9.5 | 41,190 | (6,394) | 7.4 | |
| Insurance status | |||||||
| Public | 740,033 | (28,675) | 52.6 | 284,795 | (25,324) | 51.4 | 0.90 |
| Private | 563,562 | (21,930) | 40.0 | 224,042 | (21,613) | 40.4 | |
| Uninsured | 37,265 | (1,445) | 2.7 | 16,355 | (3,804) | 3.0 | |
| No charge/other/unknown | 66,962 | (5,807) | 4.8 | 29,266 | (6,789) | 5.3 | |
| Median household income for zip code, quartiles | |||||||
| <$38,999 | 457,139 | (19,725) | 33.3 | 164,831 | (17,016) | 30.1 | 0.07 |
| $39,000$47,999 | 347,229 | (14,104) | 25.3 | 125,105 | (10,712) | 22.9 | |
| $48,000$62,999 | 304,795 | (13,427) | 22.2 | 134,915 | (13,999) | 24.7 | |
| >$63,000 | 263,171 | (15,418) | 19.2 | 122,164 | (16,279) | 22.3 | |
| Medical complexity | |||||||
| Nonchronic disease | 717,009 | (21,807) | 50.9 | 211,089 | (17,023) | 38.1 | <0.001 |
| Noncomplex chronic disease | 406,070 | (14,951) | 28.8 | 146,077 | (12,442) | 26.4 | |
| Complex chronic disease | 284,742 | (17,111) | 20.2 | 197,292 | (18,236) | 35.6 | |
| APR‐DRG severity of illness | |||||||
| 1 (lowest severity) | 730,134 | (23,162) | 51.9 | 217,202 | (18,433) | 39.2 | <0.001 |
| 2 | 486,748 | (18,395) | 34.6 | 202,931 | (16,864) | 36.6 | |
| 3 | 146,921 | (8,432) | 10.4 | 100,566 | (9,041) | 18.1 | |
| 4 (highest severity) | 41,749 | (3,002) | 3.0 | 33,340 | (3,199) | 6.0 | |
| Hospitalization characteristics | |||||||
| Neonatal hospitalization | 98,512 | (3,336) | 7.0 | 39,584 | (4,274) | 7.1 | 0.84 |
| Admission type | |||||||
| Elective | 255,774 | (12,285) | 18.3 | 109,854 | (13,061) | 19.8 | 0.05 |
| Length of stay, d, (median [IQR]) | 1.8 (0.01) [0.8‐3.6] | 2.2 (0.06) [1.1‐4.7] | <0.001 | ||||
| High turnover hospitalizations | 416,790 | (14,995) | 29.6 | 130,441 | (12,405) | 23.5 | <0.001 |
| Length of stay >4 days | 298,315 | (14,421) | 21.2 | 161,804 | (14,354) | 29.2 | <0.001 |
| Admission source | |||||||
| Transfer from another acute care hospital | 154,058 | (10,067) | 10.9 | 82,118 | (8,952) | 14.8 | 0.05 |
| Direct admission | 550,123 | (21,954) | 39.1 | 211,117 | (20,203) | 38.1 | |
| Admission from ED | 703,641 | (26,155) | 50.0 | 261,223 | (28,708) | 47.1 | |
| Discharge status | |||||||
| Routine | 1,296,638 | (46,012) | 92.1 | 519,785 | (42,613) | 93.8 | <0.01 |
| Transfer to another hospital or healthcare facility | 56,115 | (1,922) | 4.0 | 13,035 | (1,437) | 2.4 | |
| Discharge against medical advice | 2,792 | (181) | 0.2 | 382 | (70) | 0.1 | |
| Other | 52,276 | (4,223) | 3.7 | 21,256 | (4,501) | 3.8 | |
The most common pediatric medical, mental health, and surgical conditions are shown in Figure 1, together representing 32% of pediatric hospitalizations during the study period. For these medical conditions, 77.9% of hospitalizations occurred at GHs, ranging from 52.6% of chemotherapy hospitalizations to 89.0% of hospitalizations for neonatal hyperbilirubinemia. Sixty‐two percent of total hospital costs for these conditions were incurred at GHs. For the common mental health hospitalizations, 86% of hospitalizations occurred at GHs. The majority of hospitalizations and aggregate hospital costs for common surgical conditions also occurred at GHs.

Whereas pneumonia, asthma, and bronchiolitis were the most common reasons for hospitalization at both GHs and FCHs, the most costly conditions differed (see Supporting Table 1 in the online version of this article). At GHs, these respiratory diseases were responsible for the highest condition‐specific total hospital costs. At FCHs, the highest aggregate costs were due to respiratory distress syndrome and chemotherapy. Congenital heart diseases, including hypoplastic left heart syndrome, transposition of the great vessels, tetralogy of Fallot, endocardial cushion defects, coarctation of the aorta and ventricular septal defects accounted for 6 of the 20 most costly conditions at FCHs.
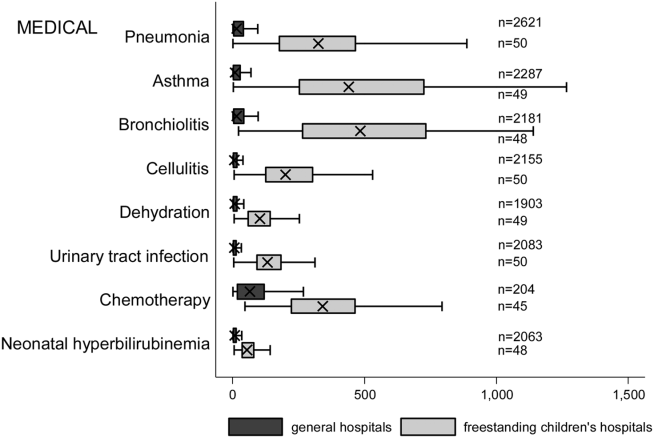
Figure 2 illustrates the volume of hospitalizations, per hospital, at GHs and FCHs for the most common medical hospitalizations. The median number of hospitalizations, per hospital, was consistently significantly lower at GHs than at FCHs (all P values <0.001). Similar results for surgical and mental health hospitalizations are shown as Supporting Figures 1 and 2 in the online version of this article. In our sensitivity analyses that included all hospitals classified as GH and FCH, all results were essentially unchanged.
Recognizing the wide range of pediatric volumes at GHs (Table 1) and our inability to differentiate children's hospitals nested within GHs from GHs with pediatric beds, we examined differences in patient and hospitalization characteristics at GHs with volumes 5838 hospitalizations (the 25th percentile for FCH volume) and GHs with pediatric volumes <5838/year (see Supporting Table 2 in the online version of this article). We also compared patient and hospitalization characteristics at FCHs and the higher‐volume GHs. A total of 36 GHs had pediatric volumes 5838, with hospitalizations at these sites together accounting for 15.4% of all pediatric hospitalizations. Characteristics of patients hospitalized at these higher‐volume GHs were similar to patients hospitalized at FCHs, but they had significantly lower disease severity, fewer neonatal hospitalizations, shorter LOS, and more high‐turnover hospitalizations than patients hospitalized at FCHs. We also observed several differences between children hospitalized at higher‐ and lower‐volume GHs (see Supporting Table 2 in the online version of this article). Children hospitalized at the lower‐volume GHs were more likely to have public health insurance and less likely to have complex chronic diseases, although overall, 39.0% of all hospitalizations for children with complex chronic diseases occurred at these lower‐volume GHs. Compared to children hospitalized at higher‐volume GHs, children hospitalized at the lower‐volume hospitals had significantly lower disease severity, shorter LOS, more direct admissions, and a greater proportion of routine discharges.
DISCUSSION
Of the 2 million pediatric hospitalizations in the United States in 2012, more than 70% occurred at GHs. We observed considerable heterogeneity in pediatric volumes across GHs, with 11% of pediatric hospitalizations occurring at hospitals with pediatric volumes of <375 hospitalizations annually, whereas 15% of pediatric hospitalizations occurred at GHs with volumes similar to those observed at FCHs. The remaining pediatric hospitalizations at GHs occurred at centers with intermediate volumes. The most common reasons for hospitalization were similar at GHs and FCHs, but the most costly conditions differed substantially. These findings have important implications for pediatric clinical care programs, research, and QI efforts.
Our finding that more than 70% of pediatric hospitalizations occurred at GHs speaks to the importance of quality measurement at these hospitals, whereas low per‐hospital pediatric volumes at the majority of GHs makes such measurement particularly challenging. Several previous studies have illustrated that volumes of pediatric hospitalizations are too small to detect meaningful differences in quality between hospitals using established condition‐specific metrics.[13, 14, 15] Our finding that more than 10% of pediatric hospitalizations occurred at GHs with pediatric volumes <375 year supports previous research suggesting that cross‐cutting, all‐condition quality metrics, composite measures, and/or multihospital reporting networks may be needed to enable quality measurement at these sites. In addition, the heterogeneity in patient volumes and characteristics across GHs raise questions about the applicability of quality metrics developed and validated at FCHs to the many GH settings. Field‐testing quality measures to ensure their validity at diverse GHs, particularly those with patient volumes and infrastructure different from FCHs, will be important to meaningful pediatric quality measurement.
Our results illustrating differences in the most common and costly conditions at GHs and FCHs have further implications for prioritization and implementation of research and QI efforts. Implementation research and QI efforts focused on cardiac and neurosurgical procedures, as well as neonatal intensive care, may have considerable impact on cost and quality at FCHs. At GHs, research and QI efforts focused on common conditions are needed to increase our knowledge of contextually relevant barriers to and facilitators of high‐quality pediatric care. This, however, can be made more difficult by small sample sizes, limited resources, and infrastructure, and competing priorities in adult‐focused GH settings.[16, 17, 18] Multihospital learning collaboratives and partnerships between FCHs and GHs can begin to address these challenges, but their success is contingent upon national advocacy and funding to support pediatric research and quality measures at GHs.
One of the most notable differences in the characteristics of pediatric hospitalizations at GHs and FCHs was the proportion of hospitalizations attributable to children with medical complexity (CMC); more than one‐third of hospitalizations at FCHs were for CMC compared to 1 in 5 at GHs. These findings align with the results of several previous studies describing the substantial resource utilization attributed to CMC, and with growing research, innovation, and quality metrics focused on improving both inpatient and outpatient care for these vulnerable children.[19, 20, 21, 22] Structured complex care programs, developed to improve care coordination and healthcare quality for CMC, are common at FCHs, and have been associated with decreased resource utilization and improved outcomes.[23, 24, 25] Notably, however, more than half of all hospitalizations for CMC, exceeding 250,000 annually, occurred at GHs, and almost 40% of hospitalizations for CMC occurred at the lower‐volume GHs. These findings speak to the importance of translating effective and innovative programs of care for CMC to GHs as resources allow, accompanied by robust evaluations of their effectiveness. Lower patient volume at most GHs, however, may be a barrier to dedicated CMC programs. As a result, decentralized community‐based programs of care for CMC, linking primary care programs with regional and tertiary care hospitals, warrant further consideration.[26, 27, 28]
This analysis should be interpreted in light of several limitations. First, we were unable to distinguish between GHs with scant pediatric‐specific resources from those with a large volume of dedicated pediatric resources, such as children's hospitals nested within GHs. We did identify 36 GHs with pediatric volumes similar to those observed at FCHs (see Supporting Table 2 in the online version of this article); patient and hospitalization characteristics at these higher‐volume GHs were similar in many ways to children hospitalized at FCHs. Several of these higher‐volume GHs may have considerable resources dedicated to the care of children, including subspecialty care, and may represent children's hospitals nested within GHs. Because nested children's hospitals are included in the GH categorization, our results may have underestimated the proportion of children cared for at children's hospitals. Further work is needed to identify the health systems challenges and opportunities that may be unique to these institutions. Second, because the 2012 KID does not include a specialty hospital indicator, we developed a proxy method for identifying these hospitals, which may have resulted in some misclassification. We are reassured that the results of our analyses did not change substantively when we included all hospitals. Similarly, although we are reassured that the number of hospitals classified in our analysis as acute care FCHs aligns, approximately, with the number of hospitals classified as such by the Children's Hospital Association, we were unable to assess the validity of this variable within the KID. Third, the KID does not link records at the patient level, so we are unable to report the number of unique children included in this analysis. In addition, the KID includes only inpatient stays with exclusion of observation status stays; potential differences between GH and FCH in the use of observation status could have biased our findings. Fifth, we used the PMCA to identify CMC; although this algorithm has been shown to have excellent sensitivity in identifying children with chronic diseases, using up to 3 years of Medicaid claims data, the sensitivity using the KID, where only 1 inpatient stay is available for assessment, is unknown.[8, 29] Similarly, use of Keren's pediatric diagnosis grouper to classify reasons for hospitalization may have resulted in misclassification, though there are few other nonproprietary pediatric‐specific diagnostic groupers available.
In 2012, more than 70% of pediatric hospitalizations occurred at GHs in the United States. The considerably higher pediatric volumes at FCHs makes these institutions well suited for research, innovation, and the development and application of disease‐specific QI initiatives. Recognizing that the majority of pediatric hospitalizations occurred at GHs, there is a clear need for implementation research, program development, and quality metrics that align with the characteristics of hospitalizations at these centers. National support for research and quality improvement that reflects the diverse hospital settings where children receive their hospital care is critical to further our nation's goal of improving hospital quality for children.
Disclosures
Dr. Leyenaar was supported by grant number K08HS024133 from the Agency for Healthcare Research and Quality. The content is solely the responsibility of the authors and does not necessarily represent the official views of the Agency for Healthcare Research and Quality. The authors have no conflicts of interest relevant to this article to disclose.
- , , , . Mirror, Mirror on the wall: how the performance of the US health care system compares internationally. The Commonwealth Fund. Available at: http://www.commonwealthfund.org/publications/fund‐reports/2014/jun/mirror‐mirror. Published June 16, 2014. Accessed August 26, 2015.
- , , , , , . Higher cost, but poorer outcomes: the US health disadvantage and implications for pediatrics. Pediatrics. 2015;135(6):961–964.
- , , , , . US health spending trends by age and gender: selected years 2002–10. Health Aff (Millwood). 2014;33(5):815–822.
- , , . Costs for hospital stays in the United States, 2012. Healthcare Cost and Utilization Project 181. Available at: http://www.hcup‐us.ahrq.gov/reports/statbriefs/sb181‐Hospital‐Costs‐United‐States‐2012.pdf. Published October 2014. Accessed September 2015.
- , , , et al. All Patient Refined Diagnosis Related Groups: Methodology Overview. 3M Health Information Systems. Available at: https://www.hcup‐us.ahrq.gov/db/nation/nis/APR‐DRGsV20MethodologyOverviewandBibliography.pdf. Accessed February 8, 2016.
- Agency for Healthcare Research and Quality. Healthcare Cost and Utilization Project. Introduction to the HCUP Kids' Inpatient Database (KID) 2012. Available at: https://www.hcup‐us.ahrq.gov/db/nation/kid/kid_2012_introduction.jsp. Published Issued July 2014. Accessed February 8, 2016.
- . Prioritization of comparative effectiveness research topics in hospital pediatrics. Arch Pediatr Adolesc Med. 2012;166(12):1155.
- , , , et al. Pediatric medical complexity algorithm: a new method to stratify children by medical complexity. Pediatrics. 2014;133(6):e1647–e1654.
- , , , et al. 3M APR DRG Classification System. 3M Health Information Systems. Available at: http://www.hcup‐us.ahrq.gov/db/nation/nis/v261_aprdrg_meth_ovrview.pdf. Accessed August 7, 2015.
- , , , , , . Trends in high‐turnover stays among children hospitalized in the United States, 1993–2003. Pediatrics. 2009;123(3):996–1002.
- , , , . High turnover stays for pediatric asthma in the United States. Med Care. 2010;48(9):827–833.
- , , , , . Variation and outcomes associated with direct admission among children with pneumonia in the United States. JAMA Pediatr. 2014;168(9):829–836.
- , , , et al. Recognizing differences in hospital quality performance for pediatric inpatient care. Pediatrics. 2015;136(2):251–262.
- , , . Small numbers limit the use of the inpatient pediatric quality indicators for hospital comparison. Acad Pediatr. 2010;10(4):266–273.
- , , , et al. Statistical uncertainty of mortality rates and rankings for children's hospitals. Pediatrics. 2011;128(4):e966–e972.
- , , , , . Determinants of career satisfaction among pediatric hospitalists: a qualitative exploration. Acad Pediatr. 2014;14(4):361–368.
- , , , et al. Quality improvement research in pediatric hospital medicine and the role of the Pediatric Research in Inpatient Settings (PRIS) network. Acad Pediatr. 2013;13(6 suppl):S54–S60.
- . Roles for children's hospitals in pediatric collaborative improvement networks. Pediatrics. 2013;131(suppl 4):S215–S218.
- , , , et al. Children with medical complexity: an emerging population for clinical and research initiatives. Pediatrics. 2011;127(3):529–538.
- , , , et al. Children with complex chronic conditions in inpatient hospital settings in the United States. Pediatrics. 2010;126(4):647–655.
- , , , , , . Patterns and costs of health care use of children with medical complexity. Pediatrics. 2012;130(6):e1463–e1470.
- , , , , , . Hospital utilization and characteristics of patients experiencing recurrent readmissions within children's hospitals. JAMA. 2011;305(7):682–690.
- , , , et al. Characteristics of hospitalizations for patients who use a structured clinical care program for children with medical complexity. J Pediatr. 2011;159(2):284–290.
- , , , . Hospital‐based comprehensive care programs for children with special health care needs: a systematic review. Arch Pediatr Adolesc Med. 2011;165(6):554–561.
- , , , , , . A tertiary care–primary care partnership model for medically complex and fragile children and youth with special health care needs. Arch Pediatr Adolesc Med. 2007;161(10):937–944.
- , , , et al. Integrated complex care coordination for children with medical complexity: a mixed‐methods evaluation of tertiary care‐community collaboration. BMC Health Serv Res. 2012;12:366.
- , , , . Medical transport of children with complex chronic conditions. Emerg Med Int. 2012;2012:837020.
- , , . Comanagement of medically complex children by subspecialists, generalists, and care coordinators. Pediatrics. 2014;134(2):203–205.
- , , , , . Ways to identify children with medical complexity and the importance of why. J Pediatr. 2015;167(2):229–237.
Improvement in the quality of hospital care in the United States is a national priority, both to advance patient safety and because our expenditures exceed any other nation's, but our health outcomes lag behind.[1, 2] Healthcare spending for children is growing at a faster rate than any other age group, with hospital care accounting for more than 40% of pediatric healthcare expenditures.[3] Inpatient healthcare comprises a greater proportion of healthcare costs for children than for adults, yet we have limited knowledge about where this care is provided.[4]
There is substantial variability in the settings in which children are hospitalized. Children may be hospitalized in freestanding children's hospitals, where all services are designed for children and which operate independently of adult‐focused institutions. They may also be hospitalized in general hospitals where care may be provided in a general inpatient bed, on a dedicated pediatric ward, or in a children's hospital nested within a hospital, which may have specialized nursing and physician care but often shares other resources such as laboratory and radiology with the primarily adult‐focused institution. Medical students and residents may be trained in all of these settings. We know little about how these hospital types differ with respect to patient populations, disease volumes, and resource utilization, and this knowledge is important to inform clinical programs, implementation research, and quality improvement (QI) priorities. To this end, we aimed to describe the volume and characteristics of pediatric hospitalizations at acute care general hospitals and freestanding children's hospitals in the United States.
METHODS
Study Design and Eligibility
The data source for this analysis was the Healthcare Cost and Utilization Project's (HCUP) 2012 Kids' Inpatient Database (KID). We conducted a cross‐sectional study of hospitalizations in children and adolescents less than 18 years of age, excluding in‐hospital births and hospitalizations for pregnancy and delivery (identified using All Patient Refined‐Diagnostic Related Groups [APR‐DRGs]).[5] Neonatal hospitalizations not representing in‐hospital births but resulting from transfers or new admissions were retained. Because the dataset does not contain identifiable information, the institutional review board at Baystate Medical Center determined that our study did not constitute human subjects research.
The KID is released every 3 years and is the only publicly available, nationally representative database developed to study pediatric hospitalizations, including an 80% sample of noninborn pediatric discharges from all community, nonrehabilitation hospitals from 44 participating states.[6] Short‐term rehabilitation hospitals, long‐term nonacute care hospitals, psychiatric hospitals, and alcoholism/chemical dependency treatment facilities are excluded. The KID contains information on all patients, regardless of payer, and provides discharge weights to calculate national estimates.[6] It contains both hospital‐level and patient‐level variables, including demographic characteristics, charges, and other clinical and resource use data available from discharge abstracts. Beginning in 2012, freestanding children's hospitals (FCHs) are assigned to a separate stratum in the KID, with data from the Children's Hospital Association used by HCUP to verify the American Hospital Association's (AHA) list of FCHs.[6] Hospitals that are not FCHs were categorized as general hospitals (GHs). We were interested in examining patterns of care at acute care hospitals and not specialty hospitals; unlike previous years, the KID 2012 does not include a specialty hospital identifier.[6] Therefore, as a proxy for specialty hospital status, we excluded hospitals that had 2% hospitalizations for 12 common medical conditions (pneumonia, asthma, bronchiolitis, cellulitis, dehydration, urinary tract infection, neonatal hyperbilirubinemia, fever, upper respiratory infection, infectious gastroenteritis, unspecified viral infection, and croup). These medical conditions were the 12 most common reasons for medical hospitalizations identified using Keren's pediatric diagnosis code grouper,[7] excluding chronic diseases, and represented 26.2% of all pediatric hospitalizations. This 2% threshold was developed empirically, based on visual analysis of the distribution of cases across hospitals and was limited to hospitals with total pediatric volumes >25/year, allowing for stable case‐mix estimates.
Descriptor Variables
Hospital level characteristics included US Census region; teaching status classified in the KID based on results of the AHA Annual Survey; urban/rural location; hospital ownership, classified as public, private nonprofit and private investor‐owned; and total volume of pediatric hospitalizations, in deciles.[6] At the patient level, we examined age, gender, race/ethnicity, expected primary payer, and median household income (in quartiles) for patient's zip code. Medical complexity was categorized as (1) nonchronic disease, (2) complex chronic disease, or (3) noncomplex chronic disease, using the previously validated Pediatric Medical Complexity Algorithm (PMCA) based on International Classification of Diseases, 9th Revision, Clinical Modification (ICD‐9‐CM) codes.[8] Disease severity was classified based on APR‐DRG severity of illness coding, which classifies illnesses severity as minor, moderate, major, or extreme.[9]
We examined the following characteristics of the hospitalizations: (1) length of hospital stay (LOS) measured in calendar days; (2) high‐turnover hospitalization defined as LOS less than 2 days[10, 11, 12]; (3) long LOS, defined as greater than 4 days, equivalent to LOS greater than the 75th percentile; (4) neonatal versus non‐neonatal hospitalization, identified using APR‐DRGs; (5) admission type categorized as elective and nonelective; (6) admission source, categorized as transfer from another acute care hospital, admission from the emergency department, or direct admission; (7) discharge status, categorized as routine discharge, transfer to another hospital or healthcare facility, and discharge against medical advice; and (8) total hospital costs, calculated by applying the cost‐to‐charge ratios available in the KID to total hospital charges.
Reasons for hospitalization were categorized using the pediatric diagnosis code grouper by Keren, which uses ICD‐9‐CM codes to group common and costly principal diagnoses into distinct conditions (eg, pneumonia, idiopathic scoliosis), excluding children who have ICD‐9‐CM principal procedure codes unlikely related to their principal diagnosis (for example, appendectomy for a child with a principal diagnosis of pneumonia).[7] This pediatric grouper classifies diagnoses as medical, surgical, or medical‐surgical based on whether <20% (medical), >80% (surgical) or between 20% and 80% (medical‐surgical) of encounters for the condition had an ICD‐9‐CM principal procedure code for a surgery related to that condition. We further characterized medical hospitalizations as either medical or mental health hospitalizations.
Statistical Analysis
We categorized each discharge record as a hospitalization at a GH or an FCH. We then calculated patient‐level summary statistics, applying weights to calculate national estimates with an associated standard deviation (SD). We assessed differences in characteristics of hospitalizations at GHs and FCHs using Rao‐Scott 2 tests for categorical variables and Wald F tests for continuous variables.[6] We identified the most common reasons for hospitalization, including those responsible for at least 2% of all medical or surgical hospitalizations and at least 0.5% of medical hospitalizations for mental health diagnoses, given the lower prevalence of these conditions and our desire to include mental health diagnoses in our analysis. For these common conditions, we calculated the proportion of condition‐specific hospitalizations and aggregate hospital costs at GHs and FCHs. We also determined the number of hospitalizations at each hospital and calculated the median and interquartile range for the number of hospitalizations for each of these conditions according to hospital type, assessing for differences using Kruskal‐Wallis tests. Finally, we identified the most common and costly conditions at GHs and FCHs by ranking frequency and aggregate costs for each condition according to hospital type, limited to the 20 most costly and/or prevalent pediatric diagnoses. Because we used a novel method to identify specialty hospitals in this dataset, we repeated these analyses using all hospitals classified as a GH and FCH as a sensitivity analysis.
RESULTS
Overall, 3866 hospitals were categorized as a GH, whereas 70 hospitals were categorized as FCHs. Following exclusion of specialty hospitals, 3758 GHs and 50 FCHs were retained in this study. The geographic distribution of hospitals was similar, but although GHs included those in both urban and rural regions, all FCHs were located in urban regions (Table 1).
| General Hospitals, n = 3,758 | Children's Hospitals, n = 50 | ||||
|---|---|---|---|---|---|
| Hospital characteristics | n | % | n | % | P Value |
| |||||
| Geographic region | |||||
| Northeast | 458 | 12.2 | 4 | 8.0 | 0.50 |
| Midwest | 1,209 | 32.2 | 15 | 30.0 | |
| South | 1,335 | 35.6 | 17 | 34.0 | |
| West | 753 | 20.1 | 14 | 28.0 | |
| Location and teaching status | |||||
| Rural | 1,524 | 40.6 | 0 | 0 | <0.0001 |
| Urban nonteaching | 1,506 | 40.1 | 7 | 14.0 | |
| Urban teaching | 725 | 19.3 | 43 | 86.0 | |
| Hospital ownership | |||||
| Government, nonfederal | 741 | 19.7 | 0 | 0 | <0.0001 |
| Private, nonprofit | 2,364 | 63.0 | 48 | 96.0 | |
| Private, investor‐owned | 650 | 17.3 | 2 | 4.0 | |
| Volume of pediatric hospitalizations (deciles) | |||||
| <185 hospitalizations/year (<8th decile) | 2,664 | 71.0 | 0 | 0 | <0.0001 |
| 186375 hospitalizations/year (8th decile) | 378 | 10.1 | 2 | 4.0 | |
| 376996 hospitalizations/year (9th decile) | 380 | 10.1 | 1 | 2.0 | |
| >986 hospitalizations/year (10th decile) | 333 | 8.9 | 47 | 94.0 | |
| Volume of pediatric hospitalizations, median [IQR] | 56 | [14240] | 12,001 | [5,83815,448] | <0.0001 |
A total of 1,407,822 (SD 50,456) hospitalizations occurred at GHs, representing 71.7% of pediatric hospitalizations, whereas 554,458 (SD 45,046) hospitalizations occurred at FCHs. Hospitalizations at GHs accounted for 63.6% of days in hospital and 50.0% of pediatric inpatient healthcare costs. Eighty percent of the GHs had total pediatric patient volumes of less than 375 hospitalizations yearly; 11.1% of pediatric hospitalizations occurred at these lower‐volume centers. At FCHs, the median volume of pediatric hospitalizations was 12,001 (interquartile range [IQR]: 583815,448). A total of 36 GHs had pediatric hospitalization volumes in this IQR.
The median age for pediatric patients was slightly higher at GHs, whereas gender, race/ethnicity, primary payer, and median household income for zip code did not differ significantly between hospital types (Table 2). Medical complexity differed between hospital types: children with complex chronic diseases represented 20.2% of hospitalizations at GHs and 35.6% of hospitalizations at FCHs. Severity of illness differed between hospital types, with fewer hospitalizations categorized at the highest level of severity at GHs than FCHs. There were no significant differences between hospital types with respect to the proportion of hospitalizations categorized as neonatal hospitalizations or as elective hospitalizations. The median LOS was shorter at GHs than FCHs. Approximately 1 in 5 children hospitalized at GHs had LOS greater than 4 days, whereas almost 30% of children hospitalized at FCHs had LOS of this duration.
| Patient Characteristics |
General Hospitals,1,407,822 (50,456), 71.7% |
Children's Hospitals,554,458 (45,046), 28.3% |
P Value | ||||
|---|---|---|---|---|---|---|---|
| n | (SD Weighted Frequency) | (%) | n | (SD Weighted Frequency) | % | ||
| |||||||
| Age, y, median [IQR] | 3.6 [011.7] | 3.4 [010.8] | 0.001 | ||||
| Gender (% female) | 644,250 | (23,089) | 45.8 | 254,505 | (20,688) | 45.9 | 0.50 |
| Race* | |||||||
| White | 668,876 | (27,741) | 47.5 | 233,930 | (26,349) | 42.2 | 0.05 |
| Black | 231,586 | (12,890) | 16.5 | 80,568 | (11,739) | 14.5 | |
| Hispanic | 279,021 | (16,843) | 19.8 | 12,1425 | (21,183) | 21.9 | |
| Other | 133,062 | (8,572) | 9.5 | 41,190 | (6,394) | 7.4 | |
| Insurance status | |||||||
| Public | 740,033 | (28,675) | 52.6 | 284,795 | (25,324) | 51.4 | 0.90 |
| Private | 563,562 | (21,930) | 40.0 | 224,042 | (21,613) | 40.4 | |
| Uninsured | 37,265 | (1,445) | 2.7 | 16,355 | (3,804) | 3.0 | |
| No charge/other/unknown | 66,962 | (5,807) | 4.8 | 29,266 | (6,789) | 5.3 | |
| Median household income for zip code, quartiles | |||||||
| <$38,999 | 457,139 | (19,725) | 33.3 | 164,831 | (17,016) | 30.1 | 0.07 |
| $39,000$47,999 | 347,229 | (14,104) | 25.3 | 125,105 | (10,712) | 22.9 | |
| $48,000$62,999 | 304,795 | (13,427) | 22.2 | 134,915 | (13,999) | 24.7 | |
| >$63,000 | 263,171 | (15,418) | 19.2 | 122,164 | (16,279) | 22.3 | |
| Medical complexity | |||||||
| Nonchronic disease | 717,009 | (21,807) | 50.9 | 211,089 | (17,023) | 38.1 | <0.001 |
| Noncomplex chronic disease | 406,070 | (14,951) | 28.8 | 146,077 | (12,442) | 26.4 | |
| Complex chronic disease | 284,742 | (17,111) | 20.2 | 197,292 | (18,236) | 35.6 | |
| APR‐DRG severity of illness | |||||||
| 1 (lowest severity) | 730,134 | (23,162) | 51.9 | 217,202 | (18,433) | 39.2 | <0.001 |
| 2 | 486,748 | (18,395) | 34.6 | 202,931 | (16,864) | 36.6 | |
| 3 | 146,921 | (8,432) | 10.4 | 100,566 | (9,041) | 18.1 | |
| 4 (highest severity) | 41,749 | (3,002) | 3.0 | 33,340 | (3,199) | 6.0 | |
| Hospitalization characteristics | |||||||
| Neonatal hospitalization | 98,512 | (3,336) | 7.0 | 39,584 | (4,274) | 7.1 | 0.84 |
| Admission type | |||||||
| Elective | 255,774 | (12,285) | 18.3 | 109,854 | (13,061) | 19.8 | 0.05 |
| Length of stay, d, (median [IQR]) | 1.8 (0.01) [0.8‐3.6] | 2.2 (0.06) [1.1‐4.7] | <0.001 | ||||
| High turnover hospitalizations | 416,790 | (14,995) | 29.6 | 130,441 | (12,405) | 23.5 | <0.001 |
| Length of stay >4 days | 298,315 | (14,421) | 21.2 | 161,804 | (14,354) | 29.2 | <0.001 |
| Admission source | |||||||
| Transfer from another acute care hospital | 154,058 | (10,067) | 10.9 | 82,118 | (8,952) | 14.8 | 0.05 |
| Direct admission | 550,123 | (21,954) | 39.1 | 211,117 | (20,203) | 38.1 | |
| Admission from ED | 703,641 | (26,155) | 50.0 | 261,223 | (28,708) | 47.1 | |
| Discharge status | |||||||
| Routine | 1,296,638 | (46,012) | 92.1 | 519,785 | (42,613) | 93.8 | <0.01 |
| Transfer to another hospital or healthcare facility | 56,115 | (1,922) | 4.0 | 13,035 | (1,437) | 2.4 | |
| Discharge against medical advice | 2,792 | (181) | 0.2 | 382 | (70) | 0.1 | |
| Other | 52,276 | (4,223) | 3.7 | 21,256 | (4,501) | 3.8 | |
The most common pediatric medical, mental health, and surgical conditions are shown in Figure 1, together representing 32% of pediatric hospitalizations during the study period. For these medical conditions, 77.9% of hospitalizations occurred at GHs, ranging from 52.6% of chemotherapy hospitalizations to 89.0% of hospitalizations for neonatal hyperbilirubinemia. Sixty‐two percent of total hospital costs for these conditions were incurred at GHs. For the common mental health hospitalizations, 86% of hospitalizations occurred at GHs. The majority of hospitalizations and aggregate hospital costs for common surgical conditions also occurred at GHs.
Whereas pneumonia, asthma, and bronchiolitis were the most common reasons for hospitalization at both GHs and FCHs, the most costly conditions differed (see Supporting Table 1 in the online version of this article). At GHs, these respiratory diseases were responsible for the highest condition‐specific total hospital costs. At FCHs, the highest aggregate costs were due to respiratory distress syndrome and chemotherapy. Congenital heart diseases, including hypoplastic left heart syndrome, transposition of the great vessels, tetralogy of Fallot, endocardial cushion defects, coarctation of the aorta and ventricular septal defects accounted for 6 of the 20 most costly conditions at FCHs.
Figure 2 illustrates the volume of hospitalizations, per hospital, at GHs and FCHs for the most common medical hospitalizations. The median number of hospitalizations, per hospital, was consistently significantly lower at GHs than at FCHs (all P values <0.001). Similar results for surgical and mental health hospitalizations are shown as Supporting Figures 1 and 2 in the online version of this article. In our sensitivity analyses that included all hospitals classified as GH and FCH, all results were essentially unchanged.
Recognizing the wide range of pediatric volumes at GHs (Table 1) and our inability to differentiate children's hospitals nested within GHs from GHs with pediatric beds, we examined differences in patient and hospitalization characteristics at GHs with volumes 5838 hospitalizations (the 25th percentile for FCH volume) and GHs with pediatric volumes <5838/year (see Supporting Table 2 in the online version of this article). We also compared patient and hospitalization characteristics at FCHs and the higher‐volume GHs. A total of 36 GHs had pediatric volumes 5838, with hospitalizations at these sites together accounting for 15.4% of all pediatric hospitalizations. Characteristics of patients hospitalized at these higher‐volume GHs were similar to patients hospitalized at FCHs, but they had significantly lower disease severity, fewer neonatal hospitalizations, shorter LOS, and more high‐turnover hospitalizations than patients hospitalized at FCHs. We also observed several differences between children hospitalized at higher‐ and lower‐volume GHs (see Supporting Table 2 in the online version of this article). Children hospitalized at the lower‐volume GHs were more likely to have public health insurance and less likely to have complex chronic diseases, although overall, 39.0% of all hospitalizations for children with complex chronic diseases occurred at these lower‐volume GHs. Compared to children hospitalized at higher‐volume GHs, children hospitalized at the lower‐volume hospitals had significantly lower disease severity, shorter LOS, more direct admissions, and a greater proportion of routine discharges.
DISCUSSION
Of the 2 million pediatric hospitalizations in the United States in 2012, more than 70% occurred at GHs. We observed considerable heterogeneity in pediatric volumes across GHs, with 11% of pediatric hospitalizations occurring at hospitals with pediatric volumes of <375 hospitalizations annually, whereas 15% of pediatric hospitalizations occurred at GHs with volumes similar to those observed at FCHs. The remaining pediatric hospitalizations at GHs occurred at centers with intermediate volumes. The most common reasons for hospitalization were similar at GHs and FCHs, but the most costly conditions differed substantially. These findings have important implications for pediatric clinical care programs, research, and QI efforts.
Our finding that more than 70% of pediatric hospitalizations occurred at GHs speaks to the importance of quality measurement at these hospitals, whereas low per‐hospital pediatric volumes at the majority of GHs makes such measurement particularly challenging. Several previous studies have illustrated that volumes of pediatric hospitalizations are too small to detect meaningful differences in quality between hospitals using established condition‐specific metrics.[13, 14, 15] Our finding that more than 10% of pediatric hospitalizations occurred at GHs with pediatric volumes <375 year supports previous research suggesting that cross‐cutting, all‐condition quality metrics, composite measures, and/or multihospital reporting networks may be needed to enable quality measurement at these sites. In addition, the heterogeneity in patient volumes and characteristics across GHs raise questions about the applicability of quality metrics developed and validated at FCHs to the many GH settings. Field‐testing quality measures to ensure their validity at diverse GHs, particularly those with patient volumes and infrastructure different from FCHs, will be important to meaningful pediatric quality measurement.
Our results illustrating differences in the most common and costly conditions at GHs and FCHs have further implications for prioritization and implementation of research and QI efforts. Implementation research and QI efforts focused on cardiac and neurosurgical procedures, as well as neonatal intensive care, may have considerable impact on cost and quality at FCHs. At GHs, research and QI efforts focused on common conditions are needed to increase our knowledge of contextually relevant barriers to and facilitators of high‐quality pediatric care. This, however, can be made more difficult by small sample sizes, limited resources, and infrastructure, and competing priorities in adult‐focused GH settings.[16, 17, 18] Multihospital learning collaboratives and partnerships between FCHs and GHs can begin to address these challenges, but their success is contingent upon national advocacy and funding to support pediatric research and quality measures at GHs.
One of the most notable differences in the characteristics of pediatric hospitalizations at GHs and FCHs was the proportion of hospitalizations attributable to children with medical complexity (CMC); more than one‐third of hospitalizations at FCHs were for CMC compared to 1 in 5 at GHs. These findings align with the results of several previous studies describing the substantial resource utilization attributed to CMC, and with growing research, innovation, and quality metrics focused on improving both inpatient and outpatient care for these vulnerable children.[19, 20, 21, 22] Structured complex care programs, developed to improve care coordination and healthcare quality for CMC, are common at FCHs, and have been associated with decreased resource utilization and improved outcomes.[23, 24, 25] Notably, however, more than half of all hospitalizations for CMC, exceeding 250,000 annually, occurred at GHs, and almost 40% of hospitalizations for CMC occurred at the lower‐volume GHs. These findings speak to the importance of translating effective and innovative programs of care for CMC to GHs as resources allow, accompanied by robust evaluations of their effectiveness. Lower patient volume at most GHs, however, may be a barrier to dedicated CMC programs. As a result, decentralized community‐based programs of care for CMC, linking primary care programs with regional and tertiary care hospitals, warrant further consideration.[26, 27, 28]
This analysis should be interpreted in light of several limitations. First, we were unable to distinguish between GHs with scant pediatric‐specific resources from those with a large volume of dedicated pediatric resources, such as children's hospitals nested within GHs. We did identify 36 GHs with pediatric volumes similar to those observed at FCHs (see Supporting Table 2 in the online version of this article); patient and hospitalization characteristics at these higher‐volume GHs were similar in many ways to children hospitalized at FCHs. Several of these higher‐volume GHs may have considerable resources dedicated to the care of children, including subspecialty care, and may represent children's hospitals nested within GHs. Because nested children's hospitals are included in the GH categorization, our results may have underestimated the proportion of children cared for at children's hospitals. Further work is needed to identify the health systems challenges and opportunities that may be unique to these institutions. Second, because the 2012 KID does not include a specialty hospital indicator, we developed a proxy method for identifying these hospitals, which may have resulted in some misclassification. We are reassured that the results of our analyses did not change substantively when we included all hospitals. Similarly, although we are reassured that the number of hospitals classified in our analysis as acute care FCHs aligns, approximately, with the number of hospitals classified as such by the Children's Hospital Association, we were unable to assess the validity of this variable within the KID. Third, the KID does not link records at the patient level, so we are unable to report the number of unique children included in this analysis. In addition, the KID includes only inpatient stays with exclusion of observation status stays; potential differences between GH and FCH in the use of observation status could have biased our findings. Fifth, we used the PMCA to identify CMC; although this algorithm has been shown to have excellent sensitivity in identifying children with chronic diseases, using up to 3 years of Medicaid claims data, the sensitivity using the KID, where only 1 inpatient stay is available for assessment, is unknown.[8, 29] Similarly, use of Keren's pediatric diagnosis grouper to classify reasons for hospitalization may have resulted in misclassification, though there are few other nonproprietary pediatric‐specific diagnostic groupers available.
In 2012, more than 70% of pediatric hospitalizations occurred at GHs in the United States. The considerably higher pediatric volumes at FCHs makes these institutions well suited for research, innovation, and the development and application of disease‐specific QI initiatives. Recognizing that the majority of pediatric hospitalizations occurred at GHs, there is a clear need for implementation research, program development, and quality metrics that align with the characteristics of hospitalizations at these centers. National support for research and quality improvement that reflects the diverse hospital settings where children receive their hospital care is critical to further our nation's goal of improving hospital quality for children.
Disclosures
Dr. Leyenaar was supported by grant number K08HS024133 from the Agency for Healthcare Research and Quality. The content is solely the responsibility of the authors and does not necessarily represent the official views of the Agency for Healthcare Research and Quality. The authors have no conflicts of interest relevant to this article to disclose.
- , , , . Mirror, Mirror on the wall: how the performance of the US health care system compares internationally. The Commonwealth Fund. Available at: http://www.commonwealthfund.org/publications/fund‐reports/2014/jun/mirror‐mirror. Published June 16, 2014. Accessed August 26, 2015.
- , , , , , . Higher cost, but poorer outcomes: the US health disadvantage and implications for pediatrics. Pediatrics. 2015;135(6):961–964.
- , , , , . US health spending trends by age and gender: selected years 2002–10. Health Aff (Millwood). 2014;33(5):815–822.
- , , . Costs for hospital stays in the United States, 2012. Healthcare Cost and Utilization Project 181. Available at: http://www.hcup‐us.ahrq.gov/reports/statbriefs/sb181‐Hospital‐Costs‐United‐States‐2012.pdf. Published October 2014. Accessed September 2015.
- , , , et al. All Patient Refined Diagnosis Related Groups: Methodology Overview. 3M Health Information Systems. Available at: https://www.hcup‐us.ahrq.gov/db/nation/nis/APR‐DRGsV20MethodologyOverviewandBibliography.pdf. Accessed February 8, 2016.
- Agency for Healthcare Research and Quality. Healthcare Cost and Utilization Project. Introduction to the HCUP Kids' Inpatient Database (KID) 2012. Available at: https://www.hcup‐us.ahrq.gov/db/nation/kid/kid_2012_introduction.jsp. Published Issued July 2014. Accessed February 8, 2016.
- . Prioritization of comparative effectiveness research topics in hospital pediatrics. Arch Pediatr Adolesc Med. 2012;166(12):1155.
- , , , et al. Pediatric medical complexity algorithm: a new method to stratify children by medical complexity. Pediatrics. 2014;133(6):e1647–e1654.
- , , , et al. 3M APR DRG Classification System. 3M Health Information Systems. Available at: http://www.hcup‐us.ahrq.gov/db/nation/nis/v261_aprdrg_meth_ovrview.pdf. Accessed August 7, 2015.
- , , , , , . Trends in high‐turnover stays among children hospitalized in the United States, 1993–2003. Pediatrics. 2009;123(3):996–1002.
- , , , . High turnover stays for pediatric asthma in the United States. Med Care. 2010;48(9):827–833.
- , , , , . Variation and outcomes associated with direct admission among children with pneumonia in the United States. JAMA Pediatr. 2014;168(9):829–836.
- , , , et al. Recognizing differences in hospital quality performance for pediatric inpatient care. Pediatrics. 2015;136(2):251–262.
- , , . Small numbers limit the use of the inpatient pediatric quality indicators for hospital comparison. Acad Pediatr. 2010;10(4):266–273.
- , , , et al. Statistical uncertainty of mortality rates and rankings for children's hospitals. Pediatrics. 2011;128(4):e966–e972.
- , , , , . Determinants of career satisfaction among pediatric hospitalists: a qualitative exploration. Acad Pediatr. 2014;14(4):361–368.
- , , , et al. Quality improvement research in pediatric hospital medicine and the role of the Pediatric Research in Inpatient Settings (PRIS) network. Acad Pediatr. 2013;13(6 suppl):S54–S60.
- . Roles for children's hospitals in pediatric collaborative improvement networks. Pediatrics. 2013;131(suppl 4):S215–S218.
- , , , et al. Children with medical complexity: an emerging population for clinical and research initiatives. Pediatrics. 2011;127(3):529–538.
- , , , et al. Children with complex chronic conditions in inpatient hospital settings in the United States. Pediatrics. 2010;126(4):647–655.
- , , , , , . Patterns and costs of health care use of children with medical complexity. Pediatrics. 2012;130(6):e1463–e1470.
- , , , , , . Hospital utilization and characteristics of patients experiencing recurrent readmissions within children's hospitals. JAMA. 2011;305(7):682–690.
- , , , et al. Characteristics of hospitalizations for patients who use a structured clinical care program for children with medical complexity. J Pediatr. 2011;159(2):284–290.
- , , , . Hospital‐based comprehensive care programs for children with special health care needs: a systematic review. Arch Pediatr Adolesc Med. 2011;165(6):554–561.
- , , , , , . A tertiary care–primary care partnership model for medically complex and fragile children and youth with special health care needs. Arch Pediatr Adolesc Med. 2007;161(10):937–944.
- , , , et al. Integrated complex care coordination for children with medical complexity: a mixed‐methods evaluation of tertiary care‐community collaboration. BMC Health Serv Res. 2012;12:366.
- , , , . Medical transport of children with complex chronic conditions. Emerg Med Int. 2012;2012:837020.
- , , . Comanagement of medically complex children by subspecialists, generalists, and care coordinators. Pediatrics. 2014;134(2):203–205.
- , , , , . Ways to identify children with medical complexity and the importance of why. J Pediatr. 2015;167(2):229–237.
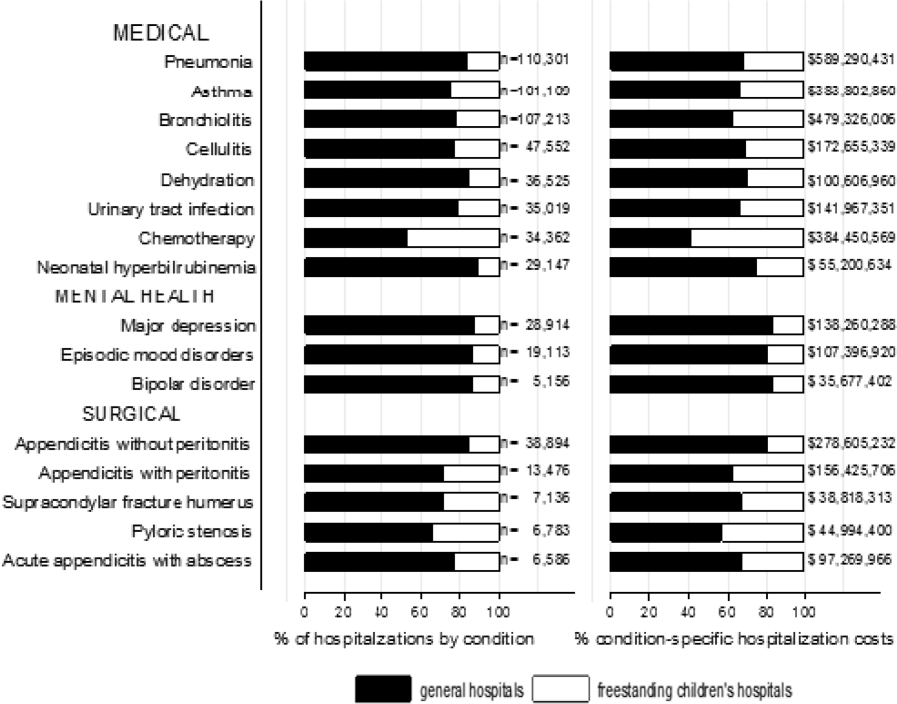
Acute Respiratory Failure Epidemiology
Acute respiratory failure (ARF), a common and serious complication in hospitalized patients, may be caused by several conditions including pneumonia, chronic obstructive pulmonary disease (COPD), adult respiratory distress syndrome (ARDS), and congestive heart failure (CHF). Although ARF is conventionally defined by an arterial oxygen tension of <60 mm Hg, an arterial carbon dioxide tension of >45 mm Hg, or both, these thresholds serve as a guide to be used in combination with history and clinical assessment of the patient.[1, 2] Supplemental oxygen and treatment of the underlying cause is the mainstay of therapy for ARF, but in severe cases patients are treated with invasive mechanical ventilation (IMV) or noninvasive ventilation (NIV). ARF is the most frequent reason for admission to the intensive care unit (ICU)[3, 4] and has an in‐hospital mortality rate of 33% to 37% among those who require IMV.[5, 6] The majority of epidemiologic studies of ARF have been limited to patients requiring mechanical ventilation or those admitted to the ICU, and information about the characteristics and outcomes of patients across the full spectrum of severity is much more limited.[5, 7, 8, 9, 10, 11] General improvements in the management of underlying conditions, implementation of more effective ventilation strategies,[12, 13] and increasing use of NIV[14, 15] may have led to better outcomes for patients with ARF, yet empirical evidence of a change in the adjusted mortality rate over time is lacking.
The objective of this study was to provide a broad characterization of the epidemiology of ARF among adults hospitalized in the United States using a large nationally representative database. We sought to evaluate whether incidence, mortality, cost, or ventilation practice associated with ARF in the United States changed over the period of 2001 to 2009.
METHODS
Data Source
We utilized data from the Nationwide Inpatient Sample (NIS) of the Health Care Cost and Utilization Project,[16] which is a 20% stratified probability sample of all US acute‐care hospitals each year. These data are drawn from a sampling frame that contains close to 95% of all discharges in the United States, with the hospital discharge record as the unit of analysis. The NIS has been used to study trends in many different diagnoses.[17, 18, 19] The database contains demographic information, payer information, principal and secondary diagnoses, cost, discharge disposition, and death during hospitalization. It also contains information on hospital characteristics including ownership, size, teaching status, and geographic region.
Definitions
We included patients 18 years old discharged between 2001 and 2009 with a primary or secondary diagnosis of ARF. We identified cases of ARF using diagnostic codes (International Classification of Diseases, Ninth Revision, Clinical Modification [ICD‐9‐CM]) previously used in studies of acute organ dysfunction in sepsis (518.81, 518.82, 518.84, 518.4, 799.1, 786.09).[17, 20, 21] To define ARDS we relied on ICD‐9‐CM codes (518.4, 518.82, 518.5, 786.09) used in prior studies that showed good sensitivity and specificity.[22, 23] The use of ventilatory support was identified using the ICD‐9‐CM procedure codes[24] (93.90, 93.70, 93.71, 93.76). Comorbidities were classified using the Agency for Healthcare Research and Quality's (Rockville, MD) Healthcare Cost and Utilization Project's (HCUP) Comorbidity Software version 3.103.5.[25]
Outcomes
The primary outcomes included the annual number of hospitalizations, population incidence, hospital mortality, and costs of care. Secondary outcomes included length of stay, most common diagnoses associated with ARF, disposition at discharge, and use and type of ventilatory support.
Analysis
We estimated the number of hospitalizations with a diagnosis of ARF/year, and we calculated the weighted frequencies following HCUP‐NIS recommendations using SAS/STAT survey procedures. Using population estimates for the years 2001 to 2009 from the US Census Bureau, we employed direct standardization to calculate age‐, gender‐, and race‐adjusted population incidence and mortality rates of ARF per 100,000 population. Hospital mortality was defined as the ratio of ARF hospitalizations ending in death divided by total number of ARF hospitalizations. Mechanical ventilation rates and rates of selected comorbidities were similarly defined.
We employed indirect standardization to adjust hospital mortality rates for age, sex, race/ethnicity, comorbidities, and hospital characteristics using logistic regression models from 2001 to predict hospital mortality for 2002 to 2009. We used linear regression models to test whether the slope of year was significant for trends in outcomes overtime. Costs were calculated using hospital‐specific cost‐to‐charge ratios when available and a weighted group average at the state level for remaining hospitals. We converted all costs to 2009 US dollars using the Consumer Price Index. Costs and lengths of stay were not normally distributed, so we calculated weighted geometric means (the average of all logarithmic values), then converted back to a base‐10 number. Using a Taylor series expansion, we then calculated standard errors. All analyses were performed using SAS version 9.2 (SAS Institute, Inc., Cary, NC).
The Baystate Medical Center institutional review board determined that the project did not constitute human subjects research.
RESULTS
Hospitalization Trends
The number of hospitalizations with an ARF diagnosis code increased at an average annual rate of 11.3% from 1,007,549 (standard deviation [SD] = 19,268) in 2001 to 1,917,910 (SD = 47,558) in 2009. More than two‐thirds of ARF admissions were associated with medical, rather than surgical, conditions (69.5% in 2001 and 71.2% in 2009). The median age, racial make‐up, and gender did not change significantly. Over the study period we observed an increase in ARF‐related hospitalizations in large, urban, teaching hospitals and in hospitals located in the Midwest (Table 1).
| 2001 | 2003 | 2005 | 2007 | 2009 | |
|---|---|---|---|---|---|
| |||||
| Patient characteristics | |||||
| All, N (SD) | 1,007,549 (19,268) | 1,184,928 (25,542) | 1,288,594 (30,493) | 1,480,270 (32,002) | 1,917,910 (47,558) |
| Age, mean (SE), y | 66.6 (0.2) | 66.0 (0.2) | 66.1 (0.2) | 65.8 (0.2) | 65.8 (0.2) |
| Age group, % | |||||
| 1844 | 11.5 | 12.0 | 11.5 | 11.6 | 10.9 |
| 4564* | 26.7 | 28.9 | 29.6 | 30.7 | 31.7 |
| 6584* | 50.2 | 47.8 | 47.0 | 45.7 | 45.3 |
| 85+ | 11.5 | 11.4 | 11.9 | 12.0 | 12.1 |
| Male* | 48.1 | 48.2 | 48.6 | 49.3 | 49.2 |
| Race | |||||
| White | 75.8 | 71.9 | 76.5 | 71.8 | 73.4 |
| Black | 12.7 | 13.6 | 11.2 | 14.2 | 12.5 |
| Hispanic | 7.2 | 9.8 | 7.7 | 8.5 | 7.8 |
| Other | 4.2 | 4.7 | 4.7 | 5.5 | 6.3 |
| Primary ARF | 20.7 | 20.9 | 25.9 | 26.1 | 19.9 |
| Secondary ARF | 79.3 | 79.1 | 74.1 | 73.9 | 80.1 |
| Medical* | 69.5 | 69.1 | 69.9 | 70.2 | 71.2 |
| Surgical* | 30.5 | 30.8 | 30.1 | 29.8 | 28.8 |
| Hospital characteristics, % | |||||
| Number of beds | |||||
| Small | 10.0 | 10.1 | 10.5 | 10.8 | 11.3 |
| Medium | 25.2 | 25.3 | 24.6 | 24.0 | 22.7 |
| Large | 64.7 | 64.6 | 64.9 | 65.2 | 66.0 |
| Region | |||||
| South* | 18.5 | 18.5 | 17.6 | 17.0 | 16.3 |
| Midwest | 21.4 | 22.0 | 23.6 | 23.2 | 23.5 |
| Northeast | 42.6 | 41.7 | 41.4 | 42.2 | 42.1 |
| West* | 17.5 | 17.8 | 17.3 | 17.6 | 18.1 |
| Hospital type | |||||
| Rural | 13.6 | 13.0 | 11.8 | 11.0 | 10.8 |
| Urban nonteaching | 45.5 | 44.5 | 50.1 | 45.3 | 45.7 |
| Urban teaching | 40.9 | 42.5 | 38.1 | 43.7 | 43.6 |
| Patient outcomes | |||||
| Ventilation strategy | |||||
| IMV* | 48.5 | 48.4 | 47.5 | 46.5 | 42.1 |
| NIV* | 3.8 | 5.3 | 6.9 | 9.4 | 10.1 |
| IMV or NIV | 50.9 | 51.7 | 52.1 | 52.9 | 49.7 |
| Disposition | |||||
| Home/home healthcare* | 42.1 | 43.8 | 42.8 | 43.4 | 45.7 |
| Transfer to acute care | 5.2 | 4.7 | 4.6 | 4.6 | 4.4 |
| Nursing facility* | 24.4 | 24.9 | 27.4 | 28.6 | 29.0 |
| Other | 0.7 | 0.8 | 0.9 | 0.9 | 1.0 |
| Adjusted mortality, % (SE)* | 27.6 (0.3) | 26.4 (0.4) | 24.9 (0.4) | 22.7 (0.4) | 20.6 (0.3) |
| Adjusted mean, LOS/case, d (SE)* | 7.8 (0.1) | 7.9 (0.1) | 7.7 (0.1) | 7.5 (0.1) | 7.1 (0.1) |
| Adjusted mean cost/case, 2009 US$, (SE) | 15,818 (251) | 16,981 (419) | 17,236 (411) | 16,941 (436) | 15,987 (402) |
After adjusting for age and sex, the population incidence of ARF increased from 502 (standard error [SE] = 10) cases per 100,000 in 2001 to 784 (SE = 19) cases per 100,000 in 2009 (a 56% increase, P < 0.0001). Hispanics had the lowest rates of ARF, with both black and white groups having similar rates (Table 2).
| 2001 | 2003 | 2005 | 2007 | 2009 | |
|---|---|---|---|---|---|
| |||||
| All* | 502 (10) | 569 (12) | 595 (14) | 627 (14) | 784 (19) |
| Age group | |||||
| 1844* | 107 (3) | 130 (4) | 137 (4) | 153 (5) | 189 (6) |
| 4564* | 422 (9) | 500 (12) | 521 (13) | 580 (14) | 739 (19) |
| 6584* | 1697 (35) | 1863 (42) | 1950 (50) | 2066 (46) | 2578 (69) |
| 85+ | 3449 (86) | 3792 (106) | 3981 (120) | 3429 (97) | 4163 (123) |
| Sex | |||||
| Male* | 491 (10) | 553 (13) | 582 (14) | 629 (14) | 782 (20) |
| Female* | 512 (10) | 583 (12) | 607 (15) | 625 (13) | 786 (19) |
| Race/ethnicity | |||||
| White* | 398 (11) | 427 (12) | 466 (16) | 450 (13) | 699 (21) |
| Black* | 423 (27) | 513 (33) | 432 (26) | 574 (38) | 738 (37) |
| Hispanic* | 247 (24) | 381 (42) | 307 (27) | 353 (34) | 478 (42) |
| Other* | 268 (20) | 342 (29) | 347 (26) | 424 (29) | 713 (77) |
| In‐hospital mortality | 140 (3) | 148 (3) | 146 (3) | 140 (3) | 154 (4) |
The most common etiologies of ARF among medical patients were pneumonia, CHF, ARDS, COPD exacerbation, and sepsis. Over the 9‐year study, the proportion of cases secondary to pneumonia and sepsis rose significantly: from 39% to 46% and 13% to 21%, respectively (Figure 1).

Mortality and Other Outcomes
The number of in‐hospital deaths related to ARF increased from 277,407 deaths in 2001 to 381,155 in 2009 (a 37% increase, P < 0.001). Standardized to the population, deaths increased from 140 in 2001 to 154 cases per 100,000 in 2009 (a 10% increase, P = 0.027). Despite slightly increasing mortality rates at a population level, adjusted in‐hospital mortality improved from 27.6% in 2001 to 20.6% in 2009 (P < 0.001). Mortality declined for both IMV and NIV patients from 35.3% in 2001 to 30.2% in 2009 and from 23.5% to 19%, respectively, but increased for those who required both NIV and IMV (from 26.9% in 2001 to 28% in 2009).
Adjusted hospital length of stay decreased from 7.8 days per patient in 2001 to 7.1 days in 2009 (P < 0.001), with a concomitant increase in discharges to nursing facilities, from 24% in 2001 to 29% in 2009. There was no linear trend in adjusted cost per case, with $15,818 in 2001 and $15,987 in 2009 (in 2009 US dollars) (Table 1).
Ventilation Practices
Overall, 50.9% patients received ventilatory support (NIV or IMV or both) in 2001 and 49.7% in 2009 (P= 0.25). The use of NIV increased from 3.8% to 10.1% (P < 0.001), a 169% increase, whereas the utilization of IMV decreased from 48.5% in 2001 to 42.1% in 2009 (P for trend < 0.0001), a 13% decrease. Uses of both NIV and IMV during hospitalization were seen in 1.4% of cases in 2001 and 2.5% of cases in 2009.
2009 Data Analysis
In 2009 the 1,917,910 hospitalizations with ARF resulted in 381,155 (SD = 8965) deaths and a total inpatient cost of $54 billion. The most common etiologies in patients over 65 years old were pneumonia, CHF, COPD, ARDS, and sepsis. In patients younger than 45 years the most frequent diagnoses were pneumonia, ARDS, sepsis, asthma, drug ingestion, and trauma. Stratified analysis by gender and by age groups showed that mortality rates among men were higher than for women and were highest in patients older than 85 years (Table 3).
| Disease | Total | Age <45 Years | 4565 Years | 6584 Years | 85+ Years | Male | Female |
|---|---|---|---|---|---|---|---|
| |||||||
| Medical | |||||||
| Total, N (%) | 1,364,624 (71.2) | 144,715 (10.6) | 416,922 (30.6) | 615,009 (45.1) | 187,977 (13.8) | 647,894 (47.5) | 716,635 (52.5) |
| Pneumonia, %* | 46.1 | 41.7 | 42.8 | 46.9 | 54.3 | 48.8 | 43.7 |
| CHF, %* | 36.6 | 10.4 | 27.3 | 43.6 | 54.8 | 35.0 | 38.1 |
| ARDS, %* | 16.1 | 22.9 | 16.2 | 14.5 | 15.9 | 15.5 | 16.7 |
| Sepsis, %* | 21.2 | 18.1 | 21.3 | 21.3 | 23.1 | 22.8 | 19.8 |
| COPD, %* | 25.4 | 4.2 | 25.6 | 32.3 | 18.3 | 25.0 | 25.7 |
| AMI, %* | 9.0 | 2.6 | 7.1 | 10.5 | 13.3 | 9.3 | 8.8 |
| Asthma, %* | 9.2 | 18.1 | 11.6 | 6.7 | 5.4 | 6.2 | 12.0 |
| Stroke, %* | 4.8 | 2.3 | 4.1 | 5.5 | 6.0 | 5.0 | 4.7 |
| Trauma or burns, %* | 3.4 | 5.4 | 2.9 | 3.0 | 4.1 | 4.3 | 2.5 |
| Cardiorespiratory arrest, %* | 4.1 | 3.9 | 4.4 | 4.1 | 3.8 | 4.6 | 3.7 |
| Drug, %* | 3.7 | 16.6 | 5.1 | 0.8 | 0.3 | 3.8 | 3.6 |
| IMV, %* | 37.7 | 54.6 | 43.7 | 33.5 | 24.8 | 41.1 | 34.5 |
| NIV, %* | 11.9 | 7.1 | 11.5 | 13.0 | 12.7 | 11.4 | 12.3 |
| In‐hospital mortality (CI) | 22 (21.322.7) | 12.9 (11.913.9) | 18.5 (17.619.4) | 23.9 (23.024.9) | 31.8 (30.633.1) | 24.2 (23.325.1) | 20.9 (20.121.7) |
| Surgical | |||||||
| Total, N (%) | 552971 (28.8) | 64983 (11.8) | 190225 (34.4) | 254336 (46) | 43426 (7.9) | 295660 (53.5) | 257287 (46.5) |
| Pneumonia, %* | 34.9 | 33.0 | 34.0 | 35.0 | 40.5 | 37.1 | 32.2 |
| CHF, %* | 27.2 | 8.9 | 21.7 | 33.3 | 42.6 | 26.7 | 27.7 |
| ARDS, %* | 45.5 | 51.5 | 45.2 | 44.7 | 42.7 | 45.0 | 46.1 |
| Sepsis, %* | 25.1 | 22.8 | 25.4 | 25.2 | 26.1 | 25.4 | 24.7 |
| COPD, %* | 8.2 | 1.1 | 7.4 | 10.8 | 7.5 | 8.3 | 8.1 |
| AMI, %* | 16.9 | 4.9 | 17.0 | 19.8 | 17.9 | 19.1 | 14.4 |
| Asthma, %* | 6.1 | 7.6 | 7.2 | 5.4 | 3.6 | 4.1 | 8.5 |
| Stroke, %* | 8.9 | 6.6 | 9.2 | 9.4 | 7.2 | 8.9 | 8.8 |
| Trauma or burns, %* | 12.2 | 26.5 | 9.6 | 9.2 | 20.3 | 13.8 | 10.4 |
| Cardiorespiratory arrest, %* | 5.5 | 4.4 | 6.0 | 5.4 | 5.2 | 6.1 | 4.7 |
| Drug, %* | 0.5 | 1.3 | 0.7 | 0.2 | 0.2 | 0.4 | 0.6 |
| IMV, %* | 52.9 | 57.1 | 54.3 | 51.3 | 50.0 | 54.5 | 51.0 |
| NIV, %* | 5.8 | 3.5 | 5.5 | 6.4 | 6.4 | 5.6 | 6.0 |
| In‐hospital mortality, % (CI) | 18.6 (17.819.5) | 10.7 (9.312.0) | 15.5 (14.216.8) | 20.8 (19.821.9) | 29.4 (27.831.1) | 19.0 (18.219.8) | 18.3 (17.319.2) |
When we examined ventilation practices among medical patients we found that patients older than 85 years, when compared to patients younger than 45 years, were less likely to be treated with IMV (25% vs 55%) and more likely to be treated with NIV (12.7% vs 7%). At the same time, the average cost per case was lowest among patients 85 years and older, and hospital costs per case fell sharply after age 70 years. Costs were considerably higher for those who did not survive during hospitalization, particularly for patients younger than 45 years (Figure 2).
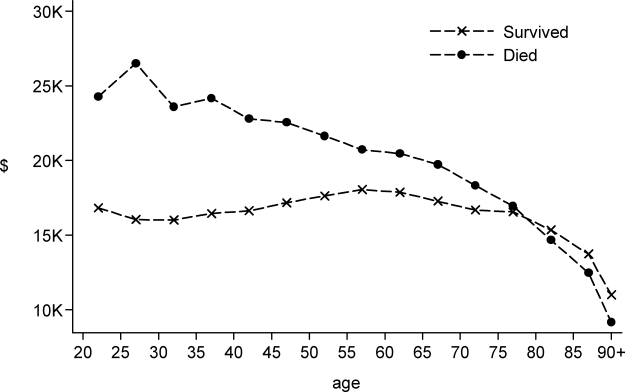
DISCUSSION
In this large population‐based study, we found that the number of hospitalizations associated with a diagnosis of ARF almost doubled over a 9‐year period. In 2009 there were nearly 2 million hospitalizations with ARF in the United States, resulting in approximately 380,000 deaths and inpatient costs of over $54 billion. The population‐adjusted ARF hospitalization rates increased in all age groups, and patients 85 years and older had the highest age‐specific hospitalization rate. Although overall rates of mechanical ventilation (NIV or IMV) remained stable over the 9‐year period, there was an important shift away from IMV (which decreased from 48% in 2001 to 42% in 2009) toward NIV (which increased from 4% in 2001 to 10% in 2009). Overall, there was a significant increase in the number of total deaths despite a decline in adjusted in‐hospital mortality rates. In‐hospital mortality rates decreased for all cases of ARF regardless of ventilation choice.
The findings of this study mirror results of others that have shown that although the incidence of critical care illnesses like sepsis[17, 20, 21, 26] and acute renal failure[27] has increased over the last decade, in‐hospital mortality rates have decreased.[20, 21, 28] Our results also compliment the results of a recent study that looked at hospitalizations for noncardiogenic ARF, which observed a 3.7‐fold increase in the number of cases and a steady decline in case fatality.[11]
Most prior studies addressing the incidence of ARF have included only patients receiving mechanical ventilation. In 1994, the estimated number of cases of ARF requiring IMV was 329,766,[9] which increased to 790,257 in 2005.[10] In our study we found that in 2009, the number of patients with ARF hospitalizations with IMV increased to 806,538. The increase in the overall number of cases with ARF was mainly driven by a surge in cases of sepsis and pneumonia. Our findings are consistent with national trends over time in noncardiogenic ARF[11] and in conditions that predispose patients to ARF such as sepsis[17, 20, 28] and acute renal failure.[27] As the number of claims for ARF doubled and the number of deaths increased, we found that adjusted hospital mortality improved from 27.6% in 2001 to 20.6% in 2009. This decline in hospital mortality was observed among all patients groups, regardless of ventilation choice. The decline in overall case fatality is consistent with prior findings in noncardiogenic ARF,[11] sepsis,[17, 28] and CHF.[29]
There are a number of potential explanations for the reduction in mortality observed over the study period, including improvements in hospital management of the underlying conditions leading to ARF, an increase in the proportion of patients being treated with NIV,[30] and advances in the care of critically ill patients such as the use of low‐tidal volume ventilation.[31, 32] Another contributor may be an increase in the proportion of discharges to nursing facilities, although this change in discharge disposition cannot fully explain our findings. For example, from 2007 to 2009, mortality decreased by 2 percentage points, and nursing home discharges increased by only 0.4 percentage points. Growth and aging of the US population only partially explain the increase we observed in the incidence of ARF, as age‐ and sex‐adjusted population rates increased by 56% from 2001 to 2009. In addition, the NIS captures data on hospital discharges and not individual patients; thus, a patient may have had multiple admissions. Over the last decade adoption of a more intensive practice style has been associated with improved in‐hospital mortality,[33, 34] and although these patients may be living longer they may have multiple readmissions.[35, 36]
We also observed that older patients were less likely to be treated with IMV, had a higher mortality rate, and less expensive care. These results are consistent with other studies and suggest that the intensity of treatment decreases with increasing age, and decisions to withhold or withdraw life‐supporting treatments are more frequent in the elderly.[26, 37] Prior research has shown that severity of illness is more important than age on patients' prognosis,[38, 39] and aggressive treatment strategies are not less cost‐effective when provided to older patients.[40]
Another important finding of this study is the marked increase in the use of NIV paired with a modest reduction in the use of IMV in the treatment of patients with ARF. This finding adds to evidence from other studies, which have similarly reported a dramatic increase in the use of NIV and a decrease in the use of IMV in patients with COPD as well as in ARF of other etiologies.[30, 41]
Our work has several limitations. First, we identified ARF based on ICD‐9‐CM codes and therefore cannot exclude disease misclassification. We did not find any studies in the literature addressing the accuracy and the completeness of ARF coding. However, we employed the same codes used to define ARF as has been used to define organ dysfunction in studies of severe sepsis,[17, 20] and the ICD‐9‐CM codes that we used to identify cases of ARDS have been used in prior studies.[11, 22, 23] Another limitation is that it is not clear to what extent the trends we observed may be due to changes over time in documentation and coding practices. Although this should be considered given the additional reimbursement associated with the diagnosis of ARF, our observation that rates of assisted ventilation have remained almost flat over the 9‐year period of the study suggest that would not wholly account for the rise in ARF. Second, because we did not have access to physiological data such as results of blood gas testing, we could not determine whether the threshold for applying the diagnosis of ARF or for delivering ventilatory support has changed over time. Third, for the purpose of this study we employed a broad definition of ARF, not limiting cases to those requiring mechanical ventilation, and this led to a more heterogeneous cohort including less severe cases of ARF. However, this is not dissimilar to the heterogeneity in disease severity observed among patients who receive a diagnosis of heart failure or acute renal failure. Fourth, survivors of ARF remain at high risk of death in the months after hospitalization,[42] but we assessed only in‐hospital mortality. It is possible that although in‐hospital mortality has improved, 30‐day mortality remained stable. Finally, as the NIS contains only discharge‐level data, we could not distinguish between patients admitted for ARF from those who developed ARF (potentially iatrogenic) after admission.
In summary, over the period of 2001 to 2009, there was a large increase in the number of patients given a diagnosis of ARF and a concomitant reduction in inpatient mortality. Although rates of mechanical ventilation remained relatively constant, there was a significant shift toward greater use of NIV at the expense of IMV.
Disclosures
Dr. Stefan is supported by KM1 CA156726 from the National Cancer Institute (NCI) and by the National Center for Research Resources and the National Center for Advancing Translational Sciences, National Institutes of Health (NIH), through grant UL1 RR025752. The work on this study was supported by a Charlton grant from Tufts University School of Medicine. Dr. Lindenauer and Dr. Pekow are supported by 1R18HL108810‐01 from the National Heart, Lung, and Blood Institute (NHLBI). The content of this publication is solely the responsibility of the authors and does not represent the official views of the NIH, NHLBI, or NCI.
All authors have read and approved the manuscript and none of them have any potential conflicts of interest to report.
Dr. Stefan had full access to all of the data in the study and takes responsibility for the integrity of the data and the accuracy of the data analysis. Conception and design: Mihaela S. Stefan, Penelope S. Pekow, Michael B. Rothberg, Jay Steingrub, Peter K. Lindenauer; analysis and interpretation: Meng‐Shiou Shieh, Mihaela S. Stefan, Penelope S. Pekow, Michael B. Rothberg, Tara Lagu, Peter K. Lindenauer; drafting the manuscript for important intellectual content: Mihaela S. Stefan, Penelope S. Pekow, Michael B. Rothberg, Jay Steingrub, Tara Lagu, and Peter K. Lindenauer.
- , . Goldman's Cecil Medicine. 24th ed. Amsterdam, the Netherlands: Elsevier Inc.; 2012.
- , . Textbook of Respiratory Medicine. 5th ed. Philadelphia, PA: Saunders; 2010.
- , , . Epidemiology and outcome of acute respiratory failure in intensive care unit patients. Crit Care Med. 2003;31(4 suppl):S296–S299.
- , , , et al. Epidemiology of critical care syndromes, organ failures, and life‐support interventions in a suburban US community. Chest. 2011;140(6):1447–1455.
- , , , , . The changing epidemiology of mechanical ventilation: a population‐based study. J Intensive Care Med. 2006;21(3):173–182.
- , , , , . Mechanical ventilation in Ontario, 1992–2000: incidence, survival, and hospital bed utilization of noncardiac surgery adult patients. Crit Care Med. 2004;32(7):1504–1509.
- . Contributions to the epidemiology of acute respiratory failure. Crit Care. 2003;7(4):288–290.
- , , , et al. Incidence, severity, and mortality of acute respiratory failure in Berlin, Germany. Am J Respir Crit Care Med. 1995;151(4):1121–1125.
- . Acute respiratory failure in the United States: incidence and 31‐day survival. Chest. 2000;118(4):1100–1105.
- , , , , , . The epidemiology of mechanical ventilation use in the United States. Crit Care Med. 2010;38(10):1947–1953.
- , , , . Trends in the incidence of noncardiogenic acute respiratory failure: the role of race. Crit Care Med. 2012;40(5):1532–1538.
- , , , , . Secular trends in nosocomial infections and mortality associated with noninvasive ventilation in patients with exacerbation of COPD and pulmonary edema. JAMA. 2003;290(22):2985–2991.
- , , , et al. Association of noninvasive ventilation with nosocomial infections and survival in critically ill patients. JAMA. 2000;284(18):2361–2367.
- , , , , . Noninvasive versus conventional mechanical ventilation. An epidemiologic survey. Am J Respir Crit Care Med. 2001;163(4):874–880.
- , , , , , . Does noninvasive ventilation reduce the ICU nosocomial infection risk? A prospective clinical survey. Intensive Care Med. 1999;25(6):567–573.
- Heathcare Cost and Utilization Project (HCUP). Overview of the Nationwide Inpatient Sample. Available at: http://www.hcup‐us.ahrq.gov/nisoverview.jsp. Accessed December 6, 2011.
- , , , , , . Hospitalizations, costs, and outcomes of severe sepsis in the United States 2003 to 2007. Crit Care Med. 2011;40(3):754–761.
- , , , , . Association of diagnostic coding with trends in hospitalizations and mortality of patients with pneumonia, 2003–2009. JAMA. 2012;307(13):1405–1413.
- , , , , . Little evidence of correlation between growth in health care spending and reduced mortality. Health Aff (Millwood). 2010;29(8):1523–1531.
- , , , . The epidemiology of sepsis in the United States from 1979 through 2000. N Engl J Med. 2003;348(16):1546–1554.
- , , , . Rapid increase in hospitalization and mortality rates for severe sepsis in the United States: a trend analysis from 1993 to 2003. Crit Care Med. 2007;35(5):1244–1250.
- , , . Risk factors for ARDS in the United States: analysis of the 1993 National Mortality Followback Study. Chest. 2001;119(4):1179–1184.
- , , , , , . Acute respiratory distress syndrome: estimated incidence and mortality rate in a 5 million‐person population base. Crit Care. 1998;2(1):29–34.
- , , . Validity of procedure codes in International Classification of Diseases, 9th Revision, Clinical Modification administrative data. Med Care. 2004;42(8):801–809.
- , , , . Comorbidity measures for use with administrative data. Med Care. 1998;36(1):8–27.
- , . Epidemiology of sepsis: an update. Crit Care Med. 2001;29(7 suppl):S109–S116.
- , , , , , . Epidemiology and outcomes of acute renal failure in hospitalized patients: a national survey. Clin J Am Soc Nephrol. 2006;1(1):43–51.
- , , , . Facing the challenge: decreasing case fatality rates in severe sepsis despite increasing hospitalizations. Crit Care Med. 2005;33(11):2555–2562.
- , , , . National and regional trends in heart failure hospitalization and mortality rates for Medicare beneficiaries,1998–2008. JAMA. 2011;306(15):1669–1678.
- , , , et al. Outcomes of noninvasive ventilation for acute exacerbations of chronic obstructive pulmonary disease in the United States, 1998–2008. Am J Respir Crit Care Med. 2011;185(2):152–159.
- , , , et al. A trial of goal‐oriented hemodynamic therapy in critically ill patients. SvO2 Collaborative Group. N Engl J Med. 1995;333(16):1025–1032.
- , . Ventilation with lower tidal volumes as compared with traditional tidal volumes for acute lung injury. N Engl J Med. 2000;343(11):813; author reply 813–814.
- , , . Short‐ and long‐term survival of nonsurgical intensive care patients and its relation to diagnosis, severity of disease, age and comorbidities. Curr Aging Sci. 2009;2(3):240–248.
- , , , , , . The impact of COPD on management and outcomes of patients hospitalized with acute myocardial infarction—a ten‐year retrospective observational study. Chest. 2012;141(6):1441–1448.
- . The paradox of health. N Engl J Med. 1988;318(7):414–418.
- , , . Rehospitalizations among patients in the Medicare fee‐for‐service program. N Engl J Med. 2009;360(14):1418–1428.
- , , , et al. Outcomes and cost‐effectiveness of ventilator support and aggressive care for patients with acute respiratory failure due to pneumonia or acute respiratory distress syndrome. Am J Med. 2000;109(8):614–620.
- , , , et al. Older age, aggressiveness of care, and survival for seriously ill, hospitalized adults. SUPPORT Investigators. Study to Understand Prognoses and Preferences for Outcomes and Risks of Treatments. Ann Intern Med. 1999;131(10):721–728.
- , , , et al. Patient age and decisions to withhold life‐sustaining treatments from seriously ill, hospitalized adults. SUPPORT Investigators. Study to Understand Prognoses and Preferences for Outcomes and Risks of Treatment. Ann Intern Med. 1999;130(2):116–125.
- , , , et al. Are aggressive treatment strategies less cost‐effective for older patients? The case of ventilator support and aggressive care for patients with acute respiratory failure. J Am Geriatr Soc. 2001;49(4):382–390.
- , . Utilization of non‐invasive ventilation in patients with acute respiratory failure from 2000–2009: a population‐based study. Am J Respir Crit Care Med. 2012;185:A6488.
- , , , et al. One‐year outcomes in survivors of the acute respiratory distress syndrome. N Engl J Med. 2003;348(8):683–693.
Acute respiratory failure (ARF), a common and serious complication in hospitalized patients, may be caused by several conditions including pneumonia, chronic obstructive pulmonary disease (COPD), adult respiratory distress syndrome (ARDS), and congestive heart failure (CHF). Although ARF is conventionally defined by an arterial oxygen tension of <60 mm Hg, an arterial carbon dioxide tension of >45 mm Hg, or both, these thresholds serve as a guide to be used in combination with history and clinical assessment of the patient.[1, 2] Supplemental oxygen and treatment of the underlying cause is the mainstay of therapy for ARF, but in severe cases patients are treated with invasive mechanical ventilation (IMV) or noninvasive ventilation (NIV). ARF is the most frequent reason for admission to the intensive care unit (ICU)[3, 4] and has an in‐hospital mortality rate of 33% to 37% among those who require IMV.[5, 6] The majority of epidemiologic studies of ARF have been limited to patients requiring mechanical ventilation or those admitted to the ICU, and information about the characteristics and outcomes of patients across the full spectrum of severity is much more limited.[5, 7, 8, 9, 10, 11] General improvements in the management of underlying conditions, implementation of more effective ventilation strategies,[12, 13] and increasing use of NIV[14, 15] may have led to better outcomes for patients with ARF, yet empirical evidence of a change in the adjusted mortality rate over time is lacking.
The objective of this study was to provide a broad characterization of the epidemiology of ARF among adults hospitalized in the United States using a large nationally representative database. We sought to evaluate whether incidence, mortality, cost, or ventilation practice associated with ARF in the United States changed over the period of 2001 to 2009.
METHODS
Data Source
We utilized data from the Nationwide Inpatient Sample (NIS) of the Health Care Cost and Utilization Project,[16] which is a 20% stratified probability sample of all US acute‐care hospitals each year. These data are drawn from a sampling frame that contains close to 95% of all discharges in the United States, with the hospital discharge record as the unit of analysis. The NIS has been used to study trends in many different diagnoses.[17, 18, 19] The database contains demographic information, payer information, principal and secondary diagnoses, cost, discharge disposition, and death during hospitalization. It also contains information on hospital characteristics including ownership, size, teaching status, and geographic region.
Definitions
We included patients 18 years old discharged between 2001 and 2009 with a primary or secondary diagnosis of ARF. We identified cases of ARF using diagnostic codes (International Classification of Diseases, Ninth Revision, Clinical Modification [ICD‐9‐CM]) previously used in studies of acute organ dysfunction in sepsis (518.81, 518.82, 518.84, 518.4, 799.1, 786.09).[17, 20, 21] To define ARDS we relied on ICD‐9‐CM codes (518.4, 518.82, 518.5, 786.09) used in prior studies that showed good sensitivity and specificity.[22, 23] The use of ventilatory support was identified using the ICD‐9‐CM procedure codes[24] (93.90, 93.70, 93.71, 93.76). Comorbidities were classified using the Agency for Healthcare Research and Quality's (Rockville, MD) Healthcare Cost and Utilization Project's (HCUP) Comorbidity Software version 3.103.5.[25]
Outcomes
The primary outcomes included the annual number of hospitalizations, population incidence, hospital mortality, and costs of care. Secondary outcomes included length of stay, most common diagnoses associated with ARF, disposition at discharge, and use and type of ventilatory support.
Analysis
We estimated the number of hospitalizations with a diagnosis of ARF/year, and we calculated the weighted frequencies following HCUP‐NIS recommendations using SAS/STAT survey procedures. Using population estimates for the years 2001 to 2009 from the US Census Bureau, we employed direct standardization to calculate age‐, gender‐, and race‐adjusted population incidence and mortality rates of ARF per 100,000 population. Hospital mortality was defined as the ratio of ARF hospitalizations ending in death divided by total number of ARF hospitalizations. Mechanical ventilation rates and rates of selected comorbidities were similarly defined.
We employed indirect standardization to adjust hospital mortality rates for age, sex, race/ethnicity, comorbidities, and hospital characteristics using logistic regression models from 2001 to predict hospital mortality for 2002 to 2009. We used linear regression models to test whether the slope of year was significant for trends in outcomes overtime. Costs were calculated using hospital‐specific cost‐to‐charge ratios when available and a weighted group average at the state level for remaining hospitals. We converted all costs to 2009 US dollars using the Consumer Price Index. Costs and lengths of stay were not normally distributed, so we calculated weighted geometric means (the average of all logarithmic values), then converted back to a base‐10 number. Using a Taylor series expansion, we then calculated standard errors. All analyses were performed using SAS version 9.2 (SAS Institute, Inc., Cary, NC).
The Baystate Medical Center institutional review board determined that the project did not constitute human subjects research.
RESULTS
Hospitalization Trends
The number of hospitalizations with an ARF diagnosis code increased at an average annual rate of 11.3% from 1,007,549 (standard deviation [SD] = 19,268) in 2001 to 1,917,910 (SD = 47,558) in 2009. More than two‐thirds of ARF admissions were associated with medical, rather than surgical, conditions (69.5% in 2001 and 71.2% in 2009). The median age, racial make‐up, and gender did not change significantly. Over the study period we observed an increase in ARF‐related hospitalizations in large, urban, teaching hospitals and in hospitals located in the Midwest (Table 1).
| 2001 | 2003 | 2005 | 2007 | 2009 | |
|---|---|---|---|---|---|
| |||||
| Patient characteristics | |||||
| All, N (SD) | 1,007,549 (19,268) | 1,184,928 (25,542) | 1,288,594 (30,493) | 1,480,270 (32,002) | 1,917,910 (47,558) |
| Age, mean (SE), y | 66.6 (0.2) | 66.0 (0.2) | 66.1 (0.2) | 65.8 (0.2) | 65.8 (0.2) |
| Age group, % | |||||
| 1844 | 11.5 | 12.0 | 11.5 | 11.6 | 10.9 |
| 4564* | 26.7 | 28.9 | 29.6 | 30.7 | 31.7 |
| 6584* | 50.2 | 47.8 | 47.0 | 45.7 | 45.3 |
| 85+ | 11.5 | 11.4 | 11.9 | 12.0 | 12.1 |
| Male* | 48.1 | 48.2 | 48.6 | 49.3 | 49.2 |
| Race | |||||
| White | 75.8 | 71.9 | 76.5 | 71.8 | 73.4 |
| Black | 12.7 | 13.6 | 11.2 | 14.2 | 12.5 |
| Hispanic | 7.2 | 9.8 | 7.7 | 8.5 | 7.8 |
| Other | 4.2 | 4.7 | 4.7 | 5.5 | 6.3 |
| Primary ARF | 20.7 | 20.9 | 25.9 | 26.1 | 19.9 |
| Secondary ARF | 79.3 | 79.1 | 74.1 | 73.9 | 80.1 |
| Medical* | 69.5 | 69.1 | 69.9 | 70.2 | 71.2 |
| Surgical* | 30.5 | 30.8 | 30.1 | 29.8 | 28.8 |
| Hospital characteristics, % | |||||
| Number of beds | |||||
| Small | 10.0 | 10.1 | 10.5 | 10.8 | 11.3 |
| Medium | 25.2 | 25.3 | 24.6 | 24.0 | 22.7 |
| Large | 64.7 | 64.6 | 64.9 | 65.2 | 66.0 |
| Region | |||||
| South* | 18.5 | 18.5 | 17.6 | 17.0 | 16.3 |
| Midwest | 21.4 | 22.0 | 23.6 | 23.2 | 23.5 |
| Northeast | 42.6 | 41.7 | 41.4 | 42.2 | 42.1 |
| West* | 17.5 | 17.8 | 17.3 | 17.6 | 18.1 |
| Hospital type | |||||
| Rural | 13.6 | 13.0 | 11.8 | 11.0 | 10.8 |
| Urban nonteaching | 45.5 | 44.5 | 50.1 | 45.3 | 45.7 |
| Urban teaching | 40.9 | 42.5 | 38.1 | 43.7 | 43.6 |
| Patient outcomes | |||||
| Ventilation strategy | |||||
| IMV* | 48.5 | 48.4 | 47.5 | 46.5 | 42.1 |
| NIV* | 3.8 | 5.3 | 6.9 | 9.4 | 10.1 |
| IMV or NIV | 50.9 | 51.7 | 52.1 | 52.9 | 49.7 |
| Disposition | |||||
| Home/home healthcare* | 42.1 | 43.8 | 42.8 | 43.4 | 45.7 |
| Transfer to acute care | 5.2 | 4.7 | 4.6 | 4.6 | 4.4 |
| Nursing facility* | 24.4 | 24.9 | 27.4 | 28.6 | 29.0 |
| Other | 0.7 | 0.8 | 0.9 | 0.9 | 1.0 |
| Adjusted mortality, % (SE)* | 27.6 (0.3) | 26.4 (0.4) | 24.9 (0.4) | 22.7 (0.4) | 20.6 (0.3) |
| Adjusted mean, LOS/case, d (SE)* | 7.8 (0.1) | 7.9 (0.1) | 7.7 (0.1) | 7.5 (0.1) | 7.1 (0.1) |
| Adjusted mean cost/case, 2009 US$, (SE) | 15,818 (251) | 16,981 (419) | 17,236 (411) | 16,941 (436) | 15,987 (402) |
After adjusting for age and sex, the population incidence of ARF increased from 502 (standard error [SE] = 10) cases per 100,000 in 2001 to 784 (SE = 19) cases per 100,000 in 2009 (a 56% increase, P < 0.0001). Hispanics had the lowest rates of ARF, with both black and white groups having similar rates (Table 2).
| 2001 | 2003 | 2005 | 2007 | 2009 | |
|---|---|---|---|---|---|
| |||||
| All* | 502 (10) | 569 (12) | 595 (14) | 627 (14) | 784 (19) |
| Age group | |||||
| 1844* | 107 (3) | 130 (4) | 137 (4) | 153 (5) | 189 (6) |
| 4564* | 422 (9) | 500 (12) | 521 (13) | 580 (14) | 739 (19) |
| 6584* | 1697 (35) | 1863 (42) | 1950 (50) | 2066 (46) | 2578 (69) |
| 85+ | 3449 (86) | 3792 (106) | 3981 (120) | 3429 (97) | 4163 (123) |
| Sex | |||||
| Male* | 491 (10) | 553 (13) | 582 (14) | 629 (14) | 782 (20) |
| Female* | 512 (10) | 583 (12) | 607 (15) | 625 (13) | 786 (19) |
| Race/ethnicity | |||||
| White* | 398 (11) | 427 (12) | 466 (16) | 450 (13) | 699 (21) |
| Black* | 423 (27) | 513 (33) | 432 (26) | 574 (38) | 738 (37) |
| Hispanic* | 247 (24) | 381 (42) | 307 (27) | 353 (34) | 478 (42) |
| Other* | 268 (20) | 342 (29) | 347 (26) | 424 (29) | 713 (77) |
| In‐hospital mortality | 140 (3) | 148 (3) | 146 (3) | 140 (3) | 154 (4) |
The most common etiologies of ARF among medical patients were pneumonia, CHF, ARDS, COPD exacerbation, and sepsis. Over the 9‐year study, the proportion of cases secondary to pneumonia and sepsis rose significantly: from 39% to 46% and 13% to 21%, respectively (Figure 1).
Mortality and Other Outcomes
The number of in‐hospital deaths related to ARF increased from 277,407 deaths in 2001 to 381,155 in 2009 (a 37% increase, P < 0.001). Standardized to the population, deaths increased from 140 in 2001 to 154 cases per 100,000 in 2009 (a 10% increase, P = 0.027). Despite slightly increasing mortality rates at a population level, adjusted in‐hospital mortality improved from 27.6% in 2001 to 20.6% in 2009 (P < 0.001). Mortality declined for both IMV and NIV patients from 35.3% in 2001 to 30.2% in 2009 and from 23.5% to 19%, respectively, but increased for those who required both NIV and IMV (from 26.9% in 2001 to 28% in 2009).
Adjusted hospital length of stay decreased from 7.8 days per patient in 2001 to 7.1 days in 2009 (P < 0.001), with a concomitant increase in discharges to nursing facilities, from 24% in 2001 to 29% in 2009. There was no linear trend in adjusted cost per case, with $15,818 in 2001 and $15,987 in 2009 (in 2009 US dollars) (Table 1).
Ventilation Practices
Overall, 50.9% patients received ventilatory support (NIV or IMV or both) in 2001 and 49.7% in 2009 (P= 0.25). The use of NIV increased from 3.8% to 10.1% (P < 0.001), a 169% increase, whereas the utilization of IMV decreased from 48.5% in 2001 to 42.1% in 2009 (P for trend < 0.0001), a 13% decrease. Uses of both NIV and IMV during hospitalization were seen in 1.4% of cases in 2001 and 2.5% of cases in 2009.
2009 Data Analysis
In 2009 the 1,917,910 hospitalizations with ARF resulted in 381,155 (SD = 8965) deaths and a total inpatient cost of $54 billion. The most common etiologies in patients over 65 years old were pneumonia, CHF, COPD, ARDS, and sepsis. In patients younger than 45 years the most frequent diagnoses were pneumonia, ARDS, sepsis, asthma, drug ingestion, and trauma. Stratified analysis by gender and by age groups showed that mortality rates among men were higher than for women and were highest in patients older than 85 years (Table 3).
| Disease | Total | Age <45 Years | 4565 Years | 6584 Years | 85+ Years | Male | Female |
|---|---|---|---|---|---|---|---|
| |||||||
| Medical | |||||||
| Total, N (%) | 1,364,624 (71.2) | 144,715 (10.6) | 416,922 (30.6) | 615,009 (45.1) | 187,977 (13.8) | 647,894 (47.5) | 716,635 (52.5) |
| Pneumonia, %* | 46.1 | 41.7 | 42.8 | 46.9 | 54.3 | 48.8 | 43.7 |
| CHF, %* | 36.6 | 10.4 | 27.3 | 43.6 | 54.8 | 35.0 | 38.1 |
| ARDS, %* | 16.1 | 22.9 | 16.2 | 14.5 | 15.9 | 15.5 | 16.7 |
| Sepsis, %* | 21.2 | 18.1 | 21.3 | 21.3 | 23.1 | 22.8 | 19.8 |
| COPD, %* | 25.4 | 4.2 | 25.6 | 32.3 | 18.3 | 25.0 | 25.7 |
| AMI, %* | 9.0 | 2.6 | 7.1 | 10.5 | 13.3 | 9.3 | 8.8 |
| Asthma, %* | 9.2 | 18.1 | 11.6 | 6.7 | 5.4 | 6.2 | 12.0 |
| Stroke, %* | 4.8 | 2.3 | 4.1 | 5.5 | 6.0 | 5.0 | 4.7 |
| Trauma or burns, %* | 3.4 | 5.4 | 2.9 | 3.0 | 4.1 | 4.3 | 2.5 |
| Cardiorespiratory arrest, %* | 4.1 | 3.9 | 4.4 | 4.1 | 3.8 | 4.6 | 3.7 |
| Drug, %* | 3.7 | 16.6 | 5.1 | 0.8 | 0.3 | 3.8 | 3.6 |
| IMV, %* | 37.7 | 54.6 | 43.7 | 33.5 | 24.8 | 41.1 | 34.5 |
| NIV, %* | 11.9 | 7.1 | 11.5 | 13.0 | 12.7 | 11.4 | 12.3 |
| In‐hospital mortality (CI) | 22 (21.322.7) | 12.9 (11.913.9) | 18.5 (17.619.4) | 23.9 (23.024.9) | 31.8 (30.633.1) | 24.2 (23.325.1) | 20.9 (20.121.7) |
| Surgical | |||||||
| Total, N (%) | 552971 (28.8) | 64983 (11.8) | 190225 (34.4) | 254336 (46) | 43426 (7.9) | 295660 (53.5) | 257287 (46.5) |
| Pneumonia, %* | 34.9 | 33.0 | 34.0 | 35.0 | 40.5 | 37.1 | 32.2 |
| CHF, %* | 27.2 | 8.9 | 21.7 | 33.3 | 42.6 | 26.7 | 27.7 |
| ARDS, %* | 45.5 | 51.5 | 45.2 | 44.7 | 42.7 | 45.0 | 46.1 |
| Sepsis, %* | 25.1 | 22.8 | 25.4 | 25.2 | 26.1 | 25.4 | 24.7 |
| COPD, %* | 8.2 | 1.1 | 7.4 | 10.8 | 7.5 | 8.3 | 8.1 |
| AMI, %* | 16.9 | 4.9 | 17.0 | 19.8 | 17.9 | 19.1 | 14.4 |
| Asthma, %* | 6.1 | 7.6 | 7.2 | 5.4 | 3.6 | 4.1 | 8.5 |
| Stroke, %* | 8.9 | 6.6 | 9.2 | 9.4 | 7.2 | 8.9 | 8.8 |
| Trauma or burns, %* | 12.2 | 26.5 | 9.6 | 9.2 | 20.3 | 13.8 | 10.4 |
| Cardiorespiratory arrest, %* | 5.5 | 4.4 | 6.0 | 5.4 | 5.2 | 6.1 | 4.7 |
| Drug, %* | 0.5 | 1.3 | 0.7 | 0.2 | 0.2 | 0.4 | 0.6 |
| IMV, %* | 52.9 | 57.1 | 54.3 | 51.3 | 50.0 | 54.5 | 51.0 |
| NIV, %* | 5.8 | 3.5 | 5.5 | 6.4 | 6.4 | 5.6 | 6.0 |
| In‐hospital mortality, % (CI) | 18.6 (17.819.5) | 10.7 (9.312.0) | 15.5 (14.216.8) | 20.8 (19.821.9) | 29.4 (27.831.1) | 19.0 (18.219.8) | 18.3 (17.319.2) |
When we examined ventilation practices among medical patients we found that patients older than 85 years, when compared to patients younger than 45 years, were less likely to be treated with IMV (25% vs 55%) and more likely to be treated with NIV (12.7% vs 7%). At the same time, the average cost per case was lowest among patients 85 years and older, and hospital costs per case fell sharply after age 70 years. Costs were considerably higher for those who did not survive during hospitalization, particularly for patients younger than 45 years (Figure 2).
DISCUSSION
In this large population‐based study, we found that the number of hospitalizations associated with a diagnosis of ARF almost doubled over a 9‐year period. In 2009 there were nearly 2 million hospitalizations with ARF in the United States, resulting in approximately 380,000 deaths and inpatient costs of over $54 billion. The population‐adjusted ARF hospitalization rates increased in all age groups, and patients 85 years and older had the highest age‐specific hospitalization rate. Although overall rates of mechanical ventilation (NIV or IMV) remained stable over the 9‐year period, there was an important shift away from IMV (which decreased from 48% in 2001 to 42% in 2009) toward NIV (which increased from 4% in 2001 to 10% in 2009). Overall, there was a significant increase in the number of total deaths despite a decline in adjusted in‐hospital mortality rates. In‐hospital mortality rates decreased for all cases of ARF regardless of ventilation choice.
The findings of this study mirror results of others that have shown that although the incidence of critical care illnesses like sepsis[17, 20, 21, 26] and acute renal failure[27] has increased over the last decade, in‐hospital mortality rates have decreased.[20, 21, 28] Our results also compliment the results of a recent study that looked at hospitalizations for noncardiogenic ARF, which observed a 3.7‐fold increase in the number of cases and a steady decline in case fatality.[11]
Most prior studies addressing the incidence of ARF have included only patients receiving mechanical ventilation. In 1994, the estimated number of cases of ARF requiring IMV was 329,766,[9] which increased to 790,257 in 2005.[10] In our study we found that in 2009, the number of patients with ARF hospitalizations with IMV increased to 806,538. The increase in the overall number of cases with ARF was mainly driven by a surge in cases of sepsis and pneumonia. Our findings are consistent with national trends over time in noncardiogenic ARF[11] and in conditions that predispose patients to ARF such as sepsis[17, 20, 28] and acute renal failure.[27] As the number of claims for ARF doubled and the number of deaths increased, we found that adjusted hospital mortality improved from 27.6% in 2001 to 20.6% in 2009. This decline in hospital mortality was observed among all patients groups, regardless of ventilation choice. The decline in overall case fatality is consistent with prior findings in noncardiogenic ARF,[11] sepsis,[17, 28] and CHF.[29]
There are a number of potential explanations for the reduction in mortality observed over the study period, including improvements in hospital management of the underlying conditions leading to ARF, an increase in the proportion of patients being treated with NIV,[30] and advances in the care of critically ill patients such as the use of low‐tidal volume ventilation.[31, 32] Another contributor may be an increase in the proportion of discharges to nursing facilities, although this change in discharge disposition cannot fully explain our findings. For example, from 2007 to 2009, mortality decreased by 2 percentage points, and nursing home discharges increased by only 0.4 percentage points. Growth and aging of the US population only partially explain the increase we observed in the incidence of ARF, as age‐ and sex‐adjusted population rates increased by 56% from 2001 to 2009. In addition, the NIS captures data on hospital discharges and not individual patients; thus, a patient may have had multiple admissions. Over the last decade adoption of a more intensive practice style has been associated with improved in‐hospital mortality,[33, 34] and although these patients may be living longer they may have multiple readmissions.[35, 36]
We also observed that older patients were less likely to be treated with IMV, had a higher mortality rate, and less expensive care. These results are consistent with other studies and suggest that the intensity of treatment decreases with increasing age, and decisions to withhold or withdraw life‐supporting treatments are more frequent in the elderly.[26, 37] Prior research has shown that severity of illness is more important than age on patients' prognosis,[38, 39] and aggressive treatment strategies are not less cost‐effective when provided to older patients.[40]
Another important finding of this study is the marked increase in the use of NIV paired with a modest reduction in the use of IMV in the treatment of patients with ARF. This finding adds to evidence from other studies, which have similarly reported a dramatic increase in the use of NIV and a decrease in the use of IMV in patients with COPD as well as in ARF of other etiologies.[30, 41]
Our work has several limitations. First, we identified ARF based on ICD‐9‐CM codes and therefore cannot exclude disease misclassification. We did not find any studies in the literature addressing the accuracy and the completeness of ARF coding. However, we employed the same codes used to define ARF as has been used to define organ dysfunction in studies of severe sepsis,[17, 20] and the ICD‐9‐CM codes that we used to identify cases of ARDS have been used in prior studies.[11, 22, 23] Another limitation is that it is not clear to what extent the trends we observed may be due to changes over time in documentation and coding practices. Although this should be considered given the additional reimbursement associated with the diagnosis of ARF, our observation that rates of assisted ventilation have remained almost flat over the 9‐year period of the study suggest that would not wholly account for the rise in ARF. Second, because we did not have access to physiological data such as results of blood gas testing, we could not determine whether the threshold for applying the diagnosis of ARF or for delivering ventilatory support has changed over time. Third, for the purpose of this study we employed a broad definition of ARF, not limiting cases to those requiring mechanical ventilation, and this led to a more heterogeneous cohort including less severe cases of ARF. However, this is not dissimilar to the heterogeneity in disease severity observed among patients who receive a diagnosis of heart failure or acute renal failure. Fourth, survivors of ARF remain at high risk of death in the months after hospitalization,[42] but we assessed only in‐hospital mortality. It is possible that although in‐hospital mortality has improved, 30‐day mortality remained stable. Finally, as the NIS contains only discharge‐level data, we could not distinguish between patients admitted for ARF from those who developed ARF (potentially iatrogenic) after admission.
In summary, over the period of 2001 to 2009, there was a large increase in the number of patients given a diagnosis of ARF and a concomitant reduction in inpatient mortality. Although rates of mechanical ventilation remained relatively constant, there was a significant shift toward greater use of NIV at the expense of IMV.
Disclosures
Dr. Stefan is supported by KM1 CA156726 from the National Cancer Institute (NCI) and by the National Center for Research Resources and the National Center for Advancing Translational Sciences, National Institutes of Health (NIH), through grant UL1 RR025752. The work on this study was supported by a Charlton grant from Tufts University School of Medicine. Dr. Lindenauer and Dr. Pekow are supported by 1R18HL108810‐01 from the National Heart, Lung, and Blood Institute (NHLBI). The content of this publication is solely the responsibility of the authors and does not represent the official views of the NIH, NHLBI, or NCI.
All authors have read and approved the manuscript and none of them have any potential conflicts of interest to report.
Dr. Stefan had full access to all of the data in the study and takes responsibility for the integrity of the data and the accuracy of the data analysis. Conception and design: Mihaela S. Stefan, Penelope S. Pekow, Michael B. Rothberg, Jay Steingrub, Peter K. Lindenauer; analysis and interpretation: Meng‐Shiou Shieh, Mihaela S. Stefan, Penelope S. Pekow, Michael B. Rothberg, Tara Lagu, Peter K. Lindenauer; drafting the manuscript for important intellectual content: Mihaela S. Stefan, Penelope S. Pekow, Michael B. Rothberg, Jay Steingrub, Tara Lagu, and Peter K. Lindenauer.
- , . Goldman's Cecil Medicine. 24th ed. Amsterdam, the Netherlands: Elsevier Inc.; 2012.
- , . Textbook of Respiratory Medicine. 5th ed. Philadelphia, PA: Saunders; 2010.
- , , . Epidemiology and outcome of acute respiratory failure in intensive care unit patients. Crit Care Med. 2003;31(4 suppl):S296–S299.
- , , , et al. Epidemiology of critical care syndromes, organ failures, and life‐support interventions in a suburban US community. Chest. 2011;140(6):1447–1455.
- , , , , . The changing epidemiology of mechanical ventilation: a population‐based study. J Intensive Care Med. 2006;21(3):173–182.
- , , , , . Mechanical ventilation in Ontario, 1992–2000: incidence, survival, and hospital bed utilization of noncardiac surgery adult patients. Crit Care Med. 2004;32(7):1504–1509.
- . Contributions to the epidemiology of acute respiratory failure. Crit Care. 2003;7(4):288–290.
- , , , et al. Incidence, severity, and mortality of acute respiratory failure in Berlin, Germany. Am J Respir Crit Care Med. 1995;151(4):1121–1125.
- . Acute respiratory failure in the United States: incidence and 31‐day survival. Chest. 2000;118(4):1100–1105.
- , , , , , . The epidemiology of mechanical ventilation use in the United States. Crit Care Med. 2010;38(10):1947–1953.
- , , , . Trends in the incidence of noncardiogenic acute respiratory failure: the role of race. Crit Care Med. 2012;40(5):1532–1538.
- , , , , . Secular trends in nosocomial infections and mortality associated with noninvasive ventilation in patients with exacerbation of COPD and pulmonary edema. JAMA. 2003;290(22):2985–2991.
- , , , et al. Association of noninvasive ventilation with nosocomial infections and survival in critically ill patients. JAMA. 2000;284(18):2361–2367.
- , , , , . Noninvasive versus conventional mechanical ventilation. An epidemiologic survey. Am J Respir Crit Care Med. 2001;163(4):874–880.
- , , , , , . Does noninvasive ventilation reduce the ICU nosocomial infection risk? A prospective clinical survey. Intensive Care Med. 1999;25(6):567–573.
- Heathcare Cost and Utilization Project (HCUP). Overview of the Nationwide Inpatient Sample. Available at: http://www.hcup‐us.ahrq.gov/nisoverview.jsp. Accessed December 6, 2011.
- , , , , , . Hospitalizations, costs, and outcomes of severe sepsis in the United States 2003 to 2007. Crit Care Med. 2011;40(3):754–761.
- , , , , . Association of diagnostic coding with trends in hospitalizations and mortality of patients with pneumonia, 2003–2009. JAMA. 2012;307(13):1405–1413.
- , , , , . Little evidence of correlation between growth in health care spending and reduced mortality. Health Aff (Millwood). 2010;29(8):1523–1531.
- , , , . The epidemiology of sepsis in the United States from 1979 through 2000. N Engl J Med. 2003;348(16):1546–1554.
- , , , . Rapid increase in hospitalization and mortality rates for severe sepsis in the United States: a trend analysis from 1993 to 2003. Crit Care Med. 2007;35(5):1244–1250.
- , , . Risk factors for ARDS in the United States: analysis of the 1993 National Mortality Followback Study. Chest. 2001;119(4):1179–1184.
- , , , , , . Acute respiratory distress syndrome: estimated incidence and mortality rate in a 5 million‐person population base. Crit Care. 1998;2(1):29–34.
- , , . Validity of procedure codes in International Classification of Diseases, 9th Revision, Clinical Modification administrative data. Med Care. 2004;42(8):801–809.
- , , , . Comorbidity measures for use with administrative data. Med Care. 1998;36(1):8–27.
- , . Epidemiology of sepsis: an update. Crit Care Med. 2001;29(7 suppl):S109–S116.
- , , , , , . Epidemiology and outcomes of acute renal failure in hospitalized patients: a national survey. Clin J Am Soc Nephrol. 2006;1(1):43–51.
- , , , . Facing the challenge: decreasing case fatality rates in severe sepsis despite increasing hospitalizations. Crit Care Med. 2005;33(11):2555–2562.
- , , , . National and regional trends in heart failure hospitalization and mortality rates for Medicare beneficiaries,1998–2008. JAMA. 2011;306(15):1669–1678.
- , , , et al. Outcomes of noninvasive ventilation for acute exacerbations of chronic obstructive pulmonary disease in the United States, 1998–2008. Am J Respir Crit Care Med. 2011;185(2):152–159.
- , , , et al. A trial of goal‐oriented hemodynamic therapy in critically ill patients. SvO2 Collaborative Group. N Engl J Med. 1995;333(16):1025–1032.
- , . Ventilation with lower tidal volumes as compared with traditional tidal volumes for acute lung injury. N Engl J Med. 2000;343(11):813; author reply 813–814.
- , , . Short‐ and long‐term survival of nonsurgical intensive care patients and its relation to diagnosis, severity of disease, age and comorbidities. Curr Aging Sci. 2009;2(3):240–248.
- , , , , , . The impact of COPD on management and outcomes of patients hospitalized with acute myocardial infarction—a ten‐year retrospective observational study. Chest. 2012;141(6):1441–1448.
- . The paradox of health. N Engl J Med. 1988;318(7):414–418.
- , , . Rehospitalizations among patients in the Medicare fee‐for‐service program. N Engl J Med. 2009;360(14):1418–1428.
- , , , et al. Outcomes and cost‐effectiveness of ventilator support and aggressive care for patients with acute respiratory failure due to pneumonia or acute respiratory distress syndrome. Am J Med. 2000;109(8):614–620.
- , , , et al. Older age, aggressiveness of care, and survival for seriously ill, hospitalized adults. SUPPORT Investigators. Study to Understand Prognoses and Preferences for Outcomes and Risks of Treatments. Ann Intern Med. 1999;131(10):721–728.
- , , , et al. Patient age and decisions to withhold life‐sustaining treatments from seriously ill, hospitalized adults. SUPPORT Investigators. Study to Understand Prognoses and Preferences for Outcomes and Risks of Treatment. Ann Intern Med. 1999;130(2):116–125.
- , , , et al. Are aggressive treatment strategies less cost‐effective for older patients? The case of ventilator support and aggressive care for patients with acute respiratory failure. J Am Geriatr Soc. 2001;49(4):382–390.
- , . Utilization of non‐invasive ventilation in patients with acute respiratory failure from 2000–2009: a population‐based study. Am J Respir Crit Care Med. 2012;185:A6488.
- , , , et al. One‐year outcomes in survivors of the acute respiratory distress syndrome. N Engl J Med. 2003;348(8):683–693.
Copyright © 2012 Society of Hospital Medicine