User login
Warfarin‐Associated Adverse Events
Warfarin is 1 of the most common causes of adverse drug events, with hospitalized patients being particularly at risk compared to outpatients.[1] Despite the availability of new oral anticoagulants (NOACs), physicians commonly prescribe warfarin to hospitalized patients,[2] likely in part due to the greater difficulty in reversing NOACs compared to warfarin. Furthermore, uptake of the NOACs is likely to be slow in resource‐poor countries due to the lower cost of warfarin.[3] However, the narrow therapeutic index, frequent drug‐drug interactions, and patient variability in metabolism of warfarin makes management challenging.[4] Thus, warfarin remains a significant cause of adverse events in hospitalized patients, occurring in approximately 3% to 8% of exposed patients, depending on underlying condition.[2, 5]
An elevated international normalized ratio (INR) is a strong predictor of drug‐associated adverse events (patient harm). In a study employing 21 different electronic triggers to identify potential adverse events, an elevated INR had the highest yield for events associated with harm (96% of INRs >5.0 associated with harm).[6] Although pharmacist‐managed inpatient anticoagulation services have been shown to improve warfarin management,[7, 8] there are evidence gaps regarding the causes of warfarin‐related adverse events and practice changes that could decrease their frequency. Although overanticoagulation is a well‐known risk factor for warfarin‐related adverse events,[9, 10] there are few evidence‐based warfarin monitoring and dosing recommendations for hospitalized patients.[10] For example, the 2012 American College of Chest Physicians Antithrombotic Guidelines[11] provide a weak recommendation on initial dosing of warfarin, but no recommendations on how frequently to monitor the INR, or appropriate dosing responses to INR levels. Although many hospitals employ protocols that suggest daily INR monitoring until stable, there are no evidence‐based guidelines to support this practice.[12] Conversely, there are reports of flags to order an INR level that are not activated unless greater than 2[13] or 3 days[14] pass since the prior INR. Protocols from some major academic medical centers suggest that after a therapeutic INR is reached, INR levels can be measured intermittently, as infrequently as twice a week.[15, 16]
The 2015 Joint Commission anticoagulant‐focused National Patient Safety Goal[17] (initially issued in 2008) mandates the assessment of baseline coagulation status before starting warfarin, and warfarin dosing based on a current INR; however, current is not defined. Neither the extent to which the mandate for assessing baseline coagulation status is adhered to nor the relationship between this process of care and patient outcomes is known. The importance of adverse drug events associated with anticoagulants, included warfarin, was also recently highlighted in the 2014 federal National Action Plan for Adverse Drug Event Prevention. In this document, the prevention of adverse drug events associated with anticoagulants was 1 of the 3 areas selected for special national attention and action.[18]
The Medicare Patient Safety Monitoring System (MPSMS) is a national chart abstraction‐based system that includes 21 in‐hospital adverse event measures, including warfarin‐associated adverse drug events.[2] Because of the importance of warfarin‐associated bleeding in hospitalized patients, we analyzed MPSMS data to determine what factors related to INR monitoring practices place patients at risk for these events. We were particularly interested in determining if we could detect potentially modifiable predictors of overanticoagulation and warfarin‐associated adverse events.
METHODS
Study Sample
We combined 2009 to 2013 MPSMS all payer data from the Centers for Medicare & Medicaid Services Hospital Inpatient Quality Reporting program for 4 common medical conditions: (1) acute myocardial infarction, (2) heart failure, (3) pneumonia, and (4) major surgery (as defined by the national Surgical Care Improvement Project).[19] To increase the sample size for cardiac patients, we combined myocardial infarction patients and heart failure patients into 1 group: acute cardiovascular disease. Patients under 18 years of age are excluded from the MPSMS sample, and we excluded patients whose INR never exceeded 1.5 after the initiation of warfarin therapy.
Patient Characteristics
Patient characteristics included demographics (age, sex, race [white, black, and other race]) and comorbidities. Comorbidities abstracted from medical records included: histories at the time of hospital admission of heart failure, obesity, coronary artery disease, renal disease, cerebrovascular disease, chronic obstructive pulmonary disease, cancer, diabetes, and smoking. The use of anticoagulants other than warfarin was also captured.
INRs
The INR measurement period for each patient started from the initial date of warfarin administration and ended on the date the maximum INR occurred. If a patient had more than 1 INR value on any day, the higher INR value was selected. A day without an INR measurement was defined as no INR value documented for a calendar day within the INR measurement period, starting on the third day of warfarin and ending on the day of the maximum INR level.
Outcomes
The study was performed to assess the association between the number of days on which a patient did not have an INR measured while receiving warfarin and the occurrence of (1) an INR 6.0[20, 21] (intermediate outcome) and (2) a warfarin‐associated adverse event. A description of the MPSMS measure of warfarin‐associated adverse events has been previously published.[2] Warfarin‐associated adverse events must have occurred within 48 hours of predefined triggers: an INR 4.0, cessation of warfarin therapy, administration of vitamin K or fresh frozen plasma, or transfusion of packed red blood cells other than in the setting of a surgical procedure. Warfarin‐associated adverse events were divided into minor and major events for this analysis. Minor events were defined as bleeding, drop in hematocrit of 3 points (occurring more than 48 hours after admission and not associated with surgery), or development of a hematoma. Major events were death, intracranial bleeding, or cardiac arrest. A patient who had both a major and a minor event was considered as having had a major event.
To assess the relationship between a rapidly rising INR and a subsequent INR 5.0 or 6.0, we determined the increase in INR between the measurement done 2 days prior to the maximum INR and 1 day prior to the maximum INR. This analysis was performed only on patients whose INR was 2.0 and 3.5 on the day prior to the maximum INR. In doing so, we sought to determine if the INR rise could predict the occurrence of a subsequent severely elevated INR in patients whose INR was within or near the therapeutic range.
Statistical Analysis
We conducted bivariate analysis to quantify the associations between lapses in measurement of the INR and subsequent warfarin‐associated adverse events, using the Mantel‐Haenszel 2 test for categorical variables. We fitted a generalized linear model with a logit link function to estimate the association of days on which an INR was not measured and the occurrence of the composite adverse event measure or the occurrence of an INR 6.0, adjusting for baseline patient characteristics, the number of days on warfarin, and receipt of heparin and low‐molecular‐weight heparin (LMWH). To account for potential imbalances in baseline patient characteristics and warfarin use prior to admission, we conducted a second analysis using the stabilized inverse probability weights approach. Specifically, we weighted each patient by the patient's inverse propensity scores of having only 1 day, at least 1 day, and at least 2 days without an INR measurement while receiving warfarin.[22, 23, 24, 25] To obtain the propensity scores, we fitted 3 logistic models with all variables included in the above primary mixed models except receipt of LMWH, heparin, and the number of days on warfarin as predictors, but 3 different outcomes, 1 day without an INR measurement, 1 or more days without an INR measurement, and 2 or more days without an INR measurement. Analyses were conducted using SAS version 9.2 (SAS Institute Inc., Cary, NC). All statistical testing was 2‐sided, at a significance level of 0.05. The institutional review board at Solutions IRB (Little Rock, AR) determined that the requirement for informed consent could be waived based on the nature of the study.
RESULTS
There were 130,828 patients included in the 2009 to 2013 MPSMS sample, of whom 19,445 (14.9%) received warfarin during their hospital stay and had at least 1 INR measurement. Among these patients, 5228 (26.9%) had no INR level above 1.5 and were excluded from further analysis, leaving 14,217 included patients. Of these patients, 1055 (7.4%) developed a warfarin‐associated adverse event. Table 1 demonstrates the baseline demographics and comorbidities of the included patients.
| Characteristics | Acute Cardiovascular Disease, No. (%), N = 6,394 | Pneumonia, No. (%), N = 3,668 | Major Surgery, No. (%), N = 4,155 | All, No. (%), N = 14,217 |
|---|---|---|---|---|
| ||||
| Age, mean [SD] | 75.3 [12.4] | 74.5 [13.3] | 69.4 [11.8] | 73.4 [12.7] |
| Sex, female | 3,175 (49.7) | 1,741 (47.5) | 2,639 (63.5) | 7,555 (53.1) |
| Race | ||||
| White | 5,388 (84.3) | 3,268 (89.1) | 3,760 (90.5) | 12,416 (87.3) |
| Other | 1,006 (15.7) | 400 (10.9) | 395 (9.5) | 1,801 (12.7) |
| Comorbidities | ||||
| Cancer | 1,186 (18.6) | 939 (25.6) | 708 (17.0) | 2,833 (19.9) |
| Diabetes | 3,043 (47.6) | 1,536 (41.9) | 1,080 (26.0) | 5,659 (39.8) |
| Obesity | 1,938 (30.3) | 896 (24.4) | 1,260 (30.3) | 4,094 (28.8) |
| Cerebrovascular disease | 1,664 (26.0) | 910 (24.8) | 498 (12.0) | 3,072 (21.6) |
| Heart failure/pulmonary edema | 5,882 (92.0) | 2,052 (55.9) | 607 (14.6) | 8,541 (60.1) |
| Chronic obstructive pulmonary disease | 2,636 (41.2) | 1,929 (52.6) | 672 (16.2) | 5,237 (36.8) |
| Smoking | 895 (14.0) | 662 (18.1) | 623 (15.0) | 2,180 (15.3) |
| Corticosteroids | 490 (7.7) | 568 (15.5) | 147 (3.5) | 1,205 (8.5) |
| Coronary artery disease | 4,628 (72.4) | 1,875 (51.1) | 1,228 (29.6) | 7,731 (54.4) |
| Renal disease | 3,000 (46.9) | 1,320 (36.0) | 565 (13.6) | 4,885 (34.4) |
| Warfarin prior to arrival | 5,074 (79.4) | 3,020 (82.3) | 898 (21.6) | 8,992 (63.3) |
| Heparin given during hospitalization | 850 (13.3) | 282 (7.7) | 314 (7.6) | 1,446 (10.7) |
| LMWH given during hospitalization | 1,591 (24.9) | 1,070 (29.2) | 1,431 (34.4) | 4,092 (28.8) |
Warfarin was started on hospital day 1 for 6825 (48.0%) of 14,217 patients. Among these patients, 6539 (95.8%) had an INR measured within 1 calendar day. We were unable to determine how many patients who started warfarin later in their hospital stay had a baseline INR, as we did not capture INRs performed prior to the day that warfarin was initiated.
Supporting Table 1 in the online version of this article demonstrates the association between an INR 6.0 and the occurrence of warfarin‐associated adverse events. A maximum INR 6.0 occurred in 469 (3.3%) of the patients included in the study, and among those patients, 133 (28.4%) experienced a warfarin‐associated adverse event compared to 922 (6.7%) adverse events in the 13,748 patients who did not develop an INR 6.0 (P < 0.001).
Among 8529 patients who received warfarin for at least 3 days, beginning on the third day of warfarin, 1549 patients (18.2%) did not have INR measured at least once each day that they received warfarin. Table 2 demonstrates that patients who had 2 or more days on which the INR was not measured had higher rates of INR 6.0 than patients for whom the INR was measured daily. A similar association was seen for warfarin‐associated adverse events (Table 2).
| No. of Patients, No. (%), N = 8,529 | Patients With INR on All Days, No. (%), N = 6,980 | Patients With 1 Day Without an INR, No. (%), N = 968 | Patients With 2 or More Days Without an INR, No. (%), N = 581 | P Value | |
|---|---|---|---|---|---|
| |||||
| Maximum INR | <0.01* | ||||
| 1.515.99 | 8,183 | 6,748 (96.7) | 911 (94.1) | 524 (90.2) | |
| 6.0 | 346 | 232 (3.3) | 57 (5.9) | 57 (9.8) | |
| Warfarin‐associated adverse events | <0.01* | ||||
| No adverse events | 7,689 (90.2) | 6,331 (90.7) | 872 (90.1) | 486 (83.6) | |
| Minor adverse events | 792 (9.3) | 617 (8.8) | 86 (8.9) | 89 (15.3) | |
| Major adverse events | 48 (0.6) | 32 (0.5) | 10 (1.0) | 6 (1.0) | |
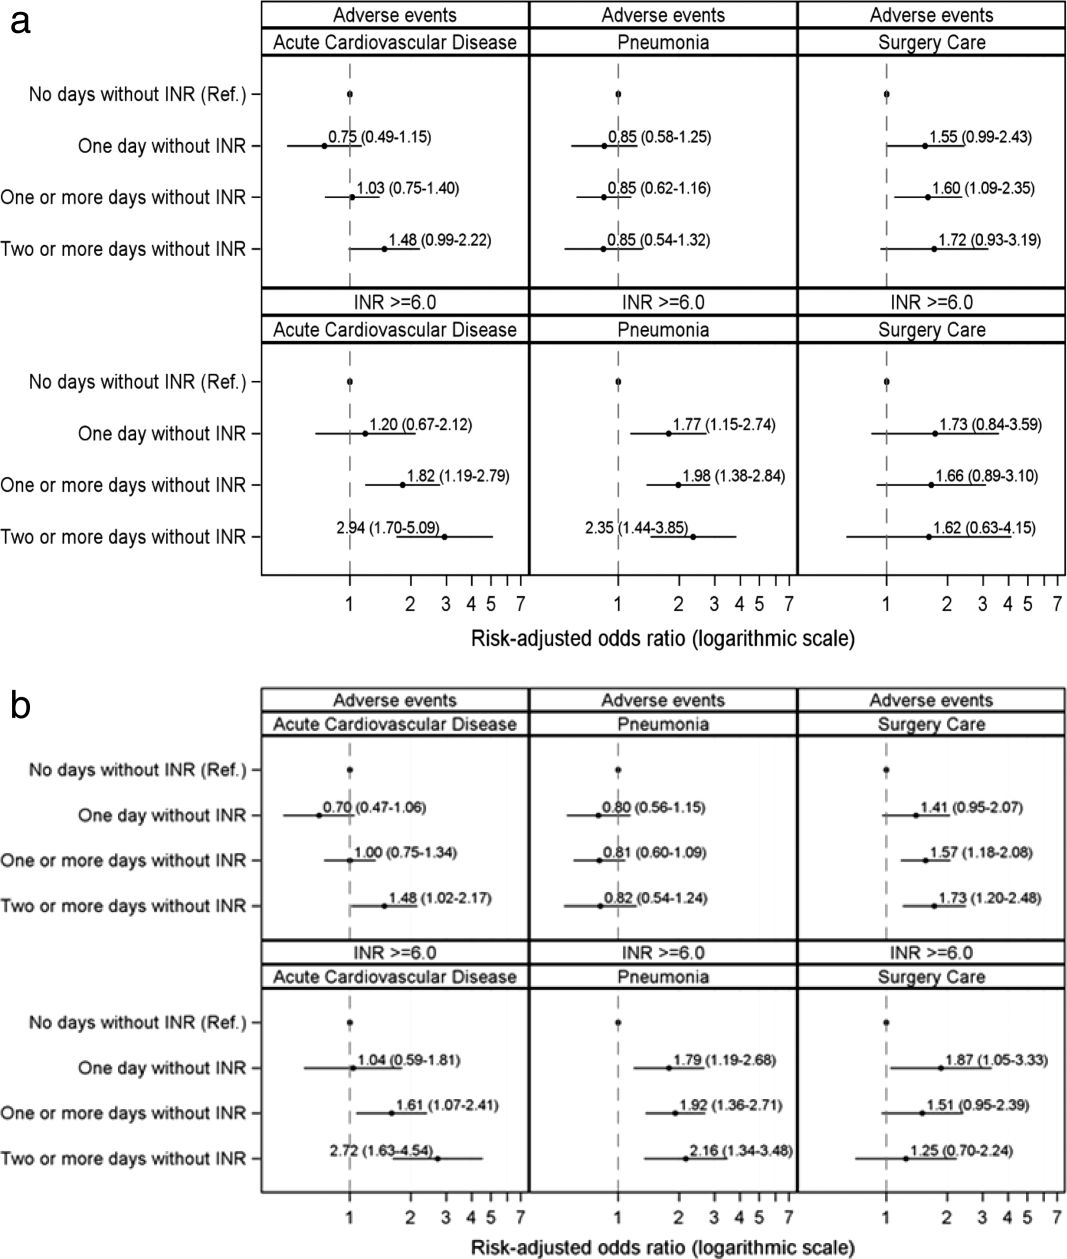
Figure 1A demonstrates the association between the number of days without an INR measurement and the subsequent development of an INR 6.0 or a warfarin‐associated adverse event, adjusted for baseline patient characteristics, receipt of heparin and LMWH, and number of days on warfarin. Patients with 1 or more days without an INR measurement had higher risk‐adjusted ORs of a subsequent INR 6.0, although the difference was not statistically significant for surgical patients. The analysis results based on inverse propensity scoring are seen in Figure 1B. Cardiac and surgical patients with 2 or more days without an INR measurement were at higher risk of having a warfarin‐associated adverse event, whereas cardiac and pneumonia patients with 1 or more days without an INR measurement were at higher risk of developing an INR 6.0.
Supporting Table 2 in the online version of this article demonstrates the relationship between patient characteristics and the occurrence of an INR 6.0 or a warfarin‐related adverse event. The only characteristic that was associated with either of these outcomes for all 3 patient conditions was renal disease, which was positively associated with a warfarin‐associated adverse event. Warfarin use prior to arrival was associated with lower risks of both an INR 6.0 and a warfarin‐associated adverse event, except for among surgical patients. Supporting Table 3 in the online version of this article demonstrates the differences in patient characteristics between patients who had daily INR measurement and those who had at least 1 day without an INR measurement.
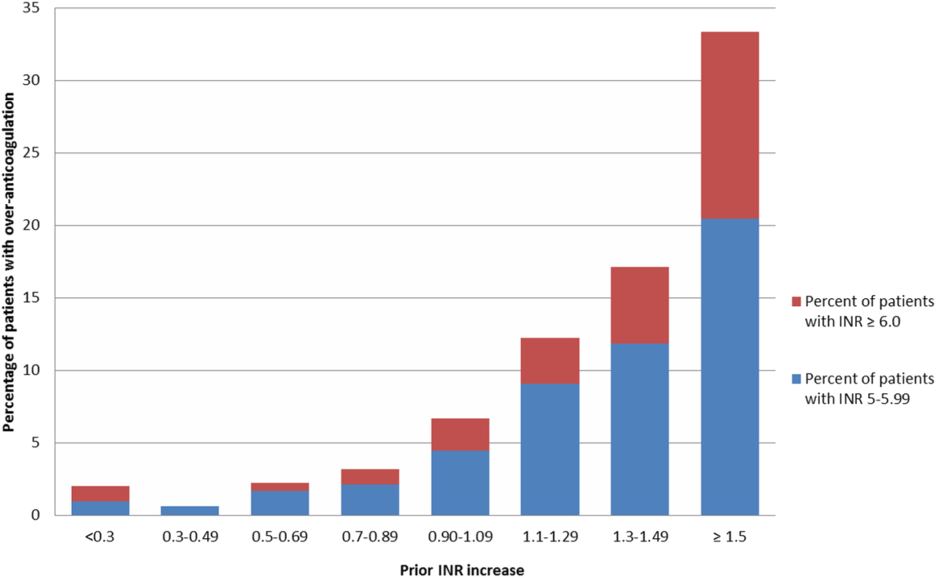
Figure 2 illustrates the relationship of the maximum INR to the prior 1‐day change in INR in 4963 patients whose INR on the day prior to the maximum INR was 2.0 to 3.5. When the increase in INR was <0.9, the risk of the next day's INR being 6.0 was 0.7%, and if the increase was 0.9, the risk was 5.2%. The risk of developing an INR 5.0 was 1.9% if the preceding day's INR increase was <0.9 and 15.3% if the prior day's INR rise was 0.9. Overall, 51% of INRs 6.0 and 55% of INRs 5.0 were immediately preceded by an INR increase of 0.9. The positive likelihood ratio (LR) for a 0.9 rise in INR predicting an INR of 6.0 was 4.2, and the positive LR was 4.9 for predicting an INR 5.0.
There was no decline in the frequency of warfarin use among the patients in the MPSMS sample during the study period (16.7% in 2009 and 17.3% in 2013).
DISCUSSION
We studied warfarin‐associated adverse events in a nationally representative study of patients who received warfarin while in an acute care hospital for a primary diagnosis of cardiac disease, pneumonia, or major surgery. Several findings resulted from our analysis. First, warfarin is still commonly prescribed to hospitalized patients and remains a frequent cause of adverse events; 7.4% of the 2009 to 2013 MPSMS population who received warfarin and had at least 1 INR >1.5 developed a warfarin‐associated adverse event.
Over 95% of patients who received warfarin on the day of hospital admission had an INR performed within 1 day. This is similar to the results from a 2006 single center study in which 95% of patients had an INR measured prior to their first dose of warfarin.[10] Since 2008, The Joint Commission's National Patient Safety Goal has required the assessment of coagulation status before starting warfarin.[17] The high level of adherence to this standard suggests that further attention to this process of care is unlikely to significantly improve patient safety.
We also found that the lack of daily INR measurements was associated with an increased risk of an INR 6.0 and warfarin‐associated adverse events in some patient populations. There is limited evidence addressing the appropriate frequency of INR measurement in hospitalized patients receiving warfarin. The Joint Commission National Patient Safety Goal requires use of a current INR to adjust this therapy, but provides no specifics.[17] Although some experts believe that INRs should be monitored daily in hospitalized patients, this does not appear to be uniformly accepted. In some reports, 2[13] or 3[14] consecutive days without the performance of an INR was required to activate a reminder. Protocols from some major teaching hospitals specify intermittent monitoring once the INR is therapeutic.[15, 16] Because our results suggest that lapses in INR measurement lead to overanticoagulation and warfarin‐related adverse events, it may be appropriate to measure INRs daily in most hospitalized patients receiving warfarin. This would be consistent with the many known causes of INR instability in patients admitted to the hospital, including drug‐drug interactions, hepatic dysfunction, and changes in volume of distribution, such that truly stable hospitalized patients are likely rare. Indeed, hospital admission is a well‐known predictor of instability of warfarin effect. [9] Although our results suggest that daily INR measurement is associated with a lower rate of overanticoagulation, future studies might better define lower risk patients for whom daily INR measurement would not be necessary.
A prior INR increase 0.9 in 1 day was associated with an increased risk of subsequent overanticoagulation. Although a rapidly rising INR is known to predict overanticoagulation[10, 14] we could find no evidence as to what specific rate of rise confers this risk. Our results suggest that use of a warfarin dosing protocol that considers both the absolute value of the INR and the rate of rise could reduce warfarin‐related adverse events.
There are important limitations of our study. We did not abstract warfarin dosages, which precluded study of the appropriateness of both initial warfarin dosing and adjustment of the warfarin dose based on INR results. MPSMS does not reliably capture antiplatelet agents or other agents that result in drug‐drug interactions with warfarin, such as antibiotics, so this factor could theoretically have confounded our results. Antibiotic use seems unlikely to be a major confounder, because patients with acute cardiovascular disease demonstrated a similar relationship between INR measurement and an INR 6.0 to that seen with pneumonia and surgical patients, despite the latter patients likely having greater antibiotics exposure. Furthermore, MPSMS does not capture indices of severity of illness, so other unmeasured confounders could have influenced our results. Although we have data for patients admitted to the hospital for only 4 conditions, these are conditions that represent approximately 22% of hospital admissions in the United States.[2] Strengths of our study include the nationally representative and randomly selected cases and use of data that were obtained from chart abstraction as opposed to administrative data. Through the use of centralized data abstraction, we avoided the potential bias introduced when hospitals self‐report adverse events.
In summary, in a national sample of patients admitted to the hospital for 4 common conditions, warfarin‐associated adverse events were detected in 7.4% of patients who received warfarin. Lack of daily INR measurement was associated with an increased risk of overanticoagulation and warfarin‐associated adverse events in certain patient populations. A 1‐day increase in the INR of 0.9 predicted subsequent overanticoagulation. These results provide actionable opportunities to improve safety in some hospitalized patients receiving warfarin.
Acknowledgements
The authors express their appreciation to Dan Budnitz, MD, MPH, for his advice regarding study design and his review and comments on a draft of this manuscript.
Disclosures: This work was supported by contract HHSA290201200003C from the Agency for Healthcare Research and Quality, United States Department of Health and Human Services, Rockville, Maryland. Qualidigm was the contractor. The authors assume full responsibility for the accuracy and completeness of the ideas. Dr. Metersky has worked on various quality improvement and patient safety projects with Qualidigm, Centers for Medicare & Medicaid Services, and the Agency for Healthcare Research and Quality. His employer has received remuneration for this work. Dr. Krumholz works under contract with the Centers for Medicare & Medicaid Services to develop and maintain performance measures. Dr. Krumholz is the chair of a cardiac scientific advisory board for UnitedHealth and the recipient of a research grant from Medtronic, Inc. through Yale University. The other authors report no conflicts of interest.
- , , , , , . Delivery of optimized inpatient anticoagulation therapy: consensus statement from the anticoagulation forum. Ann Pharmacother. 2013;47:714–724.
- , , , et al. National trends in patient safety for four common conditions, 2005–2011. N Engl J Med. 2014;370:341–351.
- , . Update on antithrombotic therapy: new anticoagulants. Circulation. 2010;121:1523–1532
- , , , . The pharmacogenetics of coumarin therapy. Pharmacogenomics. 2005;6:503–513.
- , , . Adverse drug events among hospitalized Medicare patients: epidemiology and national estimates from a new approach to surveillance. Jt Comm J Qual Patient Saf. 2010;36:12–21.
- , , , et al. Active surveillance using electronic triggers to detect adverse events in hospitalized patients. Qual Saf Health Care. 2006;15:184–190.
- , , , et al. Inpatient warfarin management: pharmacist management using a detailed dosing protocol. J Thromb Thrombolysis. 2012;33:178–184.
- , , , , . Efficacy and safety of a pharmacist‐managed inpatient anticoagulation service for warfarin initiation and titration. J Clin Pharm Ther. 2011;36:585–591.
- , , , et al. Bleeding complications of oral anticoagulant treatment: an inception‐cohort, prospective collaborative study (ISCOAT). Italian Study on Complications of Oral Anticoagulant Therapy. Lancet. 1996;348:423–428.
- , , , , , . Oral anticoagulation in the hospital: analysis of patients at risk. J Thromb Thrombolysis. 2011;31:22–26.
- , , , et al. Evidence‐based management of anticoagulant therapy: Antithrombotic Therapy and Prevention of Thrombosis, 9th ed: American College of Chest Physicians Evidence‐Based Clinical Practice Guidelines. Chest. 2012;141:e152S–e184S.
- Agency for Healthcare Research and Quality. National Guideline Clearinghouse. Available at: http://www.guideline.gov. Accessed April 30, 2015.
- , . Reduction in anticoagulation‐related adverse drug events using a trigger‐based methodology. Jt Comm J Qual Patient Saf. 2005;31:313–318.
- , , . Use of specific indicators to detect warfarin‐related adverse events. Am J Health Syst Pharm. 2005;62:1683–1688.
- University of Wisconsin Health. Warfarin management– adult–inpatient clinical practice guideline. Available at: http://www.uwhealth.org/files/uwhealth/docs/pdf3/Inpatient_Warfarin_Guideline.pdf. Accessed April 30, 2015
- Anticoagulation Guidelines ‐ LSU Health Shreveport. Available at: http://myhsc.lsuhscshreveport.edu/pharmacy/PT%20Policies/Anticoagulation_Safety.pdf. Accessed November 29, 2015.
- The Joint Commission. National patient safety goals effective January 1, 2015. Available at: http://www.jointcommission.org/assets/1/6/2015_NPSG_HAP.pdf. Accessed November 29, 2015.
- U.S. Department of Health and Human Services. Office of Disease Prevention and Health Promotion. Available at: http://health.gov/hcq/pdfs/ade-action-plan-508c.pdf. Accessed November 29, 2015.
- The Joint Commission. Surgical care improvement project. Available at: http://www.jointcommission.org/surgical_care_improvement_project. Accessed May 5, 2015.
- , , , et al. Optimization of inpatient warfarin therapy: Impact of daily consultation by a pharmacist‐managed anticoagulation service. Ann Pharmacother. 2000;34:567–572.
- , , . Effects of requiring a baseline International Normalized Ratio for inpatients treated with warfarin. Am J Health Syst Pharm. 2010;67:17–22.
- , . Weighting regressions by propensity scores. Eval Rev. 2008;32:392–409.
- . An introduction to propensity score methods for reducing the effects of confounding in observational studies. Multivar Behav Res. 2011;46:399–424.
- . Propensity score methods for bias reduction in the comparison of a treatment to a non‐randomized control group. Stat Med. 1998;17:2265–2281.
- , . The central role of the propensity score in observational studies for causal effects. Biometrika. 1983;70:41–55.
Warfarin is 1 of the most common causes of adverse drug events, with hospitalized patients being particularly at risk compared to outpatients.[1] Despite the availability of new oral anticoagulants (NOACs), physicians commonly prescribe warfarin to hospitalized patients,[2] likely in part due to the greater difficulty in reversing NOACs compared to warfarin. Furthermore, uptake of the NOACs is likely to be slow in resource‐poor countries due to the lower cost of warfarin.[3] However, the narrow therapeutic index, frequent drug‐drug interactions, and patient variability in metabolism of warfarin makes management challenging.[4] Thus, warfarin remains a significant cause of adverse events in hospitalized patients, occurring in approximately 3% to 8% of exposed patients, depending on underlying condition.[2, 5]
An elevated international normalized ratio (INR) is a strong predictor of drug‐associated adverse events (patient harm). In a study employing 21 different electronic triggers to identify potential adverse events, an elevated INR had the highest yield for events associated with harm (96% of INRs >5.0 associated with harm).[6] Although pharmacist‐managed inpatient anticoagulation services have been shown to improve warfarin management,[7, 8] there are evidence gaps regarding the causes of warfarin‐related adverse events and practice changes that could decrease their frequency. Although overanticoagulation is a well‐known risk factor for warfarin‐related adverse events,[9, 10] there are few evidence‐based warfarin monitoring and dosing recommendations for hospitalized patients.[10] For example, the 2012 American College of Chest Physicians Antithrombotic Guidelines[11] provide a weak recommendation on initial dosing of warfarin, but no recommendations on how frequently to monitor the INR, or appropriate dosing responses to INR levels. Although many hospitals employ protocols that suggest daily INR monitoring until stable, there are no evidence‐based guidelines to support this practice.[12] Conversely, there are reports of flags to order an INR level that are not activated unless greater than 2[13] or 3 days[14] pass since the prior INR. Protocols from some major academic medical centers suggest that after a therapeutic INR is reached, INR levels can be measured intermittently, as infrequently as twice a week.[15, 16]
The 2015 Joint Commission anticoagulant‐focused National Patient Safety Goal[17] (initially issued in 2008) mandates the assessment of baseline coagulation status before starting warfarin, and warfarin dosing based on a current INR; however, current is not defined. Neither the extent to which the mandate for assessing baseline coagulation status is adhered to nor the relationship between this process of care and patient outcomes is known. The importance of adverse drug events associated with anticoagulants, included warfarin, was also recently highlighted in the 2014 federal National Action Plan for Adverse Drug Event Prevention. In this document, the prevention of adverse drug events associated with anticoagulants was 1 of the 3 areas selected for special national attention and action.[18]
The Medicare Patient Safety Monitoring System (MPSMS) is a national chart abstraction‐based system that includes 21 in‐hospital adverse event measures, including warfarin‐associated adverse drug events.[2] Because of the importance of warfarin‐associated bleeding in hospitalized patients, we analyzed MPSMS data to determine what factors related to INR monitoring practices place patients at risk for these events. We were particularly interested in determining if we could detect potentially modifiable predictors of overanticoagulation and warfarin‐associated adverse events.
METHODS
Study Sample
We combined 2009 to 2013 MPSMS all payer data from the Centers for Medicare & Medicaid Services Hospital Inpatient Quality Reporting program for 4 common medical conditions: (1) acute myocardial infarction, (2) heart failure, (3) pneumonia, and (4) major surgery (as defined by the national Surgical Care Improvement Project).[19] To increase the sample size for cardiac patients, we combined myocardial infarction patients and heart failure patients into 1 group: acute cardiovascular disease. Patients under 18 years of age are excluded from the MPSMS sample, and we excluded patients whose INR never exceeded 1.5 after the initiation of warfarin therapy.
Patient Characteristics
Patient characteristics included demographics (age, sex, race [white, black, and other race]) and comorbidities. Comorbidities abstracted from medical records included: histories at the time of hospital admission of heart failure, obesity, coronary artery disease, renal disease, cerebrovascular disease, chronic obstructive pulmonary disease, cancer, diabetes, and smoking. The use of anticoagulants other than warfarin was also captured.
INRs
The INR measurement period for each patient started from the initial date of warfarin administration and ended on the date the maximum INR occurred. If a patient had more than 1 INR value on any day, the higher INR value was selected. A day without an INR measurement was defined as no INR value documented for a calendar day within the INR measurement period, starting on the third day of warfarin and ending on the day of the maximum INR level.
Outcomes
The study was performed to assess the association between the number of days on which a patient did not have an INR measured while receiving warfarin and the occurrence of (1) an INR 6.0[20, 21] (intermediate outcome) and (2) a warfarin‐associated adverse event. A description of the MPSMS measure of warfarin‐associated adverse events has been previously published.[2] Warfarin‐associated adverse events must have occurred within 48 hours of predefined triggers: an INR 4.0, cessation of warfarin therapy, administration of vitamin K or fresh frozen plasma, or transfusion of packed red blood cells other than in the setting of a surgical procedure. Warfarin‐associated adverse events were divided into minor and major events for this analysis. Minor events were defined as bleeding, drop in hematocrit of 3 points (occurring more than 48 hours after admission and not associated with surgery), or development of a hematoma. Major events were death, intracranial bleeding, or cardiac arrest. A patient who had both a major and a minor event was considered as having had a major event.
To assess the relationship between a rapidly rising INR and a subsequent INR 5.0 or 6.0, we determined the increase in INR between the measurement done 2 days prior to the maximum INR and 1 day prior to the maximum INR. This analysis was performed only on patients whose INR was 2.0 and 3.5 on the day prior to the maximum INR. In doing so, we sought to determine if the INR rise could predict the occurrence of a subsequent severely elevated INR in patients whose INR was within or near the therapeutic range.
Statistical Analysis
We conducted bivariate analysis to quantify the associations between lapses in measurement of the INR and subsequent warfarin‐associated adverse events, using the Mantel‐Haenszel 2 test for categorical variables. We fitted a generalized linear model with a logit link function to estimate the association of days on which an INR was not measured and the occurrence of the composite adverse event measure or the occurrence of an INR 6.0, adjusting for baseline patient characteristics, the number of days on warfarin, and receipt of heparin and low‐molecular‐weight heparin (LMWH). To account for potential imbalances in baseline patient characteristics and warfarin use prior to admission, we conducted a second analysis using the stabilized inverse probability weights approach. Specifically, we weighted each patient by the patient's inverse propensity scores of having only 1 day, at least 1 day, and at least 2 days without an INR measurement while receiving warfarin.[22, 23, 24, 25] To obtain the propensity scores, we fitted 3 logistic models with all variables included in the above primary mixed models except receipt of LMWH, heparin, and the number of days on warfarin as predictors, but 3 different outcomes, 1 day without an INR measurement, 1 or more days without an INR measurement, and 2 or more days without an INR measurement. Analyses were conducted using SAS version 9.2 (SAS Institute Inc., Cary, NC). All statistical testing was 2‐sided, at a significance level of 0.05. The institutional review board at Solutions IRB (Little Rock, AR) determined that the requirement for informed consent could be waived based on the nature of the study.
RESULTS
There were 130,828 patients included in the 2009 to 2013 MPSMS sample, of whom 19,445 (14.9%) received warfarin during their hospital stay and had at least 1 INR measurement. Among these patients, 5228 (26.9%) had no INR level above 1.5 and were excluded from further analysis, leaving 14,217 included patients. Of these patients, 1055 (7.4%) developed a warfarin‐associated adverse event. Table 1 demonstrates the baseline demographics and comorbidities of the included patients.
| Characteristics | Acute Cardiovascular Disease, No. (%), N = 6,394 | Pneumonia, No. (%), N = 3,668 | Major Surgery, No. (%), N = 4,155 | All, No. (%), N = 14,217 |
|---|---|---|---|---|
| ||||
| Age, mean [SD] | 75.3 [12.4] | 74.5 [13.3] | 69.4 [11.8] | 73.4 [12.7] |
| Sex, female | 3,175 (49.7) | 1,741 (47.5) | 2,639 (63.5) | 7,555 (53.1) |
| Race | ||||
| White | 5,388 (84.3) | 3,268 (89.1) | 3,760 (90.5) | 12,416 (87.3) |
| Other | 1,006 (15.7) | 400 (10.9) | 395 (9.5) | 1,801 (12.7) |
| Comorbidities | ||||
| Cancer | 1,186 (18.6) | 939 (25.6) | 708 (17.0) | 2,833 (19.9) |
| Diabetes | 3,043 (47.6) | 1,536 (41.9) | 1,080 (26.0) | 5,659 (39.8) |
| Obesity | 1,938 (30.3) | 896 (24.4) | 1,260 (30.3) | 4,094 (28.8) |
| Cerebrovascular disease | 1,664 (26.0) | 910 (24.8) | 498 (12.0) | 3,072 (21.6) |
| Heart failure/pulmonary edema | 5,882 (92.0) | 2,052 (55.9) | 607 (14.6) | 8,541 (60.1) |
| Chronic obstructive pulmonary disease | 2,636 (41.2) | 1,929 (52.6) | 672 (16.2) | 5,237 (36.8) |
| Smoking | 895 (14.0) | 662 (18.1) | 623 (15.0) | 2,180 (15.3) |
| Corticosteroids | 490 (7.7) | 568 (15.5) | 147 (3.5) | 1,205 (8.5) |
| Coronary artery disease | 4,628 (72.4) | 1,875 (51.1) | 1,228 (29.6) | 7,731 (54.4) |
| Renal disease | 3,000 (46.9) | 1,320 (36.0) | 565 (13.6) | 4,885 (34.4) |
| Warfarin prior to arrival | 5,074 (79.4) | 3,020 (82.3) | 898 (21.6) | 8,992 (63.3) |
| Heparin given during hospitalization | 850 (13.3) | 282 (7.7) | 314 (7.6) | 1,446 (10.7) |
| LMWH given during hospitalization | 1,591 (24.9) | 1,070 (29.2) | 1,431 (34.4) | 4,092 (28.8) |
Warfarin was started on hospital day 1 for 6825 (48.0%) of 14,217 patients. Among these patients, 6539 (95.8%) had an INR measured within 1 calendar day. We were unable to determine how many patients who started warfarin later in their hospital stay had a baseline INR, as we did not capture INRs performed prior to the day that warfarin was initiated.
Supporting Table 1 in the online version of this article demonstrates the association between an INR 6.0 and the occurrence of warfarin‐associated adverse events. A maximum INR 6.0 occurred in 469 (3.3%) of the patients included in the study, and among those patients, 133 (28.4%) experienced a warfarin‐associated adverse event compared to 922 (6.7%) adverse events in the 13,748 patients who did not develop an INR 6.0 (P < 0.001).
Among 8529 patients who received warfarin for at least 3 days, beginning on the third day of warfarin, 1549 patients (18.2%) did not have INR measured at least once each day that they received warfarin. Table 2 demonstrates that patients who had 2 or more days on which the INR was not measured had higher rates of INR 6.0 than patients for whom the INR was measured daily. A similar association was seen for warfarin‐associated adverse events (Table 2).
| No. of Patients, No. (%), N = 8,529 | Patients With INR on All Days, No. (%), N = 6,980 | Patients With 1 Day Without an INR, No. (%), N = 968 | Patients With 2 or More Days Without an INR, No. (%), N = 581 | P Value | |
|---|---|---|---|---|---|
| |||||
| Maximum INR | <0.01* | ||||
| 1.515.99 | 8,183 | 6,748 (96.7) | 911 (94.1) | 524 (90.2) | |
| 6.0 | 346 | 232 (3.3) | 57 (5.9) | 57 (9.8) | |
| Warfarin‐associated adverse events | <0.01* | ||||
| No adverse events | 7,689 (90.2) | 6,331 (90.7) | 872 (90.1) | 486 (83.6) | |
| Minor adverse events | 792 (9.3) | 617 (8.8) | 86 (8.9) | 89 (15.3) | |
| Major adverse events | 48 (0.6) | 32 (0.5) | 10 (1.0) | 6 (1.0) | |
Figure 1A demonstrates the association between the number of days without an INR measurement and the subsequent development of an INR 6.0 or a warfarin‐associated adverse event, adjusted for baseline patient characteristics, receipt of heparin and LMWH, and number of days on warfarin. Patients with 1 or more days without an INR measurement had higher risk‐adjusted ORs of a subsequent INR 6.0, although the difference was not statistically significant for surgical patients. The analysis results based on inverse propensity scoring are seen in Figure 1B. Cardiac and surgical patients with 2 or more days without an INR measurement were at higher risk of having a warfarin‐associated adverse event, whereas cardiac and pneumonia patients with 1 or more days without an INR measurement were at higher risk of developing an INR 6.0.
Supporting Table 2 in the online version of this article demonstrates the relationship between patient characteristics and the occurrence of an INR 6.0 or a warfarin‐related adverse event. The only characteristic that was associated with either of these outcomes for all 3 patient conditions was renal disease, which was positively associated with a warfarin‐associated adverse event. Warfarin use prior to arrival was associated with lower risks of both an INR 6.0 and a warfarin‐associated adverse event, except for among surgical patients. Supporting Table 3 in the online version of this article demonstrates the differences in patient characteristics between patients who had daily INR measurement and those who had at least 1 day without an INR measurement.
Figure 2 illustrates the relationship of the maximum INR to the prior 1‐day change in INR in 4963 patients whose INR on the day prior to the maximum INR was 2.0 to 3.5. When the increase in INR was <0.9, the risk of the next day's INR being 6.0 was 0.7%, and if the increase was 0.9, the risk was 5.2%. The risk of developing an INR 5.0 was 1.9% if the preceding day's INR increase was <0.9 and 15.3% if the prior day's INR rise was 0.9. Overall, 51% of INRs 6.0 and 55% of INRs 5.0 were immediately preceded by an INR increase of 0.9. The positive likelihood ratio (LR) for a 0.9 rise in INR predicting an INR of 6.0 was 4.2, and the positive LR was 4.9 for predicting an INR 5.0.
There was no decline in the frequency of warfarin use among the patients in the MPSMS sample during the study period (16.7% in 2009 and 17.3% in 2013).
DISCUSSION
We studied warfarin‐associated adverse events in a nationally representative study of patients who received warfarin while in an acute care hospital for a primary diagnosis of cardiac disease, pneumonia, or major surgery. Several findings resulted from our analysis. First, warfarin is still commonly prescribed to hospitalized patients and remains a frequent cause of adverse events; 7.4% of the 2009 to 2013 MPSMS population who received warfarin and had at least 1 INR >1.5 developed a warfarin‐associated adverse event.
Over 95% of patients who received warfarin on the day of hospital admission had an INR performed within 1 day. This is similar to the results from a 2006 single center study in which 95% of patients had an INR measured prior to their first dose of warfarin.[10] Since 2008, The Joint Commission's National Patient Safety Goal has required the assessment of coagulation status before starting warfarin.[17] The high level of adherence to this standard suggests that further attention to this process of care is unlikely to significantly improve patient safety.
We also found that the lack of daily INR measurements was associated with an increased risk of an INR 6.0 and warfarin‐associated adverse events in some patient populations. There is limited evidence addressing the appropriate frequency of INR measurement in hospitalized patients receiving warfarin. The Joint Commission National Patient Safety Goal requires use of a current INR to adjust this therapy, but provides no specifics.[17] Although some experts believe that INRs should be monitored daily in hospitalized patients, this does not appear to be uniformly accepted. In some reports, 2[13] or 3[14] consecutive days without the performance of an INR was required to activate a reminder. Protocols from some major teaching hospitals specify intermittent monitoring once the INR is therapeutic.[15, 16] Because our results suggest that lapses in INR measurement lead to overanticoagulation and warfarin‐related adverse events, it may be appropriate to measure INRs daily in most hospitalized patients receiving warfarin. This would be consistent with the many known causes of INR instability in patients admitted to the hospital, including drug‐drug interactions, hepatic dysfunction, and changes in volume of distribution, such that truly stable hospitalized patients are likely rare. Indeed, hospital admission is a well‐known predictor of instability of warfarin effect. [9] Although our results suggest that daily INR measurement is associated with a lower rate of overanticoagulation, future studies might better define lower risk patients for whom daily INR measurement would not be necessary.
A prior INR increase 0.9 in 1 day was associated with an increased risk of subsequent overanticoagulation. Although a rapidly rising INR is known to predict overanticoagulation[10, 14] we could find no evidence as to what specific rate of rise confers this risk. Our results suggest that use of a warfarin dosing protocol that considers both the absolute value of the INR and the rate of rise could reduce warfarin‐related adverse events.
There are important limitations of our study. We did not abstract warfarin dosages, which precluded study of the appropriateness of both initial warfarin dosing and adjustment of the warfarin dose based on INR results. MPSMS does not reliably capture antiplatelet agents or other agents that result in drug‐drug interactions with warfarin, such as antibiotics, so this factor could theoretically have confounded our results. Antibiotic use seems unlikely to be a major confounder, because patients with acute cardiovascular disease demonstrated a similar relationship between INR measurement and an INR 6.0 to that seen with pneumonia and surgical patients, despite the latter patients likely having greater antibiotics exposure. Furthermore, MPSMS does not capture indices of severity of illness, so other unmeasured confounders could have influenced our results. Although we have data for patients admitted to the hospital for only 4 conditions, these are conditions that represent approximately 22% of hospital admissions in the United States.[2] Strengths of our study include the nationally representative and randomly selected cases and use of data that were obtained from chart abstraction as opposed to administrative data. Through the use of centralized data abstraction, we avoided the potential bias introduced when hospitals self‐report adverse events.
In summary, in a national sample of patients admitted to the hospital for 4 common conditions, warfarin‐associated adverse events were detected in 7.4% of patients who received warfarin. Lack of daily INR measurement was associated with an increased risk of overanticoagulation and warfarin‐associated adverse events in certain patient populations. A 1‐day increase in the INR of 0.9 predicted subsequent overanticoagulation. These results provide actionable opportunities to improve safety in some hospitalized patients receiving warfarin.
Acknowledgements
The authors express their appreciation to Dan Budnitz, MD, MPH, for his advice regarding study design and his review and comments on a draft of this manuscript.
Disclosures: This work was supported by contract HHSA290201200003C from the Agency for Healthcare Research and Quality, United States Department of Health and Human Services, Rockville, Maryland. Qualidigm was the contractor. The authors assume full responsibility for the accuracy and completeness of the ideas. Dr. Metersky has worked on various quality improvement and patient safety projects with Qualidigm, Centers for Medicare & Medicaid Services, and the Agency for Healthcare Research and Quality. His employer has received remuneration for this work. Dr. Krumholz works under contract with the Centers for Medicare & Medicaid Services to develop and maintain performance measures. Dr. Krumholz is the chair of a cardiac scientific advisory board for UnitedHealth and the recipient of a research grant from Medtronic, Inc. through Yale University. The other authors report no conflicts of interest.
- , , , , , . Delivery of optimized inpatient anticoagulation therapy: consensus statement from the anticoagulation forum. Ann Pharmacother. 2013;47:714–724.
- , , , et al. National trends in patient safety for four common conditions, 2005–2011. N Engl J Med. 2014;370:341–351.
- , . Update on antithrombotic therapy: new anticoagulants. Circulation. 2010;121:1523–1532
- , , , . The pharmacogenetics of coumarin therapy. Pharmacogenomics. 2005;6:503–513.
- , , . Adverse drug events among hospitalized Medicare patients: epidemiology and national estimates from a new approach to surveillance. Jt Comm J Qual Patient Saf. 2010;36:12–21.
- , , , et al. Active surveillance using electronic triggers to detect adverse events in hospitalized patients. Qual Saf Health Care. 2006;15:184–190.
- , , , et al. Inpatient warfarin management: pharmacist management using a detailed dosing protocol. J Thromb Thrombolysis. 2012;33:178–184.
- , , , , . Efficacy and safety of a pharmacist‐managed inpatient anticoagulation service for warfarin initiation and titration. J Clin Pharm Ther. 2011;36:585–591.
- , , , et al. Bleeding complications of oral anticoagulant treatment: an inception‐cohort, prospective collaborative study (ISCOAT). Italian Study on Complications of Oral Anticoagulant Therapy. Lancet. 1996;348:423–428.
- , , , , , . Oral anticoagulation in the hospital: analysis of patients at risk. J Thromb Thrombolysis. 2011;31:22–26.
- , , , et al. Evidence‐based management of anticoagulant therapy: Antithrombotic Therapy and Prevention of Thrombosis, 9th ed: American College of Chest Physicians Evidence‐Based Clinical Practice Guidelines. Chest. 2012;141:e152S–e184S.
- Agency for Healthcare Research and Quality. National Guideline Clearinghouse. Available at: http://www.guideline.gov. Accessed April 30, 2015.
- , . Reduction in anticoagulation‐related adverse drug events using a trigger‐based methodology. Jt Comm J Qual Patient Saf. 2005;31:313–318.
- , , . Use of specific indicators to detect warfarin‐related adverse events. Am J Health Syst Pharm. 2005;62:1683–1688.
- University of Wisconsin Health. Warfarin management– adult–inpatient clinical practice guideline. Available at: http://www.uwhealth.org/files/uwhealth/docs/pdf3/Inpatient_Warfarin_Guideline.pdf. Accessed April 30, 2015
- Anticoagulation Guidelines ‐ LSU Health Shreveport. Available at: http://myhsc.lsuhscshreveport.edu/pharmacy/PT%20Policies/Anticoagulation_Safety.pdf. Accessed November 29, 2015.
- The Joint Commission. National patient safety goals effective January 1, 2015. Available at: http://www.jointcommission.org/assets/1/6/2015_NPSG_HAP.pdf. Accessed November 29, 2015.
- U.S. Department of Health and Human Services. Office of Disease Prevention and Health Promotion. Available at: http://health.gov/hcq/pdfs/ade-action-plan-508c.pdf. Accessed November 29, 2015.
- The Joint Commission. Surgical care improvement project. Available at: http://www.jointcommission.org/surgical_care_improvement_project. Accessed May 5, 2015.
- , , , et al. Optimization of inpatient warfarin therapy: Impact of daily consultation by a pharmacist‐managed anticoagulation service. Ann Pharmacother. 2000;34:567–572.
- , , . Effects of requiring a baseline International Normalized Ratio for inpatients treated with warfarin. Am J Health Syst Pharm. 2010;67:17–22.
- , . Weighting regressions by propensity scores. Eval Rev. 2008;32:392–409.
- . An introduction to propensity score methods for reducing the effects of confounding in observational studies. Multivar Behav Res. 2011;46:399–424.
- . Propensity score methods for bias reduction in the comparison of a treatment to a non‐randomized control group. Stat Med. 1998;17:2265–2281.
- , . The central role of the propensity score in observational studies for causal effects. Biometrika. 1983;70:41–55.
© 2015 Society of Hospital Medicine

Continuing Medical Education Program in
If you wish to receive credit for this activity, which beginson the next page, please refer to the website:
Accreditation and Designation Statement
Blackwell Futura Media Services designates this educational activity for a 1 AMA PRA Category 1 Credit. Physicians should only claim credit commensurate with the extent of their participation in the activity.
Blackwell Futura Media Services is accredited by the Accreditation Council for Continuing Medical Education to provide continuing medical education for physicians.
Educational Objectives
Upon completion of this educational activity, participants will be better able to:
-
Identify the approximate 30‐day readmission rate of Medicare patient hospitalized initially for pneumonia.
-
Distinguish which variables were accounted and unaccounted for in the development of a pneumonia readmission model.
Continuous participation in the Journal of Hospital Medicine CME program will enable learners to be better able to:
-
Interpret clinical guidelines and their applications for higher quality and more efficient care for all hospitalized patients.
-
Describe the standard of care for common illnesses and conditions treated in the hospital; such as pneumonia, COPD exacerbation, acute coronary syndrome, HF exacerbation, glycemic control, venous thromboembolic disease, stroke, etc.
-
Discuss evidence‐based recommendations involving transitions of care, including the hospital discharge process.
-
Gain insights into the roles of hospitalists as medical educators, researchers, medical ethicists, palliative care providers, and hospital‐based geriatricians.
-
Incorporate best practices for hospitalist administration, including quality improvement, patient safety, practice management, leadership, and demonstrating hospitalist value.
-
Identify evidence‐based best practices and trends for both adult and pediatric hospital medicine.
Instructions on Receiving Credit
For information on applicability and acceptance of continuing medical education credit for this activity, please consult your professional licensing board.
This activity is designed to be completed within the time designated on the title page; physicians should claim only those credits that reflect the time actually spent in the activity. To successfully earn credit, participants must complete the activity during the valid credit period that is noted on the title page.
Follow these steps to earn credit:
-
Log on to
www.blackwellpublishing.com/cme . -
Read the target audience, learning objectives, and author disclosures.
-
Read the article in print or online format.
-
Reflect on the article.
-
Access the CME Exam, and choose the best answer to each question.
-
Complete the required evaluation component of the activity.
Pneumonia Readmission Validation
Hospital readmissions are emblematic of the numerous challenges facing the US health care system. Despite high levels of spending, nearly 20% of Medicare beneficiaries are readmitted within 30 days of hospital discharge, many readmissions are considered preventable, and rates vary widely by hospital and region.1 Further, while readmissions have been estimated to cost taxpayers as much as $17 billion annually, the current fee‐for‐service method of paying for the acute care needs of seniors rewards hospitals financially for readmission, not their prevention.2
Pneumonia is the second most common reason for hospitalization among Medicare beneficiaries, accounting for approximately 650,000 admissions annually,3 and has been a focus of national quality‐improvement efforts for more than a decade.4, 5 Despite improvements in key processes of care, rates of readmission within 30 days of discharge following a hospitalization for pneumonia have been reported to vary from 10% to 24%.68 Among several factors, readmissions are believed to be influenced by the quality of both inpatient and outpatient care, and by care‐coordination activities occurring in the transition from inpatient to outpatient status.912
Public reporting of hospital performance is considered a key strategy for improving quality, reducing costs, and increasing the value of hospital care, both in the US and worldwide.13 In 2009, the Centers for Medicare & Medicaid Services (CMS) expanded its reporting initiatives by adding risk‐adjusted hospital readmission rates for acute myocardial infarction, heart failure, and pneumonia to the Hospital Compare website.14, 15 Readmission rates are an attractive focus for public reporting for several reasons. First, in contrast to most process‐based measures of quality (eg, whether a patient with pneumonia received a particular antibiotic), a readmission is an adverse outcome that matters to patients and families.16 Second, unlike process measures whose assessment requires detailed review of medical records, readmissions can be easily determined from standard hospital claims. Finally, readmissions are costly, and their prevention could yield substantial savings to society.
A necessary prerequisite for public reporting of readmission is a validated, risk‐adjusted measure that can be used to track performance over time and can facilitate comparisons across institutions. Toward this end, we describe the development, validation, and results of a National Quality Forum‐approved and CMS‐adopted model to estimate hospital‐specific, risk‐standardized, 30‐day readmission rates for Medicare patients hospitalized with pneumonia.17
METHODS
Data Sources
We used 20052006 claims data from Medicare inpatient, outpatient, and carrier (physician) Standard Analytic Files to develop and validate the administrative model. The Medicare Enrollment Database was used to determine Medicare fee‐for‐service enrollment and mortality statuses. A medical record model, used for additional validation of the administrative model, was developed using information abstracted from the charts of 75,616 pneumonia cases from 19982001 as part of the National Pneumonia Project, a CMS quality improvement initiative.18
Study Cohort
We identified hospitalizations of patients 65 years of age and older with a principal diagnosis of pneumonia (International Classification of Diseases, 9th Revision, Clinical Modification codes 480.XX, 481, 482.XX, 483.X, 485, 486, 487.0) as potential index pneumonia admissions. Because our focus was readmission for patients discharged from acute care settings, we excluded admissions in which patients died or were transferred to another acute care facility. Additionally, we restricted analysis to patients who had been enrolled in fee‐for‐service Medicare Parts A and B, for at least 12 months prior to their pneumonia hospitalization, so that we could use diagnostic codes from all inpatient and outpatient encounters during that period to enhance identification of comorbidities.
Outcome
The outcome was 30‐day readmission, defined as occurrence of at least one hospitalization for any cause within 30 days of discharge after an index admission. Readmissions were identified from hospital claims data, and were attributed to the hospital that had discharged the patient. A 30‐day time frame was selected because it is a clinically meaningful period during which hospitals can be expected to collaborate with other organizations and providers to implement measures to reduce the risk of rehospitalization.
Candidate and Final Model Variables
Candidate variables for the administrative claims model were selected by a clinician team from 189 diagnostic groups included in the Hierarchical Condition Category (HCC) clinical classification system.19 The HCC clinical classification system was developed for CMS in preparation for all‐encounter risk adjustment for Medicare Advantage (managed care). Under the HCC algorithm, the 15,000+ ICD‐9‐CM diagnosis codes are assigned to one of 189 clinically‐coherent condition categories (CCs). We used the April 2008 version of the ICD‐9‐CM to CC assignment map, which is maintained by CMS and posted at
The final risk‐adjustment model included 39 variables selected by the team of clinicians and analysts, primarily based on their clinical relevance but also with knowledge of the strength of their statistical association with readmission outcome (Table 1). For each patient, the presence or absence of these conditions was assessed from multiple sources, including secondary diagnoses during the index admission, principal and secondary diagnoses from hospital admissions in the 12 months prior to the index admission, and diagnoses from hospital outpatient and physician encounters 12 months before the index admission. A small number of CCs were considered to represent potential complications of care (eg, bleeding). Because we did not want to adjust for complications of care occurring during the index admission, a patient was not considered to have one of these conditions unless it was also present in at least one encounter prior to the index admission.
| Variable | Frequencies | Estimate | Standard Error | Odds Ratio | 95% CI | |
|---|---|---|---|---|---|---|
| ||||||
| Intercept | 2.395 | 0.021 | ||||
| Age 65 (years above 65, continuous) | 0.0001 | 0.001 | 1.000 | 0.998 | 1.001 | |
| Male | 45 | 0.071 | 0.012 | 1.073 | 1.048 | 1.099 |
| History of CABG | 5.2 | 0.179 | 0.027 | 0.836 | 0.793 | 0.881 |
| Metastatic cancer and acute leukemia (CC 7) | 4.3 | 0.177 | 0.029 | 1.194 | 1.128 | 1.263 |
| Lung, upper digestive tract, and other severe cancers (CC 8) | 6.0 | 0.256 | 0.024 | 1.292 | 1.232 | 1.354 |
| Diabetes and DM complications (CC 15‐20, 119, 120) | 36 | 0.059 | 0.012 | 1.061 | 1.036 | 1.087 |
| Disorders of fluid/electrolyte/acid‐base (CC 22, 23) | 34 | 0.149 | 0.013 | 1.160 | 1.131 | 1.191 |
| Iron deficiency and other/unspecified anemias and blood disease (CC 47) | 46 | 0.118 | 0.012 | 1.126 | 1.099 | 1.153 |
| Other psychiatric disorders (CC 60) | 12 | 0.108 | 0.017 | 1.114 | 1.077 | 1.151 |
| Cardio‐respiratory failure and shock (CC 79) | 16 | 0.114 | 0.016 | 1.121 | 1.087 | 1.156 |
| Congestive heart failure (CC 80) | 39 | 0.151 | 0.014 | 1.163 | 1.133 | 1.194 |
| Chronic atherosclerosis (CC 83, 84) | 47 | 0.051 | 0.013 | 1.053 | 1.027 | 1.079 |
| Valvular and rheumatic heart disease (CC 86) | 23 | 0.062 | 0.014 | 1.064 | 1.036 | 1.093 |
| Arrhythmias (CC 92, 93) | 38 | 0.126 | 0.013 | 1.134 | 1.107 | 1.163 |
| Vascular or circulatory disease (CC 104‐106) | 38 | 0.088 | 0.012 | 1.092 | 1.066 | 1.119 |
| COPD (CC 108) | 58 | 0.186 | 0.013 | 1.205 | 1.175 | 1.235 |
| Fibrosis of lung and other chronic lung disorders (CC 109) | 17 | 0.086 | 0.015 | 1.090 | 1.059 | 1.122 |
| Renal failure (CC 131) | 17 | 0.147 | 0.016 | 1.158 | 1.122 | 1.196 |
| Protein‐calorie malnutrition (CC 21) | 7.9 | 0.121 | 0.020 | 1.129 | 1.086 | 1.173 |
| History of infection (CC 1, 3‐6) | 35 | 0.068 | 0.012 | 1.071 | 1.045 | 1.097 |
| Severe hematological disorders (CC 44) | 3.6 | 0.117 | 0.028 | 1.125 | 1.064 | 1.188 |
| Decubitus ulcer or chronic skin ulcer (CC 148, 149) | 10 | 0.101 | 0.018 | 1.106 | 1.067 | 1.146 |
| History of pneumonia (CC 111‐113) | 44 | 0.065 | 0.013 | 1.067 | 1.041 | 1.094 |
| Vertebral fractures (CC 157) | 5.1 | 0.113 | 0.024 | 1.120 | 1.068 | 1.174 |
| Other injuries (CC 162) | 32 | 0.061 | 0.012 | 1.063 | 1.038 | 1.089 |
| Urinary tract infection (CC 135) | 26 | 0.064 | 0.014 | 1.066 | 1.038 | 1.095 |
| Lymphatic, head and neck, brain, and other major cancers; breast, prostate, colorectal, and other cancers and tumors (CC 9‐10) | 16 | 0.050 | 0.016 | 1.051 | 1.018 | 1.084 |
| End‐stage renal disease or dialysis (CC 129, 130) | 1.9 | 0.131 | 0.037 | 1.140 | 1.060 | 1.226 |
| Drug/alcohol abuse/dependence/psychosis (CC 51‐53) | 12 | 0.081 | 0.017 | 1.084 | 1.048 | 1.121 |
| Septicemia/shock (CC 2) | 6.3 | 0.094 | 0.022 | 1.098 | 1.052 | 1.146 |
| Other gastrointestinal disorders (CC 36) | 56 | 0.073 | 0.012 | 1.076 | 1.051 | 1.102 |
| Acute coronary syndrome (CC 81, 82) | 8.3 | 0.126 | 0.019 | 1.134 | 1.092 | 1.178 |
| Pleural effusion/pneumothorax (CC 114) | 12 | 0.083 | 0.017 | 1.086 | 1.051 | 1.123 |
| Other urinary tract disorders (CC 136) | 24 | 0.059 | 0.014 | 1.061 | 1.033 | 1.090 |
| Stroke (CC 95, 96) | 10 | 0.047 | 0.019 | 1.049 | 1.011 | 1.088 |
| Dementia and senility (CC 49, 50) | 27 | 0.031 | 0.014 | 1.031 | 1.004 | 1.059 |
| Hemiplegia, paraplegia, paralysis, functional disability (CC 67‐69, 100‐102, 177, 178) | 7.4 | 0.068 | 0.021 | 1.070 | 1.026 | 1.116 |
| Other lung disorders (CC 115) | 45 | 0.005 | 0.012 | 1.005 | 0.982 | 1.030 |
| Major psychiatric disorders (CC 54‐56) | 11 | 0.038 | 0.018 | 1.038 | 1.003 | 1.075 |
| Asthma (CC 110) | 12 | 0.006 | 0.018 | 1.006 | 0.972 | 1.041 |
Model Derivation
For the development of the administrative claims model, we randomly sampled half of 2006 hospitalizations that met inclusion criteria. To assess model performance at the patient level, we calculated the area under the receiver operating curve (AUC), and calculated observed readmission rates in the lowest and highest deciles on the basis of predicted readmission probabilities. We also compared performance with a null model, a model that adjusted for age and sex, and a model that included all candidate variables.20
Risk‐Standardized Readmission Rates
Using hierarchical logistic regression, we modeled the log‐odds of readmission within 30 days of discharge from an index pneumonia admission as a function of patient demographic and clinical characteristics, and a random hospital‐specific intercept. This strategy accounts for within‐hospital correlation, or clustering, of observed outcomes, and models the assumption that underlying differences in quality among hospitals being evaluated lead to systematic differences in outcomes. We then calculated hospital‐specific readmission rates as the ratio of predicted‐to‐expected readmissions (similar to observed/expected ratio), multiplied by the national unadjusted ratea form of indirect standardization. Predicted number of readmissions in each hospital is estimated given the same patient mix and its estimated hospital‐specific intercept. Expected number of readmissions in each hospital is estimated using its patient mix and the average hospital‐specific intercept. To assess hospital performance in any given year, we re‐estimate model coefficients using that year's data.
Model Validation: Administrative Claims
We compared the model performance in the development sample with its performance in the sample from the 2006 data that was not selected for the development set, and separately among pneumonia admissions in 2005. The model was recalibrated in each validation set.
Model Validation: Medical Record Abstraction
We developed a separate medical record‐based model of readmission risk using information from charts that had previously been abstracted as part of CMS's National Pneumonia Project. To select variables for this model, the clinician team: 1) reviewed the list of variables that were included in a medical record model that was previously developed for validating the National Quality Forum‐approved pneumonia mortality measure; 2) reviewed a list of other potential candidate variables available in the National Pneumonia Project dataset; and 3) reviewed variables that emerged as potentially important predictors of readmission, based on a systematic review of the literature that was conducted as part of measure development. This selection process resulted in a final medical record model that included 35 variables.
We linked patients in the National Pneumonia Project cohort to their Medicare claims data, including claims from one year before the index hospitalization, so that we could calculate risk‐standardized readmission rates in this cohort separately using medical record and claims‐based models. This analysis was conducted at the state level, for the 50 states plus the District of Columbia and Puerto Rico, because medical record data were unavailable in sufficient numbers to permit hospital‐level comparisons. To examine the relationship between risk‐standardized rates obtained from medical record and administrative data models, we estimated a linear regression model describing the association between the two rates, weighting each state by number of index hospitalizations, and calculated the correlation coefficient and the intercept and slope of this equation. A slope close to 1 and an intercept close to 0 would provide evidence that risk‐standardized state readmission rates from the medical record and claims models were similar. We also calculated the difference between state risk‐standardized readmission rates from the two models.
Analyses were conducted with the use of SAS version 9.1.3 (SAS Institute Inc, Cary, NC). Models were fitted separately for the National Pneumonia Project and 2006 cohort. We estimated the hierarchical models using the GLIMMIX procedure in SAS. The Human Investigation Committee at the Yale School of Medicine approved an exemption for the authors to use CMS claims and enrollment data for research analyses and publication.
RESULTS
Model Derivation and Performance
After exclusions were applied, the 2006 sample included 453,251 pneumonia hospitalizations (Figure 1). The development sample consisted of 226,545 hospitalizations at 4675 hospitals, with an overall unadjusted 30‐day readmission rate of 17.4%. In 11,694 index cases (5.2%), the patient died within 30 days without being readmitted. Median readmission rate was 16.3%, 25th and 75th percentile rates were 11.1% and 21.3%, and at the 10th and 90th percentile, hospital readmission rates ranged from 4.6% to 26.7% (Figure 2).
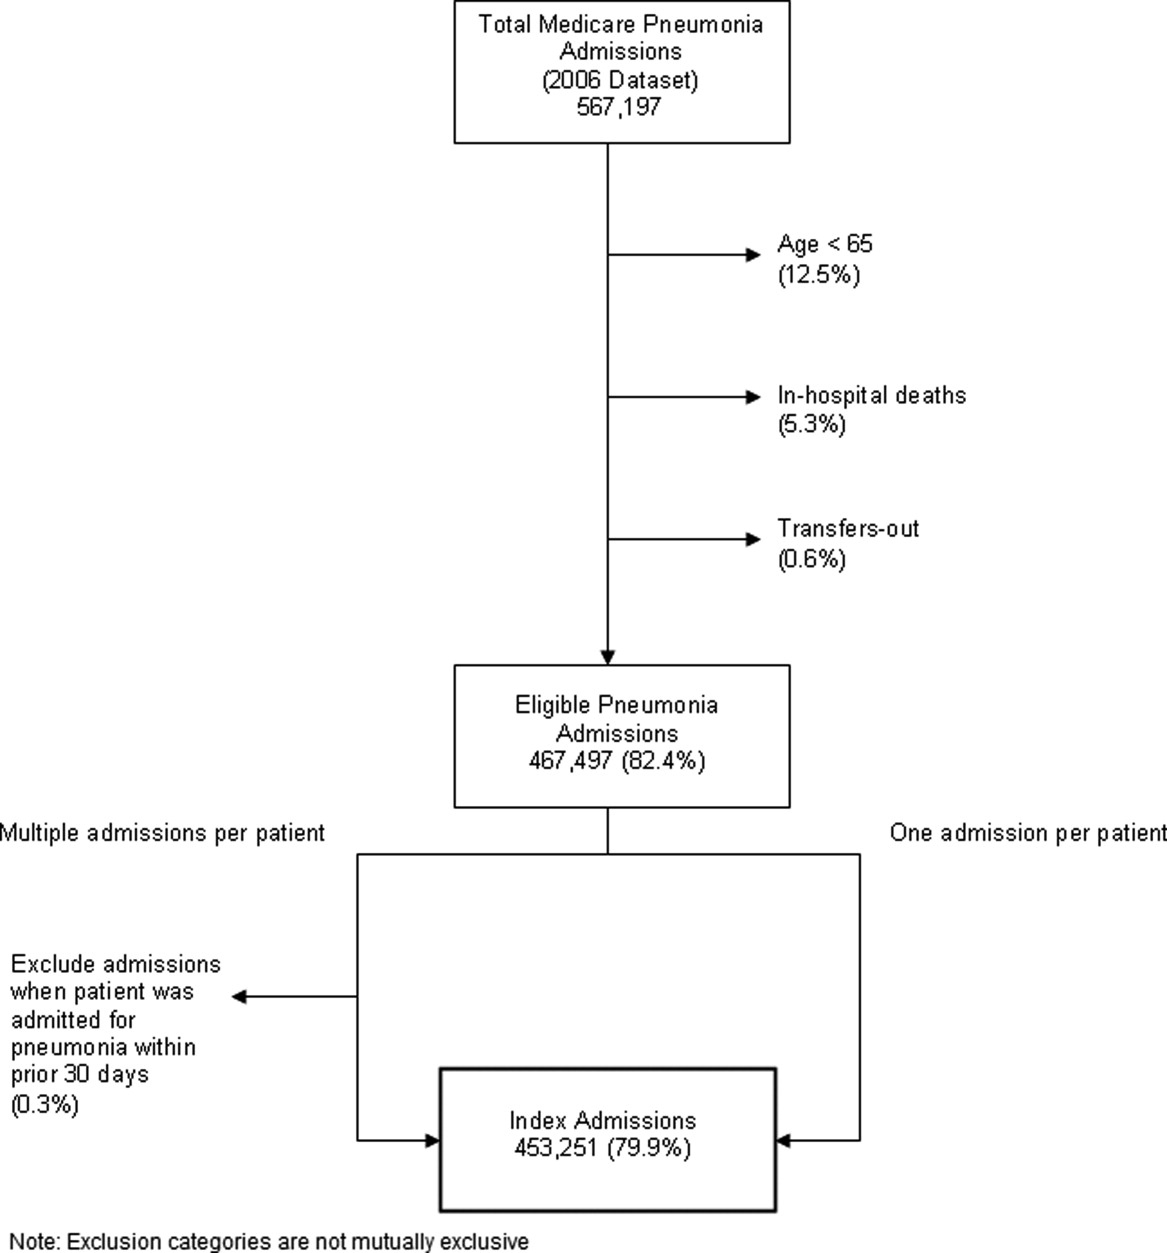
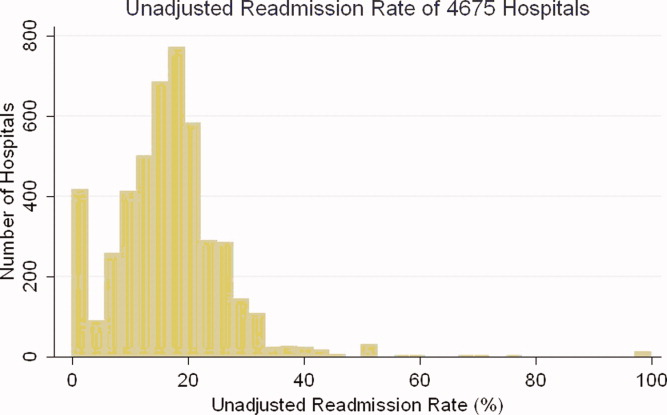
The claims model included 39 variables (age, sex, and 37 clinical variables) (Table 1). The mean age of the cohort was 80.0 years, with 55.5% women and 11.1% nonwhite patients. Mean observed readmission rate in the development sample ranged from 9% in the lowest decile of predicted pneumonia readmission rates to 32% in the highest predicted decile, a range of 23%. The AUC was 0.63. For comparison, a model with only age and sex had an AUC of 0.51, and a model with all candidate variables had an AUC equal to 0.63 (Table 2).
| Calibration (0, 1)* | Discrimination | Residuals Lack of Fit (Pearson Residual Fall %) | Model 2 (No. of Covariates) | ||||||
|---|---|---|---|---|---|---|---|---|---|
| Predictive Ability (Lowest Decile, Highest Decile) | AUC | (<2) | (2, 0) | (0, 2) | (2+) | ||||
| |||||||||
| Development sample | |||||||||
| 2006 | (1st half) N = 226,545 | (0, 1) | (0.09, 0.32) | 0.63 | 0 | 82.62 | 7.39 | 9.99 | 6,843 (40) |
| Validation sample | |||||||||
| 2006 | (2nd half) N = 226,706 | (0.002, 0.997) | (0.09, 0.31) | 0.63 | 0 | 82.55 | 7.45 | 9.99 | 6,870 (40) |
| 2005 | N = 536,015 | (0.035, 1.008) | (0.08, 0.31) | 0.63 | 0 | 82.67 | 7.31 | 10.03 | 16,241 (40) |
Hospital Risk‐Standardized Readmission Rates
Risk‐standardized readmission rates varied across hospitals (Figure 3). Median risk‐standardized readmission rate was 17.3%, and the 25th and 75th percentiles were 16.9% and 17.9%, respectively. The 5th percentile was 16.0% and the 95th percentile was 19.1%. Odds of readmission for a hospital one standard deviation above average was 1.4 times that of a hospital one standard deviation below average.
Administrative Model Validation
In the remaining 50% of pneumonia index hospitalizations from 2006, and the entire 2005 cohort, regression coefficients and standard errors of model variables were similar to those in the development data set. Model performance using 2005 data was consistent with model performance using the 2006 development and validation half‐samples (Table 2).
Medical Record Validation
After exclusions, the medical record sample taken from the National Pneumonia Project included 47,429 cases, with an unadjusted 30‐day readmission rate of 17.0%. The final medical record risk‐adjustment model included a total of 35 variables, whose prevalence and association with readmission risk varied modestly (Table 3). Performance of the medical record and administrative models was similar (areas under the ROC curve 0.59 and 0.63, respectively) (Table 4). Additionally, in the administrative model, predicted readmission rates ranged from 8% in the lowest predicted decile to 30% in the highest predicted decile, while in the medical record model, the corresponding rates varied from 10% to 26%.
| Variable | Percent | Estimate | Standard Error | Odds Ratio | 95% CI | |
|---|---|---|---|---|---|---|
| ||||||
| Age 65, mean (SD) | 15.24 (7.87) | 0.003 | 0.002 | 0.997 | 0.993 | 1.000 |
| Male | 46.18 | 0.122 | 0.025 | 1.130 | 1.075 | 1.188 |
| Nursing home resident | 17.71 | 0.035 | 0.037 | 1.036 | 0.963 | 1.114 |
| Neoplastic disease | 6.80 | 0.130 | 0.049 | 1.139 | 1.034 | 1.254 |
| Liver disease | 1.04 | 0.089 | 0.123 | 0.915 | 0.719 | 1.164 |
| History of heart failure | 28.98 | 0.234 | 0.029 | 1.264 | 1.194 | 1.339 |
| History of renal disease | 8.51 | 0.188 | 0.047 | 1.206 | 1.100 | 1.323 |
| Altered mental status | 17.95 | 0.009 | 0.034 | 1.009 | 0.944 | 1.080 |
| Pleural effusion | 21.20 | 0.165 | 0.030 | 1.179 | 1.111 | 1.251 |
| BUN 30 mg/dl | 23.28 | 0.160 | 0.033 | 1.174 | 1.100 | 1.252 |
| BUN missing | 14.56 | 0.101 | 0.185 | 0.904 | 0.630 | 1.298 |
| Systolic BP <90 mmHg | 2.95 | 0.068 | 0.070 | 1.070 | 0.932 | 1.228 |
| Systolic BP missing | 11.21 | 0.149 | 0.425 | 1.160 | 0.504 | 2.669 |
| Pulse 125/min | 7.73 | 0.036 | 0.047 | 1.036 | 0.945 | 1.137 |
| Pulse missing | 11.22 | 0.210 | 0.405 | 1.234 | 0.558 | 2.729 |
| Respiratory rate 30/min | 16.38 | 0.079 | 0.034 | 1.082 | 1.012 | 1.157 |
| Respiratory rate missing | 11.39 | 0.204 | 0.240 | 1.226 | 0.765 | 1.964 |
| Sodium <130 mmol/L | 4.82 | 0.136 | 0.057 | 1.145 | 1.025 | 1.280 |
| Sodium missing | 14.39 | 0.049 | 0.143 | 1.050 | 0.793 | 1.391 |
| Glucose 250 mg/dl | 5.19 | 0.005 | 0.057 | 0.995 | 0.889 | 1.114 |
| Glucose missing | 15.44 | 0.156 | 0.105 | 0.855 | 0.696 | 1.051 |
| Hematocrit <30% | 7.77 | 0.270 | 0.044 | 1.310 | 1.202 | 1.428 |
| Hematocrit missing | 13.62 | 0.071 | 0.135 | 0.932 | 0.715 | 1.215 |
| Creatinine 2.5 mg/dL | 4.68 | 0.109 | 0.062 | 1.115 | 0.989 | 1.258 |
| Creatinine missing | 14.63 | 0.200 | 0.167 | 1.221 | 0.880 | 1.695 |
| WBC 6‐12 b/L | 38.04 | 0.021 | 0.049 | 0.979 | 0.889 | 1.079 |
| WBC >12 b/L | 41.45 | 0.068 | 0.049 | 0.934 | 0.848 | 1.029 |
| WBC missing | 12.85 | 0.167 | 0.162 | 1.181 | 0.860 | 1.623 |
| Immunosuppressive therapy | 15.01 | 0.347 | 0.035 | 1.415 | 1.321 | 1.516 |
| Chronic lung disease | 42.16 | 0.137 | 0.028 | 1.147 | 1.086 | 1.211 |
| Coronary artery disease | 39.57 | 0.150 | 0.028 | 1.162 | 1.100 | 1.227 |
| Diabetes mellitus | 20.90 | 0.137 | 0.033 | 1.147 | 1.076 | 1.223 |
| Alcohol/drug abuse | 3.40 | 0.099 | 0.071 | 0.906 | 0.788 | 1.041 |
| Dementia/Alzheimer's disease | 16.38 | 0.125 | 0.038 | 1.133 | 1.052 | 1.222 |
| Splenectomy | 0.44 | 0.016 | 0.186 | 1.016 | 0.706 | 1.463 |
| Model | Calibration (0, 1)* | Discrimination | Residuals Lack of Fit (Pearson Residual Fall %) | Model 2 (No. of Covariates) | ||||
|---|---|---|---|---|---|---|---|---|
| Predictive Ability (Lowest Decile, Highest Decile) | AUC | (<2) | (2, 0) | (0, 2) | (2+) | |||
| ||||||||
| Medical Record Model Development Sample (NP) | ||||||||
| N = 47,429 No. of 30‐day readmissions = 8,042 | (1, 0) | (0.10, 0.26) | 0.59 | 0 | 83.04 | 5.28 | 11.68 | 710 (35) |
| Linked Administrative Model Validation Sample | ||||||||
| N = 47,429 No. of 30‐day readmissions = 8,042 | (1, 0) | (0.08, 0.30) | 0.63 | 0 | 83.04 | 6.94 | 10.01 | 1,414 (40) |
The correlation coefficient of the estimated state‐specific standardized readmission rates from the administrative and medical record models was 0.96, and the proportion of the variance explained by the model was 0.92 (Figure 4).
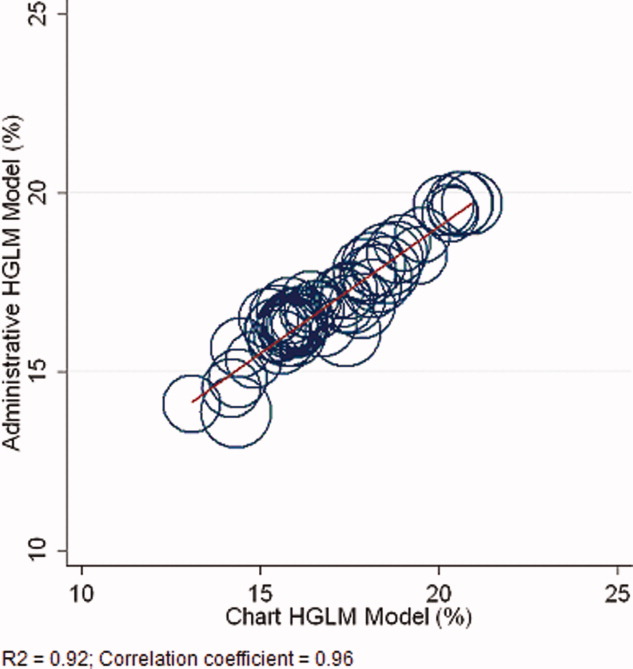
DISCUSSION
We have described the development, validation, and results of a hospital, 30‐day, risk‐standardized readmission model for pneumonia that was created to support current federal transparency initiatives. The model uses administrative claims data from Medicare fee‐for‐service patients and produces results that are comparable to a model based on information obtained through manual abstraction of medical records. We observed an overall 30‐day readmission rate of 17%, and our analyses revealed substantial variation across US hospitals, suggesting that improvement by lower performing institutions is an achievable goal.
Because more than one in six pneumonia patients are rehospitalized shortly after discharge, and because pneumonia hospitalizations represent an enormous expense to the Medicare program, prevention of readmissions is now widely recognized to offer a substantial opportunity to improve patient outcomes while simultaneously lowering health care costs. Accordingly, promotion of strategies to reduce readmission rates has become a key priority for payers and quality‐improvement organizations. These range from policy‐level attempts to stimulate change, such as publicly reporting hospital readmission rates on government websites, to establishing accreditation standardssuch as the Joint Commission's requirement to accurately reconcile medications, to the creation of quality improvement collaboratives focused on sharing best practices across institutions. Regardless of the approach taken, a valid, risk‐adjusted measure of performance is required to evaluate and track performance over time. The measure we have described meets the National Quality Forum's measure evaluation criteria in that it addresses an important clinical topic for which there appears to be significant opportunities for improvement, the measure is precisely defined and has been subjected to validity and reliability testing, it is risk‐adjusted based on patient clinical factors present at the start of care, is feasible to produce, and is understandable by a broad range of potential users.21 Because hospitalists are the physicians primarily responsible for the care of patients with pneumonia at US hospitals, and because they frequently serve as the physician champions for quality improvement activities related to pneumonia, it is especially important that they maintain a thorough understanding of the measures and methodologies underlying current efforts to measure hospital performance.
Several features of our approach warrant additional comment. First, we deliberately chose to measure all readmission events rather than attempt to discriminate between potentially preventable and nonpreventable readmissions. From the patient perspective, readmission for any reason is a concern, and limiting the measure to pneumonia‐related readmissions could make it susceptible to gaming by hospitals. Moreover, determining whether a readmission is related to a potential quality problem is not straightforward. For example, a patient with pneumonia whose discharge medications were prescribed incorrectly may be readmitted with a hip fracture following an episode of syncope. It would be inappropriate to treat this readmission as unrelated to the care the patient received for pneumonia. Additionally, while our approach does not presume that every readmission is preventable, the goal is to reduce the risk of readmissions generally (not just in narrowly defined subpopulations), and successful interventions to reduce rehospitalization have typically demonstrated reductions in all‐cause readmission.9, 22 Second, deaths that occurred within 30 days of discharge, yet that were not accompanied by a hospital readmission, were not counted as a readmission outcome. While it may seem inappropriate to treat a postdischarge death as a nonevent (rather than censoring or excluding such cases), alternative analytic approaches, such as using a hierarchical survival model, are not currently computationally feasible with large national data sets. Fortunately, only a relatively small proportion of discharges fell into this category (5.2% of index cases in the 2006 development sample died within 30 days of discharge without being readmitted). An alternative approach to handling the competing outcome of death would have been to use a composite outcome of readmission or death. However, we believe that it is important to report the outcomes separately because factors that predict readmission and mortality may differ, and when making comparisons across hospitals it would not be possible to determine whether differences in rate were due to readmission or mortality. Third, while the patient‐level readmission model showed only modest discrimination, we intentionally excluded covariates such as race and socioeconomic status, as well as in‐hospital events and potential complications of care, and whether patients were discharged home or to a skilled nursing facility. While these variables could have improved predictive ability, they may be directly or indirectly related to quality or supply factors that should not be included in a model that seeks to control for patient clinical characteristics. For example, if hospitals with a large share of poor patients have higher readmission rates, then including income in the model will obscure differences that are important to identify. While we believe that the decision to exclude such factors in the model is in the best interest of patients, and supports efforts to reduce health inequality in society more generally, we also recognize that hospitals that care for a disproportionate share of poor patients are likely to require additional resources to overcome these social factors. Fourth, we limited the analysis to patients with a principal diagnosis of pneumonia, and chose not to also include those with a principal diagnosis of sepsis or respiratory failure coupled with a secondary diagnosis of pneumonia. While the broader definition is used by CMS in the National Pneumonia Project, that initiative relied on chart abstraction to differentiate pneumonia present at the time of admission from cases developing as a complication of hospitalization. Additionally, we did not attempt to differentiate between community‐acquired and healthcare‐associated pneumonia, however our approach is consistent with the National Pneumonia Project and Pneumonia Patient Outcomes Research Team.18 Fifth, while our model estimates readmission rates at the hospital level, we recognize that readmissions are influenced by a complex and extensive range of factors. In this context, greater cooperation between hospitals and other care providers will almost certainly be required in order to achieve dramatic improvement in readmission rates, which in turn will depend upon changes to the way serious illness is paid for. Some options that have recently been described include imposing financial penalties for early readmission, extending the boundaries of case‐based payment beyond hospital discharge, and bundling payments between hospitals and physicians.2325
Our measure has several limitations. First, our models were developed and validated using Medicare data, and the results may not apply to pneumonia patients less than 65 years of age. However, most patients hospitalized with pneumonia in the US are 65 or older. In addition, we were unable to test the model with a Medicare managed care population, because data are not currently available on such patients. Finally, the medical record‐based validation was conducted by state‐level analysis because the sample size was insufficient to carry this out at the hospital level.
In conclusion, more than 17% of Medicare beneficiaries are readmitted within 30 days following discharge after a hospitalization for pneumonia, and rates vary substantially across institutions. The development of a valid measure of hospital performance and public reporting are important first steps towards focusing attention on this problem. Actual improvement will now depend on whether hospitals and partner organizations are successful at identifying and implementing effective methods to prevent readmission.
- ,,.Rehospitalizations among patients in the Medicare Fee‐for‐Service Program.N Engl J Med.2009;360(14):1418–1428.
- Medicare Payment Advisory Commission.Report to the Congress: Promoting Greater Efficiency in Medicare.2007.
- ,,,,. HCUP Facts and Figures: Statistics on Hospital‐based Care in the United States, 2007.2009. Available at: http://www.hcup‐us.ahrq.gov/reports.jsp. Accessed November 7, 2009.
- Centers for Medicare 353(3):255–264.
- ,,,.Trends in postdischarge mortality and readmissions: has length of stay declined too far?Arch Intern Med.2004;164(5):538–544.
- ,,,.Short‐term outcomes and their predictors for patients hospitalized with community‐acquired pneumonia.Heart Lung.2004;33(5):301–307.
- ,,, et al.Improved clinical outcomes with utilization of a community‐acquired pneumonia guideline.Chest.2006;130(3):794–799.
- ,,,,.Associations between initial antimicrobial therapy and medical outcomes for hospitalized elderly patients with pneumonia.Arch Intern Med.1999;159(21):2562–2572.
- ,.Hospital readmissions as a measure of quality of health care: advantages and limitations.Arch Intern Med.2000;160(8):1074–1081.
- ,,,.The care transitions intervention: results of a randomized controlled trial.Arch Intern Med.2006;166(17):1822–1828.
- Corrigan JM, Eden J, Smith BM, eds.Leadership by Example: Coordinating Government Roles in Improving Health Care Quality. Committee on Enhancing Federal Healthcare Quality Programs.Washington, DC:National Academies Press,2003.
- Medicare.gov—Hospital Compare. Available at: http://www.hospitalcompare.hhs.gov/Hospital/Search/Welcome.asp?version=default1(1):29–37.
- ,,,,.Measuring performance for treating heart attacks and heart failure: the case for outcomes measurement.Health Aff.2007;26(1):75–85.
- NQF‐Endorsed® Standards. Available at: http://www.qualityforum.org/Measures_List.aspx. Accessed November 6,2009.
- ,,,,.Timing of antibiotic administration and outcomes for Medicare patients hospitalized with community‐acquired pneumonia.Arch Intern Med.2004;164(6):637–644.
- ,,. Diagnostic Cost Group Hierarchical Condition Category Models for Medicare Risk Adjustment. Report prepared for the Health Care Financing Administration. Health Economics Research, Inc;2000. Available at: http://www.cms.hhs.gov/Reports/Reports/ItemDetail.asp?ItemID=CMS023176. Accessed November 7, 2009.
- .Regression Modeling Strategies: With Applications to Linear Models, Logistic Regression, and Survival Analysis.1st ed.New York:Springer;2006.
- National Quality Forum—Measure Evaluation Criteria.2008. Available at: http://www.qualityforum.org/uploadedFiles/Quality_Forum/Measuring_Performance/Consensus_Development_Process%E2%80%99s_Principle/EvalCriteria2008–08‐28Final.pdf?n=4701.
- ,,, et al.Comprehensive discharge planning and home follow‐up of hospitalized elders: a randomized clinical trial.JAMA.1999;281(7):613–620.
- .Paying for care episodes and care coordination.N Engl J Med.2007;356(11):1166–1168.
- .Health care reform—toward more freedom, and responsibility, for physicians.N Engl J Med.2009;361(6):623–628.
- .Beyond pay for performance—emerging models of provider‐payment reform.N Engl J Med.2008;359(12):1197–1200.
Hospital readmissions are emblematic of the numerous challenges facing the US health care system. Despite high levels of spending, nearly 20% of Medicare beneficiaries are readmitted within 30 days of hospital discharge, many readmissions are considered preventable, and rates vary widely by hospital and region.1 Further, while readmissions have been estimated to cost taxpayers as much as $17 billion annually, the current fee‐for‐service method of paying for the acute care needs of seniors rewards hospitals financially for readmission, not their prevention.2
Pneumonia is the second most common reason for hospitalization among Medicare beneficiaries, accounting for approximately 650,000 admissions annually,3 and has been a focus of national quality‐improvement efforts for more than a decade.4, 5 Despite improvements in key processes of care, rates of readmission within 30 days of discharge following a hospitalization for pneumonia have been reported to vary from 10% to 24%.68 Among several factors, readmissions are believed to be influenced by the quality of both inpatient and outpatient care, and by care‐coordination activities occurring in the transition from inpatient to outpatient status.912
Public reporting of hospital performance is considered a key strategy for improving quality, reducing costs, and increasing the value of hospital care, both in the US and worldwide.13 In 2009, the Centers for Medicare & Medicaid Services (CMS) expanded its reporting initiatives by adding risk‐adjusted hospital readmission rates for acute myocardial infarction, heart failure, and pneumonia to the Hospital Compare website.14, 15 Readmission rates are an attractive focus for public reporting for several reasons. First, in contrast to most process‐based measures of quality (eg, whether a patient with pneumonia received a particular antibiotic), a readmission is an adverse outcome that matters to patients and families.16 Second, unlike process measures whose assessment requires detailed review of medical records, readmissions can be easily determined from standard hospital claims. Finally, readmissions are costly, and their prevention could yield substantial savings to society.
A necessary prerequisite for public reporting of readmission is a validated, risk‐adjusted measure that can be used to track performance over time and can facilitate comparisons across institutions. Toward this end, we describe the development, validation, and results of a National Quality Forum‐approved and CMS‐adopted model to estimate hospital‐specific, risk‐standardized, 30‐day readmission rates for Medicare patients hospitalized with pneumonia.17
METHODS
Data Sources
We used 20052006 claims data from Medicare inpatient, outpatient, and carrier (physician) Standard Analytic Files to develop and validate the administrative model. The Medicare Enrollment Database was used to determine Medicare fee‐for‐service enrollment and mortality statuses. A medical record model, used for additional validation of the administrative model, was developed using information abstracted from the charts of 75,616 pneumonia cases from 19982001 as part of the National Pneumonia Project, a CMS quality improvement initiative.18
Study Cohort
We identified hospitalizations of patients 65 years of age and older with a principal diagnosis of pneumonia (International Classification of Diseases, 9th Revision, Clinical Modification codes 480.XX, 481, 482.XX, 483.X, 485, 486, 487.0) as potential index pneumonia admissions. Because our focus was readmission for patients discharged from acute care settings, we excluded admissions in which patients died or were transferred to another acute care facility. Additionally, we restricted analysis to patients who had been enrolled in fee‐for‐service Medicare Parts A and B, for at least 12 months prior to their pneumonia hospitalization, so that we could use diagnostic codes from all inpatient and outpatient encounters during that period to enhance identification of comorbidities.
Outcome
The outcome was 30‐day readmission, defined as occurrence of at least one hospitalization for any cause within 30 days of discharge after an index admission. Readmissions were identified from hospital claims data, and were attributed to the hospital that had discharged the patient. A 30‐day time frame was selected because it is a clinically meaningful period during which hospitals can be expected to collaborate with other organizations and providers to implement measures to reduce the risk of rehospitalization.
Candidate and Final Model Variables
Candidate variables for the administrative claims model were selected by a clinician team from 189 diagnostic groups included in the Hierarchical Condition Category (HCC) clinical classification system.19 The HCC clinical classification system was developed for CMS in preparation for all‐encounter risk adjustment for Medicare Advantage (managed care). Under the HCC algorithm, the 15,000+ ICD‐9‐CM diagnosis codes are assigned to one of 189 clinically‐coherent condition categories (CCs). We used the April 2008 version of the ICD‐9‐CM to CC assignment map, which is maintained by CMS and posted at
The final risk‐adjustment model included 39 variables selected by the team of clinicians and analysts, primarily based on their clinical relevance but also with knowledge of the strength of their statistical association with readmission outcome (Table 1). For each patient, the presence or absence of these conditions was assessed from multiple sources, including secondary diagnoses during the index admission, principal and secondary diagnoses from hospital admissions in the 12 months prior to the index admission, and diagnoses from hospital outpatient and physician encounters 12 months before the index admission. A small number of CCs were considered to represent potential complications of care (eg, bleeding). Because we did not want to adjust for complications of care occurring during the index admission, a patient was not considered to have one of these conditions unless it was also present in at least one encounter prior to the index admission.
| Variable | Frequencies | Estimate | Standard Error | Odds Ratio | 95% CI | |
|---|---|---|---|---|---|---|
| ||||||
| Intercept | 2.395 | 0.021 | ||||
| Age 65 (years above 65, continuous) | 0.0001 | 0.001 | 1.000 | 0.998 | 1.001 | |
| Male | 45 | 0.071 | 0.012 | 1.073 | 1.048 | 1.099 |
| History of CABG | 5.2 | 0.179 | 0.027 | 0.836 | 0.793 | 0.881 |
| Metastatic cancer and acute leukemia (CC 7) | 4.3 | 0.177 | 0.029 | 1.194 | 1.128 | 1.263 |
| Lung, upper digestive tract, and other severe cancers (CC 8) | 6.0 | 0.256 | 0.024 | 1.292 | 1.232 | 1.354 |
| Diabetes and DM complications (CC 15‐20, 119, 120) | 36 | 0.059 | 0.012 | 1.061 | 1.036 | 1.087 |
| Disorders of fluid/electrolyte/acid‐base (CC 22, 23) | 34 | 0.149 | 0.013 | 1.160 | 1.131 | 1.191 |
| Iron deficiency and other/unspecified anemias and blood disease (CC 47) | 46 | 0.118 | 0.012 | 1.126 | 1.099 | 1.153 |
| Other psychiatric disorders (CC 60) | 12 | 0.108 | 0.017 | 1.114 | 1.077 | 1.151 |
| Cardio‐respiratory failure and shock (CC 79) | 16 | 0.114 | 0.016 | 1.121 | 1.087 | 1.156 |
| Congestive heart failure (CC 80) | 39 | 0.151 | 0.014 | 1.163 | 1.133 | 1.194 |
| Chronic atherosclerosis (CC 83, 84) | 47 | 0.051 | 0.013 | 1.053 | 1.027 | 1.079 |
| Valvular and rheumatic heart disease (CC 86) | 23 | 0.062 | 0.014 | 1.064 | 1.036 | 1.093 |
| Arrhythmias (CC 92, 93) | 38 | 0.126 | 0.013 | 1.134 | 1.107 | 1.163 |
| Vascular or circulatory disease (CC 104‐106) | 38 | 0.088 | 0.012 | 1.092 | 1.066 | 1.119 |
| COPD (CC 108) | 58 | 0.186 | 0.013 | 1.205 | 1.175 | 1.235 |
| Fibrosis of lung and other chronic lung disorders (CC 109) | 17 | 0.086 | 0.015 | 1.090 | 1.059 | 1.122 |
| Renal failure (CC 131) | 17 | 0.147 | 0.016 | 1.158 | 1.122 | 1.196 |
| Protein‐calorie malnutrition (CC 21) | 7.9 | 0.121 | 0.020 | 1.129 | 1.086 | 1.173 |
| History of infection (CC 1, 3‐6) | 35 | 0.068 | 0.012 | 1.071 | 1.045 | 1.097 |
| Severe hematological disorders (CC 44) | 3.6 | 0.117 | 0.028 | 1.125 | 1.064 | 1.188 |
| Decubitus ulcer or chronic skin ulcer (CC 148, 149) | 10 | 0.101 | 0.018 | 1.106 | 1.067 | 1.146 |
| History of pneumonia (CC 111‐113) | 44 | 0.065 | 0.013 | 1.067 | 1.041 | 1.094 |
| Vertebral fractures (CC 157) | 5.1 | 0.113 | 0.024 | 1.120 | 1.068 | 1.174 |
| Other injuries (CC 162) | 32 | 0.061 | 0.012 | 1.063 | 1.038 | 1.089 |
| Urinary tract infection (CC 135) | 26 | 0.064 | 0.014 | 1.066 | 1.038 | 1.095 |
| Lymphatic, head and neck, brain, and other major cancers; breast, prostate, colorectal, and other cancers and tumors (CC 9‐10) | 16 | 0.050 | 0.016 | 1.051 | 1.018 | 1.084 |
| End‐stage renal disease or dialysis (CC 129, 130) | 1.9 | 0.131 | 0.037 | 1.140 | 1.060 | 1.226 |
| Drug/alcohol abuse/dependence/psychosis (CC 51‐53) | 12 | 0.081 | 0.017 | 1.084 | 1.048 | 1.121 |
| Septicemia/shock (CC 2) | 6.3 | 0.094 | 0.022 | 1.098 | 1.052 | 1.146 |
| Other gastrointestinal disorders (CC 36) | 56 | 0.073 | 0.012 | 1.076 | 1.051 | 1.102 |
| Acute coronary syndrome (CC 81, 82) | 8.3 | 0.126 | 0.019 | 1.134 | 1.092 | 1.178 |
| Pleural effusion/pneumothorax (CC 114) | 12 | 0.083 | 0.017 | 1.086 | 1.051 | 1.123 |
| Other urinary tract disorders (CC 136) | 24 | 0.059 | 0.014 | 1.061 | 1.033 | 1.090 |
| Stroke (CC 95, 96) | 10 | 0.047 | 0.019 | 1.049 | 1.011 | 1.088 |
| Dementia and senility (CC 49, 50) | 27 | 0.031 | 0.014 | 1.031 | 1.004 | 1.059 |
| Hemiplegia, paraplegia, paralysis, functional disability (CC 67‐69, 100‐102, 177, 178) | 7.4 | 0.068 | 0.021 | 1.070 | 1.026 | 1.116 |
| Other lung disorders (CC 115) | 45 | 0.005 | 0.012 | 1.005 | 0.982 | 1.030 |
| Major psychiatric disorders (CC 54‐56) | 11 | 0.038 | 0.018 | 1.038 | 1.003 | 1.075 |
| Asthma (CC 110) | 12 | 0.006 | 0.018 | 1.006 | 0.972 | 1.041 |
Model Derivation
For the development of the administrative claims model, we randomly sampled half of 2006 hospitalizations that met inclusion criteria. To assess model performance at the patient level, we calculated the area under the receiver operating curve (AUC), and calculated observed readmission rates in the lowest and highest deciles on the basis of predicted readmission probabilities. We also compared performance with a null model, a model that adjusted for age and sex, and a model that included all candidate variables.20
Risk‐Standardized Readmission Rates
Using hierarchical logistic regression, we modeled the log‐odds of readmission within 30 days of discharge from an index pneumonia admission as a function of patient demographic and clinical characteristics, and a random hospital‐specific intercept. This strategy accounts for within‐hospital correlation, or clustering, of observed outcomes, and models the assumption that underlying differences in quality among hospitals being evaluated lead to systematic differences in outcomes. We then calculated hospital‐specific readmission rates as the ratio of predicted‐to‐expected readmissions (similar to observed/expected ratio), multiplied by the national unadjusted ratea form of indirect standardization. Predicted number of readmissions in each hospital is estimated given the same patient mix and its estimated hospital‐specific intercept. Expected number of readmissions in each hospital is estimated using its patient mix and the average hospital‐specific intercept. To assess hospital performance in any given year, we re‐estimate model coefficients using that year's data.
Model Validation: Administrative Claims
We compared the model performance in the development sample with its performance in the sample from the 2006 data that was not selected for the development set, and separately among pneumonia admissions in 2005. The model was recalibrated in each validation set.
Model Validation: Medical Record Abstraction
We developed a separate medical record‐based model of readmission risk using information from charts that had previously been abstracted as part of CMS's National Pneumonia Project. To select variables for this model, the clinician team: 1) reviewed the list of variables that were included in a medical record model that was previously developed for validating the National Quality Forum‐approved pneumonia mortality measure; 2) reviewed a list of other potential candidate variables available in the National Pneumonia Project dataset; and 3) reviewed variables that emerged as potentially important predictors of readmission, based on a systematic review of the literature that was conducted as part of measure development. This selection process resulted in a final medical record model that included 35 variables.
We linked patients in the National Pneumonia Project cohort to their Medicare claims data, including claims from one year before the index hospitalization, so that we could calculate risk‐standardized readmission rates in this cohort separately using medical record and claims‐based models. This analysis was conducted at the state level, for the 50 states plus the District of Columbia and Puerto Rico, because medical record data were unavailable in sufficient numbers to permit hospital‐level comparisons. To examine the relationship between risk‐standardized rates obtained from medical record and administrative data models, we estimated a linear regression model describing the association between the two rates, weighting each state by number of index hospitalizations, and calculated the correlation coefficient and the intercept and slope of this equation. A slope close to 1 and an intercept close to 0 would provide evidence that risk‐standardized state readmission rates from the medical record and claims models were similar. We also calculated the difference between state risk‐standardized readmission rates from the two models.
Analyses were conducted with the use of SAS version 9.1.3 (SAS Institute Inc, Cary, NC). Models were fitted separately for the National Pneumonia Project and 2006 cohort. We estimated the hierarchical models using the GLIMMIX procedure in SAS. The Human Investigation Committee at the Yale School of Medicine approved an exemption for the authors to use CMS claims and enrollment data for research analyses and publication.
RESULTS
Model Derivation and Performance
After exclusions were applied, the 2006 sample included 453,251 pneumonia hospitalizations (Figure 1). The development sample consisted of 226,545 hospitalizations at 4675 hospitals, with an overall unadjusted 30‐day readmission rate of 17.4%. In 11,694 index cases (5.2%), the patient died within 30 days without being readmitted. Median readmission rate was 16.3%, 25th and 75th percentile rates were 11.1% and 21.3%, and at the 10th and 90th percentile, hospital readmission rates ranged from 4.6% to 26.7% (Figure 2).
The claims model included 39 variables (age, sex, and 37 clinical variables) (Table 1). The mean age of the cohort was 80.0 years, with 55.5% women and 11.1% nonwhite patients. Mean observed readmission rate in the development sample ranged from 9% in the lowest decile of predicted pneumonia readmission rates to 32% in the highest predicted decile, a range of 23%. The AUC was 0.63. For comparison, a model with only age and sex had an AUC of 0.51, and a model with all candidate variables had an AUC equal to 0.63 (Table 2).
| Calibration (0, 1)* | Discrimination | Residuals Lack of Fit (Pearson Residual Fall %) | Model 2 (No. of Covariates) | ||||||
|---|---|---|---|---|---|---|---|---|---|
| Predictive Ability (Lowest Decile, Highest Decile) | AUC | (<2) | (2, 0) | (0, 2) | (2+) | ||||
| |||||||||
| Development sample | |||||||||
| 2006 | (1st half) N = 226,545 | (0, 1) | (0.09, 0.32) | 0.63 | 0 | 82.62 | 7.39 | 9.99 | 6,843 (40) |
| Validation sample | |||||||||
| 2006 | (2nd half) N = 226,706 | (0.002, 0.997) | (0.09, 0.31) | 0.63 | 0 | 82.55 | 7.45 | 9.99 | 6,870 (40) |
| 2005 | N = 536,015 | (0.035, 1.008) | (0.08, 0.31) | 0.63 | 0 | 82.67 | 7.31 | 10.03 | 16,241 (40) |
Hospital Risk‐Standardized Readmission Rates
Risk‐standardized readmission rates varied across hospitals (Figure 3). Median risk‐standardized readmission rate was 17.3%, and the 25th and 75th percentiles were 16.9% and 17.9%, respectively. The 5th percentile was 16.0% and the 95th percentile was 19.1%. Odds of readmission for a hospital one standard deviation above average was 1.4 times that of a hospital one standard deviation below average.
Administrative Model Validation
In the remaining 50% of pneumonia index hospitalizations from 2006, and the entire 2005 cohort, regression coefficients and standard errors of model variables were similar to those in the development data set. Model performance using 2005 data was consistent with model performance using the 2006 development and validation half‐samples (Table 2).
Medical Record Validation
After exclusions, the medical record sample taken from the National Pneumonia Project included 47,429 cases, with an unadjusted 30‐day readmission rate of 17.0%. The final medical record risk‐adjustment model included a total of 35 variables, whose prevalence and association with readmission risk varied modestly (Table 3). Performance of the medical record and administrative models was similar (areas under the ROC curve 0.59 and 0.63, respectively) (Table 4). Additionally, in the administrative model, predicted readmission rates ranged from 8% in the lowest predicted decile to 30% in the highest predicted decile, while in the medical record model, the corresponding rates varied from 10% to 26%.
| Variable | Percent | Estimate | Standard Error | Odds Ratio | 95% CI | |
|---|---|---|---|---|---|---|
| ||||||
| Age 65, mean (SD) | 15.24 (7.87) | 0.003 | 0.002 | 0.997 | 0.993 | 1.000 |
| Male | 46.18 | 0.122 | 0.025 | 1.130 | 1.075 | 1.188 |
| Nursing home resident | 17.71 | 0.035 | 0.037 | 1.036 | 0.963 | 1.114 |
| Neoplastic disease | 6.80 | 0.130 | 0.049 | 1.139 | 1.034 | 1.254 |
| Liver disease | 1.04 | 0.089 | 0.123 | 0.915 | 0.719 | 1.164 |
| History of heart failure | 28.98 | 0.234 | 0.029 | 1.264 | 1.194 | 1.339 |
| History of renal disease | 8.51 | 0.188 | 0.047 | 1.206 | 1.100 | 1.323 |
| Altered mental status | 17.95 | 0.009 | 0.034 | 1.009 | 0.944 | 1.080 |
| Pleural effusion | 21.20 | 0.165 | 0.030 | 1.179 | 1.111 | 1.251 |
| BUN 30 mg/dl | 23.28 | 0.160 | 0.033 | 1.174 | 1.100 | 1.252 |
| BUN missing | 14.56 | 0.101 | 0.185 | 0.904 | 0.630 | 1.298 |
| Systolic BP <90 mmHg | 2.95 | 0.068 | 0.070 | 1.070 | 0.932 | 1.228 |
| Systolic BP missing | 11.21 | 0.149 | 0.425 | 1.160 | 0.504 | 2.669 |
| Pulse 125/min | 7.73 | 0.036 | 0.047 | 1.036 | 0.945 | 1.137 |
| Pulse missing | 11.22 | 0.210 | 0.405 | 1.234 | 0.558 | 2.729 |
| Respiratory rate 30/min | 16.38 | 0.079 | 0.034 | 1.082 | 1.012 | 1.157 |
| Respiratory rate missing | 11.39 | 0.204 | 0.240 | 1.226 | 0.765 | 1.964 |
| Sodium <130 mmol/L | 4.82 | 0.136 | 0.057 | 1.145 | 1.025 | 1.280 |
| Sodium missing | 14.39 | 0.049 | 0.143 | 1.050 | 0.793 | 1.391 |
| Glucose 250 mg/dl | 5.19 | 0.005 | 0.057 | 0.995 | 0.889 | 1.114 |
| Glucose missing | 15.44 | 0.156 | 0.105 | 0.855 | 0.696 | 1.051 |
| Hematocrit <30% | 7.77 | 0.270 | 0.044 | 1.310 | 1.202 | 1.428 |
| Hematocrit missing | 13.62 | 0.071 | 0.135 | 0.932 | 0.715 | 1.215 |
| Creatinine 2.5 mg/dL | 4.68 | 0.109 | 0.062 | 1.115 | 0.989 | 1.258 |
| Creatinine missing | 14.63 | 0.200 | 0.167 | 1.221 | 0.880 | 1.695 |
| WBC 6‐12 b/L | 38.04 | 0.021 | 0.049 | 0.979 | 0.889 | 1.079 |
| WBC >12 b/L | 41.45 | 0.068 | 0.049 | 0.934 | 0.848 | 1.029 |
| WBC missing | 12.85 | 0.167 | 0.162 | 1.181 | 0.860 | 1.623 |
| Immunosuppressive therapy | 15.01 | 0.347 | 0.035 | 1.415 | 1.321 | 1.516 |
| Chronic lung disease | 42.16 | 0.137 | 0.028 | 1.147 | 1.086 | 1.211 |
| Coronary artery disease | 39.57 | 0.150 | 0.028 | 1.162 | 1.100 | 1.227 |
| Diabetes mellitus | 20.90 | 0.137 | 0.033 | 1.147 | 1.076 | 1.223 |
| Alcohol/drug abuse | 3.40 | 0.099 | 0.071 | 0.906 | 0.788 | 1.041 |
| Dementia/Alzheimer's disease | 16.38 | 0.125 | 0.038 | 1.133 | 1.052 | 1.222 |
| Splenectomy | 0.44 | 0.016 | 0.186 | 1.016 | 0.706 | 1.463 |
| Model | Calibration (0, 1)* | Discrimination | Residuals Lack of Fit (Pearson Residual Fall %) | Model 2 (No. of Covariates) | ||||
|---|---|---|---|---|---|---|---|---|
| Predictive Ability (Lowest Decile, Highest Decile) | AUC | (<2) | (2, 0) | (0, 2) | (2+) | |||
| ||||||||
| Medical Record Model Development Sample (NP) | ||||||||
| N = 47,429 No. of 30‐day readmissions = 8,042 | (1, 0) | (0.10, 0.26) | 0.59 | 0 | 83.04 | 5.28 | 11.68 | 710 (35) |
| Linked Administrative Model Validation Sample | ||||||||
| N = 47,429 No. of 30‐day readmissions = 8,042 | (1, 0) | (0.08, 0.30) | 0.63 | 0 | 83.04 | 6.94 | 10.01 | 1,414 (40) |
The correlation coefficient of the estimated state‐specific standardized readmission rates from the administrative and medical record models was 0.96, and the proportion of the variance explained by the model was 0.92 (Figure 4).
DISCUSSION
We have described the development, validation, and results of a hospital, 30‐day, risk‐standardized readmission model for pneumonia that was created to support current federal transparency initiatives. The model uses administrative claims data from Medicare fee‐for‐service patients and produces results that are comparable to a model based on information obtained through manual abstraction of medical records. We observed an overall 30‐day readmission rate of 17%, and our analyses revealed substantial variation across US hospitals, suggesting that improvement by lower performing institutions is an achievable goal.
Because more than one in six pneumonia patients are rehospitalized shortly after discharge, and because pneumonia hospitalizations represent an enormous expense to the Medicare program, prevention of readmissions is now widely recognized to offer a substantial opportunity to improve patient outcomes while simultaneously lowering health care costs. Accordingly, promotion of strategies to reduce readmission rates has become a key priority for payers and quality‐improvement organizations. These range from policy‐level attempts to stimulate change, such as publicly reporting hospital readmission rates on government websites, to establishing accreditation standardssuch as the Joint Commission's requirement to accurately reconcile medications, to the creation of quality improvement collaboratives focused on sharing best practices across institutions. Regardless of the approach taken, a valid, risk‐adjusted measure of performance is required to evaluate and track performance over time. The measure we have described meets the National Quality Forum's measure evaluation criteria in that it addresses an important clinical topic for which there appears to be significant opportunities for improvement, the measure is precisely defined and has been subjected to validity and reliability testing, it is risk‐adjusted based on patient clinical factors present at the start of care, is feasible to produce, and is understandable by a broad range of potential users.21 Because hospitalists are the physicians primarily responsible for the care of patients with pneumonia at US hospitals, and because they frequently serve as the physician champions for quality improvement activities related to pneumonia, it is especially important that they maintain a thorough understanding of the measures and methodologies underlying current efforts to measure hospital performance.
Several features of our approach warrant additional comment. First, we deliberately chose to measure all readmission events rather than attempt to discriminate between potentially preventable and nonpreventable readmissions. From the patient perspective, readmission for any reason is a concern, and limiting the measure to pneumonia‐related readmissions could make it susceptible to gaming by hospitals. Moreover, determining whether a readmission is related to a potential quality problem is not straightforward. For example, a patient with pneumonia whose discharge medications were prescribed incorrectly may be readmitted with a hip fracture following an episode of syncope. It would be inappropriate to treat this readmission as unrelated to the care the patient received for pneumonia. Additionally, while our approach does not presume that every readmission is preventable, the goal is to reduce the risk of readmissions generally (not just in narrowly defined subpopulations), and successful interventions to reduce rehospitalization have typically demonstrated reductions in all‐cause readmission.9, 22 Second, deaths that occurred within 30 days of discharge, yet that were not accompanied by a hospital readmission, were not counted as a readmission outcome. While it may seem inappropriate to treat a postdischarge death as a nonevent (rather than censoring or excluding such cases), alternative analytic approaches, such as using a hierarchical survival model, are not currently computationally feasible with large national data sets. Fortunately, only a relatively small proportion of discharges fell into this category (5.2% of index cases in the 2006 development sample died within 30 days of discharge without being readmitted). An alternative approach to handling the competing outcome of death would have been to use a composite outcome of readmission or death. However, we believe that it is important to report the outcomes separately because factors that predict readmission and mortality may differ, and when making comparisons across hospitals it would not be possible to determine whether differences in rate were due to readmission or mortality. Third, while the patient‐level readmission model showed only modest discrimination, we intentionally excluded covariates such as race and socioeconomic status, as well as in‐hospital events and potential complications of care, and whether patients were discharged home or to a skilled nursing facility. While these variables could have improved predictive ability, they may be directly or indirectly related to quality or supply factors that should not be included in a model that seeks to control for patient clinical characteristics. For example, if hospitals with a large share of poor patients have higher readmission rates, then including income in the model will obscure differences that are important to identify. While we believe that the decision to exclude such factors in the model is in the best interest of patients, and supports efforts to reduce health inequality in society more generally, we also recognize that hospitals that care for a disproportionate share of poor patients are likely to require additional resources to overcome these social factors. Fourth, we limited the analysis to patients with a principal diagnosis of pneumonia, and chose not to also include those with a principal diagnosis of sepsis or respiratory failure coupled with a secondary diagnosis of pneumonia. While the broader definition is used by CMS in the National Pneumonia Project, that initiative relied on chart abstraction to differentiate pneumonia present at the time of admission from cases developing as a complication of hospitalization. Additionally, we did not attempt to differentiate between community‐acquired and healthcare‐associated pneumonia, however our approach is consistent with the National Pneumonia Project and Pneumonia Patient Outcomes Research Team.18 Fifth, while our model estimates readmission rates at the hospital level, we recognize that readmissions are influenced by a complex and extensive range of factors. In this context, greater cooperation between hospitals and other care providers will almost certainly be required in order to achieve dramatic improvement in readmission rates, which in turn will depend upon changes to the way serious illness is paid for. Some options that have recently been described include imposing financial penalties for early readmission, extending the boundaries of case‐based payment beyond hospital discharge, and bundling payments between hospitals and physicians.2325
Our measure has several limitations. First, our models were developed and validated using Medicare data, and the results may not apply to pneumonia patients less than 65 years of age. However, most patients hospitalized with pneumonia in the US are 65 or older. In addition, we were unable to test the model with a Medicare managed care population, because data are not currently available on such patients. Finally, the medical record‐based validation was conducted by state‐level analysis because the sample size was insufficient to carry this out at the hospital level.
In conclusion, more than 17% of Medicare beneficiaries are readmitted within 30 days following discharge after a hospitalization for pneumonia, and rates vary substantially across institutions. The development of a valid measure of hospital performance and public reporting are important first steps towards focusing attention on this problem. Actual improvement will now depend on whether hospitals and partner organizations are successful at identifying and implementing effective methods to prevent readmission.
- ,,.Rehospitalizations among patients in the Medicare Fee‐for‐Service Program.N Engl J Med.2009;360(14):1418–1428.
- Medicare Payment Advisory Commission.Report to the Congress: Promoting Greater Efficiency in Medicare.2007.
- ,,,,. HCUP Facts and Figures: Statistics on Hospital‐based Care in the United States, 2007.2009. Available at: http://www.hcup‐us.ahrq.gov/reports.jsp. Accessed November 7, 2009.
- Centers for Medicare 353(3):255–264.
- ,,,.Trends in postdischarge mortality and readmissions: has length of stay declined too far?Arch Intern Med.2004;164(5):538–544.
- ,,,.Short‐term outcomes and their predictors for patients hospitalized with community‐acquired pneumonia.Heart Lung.2004;33(5):301–307.
- ,,, et al.Improved clinical outcomes with utilization of a community‐acquired pneumonia guideline.Chest.2006;130(3):794–799.
- ,,,,.Associations between initial antimicrobial therapy and medical outcomes for hospitalized elderly patients with pneumonia.Arch Intern Med.1999;159(21):2562–2572.
- ,.Hospital readmissions as a measure of quality of health care: advantages and limitations.Arch Intern Med.2000;160(8):1074–1081.
- ,,,.The care transitions intervention: results of a randomized controlled trial.Arch Intern Med.2006;166(17):1822–1828.
- Corrigan JM, Eden J, Smith BM, eds.Leadership by Example: Coordinating Government Roles in Improving Health Care Quality. Committee on Enhancing Federal Healthcare Quality Programs.Washington, DC:National Academies Press,2003.
- Medicare.gov—Hospital Compare. Available at: http://www.hospitalcompare.hhs.gov/Hospital/Search/Welcome.asp?version=default1(1):29–37.
- ,,,,.Measuring performance for treating heart attacks and heart failure: the case for outcomes measurement.Health Aff.2007;26(1):75–85.
- NQF‐Endorsed® Standards. Available at: http://www.qualityforum.org/Measures_List.aspx. Accessed November 6,2009.
- ,,,,.Timing of antibiotic administration and outcomes for Medicare patients hospitalized with community‐acquired pneumonia.Arch Intern Med.2004;164(6):637–644.
- ,,. Diagnostic Cost Group Hierarchical Condition Category Models for Medicare Risk Adjustment. Report prepared for the Health Care Financing Administration. Health Economics Research, Inc;2000. Available at: http://www.cms.hhs.gov/Reports/Reports/ItemDetail.asp?ItemID=CMS023176. Accessed November 7, 2009.
- .Regression Modeling Strategies: With Applications to Linear Models, Logistic Regression, and Survival Analysis.1st ed.New York:Springer;2006.
- National Quality Forum—Measure Evaluation Criteria.2008. Available at: http://www.qualityforum.org/uploadedFiles/Quality_Forum/Measuring_Performance/Consensus_Development_Process%E2%80%99s_Principle/EvalCriteria2008–08‐28Final.pdf?n=4701.
- ,,, et al.Comprehensive discharge planning and home follow‐up of hospitalized elders: a randomized clinical trial.JAMA.1999;281(7):613–620.
- .Paying for care episodes and care coordination.N Engl J Med.2007;356(11):1166–1168.
- .Health care reform—toward more freedom, and responsibility, for physicians.N Engl J Med.2009;361(6):623–628.
- .Beyond pay for performance—emerging models of provider‐payment reform.N Engl J Med.2008;359(12):1197–1200.
Copyright © 2010 Society of Hospital Medicine
