User login
Pneumonia results in some 1.2 million hospital admissions each year in the United States, is the second leading cause of hospitalization among patients over 65, and accounts for more than $10 billion annually in hospital expenditures.1, 2 As a result of complex demographic and clinical forces, including an aging population, increasing prevalence of comorbidities, and changes in antimicrobial resistance patterns, between the periods 1988 to 1990 and 2000 to 2002 the number of patients hospitalized for pneumonia grew by 20%, and pneumonia was the leading infectious cause of death.3, 4
Given its public health significance, pneumonia has been the subject of intensive quality measurement and improvement efforts for well over a decade. Two of the largest initiatives are the Centers for Medicare & Medicaid Services (CMS) National Pneumonia Project and The Joint Commission ORYX program.5, 6 These efforts have largely entailed measuring hospital performance on pneumonia‐specific processes of care, such as whether blood oxygen levels were assessed, whether blood cultures were drawn before antibiotic treatment was initiated, the choice and timing of antibiotics, and smoking cessation counseling and vaccination at the time of discharge. While measuring processes of care (especially when they are based on sound evidence), can provide insights about quality, and can help guide hospital improvement efforts, these measures necessarily focus on a narrow spectrum of the overall care provided. Outcomes can complement process measures by directing attention to the results of care, which are influenced by both measured and unmeasured factors, and which may be more relevant from the patient's perspective.79
In 2008 CMS expanded its public reporting initiatives by adding risk‐standardized hospital mortality rates for pneumonia to the Hospital Compare website (
Methods
Design, Setting, Subjects
We conducted a cross‐sectional study at the hospital level of the outcomes of care of fee‐for‐service patients hospitalized for pneumonia between July 2006 and June 2009. Patients are eligible to be included in the measures if they are 65 years or older, have a principal diagnosis of pneumonia (International Classification of Diseases, Ninth Revision, Clinical Modification codes 480.X, 481, 482.XX, 483.X, 485, 486, and 487.0), and are cared for at a nonfederal acute care hospital in the US and its organized territories, including Puerto Rico, Guam, the US Virgin Islands, and the Northern Mariana Islands.
The mortality measure excludes patients enrolled in the Medicare hospice program in the year prior to, or on the day of admission, those in whom pneumonia is listed as a secondary diagnosis (to eliminate cases resulting from complications of hospitalization), those discharged against medical advice, and patients who are discharged alive but whose length of stay in the hospital is less than 1 day (because of concerns about the accuracy of the pneumonia diagnosis). Patients are also excluded if their administrative records for the period of analysis (1 year prior to hospitalization and 30 days following discharge) were not available or were incomplete, because these are needed to assess comorbid illness and outcomes. The readmission measure is similar, but does not exclude patients on the basis of hospice program enrollment (because these patients have been admitted and readmissions for hospice patients are likely unplanned events that can be measured and reduced), nor on the basis of hospital length of stay (because patients discharged within 24 hours may be at a heightened risk of readmission).11, 12
Information about patient comorbidities is derived from diagnoses recorded in the year prior to the index hospitalization as found in Medicare inpatient, outpatient, and carrier (physician) standard analytic files. Comorbidities are identified using the Condition Categories of the Hierarchical Condition Category grouper, which sorts the more than 15,000 possible diagnostic codes into 189 clinically‐coherent conditions and which was originally developed to support risk‐adjusted payments within Medicare managed care.13
Outcomes
The patient outcomes assessed include death from any cause within 30 days of admission and readmission for any cause within 30 days of discharge. All‐cause, rather than disease‐specific, readmission was chosen because hospital readmission as a consequence of suboptimal inpatient care or discharge coordination may manifest in many different diagnoses, and no validated method is available to distinguish related from unrelated readmissions. The measures use the Medicare Enrollment Database to determine mortality status, and acute care hospital inpatient claims are used to identify readmission events. For patients with multiple hospitalizations during the study period, the mortality measure randomly selects one hospitalization to use for determination of mortality. Admissions that are counted as readmissions (i.e., those that occurred within 30 days of discharge following hospitalization for pneumonia) are not also treated as index hospitalizations. In the case of patients who are transferred to or from another acute care facility, responsibility for deaths is assigned to the hospital that initially admitted the patient, while responsibility for readmissions is assigned to the hospital that ultimately discharges the patient to a nonacute setting (e.g., home, skilled nursing facilities).
Risk‐Standardization Methods
Hierarchical logistic regression is used to model the log‐odds of mortality or readmission within 30 days of admission or discharge from an index pneumonia admission as a function of patient demographic and clinical characteristics and a random hospital‐specific intercept. This strategy accounts for within‐hospital correlation of the observed outcomes, and reflects the assumption that underlying differences in quality among the hospitals being evaluated lead to systematic differences in outcomes. In contrast to nonhierarchical models which ignore hospital effects, this method attempts to measure the influence of the hospital on patient outcome after adjusting for patient characteristics. Comorbidities from the index admission that could represent potential complications of care are not included in the model unless they are also documented in the 12 months prior to admission. Hospital‐specific mortality and readmission rates are calculated as the ratio of predicted‐to‐expected events (similar to the observed/expected ratio), multiplied by the national unadjusted rate, a form of indirect standardization.
The model for mortality has a c‐statistic of 0.72 whereas a model based on medical record review that was developed for validation purposes had a c‐statistic of 0.77. The model for readmission has a c‐statistic of 0.63 whereas a model based on medical review had a c‐statistic of 0.59. The mortality and readmission models produce similar state‐level mortality and readmission rate estimates as the models derived from medical record review, and can therefore serve as reasonable surrogates. These methods, including their development and validation, have been described fully elsewhere,14, 15 and have been evaluated and subsequently endorsed by the National Quality Forum.16
Identification of Geographic Regions
To characterize patterns of performance geographically we identified the 306 hospital referral regions for each hospital in our analysis using definitions provided by the Dartmouth Atlas of Health Care project. Unlike a hospital‐level analysis, the hospital referral regions represent regional markets for tertiary care and are widely used to summarize variation in medical care inputs, utilization patterns, and health outcomes and provide a more detailed look at variation in outcomes than results at the state level.17
Analyses
Summary statistics were constructed using frequencies and proportions for categorical data, and means, medians and interquartile ranges for continuous variables. To characterize 30‐day risk‐standardized mortality and readmission rates at the hospital‐referral region level, we calculated means and percentiles by weighting each hospital's value by the inverse of the variance of the hospital's estimated rate. Hospitals with larger sample sizes, and therefore more precise estimates, lend more weight to the average. Hierarchical models were estimated using the SAS GLIMMIX procedure. Bayesian shrinkage was used to estimate rates in order to take into account the greater uncertainty in the true rates of hospitals with small caseloads. Using this technique, estimated rates at low volume institutions are shrunken toward the population mean, while hospitals with large caseloads have a relatively smaller amount of shrinkage and the estimate is closer to the hospital's observed rate.18
To determine whether a hospital's performance is significantly different than the national rate we measured whether the 95% interval estimate for the risk‐standardized rate overlapped with the national crude mortality or readmission rate. This information is used to categorize hospitals on Hospital Compare as better than the US national rate, worse than the US national rate, or no different than the US national rate. Hospitals with fewer than 25 cases in the 3‐year period, are excluded from this categorization on Hospital Compare.
Analyses were conducted with the use of SAS 9.1.3 (SAS Institute Inc, Cary, NC). We created the hospital referral region maps using ArcGIS version 9.3 (ESRI, Redlands, CA). The Human Investigation Committee at the Yale School of Medicine approved an exemption for the authors to use CMS claims and enrollment data for research analyses and publication.
Results
Hospital‐Specific Risk‐Standardized 30‐Day Mortality and Readmission Rates
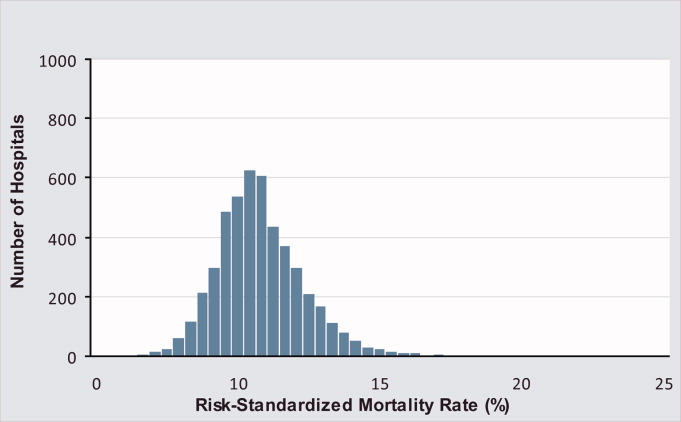
Of the 1,118,583 patients included in the mortality analysis 129,444 (11.6%) died within 30 days of hospital admission. The median (Q1, Q3) hospital 30‐day risk‐standardized mortality rate was 11.1% (10.0%, 12.3%), and ranged from 6.7% to 20.9% (Table 1, Figure 1). Hospitals at the 10th percentile had 30‐day risk‐standardized mortality rates of 9.0% while for those at the 90th percentile of performance the rate was 13.5%. The odds of all‐cause mortality for a patient treated at a hospital that was one standard deviation above the national average was 1.68 times higher than that of a patient treated at a hospital that was one standard deviation below the national average.
| Mortality | Readmission | |
|---|---|---|
| ||
| Patients (n) | 1118583 | 1161817 |
| Hospitals (n) | 4788 | 4813 |
| Patient age, years, median (Q1, Q3) | 81 (74,86) | 80 (74,86) |
| Nonwhite, % | 11.1 | 11.1 |
| Hospital case volume, median (Q1, Q3) | 168 (77,323) | 174 (79,334) |
| Risk‐standardized hospital rate, mean (SD) | 11.2 (1.2) | 18.3 (0.9) |
| Minimum | 6.7 | 13.6 |
| 1st percentile | 7.5 | 14.9 |
| 5th percentile | 8.5 | 15.8 |
| 10th percentile | 9.0 | 16.4 |
| 25th percentile | 10.0 | 17.2 |
| Median | 11.1 | 18.2 |
| 75th percentile | 12.3 | 19.2 |
| 90th percentile | 13.5 | 20.4 |
| 95th percentile | 14.4 | 21.1 |
| 99th percentile | 16.1 | 22.8 |
| Maximum | 20.9 | 26.7 |
| Model fit statistics | ||
| c‐Statistic | 0.72 | 0.63 |
| Intrahospital Correlation | 0.07 | 0.03 |
For the 3‐year period 2006 to 2009, 222 (4.7%) hospitals were categorized as having a mortality rate that was better than the national average, 3968 (83.7%) were no different than the national average, 221 (4.6%) were worse and 332 (7.0%) did not meet the minimum case threshold.
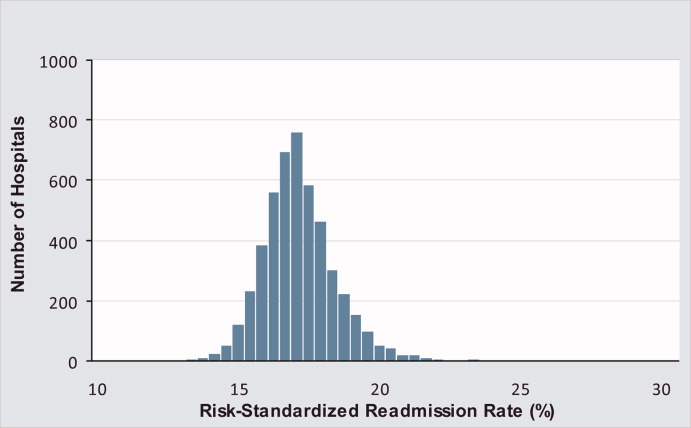
Among the 1,161,817 patients included in the readmission analysis 212,638 (18.3%) were readmitted within 30 days of hospital discharge. The median (Q1,Q3) 30‐day risk‐standardized readmission rate was 18.2% (17.2%, 19.2%) and ranged from 13.6% to 26.7% (Table 1, Figure 2). Hospitals at the 10th percentile had 30‐day risk‐standardized readmission rates of 16.4% while for those at the 90th percentile of performance the rate was 20.4%. The odds of all‐cause readmission for a patient treated at a hospital that was one standard deviation above the national average was 1.40 times higher than the odds of all‐cause readmission if treated at a hospital that was one standard deviation below the national average.
For the 3‐year period 2006 to 2009, 64 (1.3%) hospitals were categorized as having a readmission rate that was better than the national average, 4203 (88.2%) were no different than the national average, 163 (3.4%) were worse and 333 (7.0%) had less than 25 cases and were therefore not categorized.
While risk‐standardized readmission rates were substantially higher than risk‐standardized mortality rates, mortality rates varied more. For example, the top 10% of hospitals had a relative mortality rate that was 33% lower than those in the bottom 10%, as compared with just a 20% relative difference for readmission rates. The coefficient of variation, a normalized measure of dispersion that unlike the standard deviation is independent of the population mean, was 10.7 for risk‐standardized mortality rates and 4.9 for readmission rates.
Regional Risk‐Standardized 30‐Day Mortality and Readmission Rates
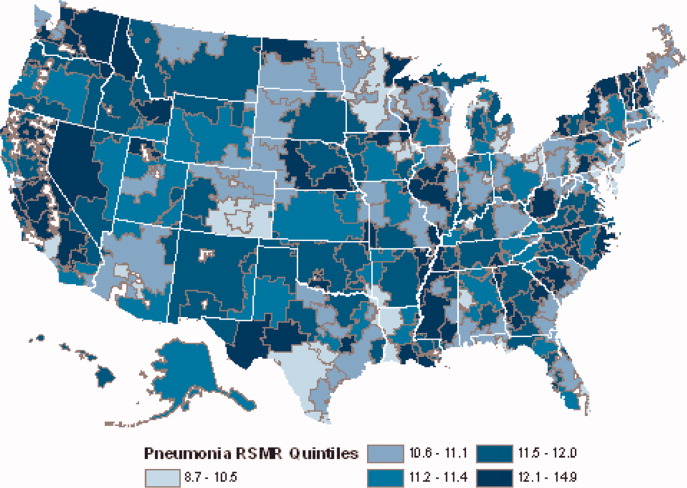
Figures 3 and 4 show the distribution of 30‐day risk‐standardized mortality and readmission rates among hospital referral regions by quintile. Highest mortality regions were found across the entire country, including parts of Northern New England, the Mid and South Atlantic, East and the West South Central, East and West North Central, and the Mountain and Pacific regions of the West. The lowest mortality rates were observed in Southern New England, parts of the Mid and South Atlantic, East and West South Central, and parts of the Mountain and Pacific regions of the West (Figure 3).
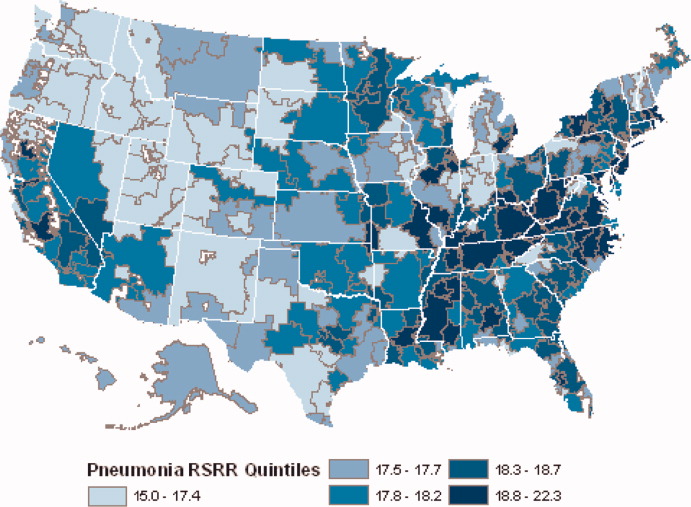
Readmission rates were higher in the eastern portions of the US (including the Northeast, Mid and South Atlantic, East South Central) as well as the East North Central, and small parts of the West North Central portions of the Midwest and in Central California. The lowest readmission rates were observed in the West (Mountain and Pacific regions), parts of the Midwest (East and West North Central) and small pockets within the South and Northeast (Figure 4).
Discussion
In this 3‐year analysis of patient, hospital, and regional outcomes we observed that pneumonia in the elderly remains a highly morbid illness, with a 30‐day mortality rate of approximately 11.6%. More notably we observed that risk‐standardized mortality rates, and to a lesser extent readmission rates, vary significantly across hospitals and regions. Finally, we observed that readmission rates, but not mortality rates, show strong geographic concentration.
These findings suggest possible opportunities to save or extend the lives of a substantial number of Americans, and to reduce the burden of rehospitalization on patients and families, if low performing institutions were able to achieve the performance of those with better outcomes. Additionally, because readmission is so common (nearly 1 in 5 patients), efforts to reduce overall health care spending should focus on this large potential source of savings.19 In this regard, impending changes in payment to hospitals around readmissions will change incentives for hospitals and physicians that may ultimately lead to lower readmission rates.20
Previous analyses of the quality of hospital care for patients with pneumonia have focused on the percentage of eligible patients who received guideline‐recommended antibiotics within a specified time frame (4 or 8 hours), and vaccination prior to hospital discharge.21, 22 These studies have highlighted large differences across hospitals and states in the percentage receiving recommended care. In contrast, the focus of this study was to compare risk‐standardized outcomes of care at the nation's hospitals and across its regions. This effort was guided by the notion that the measurement of care outcomes is an important complement to process measurement because outcomes represent a more holistic assessment of care, that an outcomes focus offers hospitals greater autonomy in terms of what processes to improve, and that outcomes are ultimately more meaningful to patients than the technical aspects of how the outcomes were achieved. In contrast to these earlier process‐oriented efforts, the magnitude of the differences we observed in mortality and readmission rates across hospitals was not nearly as large.
A recent analysis of the outcomes of care for patients with heart failure and acute myocardial infarction also found significant variation in both hospital and regional mortality and readmission rates.23 The relative differences in risk‐standardized hospital mortality rates across the 10th to 90th percentiles of hospital performance was 25% for acute myocardial infarction, and 39% for heart failure. By contrast, we found that the difference in risk‐standardized hospital mortality rates across the 10th to 90th percentiles in pneumonia was an even greater 50% (13.5% vs. 9.0%). Similar to the findings in acute myocardial infarction and heart failure, we observed that risk‐standardized mortality rates varied more so than did readmission rates.
Our study has a number of limitations. First, the analysis was restricted to Medicare patients only, and our findings may not be generalizable to younger patients. Second, our risk‐adjustment methods relied on claims data, not clinical information abstracted from charts. Nevertheless, we assessed comorbidities using all physician and hospital claims from the year prior to the index admission. Additionally our mortality and readmission models were validated against those based on medical record data and the outputs of the 2 approaches were highly correlated.15, 24, 25 Our study was restricted to patients with a principal diagnosis of pneumonia, and we therefore did not include those whose principal diagnosis was sepsis or respiratory failure and who had a secondary diagnosis of pneumonia. While this decision was made to reduce the risk of misclassifying complications of care as the reason for admission, we acknowledge that this is likely to have limited our study to patients with less severe disease, and may have introduced bias related to differences in hospital coding practices regarding the use of sepsis and respiratory failure codes. While we excluded patients with 1 day length of stay from the mortality analysis to reduce the risk of including patients in the measure who did not actually have pneumonia, we did not exclude them from the readmission analysis because very short length of stay may be a risk factor for readmission. An additional limitation of our study is that our findings are primarily descriptive, and we did not attempt to explain the sources of the variation we observed. For example, we did not examine the extent to which these differences might be explained by differences in adherence to process measures across hospitals or regions. However, if the experience in acute myocardial infarction can serve as a guide, then it is unlikely that more than a small fraction of the observed variation in outcomes can be attributed to factors such as antibiotic timing or selection.26 Additionally, we cannot explain why readmission rates were more geographically distributed than mortality rates, however it is possible that this may be related to the supply of physicians or hospital beds.27 Finally, some have argued that mortality and readmission rates do not necessarily reflect the very quality they intend to measure.2830
The outcomes of patients with pneumonia appear to be significantly influenced by both the hospital and region where they receive care. Efforts to improve population level outcomes might be informed by studying the practices of hospitals and regions that consistently achieve high levels of performance.31
Acknowledgements
The authors thank Sandi Nelson, Eric Schone, and Marian Wrobel at Mathematicia Policy Research and Changquin Wang and Jinghong Gao at YNHHS/Yale CORE for analytic support. They also acknowledge Shantal Savage, Kanchana Bhat, and Mayur M. Desai at Yale, Joseph S. Ross at the Mount Sinai School of Medicine, and Shaheen Halim at the Centers for Medicare and Medicaid Services.
- , , , , . HCUP Facts and Figures: Statistics on Hospital‐based Care in the United States, 2007 [Internet]. 2009 [cited 2009 Nov 7]. Available at: http://www.hcup‐us.ahrq.gov/reports.jsp. Accessed June2010.
- Agency for Healthcare Research and Quality. HCUP Nationwide Inpatient Sample (NIS). Healthcare Cost and Utilization Project (HCUP). [Internet]. 2007 [cited 2010 May 13]. Available at: http://www.hcup‐us.ahrq.gov/nisoverview.jsp. Accessed June2010.
- , , , , .Trends in hospitalizations for pneumonia among persons aged 65 years or older in the United States, 1988‐2002.JAMA.20057;294(21):2712–2719.
- . Deaths: Leading Causes for 2006. NVSS [Internet]. 2010 Mar 31;58(14). Available at: http://www.cdc.gov/nchs/data/nvsr/nvsr58/nvsr58_ 14.pdf. Accessed June2010.
- Centers for Medicare and Medicaid Services. Pneumonia [Internet]. [cited 2010 May 13]. Available at: http://www.qualitynet.org/dcs/ContentServer?cid= 108981596702326(1):75–85.
- , , .Performance measures for pneumonia: are they valuable, and are process measures adequate?Curr Opin Infect Dis.2007;20(2):182–189.
- , .Relationship Between Medicare's Hospital Compare Performance Measures and Mortality Rates.JAMA.2006;296(22):2694–2702.
- Medicare.gov ‐ Hospital Compare [Internet]. [cited 2009 Nov 6]. Available at: http://www.hospitalcompare.hhs.gov/Hospital/Search/Welcome.asp? version=default 2010. Available at: http://www.qualitynet.org/dcs/ContentServer? c=Page 2010. Available at: http://www.qualitynet.org/dcs/ContentServer? c=Page 2000 [cited 2009 Nov 7]. Available at: http://www.cms.hhs.gov/Reports/Reports/ItemDetail.asp?ItemID=CMS023176. Accessed June2010.
- , , , et al. Risk‐Adjustment Methodology for Hospital Monitoring/Surveillance and Public Reporting Supplement #1: 30‐Day Mortality Model for Pneumonia [Internet]. Yale University; 2006. Available at: http://www.qualitynet.org/dcs/ContentServer?c= Page 2008. Available at: http://www.qualitynet.org/dcs/ContentServer?c= Page1999.
- , .Statistical and clinical aspects of hospital outcomes profiling.Stat Sci.2007;22(2):206–226.
- Medicare Payment Advisory Commission. Report to the Congress: Promoting Greater Efficiency in Medicare.2007 June.
- Patient Protection and Affordable Care Act [Internet]. 2010. Available at: http://thomas.loc.gov. Accessed June2010.
- , , , et al.Quality of medical care delivered to medicare beneficiaries: a profile at state and national levels.JAMA.2000;284(13):1670–1676.
- , , , .Care in U.S. hospitals — the hospital quality alliance program.N Engl J Med.2005;353(3):265–274.
- , , , et al.Patterns of hospital performance in acute myocardial infarction and heart failure 30‐day mortality and readmission.Circ Cardiovasc Qual Outcomes.2009;2(5):407–413.
- , , , et al.An administrative claims model suitable for profiling hospital performance based on 30‐day mortality rates among patients with heart failure.Circulation.2006;113(13):1693–1701.
- , , , et al.An administrative claims model suitable for profiling hospital performance based on 30‐day mortality rates among patients with an acute myocardial infarction.Circulation.2006;113(13):1683–1692.
- , , , et al.Hospital quality for acute myocardial infarction: correlation among process measures and relationship with short‐term mortality.JAMA.2006;296(1):72–78.
- , , , .Hospital readmission rates for cohorts of medicare beneficiaries in Boston and New Haven.N Engl J Med.1994;331(15):989–995.
- , .Research evidence on the validity of risk‐adjusted mortality rate as a measure of hospital quality of care.Med Care Res Rev.1998;55(4):371–404.
- , .Hospital readmissions as a measure of quality of health care: advantages and limitations.Arch Intern Med.2000;160(8):1074–1081.
- , .Hospital mortality: when failure is not a good measure of success.CMAJ.2008;179(2):153–157.
- , , , , , .Research in action: using positive deviance to improve quality of health care.Implement Sci.2009;4:25.
Pneumonia results in some 1.2 million hospital admissions each year in the United States, is the second leading cause of hospitalization among patients over 65, and accounts for more than $10 billion annually in hospital expenditures.1, 2 As a result of complex demographic and clinical forces, including an aging population, increasing prevalence of comorbidities, and changes in antimicrobial resistance patterns, between the periods 1988 to 1990 and 2000 to 2002 the number of patients hospitalized for pneumonia grew by 20%, and pneumonia was the leading infectious cause of death.3, 4
Given its public health significance, pneumonia has been the subject of intensive quality measurement and improvement efforts for well over a decade. Two of the largest initiatives are the Centers for Medicare & Medicaid Services (CMS) National Pneumonia Project and The Joint Commission ORYX program.5, 6 These efforts have largely entailed measuring hospital performance on pneumonia‐specific processes of care, such as whether blood oxygen levels were assessed, whether blood cultures were drawn before antibiotic treatment was initiated, the choice and timing of antibiotics, and smoking cessation counseling and vaccination at the time of discharge. While measuring processes of care (especially when they are based on sound evidence), can provide insights about quality, and can help guide hospital improvement efforts, these measures necessarily focus on a narrow spectrum of the overall care provided. Outcomes can complement process measures by directing attention to the results of care, which are influenced by both measured and unmeasured factors, and which may be more relevant from the patient's perspective.79
In 2008 CMS expanded its public reporting initiatives by adding risk‐standardized hospital mortality rates for pneumonia to the Hospital Compare website (
Methods
Design, Setting, Subjects
We conducted a cross‐sectional study at the hospital level of the outcomes of care of fee‐for‐service patients hospitalized for pneumonia between July 2006 and June 2009. Patients are eligible to be included in the measures if they are 65 years or older, have a principal diagnosis of pneumonia (International Classification of Diseases, Ninth Revision, Clinical Modification codes 480.X, 481, 482.XX, 483.X, 485, 486, and 487.0), and are cared for at a nonfederal acute care hospital in the US and its organized territories, including Puerto Rico, Guam, the US Virgin Islands, and the Northern Mariana Islands.
The mortality measure excludes patients enrolled in the Medicare hospice program in the year prior to, or on the day of admission, those in whom pneumonia is listed as a secondary diagnosis (to eliminate cases resulting from complications of hospitalization), those discharged against medical advice, and patients who are discharged alive but whose length of stay in the hospital is less than 1 day (because of concerns about the accuracy of the pneumonia diagnosis). Patients are also excluded if their administrative records for the period of analysis (1 year prior to hospitalization and 30 days following discharge) were not available or were incomplete, because these are needed to assess comorbid illness and outcomes. The readmission measure is similar, but does not exclude patients on the basis of hospice program enrollment (because these patients have been admitted and readmissions for hospice patients are likely unplanned events that can be measured and reduced), nor on the basis of hospital length of stay (because patients discharged within 24 hours may be at a heightened risk of readmission).11, 12
Information about patient comorbidities is derived from diagnoses recorded in the year prior to the index hospitalization as found in Medicare inpatient, outpatient, and carrier (physician) standard analytic files. Comorbidities are identified using the Condition Categories of the Hierarchical Condition Category grouper, which sorts the more than 15,000 possible diagnostic codes into 189 clinically‐coherent conditions and which was originally developed to support risk‐adjusted payments within Medicare managed care.13
Outcomes
The patient outcomes assessed include death from any cause within 30 days of admission and readmission for any cause within 30 days of discharge. All‐cause, rather than disease‐specific, readmission was chosen because hospital readmission as a consequence of suboptimal inpatient care or discharge coordination may manifest in many different diagnoses, and no validated method is available to distinguish related from unrelated readmissions. The measures use the Medicare Enrollment Database to determine mortality status, and acute care hospital inpatient claims are used to identify readmission events. For patients with multiple hospitalizations during the study period, the mortality measure randomly selects one hospitalization to use for determination of mortality. Admissions that are counted as readmissions (i.e., those that occurred within 30 days of discharge following hospitalization for pneumonia) are not also treated as index hospitalizations. In the case of patients who are transferred to or from another acute care facility, responsibility for deaths is assigned to the hospital that initially admitted the patient, while responsibility for readmissions is assigned to the hospital that ultimately discharges the patient to a nonacute setting (e.g., home, skilled nursing facilities).
Risk‐Standardization Methods
Hierarchical logistic regression is used to model the log‐odds of mortality or readmission within 30 days of admission or discharge from an index pneumonia admission as a function of patient demographic and clinical characteristics and a random hospital‐specific intercept. This strategy accounts for within‐hospital correlation of the observed outcomes, and reflects the assumption that underlying differences in quality among the hospitals being evaluated lead to systematic differences in outcomes. In contrast to nonhierarchical models which ignore hospital effects, this method attempts to measure the influence of the hospital on patient outcome after adjusting for patient characteristics. Comorbidities from the index admission that could represent potential complications of care are not included in the model unless they are also documented in the 12 months prior to admission. Hospital‐specific mortality and readmission rates are calculated as the ratio of predicted‐to‐expected events (similar to the observed/expected ratio), multiplied by the national unadjusted rate, a form of indirect standardization.
The model for mortality has a c‐statistic of 0.72 whereas a model based on medical record review that was developed for validation purposes had a c‐statistic of 0.77. The model for readmission has a c‐statistic of 0.63 whereas a model based on medical review had a c‐statistic of 0.59. The mortality and readmission models produce similar state‐level mortality and readmission rate estimates as the models derived from medical record review, and can therefore serve as reasonable surrogates. These methods, including their development and validation, have been described fully elsewhere,14, 15 and have been evaluated and subsequently endorsed by the National Quality Forum.16
Identification of Geographic Regions
To characterize patterns of performance geographically we identified the 306 hospital referral regions for each hospital in our analysis using definitions provided by the Dartmouth Atlas of Health Care project. Unlike a hospital‐level analysis, the hospital referral regions represent regional markets for tertiary care and are widely used to summarize variation in medical care inputs, utilization patterns, and health outcomes and provide a more detailed look at variation in outcomes than results at the state level.17
Analyses
Summary statistics were constructed using frequencies and proportions for categorical data, and means, medians and interquartile ranges for continuous variables. To characterize 30‐day risk‐standardized mortality and readmission rates at the hospital‐referral region level, we calculated means and percentiles by weighting each hospital's value by the inverse of the variance of the hospital's estimated rate. Hospitals with larger sample sizes, and therefore more precise estimates, lend more weight to the average. Hierarchical models were estimated using the SAS GLIMMIX procedure. Bayesian shrinkage was used to estimate rates in order to take into account the greater uncertainty in the true rates of hospitals with small caseloads. Using this technique, estimated rates at low volume institutions are shrunken toward the population mean, while hospitals with large caseloads have a relatively smaller amount of shrinkage and the estimate is closer to the hospital's observed rate.18
To determine whether a hospital's performance is significantly different than the national rate we measured whether the 95% interval estimate for the risk‐standardized rate overlapped with the national crude mortality or readmission rate. This information is used to categorize hospitals on Hospital Compare as better than the US national rate, worse than the US national rate, or no different than the US national rate. Hospitals with fewer than 25 cases in the 3‐year period, are excluded from this categorization on Hospital Compare.
Analyses were conducted with the use of SAS 9.1.3 (SAS Institute Inc, Cary, NC). We created the hospital referral region maps using ArcGIS version 9.3 (ESRI, Redlands, CA). The Human Investigation Committee at the Yale School of Medicine approved an exemption for the authors to use CMS claims and enrollment data for research analyses and publication.
Results
Hospital‐Specific Risk‐Standardized 30‐Day Mortality and Readmission Rates
Of the 1,118,583 patients included in the mortality analysis 129,444 (11.6%) died within 30 days of hospital admission. The median (Q1, Q3) hospital 30‐day risk‐standardized mortality rate was 11.1% (10.0%, 12.3%), and ranged from 6.7% to 20.9% (Table 1, Figure 1). Hospitals at the 10th percentile had 30‐day risk‐standardized mortality rates of 9.0% while for those at the 90th percentile of performance the rate was 13.5%. The odds of all‐cause mortality for a patient treated at a hospital that was one standard deviation above the national average was 1.68 times higher than that of a patient treated at a hospital that was one standard deviation below the national average.
| Mortality | Readmission | |
|---|---|---|
| ||
| Patients (n) | 1118583 | 1161817 |
| Hospitals (n) | 4788 | 4813 |
| Patient age, years, median (Q1, Q3) | 81 (74,86) | 80 (74,86) |
| Nonwhite, % | 11.1 | 11.1 |
| Hospital case volume, median (Q1, Q3) | 168 (77,323) | 174 (79,334) |
| Risk‐standardized hospital rate, mean (SD) | 11.2 (1.2) | 18.3 (0.9) |
| Minimum | 6.7 | 13.6 |
| 1st percentile | 7.5 | 14.9 |
| 5th percentile | 8.5 | 15.8 |
| 10th percentile | 9.0 | 16.4 |
| 25th percentile | 10.0 | 17.2 |
| Median | 11.1 | 18.2 |
| 75th percentile | 12.3 | 19.2 |
| 90th percentile | 13.5 | 20.4 |
| 95th percentile | 14.4 | 21.1 |
| 99th percentile | 16.1 | 22.8 |
| Maximum | 20.9 | 26.7 |
| Model fit statistics | ||
| c‐Statistic | 0.72 | 0.63 |
| Intrahospital Correlation | 0.07 | 0.03 |
For the 3‐year period 2006 to 2009, 222 (4.7%) hospitals were categorized as having a mortality rate that was better than the national average, 3968 (83.7%) were no different than the national average, 221 (4.6%) were worse and 332 (7.0%) did not meet the minimum case threshold.
Among the 1,161,817 patients included in the readmission analysis 212,638 (18.3%) were readmitted within 30 days of hospital discharge. The median (Q1,Q3) 30‐day risk‐standardized readmission rate was 18.2% (17.2%, 19.2%) and ranged from 13.6% to 26.7% (Table 1, Figure 2). Hospitals at the 10th percentile had 30‐day risk‐standardized readmission rates of 16.4% while for those at the 90th percentile of performance the rate was 20.4%. The odds of all‐cause readmission for a patient treated at a hospital that was one standard deviation above the national average was 1.40 times higher than the odds of all‐cause readmission if treated at a hospital that was one standard deviation below the national average.
For the 3‐year period 2006 to 2009, 64 (1.3%) hospitals were categorized as having a readmission rate that was better than the national average, 4203 (88.2%) were no different than the national average, 163 (3.4%) were worse and 333 (7.0%) had less than 25 cases and were therefore not categorized.
While risk‐standardized readmission rates were substantially higher than risk‐standardized mortality rates, mortality rates varied more. For example, the top 10% of hospitals had a relative mortality rate that was 33% lower than those in the bottom 10%, as compared with just a 20% relative difference for readmission rates. The coefficient of variation, a normalized measure of dispersion that unlike the standard deviation is independent of the population mean, was 10.7 for risk‐standardized mortality rates and 4.9 for readmission rates.
Regional Risk‐Standardized 30‐Day Mortality and Readmission Rates
Figures 3 and 4 show the distribution of 30‐day risk‐standardized mortality and readmission rates among hospital referral regions by quintile. Highest mortality regions were found across the entire country, including parts of Northern New England, the Mid and South Atlantic, East and the West South Central, East and West North Central, and the Mountain and Pacific regions of the West. The lowest mortality rates were observed in Southern New England, parts of the Mid and South Atlantic, East and West South Central, and parts of the Mountain and Pacific regions of the West (Figure 3).
Readmission rates were higher in the eastern portions of the US (including the Northeast, Mid and South Atlantic, East South Central) as well as the East North Central, and small parts of the West North Central portions of the Midwest and in Central California. The lowest readmission rates were observed in the West (Mountain and Pacific regions), parts of the Midwest (East and West North Central) and small pockets within the South and Northeast (Figure 4).
Discussion
In this 3‐year analysis of patient, hospital, and regional outcomes we observed that pneumonia in the elderly remains a highly morbid illness, with a 30‐day mortality rate of approximately 11.6%. More notably we observed that risk‐standardized mortality rates, and to a lesser extent readmission rates, vary significantly across hospitals and regions. Finally, we observed that readmission rates, but not mortality rates, show strong geographic concentration.
These findings suggest possible opportunities to save or extend the lives of a substantial number of Americans, and to reduce the burden of rehospitalization on patients and families, if low performing institutions were able to achieve the performance of those with better outcomes. Additionally, because readmission is so common (nearly 1 in 5 patients), efforts to reduce overall health care spending should focus on this large potential source of savings.19 In this regard, impending changes in payment to hospitals around readmissions will change incentives for hospitals and physicians that may ultimately lead to lower readmission rates.20
Previous analyses of the quality of hospital care for patients with pneumonia have focused on the percentage of eligible patients who received guideline‐recommended antibiotics within a specified time frame (4 or 8 hours), and vaccination prior to hospital discharge.21, 22 These studies have highlighted large differences across hospitals and states in the percentage receiving recommended care. In contrast, the focus of this study was to compare risk‐standardized outcomes of care at the nation's hospitals and across its regions. This effort was guided by the notion that the measurement of care outcomes is an important complement to process measurement because outcomes represent a more holistic assessment of care, that an outcomes focus offers hospitals greater autonomy in terms of what processes to improve, and that outcomes are ultimately more meaningful to patients than the technical aspects of how the outcomes were achieved. In contrast to these earlier process‐oriented efforts, the magnitude of the differences we observed in mortality and readmission rates across hospitals was not nearly as large.
A recent analysis of the outcomes of care for patients with heart failure and acute myocardial infarction also found significant variation in both hospital and regional mortality and readmission rates.23 The relative differences in risk‐standardized hospital mortality rates across the 10th to 90th percentiles of hospital performance was 25% for acute myocardial infarction, and 39% for heart failure. By contrast, we found that the difference in risk‐standardized hospital mortality rates across the 10th to 90th percentiles in pneumonia was an even greater 50% (13.5% vs. 9.0%). Similar to the findings in acute myocardial infarction and heart failure, we observed that risk‐standardized mortality rates varied more so than did readmission rates.
Our study has a number of limitations. First, the analysis was restricted to Medicare patients only, and our findings may not be generalizable to younger patients. Second, our risk‐adjustment methods relied on claims data, not clinical information abstracted from charts. Nevertheless, we assessed comorbidities using all physician and hospital claims from the year prior to the index admission. Additionally our mortality and readmission models were validated against those based on medical record data and the outputs of the 2 approaches were highly correlated.15, 24, 25 Our study was restricted to patients with a principal diagnosis of pneumonia, and we therefore did not include those whose principal diagnosis was sepsis or respiratory failure and who had a secondary diagnosis of pneumonia. While this decision was made to reduce the risk of misclassifying complications of care as the reason for admission, we acknowledge that this is likely to have limited our study to patients with less severe disease, and may have introduced bias related to differences in hospital coding practices regarding the use of sepsis and respiratory failure codes. While we excluded patients with 1 day length of stay from the mortality analysis to reduce the risk of including patients in the measure who did not actually have pneumonia, we did not exclude them from the readmission analysis because very short length of stay may be a risk factor for readmission. An additional limitation of our study is that our findings are primarily descriptive, and we did not attempt to explain the sources of the variation we observed. For example, we did not examine the extent to which these differences might be explained by differences in adherence to process measures across hospitals or regions. However, if the experience in acute myocardial infarction can serve as a guide, then it is unlikely that more than a small fraction of the observed variation in outcomes can be attributed to factors such as antibiotic timing or selection.26 Additionally, we cannot explain why readmission rates were more geographically distributed than mortality rates, however it is possible that this may be related to the supply of physicians or hospital beds.27 Finally, some have argued that mortality and readmission rates do not necessarily reflect the very quality they intend to measure.2830
The outcomes of patients with pneumonia appear to be significantly influenced by both the hospital and region where they receive care. Efforts to improve population level outcomes might be informed by studying the practices of hospitals and regions that consistently achieve high levels of performance.31
Acknowledgements
The authors thank Sandi Nelson, Eric Schone, and Marian Wrobel at Mathematicia Policy Research and Changquin Wang and Jinghong Gao at YNHHS/Yale CORE for analytic support. They also acknowledge Shantal Savage, Kanchana Bhat, and Mayur M. Desai at Yale, Joseph S. Ross at the Mount Sinai School of Medicine, and Shaheen Halim at the Centers for Medicare and Medicaid Services.
- , , , , . HCUP Facts and Figures: Statistics on Hospital‐based Care in the United States, 2007 [Internet]. 2009 [cited 2009 Nov 7]. Available at: http://www.hcup‐us.ahrq.gov/reports.jsp. Accessed June2010.
- Agency for Healthcare Research and Quality. HCUP Nationwide Inpatient Sample (NIS). Healthcare Cost and Utilization Project (HCUP). [Internet]. 2007 [cited 2010 May 13]. Available at: http://www.hcup‐us.ahrq.gov/nisoverview.jsp. Accessed June2010.
- , , , , .Trends in hospitalizations for pneumonia among persons aged 65 years or older in the United States, 1988‐2002.JAMA.20057;294(21):2712–2719.
- . Deaths: Leading Causes for 2006. NVSS [Internet]. 2010 Mar 31;58(14). Available at: http://www.cdc.gov/nchs/data/nvsr/nvsr58/nvsr58_ 14.pdf. Accessed June2010.
- Centers for Medicare and Medicaid Services. Pneumonia [Internet]. [cited 2010 May 13]. Available at: http://www.qualitynet.org/dcs/ContentServer?cid= 108981596702326(1):75–85.
- , , .Performance measures for pneumonia: are they valuable, and are process measures adequate?Curr Opin Infect Dis.2007;20(2):182–189.
- , .Relationship Between Medicare's Hospital Compare Performance Measures and Mortality Rates.JAMA.2006;296(22):2694–2702.
- Medicare.gov ‐ Hospital Compare [Internet]. [cited 2009 Nov 6]. Available at: http://www.hospitalcompare.hhs.gov/Hospital/Search/Welcome.asp? version=default 2010. Available at: http://www.qualitynet.org/dcs/ContentServer? c=Page 2010. Available at: http://www.qualitynet.org/dcs/ContentServer? c=Page 2000 [cited 2009 Nov 7]. Available at: http://www.cms.hhs.gov/Reports/Reports/ItemDetail.asp?ItemID=CMS023176. Accessed June2010.
- , , , et al. Risk‐Adjustment Methodology for Hospital Monitoring/Surveillance and Public Reporting Supplement #1: 30‐Day Mortality Model for Pneumonia [Internet]. Yale University; 2006. Available at: http://www.qualitynet.org/dcs/ContentServer?c= Page 2008. Available at: http://www.qualitynet.org/dcs/ContentServer?c= Page1999.
- , .Statistical and clinical aspects of hospital outcomes profiling.Stat Sci.2007;22(2):206–226.
- Medicare Payment Advisory Commission. Report to the Congress: Promoting Greater Efficiency in Medicare.2007 June.
- Patient Protection and Affordable Care Act [Internet]. 2010. Available at: http://thomas.loc.gov. Accessed June2010.
- , , , et al.Quality of medical care delivered to medicare beneficiaries: a profile at state and national levels.JAMA.2000;284(13):1670–1676.
- , , , .Care in U.S. hospitals — the hospital quality alliance program.N Engl J Med.2005;353(3):265–274.
- , , , et al.Patterns of hospital performance in acute myocardial infarction and heart failure 30‐day mortality and readmission.Circ Cardiovasc Qual Outcomes.2009;2(5):407–413.
- , , , et al.An administrative claims model suitable for profiling hospital performance based on 30‐day mortality rates among patients with heart failure.Circulation.2006;113(13):1693–1701.
- , , , et al.An administrative claims model suitable for profiling hospital performance based on 30‐day mortality rates among patients with an acute myocardial infarction.Circulation.2006;113(13):1683–1692.
- , , , et al.Hospital quality for acute myocardial infarction: correlation among process measures and relationship with short‐term mortality.JAMA.2006;296(1):72–78.
- , , , .Hospital readmission rates for cohorts of medicare beneficiaries in Boston and New Haven.N Engl J Med.1994;331(15):989–995.
- , .Research evidence on the validity of risk‐adjusted mortality rate as a measure of hospital quality of care.Med Care Res Rev.1998;55(4):371–404.
- , .Hospital readmissions as a measure of quality of health care: advantages and limitations.Arch Intern Med.2000;160(8):1074–1081.
- , .Hospital mortality: when failure is not a good measure of success.CMAJ.2008;179(2):153–157.
- , , , , , .Research in action: using positive deviance to improve quality of health care.Implement Sci.2009;4:25.
Copyright © 2010 Society of Hospital Medicine
