User login
The Effect of Hospital Safety Net Status on the Association Between Bundled Payment Participation and Changes in Medical Episode Outcomes
Bundled payments represent one of the most prominent value-based payment arrangements nationwide. Under this payment approach, hospitals assume responsibility for quality and costs across discrete episodes of care. Hospitals that maintain quality while achieving cost reductions are eligible for financial incentives, whereas those that do not are subject to financial penalties.
To date, the largest completed bundled payment program nationwide is Medicare’s Bundled Payments for Care Improvement (BPCI) initiative. Among four different participation models in BPCI, hospital enrollment was greatest in Model 2, in which episodes spanned from hospitalization through 90 days of post–acute care. The overall results from BPCI Model 2 have been positive: hospitals participating in both common surgical episodes, such as joint replacement surgery, and medical episodes, such as acute myocardial infarction (AMI) and congestive heart failure (CHF), have demonstrated long-term financial savings with stable quality performance.1,2
Safety net hospitals that disproportionately serve low-income patients may fare differently than other hospitals under bundled payment models. At baseline, these hospitals typically have fewer financial resources, which may limit their ability to implement measures to standardize care during hospitalization (eg, clinical pathways) or after discharge (eg, postdischarge programs and other strategies to reduce readmissions).3 Efforts to redesign care may be further complicated by greater clinical complexity and social and structural determinants of health among patients seeking care at safety net hospitals. Given the well-known interactions between social determinants and health conditions, these factors are highly relevant for patients hospitalized at safety net hospitals for acute medical events or exacerbations of chronic conditions.
Existing evidence has shown that safety net hospitals have not performed as well as other hospitals in other value-based reforms.4-8 In the context of bundled payments for joint replacement surgery, safety net hospitals have been less likely to achieve financial savings but more likely to receive penalties.9-11 Moreover, the savings achieved by safety net hospitals have been smaller than those achieved by non–safety net hospitals.12
Despite these concerning findings, there are few data about how safety net hospitals have fared under bundled payments for common medical conditions. To address this critical knowledge gap, we evaluated the effect of hospital safety net status on the association between BPCI Model 2 participation and changes in outcomes for medical condition episodes.
METHODS
This study was approved by the University of Pennsylvania Institutional Review Board with a waiver of informed consent.
Data
We used 100% Medicare claims data from 2011 to 2016 for patients receiving care at hospitals participating in BPCI Model 2 for one of four common medical condition episodes: AMI, pneumonia, CHF, and chronic obstructive pulmonary disease (COPD). A 20% random national sample was used for patients hospitalized at nonparticipant hospitals. Publicly available data from the Centers for Medicare & Medicaid Services (CMS) were used to identify hospital enrollment in BPCI Model 2, while data from the 2017 CMS Impact File were used to quantify each hospital’s disproportionate patient percentage (DPP), which reflects the proportion of Medicaid and low-income Medicare beneficiaries served and determines a hospital’s eligibility to earn disproportionate share hospital payments.
Data from the 2011 American Hospital Association Annual Survey were used to capture hospital characteristics, such as number of beds, teaching status, and profit status, while data from the Medicare provider of service, beneficiary summary, and accountable care organization files were used to capture additional hospital characteristics and market characteristics, such as population size and Medicare Advantage penetration. The Medicare Provider Enrollment, Chain, and Ownership System file was used to identify and remove BPCI episodes from physician group practices. State-level data about area deprivation index—a census tract–based measure that incorporates factors such as income, education, employment, and housing quality to describe socioeconomic disadvantage among neighborhoods—were used to define socioeconomically disadvantaged areas as those in the top 20% of area deprivation index statewide.13 Markets were defined using hospital referral regions.14
Study Periods and Hospital Groups
Our analysis spanned the period between January 1, 2011, and December 31, 2016. We separated this period into a baseline period (January 2011–September 2013) prior to the start of BPCI and a subsequent BPCI period (October 2013–December 2016).
We defined any hospitals participating in BPCI Model 2 across this period for any of the four included medical condition episodes as BPCI hospitals. Because hospitals were able to enter or exit BPCI over time, and enrollment data were provided by CMS as quarterly participation files, we were able to identify dates of entry into or exit from BPCI over time by hospital-condition pairs. Hospitals were considered BPCI hospitals until the end of the study period, regardless of subsequent exit.
We defined non-BPCI hospitals as those that never participated in the program and had 10 or more admissions in the BPCI period for the included medical condition episodes. We used this approach to minimize potential bias arising from BPCI entry and exit over time.
Across both BPCI and non-BPCI hospital groups, we followed prior methods and defined safety net hospitals based on a hospital’s DPP.15 Specifically, safety net hospitals were those in the top quartile of DPP among all hospitals nationwide, and hospitals in the other three quartiles were defined as non–safety net hospitals.9,12
Study Sample and Episode Construction
Our study sample included Medicare fee-for-service beneficiaries admitted to BPCI and non-BPCI hospitals for any of the four medical conditions of interest. We adhered to BPCI program rules, which defined each episode type based on a set of Medicare Severity Diagnosis Related Group (MS-DRG) codes (eg, myocardial infarction episodes were defined as MS-DRGs 280-282). From this sample, we excluded beneficiaries with end-stage renal disease or insurance coverage through Medicare Advantage, as well as beneficiaries who died during the index hospital admission, had any non–Inpatient Prospective Payment System claims, or lacked continuous primary Medicare fee-for-service coverage either during the episode or in the 12 months preceding it.
We constructed 90-day medical condition episodes that began with hospital admission and spanned 90 days after hospital discharge. To avoid bias arising from CMS rules related to precedence (rules for handling how overlapping episodes are assigned to hospitals), we followed prior methods and constructed naturally occurring episodes by assigning overlapping ones to the earlier hospital admission.2,16 From this set of episodes, we identified those for AMI, CHF, COPD, and pneumonia.
Exposure and Covariate Variables
Our study exposure was the interaction between hospital safety net status and hospital BPCI participation, which captured whether the association between BPCI participation and outcomes varied by safety net status (eg, whether differential changes in an outcome related to BPCI participation were different for safety net and non–safety net hospitals in the program). BPCI participation was defined using a time-varying indicator of BPCI participation to distinguish between episodes occurring under the program (ie, after a hospital began participating) or before participation in it. Covariates were chosen based on prior studies and included patient variables such as age, sex, Elixhauser comorbidities, frailty, and Medicare/Medicaid dual-eligibility status.17-23 Additionally, our analysis included market variables such as population size and Medicare Advantage penetration.
Outcome Variables
The prespecified primary study outcome was standardized 90-day postdischarge spending. This outcome was chosen owing to the lack of variation in standardized index hospitalization spending given the MS-DRG system and prior work suggesting that bundled payment participants instead targeted changes to postdischarge utilization and spending.2 Secondary outcomes included 90-day unplanned readmission rates, 90-day postdischarge mortality rates, discharge to institutional post–acute care providers (defined as either skilled nursing facilities [SNFs] or inpatient rehabilitation facilities), discharge home with home health agency services, and—among patients discharged to SNFs—SNF length of stay (LOS), measured in number of days.
Statistical Analysis
We described the characteristics of patients and hospitals in our samples. In adjusted analyses, we used a series of difference-in-differences (DID) generalized linear models to conduct a heterogeneity analysis evaluating whether the relationship between hospital BPCI participation and medical condition episode outcomes varied based on hospital safety net status.
In these models, the DID estimator was a time-varying indicator of hospital BPCI participation (equal to 1 for episodes occurring during the BPCI period at BPCI hospitals after they initiated participation; 0 otherwise) together with hospital and quarter-time fixed effects. To examine differences in the association between BPCI and episode outcomes by hospital safety net status—that is, whether there was heterogeneity in the outcome changes between safety net and non–safety net hospitals participating in BPCI—our models also included an interaction term between hospital safety net status and the time-varying BPCI participation term (Appendix Methods). In this approach, BPCI safety net and BPCI non–safety net hospitals were compared with non-BPCI hospitals as the comparison group. The comparisons were chosen to yield the most policy-salient findings, since Medicare evaluated hospitals in BPCI, whether safety net or not, by comparing their performance to nonparticipating hospitals, whether safety net or not.
All models controlled for patient and time-varying market characteristics and included hospital fixed effects (to account for time-invariant hospital market characteristics) and MS-DRG fixed effects. All outcomes were evaluated using models with identity links and normal distributions (ie, ordinary least squares). These variables and models were applied to data from the baseline period to examine consistency with the parallel trends assumption. Overall, Wald tests did not indicate divergent baseline period trends in outcomes between BPCI and non-BPCI hospitals (Appendix Figure 1) or BPCI safety net versus BPCI non–safety net hospitals (Appendix Figure 2).
We conducted sensitivity analyses to evaluate the robustness of our results. First, instead of comparing differential changes at BPCI safety net vs BPCI non–safety net hospitals (ie, evaluating safety net status among BPCI hospitals), we evaluated changes at BPCI safety net vs non-BPCI safety net hospitals compared with changes at BPCI non–safety net vs non-BPCI non–safety net hospitals (ie, marginal differences in the changes associated with BPCI participation among safety net vs non–safety net hospitals). Because safety net hospitals in BPCI were compared with nonparticipating safety net hospitals, and non–safety net hospitals in BPCI were compared with nonparticipating non–safety net hospitals, this set of analyses helped address potential concerns about unobservable differences between safety net and non–safety net organizations and their potential impact on our findings.
Second, we used an alternative, BPCI-specific definition for safety net hospitals: instead of defining safety net status based on all hospitals nationwide, we defined it only among BPCI hospitals (safety net hospitals defined as those in the top quartile of DPP among all BPCI hospitals) and non-BPCI hospitals (safety net hospitals defined as those in the top quartile of DPP among all non-BPCI hospitals). Third, we repeated our main analyses using models with standard errors clustered at the hospital level and without hospital fixed effects. Fourth, we repeated analysis using models with alternative nonlinear link functions and outcome distributions and without hospital fixed effects.
Statistical tests were two-tailed and considered significant at α = .05 for the primary outcome. Statistical analyses were conducted using SAS 9.4 (SAS Institute, Inc.).
RESULTS
Our sample consisted of 3066 hospitals nationwide that collectively provided medical condition episode care to a total of 1,611,848 Medicare fee-for-service beneficiaries. This sample included 238 BPCI hospitals and 2769 non-BPCI hospitals (Table 1, Appendix Table 1).
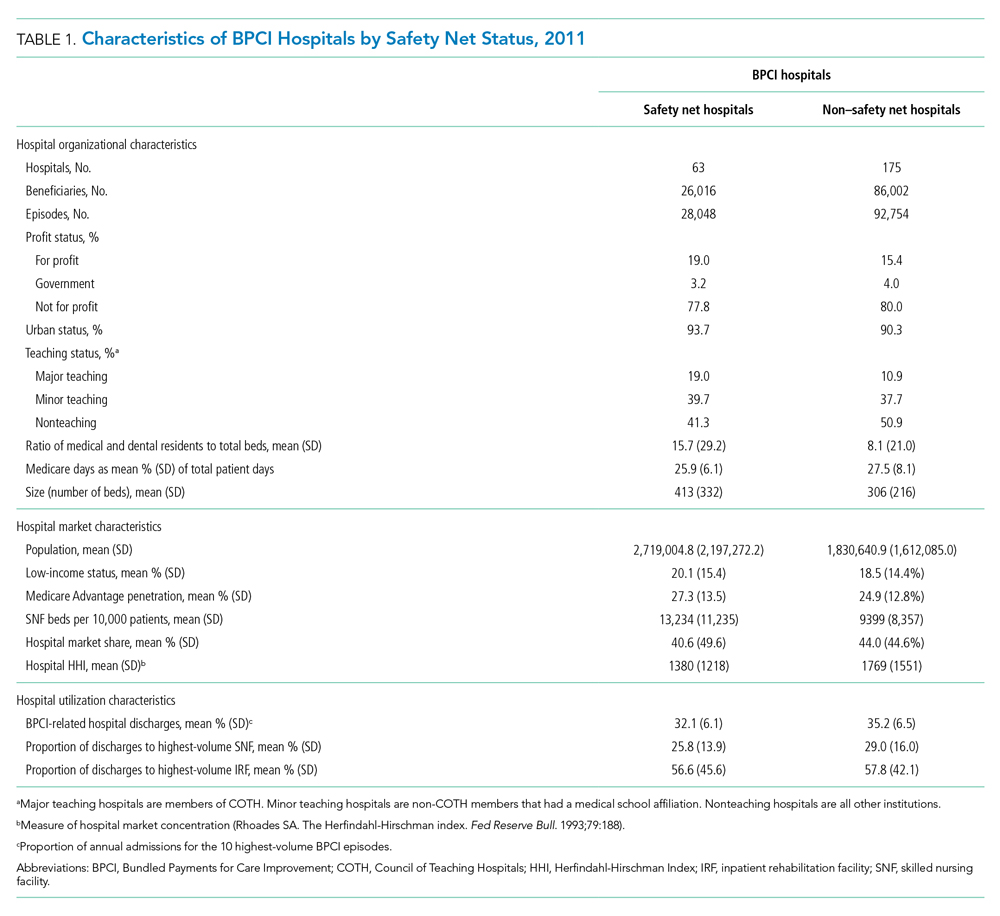
Among BPCI hospitals, 63 were safety net and 175 were non–safety net hospitals. Compared with non–safety net hospitals, safety net hospitals tended to be larger and were more likely to be urban teaching hospitals. Safety net hospitals also tended to be located in areas with larger populations, more low-income individuals, and greater Medicare Advantage penetration.
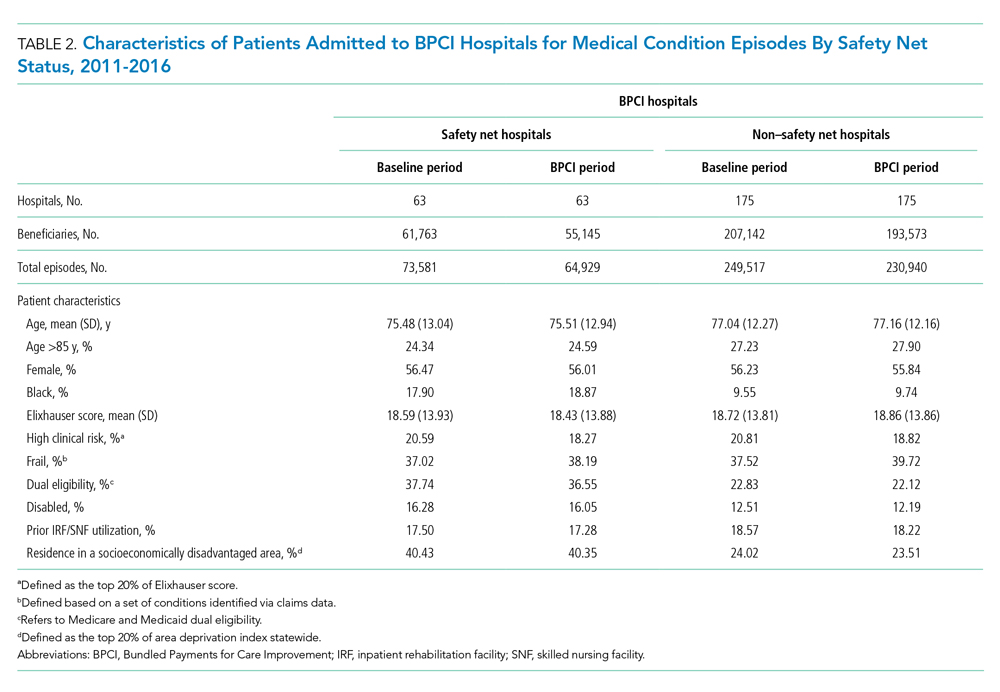
In both the baseline and BPCI periods, there were differences in several characteristics for patients admitted to safety net vs non–safety net hospitals (Table 2; Appendix Table 2). Among BPCI hospitals, in both periods, patients admitted at safety net hospitals were younger and more likely to be Black, be Medicare/Medicaid dual eligible, and report having a disability than patients admitted to non–safety net hospitals. Patients admitted to safety net hospitals were also more likely to reside in socioeconomically disadvantaged areas.
Safety Net Status Among BPCI Hospitals
In the baseline period (Appendix Table 3), postdischarge spending was slightly greater among patients admitted to BPCI safety net hospitals ($18,817) than those admitted to BPCI non–safety net hospitals ($18,335). There were also small differences in secondary outcomes between the BPCI safety net and non−safety net groups.
In adjusted analyses evaluating heterogeneity in the effect of BPCI participation between safety net and non–safety net hospitals (Figure 1), differential changes in postdischarge spending between baseline and BPCI participation periods did not differ between safety net and non–safety net hospitals participating in BPCI (aDID, $40; 95% CI, –$254 to $335; P = .79). 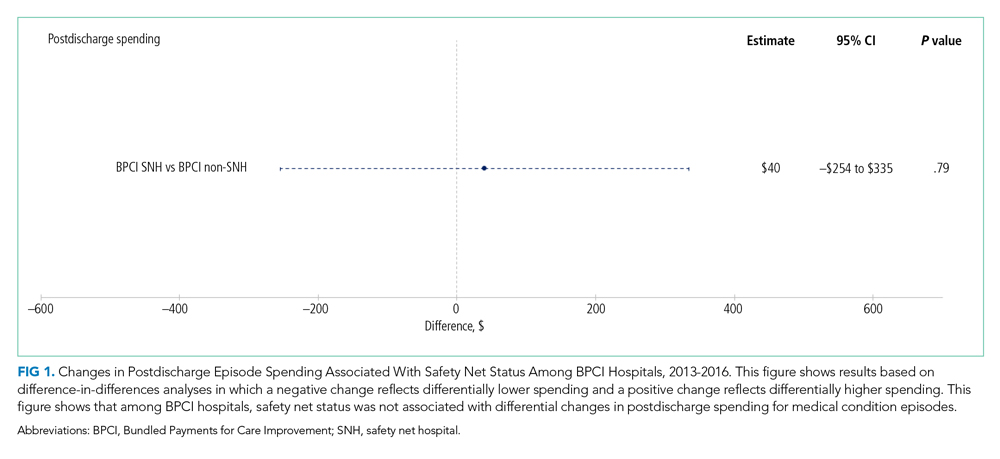

Sensitivity Analysis
Analyses of BPCI participation among safety net vs non–safety net hospitals nationwide yielded results that were similar to those from our main analyses (Appendix Figures 4, 5, and 6). Compared with BPCI participation among non–safety net hospitals, participation among safety net hospitals was associated with a differential increase from baseline to BPCI periods in discharge to institutional post–acute care providers (aDID, 1.07 percentage points; 95% CI, 0.47-1.67 percentage points; P < .001), but no differential changes between baseline and BPCI periods in postdischarge spending (aDID, –$199;95% CI, –$461 to $63; P = .14), SNF LOS (aDID, –0.22 days; 95% CI, –0.54 to 0.09 days; P = .16), or other secondary outcomes.
Replicating our main analyses using an alternative, BPCI-specific definition of safety net hospitals yielded similar results overall (Appendix Table 4; Appendix Figures 7, 8, and 9). There were no differential changes between baseline and BPCI periods in postdischarge spending between BPCI safety net and BPCI non–safety net hospitals (aDID, $111; 95% CI, –$189 to $411; P = .47). Results for secondary outcomes were also qualitatively similar to results from main analyses, with the exception that among BPCI hospitals, safety net hospitals had a differentially higher SNF LOS than non–safety net hospitals between baseline and BPCI periods (aDID, 0.38 days; 95% CI, 0.02-0.74 days; P = .04).
Compared with results from our main analysis, findings were qualitatively similar overall in analyses using models with hospital-clustered standard errors and without hospital fixed effects (Appendix Figures 10, 11, and 12) as well as models with alternative link functions and outcome distributions and without hospital fixed effects (Appendix Figures 13, 14, and 15).
Discussion
This analysis builds on prior work by evaluating how hospital safety net status affected the known association between bundled payment participation and decreased spending and stable quality for medical condition episodes. Although safety net status did not appear to affect those relationships, it did affect the relationship between participation and post–acute care utilization. These results have three main implications.
First, our results suggest that policymakers should continue engaging safety net hospitals in medical condition bundled payments while monitoring for unintended consequences. Our findings with regard to spending provide some reassurance that safety net hospitals can potentially achieve savings while maintaining quality under bundled payments, similar to other types of hospitals. However, the differences in patient populations and post–acute care utilization patterns suggest that policymakers should continue to carefully monitor for disparities based on hospital safety net status and consider implementing measures that have been used in other payment reforms to support safety net organizations. Such measures could involve providing customized technical assistance or evaluating performance using “peer groups” that compare performance among safety net hospitals alone rather than among all hospitals.24,25
Second, our findings underscore potential challenges that safety net hospitals may face when attempting to redesign care. For instance, among hospitals accepting bundled payments for medical conditions, successful strategies in BPCI have often included maintaining the proportion of patients discharged to institutional post–acute care providers while reducing SNF LOS.2 However, in our study, discharge to institutional post–acute care providers actually increased among safety net hospitals relative to other hospitals while SNF LOS did not decrease. Additionally, while other hospitals in bundled payments have exhibited differentially greater discharge home with home health services, we found that safety net hospitals did not. These represent areas for future work, particularly because little is known about how safety net hospitals coordinate post–acute care (eg, the extent to which safety net hospitals integrate with post–acute care providers or coordinate home-based care for vulnerable patient populations).
Third, study results offer insight into potential challenges to practice changes. Compared with other hospitals, safety net hospitals in our analysis provided medical condition episode care to more Black, Medicare/Medicaid dual-eligible, and disabled patients, as well as individuals living in socioeconomically disadvantaged areas. Collectively, these groups may face more challenging socioeconomic circumstances or existing disparities. The combination of these factors and limited financial resources at safety net hospitals could complicate their ability to manage transitions of care after hospitalization by shifting discharge away from high-intensity institutional post–acute care facilities.
Our analysis has limitations. First, given the observational study design, findings are subject to residual confounding and selection bias. For instance, findings related to post–acute care utilization could have been influenced by unobservable changes in market supply and other factors. However, we mitigated these risks using a quasi-experimental methodology that also directly accounted for multiple patient, hospital, and market characteristics and also used fixed effects to account for unobserved heterogeneity. Second, in studying BPCI Model 2, we evaluated one model within one bundled payment program. However, BPCI Model 2 encompassed a wide range of medical conditions, and both this scope and program design have served as the direct basis for subsequent bundled payment models, such as the ongoing BPCI Advanced and other forthcoming programs.26 Third, while our analysis evaluated multiple aspects of patient complexity, individuals may be “high risk” owing to several clinical and social determinants. Future work should evaluate different features of patient risk and how they affect outcomes under payment models such as bundled payments.
CONCLUSION
Safety net status appeared to affect the relationship between bundled payment participation and post–acute care utilization, but not episode spending. These findings suggest that policymakers could support safety net hospitals within bundled payment programs and consider safety net status when evaluating them.
1. Navathe AS, Emanuel EJ, Venkataramani AS, et al. Spending and quality after three years of Medicare’s voluntary bundled payment for joint replacement surgery. Health Aff (Millwood). 2020;39(1):58-66. https://doi.org/10.1377/hlthaff.2019.00466
2. Rolnick JA, Liao JM, Emanuel EJ, et al. Spending and quality after three years of Medicare’s bundled payments for medical conditions: quasi-experimental difference-in-differences study. BMJ. 2020;369:m1780. https://doi.org/10.1136/bmj.m1780
3. Figueroa JF, Joynt KE, Zhou X, Orav EJ, Jha AK. Safety-net hospitals face more barriers yet use fewer strategies to reduce readmissions. Med Care. 2017;55(3):229-235. https://doi.org/10.1097/MLR.0000000000000687
4. Werner RM, Goldman LE, Dudley RA. Comparison of change in quality of care between safety-net and non–safety-net hospitals. JAMA. 2008;299(18):2180-2187. https://doi/org/10.1001/jama.299.18.2180
5. Ross JS, Bernheim SM, Lin Z, et al. Based on key measures, care quality for Medicare enrollees at safety-net and non–safety-net hospitals was almost equal. Health Aff (Millwood). 2012;31(8):1739-1748. https://doi.org/10.1377/hlthaff.2011.1028
6. Gilman M, Adams EK, Hockenberry JM, Milstein AS, Wilson IB, Becker ER. Safety-net hospitals more likely than other hospitals to fare poorly under Medicare’s value-based purchasing. Health Aff (Millwood). 2015;34(3):398-405. https://doi.org/10.1377/hlthaff.2014.1059
7. Joynt KE, Jha AK. Characteristics of hospitals receiving penalties under the Hospital Readmissions Reduction Program. JAMA. 2013;309(4):342-343. https://doi.org/10.1001/jama.2012.94856
8. Rajaram R, Chung JW, Kinnier CV, et al. Hospital characteristics associated with penalties in the Centers for Medicare & Medicaid Services Hospital-Acquired Condition Reduction Program. JAMA. 2015;314(4):375-383. https://doi.org/10.1001/jama.2015.8609
9. Navathe AS, Liao JM, Shah Y, et al. Characteristics of hospitals earning savings in the first year of mandatory bundled payment for hip and knee surgery. JAMA. 2018;319(9):930-932. https://doi.org/10.1001/jama.2018.0678
10. Thirukumaran CP, Glance LG, Cai X, Balkissoon R, Mesfin A, Li Y. Performance of safety-net hospitals in year 1 of the Comprehensive Care for Joint Replacement Model. Health Aff (Millwood). 2019;38(2):190-196. https://doi.org/10.1377/hlthaff.2018.05264
11. Thirukumaran CP, Glance LG, Cai X, Kim Y, Li Y. Penalties and rewards for safety net vs non–safety net hospitals in the first 2 years of the Comprehensive Care for Joint Replacement Model. JAMA. 2019;321(20):2027-2030. https://doi.org/10.1001/jama.2019.5118
12. Kim H, Grunditz JI, Meath THA, Quiñones AR, Ibrahim SA, McConnell KJ. Level of reconciliation payments by safety-net hospital status under the first year of the Comprehensive Care for Joint Replacement Program. JAMA Surg. 2019;154(2):178-179. https://doi.org/10.1001/jamasurg.2018.3098
13. Department of Medicine, University of Wisconsin School of Medicine and Public Health. Neighborhood Atlas. Accessed March 1, 2021. https://www.neighborhoodatlas.medicine.wisc.edu/
14. Dartmouth Atlas Project. The Dartmouth Atlas of Health Care. Accessed March 1, 2021. https://www.dartmouthatlas.org/
15. Chatterjee P, Joynt KE, Orav EJ, Jha AK. Patient experience in safety-net hospitals: implications for improving care and value-based purchasing. Arch Intern Med. 2012;172(16):1204-1210. https://doi.org/10.1001/archinternmed.2012.3158
16. Rolnick JA, Liao JM, Navathe AS. Programme design matters—lessons from bundled payments in the US. June 17, 2020. Accessed March 1, 2021. https://blogs.bmj.com/bmj/2020/06/17/programme-design-matters-lessons-from-bundled-payments-in-the-us
17. Dummit LA, Kahvecioglu D, Marrufo G, et al. Association between hospital participation in a Medicare bundled payment initiative and payments and quality outcomes for lower extremity joint replacement episodes. JAMA. 2016;316(12):1267-1278. https://doi.org/10.1001/jama.2016.12717
18. Navathe AS, Liao JM, Dykstra SE, et al. Association of hospital participation in a Medicare bundled payment program with volume and case mix of lower extremity joint replacement episodes. JAMA. 2018;320(9):901-910. https://doi.org/10.1001/jama.2018.12345
19. Joynt Maddox KE, Orav EJ, Zheng J, Epstein AM. Evaluation of Medicare’s bundled payments initiative for medical conditions. N Engl J Med. 2018;379(3):260-269. https://doi.org/10.1056/NEJMsa1801569
20. Navathe AS, Emanuel EJ, Venkataramani AS, et al. Spending and quality after three years of Medicare’s voluntary bundled payment for joint replacement surgery. Health Aff (Millwood). 2020;39(1):58-66. https://doi.org/10.1377/hlthaff.2019.00466
21. Liao JM, Emanuel EJ, Venkataramani AS, et al. Association of bundled payments for joint replacement surgery and patient outcomes with simultaneous hospital participation in accountable care organizations. JAMA Netw Open. 2019;2(9):e1912270. https://doi.org/10.1001/jamanetworkopen.2019.12270
22. Kim DH, Schneeweiss S. Measuring frailty using claims data for pharmacoepidemiologic studies of mortality in older adults: evidence and recommendations. Pharmacoepidemiol Drug Saf. 2014;23(9):891-901. https://doi.org/10.1002/pds.3674
23. Joynt KE, Figueroa JF, Beaulieu N, Wild RC, Orav EJ, Jha AK. Segmenting high-cost Medicare patients into potentially actionable cohorts. Healthc (Amst). 2017;5(1-2):62-67. https://doi.org/10.1016/j.hjdsi.2016.11.002
24. Quality Payment Program. Small, underserved, and rural practices. Accessed March 1, 2021. https://qpp.cms.gov/about/small-underserved-rural-practices
25. McCarthy CP, Vaduganathan M, Patel KV, et al. Association of the new peer group–stratified method with the reclassification of penalty status in the Hospital Readmission Reduction Program. JAMA Netw Open. 2019;2(4):e192987. https://doi.org/10.1001/jamanetworkopen.2019.2987
26. Centers for Medicare & Medicaid Services. BPCI Advanced. Updated September 16, 2021. Accessed October 18, 2021. https://innovation.cms.gov/innovation-models/bpci-advanced
Bundled payments represent one of the most prominent value-based payment arrangements nationwide. Under this payment approach, hospitals assume responsibility for quality and costs across discrete episodes of care. Hospitals that maintain quality while achieving cost reductions are eligible for financial incentives, whereas those that do not are subject to financial penalties.
To date, the largest completed bundled payment program nationwide is Medicare’s Bundled Payments for Care Improvement (BPCI) initiative. Among four different participation models in BPCI, hospital enrollment was greatest in Model 2, in which episodes spanned from hospitalization through 90 days of post–acute care. The overall results from BPCI Model 2 have been positive: hospitals participating in both common surgical episodes, such as joint replacement surgery, and medical episodes, such as acute myocardial infarction (AMI) and congestive heart failure (CHF), have demonstrated long-term financial savings with stable quality performance.1,2
Safety net hospitals that disproportionately serve low-income patients may fare differently than other hospitals under bundled payment models. At baseline, these hospitals typically have fewer financial resources, which may limit their ability to implement measures to standardize care during hospitalization (eg, clinical pathways) or after discharge (eg, postdischarge programs and other strategies to reduce readmissions).3 Efforts to redesign care may be further complicated by greater clinical complexity and social and structural determinants of health among patients seeking care at safety net hospitals. Given the well-known interactions between social determinants and health conditions, these factors are highly relevant for patients hospitalized at safety net hospitals for acute medical events or exacerbations of chronic conditions.
Existing evidence has shown that safety net hospitals have not performed as well as other hospitals in other value-based reforms.4-8 In the context of bundled payments for joint replacement surgery, safety net hospitals have been less likely to achieve financial savings but more likely to receive penalties.9-11 Moreover, the savings achieved by safety net hospitals have been smaller than those achieved by non–safety net hospitals.12
Despite these concerning findings, there are few data about how safety net hospitals have fared under bundled payments for common medical conditions. To address this critical knowledge gap, we evaluated the effect of hospital safety net status on the association between BPCI Model 2 participation and changes in outcomes for medical condition episodes.
METHODS
This study was approved by the University of Pennsylvania Institutional Review Board with a waiver of informed consent.
Data
We used 100% Medicare claims data from 2011 to 2016 for patients receiving care at hospitals participating in BPCI Model 2 for one of four common medical condition episodes: AMI, pneumonia, CHF, and chronic obstructive pulmonary disease (COPD). A 20% random national sample was used for patients hospitalized at nonparticipant hospitals. Publicly available data from the Centers for Medicare & Medicaid Services (CMS) were used to identify hospital enrollment in BPCI Model 2, while data from the 2017 CMS Impact File were used to quantify each hospital’s disproportionate patient percentage (DPP), which reflects the proportion of Medicaid and low-income Medicare beneficiaries served and determines a hospital’s eligibility to earn disproportionate share hospital payments.
Data from the 2011 American Hospital Association Annual Survey were used to capture hospital characteristics, such as number of beds, teaching status, and profit status, while data from the Medicare provider of service, beneficiary summary, and accountable care organization files were used to capture additional hospital characteristics and market characteristics, such as population size and Medicare Advantage penetration. The Medicare Provider Enrollment, Chain, and Ownership System file was used to identify and remove BPCI episodes from physician group practices. State-level data about area deprivation index—a census tract–based measure that incorporates factors such as income, education, employment, and housing quality to describe socioeconomic disadvantage among neighborhoods—were used to define socioeconomically disadvantaged areas as those in the top 20% of area deprivation index statewide.13 Markets were defined using hospital referral regions.14
Study Periods and Hospital Groups
Our analysis spanned the period between January 1, 2011, and December 31, 2016. We separated this period into a baseline period (January 2011–September 2013) prior to the start of BPCI and a subsequent BPCI period (October 2013–December 2016).
We defined any hospitals participating in BPCI Model 2 across this period for any of the four included medical condition episodes as BPCI hospitals. Because hospitals were able to enter or exit BPCI over time, and enrollment data were provided by CMS as quarterly participation files, we were able to identify dates of entry into or exit from BPCI over time by hospital-condition pairs. Hospitals were considered BPCI hospitals until the end of the study period, regardless of subsequent exit.
We defined non-BPCI hospitals as those that never participated in the program and had 10 or more admissions in the BPCI period for the included medical condition episodes. We used this approach to minimize potential bias arising from BPCI entry and exit over time.
Across both BPCI and non-BPCI hospital groups, we followed prior methods and defined safety net hospitals based on a hospital’s DPP.15 Specifically, safety net hospitals were those in the top quartile of DPP among all hospitals nationwide, and hospitals in the other three quartiles were defined as non–safety net hospitals.9,12
Study Sample and Episode Construction
Our study sample included Medicare fee-for-service beneficiaries admitted to BPCI and non-BPCI hospitals for any of the four medical conditions of interest. We adhered to BPCI program rules, which defined each episode type based on a set of Medicare Severity Diagnosis Related Group (MS-DRG) codes (eg, myocardial infarction episodes were defined as MS-DRGs 280-282). From this sample, we excluded beneficiaries with end-stage renal disease or insurance coverage through Medicare Advantage, as well as beneficiaries who died during the index hospital admission, had any non–Inpatient Prospective Payment System claims, or lacked continuous primary Medicare fee-for-service coverage either during the episode or in the 12 months preceding it.
We constructed 90-day medical condition episodes that began with hospital admission and spanned 90 days after hospital discharge. To avoid bias arising from CMS rules related to precedence (rules for handling how overlapping episodes are assigned to hospitals), we followed prior methods and constructed naturally occurring episodes by assigning overlapping ones to the earlier hospital admission.2,16 From this set of episodes, we identified those for AMI, CHF, COPD, and pneumonia.
Exposure and Covariate Variables
Our study exposure was the interaction between hospital safety net status and hospital BPCI participation, which captured whether the association between BPCI participation and outcomes varied by safety net status (eg, whether differential changes in an outcome related to BPCI participation were different for safety net and non–safety net hospitals in the program). BPCI participation was defined using a time-varying indicator of BPCI participation to distinguish between episodes occurring under the program (ie, after a hospital began participating) or before participation in it. Covariates were chosen based on prior studies and included patient variables such as age, sex, Elixhauser comorbidities, frailty, and Medicare/Medicaid dual-eligibility status.17-23 Additionally, our analysis included market variables such as population size and Medicare Advantage penetration.
Outcome Variables
The prespecified primary study outcome was standardized 90-day postdischarge spending. This outcome was chosen owing to the lack of variation in standardized index hospitalization spending given the MS-DRG system and prior work suggesting that bundled payment participants instead targeted changes to postdischarge utilization and spending.2 Secondary outcomes included 90-day unplanned readmission rates, 90-day postdischarge mortality rates, discharge to institutional post–acute care providers (defined as either skilled nursing facilities [SNFs] or inpatient rehabilitation facilities), discharge home with home health agency services, and—among patients discharged to SNFs—SNF length of stay (LOS), measured in number of days.
Statistical Analysis
We described the characteristics of patients and hospitals in our samples. In adjusted analyses, we used a series of difference-in-differences (DID) generalized linear models to conduct a heterogeneity analysis evaluating whether the relationship between hospital BPCI participation and medical condition episode outcomes varied based on hospital safety net status.
In these models, the DID estimator was a time-varying indicator of hospital BPCI participation (equal to 1 for episodes occurring during the BPCI period at BPCI hospitals after they initiated participation; 0 otherwise) together with hospital and quarter-time fixed effects. To examine differences in the association between BPCI and episode outcomes by hospital safety net status—that is, whether there was heterogeneity in the outcome changes between safety net and non–safety net hospitals participating in BPCI—our models also included an interaction term between hospital safety net status and the time-varying BPCI participation term (Appendix Methods). In this approach, BPCI safety net and BPCI non–safety net hospitals were compared with non-BPCI hospitals as the comparison group. The comparisons were chosen to yield the most policy-salient findings, since Medicare evaluated hospitals in BPCI, whether safety net or not, by comparing their performance to nonparticipating hospitals, whether safety net or not.
All models controlled for patient and time-varying market characteristics and included hospital fixed effects (to account for time-invariant hospital market characteristics) and MS-DRG fixed effects. All outcomes were evaluated using models with identity links and normal distributions (ie, ordinary least squares). These variables and models were applied to data from the baseline period to examine consistency with the parallel trends assumption. Overall, Wald tests did not indicate divergent baseline period trends in outcomes between BPCI and non-BPCI hospitals (Appendix Figure 1) or BPCI safety net versus BPCI non–safety net hospitals (Appendix Figure 2).
We conducted sensitivity analyses to evaluate the robustness of our results. First, instead of comparing differential changes at BPCI safety net vs BPCI non–safety net hospitals (ie, evaluating safety net status among BPCI hospitals), we evaluated changes at BPCI safety net vs non-BPCI safety net hospitals compared with changes at BPCI non–safety net vs non-BPCI non–safety net hospitals (ie, marginal differences in the changes associated with BPCI participation among safety net vs non–safety net hospitals). Because safety net hospitals in BPCI were compared with nonparticipating safety net hospitals, and non–safety net hospitals in BPCI were compared with nonparticipating non–safety net hospitals, this set of analyses helped address potential concerns about unobservable differences between safety net and non–safety net organizations and their potential impact on our findings.
Second, we used an alternative, BPCI-specific definition for safety net hospitals: instead of defining safety net status based on all hospitals nationwide, we defined it only among BPCI hospitals (safety net hospitals defined as those in the top quartile of DPP among all BPCI hospitals) and non-BPCI hospitals (safety net hospitals defined as those in the top quartile of DPP among all non-BPCI hospitals). Third, we repeated our main analyses using models with standard errors clustered at the hospital level and without hospital fixed effects. Fourth, we repeated analysis using models with alternative nonlinear link functions and outcome distributions and without hospital fixed effects.
Statistical tests were two-tailed and considered significant at α = .05 for the primary outcome. Statistical analyses were conducted using SAS 9.4 (SAS Institute, Inc.).
RESULTS
Our sample consisted of 3066 hospitals nationwide that collectively provided medical condition episode care to a total of 1,611,848 Medicare fee-for-service beneficiaries. This sample included 238 BPCI hospitals and 2769 non-BPCI hospitals (Table 1, Appendix Table 1).
Among BPCI hospitals, 63 were safety net and 175 were non–safety net hospitals. Compared with non–safety net hospitals, safety net hospitals tended to be larger and were more likely to be urban teaching hospitals. Safety net hospitals also tended to be located in areas with larger populations, more low-income individuals, and greater Medicare Advantage penetration.
In both the baseline and BPCI periods, there were differences in several characteristics for patients admitted to safety net vs non–safety net hospitals (Table 2; Appendix Table 2). Among BPCI hospitals, in both periods, patients admitted at safety net hospitals were younger and more likely to be Black, be Medicare/Medicaid dual eligible, and report having a disability than patients admitted to non–safety net hospitals. Patients admitted to safety net hospitals were also more likely to reside in socioeconomically disadvantaged areas.
Safety Net Status Among BPCI Hospitals
In the baseline period (Appendix Table 3), postdischarge spending was slightly greater among patients admitted to BPCI safety net hospitals ($18,817) than those admitted to BPCI non–safety net hospitals ($18,335). There were also small differences in secondary outcomes between the BPCI safety net and non−safety net groups.
In adjusted analyses evaluating heterogeneity in the effect of BPCI participation between safety net and non–safety net hospitals (Figure 1), differential changes in postdischarge spending between baseline and BPCI participation periods did not differ between safety net and non–safety net hospitals participating in BPCI (aDID, $40; 95% CI, –$254 to $335; P = .79).
Sensitivity Analysis
Analyses of BPCI participation among safety net vs non–safety net hospitals nationwide yielded results that were similar to those from our main analyses (Appendix Figures 4, 5, and 6). Compared with BPCI participation among non–safety net hospitals, participation among safety net hospitals was associated with a differential increase from baseline to BPCI periods in discharge to institutional post–acute care providers (aDID, 1.07 percentage points; 95% CI, 0.47-1.67 percentage points; P < .001), but no differential changes between baseline and BPCI periods in postdischarge spending (aDID, –$199;95% CI, –$461 to $63; P = .14), SNF LOS (aDID, –0.22 days; 95% CI, –0.54 to 0.09 days; P = .16), or other secondary outcomes.
Replicating our main analyses using an alternative, BPCI-specific definition of safety net hospitals yielded similar results overall (Appendix Table 4; Appendix Figures 7, 8, and 9). There were no differential changes between baseline and BPCI periods in postdischarge spending between BPCI safety net and BPCI non–safety net hospitals (aDID, $111; 95% CI, –$189 to $411; P = .47). Results for secondary outcomes were also qualitatively similar to results from main analyses, with the exception that among BPCI hospitals, safety net hospitals had a differentially higher SNF LOS than non–safety net hospitals between baseline and BPCI periods (aDID, 0.38 days; 95% CI, 0.02-0.74 days; P = .04).
Compared with results from our main analysis, findings were qualitatively similar overall in analyses using models with hospital-clustered standard errors and without hospital fixed effects (Appendix Figures 10, 11, and 12) as well as models with alternative link functions and outcome distributions and without hospital fixed effects (Appendix Figures 13, 14, and 15).
Discussion
This analysis builds on prior work by evaluating how hospital safety net status affected the known association between bundled payment participation and decreased spending and stable quality for medical condition episodes. Although safety net status did not appear to affect those relationships, it did affect the relationship between participation and post–acute care utilization. These results have three main implications.
First, our results suggest that policymakers should continue engaging safety net hospitals in medical condition bundled payments while monitoring for unintended consequences. Our findings with regard to spending provide some reassurance that safety net hospitals can potentially achieve savings while maintaining quality under bundled payments, similar to other types of hospitals. However, the differences in patient populations and post–acute care utilization patterns suggest that policymakers should continue to carefully monitor for disparities based on hospital safety net status and consider implementing measures that have been used in other payment reforms to support safety net organizations. Such measures could involve providing customized technical assistance or evaluating performance using “peer groups” that compare performance among safety net hospitals alone rather than among all hospitals.24,25
Second, our findings underscore potential challenges that safety net hospitals may face when attempting to redesign care. For instance, among hospitals accepting bundled payments for medical conditions, successful strategies in BPCI have often included maintaining the proportion of patients discharged to institutional post–acute care providers while reducing SNF LOS.2 However, in our study, discharge to institutional post–acute care providers actually increased among safety net hospitals relative to other hospitals while SNF LOS did not decrease. Additionally, while other hospitals in bundled payments have exhibited differentially greater discharge home with home health services, we found that safety net hospitals did not. These represent areas for future work, particularly because little is known about how safety net hospitals coordinate post–acute care (eg, the extent to which safety net hospitals integrate with post–acute care providers or coordinate home-based care for vulnerable patient populations).
Third, study results offer insight into potential challenges to practice changes. Compared with other hospitals, safety net hospitals in our analysis provided medical condition episode care to more Black, Medicare/Medicaid dual-eligible, and disabled patients, as well as individuals living in socioeconomically disadvantaged areas. Collectively, these groups may face more challenging socioeconomic circumstances or existing disparities. The combination of these factors and limited financial resources at safety net hospitals could complicate their ability to manage transitions of care after hospitalization by shifting discharge away from high-intensity institutional post–acute care facilities.
Our analysis has limitations. First, given the observational study design, findings are subject to residual confounding and selection bias. For instance, findings related to post–acute care utilization could have been influenced by unobservable changes in market supply and other factors. However, we mitigated these risks using a quasi-experimental methodology that also directly accounted for multiple patient, hospital, and market characteristics and also used fixed effects to account for unobserved heterogeneity. Second, in studying BPCI Model 2, we evaluated one model within one bundled payment program. However, BPCI Model 2 encompassed a wide range of medical conditions, and both this scope and program design have served as the direct basis for subsequent bundled payment models, such as the ongoing BPCI Advanced and other forthcoming programs.26 Third, while our analysis evaluated multiple aspects of patient complexity, individuals may be “high risk” owing to several clinical and social determinants. Future work should evaluate different features of patient risk and how they affect outcomes under payment models such as bundled payments.
CONCLUSION
Safety net status appeared to affect the relationship between bundled payment participation and post–acute care utilization, but not episode spending. These findings suggest that policymakers could support safety net hospitals within bundled payment programs and consider safety net status when evaluating them.
1. Navathe AS, Emanuel EJ, Venkataramani AS, et al. Spending and quality after three years of Medicare’s voluntary bundled payment for joint replacement surgery. Health Aff (Millwood). 2020;39(1):58-66. https://doi.org/10.1377/hlthaff.2019.00466
2. Rolnick JA, Liao JM, Emanuel EJ, et al. Spending and quality after three years of Medicare’s bundled payments for medical conditions: quasi-experimental difference-in-differences study. BMJ. 2020;369:m1780. https://doi.org/10.1136/bmj.m1780
3. Figueroa JF, Joynt KE, Zhou X, Orav EJ, Jha AK. Safety-net hospitals face more barriers yet use fewer strategies to reduce readmissions. Med Care. 2017;55(3):229-235. https://doi.org/10.1097/MLR.0000000000000687
4. Werner RM, Goldman LE, Dudley RA. Comparison of change in quality of care between safety-net and non–safety-net hospitals. JAMA. 2008;299(18):2180-2187. https://doi/org/10.1001/jama.299.18.2180
5. Ross JS, Bernheim SM, Lin Z, et al. Based on key measures, care quality for Medicare enrollees at safety-net and non–safety-net hospitals was almost equal. Health Aff (Millwood). 2012;31(8):1739-1748. https://doi.org/10.1377/hlthaff.2011.1028
6. Gilman M, Adams EK, Hockenberry JM, Milstein AS, Wilson IB, Becker ER. Safety-net hospitals more likely than other hospitals to fare poorly under Medicare’s value-based purchasing. Health Aff (Millwood). 2015;34(3):398-405. https://doi.org/10.1377/hlthaff.2014.1059
7. Joynt KE, Jha AK. Characteristics of hospitals receiving penalties under the Hospital Readmissions Reduction Program. JAMA. 2013;309(4):342-343. https://doi.org/10.1001/jama.2012.94856
8. Rajaram R, Chung JW, Kinnier CV, et al. Hospital characteristics associated with penalties in the Centers for Medicare & Medicaid Services Hospital-Acquired Condition Reduction Program. JAMA. 2015;314(4):375-383. https://doi.org/10.1001/jama.2015.8609
9. Navathe AS, Liao JM, Shah Y, et al. Characteristics of hospitals earning savings in the first year of mandatory bundled payment for hip and knee surgery. JAMA. 2018;319(9):930-932. https://doi.org/10.1001/jama.2018.0678
10. Thirukumaran CP, Glance LG, Cai X, Balkissoon R, Mesfin A, Li Y. Performance of safety-net hospitals in year 1 of the Comprehensive Care for Joint Replacement Model. Health Aff (Millwood). 2019;38(2):190-196. https://doi.org/10.1377/hlthaff.2018.05264
11. Thirukumaran CP, Glance LG, Cai X, Kim Y, Li Y. Penalties and rewards for safety net vs non–safety net hospitals in the first 2 years of the Comprehensive Care for Joint Replacement Model. JAMA. 2019;321(20):2027-2030. https://doi.org/10.1001/jama.2019.5118
12. Kim H, Grunditz JI, Meath THA, Quiñones AR, Ibrahim SA, McConnell KJ. Level of reconciliation payments by safety-net hospital status under the first year of the Comprehensive Care for Joint Replacement Program. JAMA Surg. 2019;154(2):178-179. https://doi.org/10.1001/jamasurg.2018.3098
13. Department of Medicine, University of Wisconsin School of Medicine and Public Health. Neighborhood Atlas. Accessed March 1, 2021. https://www.neighborhoodatlas.medicine.wisc.edu/
14. Dartmouth Atlas Project. The Dartmouth Atlas of Health Care. Accessed March 1, 2021. https://www.dartmouthatlas.org/
15. Chatterjee P, Joynt KE, Orav EJ, Jha AK. Patient experience in safety-net hospitals: implications for improving care and value-based purchasing. Arch Intern Med. 2012;172(16):1204-1210. https://doi.org/10.1001/archinternmed.2012.3158
16. Rolnick JA, Liao JM, Navathe AS. Programme design matters—lessons from bundled payments in the US. June 17, 2020. Accessed March 1, 2021. https://blogs.bmj.com/bmj/2020/06/17/programme-design-matters-lessons-from-bundled-payments-in-the-us
17. Dummit LA, Kahvecioglu D, Marrufo G, et al. Association between hospital participation in a Medicare bundled payment initiative and payments and quality outcomes for lower extremity joint replacement episodes. JAMA. 2016;316(12):1267-1278. https://doi.org/10.1001/jama.2016.12717
18. Navathe AS, Liao JM, Dykstra SE, et al. Association of hospital participation in a Medicare bundled payment program with volume and case mix of lower extremity joint replacement episodes. JAMA. 2018;320(9):901-910. https://doi.org/10.1001/jama.2018.12345
19. Joynt Maddox KE, Orav EJ, Zheng J, Epstein AM. Evaluation of Medicare’s bundled payments initiative for medical conditions. N Engl J Med. 2018;379(3):260-269. https://doi.org/10.1056/NEJMsa1801569
20. Navathe AS, Emanuel EJ, Venkataramani AS, et al. Spending and quality after three years of Medicare’s voluntary bundled payment for joint replacement surgery. Health Aff (Millwood). 2020;39(1):58-66. https://doi.org/10.1377/hlthaff.2019.00466
21. Liao JM, Emanuel EJ, Venkataramani AS, et al. Association of bundled payments for joint replacement surgery and patient outcomes with simultaneous hospital participation in accountable care organizations. JAMA Netw Open. 2019;2(9):e1912270. https://doi.org/10.1001/jamanetworkopen.2019.12270
22. Kim DH, Schneeweiss S. Measuring frailty using claims data for pharmacoepidemiologic studies of mortality in older adults: evidence and recommendations. Pharmacoepidemiol Drug Saf. 2014;23(9):891-901. https://doi.org/10.1002/pds.3674
23. Joynt KE, Figueroa JF, Beaulieu N, Wild RC, Orav EJ, Jha AK. Segmenting high-cost Medicare patients into potentially actionable cohorts. Healthc (Amst). 2017;5(1-2):62-67. https://doi.org/10.1016/j.hjdsi.2016.11.002
24. Quality Payment Program. Small, underserved, and rural practices. Accessed March 1, 2021. https://qpp.cms.gov/about/small-underserved-rural-practices
25. McCarthy CP, Vaduganathan M, Patel KV, et al. Association of the new peer group–stratified method with the reclassification of penalty status in the Hospital Readmission Reduction Program. JAMA Netw Open. 2019;2(4):e192987. https://doi.org/10.1001/jamanetworkopen.2019.2987
26. Centers for Medicare & Medicaid Services. BPCI Advanced. Updated September 16, 2021. Accessed October 18, 2021. https://innovation.cms.gov/innovation-models/bpci-advanced
© 2021 Society of Hospital Medicine