User login
The Effect of Hospital Safety Net Status on the Association Between Bundled Payment Participation and Changes in Medical Episode Outcomes
Bundled payments represent one of the most prominent value-based payment arrangements nationwide. Under this payment approach, hospitals assume responsibility for quality and costs across discrete episodes of care. Hospitals that maintain quality while achieving cost reductions are eligible for financial incentives, whereas those that do not are subject to financial penalties.
To date, the largest completed bundled payment program nationwide is Medicare’s Bundled Payments for Care Improvement (BPCI) initiative. Among four different participation models in BPCI, hospital enrollment was greatest in Model 2, in which episodes spanned from hospitalization through 90 days of post–acute care. The overall results from BPCI Model 2 have been positive: hospitals participating in both common surgical episodes, such as joint replacement surgery, and medical episodes, such as acute myocardial infarction (AMI) and congestive heart failure (CHF), have demonstrated long-term financial savings with stable quality performance.1,2
Safety net hospitals that disproportionately serve low-income patients may fare differently than other hospitals under bundled payment models. At baseline, these hospitals typically have fewer financial resources, which may limit their ability to implement measures to standardize care during hospitalization (eg, clinical pathways) or after discharge (eg, postdischarge programs and other strategies to reduce readmissions).3 Efforts to redesign care may be further complicated by greater clinical complexity and social and structural determinants of health among patients seeking care at safety net hospitals. Given the well-known interactions between social determinants and health conditions, these factors are highly relevant for patients hospitalized at safety net hospitals for acute medical events or exacerbations of chronic conditions.
Existing evidence has shown that safety net hospitals have not performed as well as other hospitals in other value-based reforms.4-8 In the context of bundled payments for joint replacement surgery, safety net hospitals have been less likely to achieve financial savings but more likely to receive penalties.9-11 Moreover, the savings achieved by safety net hospitals have been smaller than those achieved by non–safety net hospitals.12
Despite these concerning findings, there are few data about how safety net hospitals have fared under bundled payments for common medical conditions. To address this critical knowledge gap, we evaluated the effect of hospital safety net status on the association between BPCI Model 2 participation and changes in outcomes for medical condition episodes.
METHODS
This study was approved by the University of Pennsylvania Institutional Review Board with a waiver of informed consent.
Data
We used 100% Medicare claims data from 2011 to 2016 for patients receiving care at hospitals participating in BPCI Model 2 for one of four common medical condition episodes: AMI, pneumonia, CHF, and chronic obstructive pulmonary disease (COPD). A 20% random national sample was used for patients hospitalized at nonparticipant hospitals. Publicly available data from the Centers for Medicare & Medicaid Services (CMS) were used to identify hospital enrollment in BPCI Model 2, while data from the 2017 CMS Impact File were used to quantify each hospital’s disproportionate patient percentage (DPP), which reflects the proportion of Medicaid and low-income Medicare beneficiaries served and determines a hospital’s eligibility to earn disproportionate share hospital payments.
Data from the 2011 American Hospital Association Annual Survey were used to capture hospital characteristics, such as number of beds, teaching status, and profit status, while data from the Medicare provider of service, beneficiary summary, and accountable care organization files were used to capture additional hospital characteristics and market characteristics, such as population size and Medicare Advantage penetration. The Medicare Provider Enrollment, Chain, and Ownership System file was used to identify and remove BPCI episodes from physician group practices. State-level data about area deprivation index—a census tract–based measure that incorporates factors such as income, education, employment, and housing quality to describe socioeconomic disadvantage among neighborhoods—were used to define socioeconomically disadvantaged areas as those in the top 20% of area deprivation index statewide.13 Markets were defined using hospital referral regions.14
Study Periods and Hospital Groups
Our analysis spanned the period between January 1, 2011, and December 31, 2016. We separated this period into a baseline period (January 2011–September 2013) prior to the start of BPCI and a subsequent BPCI period (October 2013–December 2016).
We defined any hospitals participating in BPCI Model 2 across this period for any of the four included medical condition episodes as BPCI hospitals. Because hospitals were able to enter or exit BPCI over time, and enrollment data were provided by CMS as quarterly participation files, we were able to identify dates of entry into or exit from BPCI over time by hospital-condition pairs. Hospitals were considered BPCI hospitals until the end of the study period, regardless of subsequent exit.
We defined non-BPCI hospitals as those that never participated in the program and had 10 or more admissions in the BPCI period for the included medical condition episodes. We used this approach to minimize potential bias arising from BPCI entry and exit over time.
Across both BPCI and non-BPCI hospital groups, we followed prior methods and defined safety net hospitals based on a hospital’s DPP.15 Specifically, safety net hospitals were those in the top quartile of DPP among all hospitals nationwide, and hospitals in the other three quartiles were defined as non–safety net hospitals.9,12
Study Sample and Episode Construction
Our study sample included Medicare fee-for-service beneficiaries admitted to BPCI and non-BPCI hospitals for any of the four medical conditions of interest. We adhered to BPCI program rules, which defined each episode type based on a set of Medicare Severity Diagnosis Related Group (MS-DRG) codes (eg, myocardial infarction episodes were defined as MS-DRGs 280-282). From this sample, we excluded beneficiaries with end-stage renal disease or insurance coverage through Medicare Advantage, as well as beneficiaries who died during the index hospital admission, had any non–Inpatient Prospective Payment System claims, or lacked continuous primary Medicare fee-for-service coverage either during the episode or in the 12 months preceding it.
We constructed 90-day medical condition episodes that began with hospital admission and spanned 90 days after hospital discharge. To avoid bias arising from CMS rules related to precedence (rules for handling how overlapping episodes are assigned to hospitals), we followed prior methods and constructed naturally occurring episodes by assigning overlapping ones to the earlier hospital admission.2,16 From this set of episodes, we identified those for AMI, CHF, COPD, and pneumonia.
Exposure and Covariate Variables
Our study exposure was the interaction between hospital safety net status and hospital BPCI participation, which captured whether the association between BPCI participation and outcomes varied by safety net status (eg, whether differential changes in an outcome related to BPCI participation were different for safety net and non–safety net hospitals in the program). BPCI participation was defined using a time-varying indicator of BPCI participation to distinguish between episodes occurring under the program (ie, after a hospital began participating) or before participation in it. Covariates were chosen based on prior studies and included patient variables such as age, sex, Elixhauser comorbidities, frailty, and Medicare/Medicaid dual-eligibility status.17-23 Additionally, our analysis included market variables such as population size and Medicare Advantage penetration.
Outcome Variables
The prespecified primary study outcome was standardized 90-day postdischarge spending. This outcome was chosen owing to the lack of variation in standardized index hospitalization spending given the MS-DRG system and prior work suggesting that bundled payment participants instead targeted changes to postdischarge utilization and spending.2 Secondary outcomes included 90-day unplanned readmission rates, 90-day postdischarge mortality rates, discharge to institutional post–acute care providers (defined as either skilled nursing facilities [SNFs] or inpatient rehabilitation facilities), discharge home with home health agency services, and—among patients discharged to SNFs—SNF length of stay (LOS), measured in number of days.
Statistical Analysis
We described the characteristics of patients and hospitals in our samples. In adjusted analyses, we used a series of difference-in-differences (DID) generalized linear models to conduct a heterogeneity analysis evaluating whether the relationship between hospital BPCI participation and medical condition episode outcomes varied based on hospital safety net status.
In these models, the DID estimator was a time-varying indicator of hospital BPCI participation (equal to 1 for episodes occurring during the BPCI period at BPCI hospitals after they initiated participation; 0 otherwise) together with hospital and quarter-time fixed effects. To examine differences in the association between BPCI and episode outcomes by hospital safety net status—that is, whether there was heterogeneity in the outcome changes between safety net and non–safety net hospitals participating in BPCI—our models also included an interaction term between hospital safety net status and the time-varying BPCI participation term (Appendix Methods). In this approach, BPCI safety net and BPCI non–safety net hospitals were compared with non-BPCI hospitals as the comparison group. The comparisons were chosen to yield the most policy-salient findings, since Medicare evaluated hospitals in BPCI, whether safety net or not, by comparing their performance to nonparticipating hospitals, whether safety net or not.
All models controlled for patient and time-varying market characteristics and included hospital fixed effects (to account for time-invariant hospital market characteristics) and MS-DRG fixed effects. All outcomes were evaluated using models with identity links and normal distributions (ie, ordinary least squares). These variables and models were applied to data from the baseline period to examine consistency with the parallel trends assumption. Overall, Wald tests did not indicate divergent baseline period trends in outcomes between BPCI and non-BPCI hospitals (Appendix Figure 1) or BPCI safety net versus BPCI non–safety net hospitals (Appendix Figure 2).
We conducted sensitivity analyses to evaluate the robustness of our results. First, instead of comparing differential changes at BPCI safety net vs BPCI non–safety net hospitals (ie, evaluating safety net status among BPCI hospitals), we evaluated changes at BPCI safety net vs non-BPCI safety net hospitals compared with changes at BPCI non–safety net vs non-BPCI non–safety net hospitals (ie, marginal differences in the changes associated with BPCI participation among safety net vs non–safety net hospitals). Because safety net hospitals in BPCI were compared with nonparticipating safety net hospitals, and non–safety net hospitals in BPCI were compared with nonparticipating non–safety net hospitals, this set of analyses helped address potential concerns about unobservable differences between safety net and non–safety net organizations and their potential impact on our findings.
Second, we used an alternative, BPCI-specific definition for safety net hospitals: instead of defining safety net status based on all hospitals nationwide, we defined it only among BPCI hospitals (safety net hospitals defined as those in the top quartile of DPP among all BPCI hospitals) and non-BPCI hospitals (safety net hospitals defined as those in the top quartile of DPP among all non-BPCI hospitals). Third, we repeated our main analyses using models with standard errors clustered at the hospital level and without hospital fixed effects. Fourth, we repeated analysis using models with alternative nonlinear link functions and outcome distributions and without hospital fixed effects.
Statistical tests were two-tailed and considered significant at α = .05 for the primary outcome. Statistical analyses were conducted using SAS 9.4 (SAS Institute, Inc.).
RESULTS
Our sample consisted of 3066 hospitals nationwide that collectively provided medical condition episode care to a total of 1,611,848 Medicare fee-for-service beneficiaries. This sample included 238 BPCI hospitals and 2769 non-BPCI hospitals (Table 1, Appendix Table 1).
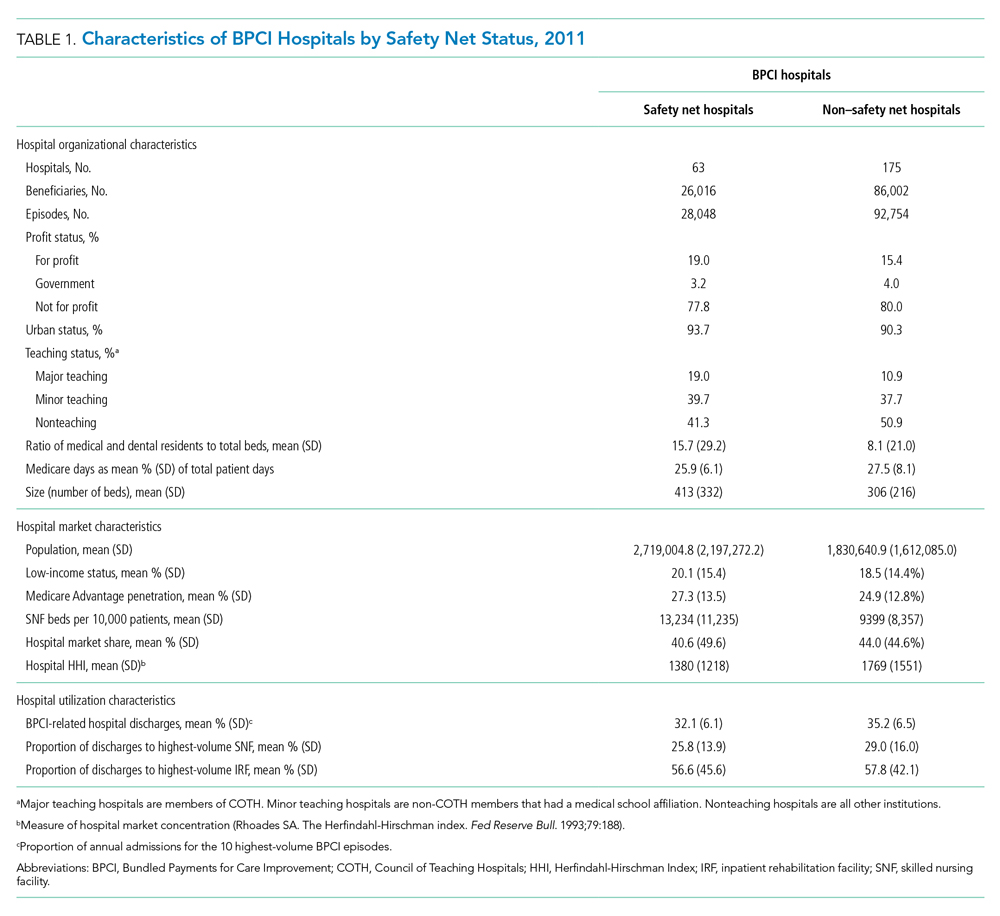
Among BPCI hospitals, 63 were safety net and 175 were non–safety net hospitals. Compared with non–safety net hospitals, safety net hospitals tended to be larger and were more likely to be urban teaching hospitals. Safety net hospitals also tended to be located in areas with larger populations, more low-income individuals, and greater Medicare Advantage penetration.
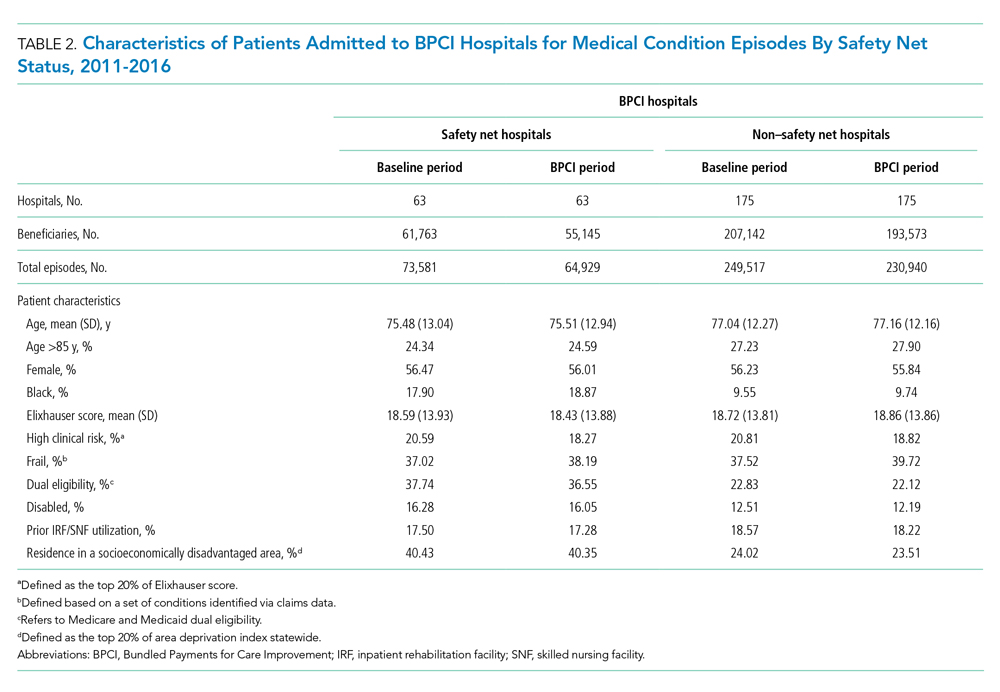
In both the baseline and BPCI periods, there were differences in several characteristics for patients admitted to safety net vs non–safety net hospitals (Table 2; Appendix Table 2). Among BPCI hospitals, in both periods, patients admitted at safety net hospitals were younger and more likely to be Black, be Medicare/Medicaid dual eligible, and report having a disability than patients admitted to non–safety net hospitals. Patients admitted to safety net hospitals were also more likely to reside in socioeconomically disadvantaged areas.
Safety Net Status Among BPCI Hospitals
In the baseline period (Appendix Table 3), postdischarge spending was slightly greater among patients admitted to BPCI safety net hospitals ($18,817) than those admitted to BPCI non–safety net hospitals ($18,335). There were also small differences in secondary outcomes between the BPCI safety net and non−safety net groups.
In adjusted analyses evaluating heterogeneity in the effect of BPCI participation between safety net and non–safety net hospitals (Figure 1), differential changes in postdischarge spending between baseline and BPCI participation periods did not differ between safety net and non–safety net hospitals participating in BPCI (aDID, $40; 95% CI, –$254 to $335; P = .79). 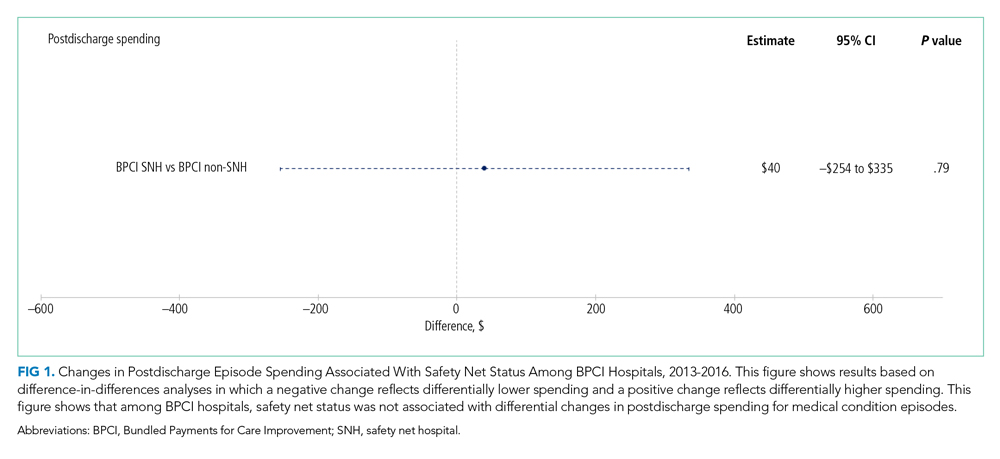

Sensitivity Analysis
Analyses of BPCI participation among safety net vs non–safety net hospitals nationwide yielded results that were similar to those from our main analyses (Appendix Figures 4, 5, and 6). Compared with BPCI participation among non–safety net hospitals, participation among safety net hospitals was associated with a differential increase from baseline to BPCI periods in discharge to institutional post–acute care providers (aDID, 1.07 percentage points; 95% CI, 0.47-1.67 percentage points; P < .001), but no differential changes between baseline and BPCI periods in postdischarge spending (aDID, –$199;95% CI, –$461 to $63; P = .14), SNF LOS (aDID, –0.22 days; 95% CI, –0.54 to 0.09 days; P = .16), or other secondary outcomes.
Replicating our main analyses using an alternative, BPCI-specific definition of safety net hospitals yielded similar results overall (Appendix Table 4; Appendix Figures 7, 8, and 9). There were no differential changes between baseline and BPCI periods in postdischarge spending between BPCI safety net and BPCI non–safety net hospitals (aDID, $111; 95% CI, –$189 to $411; P = .47). Results for secondary outcomes were also qualitatively similar to results from main analyses, with the exception that among BPCI hospitals, safety net hospitals had a differentially higher SNF LOS than non–safety net hospitals between baseline and BPCI periods (aDID, 0.38 days; 95% CI, 0.02-0.74 days; P = .04).
Compared with results from our main analysis, findings were qualitatively similar overall in analyses using models with hospital-clustered standard errors and without hospital fixed effects (Appendix Figures 10, 11, and 12) as well as models with alternative link functions and outcome distributions and without hospital fixed effects (Appendix Figures 13, 14, and 15).
Discussion
This analysis builds on prior work by evaluating how hospital safety net status affected the known association between bundled payment participation and decreased spending and stable quality for medical condition episodes. Although safety net status did not appear to affect those relationships, it did affect the relationship between participation and post–acute care utilization. These results have three main implications.
First, our results suggest that policymakers should continue engaging safety net hospitals in medical condition bundled payments while monitoring for unintended consequences. Our findings with regard to spending provide some reassurance that safety net hospitals can potentially achieve savings while maintaining quality under bundled payments, similar to other types of hospitals. However, the differences in patient populations and post–acute care utilization patterns suggest that policymakers should continue to carefully monitor for disparities based on hospital safety net status and consider implementing measures that have been used in other payment reforms to support safety net organizations. Such measures could involve providing customized technical assistance or evaluating performance using “peer groups” that compare performance among safety net hospitals alone rather than among all hospitals.24,25
Second, our findings underscore potential challenges that safety net hospitals may face when attempting to redesign care. For instance, among hospitals accepting bundled payments for medical conditions, successful strategies in BPCI have often included maintaining the proportion of patients discharged to institutional post–acute care providers while reducing SNF LOS.2 However, in our study, discharge to institutional post–acute care providers actually increased among safety net hospitals relative to other hospitals while SNF LOS did not decrease. Additionally, while other hospitals in bundled payments have exhibited differentially greater discharge home with home health services, we found that safety net hospitals did not. These represent areas for future work, particularly because little is known about how safety net hospitals coordinate post–acute care (eg, the extent to which safety net hospitals integrate with post–acute care providers or coordinate home-based care for vulnerable patient populations).
Third, study results offer insight into potential challenges to practice changes. Compared with other hospitals, safety net hospitals in our analysis provided medical condition episode care to more Black, Medicare/Medicaid dual-eligible, and disabled patients, as well as individuals living in socioeconomically disadvantaged areas. Collectively, these groups may face more challenging socioeconomic circumstances or existing disparities. The combination of these factors and limited financial resources at safety net hospitals could complicate their ability to manage transitions of care after hospitalization by shifting discharge away from high-intensity institutional post–acute care facilities.
Our analysis has limitations. First, given the observational study design, findings are subject to residual confounding and selection bias. For instance, findings related to post–acute care utilization could have been influenced by unobservable changes in market supply and other factors. However, we mitigated these risks using a quasi-experimental methodology that also directly accounted for multiple patient, hospital, and market characteristics and also used fixed effects to account for unobserved heterogeneity. Second, in studying BPCI Model 2, we evaluated one model within one bundled payment program. However, BPCI Model 2 encompassed a wide range of medical conditions, and both this scope and program design have served as the direct basis for subsequent bundled payment models, such as the ongoing BPCI Advanced and other forthcoming programs.26 Third, while our analysis evaluated multiple aspects of patient complexity, individuals may be “high risk” owing to several clinical and social determinants. Future work should evaluate different features of patient risk and how they affect outcomes under payment models such as bundled payments.
CONCLUSION
Safety net status appeared to affect the relationship between bundled payment participation and post–acute care utilization, but not episode spending. These findings suggest that policymakers could support safety net hospitals within bundled payment programs and consider safety net status when evaluating them.
1. Navathe AS, Emanuel EJ, Venkataramani AS, et al. Spending and quality after three years of Medicare’s voluntary bundled payment for joint replacement surgery. Health Aff (Millwood). 2020;39(1):58-66. https://doi.org/10.1377/hlthaff.2019.00466
2. Rolnick JA, Liao JM, Emanuel EJ, et al. Spending and quality after three years of Medicare’s bundled payments for medical conditions: quasi-experimental difference-in-differences study. BMJ. 2020;369:m1780. https://doi.org/10.1136/bmj.m1780
3. Figueroa JF, Joynt KE, Zhou X, Orav EJ, Jha AK. Safety-net hospitals face more barriers yet use fewer strategies to reduce readmissions. Med Care. 2017;55(3):229-235. https://doi.org/10.1097/MLR.0000000000000687
4. Werner RM, Goldman LE, Dudley RA. Comparison of change in quality of care between safety-net and non–safety-net hospitals. JAMA. 2008;299(18):2180-2187. https://doi/org/10.1001/jama.299.18.2180
5. Ross JS, Bernheim SM, Lin Z, et al. Based on key measures, care quality for Medicare enrollees at safety-net and non–safety-net hospitals was almost equal. Health Aff (Millwood). 2012;31(8):1739-1748. https://doi.org/10.1377/hlthaff.2011.1028
6. Gilman M, Adams EK, Hockenberry JM, Milstein AS, Wilson IB, Becker ER. Safety-net hospitals more likely than other hospitals to fare poorly under Medicare’s value-based purchasing. Health Aff (Millwood). 2015;34(3):398-405. https://doi.org/10.1377/hlthaff.2014.1059
7. Joynt KE, Jha AK. Characteristics of hospitals receiving penalties under the Hospital Readmissions Reduction Program. JAMA. 2013;309(4):342-343. https://doi.org/10.1001/jama.2012.94856
8. Rajaram R, Chung JW, Kinnier CV, et al. Hospital characteristics associated with penalties in the Centers for Medicare & Medicaid Services Hospital-Acquired Condition Reduction Program. JAMA. 2015;314(4):375-383. https://doi.org/10.1001/jama.2015.8609
9. Navathe AS, Liao JM, Shah Y, et al. Characteristics of hospitals earning savings in the first year of mandatory bundled payment for hip and knee surgery. JAMA. 2018;319(9):930-932. https://doi.org/10.1001/jama.2018.0678
10. Thirukumaran CP, Glance LG, Cai X, Balkissoon R, Mesfin A, Li Y. Performance of safety-net hospitals in year 1 of the Comprehensive Care for Joint Replacement Model. Health Aff (Millwood). 2019;38(2):190-196. https://doi.org/10.1377/hlthaff.2018.05264
11. Thirukumaran CP, Glance LG, Cai X, Kim Y, Li Y. Penalties and rewards for safety net vs non–safety net hospitals in the first 2 years of the Comprehensive Care for Joint Replacement Model. JAMA. 2019;321(20):2027-2030. https://doi.org/10.1001/jama.2019.5118
12. Kim H, Grunditz JI, Meath THA, Quiñones AR, Ibrahim SA, McConnell KJ. Level of reconciliation payments by safety-net hospital status under the first year of the Comprehensive Care for Joint Replacement Program. JAMA Surg. 2019;154(2):178-179. https://doi.org/10.1001/jamasurg.2018.3098
13. Department of Medicine, University of Wisconsin School of Medicine and Public Health. Neighborhood Atlas. Accessed March 1, 2021. https://www.neighborhoodatlas.medicine.wisc.edu/
14. Dartmouth Atlas Project. The Dartmouth Atlas of Health Care. Accessed March 1, 2021. https://www.dartmouthatlas.org/
15. Chatterjee P, Joynt KE, Orav EJ, Jha AK. Patient experience in safety-net hospitals: implications for improving care and value-based purchasing. Arch Intern Med. 2012;172(16):1204-1210. https://doi.org/10.1001/archinternmed.2012.3158
16. Rolnick JA, Liao JM, Navathe AS. Programme design matters—lessons from bundled payments in the US. June 17, 2020. Accessed March 1, 2021. https://blogs.bmj.com/bmj/2020/06/17/programme-design-matters-lessons-from-bundled-payments-in-the-us
17. Dummit LA, Kahvecioglu D, Marrufo G, et al. Association between hospital participation in a Medicare bundled payment initiative and payments and quality outcomes for lower extremity joint replacement episodes. JAMA. 2016;316(12):1267-1278. https://doi.org/10.1001/jama.2016.12717
18. Navathe AS, Liao JM, Dykstra SE, et al. Association of hospital participation in a Medicare bundled payment program with volume and case mix of lower extremity joint replacement episodes. JAMA. 2018;320(9):901-910. https://doi.org/10.1001/jama.2018.12345
19. Joynt Maddox KE, Orav EJ, Zheng J, Epstein AM. Evaluation of Medicare’s bundled payments initiative for medical conditions. N Engl J Med. 2018;379(3):260-269. https://doi.org/10.1056/NEJMsa1801569
20. Navathe AS, Emanuel EJ, Venkataramani AS, et al. Spending and quality after three years of Medicare’s voluntary bundled payment for joint replacement surgery. Health Aff (Millwood). 2020;39(1):58-66. https://doi.org/10.1377/hlthaff.2019.00466
21. Liao JM, Emanuel EJ, Venkataramani AS, et al. Association of bundled payments for joint replacement surgery and patient outcomes with simultaneous hospital participation in accountable care organizations. JAMA Netw Open. 2019;2(9):e1912270. https://doi.org/10.1001/jamanetworkopen.2019.12270
22. Kim DH, Schneeweiss S. Measuring frailty using claims data for pharmacoepidemiologic studies of mortality in older adults: evidence and recommendations. Pharmacoepidemiol Drug Saf. 2014;23(9):891-901. https://doi.org/10.1002/pds.3674
23. Joynt KE, Figueroa JF, Beaulieu N, Wild RC, Orav EJ, Jha AK. Segmenting high-cost Medicare patients into potentially actionable cohorts. Healthc (Amst). 2017;5(1-2):62-67. https://doi.org/10.1016/j.hjdsi.2016.11.002
24. Quality Payment Program. Small, underserved, and rural practices. Accessed March 1, 2021. https://qpp.cms.gov/about/small-underserved-rural-practices
25. McCarthy CP, Vaduganathan M, Patel KV, et al. Association of the new peer group–stratified method with the reclassification of penalty status in the Hospital Readmission Reduction Program. JAMA Netw Open. 2019;2(4):e192987. https://doi.org/10.1001/jamanetworkopen.2019.2987
26. Centers for Medicare & Medicaid Services. BPCI Advanced. Updated September 16, 2021. Accessed October 18, 2021. https://innovation.cms.gov/innovation-models/bpci-advanced
Bundled payments represent one of the most prominent value-based payment arrangements nationwide. Under this payment approach, hospitals assume responsibility for quality and costs across discrete episodes of care. Hospitals that maintain quality while achieving cost reductions are eligible for financial incentives, whereas those that do not are subject to financial penalties.
To date, the largest completed bundled payment program nationwide is Medicare’s Bundled Payments for Care Improvement (BPCI) initiative. Among four different participation models in BPCI, hospital enrollment was greatest in Model 2, in which episodes spanned from hospitalization through 90 days of post–acute care. The overall results from BPCI Model 2 have been positive: hospitals participating in both common surgical episodes, such as joint replacement surgery, and medical episodes, such as acute myocardial infarction (AMI) and congestive heart failure (CHF), have demonstrated long-term financial savings with stable quality performance.1,2
Safety net hospitals that disproportionately serve low-income patients may fare differently than other hospitals under bundled payment models. At baseline, these hospitals typically have fewer financial resources, which may limit their ability to implement measures to standardize care during hospitalization (eg, clinical pathways) or after discharge (eg, postdischarge programs and other strategies to reduce readmissions).3 Efforts to redesign care may be further complicated by greater clinical complexity and social and structural determinants of health among patients seeking care at safety net hospitals. Given the well-known interactions between social determinants and health conditions, these factors are highly relevant for patients hospitalized at safety net hospitals for acute medical events or exacerbations of chronic conditions.
Existing evidence has shown that safety net hospitals have not performed as well as other hospitals in other value-based reforms.4-8 In the context of bundled payments for joint replacement surgery, safety net hospitals have been less likely to achieve financial savings but more likely to receive penalties.9-11 Moreover, the savings achieved by safety net hospitals have been smaller than those achieved by non–safety net hospitals.12
Despite these concerning findings, there are few data about how safety net hospitals have fared under bundled payments for common medical conditions. To address this critical knowledge gap, we evaluated the effect of hospital safety net status on the association between BPCI Model 2 participation and changes in outcomes for medical condition episodes.
METHODS
This study was approved by the University of Pennsylvania Institutional Review Board with a waiver of informed consent.
Data
We used 100% Medicare claims data from 2011 to 2016 for patients receiving care at hospitals participating in BPCI Model 2 for one of four common medical condition episodes: AMI, pneumonia, CHF, and chronic obstructive pulmonary disease (COPD). A 20% random national sample was used for patients hospitalized at nonparticipant hospitals. Publicly available data from the Centers for Medicare & Medicaid Services (CMS) were used to identify hospital enrollment in BPCI Model 2, while data from the 2017 CMS Impact File were used to quantify each hospital’s disproportionate patient percentage (DPP), which reflects the proportion of Medicaid and low-income Medicare beneficiaries served and determines a hospital’s eligibility to earn disproportionate share hospital payments.
Data from the 2011 American Hospital Association Annual Survey were used to capture hospital characteristics, such as number of beds, teaching status, and profit status, while data from the Medicare provider of service, beneficiary summary, and accountable care organization files were used to capture additional hospital characteristics and market characteristics, such as population size and Medicare Advantage penetration. The Medicare Provider Enrollment, Chain, and Ownership System file was used to identify and remove BPCI episodes from physician group practices. State-level data about area deprivation index—a census tract–based measure that incorporates factors such as income, education, employment, and housing quality to describe socioeconomic disadvantage among neighborhoods—were used to define socioeconomically disadvantaged areas as those in the top 20% of area deprivation index statewide.13 Markets were defined using hospital referral regions.14
Study Periods and Hospital Groups
Our analysis spanned the period between January 1, 2011, and December 31, 2016. We separated this period into a baseline period (January 2011–September 2013) prior to the start of BPCI and a subsequent BPCI period (October 2013–December 2016).
We defined any hospitals participating in BPCI Model 2 across this period for any of the four included medical condition episodes as BPCI hospitals. Because hospitals were able to enter or exit BPCI over time, and enrollment data were provided by CMS as quarterly participation files, we were able to identify dates of entry into or exit from BPCI over time by hospital-condition pairs. Hospitals were considered BPCI hospitals until the end of the study period, regardless of subsequent exit.
We defined non-BPCI hospitals as those that never participated in the program and had 10 or more admissions in the BPCI period for the included medical condition episodes. We used this approach to minimize potential bias arising from BPCI entry and exit over time.
Across both BPCI and non-BPCI hospital groups, we followed prior methods and defined safety net hospitals based on a hospital’s DPP.15 Specifically, safety net hospitals were those in the top quartile of DPP among all hospitals nationwide, and hospitals in the other three quartiles were defined as non–safety net hospitals.9,12
Study Sample and Episode Construction
Our study sample included Medicare fee-for-service beneficiaries admitted to BPCI and non-BPCI hospitals for any of the four medical conditions of interest. We adhered to BPCI program rules, which defined each episode type based on a set of Medicare Severity Diagnosis Related Group (MS-DRG) codes (eg, myocardial infarction episodes were defined as MS-DRGs 280-282). From this sample, we excluded beneficiaries with end-stage renal disease or insurance coverage through Medicare Advantage, as well as beneficiaries who died during the index hospital admission, had any non–Inpatient Prospective Payment System claims, or lacked continuous primary Medicare fee-for-service coverage either during the episode or in the 12 months preceding it.
We constructed 90-day medical condition episodes that began with hospital admission and spanned 90 days after hospital discharge. To avoid bias arising from CMS rules related to precedence (rules for handling how overlapping episodes are assigned to hospitals), we followed prior methods and constructed naturally occurring episodes by assigning overlapping ones to the earlier hospital admission.2,16 From this set of episodes, we identified those for AMI, CHF, COPD, and pneumonia.
Exposure and Covariate Variables
Our study exposure was the interaction between hospital safety net status and hospital BPCI participation, which captured whether the association between BPCI participation and outcomes varied by safety net status (eg, whether differential changes in an outcome related to BPCI participation were different for safety net and non–safety net hospitals in the program). BPCI participation was defined using a time-varying indicator of BPCI participation to distinguish between episodes occurring under the program (ie, after a hospital began participating) or before participation in it. Covariates were chosen based on prior studies and included patient variables such as age, sex, Elixhauser comorbidities, frailty, and Medicare/Medicaid dual-eligibility status.17-23 Additionally, our analysis included market variables such as population size and Medicare Advantage penetration.
Outcome Variables
The prespecified primary study outcome was standardized 90-day postdischarge spending. This outcome was chosen owing to the lack of variation in standardized index hospitalization spending given the MS-DRG system and prior work suggesting that bundled payment participants instead targeted changes to postdischarge utilization and spending.2 Secondary outcomes included 90-day unplanned readmission rates, 90-day postdischarge mortality rates, discharge to institutional post–acute care providers (defined as either skilled nursing facilities [SNFs] or inpatient rehabilitation facilities), discharge home with home health agency services, and—among patients discharged to SNFs—SNF length of stay (LOS), measured in number of days.
Statistical Analysis
We described the characteristics of patients and hospitals in our samples. In adjusted analyses, we used a series of difference-in-differences (DID) generalized linear models to conduct a heterogeneity analysis evaluating whether the relationship between hospital BPCI participation and medical condition episode outcomes varied based on hospital safety net status.
In these models, the DID estimator was a time-varying indicator of hospital BPCI participation (equal to 1 for episodes occurring during the BPCI period at BPCI hospitals after they initiated participation; 0 otherwise) together with hospital and quarter-time fixed effects. To examine differences in the association between BPCI and episode outcomes by hospital safety net status—that is, whether there was heterogeneity in the outcome changes between safety net and non–safety net hospitals participating in BPCI—our models also included an interaction term between hospital safety net status and the time-varying BPCI participation term (Appendix Methods). In this approach, BPCI safety net and BPCI non–safety net hospitals were compared with non-BPCI hospitals as the comparison group. The comparisons were chosen to yield the most policy-salient findings, since Medicare evaluated hospitals in BPCI, whether safety net or not, by comparing their performance to nonparticipating hospitals, whether safety net or not.
All models controlled for patient and time-varying market characteristics and included hospital fixed effects (to account for time-invariant hospital market characteristics) and MS-DRG fixed effects. All outcomes were evaluated using models with identity links and normal distributions (ie, ordinary least squares). These variables and models were applied to data from the baseline period to examine consistency with the parallel trends assumption. Overall, Wald tests did not indicate divergent baseline period trends in outcomes between BPCI and non-BPCI hospitals (Appendix Figure 1) or BPCI safety net versus BPCI non–safety net hospitals (Appendix Figure 2).
We conducted sensitivity analyses to evaluate the robustness of our results. First, instead of comparing differential changes at BPCI safety net vs BPCI non–safety net hospitals (ie, evaluating safety net status among BPCI hospitals), we evaluated changes at BPCI safety net vs non-BPCI safety net hospitals compared with changes at BPCI non–safety net vs non-BPCI non–safety net hospitals (ie, marginal differences in the changes associated with BPCI participation among safety net vs non–safety net hospitals). Because safety net hospitals in BPCI were compared with nonparticipating safety net hospitals, and non–safety net hospitals in BPCI were compared with nonparticipating non–safety net hospitals, this set of analyses helped address potential concerns about unobservable differences between safety net and non–safety net organizations and their potential impact on our findings.
Second, we used an alternative, BPCI-specific definition for safety net hospitals: instead of defining safety net status based on all hospitals nationwide, we defined it only among BPCI hospitals (safety net hospitals defined as those in the top quartile of DPP among all BPCI hospitals) and non-BPCI hospitals (safety net hospitals defined as those in the top quartile of DPP among all non-BPCI hospitals). Third, we repeated our main analyses using models with standard errors clustered at the hospital level and without hospital fixed effects. Fourth, we repeated analysis using models with alternative nonlinear link functions and outcome distributions and without hospital fixed effects.
Statistical tests were two-tailed and considered significant at α = .05 for the primary outcome. Statistical analyses were conducted using SAS 9.4 (SAS Institute, Inc.).
RESULTS
Our sample consisted of 3066 hospitals nationwide that collectively provided medical condition episode care to a total of 1,611,848 Medicare fee-for-service beneficiaries. This sample included 238 BPCI hospitals and 2769 non-BPCI hospitals (Table 1, Appendix Table 1).
Among BPCI hospitals, 63 were safety net and 175 were non–safety net hospitals. Compared with non–safety net hospitals, safety net hospitals tended to be larger and were more likely to be urban teaching hospitals. Safety net hospitals also tended to be located in areas with larger populations, more low-income individuals, and greater Medicare Advantage penetration.
In both the baseline and BPCI periods, there were differences in several characteristics for patients admitted to safety net vs non–safety net hospitals (Table 2; Appendix Table 2). Among BPCI hospitals, in both periods, patients admitted at safety net hospitals were younger and more likely to be Black, be Medicare/Medicaid dual eligible, and report having a disability than patients admitted to non–safety net hospitals. Patients admitted to safety net hospitals were also more likely to reside in socioeconomically disadvantaged areas.
Safety Net Status Among BPCI Hospitals
In the baseline period (Appendix Table 3), postdischarge spending was slightly greater among patients admitted to BPCI safety net hospitals ($18,817) than those admitted to BPCI non–safety net hospitals ($18,335). There were also small differences in secondary outcomes between the BPCI safety net and non−safety net groups.
In adjusted analyses evaluating heterogeneity in the effect of BPCI participation between safety net and non–safety net hospitals (Figure 1), differential changes in postdischarge spending between baseline and BPCI participation periods did not differ between safety net and non–safety net hospitals participating in BPCI (aDID, $40; 95% CI, –$254 to $335; P = .79).
Sensitivity Analysis
Analyses of BPCI participation among safety net vs non–safety net hospitals nationwide yielded results that were similar to those from our main analyses (Appendix Figures 4, 5, and 6). Compared with BPCI participation among non–safety net hospitals, participation among safety net hospitals was associated with a differential increase from baseline to BPCI periods in discharge to institutional post–acute care providers (aDID, 1.07 percentage points; 95% CI, 0.47-1.67 percentage points; P < .001), but no differential changes between baseline and BPCI periods in postdischarge spending (aDID, –$199;95% CI, –$461 to $63; P = .14), SNF LOS (aDID, –0.22 days; 95% CI, –0.54 to 0.09 days; P = .16), or other secondary outcomes.
Replicating our main analyses using an alternative, BPCI-specific definition of safety net hospitals yielded similar results overall (Appendix Table 4; Appendix Figures 7, 8, and 9). There were no differential changes between baseline and BPCI periods in postdischarge spending between BPCI safety net and BPCI non–safety net hospitals (aDID, $111; 95% CI, –$189 to $411; P = .47). Results for secondary outcomes were also qualitatively similar to results from main analyses, with the exception that among BPCI hospitals, safety net hospitals had a differentially higher SNF LOS than non–safety net hospitals between baseline and BPCI periods (aDID, 0.38 days; 95% CI, 0.02-0.74 days; P = .04).
Compared with results from our main analysis, findings were qualitatively similar overall in analyses using models with hospital-clustered standard errors and without hospital fixed effects (Appendix Figures 10, 11, and 12) as well as models with alternative link functions and outcome distributions and without hospital fixed effects (Appendix Figures 13, 14, and 15).
Discussion
This analysis builds on prior work by evaluating how hospital safety net status affected the known association between bundled payment participation and decreased spending and stable quality for medical condition episodes. Although safety net status did not appear to affect those relationships, it did affect the relationship between participation and post–acute care utilization. These results have three main implications.
First, our results suggest that policymakers should continue engaging safety net hospitals in medical condition bundled payments while monitoring for unintended consequences. Our findings with regard to spending provide some reassurance that safety net hospitals can potentially achieve savings while maintaining quality under bundled payments, similar to other types of hospitals. However, the differences in patient populations and post–acute care utilization patterns suggest that policymakers should continue to carefully monitor for disparities based on hospital safety net status and consider implementing measures that have been used in other payment reforms to support safety net organizations. Such measures could involve providing customized technical assistance or evaluating performance using “peer groups” that compare performance among safety net hospitals alone rather than among all hospitals.24,25
Second, our findings underscore potential challenges that safety net hospitals may face when attempting to redesign care. For instance, among hospitals accepting bundled payments for medical conditions, successful strategies in BPCI have often included maintaining the proportion of patients discharged to institutional post–acute care providers while reducing SNF LOS.2 However, in our study, discharge to institutional post–acute care providers actually increased among safety net hospitals relative to other hospitals while SNF LOS did not decrease. Additionally, while other hospitals in bundled payments have exhibited differentially greater discharge home with home health services, we found that safety net hospitals did not. These represent areas for future work, particularly because little is known about how safety net hospitals coordinate post–acute care (eg, the extent to which safety net hospitals integrate with post–acute care providers or coordinate home-based care for vulnerable patient populations).
Third, study results offer insight into potential challenges to practice changes. Compared with other hospitals, safety net hospitals in our analysis provided medical condition episode care to more Black, Medicare/Medicaid dual-eligible, and disabled patients, as well as individuals living in socioeconomically disadvantaged areas. Collectively, these groups may face more challenging socioeconomic circumstances or existing disparities. The combination of these factors and limited financial resources at safety net hospitals could complicate their ability to manage transitions of care after hospitalization by shifting discharge away from high-intensity institutional post–acute care facilities.
Our analysis has limitations. First, given the observational study design, findings are subject to residual confounding and selection bias. For instance, findings related to post–acute care utilization could have been influenced by unobservable changes in market supply and other factors. However, we mitigated these risks using a quasi-experimental methodology that also directly accounted for multiple patient, hospital, and market characteristics and also used fixed effects to account for unobserved heterogeneity. Second, in studying BPCI Model 2, we evaluated one model within one bundled payment program. However, BPCI Model 2 encompassed a wide range of medical conditions, and both this scope and program design have served as the direct basis for subsequent bundled payment models, such as the ongoing BPCI Advanced and other forthcoming programs.26 Third, while our analysis evaluated multiple aspects of patient complexity, individuals may be “high risk” owing to several clinical and social determinants. Future work should evaluate different features of patient risk and how they affect outcomes under payment models such as bundled payments.
CONCLUSION
Safety net status appeared to affect the relationship between bundled payment participation and post–acute care utilization, but not episode spending. These findings suggest that policymakers could support safety net hospitals within bundled payment programs and consider safety net status when evaluating them.
1. Navathe AS, Emanuel EJ, Venkataramani AS, et al. Spending and quality after three years of Medicare’s voluntary bundled payment for joint replacement surgery. Health Aff (Millwood). 2020;39(1):58-66. https://doi.org/10.1377/hlthaff.2019.00466
2. Rolnick JA, Liao JM, Emanuel EJ, et al. Spending and quality after three years of Medicare’s bundled payments for medical conditions: quasi-experimental difference-in-differences study. BMJ. 2020;369:m1780. https://doi.org/10.1136/bmj.m1780
3. Figueroa JF, Joynt KE, Zhou X, Orav EJ, Jha AK. Safety-net hospitals face more barriers yet use fewer strategies to reduce readmissions. Med Care. 2017;55(3):229-235. https://doi.org/10.1097/MLR.0000000000000687
4. Werner RM, Goldman LE, Dudley RA. Comparison of change in quality of care between safety-net and non–safety-net hospitals. JAMA. 2008;299(18):2180-2187. https://doi/org/10.1001/jama.299.18.2180
5. Ross JS, Bernheim SM, Lin Z, et al. Based on key measures, care quality for Medicare enrollees at safety-net and non–safety-net hospitals was almost equal. Health Aff (Millwood). 2012;31(8):1739-1748. https://doi.org/10.1377/hlthaff.2011.1028
6. Gilman M, Adams EK, Hockenberry JM, Milstein AS, Wilson IB, Becker ER. Safety-net hospitals more likely than other hospitals to fare poorly under Medicare’s value-based purchasing. Health Aff (Millwood). 2015;34(3):398-405. https://doi.org/10.1377/hlthaff.2014.1059
7. Joynt KE, Jha AK. Characteristics of hospitals receiving penalties under the Hospital Readmissions Reduction Program. JAMA. 2013;309(4):342-343. https://doi.org/10.1001/jama.2012.94856
8. Rajaram R, Chung JW, Kinnier CV, et al. Hospital characteristics associated with penalties in the Centers for Medicare & Medicaid Services Hospital-Acquired Condition Reduction Program. JAMA. 2015;314(4):375-383. https://doi.org/10.1001/jama.2015.8609
9. Navathe AS, Liao JM, Shah Y, et al. Characteristics of hospitals earning savings in the first year of mandatory bundled payment for hip and knee surgery. JAMA. 2018;319(9):930-932. https://doi.org/10.1001/jama.2018.0678
10. Thirukumaran CP, Glance LG, Cai X, Balkissoon R, Mesfin A, Li Y. Performance of safety-net hospitals in year 1 of the Comprehensive Care for Joint Replacement Model. Health Aff (Millwood). 2019;38(2):190-196. https://doi.org/10.1377/hlthaff.2018.05264
11. Thirukumaran CP, Glance LG, Cai X, Kim Y, Li Y. Penalties and rewards for safety net vs non–safety net hospitals in the first 2 years of the Comprehensive Care for Joint Replacement Model. JAMA. 2019;321(20):2027-2030. https://doi.org/10.1001/jama.2019.5118
12. Kim H, Grunditz JI, Meath THA, Quiñones AR, Ibrahim SA, McConnell KJ. Level of reconciliation payments by safety-net hospital status under the first year of the Comprehensive Care for Joint Replacement Program. JAMA Surg. 2019;154(2):178-179. https://doi.org/10.1001/jamasurg.2018.3098
13. Department of Medicine, University of Wisconsin School of Medicine and Public Health. Neighborhood Atlas. Accessed March 1, 2021. https://www.neighborhoodatlas.medicine.wisc.edu/
14. Dartmouth Atlas Project. The Dartmouth Atlas of Health Care. Accessed March 1, 2021. https://www.dartmouthatlas.org/
15. Chatterjee P, Joynt KE, Orav EJ, Jha AK. Patient experience in safety-net hospitals: implications for improving care and value-based purchasing. Arch Intern Med. 2012;172(16):1204-1210. https://doi.org/10.1001/archinternmed.2012.3158
16. Rolnick JA, Liao JM, Navathe AS. Programme design matters—lessons from bundled payments in the US. June 17, 2020. Accessed March 1, 2021. https://blogs.bmj.com/bmj/2020/06/17/programme-design-matters-lessons-from-bundled-payments-in-the-us
17. Dummit LA, Kahvecioglu D, Marrufo G, et al. Association between hospital participation in a Medicare bundled payment initiative and payments and quality outcomes for lower extremity joint replacement episodes. JAMA. 2016;316(12):1267-1278. https://doi.org/10.1001/jama.2016.12717
18. Navathe AS, Liao JM, Dykstra SE, et al. Association of hospital participation in a Medicare bundled payment program with volume and case mix of lower extremity joint replacement episodes. JAMA. 2018;320(9):901-910. https://doi.org/10.1001/jama.2018.12345
19. Joynt Maddox KE, Orav EJ, Zheng J, Epstein AM. Evaluation of Medicare’s bundled payments initiative for medical conditions. N Engl J Med. 2018;379(3):260-269. https://doi.org/10.1056/NEJMsa1801569
20. Navathe AS, Emanuel EJ, Venkataramani AS, et al. Spending and quality after three years of Medicare’s voluntary bundled payment for joint replacement surgery. Health Aff (Millwood). 2020;39(1):58-66. https://doi.org/10.1377/hlthaff.2019.00466
21. Liao JM, Emanuel EJ, Venkataramani AS, et al. Association of bundled payments for joint replacement surgery and patient outcomes with simultaneous hospital participation in accountable care organizations. JAMA Netw Open. 2019;2(9):e1912270. https://doi.org/10.1001/jamanetworkopen.2019.12270
22. Kim DH, Schneeweiss S. Measuring frailty using claims data for pharmacoepidemiologic studies of mortality in older adults: evidence and recommendations. Pharmacoepidemiol Drug Saf. 2014;23(9):891-901. https://doi.org/10.1002/pds.3674
23. Joynt KE, Figueroa JF, Beaulieu N, Wild RC, Orav EJ, Jha AK. Segmenting high-cost Medicare patients into potentially actionable cohorts. Healthc (Amst). 2017;5(1-2):62-67. https://doi.org/10.1016/j.hjdsi.2016.11.002
24. Quality Payment Program. Small, underserved, and rural practices. Accessed March 1, 2021. https://qpp.cms.gov/about/small-underserved-rural-practices
25. McCarthy CP, Vaduganathan M, Patel KV, et al. Association of the new peer group–stratified method with the reclassification of penalty status in the Hospital Readmission Reduction Program. JAMA Netw Open. 2019;2(4):e192987. https://doi.org/10.1001/jamanetworkopen.2019.2987
26. Centers for Medicare & Medicaid Services. BPCI Advanced. Updated September 16, 2021. Accessed October 18, 2021. https://innovation.cms.gov/innovation-models/bpci-advanced
© 2021 Society of Hospital Medicine
Policy in Clinical Practice: Hospital Price Transparency
CLINICAL SCENARIO
A 59-year-old man is observed in the hospital for substernal chest pain initially concerning for angina. Serial troponin testing is negative, and based on additional history of intermittent dysphagia, an elective upper endoscopy is recommended after discharge. The patient does not have health insurance and expresses anxiety about the cost of endoscopy. He asks how he could compare the costs at different hospitals. How do federal price transparency rules assist the hospitalist in addressing this patient’s question?
BACKGROUND AND HISTORY
Healthcare costs continue to rise in the United States despite mounting concerns about wasteful spending and unaffordability.1 One contributor is a lack of price transparency.2 In theory, price transparency allows individuals to shop for services, spurring competition and lower prices. However, healthcare prices have historically been opaque to both physicians and patients; unlike other licensed professionals who provide clients estimates for their work (eg, lawyers, electricians), physicians are rarely able to offer patients real-time insight or guidance about costs, which most patients discover only when the bill arrives. The situation is particularly problematic for patients who bear higher out-of-pocket costs, such as the uninsured or those with high-deductible health plans.3
Decades of work to improve healthcare price transparency have unfortunately borne little fruit. Multiple states and organizations have attempted to disseminate price information on comparison websites.4 These efforts only modestly reduced some prices, with benefits confined to elective, single-episode, commodifiable services such as magnetic resonance imaging scans.5 The Affordable Care Act required hospitals to publish standard charges, also called a chargemaster (Table).6 However, chargemaster fees are notoriously inflated and inaccessible at the point of service, undercutting transparency.

POLICY IN CLINICAL PRACTICE
Beginning January 2021, the Centers for Medicare & Medicaid Services (CMS) required all hospitals to publish negotiated prices—including payor-specific negotiated charges—for 300 “shoppable services” (Table).6 The list must include 70 common CMS-specified services, such as a basic metabolic panel, upper endoscopy, and prostate biopsy, as well as another 230 services that each hospital determines relevant to its patient population.
In circumstances where hospitals have negotiated different prices for a service, they must list each third-party payor and their payor-specific charge. The information must be prominently displayed, accessible without requiring the patient to enter personal information, and provided in a machine-readable file. CMS may impose a $300 daily penalty on hospitals failing to comply with the policy. Of note, the policy does not apply to clinics or ambulatory surgery centers.
As more hospitals share data, this policy will directly benefit both patients and physicians. It can benefit patients with the time, foresight, and ability to search for the lowest price for shoppable services. Other patients may also benefit indirectly, to the extent that insurers and other purchasers apply this information to negotiate lower and more uniform prices. Decreased price variation may also encourage hospitals to compete on quality to distinguish the value of their services. Hospitalists could benefit through the ability to directly help patients locate price information.
Despite these potential benefits, the policy has limitations. Price information about shoppable services is most useful for discharge planning, and other solutions are needed to address transparency before and during unplanned admissions. Patients who prioritize continuity with a hospital or physician may be less price sensitive, particularly for more complex services. Patients with commercial insurance may be shielded from cost considerations and personal incentives to comparison shop. Interpreting hospitals’ estimates remains difficult, as it can be unclear if professional fees are included or if certain prices are offered to outpatients.7 Price information is not accompanied by corresponding quality data. Additionally, price transparency may also fail to lower prices in heavily concentrated payor or provider markets, and it remains unknown whether some providers may actually raise prices after learning about higher rates negotiated by competitors.8,9
Another issue is hospital participation. Early evidence suggests that most hospitals have not complied with the letter or spirit of the regulation.
Despite its limitations, this policy represents a meaningful advance for healthcare competition and patient empowerment. Additionally, it signals federal willingness to address the lack of price transparency as a source of widespread patient and clinician frustration—a commitment that will be needed to sustain this policy and implement additional measures in the future.
COMMENTARY AND RECOMMENDATIONS
CMS could consider five steps to augment the policy and maximize transparency and value for patients.
First, CMS could consider increasing daily nonparticipation penalties. Hospitals, particularly those in areas with less competition, have less incentive to participate given meager current penalties. Because the magnitude needed to compel action remains unknown, CMS could gradually escalate penalties over time until there is broader participation across hospitals.
Second, policymakers could aggregate price information centrally, organize the data around patients’ clinical scenarios, and advertise its availability. Currently, this information is scattered and time-consuming for hospitalists and patients to gather for decision-making. Additionally, CMS could encourage the development of third-party tools that aggregate and analyze machine-readable price data or require that prices be posted at the point of service.
Third, CMS could revise the policy to include quality as well as price information. Price alone does not offer a full enough picture of what consumers can expect from hospitals for shoppable services. Pairing price and quality information is better aligned to addressing costs in the context of value, rather than cost-cutting for its own purposes.
Fourth, over time, CMS could expand the list of services and sites required to report (eg, clinics and ambulatory surgical centers as well as hospitals).
Fifth, CMS rule-makers could set reporting standards and contextualize price information in common clinical scenarios. Patients may have difficulty shopping for complex healthcare services without understanding how they apply in different clinical situations. Decision-making would also be aided by reporting standards—for instance, for how prices are displayed and whether they include certain fees (eg, professional fees, pathology studies).
WHAT SHOULD I TELL MY PATIENT?
Hospitalists planning follow-up care should inform patients that price information is increasingly available and encourage them to search on the internet or contact hospital billing offices to request information (eg, discounted cash prices and minimum negotiated charges) before obtaining elective services after discharge. Hospitalists can also encourage patients to discuss shoppable services with their primary care physicians to understand the clinical context and make high-value decisions. Hospitalists who wish to build communication skills discussing costs with patients can increasingly find resources for these conversations and request that prices be displayed in the electronic health record for this purpose.13,14 As conversations occur, hospitalists should seek to understand other factors, such as convenience and continuity relationships, that might influence choices.
CONCLUSIONS
Starting in 2021, CMS policy requires that hospitals report prices for services such as the endoscopy recommended for the patient in the scenario. Though the policy gives patients new hope for greater transparency and better prices, additional steps are needed to help patients and hospitalists achieve these benefits.
1. Shrank WH, Rogstad TL, Parekh N. Waste in the US health care system: estimated costs and potential for savings. JAMA. 2019;322(15):1501-1509. https://doi.org/10.1001/jama.2019.13978
2. Wetzell S. Transparency: a needed step towards health care affordability. American Health Policy Institute. March 2014. Accessed August 26, 2021. https://www.americanhealthpolicy.org/Content/documents/resources/Transparency%20Study%201%20-%20The%20Need%20for%20Health%20Care%20Transparency.pdf
3. Mehrotra A, Dean KM, Sinaiko AD, Sood N. Americans support price shopping for health care, but few actually seek out price information. Health Aff (Millwood). 2017;36(8):1392-1400. https://doi.org/10.1377/hlthaff.2016.1471
4. Kullgren JT, Duey KA, Werner RM. A census of state health care price transparency websites. JAMA. 2013;309(23):2437-2438. https://doi.org/10.1001/jama.2013.6557
5. Brown ZY. Equilibrium effects of health care price information. Rev Econ Stat. 2019;101(4):699-712. https://doi.org/10.1162/rest_a_00765
6. Medicare and Medicaid Programs: CY 2020 hospital outpatient PPS policy changes and payment rates and ambulatory surgical center payment system policy changes and payment rates. Price transparency requirements for hospitals to make standard charges public. 45 CFR §180.20 (2019).
7. Kurani N, Ramirez G, Hudman J, Cox C, Kamal R. Early results from federal price transparency rule show difficulty in estimating the cost of care. Peterson-Kaiser Family Foundation. April 9, 2021. Accessed August 26, 2021. https://www.healthsystemtracker.org/brief/early-results-from-federal-price-transparency-rule-show-difficultly-in-estimating-the-cost-of-care/
8. Miller BJ, Mandelberg MC, Griffith NC, Ehrenfeld JM. Price transparency: empowering patient choice and promoting provider competition. J Med Syst. 2020;44(4):80. https://doi.org/10.1007/s10916-020-01553-2
9. Glied S. Price transparency–promise and peril. JAMA. 2021;325(15):1496-1497. https://doi.org/10.1001/jama.2021.4640
10. Haque W, Ahmadzada M, Allahrakha H, Haque E, Hsiehchen D. Transparency, accessibility, and variability of US hospital price data. JAMA Netw Open. 2021;4(5):e2110109. https://doi.org/10.1001/jamanetworkopen.2021.10109
11. Henderson M, Mouslim MC. Low compliance from big hospitals on CMS’s hospital price transparency rule. Health Affairs Blog. March 16, 2021. Accessed August 26, 2021. https://doi.org/10.1377/hblog20210311.899634
12. McGinty T, Wilde Mathews A, Evans M. Hospitals hide pricing data from search results. The Wall Street Journal. March 22, 2021. Accessed August 26, 2021. https://www.wsj.com/articles/hospitals-hide-pricing-data-from-search-results-11616405402
13. Dine CJ, Masi D, Smith CD. Tools to help overcome barriers to cost-of-care conversations. Ann Intern Med. 2019;170(9 suppl):S36-S38. https://doi.org/10.7326/M19-0778
14. Miller BJ, Slota JM, Ehrenfeld JM. Redefining the physician’s role in cost-conscious care: the potential role of the electronic health record. JAMA. 2019;322(8):721-722. https://doi.org/10.1001/jama.2019.9114
CLINICAL SCENARIO
A 59-year-old man is observed in the hospital for substernal chest pain initially concerning for angina. Serial troponin testing is negative, and based on additional history of intermittent dysphagia, an elective upper endoscopy is recommended after discharge. The patient does not have health insurance and expresses anxiety about the cost of endoscopy. He asks how he could compare the costs at different hospitals. How do federal price transparency rules assist the hospitalist in addressing this patient’s question?
BACKGROUND AND HISTORY
Healthcare costs continue to rise in the United States despite mounting concerns about wasteful spending and unaffordability.1 One contributor is a lack of price transparency.2 In theory, price transparency allows individuals to shop for services, spurring competition and lower prices. However, healthcare prices have historically been opaque to both physicians and patients; unlike other licensed professionals who provide clients estimates for their work (eg, lawyers, electricians), physicians are rarely able to offer patients real-time insight or guidance about costs, which most patients discover only when the bill arrives. The situation is particularly problematic for patients who bear higher out-of-pocket costs, such as the uninsured or those with high-deductible health plans.3
Decades of work to improve healthcare price transparency have unfortunately borne little fruit. Multiple states and organizations have attempted to disseminate price information on comparison websites.4 These efforts only modestly reduced some prices, with benefits confined to elective, single-episode, commodifiable services such as magnetic resonance imaging scans.5 The Affordable Care Act required hospitals to publish standard charges, also called a chargemaster (Table).6 However, chargemaster fees are notoriously inflated and inaccessible at the point of service, undercutting transparency.
POLICY IN CLINICAL PRACTICE
Beginning January 2021, the Centers for Medicare & Medicaid Services (CMS) required all hospitals to publish negotiated prices—including payor-specific negotiated charges—for 300 “shoppable services” (Table).6 The list must include 70 common CMS-specified services, such as a basic metabolic panel, upper endoscopy, and prostate biopsy, as well as another 230 services that each hospital determines relevant to its patient population.
In circumstances where hospitals have negotiated different prices for a service, they must list each third-party payor and their payor-specific charge. The information must be prominently displayed, accessible without requiring the patient to enter personal information, and provided in a machine-readable file. CMS may impose a $300 daily penalty on hospitals failing to comply with the policy. Of note, the policy does not apply to clinics or ambulatory surgery centers.
As more hospitals share data, this policy will directly benefit both patients and physicians. It can benefit patients with the time, foresight, and ability to search for the lowest price for shoppable services. Other patients may also benefit indirectly, to the extent that insurers and other purchasers apply this information to negotiate lower and more uniform prices. Decreased price variation may also encourage hospitals to compete on quality to distinguish the value of their services. Hospitalists could benefit through the ability to directly help patients locate price information.
Despite these potential benefits, the policy has limitations. Price information about shoppable services is most useful for discharge planning, and other solutions are needed to address transparency before and during unplanned admissions. Patients who prioritize continuity with a hospital or physician may be less price sensitive, particularly for more complex services. Patients with commercial insurance may be shielded from cost considerations and personal incentives to comparison shop. Interpreting hospitals’ estimates remains difficult, as it can be unclear if professional fees are included or if certain prices are offered to outpatients.7 Price information is not accompanied by corresponding quality data. Additionally, price transparency may also fail to lower prices in heavily concentrated payor or provider markets, and it remains unknown whether some providers may actually raise prices after learning about higher rates negotiated by competitors.8,9
Another issue is hospital participation. Early evidence suggests that most hospitals have not complied with the letter or spirit of the regulation.
Despite its limitations, this policy represents a meaningful advance for healthcare competition and patient empowerment. Additionally, it signals federal willingness to address the lack of price transparency as a source of widespread patient and clinician frustration—a commitment that will be needed to sustain this policy and implement additional measures in the future.
COMMENTARY AND RECOMMENDATIONS
CMS could consider five steps to augment the policy and maximize transparency and value for patients.
First, CMS could consider increasing daily nonparticipation penalties. Hospitals, particularly those in areas with less competition, have less incentive to participate given meager current penalties. Because the magnitude needed to compel action remains unknown, CMS could gradually escalate penalties over time until there is broader participation across hospitals.
Second, policymakers could aggregate price information centrally, organize the data around patients’ clinical scenarios, and advertise its availability. Currently, this information is scattered and time-consuming for hospitalists and patients to gather for decision-making. Additionally, CMS could encourage the development of third-party tools that aggregate and analyze machine-readable price data or require that prices be posted at the point of service.
Third, CMS could revise the policy to include quality as well as price information. Price alone does not offer a full enough picture of what consumers can expect from hospitals for shoppable services. Pairing price and quality information is better aligned to addressing costs in the context of value, rather than cost-cutting for its own purposes.
Fourth, over time, CMS could expand the list of services and sites required to report (eg, clinics and ambulatory surgical centers as well as hospitals).
Fifth, CMS rule-makers could set reporting standards and contextualize price information in common clinical scenarios. Patients may have difficulty shopping for complex healthcare services without understanding how they apply in different clinical situations. Decision-making would also be aided by reporting standards—for instance, for how prices are displayed and whether they include certain fees (eg, professional fees, pathology studies).
WHAT SHOULD I TELL MY PATIENT?
Hospitalists planning follow-up care should inform patients that price information is increasingly available and encourage them to search on the internet or contact hospital billing offices to request information (eg, discounted cash prices and minimum negotiated charges) before obtaining elective services after discharge. Hospitalists can also encourage patients to discuss shoppable services with their primary care physicians to understand the clinical context and make high-value decisions. Hospitalists who wish to build communication skills discussing costs with patients can increasingly find resources for these conversations and request that prices be displayed in the electronic health record for this purpose.13,14 As conversations occur, hospitalists should seek to understand other factors, such as convenience and continuity relationships, that might influence choices.
CONCLUSIONS
Starting in 2021, CMS policy requires that hospitals report prices for services such as the endoscopy recommended for the patient in the scenario. Though the policy gives patients new hope for greater transparency and better prices, additional steps are needed to help patients and hospitalists achieve these benefits.
1. Shrank WH, Rogstad TL, Parekh N. Waste in the US health care system: estimated costs and potential for savings. JAMA. 2019;322(15):1501-1509. https://doi.org/10.1001/jama.2019.13978
2. Wetzell S. Transparency: a needed step towards health care affordability. American Health Policy Institute. March 2014. Accessed August 26, 2021. https://www.americanhealthpolicy.org/Content/documents/resources/Transparency%20Study%201%20-%20The%20Need%20for%20Health%20Care%20Transparency.pdf
3. Mehrotra A, Dean KM, Sinaiko AD, Sood N. Americans support price shopping for health care, but few actually seek out price information. Health Aff (Millwood). 2017;36(8):1392-1400. https://doi.org/10.1377/hlthaff.2016.1471
4. Kullgren JT, Duey KA, Werner RM. A census of state health care price transparency websites. JAMA. 2013;309(23):2437-2438. https://doi.org/10.1001/jama.2013.6557
5. Brown ZY. Equilibrium effects of health care price information. Rev Econ Stat. 2019;101(4):699-712. https://doi.org/10.1162/rest_a_00765
6. Medicare and Medicaid Programs: CY 2020 hospital outpatient PPS policy changes and payment rates and ambulatory surgical center payment system policy changes and payment rates. Price transparency requirements for hospitals to make standard charges public. 45 CFR §180.20 (2019).
7. Kurani N, Ramirez G, Hudman J, Cox C, Kamal R. Early results from federal price transparency rule show difficulty in estimating the cost of care. Peterson-Kaiser Family Foundation. April 9, 2021. Accessed August 26, 2021. https://www.healthsystemtracker.org/brief/early-results-from-federal-price-transparency-rule-show-difficultly-in-estimating-the-cost-of-care/
8. Miller BJ, Mandelberg MC, Griffith NC, Ehrenfeld JM. Price transparency: empowering patient choice and promoting provider competition. J Med Syst. 2020;44(4):80. https://doi.org/10.1007/s10916-020-01553-2
9. Glied S. Price transparency–promise and peril. JAMA. 2021;325(15):1496-1497. https://doi.org/10.1001/jama.2021.4640
10. Haque W, Ahmadzada M, Allahrakha H, Haque E, Hsiehchen D. Transparency, accessibility, and variability of US hospital price data. JAMA Netw Open. 2021;4(5):e2110109. https://doi.org/10.1001/jamanetworkopen.2021.10109
11. Henderson M, Mouslim MC. Low compliance from big hospitals on CMS’s hospital price transparency rule. Health Affairs Blog. March 16, 2021. Accessed August 26, 2021. https://doi.org/10.1377/hblog20210311.899634
12. McGinty T, Wilde Mathews A, Evans M. Hospitals hide pricing data from search results. The Wall Street Journal. March 22, 2021. Accessed August 26, 2021. https://www.wsj.com/articles/hospitals-hide-pricing-data-from-search-results-11616405402
13. Dine CJ, Masi D, Smith CD. Tools to help overcome barriers to cost-of-care conversations. Ann Intern Med. 2019;170(9 suppl):S36-S38. https://doi.org/10.7326/M19-0778
14. Miller BJ, Slota JM, Ehrenfeld JM. Redefining the physician’s role in cost-conscious care: the potential role of the electronic health record. JAMA. 2019;322(8):721-722. https://doi.org/10.1001/jama.2019.9114
© 2021 Society of Hospital Medicine
Overlap between Medicare’s Voluntary Bundled Payment and Accountable Care Organization Programs
Voluntary accountable care organizations (ACOs) and bundled payments have concurrently become cornerstone strategies in Medicare’s shift from volume-based fee-for-service toward value-based payment.
Physician practice and hospital participation in Medicare’s largest ACO model, the Medicare Shared Savings Program (MSSP),1 grew to include 561 organizations in 2018. Under MSSP, participants assume financial accountability for the global quality and costs of care for defined populations of Medicare fee-for-service patients. ACOs that manage to maintain or improve quality while achieving savings (ie, containing costs below a predefined population-wide spending benchmark) are eligible to receive a portion of the difference back from Medicare in the form of “shared savings”.
Similarly, hospital participation in Medicare’s bundled payment programs has grown over time. Most notably, more than 700 participants enrolled in the recently concluded Bundled Payments for Care Improvement (BPCI) initiative,2 Medicare’s largest bundled payment program over the past five years.3 Under BPCI, participants assumed financial accountability for the quality and costs of care for all Medicare patients triggering a qualifying “episode of care”. Participants that limit episode spending below a predefined benchmark without compromising quality were eligible for financial incentives.
As both ACOs and bundled payments grow in prominence and scale, they may increasingly overlap if patients attributed to ACOs receive care at bundled payment hospitals. Overlap could create synergies by increasing incentives to address shared processes (eg, discharge planning) or outcomes (eg, readmissions).4 An ACO focus on reducing hospital admissions could complement bundled payment efforts to increase hospital efficiency.
Conversely, Medicare’s approach to allocating savings and losses can penalize ACOs or bundled payment participants.3 For example, when a patient included in an MSSP ACO population receives episodic care at a hospital participating in BPCI, the historical costs of care for the hospital and the episode type, not the actual costs of care for that specific patient and his/her episode, are counted in the performance of the ACO. In other words, in these cases, the performance of the MSSP ACO is dependent on the historical spending at BPCI hospitals—despite it being out of ACO’s control and having little to do with the actual care its patients receive at BPCI hospitals—and MSSP ACOs cannot benefit from improvements over time. Therefore, MSSP ACOs may be functionally penalized if patients receive care at historically high-cost BPCI hospitals regardless of whether they have considerably improved the value of care delivered. As a corollary, Medicare rules involve a “claw back” stipulation in which savings are recouped from hospitals that participate in both BPCI and MSSP, effectively discouraging participation in both payment models.
Although these dynamics are complex, they highlight an intuitive point that has gained increasing awareness,5 ie, policymakers must understand the magnitude of overlap to evaluate the urgency in coordinating between the payment models. Our objective was to describe the extent of overlap and the characteristics of patients affected by it.
METHODS
We used 100% institutional Medicare claims, MSSP beneficiary attribution, and BPCI hospital data to identify fee-for-service beneficiaries attributed to MSSP and/or receiving care at BPCI hospitals for its 48 included episodes from the start of BPCI in 2013 quarter 4 through 2016 quarter 4.
We examined the trends in the number of episodes across the following three groups: MSSP-attributed patients hospitalized at BPCI hospitals for an episode included in BPCI (Overlap), MSSP-attributed patients hospitalized for that episode at non-BPCI hospitals (MSSP-only), and non-MSSP-attributed patients hospitalized at BPCI hospitals for a BPCI episode (BPCI-only). We used Medicare and United States Census Bureau data to compare groups with respect to sociodemographic (eg, age, sex, residence in a low-income area),6 clinical (eg, Elixhauser comorbidity index),7 and prior utilization (eg, skilled nursing facility discharge) characteristics.
Categorical and continuous variables were compared using logistic regression and one-way analysis of variance, respectively. Analyses were performed using Stata (StataCorp, College Station, Texas), version 15.0. Statistical tests were 2-tailed and significant at α = 0.05. This study was approved by the institutional review board at the University of Pennsylvania.
RESULTS
The number of MSSP ACOs increased from 220 in 2013 to 432 in 2016. The number of BPCI hospitals increased from 9 to 389 over this period, peaking at 413 hospitals in 2015. Over our study period, a total of 243,392, 2,824,898, and 702,864 episodes occurred in the Overlap, ACO-only, and BPCI-only groups, respectively (Table). Among episodes, patients in the Overlap group generally showed lower severity than those in other groups, although the differences were small. The BPCI-only, MSSP-only, and Overlap groups also exhibited small differences with respect to other characteristics such as the proportion of patients with Medicare/Medicaid dual-eligibility (15% of individual vs 16% and 12%, respectively) and prior use of skilled nursing facilities (33% vs 34% vs 31%, respectively) and acute care hospitals (45% vs 41% vs 39%, respectively) (P < .001 for all).
The overall overlap facing MSSP patients (overlap as a proportion of all MSSP patients) increased from 0.3% at the end of 2013 to 10% at the end of 2016, whereas over the same period, overlap facing bundled payment patients (overlap as a proportion of all bundled payment patients) increased from 11.9% to 27% (Appendix Figure). Overlap facing MSSP ACOs varied according to episode type, ranging from 3% for both acute myocardial infarction and chronic obstructive pulmonary disease episodes to 18% for automatic implantable cardiac defibrillator episodes at the end of 2016. Similarly, overlap facing bundled payment patients varied from 21% for spinal fusion episodes to 32% for lower extremity joint replacement and automatic implantable cardiac defibrillator episodes.
DISCUSSION
To our knowledge, this is the first study to describe the sizable and growing overlap facing ACOs with attributed patients who receive care at bundled payment hospitals, as well as bundled payment hospitals that treat patients attributed to ACOs.
The major implication of our findings is that policymakers must address and anticipate forthcoming payment model overlap as a key policy priority. Given the emphasis on ACOs and bundled payments as payment models—for example, Medicare continues to implement both nationwide via the Next Generation ACO model8 and the recently launched BPCI-Advanced program9—policymakers urgently need insights about the extent of payment model overlap. In that context, it is notable that although we have evaluated MSSP and BPCI as flagship programs, true overlap may actually be greater once other programs are considered.
Several factors may underlie the differences in the magnitude of overlap facing bundled payment versus ACO patients. The models differ in how they identify relevant patient populations, with patients falling under bundled payments via hospitalization for certain episode types but patients falling under ACOs via attribution based on the plurality of primary care services. Furthermore, BPCI participation lagged behind MSSP participation in time, while also occurring disproportionately in areas with existing MSSP ACOs.
Given these findings, understanding the implications of overlap should be a priority for future research and policy strategies. Potential policy considerations should include revising cost accounting processes so that when ACO-attributed patients receive episodic care at bundled payment hospitals, actual rather than historical hospital costs are counted toward ACO cost performance. To encourage hospitals to assume more accountability over outcomes—the ostensible overarching goal of value-based payment reform—Medicare could elect not to recoup savings from hospitals in both payment models. Although such changes require careful accounting to protect Medicare from financial losses as it forgoes some savings achieved through payment reforms, this may be worthwhile if hospital engagement in both models yields synergies.
Importantly, any policy changes made to address program overlap would need to accommodate ongoing changes in ACO, bundled payments, and other payment programs. For example, Medicare overhauled MSSP in December 2018. Compared to the earlier rules, in which ACOs could avoid downside financial risk altogether via “upside only” arrangements for up to six years, new MSSP rules require all participants to assume downside risk after several years of participation. Separately, forthcoming payment reforms such as direct contracting10 may draw clinicians and hospitals previously not participating in either Medicare fee-for-service or value-based payment models into payment reform. These factors may affect overlap in unpredictable ways (eg, they may increase the overlap by increasing the number of patients whose care is covered by different payment models or they may decrease overlap by raising the financial stakes of payment reforms to a degree that organizations drop out altogether).
This study has limitations. First, generalizability is limited by the fact that our analysis did not include bundled payment episodes assigned to physician group participants in BPCI or hospitals in mandatory joint replacement bundles under the Medicare Comprehensive Care for Joint Replacement model.11 Second, although this study provides the first description of overlap between ACO and bundled payment programs, it was descriptive in nature. Future research is needed to evaluate the impact of overlap on clinical, quality, and cost outcomes. This is particularly important because although we observed only small differences in patient characteristics among MSSP-only, BPCI-only, and Overlap groups, characteristics could change differentially over time. Payment reforms must be carefully monitored for potentially unintended consequences that could arise from differential changes in patient characteristics (eg, cherry-picking behavior that is disadvantageous to vulnerable individuals).
Nonetheless, this study underscores the importance and extent of overlap and the urgency to consider policy measures to coordinate between the payment models.
Acknowledgments
The authors thank research assistance from Sandra Vanderslice who did not receive any compensation for her work. This research was supported in part by The Commonwealth Fund. Rachel Werner was supported in part by K24-AG047908 from the NIA.
1. Centers for Medicare and Medicaid Services. Shared Savings Program. https://www.cms.gov/Medicare/Medicare-Fee-For-Service-Payment/sharedsavingsprogram/index.html. Accessed July 22, 2019.
2. Centers for Medicare and Medicaid Services. Bundled Payments for Care Improvement (BPCI) Initiative: General Information. https://innovation.cms.gov/initiatives/bundled-payments/. Accessed July 22, 2019.
3. Mechanic RE. When new Medicare payment systems collide. N Engl J Med. 2016;374(18):1706-1709. https://doi.org/10.1056/NEJMp1601464.
4. Ryan AM, Krinsky S, Adler-Milstein J, Damberg CL, Maurer KA, Hollingsworth JM. Association between hospitals’ engagement in value-based reforms and readmission reduction in the hospital readmission reduction program. JAMA Intern Med. 2017;177(6):863-868. https://doi.org/10.1001/jamainternmed.2017.0518.
5. Liao JM, Dykstra SE, Werner RM, Navathe AS. BPCI Advanced will further emphasize the need to address overlap between bundled payments and accountable care organizations. https://www.healthaffairs.org/do/10.1377/hblog20180409.159181/full/. Accessed May 14, 2019.
6. Census Bureau. United States Census Bureau. https://www.census.gov/. Accessed May 14, 2018.
7. van Walraven C, Austin PC, Jennings A, Quan H, Forster AJ. A modification of the elixhauser comorbidity measures into a point system for hospital death using administrative data. Med Care. 2009;47(6):626-633. https://doi.org/10.1097/MLR.0b013e31819432e5.
8. Centers for Medicare and Medicaid Services. Next, Generation ACO Model. https://innovation.cms.gov/initiatives/next-generation-aco-model/. Accessed July 22, 2019.
9. Centers for Medicare and Medicaid Services. BPCI Advanced. https://innovation.cms.gov/initiatives/bpci-advanced. Accessed July 22, 2019.
10. Centers for Medicare and Medicaid Services. Direct Contracting. https://www.cms.gov/newsroom/fact-sheets/direct-contracting. Accessed July 22, 2019.
11. Centers for Medicare and Medicaid Services. Comprehensive Care for Joint Replacement Model. https://innovation.cms.gov/initiatives/CJR. Accessed July 22, 2019.
Voluntary accountable care organizations (ACOs) and bundled payments have concurrently become cornerstone strategies in Medicare’s shift from volume-based fee-for-service toward value-based payment.
Physician practice and hospital participation in Medicare’s largest ACO model, the Medicare Shared Savings Program (MSSP),1 grew to include 561 organizations in 2018. Under MSSP, participants assume financial accountability for the global quality and costs of care for defined populations of Medicare fee-for-service patients. ACOs that manage to maintain or improve quality while achieving savings (ie, containing costs below a predefined population-wide spending benchmark) are eligible to receive a portion of the difference back from Medicare in the form of “shared savings”.
Similarly, hospital participation in Medicare’s bundled payment programs has grown over time. Most notably, more than 700 participants enrolled in the recently concluded Bundled Payments for Care Improvement (BPCI) initiative,2 Medicare’s largest bundled payment program over the past five years.3 Under BPCI, participants assumed financial accountability for the quality and costs of care for all Medicare patients triggering a qualifying “episode of care”. Participants that limit episode spending below a predefined benchmark without compromising quality were eligible for financial incentives.
As both ACOs and bundled payments grow in prominence and scale, they may increasingly overlap if patients attributed to ACOs receive care at bundled payment hospitals. Overlap could create synergies by increasing incentives to address shared processes (eg, discharge planning) or outcomes (eg, readmissions).4 An ACO focus on reducing hospital admissions could complement bundled payment efforts to increase hospital efficiency.
Conversely, Medicare’s approach to allocating savings and losses can penalize ACOs or bundled payment participants.3 For example, when a patient included in an MSSP ACO population receives episodic care at a hospital participating in BPCI, the historical costs of care for the hospital and the episode type, not the actual costs of care for that specific patient and his/her episode, are counted in the performance of the ACO. In other words, in these cases, the performance of the MSSP ACO is dependent on the historical spending at BPCI hospitals—despite it being out of ACO’s control and having little to do with the actual care its patients receive at BPCI hospitals—and MSSP ACOs cannot benefit from improvements over time. Therefore, MSSP ACOs may be functionally penalized if patients receive care at historically high-cost BPCI hospitals regardless of whether they have considerably improved the value of care delivered. As a corollary, Medicare rules involve a “claw back” stipulation in which savings are recouped from hospitals that participate in both BPCI and MSSP, effectively discouraging participation in both payment models.
Although these dynamics are complex, they highlight an intuitive point that has gained increasing awareness,5 ie, policymakers must understand the magnitude of overlap to evaluate the urgency in coordinating between the payment models. Our objective was to describe the extent of overlap and the characteristics of patients affected by it.
METHODS
We used 100% institutional Medicare claims, MSSP beneficiary attribution, and BPCI hospital data to identify fee-for-service beneficiaries attributed to MSSP and/or receiving care at BPCI hospitals for its 48 included episodes from the start of BPCI in 2013 quarter 4 through 2016 quarter 4.
We examined the trends in the number of episodes across the following three groups: MSSP-attributed patients hospitalized at BPCI hospitals for an episode included in BPCI (Overlap), MSSP-attributed patients hospitalized for that episode at non-BPCI hospitals (MSSP-only), and non-MSSP-attributed patients hospitalized at BPCI hospitals for a BPCI episode (BPCI-only). We used Medicare and United States Census Bureau data to compare groups with respect to sociodemographic (eg, age, sex, residence in a low-income area),6 clinical (eg, Elixhauser comorbidity index),7 and prior utilization (eg, skilled nursing facility discharge) characteristics.
Categorical and continuous variables were compared using logistic regression and one-way analysis of variance, respectively. Analyses were performed using Stata (StataCorp, College Station, Texas), version 15.0. Statistical tests were 2-tailed and significant at α = 0.05. This study was approved by the institutional review board at the University of Pennsylvania.
RESULTS
The number of MSSP ACOs increased from 220 in 2013 to 432 in 2016. The number of BPCI hospitals increased from 9 to 389 over this period, peaking at 413 hospitals in 2015. Over our study period, a total of 243,392, 2,824,898, and 702,864 episodes occurred in the Overlap, ACO-only, and BPCI-only groups, respectively (Table). Among episodes, patients in the Overlap group generally showed lower severity than those in other groups, although the differences were small. The BPCI-only, MSSP-only, and Overlap groups also exhibited small differences with respect to other characteristics such as the proportion of patients with Medicare/Medicaid dual-eligibility (15% of individual vs 16% and 12%, respectively) and prior use of skilled nursing facilities (33% vs 34% vs 31%, respectively) and acute care hospitals (45% vs 41% vs 39%, respectively) (P < .001 for all).
The overall overlap facing MSSP patients (overlap as a proportion of all MSSP patients) increased from 0.3% at the end of 2013 to 10% at the end of 2016, whereas over the same period, overlap facing bundled payment patients (overlap as a proportion of all bundled payment patients) increased from 11.9% to 27% (Appendix Figure). Overlap facing MSSP ACOs varied according to episode type, ranging from 3% for both acute myocardial infarction and chronic obstructive pulmonary disease episodes to 18% for automatic implantable cardiac defibrillator episodes at the end of 2016. Similarly, overlap facing bundled payment patients varied from 21% for spinal fusion episodes to 32% for lower extremity joint replacement and automatic implantable cardiac defibrillator episodes.
DISCUSSION
To our knowledge, this is the first study to describe the sizable and growing overlap facing ACOs with attributed patients who receive care at bundled payment hospitals, as well as bundled payment hospitals that treat patients attributed to ACOs.
The major implication of our findings is that policymakers must address and anticipate forthcoming payment model overlap as a key policy priority. Given the emphasis on ACOs and bundled payments as payment models—for example, Medicare continues to implement both nationwide via the Next Generation ACO model8 and the recently launched BPCI-Advanced program9—policymakers urgently need insights about the extent of payment model overlap. In that context, it is notable that although we have evaluated MSSP and BPCI as flagship programs, true overlap may actually be greater once other programs are considered.
Several factors may underlie the differences in the magnitude of overlap facing bundled payment versus ACO patients. The models differ in how they identify relevant patient populations, with patients falling under bundled payments via hospitalization for certain episode types but patients falling under ACOs via attribution based on the plurality of primary care services. Furthermore, BPCI participation lagged behind MSSP participation in time, while also occurring disproportionately in areas with existing MSSP ACOs.
Given these findings, understanding the implications of overlap should be a priority for future research and policy strategies. Potential policy considerations should include revising cost accounting processes so that when ACO-attributed patients receive episodic care at bundled payment hospitals, actual rather than historical hospital costs are counted toward ACO cost performance. To encourage hospitals to assume more accountability over outcomes—the ostensible overarching goal of value-based payment reform—Medicare could elect not to recoup savings from hospitals in both payment models. Although such changes require careful accounting to protect Medicare from financial losses as it forgoes some savings achieved through payment reforms, this may be worthwhile if hospital engagement in both models yields synergies.
Importantly, any policy changes made to address program overlap would need to accommodate ongoing changes in ACO, bundled payments, and other payment programs. For example, Medicare overhauled MSSP in December 2018. Compared to the earlier rules, in which ACOs could avoid downside financial risk altogether via “upside only” arrangements for up to six years, new MSSP rules require all participants to assume downside risk after several years of participation. Separately, forthcoming payment reforms such as direct contracting10 may draw clinicians and hospitals previously not participating in either Medicare fee-for-service or value-based payment models into payment reform. These factors may affect overlap in unpredictable ways (eg, they may increase the overlap by increasing the number of patients whose care is covered by different payment models or they may decrease overlap by raising the financial stakes of payment reforms to a degree that organizations drop out altogether).
This study has limitations. First, generalizability is limited by the fact that our analysis did not include bundled payment episodes assigned to physician group participants in BPCI or hospitals in mandatory joint replacement bundles under the Medicare Comprehensive Care for Joint Replacement model.11 Second, although this study provides the first description of overlap between ACO and bundled payment programs, it was descriptive in nature. Future research is needed to evaluate the impact of overlap on clinical, quality, and cost outcomes. This is particularly important because although we observed only small differences in patient characteristics among MSSP-only, BPCI-only, and Overlap groups, characteristics could change differentially over time. Payment reforms must be carefully monitored for potentially unintended consequences that could arise from differential changes in patient characteristics (eg, cherry-picking behavior that is disadvantageous to vulnerable individuals).
Nonetheless, this study underscores the importance and extent of overlap and the urgency to consider policy measures to coordinate between the payment models.
Acknowledgments
The authors thank research assistance from Sandra Vanderslice who did not receive any compensation for her work. This research was supported in part by The Commonwealth Fund. Rachel Werner was supported in part by K24-AG047908 from the NIA.
1. Centers for Medicare and Medicaid Services. Shared Savings Program. https://www.cms.gov/Medicare/Medicare-Fee-For-Service-Payment/sharedsavingsprogram/index.html. Accessed July 22, 2019.
2. Centers for Medicare and Medicaid Services. Bundled Payments for Care Improvement (BPCI) Initiative: General Information. https://innovation.cms.gov/initiatives/bundled-payments/. Accessed July 22, 2019.
3. Mechanic RE. When new Medicare payment systems collide. N Engl J Med. 2016;374(18):1706-1709. https://doi.org/10.1056/NEJMp1601464.
4. Ryan AM, Krinsky S, Adler-Milstein J, Damberg CL, Maurer KA, Hollingsworth JM. Association between hospitals’ engagement in value-based reforms and readmission reduction in the hospital readmission reduction program. JAMA Intern Med. 2017;177(6):863-868. https://doi.org/10.1001/jamainternmed.2017.0518.
5. Liao JM, Dykstra SE, Werner RM, Navathe AS. BPCI Advanced will further emphasize the need to address overlap between bundled payments and accountable care organizations. https://www.healthaffairs.org/do/10.1377/hblog20180409.159181/full/. Accessed May 14, 2019.
6. Census Bureau. United States Census Bureau. https://www.census.gov/. Accessed May 14, 2018.
7. van Walraven C, Austin PC, Jennings A, Quan H, Forster AJ. A modification of the elixhauser comorbidity measures into a point system for hospital death using administrative data. Med Care. 2009;47(6):626-633. https://doi.org/10.1097/MLR.0b013e31819432e5.
8. Centers for Medicare and Medicaid Services. Next, Generation ACO Model. https://innovation.cms.gov/initiatives/next-generation-aco-model/. Accessed July 22, 2019.
9. Centers for Medicare and Medicaid Services. BPCI Advanced. https://innovation.cms.gov/initiatives/bpci-advanced. Accessed July 22, 2019.
10. Centers for Medicare and Medicaid Services. Direct Contracting. https://www.cms.gov/newsroom/fact-sheets/direct-contracting. Accessed July 22, 2019.
11. Centers for Medicare and Medicaid Services. Comprehensive Care for Joint Replacement Model. https://innovation.cms.gov/initiatives/CJR. Accessed July 22, 2019.
© 2019 Society of Hospital Medicine
Nationwide Hospital Performance on Publicly Reported Episode Spending Measures
Amid the continued shift from fee-for-service toward value-based payment, policymakers such as the Centers for Medicare & Medicaid Services have initiated strategies to contain spending on episodes of care. This episode focus has led to nationwide implementation of payment models such as bundled payments, which hold hospitals accountable for quality and costs across procedure-based (eg, coronary artery bypass surgery) and condition-based (eg, congestive heart failure) episodes, which begin with hospitalization and encompass subsequent hospital and postdischarge care.
Simultaneously, Medicare has increased its emphasis on similarly designed episodes of care (eg, those spanning hospitalization and postdischarge care) using other strategies, such as public reporting and use of episode-based measures to evaluate hospital cost performance. In 2017, Medicare trialed the implementation of six Clinical Episode-Based Payment (CEBP) measures in the national Hospital Inpatient Quality Reporting Program in order to assess hospital and clinician spending on procedure and condition episodes.1,2
CEBP measures reflect episode-specific spending, conveying “how expensive a hospital is” by capturing facility and professional payments for a given episode spanning between 3 days prior to hospitalization and 30 days following discharge. Given standard payment rates used in Medicare, the variation in episode spending reflects differences in quantity and type of services utilized within an episode. Medicare has specified episode-related services and designed CEBP measures via logic and definition rules informed by a combination of claims and procedures-based grouping, as well as by physician input. For example, the CEBP measure for cellulitis encompasses services related to diagnosing and treating the infection within the episode window, but not unrelated services such as eye exams for coexisting glaucoma. To increase clinical salience, CEBP measures are subdivided to reflect differing complexity when possible. For instance, cellulitis measures are divided into episodes with or without major complications or comorbidities and further subdivided into subtypes for episodes reflecting cellulitis in patients with diabetes, patients with decubitus ulcers, or neither.
CEBPs are similar to other spending measures used in payment programs, such as the Medicare Spending Per Beneficiary, but are more clinically relevant because their focus on episodes more closely reflects clinical practice. CEBPs and Medicare Spending Per Beneficiary have similar designs (eg, same episode windows) and purpose (eg, to capture the cost efficiency of hospital care).3 However, unlike CEBPs, Medicare Spending Per Beneficiary is a “global” measure that summarizes a hospital’s cost efficiency aggregated across all inpatient episodes rather than represent it based on specific conditions or procedures.4 The limitations of publicly reported global hospital measures—for instance, the poor correlation between hospital performance on distinct publicly reported quality measures5—highlight the potential utility of episode-specific spending measures such as CEBP.
Compared with episode-based payment models, initiatives such as CEBP measures have gone largely unstudied. However, they represent signals of Medicare’s growing commitment to addressing care episodes, tested without potentially tedious rulemaking required to change payment. In fact, publicly reported episode spending measures offer policymakers several interrelated benefits: the ability to rapidly evaluate performance at a large number of hospitals (eg, Medicare scaling up CEBP measures among all eligible hospitals nationwide), the option of leveraging publicly reported feedback to prompt clinical improvements (eg, by including CEBP measures in the Hospital Inpatient Quality Reporting Program), and the platform for developing and testing promising spending measures for subsequent use in formal payment models (eg, by using CEBP measures that possess large variation or cost-reduction opportunities in future bundled payment programs).
Despite these benefits, little is known about hospital performance on publicly reported episode-specific spending measures. We addressed this knowledge gap by providing what is, to our knowledge, the first nationwide description of hospital performance on such measures. We also evaluated which episode components accounted for spending variation in procedural vs condition episodes, examined whether CEBP measures can be used to effectively identify high- vs low-cost hospitals, and compared spending performance on CEBPs vs Medicare Spending Per Beneficiary.
METHODS
Data and Study Sample
We utilized publicly available data from Hospital Compare, which include information about hospital-level CEBP and Medicare Spending Per Beneficiary performance for Medicare-certified acute care hospitals nationwide.5 Our analysis evaluated the six CEBP measures tested by Medicare in 2017: three conditions (cellulitis, kidney/urinary tract infection [UTI], gastrointestinal hemorrhage) and three procedures (spinal fusion, cholecystectomy and common duct exploration, and aortic aneurysm repair). Per Medicare rules, CEBP measures are calculated only for hospitals with requisite volume for targeted conditions (minimum of 40 episodes) and procedures (minimum of 25 episodes) and are reported on Hospital Compare in risk-adjusted (eg, for age, hierarchical condition categories in alignment with existing Medicare methodology) and payment-standardized form (ie, accounts for wage index, medical education, disproportionate share hospital payments) . Each CEBP encompasses episodes with or without major complications/comorbidities.
For each hospital, CEBP spending is reported as average total episode spending, as well as average spending on specific components. We grouped components into three groups: hospitalization, skilled nursing facility (SNF) use, and other (encompassing postdischarge readmissions, emergency department visits, and home health agency use), with a focus on SNF given existing evidence from episode-based payment models about the opportunity for savings from reduced SNF care. Hospital Compare also provides information about the national CEBP measure performance (ie, average spending for a given episode type among all eligible hospitals nationwide).
Hospital Groups
To evaluate hospitals’ CEBP performance for specific episode types, we categorized hospitals as either “below average spending” if their average episode spending was below the national average or “above average spending” if spending was above the national average. According to this approach, a hospital could have below average spending for some episodes but above average spending for others.
To compare hospitals across episode types simultaneously, we categorized hospitals as “low cost” if episode spending was below the national average for all applicable measures, “high cost” if episode spending was above the national average for all applicable measures, or “mixed cost” if episode spending was above the national average for some measures and below for others.
We also conducted sensitivity analyses using alternative hospital group definitions. For comparisons of specific episode types, we categorized hospitals as “high spending” (top quartile of average episode spending among eligible hospitals) or “other spending” (all others). For comparisons across all episode types, we focused on SNF care and categorized hospitals as “high SNF cost” (top quartile of episode spending attributed to SNF care) and “other SNF cost” (all others). We applied a similar approach to Medicare Spending Per Beneficiary, categorizing hospitals as either “low MSPB cost” if their episode spending was below the national average for Medicare Spending Per Beneficiary or “high MSPB cost” if not.
Statistical Analysis
We assessed variation by describing the distribution of total episode spending across eligible hospitals for each individual episode type, as well as the proportion of spending attributed to SNF care across all episode types. We reported the difference between the 10th and 90th percentile for each distribution to quantify variation. To evaluate how individual episode components contributed to overall spending variation, we used linear regression and applied analysis of variance to each episode component. Specifically, we regressed episode spending on each episode component (hospital, SNF, other) separately and used these results to generate predicted episode spending values for each hospital based on its value for each spending component. We then calculated the differen-ces (ie, residuals) between predicted and actual total episode spending values. We plotted residuals for each component, with lower residual plot variation (ie, a flatter curve) representing larger contribution of a spending component to overall spending variation.
Pearson correlation coefficients were used to assess within-hospital CEBP correlation (ie, the extent to which performance was hospital specific). We evaluated if and how components of spending varied across hospitals by comparing spending groups (for individual episode types) and cost groups (for all episode types). To test the robustness of these categories, we conducted sensitivity analyses using high spending vs other spending groups (for individual episode types) and high SNF cost vs low SNF cost groups (for all episode types).
To assess concordance between CEBP and Medicare Spending Per Beneficiary, we cross tabulated hospital CEBP performance (high vs low vs mixed cost) and Medicare Spending Per Beneficiary performance (high vs low MSPB cost). This approached allowed us to quantify the number of hospitals that have concordant performance for both types of spending measures (ie, high cost or low cost on both) and the number with discordant performance (eg, high cost on one spending measure but low cost on the other). We used Pearson correlation coefficients to assess correlation between CEBP and Medicare Spending Per Beneficiary, with evaluation of CEBP performance in aggregate form (ie, hospitals’ average CEBP performance across all eligible episode types) and by individual episode types.
Chi-square and Kruskal-Wallis tests were used to compare categorical and continuous variables, respectively. To compare spending amounts, we evaluated the distribution of total episode spending (Appendix Figure 1) and used ordinary least squares regression with spending as the dependent variable and hospital group, episode components, and their interaction as independent variables. Because CEBP dollar amounts are reported through Hospital Compare on a risk-adjusted and payment-standardized basis, no additional adjustments were applied. Analyses were performed using SAS version 9.4 (SAS Institute; Cary, NC) and all tests of significance were two-tailed at alpha=0.05.
RESULTS
Of 3,129 hospitals, 1,778 achieved minimum thresholds and had CEBPs calculated for at least one of the six CEBP episode types.
Variation in CEBP Performance
For each episode type, spending varied across eligible hospitals (Appendix Figure 2). In particular, the difference between the 10th and 90th percentile values for cellulitis, kidney/UTI, and gastrointestinal hemorrhage were $2,873, $3,514, and $2,982, respectively. Differences were greater for procedural episodes of aortic aneurysm ($17,860), spinal fusion ($11,893), and cholecystectomy ($3,689). Evaluated across all episode types, the proportion of episode spending attributed to SNF care also varied across hospitals (Appendix Figure 3), with a difference of 24.7% between the 10th (4.5%) and 90th (29.2%) percentile values.
Residual plots demonstrated differences in which episode components accounted for variation in overall spending. For aortic aneurysm episodes, variation in the SNF episode component best explained variation in episode spending and thus had the lowest residual plot variation, followed by other and hospital components (Figure). Similar patterns were observed for spinal fusion and cholecystectomy episodes. In contrast, for cellulitis episodes, all three components had comparable residual-plot variation, which indicates that the variation in the components explained episode spending variation similarly (Figure)—a pattern reflected in kidney/UTI and gastrointestinal hemorrhage episodes.

Correlation in Performance on CEBP Measures
Across hospitals in our sample, within-hospital correlations were generally low (Appendix Table 1). In particular, correlations ranged from
CEBP Performance by Hospital Groups
Overall spending on specific episode types varied across hospital groups (Table). Spending for aortic aneurysm episodes was $42,633 at hospitals with above average spending and $37,730 at those with below average spending, while spending for spinal fusion episodes was $39,231 at those with above average spending and $34,832 at those with below average spending. In comparison, spending at hospitals deemed above and below average spending for cellulitis episodes was $10,763 and $9,064, respectively, and $11,223 and $9,161 at hospitals deemed above and below average spending for kidney/UTI episodes, respectively.

Spending on specific episode components also differed by hospital group (Table). Though the magnitude of absolute spending amounts and differences varied by specific episode, hospitals with above average spending tended to spend more on SNF than did those with below average spending. For example, hospitals with above average spending for cellulitis episodes spent an average of $2,564 on SNF (24% of overall episode spending) vs $1,293 (14% of episode spending) among those with below average spending. Similarly, hospitals with above and below average spending for kidney/UTI episodes spent $4,068 (36% of episode spending) and $2,232 (24% of episode spending) on SNF, respectively (P < .001 for both episode types). Findings were qualitatively similar in sensitivity analyses (Appendix Table 2).
Among hospitals in our sample, we categorized 481 as high cost (27%), 452 as low cost (25%), and 845 as mixed cost (48%), with hospital groups distributed broadly nationwide (Appendix Figure 4). Evaluated on performance across all six episode types, hospital groups also demonstrated differences in spending by cost components (Table). In particular, spending in SNF ranged from 18.1% of overall episode spending among high-cost hospitals to 10.7% among mixed-cost hospitals and 9.2% among low-cost hospitals. Additionally, spending on hospitalization accounted for 83.3% of overall episode spending among low-cost hospitals, compared with 81.2% and 73.4% among mixed-cost and high-cost hospitals, respectively (P < .001). Comparisons were qualitatively similar in sensitivity analyses (Appendix Table 3).
Comparison of CEBP and Medicare Spending Per Beneficiary Performance
Correlation between Medicare Spending Per Beneficiary and aggregated CEBPs was 0.42 and, for individual episode types, ranged between 0.14 and 0.36 (Appendix Table 2). There was low concordance between hospital performance on CEBP and Medicare Spending Per Beneficiary. Across all eligible hospitals, only 16.3% (290/1778) had positive concordance between performance on the two measure types (ie, low cost for both), while 16.5% (293/1778) had negative concordance (ie, high cost for both). There was discordant performance in most instances (67.2%; 1195/1778), which reflecting favorable performance on one measure type but not the other.
DISCUSSION
To our knowledge, this study is the first to describe hospitals’ episode-specific spending performance nationwide. It demonstrated significant variation across hospitals driven by different episode components for different episode types. It also showed low correlation between individual episode spending measures and poor concordance between episode-specific and global hospital spending measures. Two practice and policy implications are noteworthy.
First, our findings corroborate and build upon evidence from bundled payment programs about the opportunity for hospitals to improve their cost efficiency. Findings from bundled payment evaluations of surgical episodes suggest that the major area for cost savings is in the reduction of institutional post-acute care use such as that of SNFs.7-9 We demonstrated similar opportunity in a national sample of hospitals, finding that, for the three evaluated procedural CEBPs, SNF care accounted for more variation in overall episode spending than did other components. While variation may imply opportunity for greater efficiency and standardization, it is important to note that variation itself is not inherently problematic. Additional studies are needed to distinguish between warranted and unwarranted variation in procedural episodes, as well as identify strategies for reducing the latter.
Though bundled payment evaluations have predominantly emphasized procedural episodes, existing evidence suggests that participation in medical condition bundles has not been associated with cost savings or utilization changes.7-15 Findings from our analysis of variance—that there appear to be smaller variation-reduction opportunities for condition episodes than for procedural episodes—offer insight into this issue. Existing episodes are initiated by hospitalization and extend into the postacute period, a design that may not afford substantial post-acute care savings opportunities for condition episodes. This is an important insight as policymakers consider how to best design condition-based episodes in the future (eg, whether to use non–hospital based episode triggers). Future work should evaluate whether our findings reflect inherent differences between condition and procedural episodes16 or whether interventions can still optimize SNF care for these episodes despite smaller variation.
Second, our results highlight the potential limitations of global performance measures such as Medicare Spending Per Beneficiary. As a general measure of hospital spending, Medicare Spending Per Beneficiary is based on the premise that hospitals can be categorized as high or low cost with consideration of all inpatient episodic care. However, our analyses suggest that hospitals may be high cost for certain episodes and low cost for others—a fact highlighted by the low correlation and high discordance observed between hospital CEBP and Medicare Spending Per Beneficiary performance. Because overarching measures may miss spending differen-ces related to underlying clinical scenarios, episode-specific spending measures would provide important perspective and complements to global measures for assessing hospital cost performance, particularly in an era of value-based payments. Policymakers should consider prioritizing the development and implementation of such measures.
Our study has limitations. First, it is descriptive in nature, and future work should evaluate the association between episode-specific spending measure performance and clinical and quality outcomes. Second, we evaluated all CEBP-eligible hospitals nationwide to provide a broad view of episode-specific spending. However, future studies should assess performance among hospital subtypes, such as vertically integrated or safety-net organizations, because they may be more or less able to perform on these spending measures. Third, though findings may not be generalizable to other clinical episodes, our results were qualitatively consistent across episode types and broadly consistent with evidence from episode-based payment models. Fourth, we analyzed cost from the perspective of utilization and did not incorporate price considerations, which may be more relevant for commercial insurers than it is for Medicare.
Nonetheless, the emergence of CEBPs reflects the ongoing shift in policymaker attention toward episode-specific spending. In particular, though further scale or use of CEBP measures has been put on hold amid other payment reform changes, their nationwide implementation in 2017 signals Medicare’s broad interest in evaluating all hospitals on episode-specific spending efficiency, in addition to other facets of spending, quality, safety, and patient experience. Importantly, such efforts complement other ongoing nationwide initiatives for emphasizing episode spending, such as use of episode-based cost measures within the Merit-Based Incentive Payment System17 to score clinicians and groups in part based on their episode-specific spending efficiency. Insight about episode spending performance could help hospitals prepare for environments with increasing focus on episode spending and as policymakers incorporate this perspective into quality and value-based payment policies.
1. Centers for Medicare & Medicaid Services. Fiscal Year 2019 Clinical Episode-Based Payment Measures Overview. https://www.qualityreportingcenter.com/globalassets/migrated-pdf/cepb_slides_npc-6.17.2018_5.22.18_vfinal508.pdf. Accessed November 26, 2019.
2. Centers for Medicare & Medicaid Services. Hospital Inpatient Quality Reporting Program. https://www.cms.gov/Medicare/Quality-Initiatives-Patient-Assessment-Instruments/HospitalQualityInits/HospitalRHQDAPU.html. Accessed November 23, 2019.
3. Centers for Medicare & Medicaid Services. Medicare Spending Per Beneficiary (MSPB) Spending Breakdown by Claim Type. https://www.cms.gov/Medicare/Quality-Initiatives-Patient-Assessment-Instruments/hospital-value-based-purchasing/Downloads/Fact-Sheet-MSPB-Spending-Breakdowns-by-Claim-Type-Dec-2014.pdf. Accessed November 25, 2019.
4. Hu J, Jordan J, Rubinfeld I, Schreiber M, Waterman B, Nerenz D. Correlations among hospital quality measure: What “Hospital Compare” data tell us. Am J Med Qual. 2017;32(6):605-610. https://doi.org/10.1177/1062860616684012.
5. Centers for Medicare & Medicaid Services. Hospital Compare datasets. https://data.medicare.gov/data/hospital-compare. Accessed November 26, 2019.
6. American Hospital Association. AHA Data Products. https://www.aha.org/data-insights/aha-data-products. Accessed November 25, 2019.
7. Dummit LA, Kahvecioglu D, Marrufo G, et al. Bundled payment initiative and payments and quality outcomes for lower extremity joint replacement episodes. JAMA. 2016; 316(12):1267-1278. https://doi.org/10.1001/jama.2016.12717.
8. Finkelstein A, Ji Y, Mahoney N, Skinner J. Mandatory medicare bundled payment program for lower extremity joint replacement and discharge to institutional postacute care: Interim analysis of the first year of a 5-year randomized trial. JAMA. 2018;320(9):892-900. https://doi.org/10.1001/jama.2018.12346.
9. Navathe AS, Troxel AB, Liao JM, et al. Cost of joint replacement using bundled payment models. JAMA Intern Med. 2017;177(2):214-222. https://doi.org/10.1001/jamainternmed.2016.8263.
10. Liao JM, Emanuel EJ, Polsky DE, et al. National representativeness of hospitals and markets in Medicare’s mandatory bundled payment program. Health Aff. 2019;38(1):44-53.
11. Barnett ML, Wilcock A, McWilliams JM, et al. Two-year evaluation of mandatory bundled payments for joint replacement. N Engl J Med. 2019;380(3):252-262. https://doi.org/10.1056/NEJMsa1809010.
12. Navathe AS, Liao JM, Polsky D, et al. Comparison of hospitals participating in Medicare’s voluntary and mandatory orthopedic bundle programs. Health Aff. 2018;37(6):854-863. https://www.doi.org/10.1377/hlthaff.2017.1358.
13. Joynt Maddox KE, Orav EJ, Zheng J, Epstein AM. Participation and Dropout in the Bundled Payments for Care Improvement Initiative. JAMA. 2018;319(2):191-193. https://doi.org/10.1001/jama.2017.14771.
14. Navathe AS, Liao JM, Dykstra SE, et al. Association of hospital participation in a Medicare bundled payment program with volume and case mix of lower extremity joint replacement episodes. JAMA. 2018;320(9):901-910. https://doi.org/10.1001/jama.2018.12345.
15. Joynt Maddox KE, Orav EJ, Epstein AM. Medicare’s bundled payments initiative for medical conditions. N Engl J Med. 2018;379(18):e33. https://doi.org/10.1056/NEJMc1811049.
16. Navathe AS, Shan E, Liao JM. What have we learned about bundling medical conditions? Health Affairs Blog. https://www.healthaffairs.org/do/10.1377/hblog20180828.844613/full/. Accessed November 25, 2019.
17. Centers for Medicare & Medicaid Services. MACRA. https://www.cms.gov/medicare/quality-initiatives-patient-assessment-instruments/value-based-programs/macra-mips-and-apms/macra-mips-and-apms.html. Accessed November 26, 2019.
Amid the continued shift from fee-for-service toward value-based payment, policymakers such as the Centers for Medicare & Medicaid Services have initiated strategies to contain spending on episodes of care. This episode focus has led to nationwide implementation of payment models such as bundled payments, which hold hospitals accountable for quality and costs across procedure-based (eg, coronary artery bypass surgery) and condition-based (eg, congestive heart failure) episodes, which begin with hospitalization and encompass subsequent hospital and postdischarge care.
Simultaneously, Medicare has increased its emphasis on similarly designed episodes of care (eg, those spanning hospitalization and postdischarge care) using other strategies, such as public reporting and use of episode-based measures to evaluate hospital cost performance. In 2017, Medicare trialed the implementation of six Clinical Episode-Based Payment (CEBP) measures in the national Hospital Inpatient Quality Reporting Program in order to assess hospital and clinician spending on procedure and condition episodes.1,2
CEBP measures reflect episode-specific spending, conveying “how expensive a hospital is” by capturing facility and professional payments for a given episode spanning between 3 days prior to hospitalization and 30 days following discharge. Given standard payment rates used in Medicare, the variation in episode spending reflects differences in quantity and type of services utilized within an episode. Medicare has specified episode-related services and designed CEBP measures via logic and definition rules informed by a combination of claims and procedures-based grouping, as well as by physician input. For example, the CEBP measure for cellulitis encompasses services related to diagnosing and treating the infection within the episode window, but not unrelated services such as eye exams for coexisting glaucoma. To increase clinical salience, CEBP measures are subdivided to reflect differing complexity when possible. For instance, cellulitis measures are divided into episodes with or without major complications or comorbidities and further subdivided into subtypes for episodes reflecting cellulitis in patients with diabetes, patients with decubitus ulcers, or neither.
CEBPs are similar to other spending measures used in payment programs, such as the Medicare Spending Per Beneficiary, but are more clinically relevant because their focus on episodes more closely reflects clinical practice. CEBPs and Medicare Spending Per Beneficiary have similar designs (eg, same episode windows) and purpose (eg, to capture the cost efficiency of hospital care).3 However, unlike CEBPs, Medicare Spending Per Beneficiary is a “global” measure that summarizes a hospital’s cost efficiency aggregated across all inpatient episodes rather than represent it based on specific conditions or procedures.4 The limitations of publicly reported global hospital measures—for instance, the poor correlation between hospital performance on distinct publicly reported quality measures5—highlight the potential utility of episode-specific spending measures such as CEBP.
Compared with episode-based payment models, initiatives such as CEBP measures have gone largely unstudied. However, they represent signals of Medicare’s growing commitment to addressing care episodes, tested without potentially tedious rulemaking required to change payment. In fact, publicly reported episode spending measures offer policymakers several interrelated benefits: the ability to rapidly evaluate performance at a large number of hospitals (eg, Medicare scaling up CEBP measures among all eligible hospitals nationwide), the option of leveraging publicly reported feedback to prompt clinical improvements (eg, by including CEBP measures in the Hospital Inpatient Quality Reporting Program), and the platform for developing and testing promising spending measures for subsequent use in formal payment models (eg, by using CEBP measures that possess large variation or cost-reduction opportunities in future bundled payment programs).
Despite these benefits, little is known about hospital performance on publicly reported episode-specific spending measures. We addressed this knowledge gap by providing what is, to our knowledge, the first nationwide description of hospital performance on such measures. We also evaluated which episode components accounted for spending variation in procedural vs condition episodes, examined whether CEBP measures can be used to effectively identify high- vs low-cost hospitals, and compared spending performance on CEBPs vs Medicare Spending Per Beneficiary.
METHODS
Data and Study Sample
We utilized publicly available data from Hospital Compare, which include information about hospital-level CEBP and Medicare Spending Per Beneficiary performance for Medicare-certified acute care hospitals nationwide.5 Our analysis evaluated the six CEBP measures tested by Medicare in 2017: three conditions (cellulitis, kidney/urinary tract infection [UTI], gastrointestinal hemorrhage) and three procedures (spinal fusion, cholecystectomy and common duct exploration, and aortic aneurysm repair). Per Medicare rules, CEBP measures are calculated only for hospitals with requisite volume for targeted conditions (minimum of 40 episodes) and procedures (minimum of 25 episodes) and are reported on Hospital Compare in risk-adjusted (eg, for age, hierarchical condition categories in alignment with existing Medicare methodology) and payment-standardized form (ie, accounts for wage index, medical education, disproportionate share hospital payments) . Each CEBP encompasses episodes with or without major complications/comorbidities.
For each hospital, CEBP spending is reported as average total episode spending, as well as average spending on specific components. We grouped components into three groups: hospitalization, skilled nursing facility (SNF) use, and other (encompassing postdischarge readmissions, emergency department visits, and home health agency use), with a focus on SNF given existing evidence from episode-based payment models about the opportunity for savings from reduced SNF care. Hospital Compare also provides information about the national CEBP measure performance (ie, average spending for a given episode type among all eligible hospitals nationwide).
Hospital Groups
To evaluate hospitals’ CEBP performance for specific episode types, we categorized hospitals as either “below average spending” if their average episode spending was below the national average or “above average spending” if spending was above the national average. According to this approach, a hospital could have below average spending for some episodes but above average spending for others.
To compare hospitals across episode types simultaneously, we categorized hospitals as “low cost” if episode spending was below the national average for all applicable measures, “high cost” if episode spending was above the national average for all applicable measures, or “mixed cost” if episode spending was above the national average for some measures and below for others.
We also conducted sensitivity analyses using alternative hospital group definitions. For comparisons of specific episode types, we categorized hospitals as “high spending” (top quartile of average episode spending among eligible hospitals) or “other spending” (all others). For comparisons across all episode types, we focused on SNF care and categorized hospitals as “high SNF cost” (top quartile of episode spending attributed to SNF care) and “other SNF cost” (all others). We applied a similar approach to Medicare Spending Per Beneficiary, categorizing hospitals as either “low MSPB cost” if their episode spending was below the national average for Medicare Spending Per Beneficiary or “high MSPB cost” if not.
Statistical Analysis
We assessed variation by describing the distribution of total episode spending across eligible hospitals for each individual episode type, as well as the proportion of spending attributed to SNF care across all episode types. We reported the difference between the 10th and 90th percentile for each distribution to quantify variation. To evaluate how individual episode components contributed to overall spending variation, we used linear regression and applied analysis of variance to each episode component. Specifically, we regressed episode spending on each episode component (hospital, SNF, other) separately and used these results to generate predicted episode spending values for each hospital based on its value for each spending component. We then calculated the differen-ces (ie, residuals) between predicted and actual total episode spending values. We plotted residuals for each component, with lower residual plot variation (ie, a flatter curve) representing larger contribution of a spending component to overall spending variation.
Pearson correlation coefficients were used to assess within-hospital CEBP correlation (ie, the extent to which performance was hospital specific). We evaluated if and how components of spending varied across hospitals by comparing spending groups (for individual episode types) and cost groups (for all episode types). To test the robustness of these categories, we conducted sensitivity analyses using high spending vs other spending groups (for individual episode types) and high SNF cost vs low SNF cost groups (for all episode types).
To assess concordance between CEBP and Medicare Spending Per Beneficiary, we cross tabulated hospital CEBP performance (high vs low vs mixed cost) and Medicare Spending Per Beneficiary performance (high vs low MSPB cost). This approached allowed us to quantify the number of hospitals that have concordant performance for both types of spending measures (ie, high cost or low cost on both) and the number with discordant performance (eg, high cost on one spending measure but low cost on the other). We used Pearson correlation coefficients to assess correlation between CEBP and Medicare Spending Per Beneficiary, with evaluation of CEBP performance in aggregate form (ie, hospitals’ average CEBP performance across all eligible episode types) and by individual episode types.
Chi-square and Kruskal-Wallis tests were used to compare categorical and continuous variables, respectively. To compare spending amounts, we evaluated the distribution of total episode spending (Appendix Figure 1) and used ordinary least squares regression with spending as the dependent variable and hospital group, episode components, and their interaction as independent variables. Because CEBP dollar amounts are reported through Hospital Compare on a risk-adjusted and payment-standardized basis, no additional adjustments were applied. Analyses were performed using SAS version 9.4 (SAS Institute; Cary, NC) and all tests of significance were two-tailed at alpha=0.05.
RESULTS
Of 3,129 hospitals, 1,778 achieved minimum thresholds and had CEBPs calculated for at least one of the six CEBP episode types.
Variation in CEBP Performance
For each episode type, spending varied across eligible hospitals (Appendix Figure 2). In particular, the difference between the 10th and 90th percentile values for cellulitis, kidney/UTI, and gastrointestinal hemorrhage were $2,873, $3,514, and $2,982, respectively. Differences were greater for procedural episodes of aortic aneurysm ($17,860), spinal fusion ($11,893), and cholecystectomy ($3,689). Evaluated across all episode types, the proportion of episode spending attributed to SNF care also varied across hospitals (Appendix Figure 3), with a difference of 24.7% between the 10th (4.5%) and 90th (29.2%) percentile values.
Residual plots demonstrated differences in which episode components accounted for variation in overall spending. For aortic aneurysm episodes, variation in the SNF episode component best explained variation in episode spending and thus had the lowest residual plot variation, followed by other and hospital components (Figure). Similar patterns were observed for spinal fusion and cholecystectomy episodes. In contrast, for cellulitis episodes, all three components had comparable residual-plot variation, which indicates that the variation in the components explained episode spending variation similarly (Figure)—a pattern reflected in kidney/UTI and gastrointestinal hemorrhage episodes.
Correlation in Performance on CEBP Measures
Across hospitals in our sample, within-hospital correlations were generally low (Appendix Table 1). In particular, correlations ranged from
CEBP Performance by Hospital Groups
Overall spending on specific episode types varied across hospital groups (Table). Spending for aortic aneurysm episodes was $42,633 at hospitals with above average spending and $37,730 at those with below average spending, while spending for spinal fusion episodes was $39,231 at those with above average spending and $34,832 at those with below average spending. In comparison, spending at hospitals deemed above and below average spending for cellulitis episodes was $10,763 and $9,064, respectively, and $11,223 and $9,161 at hospitals deemed above and below average spending for kidney/UTI episodes, respectively.
Spending on specific episode components also differed by hospital group (Table). Though the magnitude of absolute spending amounts and differences varied by specific episode, hospitals with above average spending tended to spend more on SNF than did those with below average spending. For example, hospitals with above average spending for cellulitis episodes spent an average of $2,564 on SNF (24% of overall episode spending) vs $1,293 (14% of episode spending) among those with below average spending. Similarly, hospitals with above and below average spending for kidney/UTI episodes spent $4,068 (36% of episode spending) and $2,232 (24% of episode spending) on SNF, respectively (P < .001 for both episode types). Findings were qualitatively similar in sensitivity analyses (Appendix Table 2).
Among hospitals in our sample, we categorized 481 as high cost (27%), 452 as low cost (25%), and 845 as mixed cost (48%), with hospital groups distributed broadly nationwide (Appendix Figure 4). Evaluated on performance across all six episode types, hospital groups also demonstrated differences in spending by cost components (Table). In particular, spending in SNF ranged from 18.1% of overall episode spending among high-cost hospitals to 10.7% among mixed-cost hospitals and 9.2% among low-cost hospitals. Additionally, spending on hospitalization accounted for 83.3% of overall episode spending among low-cost hospitals, compared with 81.2% and 73.4% among mixed-cost and high-cost hospitals, respectively (P < .001). Comparisons were qualitatively similar in sensitivity analyses (Appendix Table 3).
Comparison of CEBP and Medicare Spending Per Beneficiary Performance
Correlation between Medicare Spending Per Beneficiary and aggregated CEBPs was 0.42 and, for individual episode types, ranged between 0.14 and 0.36 (Appendix Table 2). There was low concordance between hospital performance on CEBP and Medicare Spending Per Beneficiary. Across all eligible hospitals, only 16.3% (290/1778) had positive concordance between performance on the two measure types (ie, low cost for both), while 16.5% (293/1778) had negative concordance (ie, high cost for both). There was discordant performance in most instances (67.2%; 1195/1778), which reflecting favorable performance on one measure type but not the other.
DISCUSSION
To our knowledge, this study is the first to describe hospitals’ episode-specific spending performance nationwide. It demonstrated significant variation across hospitals driven by different episode components for different episode types. It also showed low correlation between individual episode spending measures and poor concordance between episode-specific and global hospital spending measures. Two practice and policy implications are noteworthy.
First, our findings corroborate and build upon evidence from bundled payment programs about the opportunity for hospitals to improve their cost efficiency. Findings from bundled payment evaluations of surgical episodes suggest that the major area for cost savings is in the reduction of institutional post-acute care use such as that of SNFs.7-9 We demonstrated similar opportunity in a national sample of hospitals, finding that, for the three evaluated procedural CEBPs, SNF care accounted for more variation in overall episode spending than did other components. While variation may imply opportunity for greater efficiency and standardization, it is important to note that variation itself is not inherently problematic. Additional studies are needed to distinguish between warranted and unwarranted variation in procedural episodes, as well as identify strategies for reducing the latter.
Though bundled payment evaluations have predominantly emphasized procedural episodes, existing evidence suggests that participation in medical condition bundles has not been associated with cost savings or utilization changes.7-15 Findings from our analysis of variance—that there appear to be smaller variation-reduction opportunities for condition episodes than for procedural episodes—offer insight into this issue. Existing episodes are initiated by hospitalization and extend into the postacute period, a design that may not afford substantial post-acute care savings opportunities for condition episodes. This is an important insight as policymakers consider how to best design condition-based episodes in the future (eg, whether to use non–hospital based episode triggers). Future work should evaluate whether our findings reflect inherent differences between condition and procedural episodes16 or whether interventions can still optimize SNF care for these episodes despite smaller variation.
Second, our results highlight the potential limitations of global performance measures such as Medicare Spending Per Beneficiary. As a general measure of hospital spending, Medicare Spending Per Beneficiary is based on the premise that hospitals can be categorized as high or low cost with consideration of all inpatient episodic care. However, our analyses suggest that hospitals may be high cost for certain episodes and low cost for others—a fact highlighted by the low correlation and high discordance observed between hospital CEBP and Medicare Spending Per Beneficiary performance. Because overarching measures may miss spending differen-ces related to underlying clinical scenarios, episode-specific spending measures would provide important perspective and complements to global measures for assessing hospital cost performance, particularly in an era of value-based payments. Policymakers should consider prioritizing the development and implementation of such measures.
Our study has limitations. First, it is descriptive in nature, and future work should evaluate the association between episode-specific spending measure performance and clinical and quality outcomes. Second, we evaluated all CEBP-eligible hospitals nationwide to provide a broad view of episode-specific spending. However, future studies should assess performance among hospital subtypes, such as vertically integrated or safety-net organizations, because they may be more or less able to perform on these spending measures. Third, though findings may not be generalizable to other clinical episodes, our results were qualitatively consistent across episode types and broadly consistent with evidence from episode-based payment models. Fourth, we analyzed cost from the perspective of utilization and did not incorporate price considerations, which may be more relevant for commercial insurers than it is for Medicare.
Nonetheless, the emergence of CEBPs reflects the ongoing shift in policymaker attention toward episode-specific spending. In particular, though further scale or use of CEBP measures has been put on hold amid other payment reform changes, their nationwide implementation in 2017 signals Medicare’s broad interest in evaluating all hospitals on episode-specific spending efficiency, in addition to other facets of spending, quality, safety, and patient experience. Importantly, such efforts complement other ongoing nationwide initiatives for emphasizing episode spending, such as use of episode-based cost measures within the Merit-Based Incentive Payment System17 to score clinicians and groups in part based on their episode-specific spending efficiency. Insight about episode spending performance could help hospitals prepare for environments with increasing focus on episode spending and as policymakers incorporate this perspective into quality and value-based payment policies.
1. Centers for Medicare & Medicaid Services. Fiscal Year 2019 Clinical Episode-Based Payment Measures Overview. https://www.qualityreportingcenter.com/globalassets/migrated-pdf/cepb_slides_npc-6.17.2018_5.22.18_vfinal508.pdf. Accessed November 26, 2019.
2. Centers for Medicare & Medicaid Services. Hospital Inpatient Quality Reporting Program. https://www.cms.gov/Medicare/Quality-Initiatives-Patient-Assessment-Instruments/HospitalQualityInits/HospitalRHQDAPU.html. Accessed November 23, 2019.
3. Centers for Medicare & Medicaid Services. Medicare Spending Per Beneficiary (MSPB) Spending Breakdown by Claim Type. https://www.cms.gov/Medicare/Quality-Initiatives-Patient-Assessment-Instruments/hospital-value-based-purchasing/Downloads/Fact-Sheet-MSPB-Spending-Breakdowns-by-Claim-Type-Dec-2014.pdf. Accessed November 25, 2019.
4. Hu J, Jordan J, Rubinfeld I, Schreiber M, Waterman B, Nerenz D. Correlations among hospital quality measure: What “Hospital Compare” data tell us. Am J Med Qual. 2017;32(6):605-610. https://doi.org/10.1177/1062860616684012.
5. Centers for Medicare & Medicaid Services. Hospital Compare datasets. https://data.medicare.gov/data/hospital-compare. Accessed November 26, 2019.
6. American Hospital Association. AHA Data Products. https://www.aha.org/data-insights/aha-data-products. Accessed November 25, 2019.
7. Dummit LA, Kahvecioglu D, Marrufo G, et al. Bundled payment initiative and payments and quality outcomes for lower extremity joint replacement episodes. JAMA. 2016; 316(12):1267-1278. https://doi.org/10.1001/jama.2016.12717.
8. Finkelstein A, Ji Y, Mahoney N, Skinner J. Mandatory medicare bundled payment program for lower extremity joint replacement and discharge to institutional postacute care: Interim analysis of the first year of a 5-year randomized trial. JAMA. 2018;320(9):892-900. https://doi.org/10.1001/jama.2018.12346.
9. Navathe AS, Troxel AB, Liao JM, et al. Cost of joint replacement using bundled payment models. JAMA Intern Med. 2017;177(2):214-222. https://doi.org/10.1001/jamainternmed.2016.8263.
10. Liao JM, Emanuel EJ, Polsky DE, et al. National representativeness of hospitals and markets in Medicare’s mandatory bundled payment program. Health Aff. 2019;38(1):44-53.
11. Barnett ML, Wilcock A, McWilliams JM, et al. Two-year evaluation of mandatory bundled payments for joint replacement. N Engl J Med. 2019;380(3):252-262. https://doi.org/10.1056/NEJMsa1809010.
12. Navathe AS, Liao JM, Polsky D, et al. Comparison of hospitals participating in Medicare’s voluntary and mandatory orthopedic bundle programs. Health Aff. 2018;37(6):854-863. https://www.doi.org/10.1377/hlthaff.2017.1358.
13. Joynt Maddox KE, Orav EJ, Zheng J, Epstein AM. Participation and Dropout in the Bundled Payments for Care Improvement Initiative. JAMA. 2018;319(2):191-193. https://doi.org/10.1001/jama.2017.14771.
14. Navathe AS, Liao JM, Dykstra SE, et al. Association of hospital participation in a Medicare bundled payment program with volume and case mix of lower extremity joint replacement episodes. JAMA. 2018;320(9):901-910. https://doi.org/10.1001/jama.2018.12345.
15. Joynt Maddox KE, Orav EJ, Epstein AM. Medicare’s bundled payments initiative for medical conditions. N Engl J Med. 2018;379(18):e33. https://doi.org/10.1056/NEJMc1811049.
16. Navathe AS, Shan E, Liao JM. What have we learned about bundling medical conditions? Health Affairs Blog. https://www.healthaffairs.org/do/10.1377/hblog20180828.844613/full/. Accessed November 25, 2019.
17. Centers for Medicare & Medicaid Services. MACRA. https://www.cms.gov/medicare/quality-initiatives-patient-assessment-instruments/value-based-programs/macra-mips-and-apms/macra-mips-and-apms.html. Accessed November 26, 2019.
© 2020 Society of Hospital Medicine