User login
Pneumonia Treatment Duration
Pneumonia is the leading inpatient infectious diagnosis for which antimicrobials are prescribed in the United States.[1] Supported by moderate‐ to high‐quality evidence, guidelines produced jointly by the Infectious Diseases Society of America (IDSA) and American Thoracic Society (ATS) recommend treating pneumonia with the shortest appropriate duration of antimicrobial therapy to minimize risk for antimicrobial‐related adverse events.[2, 3, 4]
Evidence supports short duration of therapy for treatment of uncomplicated pneumonia.[3, 4, 5, 6, 7, 8, 9, 10, 11, 12] IDSA/ATS guidelines state, patients with CAP [community‐acquired pneumonia] should be treated for a minimum of 5 days (level 1 evidence), should be afebrile for 4872 hours, and should have no more than 1 CAP‐associated sign of clinical instabilitybefore discontinuation of therapy (level II evidence). (Moderate recommendation.) A longer duration of therapy may be warranted if initial therapy was not active against the identified pathogen or if it was complicated by [abscess, empyema, severe immunosuppression, or] extra‐pulmonary infection such as meningitis or endocarditis. (Weak recommendation; level III evidence).[3] Recommended therapy duration for patients with uncomplicated healthcare‐associated pneumonia (HCAP) who respond to initial therapy is 7 to 8 days unless gram‐negative nonfermenting rods or complications are identified (level I evidence).[4]
Within the Veterans Health Administration (VHA), the Antimicrobial Stewardship Taskforce (ASTF) was created to optimize care by developing, deploying, and monitoring a national‐level strategic plan for antimicrobial therapy management improvements.[13, 14] Although single‐center studies have found antimicrobial therapy for CAP being frequently prescribed for longer than recommended, the reproducibility of this finding across different facilities has not been assessed.[15, 16] The ASTF collaborated with the VHA Center for Medication Safety to assess total duration of antimicrobial therapy prescribed for veterans hospitalized with uncomplicated pneumonia.[17]
METHODS
This retrospective multicenter evaluation was conducted in 30 VHA facilities that volunteered to participate in this project. Inpatients discharged with a primary International Classification of Diseases, Ninth Revision, Clinical Modification (ICD‐9‐CM) diagnosis code for pneumonia (or pneumonia diagnosis secondary to primary sepsis diagnosis) during 2013 were evaluated.[18] Diagnoses, admissions, and patient demographics were identified using Veterans Affairs (VA) integrated databases through the Austin Integrated Technology Center. Up to 200 admissions per facility were randomly selected for review. Clinical pharmacists at each facility performed manual record reviews utilizing a standardized protocol and collection form. Completed cases were uploaded to a central database for analysis. Standardized chart abstraction was facilitated by detailed instructions, a data dictionary, and monthly conference calls.
Inclusion criteria required patient admission to any medical ward including intensive care unit (ICU) wards for 48 hours, receipt of >24 hours inpatient antimicrobial therapy (eg, at least 2 doses of a once‐daily antibiotic), documentation of pneumonia discharge diagnosis, and survival until discharge. Exclusion criteria were: complicated pneumonia (lung abscess, necrotizing pneumonia, thoracentesis performed), significant immunosuppression (cancer chemotherapy or absolute neutrophil count <1500 cell/mm3 within 28 days, organ transplantation, human immunodeficiency virus infection); or extrapulmonary infection (eg, meningitis, endocarditis).[3] Patients were also excluded if directly transferred from another inpatient facility, pneumonia occurred >48 hours after admission, index hospitalization was >14 days, previously hospitalized within 28 days prior to index admission, or discharged without documentation of completing a full course of therapy. In addition, patients who received initial therapy discordant with culture and susceptibility findings, were not clinically stable by discharge, or had gram‐negative nonfermentative bacilli cultured were excluded from analysis because according to the guidelines, either data are lacking to support a short duration of therapy such as initial discordant therapy, or a longer duration of therapy may be warranted such as gram‐negative nonfermentative bacilli and clinical instability at discharge.[4] Our intent for these exclusions was to minimize bias against clinician decision making for cases where a longer duration of therapy may have been appropriate.
Patients meeting all criteria had the following abstracted: demographics; prior healthcare exposures, admitting location (ICU or non‐ICU ward), parameters for calculation of Pneumonia Severity Index (PSI), culture results obtained 48 hours of admission, duration of antimicrobials administered during hospitalization and prescribed upon discharge (or recommendations for outpatient duration in the discharge summary for patients receiving medications from non‐VA sources), daily clinical stability assessment, Clostridium difficile infection (CDI) test results, and readmission or death within 28 days of discharge.[19]
Guideline‐similar CAP therapy duration was defined as a minimum of 5 days of antimicrobials, up to a maximum of 3 additional days beginning the first day the patient was afebrile and exhibited 1 sign of clinical instability (heart rate > 100 beats/minute, respiratory rate >24 breaths/minute, systolic blood pressure <90, oxygen saturation <90% or partial pressure of oxygen <60 mm Hg on room air or baseline O2 requirements, or not returned to baseline mental status).[3] This definition was made by consensus decision of the investigators and was necessary to operationalize the relationship between clinical stability and appropriate duration of therapy. Guideline‐similar HCAP therapy duration was defined as 8 days.[4] CDI was defined in accordance with VA criteria for hospital onset and community‐onset healthcare‐facilityassociated CDI.[20] All‐cause hospital readmission and all‐cause death were defined as inpatient readmission or any death, respectively, within 28 days after discharge for the pneumonia admission.
Demographics, comorbidities, microbiology results, antimicrobial utilization, CDI, readmission, and death rates between guideline‐similar and guideline‐excessive duration of antimicrobial therapy groups were characterized with descriptive statistics, Mann‐Whitney U test, or 2 test as indicated (significance defined as P < 0.05). Multivariable logistic regression (SAS version 9.3 [SAS Institute, Cary, NC]) was used to assess association between duration of therapy exceeding recommended guidelines with all‐cause readmission and all‐cause death after adjustment for pertinent covariates. Odds ratios (OR) with 95% confidence intervals ( 95% CI) were reported. This medication utilization evaluation (MUE) was reviewed by the Hines VHA Institutional Review Board for Human Subjects Protection. Based on VHA Policy Handbook 1058.05, which defines operations activities that may constitute research, the board determined that the evaluation constituted quality improvement rather than research, and thus was exempt from VHA Human Subjects Research requirements.
RESULTS
There were 3881 admissions eligible for chart review. After manual chart review of inclusion and exclusion criteria, 1739 (44.8%) patients were available for duration of therapy analysis. (Figure 1). Only 1 admission for each patient was analyzed.

The cohort was comprised primarily of elderly male patients (96.6%) of whom more than two‐thirds were hospitalized for CAP (Table 1). Most patients had significant disease severity as indicated by PSI score; however, only 12% were directly admitted to the ICU. Blood cultures were collected in >95% of cases; lower respiratory cultures were obtained in 39.9% of cases.
| Characteristic | Value |
|---|---|
| |
| Age, y, mean SD | 71.8 (12.7) |
| Gender, male, n (%) | 1,680 (96.6) |
| Living environment at time of index admission, n (%) | |
| Home | 1,416 (81.4) |
| VA community‐based living center | 88 (5.1) |
| Non‐VA long‐term skilled care facility | 95 (5.5) |
| Assisted living facility | 52 (2.9) |
| Not documented | 46 (2.7) |
| Other | 29 (1.7) |
| Prior healthcare exposures, n (%) | |
| Prior hospitalization within last 90 days | 310 (17.8) |
| Residence in a long‐term skilled care facility in last 90 days | 209 (12.0) |
| Chronic dialysis within last 28 days | 52 (3.0) |
| Intravenous antimicrobials within last 28 days | 76 (4.4) |
| Wound, tracheostomy, or ventilator care in last 28 days | 37 (2.1) |
| Community‐acquired pneumonia, n (%) | 1,195 (68.7) |
| Healthcare‐associated pneumonia, n (%) | 544 (31.3) |
| Comorbidities, n (%) | |
| Renal disease | 438 (25.2) |
| Liver disease | 39 (2.2) |
| Congestive heart failure | 436 (25.1) |
| Cerebrovascular disease | 356 (20.4) |
| Neoplastic disease (excluding skin) | 384 (22.1) |
| Severity of illness, n (%) | |
| Pneumonia Severity Index | |
| Class I | 30 (1.8) |
| Class II | 198 (11.4) |
| Class III | 349 (20.1) |
| Class IV | 759 (43.6) |
| Class V | 403 (23.2) |
| Intensive care upon admission | 212 (12.2) |
| Culture collection 48 hours of admission, n (%) | 1,687 (97.0) |
| Blood | 1,631 (96.7) |
| Lower respiratory tract (sputum) | 673 (39.9) |
| Bronchoalveolar lavage | 20 (1.2) |
| Urine | 632 (37.5) |
| Skin/wound | 3 (0.2) |
| Other | 158 (9.4) |
| Facility complexity, n (%) | |
| Level 1a‐c | 1,286 (74.0) |
| Level 2 | 437 (25.1) |
| Level 3 | 16 (0.9) |
Commonly administered antimicrobials during hospitalization and at discharge are summarized in Table 2. Anti‐pseudomonal ‐lactams and antimethicillin‐resistant Staphylococcus aureus antimicrobials were more frequently administered to patients with HCAP, whereas third‐generation cephalosporins and macrolides were more likely to be administered to patients with CAP. Fluoroquinolones were prescribed to 55.3% of patients upon discharge.
| Inpatient Antimicrobials Administered* | ||||
|---|---|---|---|---|
| Portion of Cohort Receiving Antimicrobial, n (%), n = 1,739 |
Therapy Duration Similar With Guidelines, n (%), n = 241 |
Therapy Duration Exceeding Guidelines, n (%), n = 1,498 | Significance | |
| Antimicrobials Dispensed or Recommended at Discharge | ||||
| Portion of Cohort Receiving Antimicrobial, n (%), n = 1,471 |
Therapy Duration Similar With Guidelines, n (%), n = 151 |
Therapy Duration Exceeding Guidelines, n (%), n = 1,320 | Significance | |
| ||||
| Third‐generation cephalosporins | 809 (46.5) | 75 (31.1) | 734 (49.0) | <0.001 |
| Fluoroquinolones | 836 (48.1) | 114 (47.3) | 722 (48.2) | 0.80 |
| Macrolides | 788 (45.3) | 90 (37.3) | 698 (46.6) | <0.01 |
| Pseudomonal ‐lactams | 692 (39.8) | 138 (57.3) | 554 (37.0) | 0.01 |
| Anti‐MRSA antimicrobials | 663 (38.1) | 135 (56.0) | 528 (35.3) | <0.01 |
| Other ‐lactams | 139 (8.0) | 10 (4.2) | 129 (8.6) | 0.02 |
| Tetracyclines | 119 (6.8) | 14 (5.8) | 105 (7.0) | 0.49 |
| Other | 97 (5.6) | 15 (6.2) | 82 (5.5) | 0.64 |
| Third‐generation cephalosporins | 285 (19.4) | 27 (17.9) | 258 (19.6) | 0.62 |
| Fluoroquinolones | 813 (55.3) | 95 (62.9) | 718 (54.4) | 0.05 |
| Macrolides | 203 (13.8) | 20 (13.3) | 183 (13.9) | 0.83 |
| Pseudomonal ‐lactams | 31 (2.1) | 4 (2.7) | 27 (2.1) | 0.62 |
| Anti‐MRSA antimicrobials | 45 (3.1) | 6 (4.0) | 39 (3.0) | 0.49 |
| Other ‐lactams | 239 (16.3) | 13 (8.6) | 226 (17.1) | 0.01 |
| Tetracyclines | 95 (6.5) | 10 (6.6) | 85 (6.4) | 0.93 |
| Other | 44 (3.0) | 5 (3.3) | 39 (3.0) | 0.81 |
Overall, 13.9% of patients with uncomplicated pneumonia received guideline‐similar duration of therapy (Table 3). A greater proportion of HCAP patients (29.0%) received guideline‐similar therapy duration as compared to CAP patients (6.9%) (P < 0.01 (Table 3). Median duration of therapy was 7 days (interquartile range [IQR] = 78 days) for guideline‐similar therapy compared to 10 days (913 days) for therapy duration in excess of guideline recommendations. Overall, 97.1 % of patients met clinical stability criteria before day 4 of therapy, yet 50% received 4 days of intravenous (IV) therapy (median was 4 days, IQR = 36 days). Antimicrobial therapy was generally completed after discharge, as only 17.3% received their entire treatment course during hospitalization. Median duration of outpatient oral (PO) antimicrobial therapy was twice as long for guideline‐excessive therapy compared to guideline‐similar therapy (6 vs 3 days), whereas duration of inpatient IV and PO antimicrobial therapy was similar. Patients discharged on a fluoroquinolone were more likely to receive guideline‐similar duration of therapy. The VHA classifies facilities into 3 levels of complexity, with lower scores indicating more complex facilities.[21] Guideline‐similar therapy duration occurred in 10.4% of cases in lower complexity facilities (levels 2 and 3),and 15.1% in more complex facilities (level 1) (P = 0.01). The median duration of therapy was similar for more and less complex facilities, respectively (10 days, IQR = 812 days vs 10 days, IQR = 813 days).
| Outcome |
Therapy Duration Similar With IDSA/ATS Guidelines |
Therapy Duration in Excess of IDSA/ATS Guideline Recommendations | Significance |
|---|---|---|---|
| |||
| Antimicrobial duration consistent with guideline recommendations, n (%) | 241 (13.9) | 1,498 (86.1) | NR |
| CAP* | 83 (6.9) | 1,112 (93.1) | NR |
| HCAP* | 158 (29.0) | 386 (71.0) | NR |
| Total days of therapy for pneumonia, median (IQR) | 7 (78) | 10 (913) | NR |
| CAP | 6 (59) | 10 (812) | <0.01 |
| HCAP | 7 (78) | 11 (1014) | <0.01 |
| Days of IV therapy administered for pneumonia, median (IQR) | 4 (37) | 4 (36) | 0.50 |
| Days of PO inpatient therapy administered, median (IQR) | 1 (03) | 1 (03) | 0.78 |
| Days of PO outpatient therapy dispensed at discharge, median (IQR) | 3 (25) | 6 (47) | <0.01 |
| Days of PO outpatient therapy recommended in Discharge Summary for patients without a VA prescription, median (IQR) | 3 (24) | 5 (47) | <0.01 |
| Aggregate 28‐day hospital readmission, n (%) | 42 (17.4) | 183 (12.2) | 0.03 |
| CAP∥# | 7 (8.4) | 112 (10.1) | 0.58 |
| HCAP∥# | 35 (22.2) | 71 (18.4) | 0.28 |
| Aggregate 28‐day CDI rate, n (%) | 6 (2.5) | 9 (0.6) | 0.03 |
| CAP∥** | 1 (1.2) | 6 (0.5) | 0.44 |
| HCAP∥** | 5 (3.2) | 3 (0.8) | 0.04 |
| Aggregate 28‐day death after discharge, n (%) | 6 (2.5) | 52 (3.5) | 0.43 |
| CAP∥** | 1 (1.2) | 33 (3.0) | 0.35 |
| HCAP∥** | 5 (3.2) | 19 (4.9) | 0.37 |
The 28‐day postdischarge all‐cause readmission rate for patients who received guideline‐similar therapy duration was higher (17.4%) than for patients who received therapy duration in excess of guideline recommendations (12.2%) (P = 0.03). After adjustment for covariates associated with readmission (HCAP, age, prior skilled nursing facility residence, PSI score comorbidity elements), we found no evidence that patients who received guideline‐similar therapy duration were more likely to be readmitted than were patients who received guideline‐excessive duration (OR: 1.1 [95% CI: 0.8, 1.7]) (Table 3). Likewise, no difference in 28‐day all‐cause postdischarge mortality was identified between guideline‐similar and guideline‐excessive duration after adjustment for the same covariates (adjusted OR: 0.5 [95% CI: 0.2, 1.2]) (Table 4).
| Model Variables | Odds Ratio | 95% Confidence Interval | P Value |
|---|---|---|---|
| |||
| Readmission model | |||
| Duration of antibiotics | 1.11 | 0.75, 1.64 | 0.62 |
| HCAP | 1.94 | 1.38, 2.72 | <0.01 |
| Age | 1.01 | 1.00, 1.03 | 0.04 |
| Prior skilled nursing facility residence | 0.91 | 0.59, 1.40 | 0.67 |
| PSI score comorbidity elements | |||
| Neoplastic disease | 1.20 | 0.86, 1.67 | 0.29 |
| Liver disease | 1.55 | 0.66, 3.64 | 0.31 |
| CHF | 1.15 | 0.83, 1.59 | 0.41 |
| Cerebrovascular disease | 1.06 | 0.75, 1.50 | 0.75 |
| Renal disease | 1.51 | 1.09, 2.08 | 0.01 |
| Mortality model | |||
| Duration of antibiotics | 0.53 | 0.23, 1.22 | 0.14 |
| HCAP | 2.53 | 1.38, 4.65 | <0.01 |
| Age | 1.06 | 1.03, 1.09 | <0.01 |
| Prior skilled nursing facility residence | 0.79 | 0.38, 1.66 | 0.53 |
| PSI score comorbidity elements | |||
| Neoplastic disease | 1.03 | 0.57, 1.87 | 0.91 |
| Liver disease | <0.001 | <0.001, >999.9 | 0.98 |
| CHF | 0.73 | 0.39, 1.38 | 0.34 |
| Cerebrovascular disease | 0.82 | 0.43, 1.56 | 0.55 |
| Renal disease | 0.72 | 0.39, 1.35 | 0.31 |
CDI cases (n = 15) were too sparse to adequately perform multivariable logistic regression analysis; however, a higher percentage of patients who received guideline‐similar duration of therapy developed CDI compared to patients who received guideline‐excessive duration of therapy (40.0% vs 13.6%, P < 0.01). The median duration of therapy for patients who did and did not develop CDI was similar (8 days, IQR = 714 days vs 10 days, IQR = 812 days, P = 0.85, respectively). Patients who developed CDI had a higher rate of HCAP diagnosis (1.5% vs 0.6%; P = 0.06), were more likely to have concomitant non‐pneumonia infection (40.0% vs 9.5%, P < 0.01), have chronic comorbidity (86.7% vs 59.1%, P = 0.03), and to have been admitted to the ICU (26.7% vs 12.1%, P = 0.09).
DISCUSSION
IDSA/ATS guidelines for pneumonia duration of therapy generally agree with other professional society guidelines including the British Thoracic Society and National Institute for Health and Care Excellence.[22, 23] In contrast to existing evidence and guideline recommendations, this multi‐centered evaluation identified prolonged durations of antimicrobial therapy prescribed in 93% and 71% of patients with uncomplicated CAP and HCAP (Table 3), respectively.[3, 4, 5, 6, 7, 8, 9, 10, 11, 12] Almost all (97.1%) uncomplicated CAP and HCAP patients met clinical stability criteria before day 4 of hospitalization, yet the median duration of IV therapy was 4 days. Because criteria for IV to PO conversion and the clinical stability definition utilized in this analysis were similar, many patients may have been eligible for PO therapy earlier, favorably impacting length of stay, cost, and adverse effects.[3, 12, 24, 25, 26] Although median days of inpatient PO therapy administered was 1 day (IQR = 03 days), inpatient observation after PO conversion may not be necessary. The duration of PO therapy was based on calendar days, where if a patient received 1 dose of a once daily antibiotic (ie, levofloxacin), they were considered to have received 1 day of inpatient PO antibiotics even if discharged the same day.
Approximately half of all days of therapy occurred after discharge. Although the median therapy duration for inpatients was similar, the median duration of antimicrobials administered upon hospital discharge was twice as long for patients receiving guideline‐excessive compared to guideline‐similar duration of therapy. The median excess in antibiotic duration is almost entirely accounted for by excess outpatient days of therapy. This is an important consideration for antimicrobial stewardship programs that tend to focus on inpatient antimicrobial use.
Noteworthy observations include the low rate of respiratory tract culture collection (41%) and frequent use of fluoroquinolones upon discharge. Collection of respiratory tract cultures is recommended for all patients with HCAP and patients with CAP who have risk factors for resistant pathogens, characteristics that were common in this cohort.[3, 4] Recently, we identified that respiratory culture collection is associated with increased de‐escalation rates in HCAP, and that culture‐negative patients frequently receive fluoroquinolones.[27] IDSA/ATS CAP guidelines discourage empirically switching to PO fluoroquinolone therapy based on bioavailability considerations alone.[3] Further, fluoroquinolones are considered to be associated with high risk of CDI.[28, 29] Prescription of fluoroquinolone upon discharge was associated with guideline‐similar duration of therapy and was not shown to be associated with CDI; however, power to detect differences between exposures to specific antimicrobials and CDI was low.
CDI was more common in patients with CAP (1.2% vs 0.5%) and HCAP (3.2% vs 0.8%) who received duration of therapy similar with guideline recommendations. This observation is confounded, as patients with CDI had significantly greater comorbidity as well as secondary infections and tended to more frequently receive ICU care. There were no differences in adjusted rates of readmission or death between patients receiving guideline‐similar and guideline‐excessive duration of therapy.
Evaluation strengths included exclusion of patients with complicating conditions possibly requiring prolonged antimicrobial treatment courses, which allowed the evaluation to focus on patients most likely to benefit from shorter course therapy. The definition of appropriate therapy duration was based upon daily assessment of clinical stability criteria that paralleled the CAP guidelines. The definition utilized objective parameters while accounting for patient variability in achieving clinical stability criteria. Finally, the analyses of clinical end points suggest that shorter duration of therapy may be as safe and effective as longer duration of therapy in uncomplicated pneumonia.
Limitations include those common to other analyses conducted within the VHA, including a predominantly elderly male cohort.[30] Only ICD‐9‐CM codes consistent with a discharge diagnosis of pneumonia were used to identify the cohort, and clinical impressions not documented in the medical record may have impacted the clinician's treatment duration decisions. The upper limit of appropriate duration of therapy for CAP was arbitrarily set at up to 3 days beyond meeting clinical stability criteria to provide a reasonable duration of appropriate therapy beyond clinical stability to operationalize the duration of therapy recommendations within the context of the IDSA/ATS guidelines. Additionally, CIs for the ORs of readmission and mortality were broad, and thus too imprecise to determine whether guideline‐similar durations increased or decreased readmission or mortality in comparison with therapy that exceeded guideline recommendations. We could not fully assess the potential for association between guideline‐excessive therapy duration and risk for CDI due to sparse cases. Finally, non‐VA prescription data were not available for all patients, and we relied on intended duration of therapy as recommended by the discharging provider in 4.1% of cases.
Most quality assessments of pneumonia treatment have focused on antimicrobial selection and timely administration or conversion from IV to PO therapy.[31, 32] This evaluation identified potential opportunities for expansion of antimicrobial stewardship activities during the transition of care setting. The efficacy of short‐course ‐lactam, macrolide, or fluoroquinolone therapy for CAP appears equivalent to longer treatment regimens with no difference in adverse event rates, suggesting that optimal duration of therapy may be a rational target for quality improvement.[5, 6, 7, 8, 9, 10, 11, 12, 15, 31] Recommendations for HCAP duration of therapy are extrapolated from a prospective multicentered study, which randomized patients with hospital‐acquired pneumonia to receive 8 versus 15 days of therapy, that identified similar outcomes to ours.[4, 12]
Single‐center studies have identified that antimicrobial therapy for pneumonia is frequently prescribed for longer than recommended by guidelines, which found a similar median duration of therapy as our evaluation.[15, 16] Similar to Jenkins et al., we observed a high rate of fluoroquinolone prescriptions upon discharge.[16]
There are few published examples of interventions designed to limit excessive duration of therapy, particularly for antimicrobials prescribed upon hospital discharge.[15, 33, 34] Serial procalcitonin measurements have been used to guide duration of therapy for pneumonia; however, the costbenefit ratio of procalcitonin measurement is unclear.[35, 36] Procalcitonin use was uncommon, and none of the participating facilities in our evaluation utilized a specific algorithm to guide therapy duration. Limited data suggest that patient‐level prospective audit with feedback may be effective. Advic et al. evaluated management of presumed CAP before and after education and prospective feedback to medical teams concerning antimicrobial selection and duration of therapy.[15] The intervention led to a decrease in median duration of therapy from 10 days (IQR = 813 days) to 7 days (IQR = 78 days) without increasing clinical failure or readmission rates. We recently reported a single‐center evaluation in which pharmacists utilizing a decision support tool while performing discharge medication reconciliation were able to reduce excessive mean duration of therapy from 9.5 days ( 2.4 days) to 8.3 days ( 2.9 days) in patients without complicated pneumonia, with a 19.2% reduction in duration of therapy prescribed at discharge.[37] A similar approach utilizing pharmacists performing discharge review has recently been reported in a community hospital.[38]
Future work should recognize that few patients complete their entire course of therapy as inpatients, and the majority of treatment is prescribed upon discharge. Pivotal time points for antimicrobial stewardship intervention include day 2 to 3 of hospitalization when conveying suggestions for antimicrobial de‐escalation and/or IV to PO conversion, and toward the end of hospitalization during discharge planning. Although it may not be feasible for antimicrobial stewards to review all uncomplicated cases of pneumonia during hospitalization, most facilities have a systematic process for reviewing medications during transitions of care. We believe that interventions intended to assess and recommend shortened courses of therapy are appropriate. These interventions should include a mechanism for support by stewardship personnel or other infectious diseases specialists. Based on our evaluation, the ASTF produced and disseminated clinical guidance documents and tools to triage pneumonia case severity and assess response to therapy. Qualified personnel are encouraged to use this information to make recommendations to providers regarding excessive duration of therapy for uncomplicated cases where appropriate. Other work should include an in‐depth assessment of clinical outcomes related to treatment duration, investigation of provider rationale for prolonged treatment, and duration of antimicrobial therapy prescribed upon discharge for other common disease states. Finally, manual chart review to classify uncomplicated cases and related outcomes was laborious, and automated case identification is technologically plausible and should be explored.[39]
In conclusion, this national VHA MUE found that patients with uncomplicated pneumonia were commonly prescribed antimicrobials for the duration of therapy in excess of guideline recommendations. Patients with uncomplicated pneumonia who received therapy duration consistent with guideline recommendations did not have significantly different all‐cause readmission and death rates compared to patients receiving prolonged treatment. Approximately half of all therapy was prescribed upon hospital discharge, and clinicians as well as antimicrobial stewardship programs should consider these findings to address excessive duration of antimicrobial therapy upon hospital discharge.
Acknowledgements
The authors acknowledge Dr. Michael Fine for his assistance with utilization of the Pneumonia Severity Index, Kenneth Bukowski for assisting with development of data collection tools and data management, and members of the Antimicrobial Stewardship Taskforce Implementation Sub‐Committee. Collaborators in the Pneumonia Duration of Therapy Medication Utilization Evaluation Group include: Biloxi VA (VA Gulf Coast): Cheryl Hankins, PharmD, BCPS; Central Alabama VAMC: Lauren Rass, PharmD, BCPS, Kelly Mooney, PharmD, BCPS; Central Arkansas: Nicholas Tinsley, MS, PharmD; Chillicothe VA: Stephen Hanson, PharmD, BCPS, Beth Gallaugher, BSN, RN, Elizabeth Baltenberger, PharmD; Cincinnati VA: Jason Hiett, PharmD, BCPS, Victoria Tate, PharmD, BCPS, Brian Salzman, PharmD; Dorn Medical Center: MaryAnne Maurer, PharmD, BCPS, BCACP, Rebekah Sipes, PharmD, BCACP, Ginger Ervin, PharmD; Dwight D. Eisenhower VAMC: Emily Potter, PharmD; Hudson Valley: Rita Lee Bodine, PharmD, Clement Chen, PharmD, Cristina Fantino, PharmD; James H. Quillen VAMC: Marty Vannoy, PharmD, BCPS, Erin Harshbarger, PharmD, Kristen Nelsen, PharmD; Jesse Brown VAMC: Lisa Young, PharmD, BCPS, AQ‐ID, Andrea Bidlencik, PharmD, BCPS; Kansas City VA: Jamie Guyear, PharmD, AQ‐ID, Ann Ungerman, PharmD, BCPS, Lauri Witt, PharmD, BCACP; Louis Stokes Cleveland VAMC: Amy Hirsch, PharmD, BCPS, Steven Adoryan, PharmD, BCP‐CC, Amanda Miller, PharmD, BCPS; Maine VAMC: Joel Coon, PharmD, Rachel Naida, PharmD, Kelly Grossman, PharmD; Martinsburg VAMC: Kelly Li, PharmD, Sarah Mickanis, PharmD, BCPS; Miami VA Medical Center: Mara Carrasquillo, BS, PharmD, Maribel Toro, PharmD; North Florida/South Georgia Veterans Health System: Nora Morgan, PharmD, Hugh Frank, PharmD, BCPS, BCPP, Sarah Onofrio, PharmD, BCPS; North Texas HCS: Susan Duquaine, PharmD, BCPS, AQ‐ID, Ruben Villaneuva, PharmD, BCPS, Jaela Dahl, PharmD, BCPS; Ozarks: Andrew Siler, PharmD, BCPS, Michele Walker, PharmD, CGP, Jennifer Cole, PharmD, BCPS, BCCCP; Providence VAMC: Kerry LaPlante, PharmD, FCCP, Lindsey Williamson, PharmD; Richmond VA: Daniel Tassone, PharmD, BCPS; Salisbury VAMC: Brett Norem, PharmD, Marrisa Ragonesi, PharmD; San Juan VA: Monica Sanabria‐Seda, PharmD, BCPS, Jaime Velez‐Fores, PharmD, BCPS, AQ‐ID, Norma Ayala‐Burgos, PharmD; Sioux Falls VA: Andrea Aylward, PharmD, BCPS; South Texas HCS: Kelly Echevarria, PharmD, BCPS, AQ‐ID, Manuel Escobar, PharmD; Tennessee Valley HCS: Casey Ryals, PharmD, BCACP, Molly Hurst, PharmD, Jonathan Hale, PharmD; VA Central Iowa Health Care System: Jenny Phabmixay, PharmD, BCPS, Mackenzie Brown, PharmD, BCPS, Cynthia Muthusi, PharmD, BCPS; VA Loma Linda: Tony Chau, PharmD; VA Sierra Nevada: Scott Mambourg, PharmD, BCPS, AAHIVP, Matthew Han, PharmD, Nathan Mihoch, PharmD; VA WNY Healthcare System: Kari Mergenhagen, PharmD, BCPS, AQ‐ID, Christine Ruh, PharmD, BCPS; Veterans Affairs Salt Lake City Health System: Emily Spivak, MD, MHS, Patricia Orlando, PharmD
Disclosures: Karl Madaras‐Kelly is employed full time by Idaho State University and has a without compensation appointment as a clinical pharmacist at the Boise VA Medical Center. He receives grant support unrelated to this work through the Department of Veterans Affairs subcontracted to Idaho State University. Muriel Burk is employed full time through the Department of Veterans Affairs as clinical pharmacy specialist in outcomes and medication safety evaluation. Christina Caplinger was employed by the Department of Veterans Affairs as an infectious diseases fellow at the time this work was completed. She is currently employed by Micromedex. Jefferson Bohan is employed full time by the Department of Veterans Affairs as an infectious diseases fellow. Melinda Neuhauser is employed full time through the Department of Veterans Affairs as a clinical pharmacy specialistinfectious diseases. Matthew Goetz is employed full time through the Department of Veterans Affairs as an infectious diseases physician. Rhongping Zhang is employed full time through the Department of Veterans Affairs as a data analyst. Francesca Cunningham is employed full time through the Department of Veterans Affairs as the director of the VA Center for Medication Safety. This work was supported with resources and use of the Department of Veterans Affairs healthcare system. The views expressed in this article are solely those of the authors and do not necessarily reflect the position or policy of the Department of Veterans Affairs. The authors report no conflicts of interest.
- Centers for Disease Control and Prevention. National hospital discharge survey 2010. Available at: http://www.cdc.gov/nchs/fastats/pneumonia.htm. Accessed December 1, 2014.
- , , , et al. Implementing an antibiotic stewardship program: guidelines by the Infectious Diseases Society of America and the Society for Healthcare Epidemiology of America. Clin Infect Dis. 2016;62(10):e51–e77.
- , , , et al. Infectious Diseases Society of America/American Thoracic Society consensus guidelines on the management of community‐acquired pneumonia in adults. Clin Infect Dis. 2007;44(suppl 2):S27–S72.
- American Thoracic Society; Infectious Diseases Society of America. Guidelines for the management of adults with hospital‐acquired, ventilator‐associated, and healthcare‐associated pneumonia. Am J Respir Crit Care Med. 2005;171(4):388–416.
- , , , et al. Short‐ versus long‐course antibacterial therapy for community‐acquired pneumonia: a meta‐analysis. Drugs. 2008;68(13):1841–1854.
- , , , et al. Efficacy of short‐course antibiotic regimens for community‐acquired pneumonia: a meta‐analysis. Am J Med. 2007;120:783–790.
- , , , et al. High‐dose, short‐course levofloxacin for community‐acquired pneumonia: a new treatment paradigm. Clin Infect Dis. 2003;37:752–760.
- , , , et al. Comparison of 7 versus 10 days of antibiotic therapy for hospitalized patients with uncomplicated community‐acquired pneumonia: a prospective. Am J Ther. 1999;6(4):217–222.
- , , , et al. Effectiveness of discontinuing antibiotic treatment after three days versus eight days in mild to moderate‐severe community acquired pneumonia: randomised, double blind trial. BMJ. 2006;332(7554):1355.
- , , , et al. Efficacy of a three day course of azithromycin in moderately severe community‐acquired pneumonia. Eur Respir J. 1995;8(3):398–402.
- , , , et al. Comparison of 8 vs 15 days of antibiotic therapy for ventilator‐associated pneumonia in adults: a randomized trial. JAMA. 2003;290(19):2588–2598.
- , , , et al. Effectiveness of early switch from intravenous to oral antibiotics in severe community acquired pneumonia: multicentre randomized trial. BMJ. 2006;333(7580):1193.
- , , , , . Unnecessary antimicrobial use in the context of Clostridium difficile infection: a call to arms for the Veterans Affairs Antimicrobial Stewardship Task Force. Infect Control Hosp Epidemiol. 2013;34(6):651–653.
- VHA Directive 1031. Antimicrobial stewardship programs. Available at: https://www1.va.gov/vhapublications/ViewPublication.asp?pub_ID=2964. Accessed December 1, 2014.
- , , , et al. Impact of an antimicrobial stewardship intervention on shortening the duration of therapy for community‐acquired pneumonia. Clin Infect Dis. 2012;54:1581–1587.
- , , , et al. Targets for antibiotic and healthcare resource stewardship in inpatient community‐acquired pneumonia: a comparison of management practices with National Guideline Recommendations. Infection. 2013;41(1):135–144.
- , , , , . Pharmacy benefits management in the Veterans Health Administration: 1995 to 2003. Am J Manag Care. 2005;11(2):104–112.
- , , , . Accuracy of administrative data for identifying patients with pneumonia. Am J Med Qual. 2005;20(6):319–328.
- , , , et al. A prediction rule to identify low‐risk patients with community‐acquired pneumonia. N Engl J Med. 1997;336:243–250.
- , , , , . Clostridium difficile infections in Veterans Health Administration acute care facilities. Infect Control Hosp Epidemiol. 2014;35(8):1037–1042.
- , , , , . Organization complexity and primary care providers' perceptions of quality improvement culture within the Veterans Health Administration. Am J Med Qual. 2016;31(2):139–146.
- , , , et al. BTS guidelines for the management of community acquired pneumonia in adults: update 2009. Thorax. 2009;64(suppl 3):iii1–iii55.
- National Institute for Health and Care Excellence. Pneumonia in adults: diagnosis and management. Available at: http://www.nice.org.uk/guidance/cg191. Published December 2014. Accessed May 9, 2016.
- , , , , , . A prospective randomized study of inpatient IV antibiotics for community‐acquired pneumonia: the optimal duration of therapy. Chest. 1996;110(4):965–971.
- , , , et al. Early switch from intravenous to oral antibiotics and early hospital discharge: a prospective observational study of 200 consecutive patients with community‐acquired pneumonia. Arch Intern Med. 1999;159(20):2449–2454.
- , , , . Correlates and economic and clinical outcomes of an adult IV to PO antimicrobial conversion program at an academic medical center in Midwest United States. J Pharm Pract. 2015;28(3):238–248.
- , , , et al. Antimicrobial De‐escalation of treatment for healthcare‐associated pneumonia within the Veterans Healthcare Administration. J Antimicrob Chemother. 2016;71(2):539–546.
- , , , et al. Community‐associated Clostridium difficile infection and antibiotics: a meta‐analysis. J Antimicrob Chemother. 2013;68(9):1951.
- , , , . Meta‐analysis of antibiotics and the risk of community‐associated Clostridium difficle infection. Antimicrob Agents Chemother. 2013;57(5):2326–2332.
- , , , et al. Evaluating diagnosis‐based case‐mix measures: how well do they apply to the VA population? Med Care. 2001;39:692–704.
- , , . What is the role of antimicrobial stewardship in improving outcomes of patients with CAP? Infect Dis Clin North Am. 2013;27(1):211–228.
- , , , et al. Quality of care for elderly patients hospitalized for pneumonia in the United States, 2006 to 2010. JAMA Intern Med. 2014;174(11):1806–1814.
- , , , et al. An evaluation of the impact of antibiotic stewardship on reducing the use of high‐risk antibiotics and its effect on the incidence of Clostridium difficile infection in hospital settings. J Antimicrob Chemother. 2012;67(12):2988–2996.
- , , , et al.; Centers for Disease Control and Prevention. Vital signs: improving antibiotic use among hospitalized patients. MMWR Morb Mortal Wkly Rep. 2014;63(9):194–200.
- , , et al. Effect of procalcitonin‐based guidelines vs standard guidelines on antibiotic use in lower respiratory tract infections: the ProHOSP randomized controlled trial. JAMA. 2009;302(10):1059–1066.
- , , , et al. Cost‐effectiveness of procalcitonin‐guided antibiotic use in community acquired pneumonia. J Gen Intern Med. 2013;28(9):1157–1164.
- , , , , , . Interim evaluation of a Protocol to Optimize the Duration of Pneumonia Therapy at Hospital Discharge. Open Forum Infect Dis. 2015;2(suppl 1):S379.
- , , , et al. Intervention to improve antibiotic selection and shorten treatment durations at the time of hospital discharge. Open Forum Infect Dis. 2015;2(suppl 1):S1.
- , , , et al. Using the electronic medical record to identify community‐acquired pneumonia: toward a replicable automated strategy. PLoS One. 2013;8(8):e70944.
Pneumonia is the leading inpatient infectious diagnosis for which antimicrobials are prescribed in the United States.[1] Supported by moderate‐ to high‐quality evidence, guidelines produced jointly by the Infectious Diseases Society of America (IDSA) and American Thoracic Society (ATS) recommend treating pneumonia with the shortest appropriate duration of antimicrobial therapy to minimize risk for antimicrobial‐related adverse events.[2, 3, 4]
Evidence supports short duration of therapy for treatment of uncomplicated pneumonia.[3, 4, 5, 6, 7, 8, 9, 10, 11, 12] IDSA/ATS guidelines state, patients with CAP [community‐acquired pneumonia] should be treated for a minimum of 5 days (level 1 evidence), should be afebrile for 4872 hours, and should have no more than 1 CAP‐associated sign of clinical instabilitybefore discontinuation of therapy (level II evidence). (Moderate recommendation.) A longer duration of therapy may be warranted if initial therapy was not active against the identified pathogen or if it was complicated by [abscess, empyema, severe immunosuppression, or] extra‐pulmonary infection such as meningitis or endocarditis. (Weak recommendation; level III evidence).[3] Recommended therapy duration for patients with uncomplicated healthcare‐associated pneumonia (HCAP) who respond to initial therapy is 7 to 8 days unless gram‐negative nonfermenting rods or complications are identified (level I evidence).[4]
Within the Veterans Health Administration (VHA), the Antimicrobial Stewardship Taskforce (ASTF) was created to optimize care by developing, deploying, and monitoring a national‐level strategic plan for antimicrobial therapy management improvements.[13, 14] Although single‐center studies have found antimicrobial therapy for CAP being frequently prescribed for longer than recommended, the reproducibility of this finding across different facilities has not been assessed.[15, 16] The ASTF collaborated with the VHA Center for Medication Safety to assess total duration of antimicrobial therapy prescribed for veterans hospitalized with uncomplicated pneumonia.[17]
METHODS
This retrospective multicenter evaluation was conducted in 30 VHA facilities that volunteered to participate in this project. Inpatients discharged with a primary International Classification of Diseases, Ninth Revision, Clinical Modification (ICD‐9‐CM) diagnosis code for pneumonia (or pneumonia diagnosis secondary to primary sepsis diagnosis) during 2013 were evaluated.[18] Diagnoses, admissions, and patient demographics were identified using Veterans Affairs (VA) integrated databases through the Austin Integrated Technology Center. Up to 200 admissions per facility were randomly selected for review. Clinical pharmacists at each facility performed manual record reviews utilizing a standardized protocol and collection form. Completed cases were uploaded to a central database for analysis. Standardized chart abstraction was facilitated by detailed instructions, a data dictionary, and monthly conference calls.
Inclusion criteria required patient admission to any medical ward including intensive care unit (ICU) wards for 48 hours, receipt of >24 hours inpatient antimicrobial therapy (eg, at least 2 doses of a once‐daily antibiotic), documentation of pneumonia discharge diagnosis, and survival until discharge. Exclusion criteria were: complicated pneumonia (lung abscess, necrotizing pneumonia, thoracentesis performed), significant immunosuppression (cancer chemotherapy or absolute neutrophil count <1500 cell/mm3 within 28 days, organ transplantation, human immunodeficiency virus infection); or extrapulmonary infection (eg, meningitis, endocarditis).[3] Patients were also excluded if directly transferred from another inpatient facility, pneumonia occurred >48 hours after admission, index hospitalization was >14 days, previously hospitalized within 28 days prior to index admission, or discharged without documentation of completing a full course of therapy. In addition, patients who received initial therapy discordant with culture and susceptibility findings, were not clinically stable by discharge, or had gram‐negative nonfermentative bacilli cultured were excluded from analysis because according to the guidelines, either data are lacking to support a short duration of therapy such as initial discordant therapy, or a longer duration of therapy may be warranted such as gram‐negative nonfermentative bacilli and clinical instability at discharge.[4] Our intent for these exclusions was to minimize bias against clinician decision making for cases where a longer duration of therapy may have been appropriate.
Patients meeting all criteria had the following abstracted: demographics; prior healthcare exposures, admitting location (ICU or non‐ICU ward), parameters for calculation of Pneumonia Severity Index (PSI), culture results obtained 48 hours of admission, duration of antimicrobials administered during hospitalization and prescribed upon discharge (or recommendations for outpatient duration in the discharge summary for patients receiving medications from non‐VA sources), daily clinical stability assessment, Clostridium difficile infection (CDI) test results, and readmission or death within 28 days of discharge.[19]
Guideline‐similar CAP therapy duration was defined as a minimum of 5 days of antimicrobials, up to a maximum of 3 additional days beginning the first day the patient was afebrile and exhibited 1 sign of clinical instability (heart rate > 100 beats/minute, respiratory rate >24 breaths/minute, systolic blood pressure <90, oxygen saturation <90% or partial pressure of oxygen <60 mm Hg on room air or baseline O2 requirements, or not returned to baseline mental status).[3] This definition was made by consensus decision of the investigators and was necessary to operationalize the relationship between clinical stability and appropriate duration of therapy. Guideline‐similar HCAP therapy duration was defined as 8 days.[4] CDI was defined in accordance with VA criteria for hospital onset and community‐onset healthcare‐facilityassociated CDI.[20] All‐cause hospital readmission and all‐cause death were defined as inpatient readmission or any death, respectively, within 28 days after discharge for the pneumonia admission.
Demographics, comorbidities, microbiology results, antimicrobial utilization, CDI, readmission, and death rates between guideline‐similar and guideline‐excessive duration of antimicrobial therapy groups were characterized with descriptive statistics, Mann‐Whitney U test, or 2 test as indicated (significance defined as P < 0.05). Multivariable logistic regression (SAS version 9.3 [SAS Institute, Cary, NC]) was used to assess association between duration of therapy exceeding recommended guidelines with all‐cause readmission and all‐cause death after adjustment for pertinent covariates. Odds ratios (OR) with 95% confidence intervals ( 95% CI) were reported. This medication utilization evaluation (MUE) was reviewed by the Hines VHA Institutional Review Board for Human Subjects Protection. Based on VHA Policy Handbook 1058.05, which defines operations activities that may constitute research, the board determined that the evaluation constituted quality improvement rather than research, and thus was exempt from VHA Human Subjects Research requirements.
RESULTS
There were 3881 admissions eligible for chart review. After manual chart review of inclusion and exclusion criteria, 1739 (44.8%) patients were available for duration of therapy analysis. (Figure 1). Only 1 admission for each patient was analyzed.
The cohort was comprised primarily of elderly male patients (96.6%) of whom more than two‐thirds were hospitalized for CAP (Table 1). Most patients had significant disease severity as indicated by PSI score; however, only 12% were directly admitted to the ICU. Blood cultures were collected in >95% of cases; lower respiratory cultures were obtained in 39.9% of cases.
| Characteristic | Value |
|---|---|
| |
| Age, y, mean SD | 71.8 (12.7) |
| Gender, male, n (%) | 1,680 (96.6) |
| Living environment at time of index admission, n (%) | |
| Home | 1,416 (81.4) |
| VA community‐based living center | 88 (5.1) |
| Non‐VA long‐term skilled care facility | 95 (5.5) |
| Assisted living facility | 52 (2.9) |
| Not documented | 46 (2.7) |
| Other | 29 (1.7) |
| Prior healthcare exposures, n (%) | |
| Prior hospitalization within last 90 days | 310 (17.8) |
| Residence in a long‐term skilled care facility in last 90 days | 209 (12.0) |
| Chronic dialysis within last 28 days | 52 (3.0) |
| Intravenous antimicrobials within last 28 days | 76 (4.4) |
| Wound, tracheostomy, or ventilator care in last 28 days | 37 (2.1) |
| Community‐acquired pneumonia, n (%) | 1,195 (68.7) |
| Healthcare‐associated pneumonia, n (%) | 544 (31.3) |
| Comorbidities, n (%) | |
| Renal disease | 438 (25.2) |
| Liver disease | 39 (2.2) |
| Congestive heart failure | 436 (25.1) |
| Cerebrovascular disease | 356 (20.4) |
| Neoplastic disease (excluding skin) | 384 (22.1) |
| Severity of illness, n (%) | |
| Pneumonia Severity Index | |
| Class I | 30 (1.8) |
| Class II | 198 (11.4) |
| Class III | 349 (20.1) |
| Class IV | 759 (43.6) |
| Class V | 403 (23.2) |
| Intensive care upon admission | 212 (12.2) |
| Culture collection 48 hours of admission, n (%) | 1,687 (97.0) |
| Blood | 1,631 (96.7) |
| Lower respiratory tract (sputum) | 673 (39.9) |
| Bronchoalveolar lavage | 20 (1.2) |
| Urine | 632 (37.5) |
| Skin/wound | 3 (0.2) |
| Other | 158 (9.4) |
| Facility complexity, n (%) | |
| Level 1a‐c | 1,286 (74.0) |
| Level 2 | 437 (25.1) |
| Level 3 | 16 (0.9) |
Commonly administered antimicrobials during hospitalization and at discharge are summarized in Table 2. Anti‐pseudomonal ‐lactams and antimethicillin‐resistant Staphylococcus aureus antimicrobials were more frequently administered to patients with HCAP, whereas third‐generation cephalosporins and macrolides were more likely to be administered to patients with CAP. Fluoroquinolones were prescribed to 55.3% of patients upon discharge.
| Inpatient Antimicrobials Administered* | ||||
|---|---|---|---|---|
| Portion of Cohort Receiving Antimicrobial, n (%), n = 1,739 |
Therapy Duration Similar With Guidelines, n (%), n = 241 |
Therapy Duration Exceeding Guidelines, n (%), n = 1,498 | Significance | |
| Antimicrobials Dispensed or Recommended at Discharge | ||||
| Portion of Cohort Receiving Antimicrobial, n (%), n = 1,471 |
Therapy Duration Similar With Guidelines, n (%), n = 151 |
Therapy Duration Exceeding Guidelines, n (%), n = 1,320 | Significance | |
| ||||
| Third‐generation cephalosporins | 809 (46.5) | 75 (31.1) | 734 (49.0) | <0.001 |
| Fluoroquinolones | 836 (48.1) | 114 (47.3) | 722 (48.2) | 0.80 |
| Macrolides | 788 (45.3) | 90 (37.3) | 698 (46.6) | <0.01 |
| Pseudomonal ‐lactams | 692 (39.8) | 138 (57.3) | 554 (37.0) | 0.01 |
| Anti‐MRSA antimicrobials | 663 (38.1) | 135 (56.0) | 528 (35.3) | <0.01 |
| Other ‐lactams | 139 (8.0) | 10 (4.2) | 129 (8.6) | 0.02 |
| Tetracyclines | 119 (6.8) | 14 (5.8) | 105 (7.0) | 0.49 |
| Other | 97 (5.6) | 15 (6.2) | 82 (5.5) | 0.64 |
| Third‐generation cephalosporins | 285 (19.4) | 27 (17.9) | 258 (19.6) | 0.62 |
| Fluoroquinolones | 813 (55.3) | 95 (62.9) | 718 (54.4) | 0.05 |
| Macrolides | 203 (13.8) | 20 (13.3) | 183 (13.9) | 0.83 |
| Pseudomonal ‐lactams | 31 (2.1) | 4 (2.7) | 27 (2.1) | 0.62 |
| Anti‐MRSA antimicrobials | 45 (3.1) | 6 (4.0) | 39 (3.0) | 0.49 |
| Other ‐lactams | 239 (16.3) | 13 (8.6) | 226 (17.1) | 0.01 |
| Tetracyclines | 95 (6.5) | 10 (6.6) | 85 (6.4) | 0.93 |
| Other | 44 (3.0) | 5 (3.3) | 39 (3.0) | 0.81 |
Overall, 13.9% of patients with uncomplicated pneumonia received guideline‐similar duration of therapy (Table 3). A greater proportion of HCAP patients (29.0%) received guideline‐similar therapy duration as compared to CAP patients (6.9%) (P < 0.01 (Table 3). Median duration of therapy was 7 days (interquartile range [IQR] = 78 days) for guideline‐similar therapy compared to 10 days (913 days) for therapy duration in excess of guideline recommendations. Overall, 97.1 % of patients met clinical stability criteria before day 4 of therapy, yet 50% received 4 days of intravenous (IV) therapy (median was 4 days, IQR = 36 days). Antimicrobial therapy was generally completed after discharge, as only 17.3% received their entire treatment course during hospitalization. Median duration of outpatient oral (PO) antimicrobial therapy was twice as long for guideline‐excessive therapy compared to guideline‐similar therapy (6 vs 3 days), whereas duration of inpatient IV and PO antimicrobial therapy was similar. Patients discharged on a fluoroquinolone were more likely to receive guideline‐similar duration of therapy. The VHA classifies facilities into 3 levels of complexity, with lower scores indicating more complex facilities.[21] Guideline‐similar therapy duration occurred in 10.4% of cases in lower complexity facilities (levels 2 and 3),and 15.1% in more complex facilities (level 1) (P = 0.01). The median duration of therapy was similar for more and less complex facilities, respectively (10 days, IQR = 812 days vs 10 days, IQR = 813 days).
| Outcome |
Therapy Duration Similar With IDSA/ATS Guidelines |
Therapy Duration in Excess of IDSA/ATS Guideline Recommendations | Significance |
|---|---|---|---|
| |||
| Antimicrobial duration consistent with guideline recommendations, n (%) | 241 (13.9) | 1,498 (86.1) | NR |
| CAP* | 83 (6.9) | 1,112 (93.1) | NR |
| HCAP* | 158 (29.0) | 386 (71.0) | NR |
| Total days of therapy for pneumonia, median (IQR) | 7 (78) | 10 (913) | NR |
| CAP | 6 (59) | 10 (812) | <0.01 |
| HCAP | 7 (78) | 11 (1014) | <0.01 |
| Days of IV therapy administered for pneumonia, median (IQR) | 4 (37) | 4 (36) | 0.50 |
| Days of PO inpatient therapy administered, median (IQR) | 1 (03) | 1 (03) | 0.78 |
| Days of PO outpatient therapy dispensed at discharge, median (IQR) | 3 (25) | 6 (47) | <0.01 |
| Days of PO outpatient therapy recommended in Discharge Summary for patients without a VA prescription, median (IQR) | 3 (24) | 5 (47) | <0.01 |
| Aggregate 28‐day hospital readmission, n (%) | 42 (17.4) | 183 (12.2) | 0.03 |
| CAP∥# | 7 (8.4) | 112 (10.1) | 0.58 |
| HCAP∥# | 35 (22.2) | 71 (18.4) | 0.28 |
| Aggregate 28‐day CDI rate, n (%) | 6 (2.5) | 9 (0.6) | 0.03 |
| CAP∥** | 1 (1.2) | 6 (0.5) | 0.44 |
| HCAP∥** | 5 (3.2) | 3 (0.8) | 0.04 |
| Aggregate 28‐day death after discharge, n (%) | 6 (2.5) | 52 (3.5) | 0.43 |
| CAP∥** | 1 (1.2) | 33 (3.0) | 0.35 |
| HCAP∥** | 5 (3.2) | 19 (4.9) | 0.37 |
The 28‐day postdischarge all‐cause readmission rate for patients who received guideline‐similar therapy duration was higher (17.4%) than for patients who received therapy duration in excess of guideline recommendations (12.2%) (P = 0.03). After adjustment for covariates associated with readmission (HCAP, age, prior skilled nursing facility residence, PSI score comorbidity elements), we found no evidence that patients who received guideline‐similar therapy duration were more likely to be readmitted than were patients who received guideline‐excessive duration (OR: 1.1 [95% CI: 0.8, 1.7]) (Table 3). Likewise, no difference in 28‐day all‐cause postdischarge mortality was identified between guideline‐similar and guideline‐excessive duration after adjustment for the same covariates (adjusted OR: 0.5 [95% CI: 0.2, 1.2]) (Table 4).
| Model Variables | Odds Ratio | 95% Confidence Interval | P Value |
|---|---|---|---|
| |||
| Readmission model | |||
| Duration of antibiotics | 1.11 | 0.75, 1.64 | 0.62 |
| HCAP | 1.94 | 1.38, 2.72 | <0.01 |
| Age | 1.01 | 1.00, 1.03 | 0.04 |
| Prior skilled nursing facility residence | 0.91 | 0.59, 1.40 | 0.67 |
| PSI score comorbidity elements | |||
| Neoplastic disease | 1.20 | 0.86, 1.67 | 0.29 |
| Liver disease | 1.55 | 0.66, 3.64 | 0.31 |
| CHF | 1.15 | 0.83, 1.59 | 0.41 |
| Cerebrovascular disease | 1.06 | 0.75, 1.50 | 0.75 |
| Renal disease | 1.51 | 1.09, 2.08 | 0.01 |
| Mortality model | |||
| Duration of antibiotics | 0.53 | 0.23, 1.22 | 0.14 |
| HCAP | 2.53 | 1.38, 4.65 | <0.01 |
| Age | 1.06 | 1.03, 1.09 | <0.01 |
| Prior skilled nursing facility residence | 0.79 | 0.38, 1.66 | 0.53 |
| PSI score comorbidity elements | |||
| Neoplastic disease | 1.03 | 0.57, 1.87 | 0.91 |
| Liver disease | <0.001 | <0.001, >999.9 | 0.98 |
| CHF | 0.73 | 0.39, 1.38 | 0.34 |
| Cerebrovascular disease | 0.82 | 0.43, 1.56 | 0.55 |
| Renal disease | 0.72 | 0.39, 1.35 | 0.31 |
CDI cases (n = 15) were too sparse to adequately perform multivariable logistic regression analysis; however, a higher percentage of patients who received guideline‐similar duration of therapy developed CDI compared to patients who received guideline‐excessive duration of therapy (40.0% vs 13.6%, P < 0.01). The median duration of therapy for patients who did and did not develop CDI was similar (8 days, IQR = 714 days vs 10 days, IQR = 812 days, P = 0.85, respectively). Patients who developed CDI had a higher rate of HCAP diagnosis (1.5% vs 0.6%; P = 0.06), were more likely to have concomitant non‐pneumonia infection (40.0% vs 9.5%, P < 0.01), have chronic comorbidity (86.7% vs 59.1%, P = 0.03), and to have been admitted to the ICU (26.7% vs 12.1%, P = 0.09).
DISCUSSION
IDSA/ATS guidelines for pneumonia duration of therapy generally agree with other professional society guidelines including the British Thoracic Society and National Institute for Health and Care Excellence.[22, 23] In contrast to existing evidence and guideline recommendations, this multi‐centered evaluation identified prolonged durations of antimicrobial therapy prescribed in 93% and 71% of patients with uncomplicated CAP and HCAP (Table 3), respectively.[3, 4, 5, 6, 7, 8, 9, 10, 11, 12] Almost all (97.1%) uncomplicated CAP and HCAP patients met clinical stability criteria before day 4 of hospitalization, yet the median duration of IV therapy was 4 days. Because criteria for IV to PO conversion and the clinical stability definition utilized in this analysis were similar, many patients may have been eligible for PO therapy earlier, favorably impacting length of stay, cost, and adverse effects.[3, 12, 24, 25, 26] Although median days of inpatient PO therapy administered was 1 day (IQR = 03 days), inpatient observation after PO conversion may not be necessary. The duration of PO therapy was based on calendar days, where if a patient received 1 dose of a once daily antibiotic (ie, levofloxacin), they were considered to have received 1 day of inpatient PO antibiotics even if discharged the same day.
Approximately half of all days of therapy occurred after discharge. Although the median therapy duration for inpatients was similar, the median duration of antimicrobials administered upon hospital discharge was twice as long for patients receiving guideline‐excessive compared to guideline‐similar duration of therapy. The median excess in antibiotic duration is almost entirely accounted for by excess outpatient days of therapy. This is an important consideration for antimicrobial stewardship programs that tend to focus on inpatient antimicrobial use.
Noteworthy observations include the low rate of respiratory tract culture collection (41%) and frequent use of fluoroquinolones upon discharge. Collection of respiratory tract cultures is recommended for all patients with HCAP and patients with CAP who have risk factors for resistant pathogens, characteristics that were common in this cohort.[3, 4] Recently, we identified that respiratory culture collection is associated with increased de‐escalation rates in HCAP, and that culture‐negative patients frequently receive fluoroquinolones.[27] IDSA/ATS CAP guidelines discourage empirically switching to PO fluoroquinolone therapy based on bioavailability considerations alone.[3] Further, fluoroquinolones are considered to be associated with high risk of CDI.[28, 29] Prescription of fluoroquinolone upon discharge was associated with guideline‐similar duration of therapy and was not shown to be associated with CDI; however, power to detect differences between exposures to specific antimicrobials and CDI was low.
CDI was more common in patients with CAP (1.2% vs 0.5%) and HCAP (3.2% vs 0.8%) who received duration of therapy similar with guideline recommendations. This observation is confounded, as patients with CDI had significantly greater comorbidity as well as secondary infections and tended to more frequently receive ICU care. There were no differences in adjusted rates of readmission or death between patients receiving guideline‐similar and guideline‐excessive duration of therapy.
Evaluation strengths included exclusion of patients with complicating conditions possibly requiring prolonged antimicrobial treatment courses, which allowed the evaluation to focus on patients most likely to benefit from shorter course therapy. The definition of appropriate therapy duration was based upon daily assessment of clinical stability criteria that paralleled the CAP guidelines. The definition utilized objective parameters while accounting for patient variability in achieving clinical stability criteria. Finally, the analyses of clinical end points suggest that shorter duration of therapy may be as safe and effective as longer duration of therapy in uncomplicated pneumonia.
Limitations include those common to other analyses conducted within the VHA, including a predominantly elderly male cohort.[30] Only ICD‐9‐CM codes consistent with a discharge diagnosis of pneumonia were used to identify the cohort, and clinical impressions not documented in the medical record may have impacted the clinician's treatment duration decisions. The upper limit of appropriate duration of therapy for CAP was arbitrarily set at up to 3 days beyond meeting clinical stability criteria to provide a reasonable duration of appropriate therapy beyond clinical stability to operationalize the duration of therapy recommendations within the context of the IDSA/ATS guidelines. Additionally, CIs for the ORs of readmission and mortality were broad, and thus too imprecise to determine whether guideline‐similar durations increased or decreased readmission or mortality in comparison with therapy that exceeded guideline recommendations. We could not fully assess the potential for association between guideline‐excessive therapy duration and risk for CDI due to sparse cases. Finally, non‐VA prescription data were not available for all patients, and we relied on intended duration of therapy as recommended by the discharging provider in 4.1% of cases.
Most quality assessments of pneumonia treatment have focused on antimicrobial selection and timely administration or conversion from IV to PO therapy.[31, 32] This evaluation identified potential opportunities for expansion of antimicrobial stewardship activities during the transition of care setting. The efficacy of short‐course ‐lactam, macrolide, or fluoroquinolone therapy for CAP appears equivalent to longer treatment regimens with no difference in adverse event rates, suggesting that optimal duration of therapy may be a rational target for quality improvement.[5, 6, 7, 8, 9, 10, 11, 12, 15, 31] Recommendations for HCAP duration of therapy are extrapolated from a prospective multicentered study, which randomized patients with hospital‐acquired pneumonia to receive 8 versus 15 days of therapy, that identified similar outcomes to ours.[4, 12]
Single‐center studies have identified that antimicrobial therapy for pneumonia is frequently prescribed for longer than recommended by guidelines, which found a similar median duration of therapy as our evaluation.[15, 16] Similar to Jenkins et al., we observed a high rate of fluoroquinolone prescriptions upon discharge.[16]
There are few published examples of interventions designed to limit excessive duration of therapy, particularly for antimicrobials prescribed upon hospital discharge.[15, 33, 34] Serial procalcitonin measurements have been used to guide duration of therapy for pneumonia; however, the costbenefit ratio of procalcitonin measurement is unclear.[35, 36] Procalcitonin use was uncommon, and none of the participating facilities in our evaluation utilized a specific algorithm to guide therapy duration. Limited data suggest that patient‐level prospective audit with feedback may be effective. Advic et al. evaluated management of presumed CAP before and after education and prospective feedback to medical teams concerning antimicrobial selection and duration of therapy.[15] The intervention led to a decrease in median duration of therapy from 10 days (IQR = 813 days) to 7 days (IQR = 78 days) without increasing clinical failure or readmission rates. We recently reported a single‐center evaluation in which pharmacists utilizing a decision support tool while performing discharge medication reconciliation were able to reduce excessive mean duration of therapy from 9.5 days ( 2.4 days) to 8.3 days ( 2.9 days) in patients without complicated pneumonia, with a 19.2% reduction in duration of therapy prescribed at discharge.[37] A similar approach utilizing pharmacists performing discharge review has recently been reported in a community hospital.[38]
Future work should recognize that few patients complete their entire course of therapy as inpatients, and the majority of treatment is prescribed upon discharge. Pivotal time points for antimicrobial stewardship intervention include day 2 to 3 of hospitalization when conveying suggestions for antimicrobial de‐escalation and/or IV to PO conversion, and toward the end of hospitalization during discharge planning. Although it may not be feasible for antimicrobial stewards to review all uncomplicated cases of pneumonia during hospitalization, most facilities have a systematic process for reviewing medications during transitions of care. We believe that interventions intended to assess and recommend shortened courses of therapy are appropriate. These interventions should include a mechanism for support by stewardship personnel or other infectious diseases specialists. Based on our evaluation, the ASTF produced and disseminated clinical guidance documents and tools to triage pneumonia case severity and assess response to therapy. Qualified personnel are encouraged to use this information to make recommendations to providers regarding excessive duration of therapy for uncomplicated cases where appropriate. Other work should include an in‐depth assessment of clinical outcomes related to treatment duration, investigation of provider rationale for prolonged treatment, and duration of antimicrobial therapy prescribed upon discharge for other common disease states. Finally, manual chart review to classify uncomplicated cases and related outcomes was laborious, and automated case identification is technologically plausible and should be explored.[39]
In conclusion, this national VHA MUE found that patients with uncomplicated pneumonia were commonly prescribed antimicrobials for the duration of therapy in excess of guideline recommendations. Patients with uncomplicated pneumonia who received therapy duration consistent with guideline recommendations did not have significantly different all‐cause readmission and death rates compared to patients receiving prolonged treatment. Approximately half of all therapy was prescribed upon hospital discharge, and clinicians as well as antimicrobial stewardship programs should consider these findings to address excessive duration of antimicrobial therapy upon hospital discharge.
Acknowledgements
The authors acknowledge Dr. Michael Fine for his assistance with utilization of the Pneumonia Severity Index, Kenneth Bukowski for assisting with development of data collection tools and data management, and members of the Antimicrobial Stewardship Taskforce Implementation Sub‐Committee. Collaborators in the Pneumonia Duration of Therapy Medication Utilization Evaluation Group include: Biloxi VA (VA Gulf Coast): Cheryl Hankins, PharmD, BCPS; Central Alabama VAMC: Lauren Rass, PharmD, BCPS, Kelly Mooney, PharmD, BCPS; Central Arkansas: Nicholas Tinsley, MS, PharmD; Chillicothe VA: Stephen Hanson, PharmD, BCPS, Beth Gallaugher, BSN, RN, Elizabeth Baltenberger, PharmD; Cincinnati VA: Jason Hiett, PharmD, BCPS, Victoria Tate, PharmD, BCPS, Brian Salzman, PharmD; Dorn Medical Center: MaryAnne Maurer, PharmD, BCPS, BCACP, Rebekah Sipes, PharmD, BCACP, Ginger Ervin, PharmD; Dwight D. Eisenhower VAMC: Emily Potter, PharmD; Hudson Valley: Rita Lee Bodine, PharmD, Clement Chen, PharmD, Cristina Fantino, PharmD; James H. Quillen VAMC: Marty Vannoy, PharmD, BCPS, Erin Harshbarger, PharmD, Kristen Nelsen, PharmD; Jesse Brown VAMC: Lisa Young, PharmD, BCPS, AQ‐ID, Andrea Bidlencik, PharmD, BCPS; Kansas City VA: Jamie Guyear, PharmD, AQ‐ID, Ann Ungerman, PharmD, BCPS, Lauri Witt, PharmD, BCACP; Louis Stokes Cleveland VAMC: Amy Hirsch, PharmD, BCPS, Steven Adoryan, PharmD, BCP‐CC, Amanda Miller, PharmD, BCPS; Maine VAMC: Joel Coon, PharmD, Rachel Naida, PharmD, Kelly Grossman, PharmD; Martinsburg VAMC: Kelly Li, PharmD, Sarah Mickanis, PharmD, BCPS; Miami VA Medical Center: Mara Carrasquillo, BS, PharmD, Maribel Toro, PharmD; North Florida/South Georgia Veterans Health System: Nora Morgan, PharmD, Hugh Frank, PharmD, BCPS, BCPP, Sarah Onofrio, PharmD, BCPS; North Texas HCS: Susan Duquaine, PharmD, BCPS, AQ‐ID, Ruben Villaneuva, PharmD, BCPS, Jaela Dahl, PharmD, BCPS; Ozarks: Andrew Siler, PharmD, BCPS, Michele Walker, PharmD, CGP, Jennifer Cole, PharmD, BCPS, BCCCP; Providence VAMC: Kerry LaPlante, PharmD, FCCP, Lindsey Williamson, PharmD; Richmond VA: Daniel Tassone, PharmD, BCPS; Salisbury VAMC: Brett Norem, PharmD, Marrisa Ragonesi, PharmD; San Juan VA: Monica Sanabria‐Seda, PharmD, BCPS, Jaime Velez‐Fores, PharmD, BCPS, AQ‐ID, Norma Ayala‐Burgos, PharmD; Sioux Falls VA: Andrea Aylward, PharmD, BCPS; South Texas HCS: Kelly Echevarria, PharmD, BCPS, AQ‐ID, Manuel Escobar, PharmD; Tennessee Valley HCS: Casey Ryals, PharmD, BCACP, Molly Hurst, PharmD, Jonathan Hale, PharmD; VA Central Iowa Health Care System: Jenny Phabmixay, PharmD, BCPS, Mackenzie Brown, PharmD, BCPS, Cynthia Muthusi, PharmD, BCPS; VA Loma Linda: Tony Chau, PharmD; VA Sierra Nevada: Scott Mambourg, PharmD, BCPS, AAHIVP, Matthew Han, PharmD, Nathan Mihoch, PharmD; VA WNY Healthcare System: Kari Mergenhagen, PharmD, BCPS, AQ‐ID, Christine Ruh, PharmD, BCPS; Veterans Affairs Salt Lake City Health System: Emily Spivak, MD, MHS, Patricia Orlando, PharmD
Disclosures: Karl Madaras‐Kelly is employed full time by Idaho State University and has a without compensation appointment as a clinical pharmacist at the Boise VA Medical Center. He receives grant support unrelated to this work through the Department of Veterans Affairs subcontracted to Idaho State University. Muriel Burk is employed full time through the Department of Veterans Affairs as clinical pharmacy specialist in outcomes and medication safety evaluation. Christina Caplinger was employed by the Department of Veterans Affairs as an infectious diseases fellow at the time this work was completed. She is currently employed by Micromedex. Jefferson Bohan is employed full time by the Department of Veterans Affairs as an infectious diseases fellow. Melinda Neuhauser is employed full time through the Department of Veterans Affairs as a clinical pharmacy specialistinfectious diseases. Matthew Goetz is employed full time through the Department of Veterans Affairs as an infectious diseases physician. Rhongping Zhang is employed full time through the Department of Veterans Affairs as a data analyst. Francesca Cunningham is employed full time through the Department of Veterans Affairs as the director of the VA Center for Medication Safety. This work was supported with resources and use of the Department of Veterans Affairs healthcare system. The views expressed in this article are solely those of the authors and do not necessarily reflect the position or policy of the Department of Veterans Affairs. The authors report no conflicts of interest.
- Centers for Disease Control and Prevention. National hospital discharge survey 2010. Available at: http://www.cdc.gov/nchs/fastats/pneumonia.htm. Accessed December 1, 2014.
- , , , et al. Implementing an antibiotic stewardship program: guidelines by the Infectious Diseases Society of America and the Society for Healthcare Epidemiology of America. Clin Infect Dis. 2016;62(10):e51–e77.
- , , , et al. Infectious Diseases Society of America/American Thoracic Society consensus guidelines on the management of community‐acquired pneumonia in adults. Clin Infect Dis. 2007;44(suppl 2):S27–S72.
- American Thoracic Society; Infectious Diseases Society of America. Guidelines for the management of adults with hospital‐acquired, ventilator‐associated, and healthcare‐associated pneumonia. Am J Respir Crit Care Med. 2005;171(4):388–416.
- , , , et al. Short‐ versus long‐course antibacterial therapy for community‐acquired pneumonia: a meta‐analysis. Drugs. 2008;68(13):1841–1854.
- , , , et al. Efficacy of short‐course antibiotic regimens for community‐acquired pneumonia: a meta‐analysis. Am J Med. 2007;120:783–790.
- , , , et al. High‐dose, short‐course levofloxacin for community‐acquired pneumonia: a new treatment paradigm. Clin Infect Dis. 2003;37:752–760.
- , , , et al. Comparison of 7 versus 10 days of antibiotic therapy for hospitalized patients with uncomplicated community‐acquired pneumonia: a prospective. Am J Ther. 1999;6(4):217–222.
- , , , et al. Effectiveness of discontinuing antibiotic treatment after three days versus eight days in mild to moderate‐severe community acquired pneumonia: randomised, double blind trial. BMJ. 2006;332(7554):1355.
- , , , et al. Efficacy of a three day course of azithromycin in moderately severe community‐acquired pneumonia. Eur Respir J. 1995;8(3):398–402.
- , , , et al. Comparison of 8 vs 15 days of antibiotic therapy for ventilator‐associated pneumonia in adults: a randomized trial. JAMA. 2003;290(19):2588–2598.
- , , , et al. Effectiveness of early switch from intravenous to oral antibiotics in severe community acquired pneumonia: multicentre randomized trial. BMJ. 2006;333(7580):1193.
- , , , , . Unnecessary antimicrobial use in the context of Clostridium difficile infection: a call to arms for the Veterans Affairs Antimicrobial Stewardship Task Force. Infect Control Hosp Epidemiol. 2013;34(6):651–653.
- VHA Directive 1031. Antimicrobial stewardship programs. Available at: https://www1.va.gov/vhapublications/ViewPublication.asp?pub_ID=2964. Accessed December 1, 2014.
- , , , et al. Impact of an antimicrobial stewardship intervention on shortening the duration of therapy for community‐acquired pneumonia. Clin Infect Dis. 2012;54:1581–1587.
- , , , et al. Targets for antibiotic and healthcare resource stewardship in inpatient community‐acquired pneumonia: a comparison of management practices with National Guideline Recommendations. Infection. 2013;41(1):135–144.
- , , , , . Pharmacy benefits management in the Veterans Health Administration: 1995 to 2003. Am J Manag Care. 2005;11(2):104–112.
- , , , . Accuracy of administrative data for identifying patients with pneumonia. Am J Med Qual. 2005;20(6):319–328.
- , , , et al. A prediction rule to identify low‐risk patients with community‐acquired pneumonia. N Engl J Med. 1997;336:243–250.
- , , , , . Clostridium difficile infections in Veterans Health Administration acute care facilities. Infect Control Hosp Epidemiol. 2014;35(8):1037–1042.
- , , , , . Organization complexity and primary care providers' perceptions of quality improvement culture within the Veterans Health Administration. Am J Med Qual. 2016;31(2):139–146.
- , , , et al. BTS guidelines for the management of community acquired pneumonia in adults: update 2009. Thorax. 2009;64(suppl 3):iii1–iii55.
- National Institute for Health and Care Excellence. Pneumonia in adults: diagnosis and management. Available at: http://www.nice.org.uk/guidance/cg191. Published December 2014. Accessed May 9, 2016.
- , , , , , . A prospective randomized study of inpatient IV antibiotics for community‐acquired pneumonia: the optimal duration of therapy. Chest. 1996;110(4):965–971.
- , , , et al. Early switch from intravenous to oral antibiotics and early hospital discharge: a prospective observational study of 200 consecutive patients with community‐acquired pneumonia. Arch Intern Med. 1999;159(20):2449–2454.
- , , , . Correlates and economic and clinical outcomes of an adult IV to PO antimicrobial conversion program at an academic medical center in Midwest United States. J Pharm Pract. 2015;28(3):238–248.
- , , , et al. Antimicrobial De‐escalation of treatment for healthcare‐associated pneumonia within the Veterans Healthcare Administration. J Antimicrob Chemother. 2016;71(2):539–546.
- , , , et al. Community‐associated Clostridium difficile infection and antibiotics: a meta‐analysis. J Antimicrob Chemother. 2013;68(9):1951.
- , , , . Meta‐analysis of antibiotics and the risk of community‐associated Clostridium difficle infection. Antimicrob Agents Chemother. 2013;57(5):2326–2332.
- , , , et al. Evaluating diagnosis‐based case‐mix measures: how well do they apply to the VA population? Med Care. 2001;39:692–704.
- , , . What is the role of antimicrobial stewardship in improving outcomes of patients with CAP? Infect Dis Clin North Am. 2013;27(1):211–228.
- , , , et al. Quality of care for elderly patients hospitalized for pneumonia in the United States, 2006 to 2010. JAMA Intern Med. 2014;174(11):1806–1814.
- , , , et al. An evaluation of the impact of antibiotic stewardship on reducing the use of high‐risk antibiotics and its effect on the incidence of Clostridium difficile infection in hospital settings. J Antimicrob Chemother. 2012;67(12):2988–2996.
- , , , et al.; Centers for Disease Control and Prevention. Vital signs: improving antibiotic use among hospitalized patients. MMWR Morb Mortal Wkly Rep. 2014;63(9):194–200.
- , , et al. Effect of procalcitonin‐based guidelines vs standard guidelines on antibiotic use in lower respiratory tract infections: the ProHOSP randomized controlled trial. JAMA. 2009;302(10):1059–1066.
- , , , et al. Cost‐effectiveness of procalcitonin‐guided antibiotic use in community acquired pneumonia. J Gen Intern Med. 2013;28(9):1157–1164.
- , , , , , . Interim evaluation of a Protocol to Optimize the Duration of Pneumonia Therapy at Hospital Discharge. Open Forum Infect Dis. 2015;2(suppl 1):S379.
- , , , et al. Intervention to improve antibiotic selection and shorten treatment durations at the time of hospital discharge. Open Forum Infect Dis. 2015;2(suppl 1):S1.
- , , , et al. Using the electronic medical record to identify community‐acquired pneumonia: toward a replicable automated strategy. PLoS One. 2013;8(8):e70944.
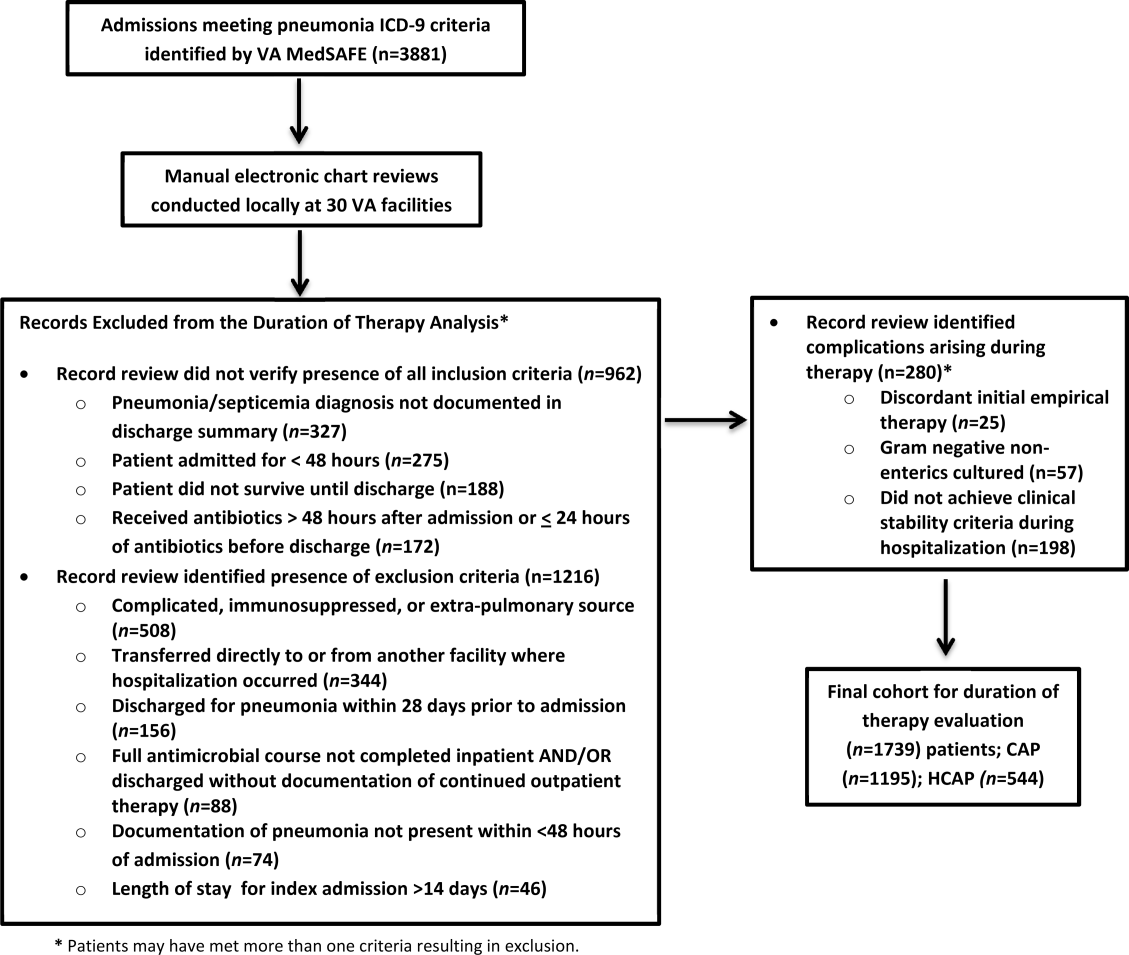
Predicting Antibiotic Resistance in HCAP
Healthcare associated pneumonia (HCAP) is defined as pneumonia that is present upon admission, and occurs in patients that have recently been hospitalized, reside in a nursing home, or have had other recent healthcare exposures. Practice guidelines developed by the American Thoracic Society (ATS) and the Infectious Diseases Society of America (IDSA), recommend strategies for the diagnosis and treatment of patients with HCAP.1 A premise of the guidelines is that recent healthcare exposure places patients at risk for infection due to multi‐drug resistant (MDR) pathogens such as methicillin‐resistant Staphylococcus aureus (MRSA) or Pseudomonas aeruginosa. In addition to criteria utilized to define HCAP, the guidelines state that recent immunosuppression and antibiotic exposure are risk factors for pneumonia due to MDR pathogens. In contrast to the treatment of community‐acquired pneumonia (CAP), the guidelines recommend empirical administration of antibiotics with activity against MRSA and Pseudomonas aeruginosa for all patients with HCAP.
We recently reported that antimicrobial resistance to CAP antibiotics (CAP‐resistance) was identified in one‐third of culture‐positive patients with HCAP.2 Data regarding the predictive ability of the guideline‐defined criteria specific to HCAP are limited.3 Evaluation and potential refinement of the criteria to identify patients at risk for MDR pathogens can aid in making antibiotic‐related treatment decisions.
The purposes of this study are to: 1) develop and validate a model to predict CAP‐resistance among patients with HCAP, and to compare the model's predictive performance to a model that includes traditional guideline‐defined risk factors; and 2) develop models to predict recovery of pathogen‐specific etiology (MRSA and Pseudomonas aeruginosa), and to compare the predictive performance of the pathogen‐specific and CAP‐resistance models.
METHODS
Patients with HCAP who were admitted to 6 Veterans Affairs Medical Centers (VAMC) in the northwestern United States between January 1, 2003 and December 31, 2008 were included in the retrospective cohort study. The cohort was identified utilizing medical records data extracted from the Veterans Integrated Service Network (VISN20) Data Warehouse. The Data Warehouse is a centralized open architecture relational database that houses medical and administrative records data for VISN20 patients. This research complies with all federal guidelines and VAMC policies relative to human subjects and clinical research.
Subjects were identified by the following pneumonia‐related discharge International Classification of Diseases (ICD‐9 CM) codes: 1) a primary diagnosis of 480‐483; 485‐487.0 (pneumonia); or 2) a primary diagnosis of 507.0 (pneumonitis), 518.8 (respiratory failure), or 0.38 (septicemia), and a secondary diagnosis of 480‐483; 485‐487.0.4 Eligibility required that patients received antibiotic therapy for pneumonia within 24 hours of admission, continue inpatient treatment for >24 hours, and meet any of the following guideline‐defined criteria: 1) hospitalization during the preceding 90 days; 2) admission from a nursing home; 3) outpatient or home wound care, outpatient or home infusion therapy, or chronic hemodialysis.1 In addition, patients not meeting guideline‐defined criteria, who had frequent healthcare system exposure, defined as 12 Emergency Department, Medicine, or Surgery clinic visits within 90 days of admission, were also included. Patients were excluded if they were directly transferred from another hospital, or had pneumonia‐related ICD‐9 codes but received inpatient care for pneumonia in a non‐VA hospital.
Study data included medical records for the year prior to admission for HCAP through 30 days afterwards. Data included: demographics; domicile preceding admission; healthcare utilization including diagnosis and procedure codes; inpatient medications administered, and outpatient prescription fills; vital signs; and laboratory test results, including cultures and susceptibilities.
Guideline‐defined criteria for predicting CAP‐resistance were similar to those used to identify the study cohort. Nursing home admission included patients who were directly admitted from a nursing home, skilled nursing facility, or domiciliary. Prior hospitalization 2 days within 90 days was calculated by summing the length of stay for all admissions during the preceding 90 days. Outpatient intravenous therapy, chronic hemodialysis, and wound care therapy was determined from medication administration records and relevant Current Procedural Terminology (CPT) or ICD‐9 procedure codes for care administered within 30 days. Antibiotic exposure was defined as administration of 1 dose of antibiotic during inpatient care, or fill of an outpatient prescription for 1 antibiotic dose within 90 days preceding admission. Immunosuppression was defined as: human immunodeficiency virus (HIV) diagnosis; white blood cell (WBC) count of 2500 cells/mm3 within 30 days of admission; corticosteroid ingestion during prior admission, or outpatient prescription fills for a corticosteroid with quantity sufficient to last 14 days preceding admission; or inpatient ingestion of, or outpatient prescription fills for, transplant or rheumatologic‐related immunosuppressants within 90 days preceding admission.
Additional variables assessed to predict CAP‐resistance were obtained as follows. First, modifications of guideline‐defined criteria were constructed. These included: direct nursing home admission, or recent nursing home stay preceding admission; total days of hospitalization within 90 days preceding admission; specific antibiotic exposures, including dates since last exposure preceding admission; and individual components of the immunosuppression criterion. Other cohort‐developed variables included: demographics; substance use history; chronic comorbidity determined by individual and composite measures of Charlson score; pulmonary disease history (eg, bronchiectasis); type and frequency of outpatient visits; consecutive (2) prescription fills for chronic medications of interest; clinical and surveillance culture results preceding admission; admitting ward; vital signs; and relevant hematology and chemistry labs.5
Sputum, blood, and bronchoscopy‐collected cultures obtained within 48 hours after admission were assessed to determine specimen acceptability. Poor sputum specimens were defined by Gram stain quantitative results indicating >10 epithelial cells (EPI) per low power field (LPF), or in the absence of quantitative results, semi‐quantitative results indicating 2‐4+EPI. Single positive blood cultures with results indicating likely contaminants were considered poor specimens. All bronchoscopy‐obtained specimens were considered acceptable. All cultures classified as poor specimens were excluded, and microbiology results were evaluated for the remaining specimens.2, 6 Organisms thought to represent colonization or contamination were excluded: coagulase‐negative (CN) Staphylococcus, Enterococcus sp, Bacillus sp, Proprionibacterium sp, and Candida sp. Recovery of a potential pneumonia pathogen from 1 acceptable culture constituted a culture‐positive admission.
CAP‐resistance was determined for each isolate. CAP‐resistance was defined as non‐susceptibility to non‐pseudomonal third generation cephalosporins (ceftriaxone or cefotaxime) or non‐pseudomonal 8‐methoxy fluoroquinolones (moxifloxacin, gatifloxacin), the VA preferred agents for treatment of CAP.7 There were differences between facilities in susceptibility reporting criteria; therefore, the following approach was used to determine CAP‐resistance. First, MRSA and Pseudomonas aeruginosa isolates were classified as CAP‐resistant. Second, susceptibility results were directly utilized to determine CAP‐resistance if both antibiotic results were available. Third, if only a surrogate antibiotic from a class was reported, a representative antibiotic consistent with Clinical Laboratory Standards Institute reporting criteria was utilized.8 Finally, expert rules determined CAP‐resistance for select potential pneumonia pathogens (eg, Haemophilus sp) if antibiotic susceptibility results for both cephalosporin and fluoroquinolone classes were not reported.815 Presence of 1 CAP‐resistant isolate resulted in a CAP‐resistant classification for an admission. MRSA and Pseudomonas aeruginosa endpoints were defined in a similar manner. Only the first admission for each patient was utilized in the analysis.
The probability of CAP‐resistance was predicted from guideline‐defined criteria (guideline‐defined model) with logistic regression. Next, non‐guideline variables were classified as high, medium, or low interest for association with CAP‐resistance. Variables were assessed for collinearity. A model of CAP‐resistance was developed from variables of high interest. Guideline‐defined criteria were omitted to allow consideration of more specific measures (eg, specific antibiotic exposures as opposed to receipt of antibiotics within the preceding 90 days) during this stage. Next, guideline‐defined criteria, and subsequently variables of lesser interest, were added in an attempt to improve the model. Annual trends and plausible interactions were considered. Model selection was by Akaike's Information Criterion (AIC).16 To promote model reliability, the final model was required to lack evidence of over‐fitting in bootstrapped internal validation.17 The guideline‐defined and cohort‐developed models were compared by difference in area under receiver operating characteristic (aROC) curves. The model development process was repeated for MRSA and Pseudomonas aeruginosa endpoints. Finally, to determine if the CAP‐resistance model sufficiently predicted pathogen‐specific MDR, the CAP‐resistance model was re‐estimated for MRSA and Pseudomonas aeruginosa endpoints. Statistical analysis was performed with R version 2.10.0 (The R Foundation for Statistical Computing, Vienna, Austria).
RESULTS
The cohort was comprised of 1300 patients with HCAP. Of these, 375 (28.8% [26.4‐31.4]) met culture‐positive criteria for potential pneumonia pathogens. CAP‐resistant organisms were identified in 118 (31.5% [26.8‐36.4]) patients within 48 hours of admission. CAP‐resistant organisms included: MRSA (49.2% [40.4‐58.1]), Pseudomonas aeruginosa (29.5% [21.9‐38.1]), Enterobacteriaceae (11.4% [6.5‐18.0]), Gram‐negative non‐enterics (8.3% [4.2‐14.4]), Streptococcus pneumoniae (1.5% [0.2‐5.4]), and opportunistic organisms (eg, Mycobacterium spp) (8.3% [4.2‐14.4]). Differences in select characteristics and exposures between culture‐positive and culture‐negative admissions, as well as CAP‐resistant and CAP‐sensitive admissions, were evident (Table 1).
| Characteristic | Culture‐Negative Admissions (n = 925) | Culture‐Positive Admissions (n = 375) | P Value | CAP‐Sensitive Admissions (n = 257) | CAP‐Resistant Admissions (n = 118) | P Value |
|---|---|---|---|---|---|---|
| ||||||
| Demographics | ||||||
| Age (mean/SD) | 71.9 (12.1) | 71.4 (12.4) | 0.44 | 70.4 (12.4) | 72.9 (12.3) | 0.07 |
| Gender (% male) | 97.1 | 98.8 | 0.07 | 98.4 | 99.2 | 1.00 |
| Primary inclusion diagnosis (%) | ||||||
| Pneumonia | 93.1 | 85.9 | <0.01 | 87.2 | 83.1 | 0.87 |
| Aspiration pneumonitis with pneumonia pneumonia witpneumonia | 1.5 | 4.3 | 0.02 | 4.6 | 3.3 | 0.48 |
| Septicemia with pneumonia | 2.6 | 6.2 | <0.01 | 5.1 | 8.5 | 0.25 |
| Respiratory failure with pneumonia | 2.8 | 3.5 | 0.50 | 3.1 | 5.1 | 0.38 |
| HCAP inclusion criteria (%) | ||||||
| Nursing home residence | 31.2 | 35.9 | 0.08 | 30.4 | 46.6 | <0.01 |
| Hospitalization of >2 days in last 90 days | 58.7 | 57.6 | 0.73 | 52.1 | 62.7 | 0.06 |
| Intravenous therapy in last 30 days | 19.5 | 20.7 | 0.61 | 19.5 | 21.2 | 0.68 |
| Outpatient wound care in last 30 days | 2.7 | 2.7 | 1.00 | 3.1 | 1.7 | 0.73 |
| Chronic dialysis in last 30 days | 2.5 | 1.7 | 0.45 | 1.2 | 2.5 | 0.38 |
| Hospitalization duration 0‐2 days in last 90 days | 10.2 | 11.2 | 0.57 | 12.5 | 5.9 | 0.22 |
| >12 ED or clinic visits in last 90 days | 44.1 | 44.6 | 0.86 | 44.0 | 41.5 | 0.74 |
| Other guideline‐defined MDR criteria (%) | ||||||
| Antibiotics in last 90 days | 63.8 | 61.6 | 0.47 | 57.2 | 66.1 | 0.11 |
| Recent immunosuppression | 19.3 | 23.9 | 0.53 | 24.1 | 22.0 | 0.70 |
| Severity of illness (%) | ||||||
| Admitted to the ICU | 21.8 | 41.6 | <0.01 | 26.3 | 38.6* | <0.01 |
| Mechanical ventilation | 5.6 | 12.7 | <0.01 | 12.1 | 12.7 | 0.87 |
| Comorbidity (%) | ||||||
| Charlson comorbidity score (mean/SD) | 4.3 (3.0) | 4.3 (3.0) | 0.85 | 4.1 (3.1) | 4.5 (2.8) | 0.20 |
| Diabetes | 33.8 | 29.2 | 0.10 | 27.2 | 39.0 | 0.07 |
| Prior antibiotic use (%) | ||||||
| Any cephalosporin | 42.0 | 39.9 | 0.48 | 32.3 | 51.7 | <0.01 |
| Third generation cephalosporin | 24.5 | 23.7 | 0.78 | 18.3 | 30.5 | 0.01 |
| Anti‐pseudomonal fluoroquinolone | 28.5 | 28.4 | 1.0 | 23.3 | 37.3 | 0.02 |
| 8‐Methoxy fluoroquinolone | 20.1 | 23.9 | 0.10 | 24.1 | 24.5 | 1.00 |
| Prior corticosteroid use (%) | ||||||
| Systemic steroids (>10 mg/day prednisone) | 11.1 | 13.2 | 0.28 | 11.3 | 16.1 | 0.24 |
| Inhaled steroids | 7.5 | 10.0 | 0.11 | 8.9 | 10.2 | 0.71 |
| Prior MDR cultured (%) | ||||||
| MRSA within <90 days | 4.2 | 7.7 | <0.01 | 2.7 | 15.3 | <0.01 |
| MRSA >90 days but <365 days | 5.6 | 6.5 | 0.54 | 3.9 | 10.2 | 0.03 |
| P. aeruginosa within 365 days | 5.7 | 11.5 | <0.01 | 5.8 | 19.5 | <0.01 |
Of the guideline‐defined criteria, direct admission from a nursing home, prior hospitalization, and recent antibiotic exposure were associated with CAP‐resistance (Table 2). The cohort‐derived CAP‐resistance model included 6 variables. Prior MRSA colonization or infection within 90 days preceding admission was strongly predictive of CAP‐resistance. A composite variable consisting of direct admission from a nursing home or admission from the community after recent discharge from a nursing home was more predictive than direct admission from a nursing home alone. Exposure to cephalosporin antibiotics within the prior year was also predictive of CAP‐resistance. Subcategorizing cephalosporins by class or by most recent exposure in 90‐day increments did not improve the model. The remaining predictors in the model were guideline‐defined infusion therapy criterion, diabetes, and intensive care unit (ICU) admission.
| Guidelinedefined model of CAPResistant HCAP | AIC 461.1 | CohortDeveloped Model of CAPresistant HCAP | AIC 431.1 | ||||
|---|---|---|---|---|---|---|---|
| Variable | OR | 95% CI | P Value | Variable | OR | 95% CI | P Value |
| |||||||
| (Intercept) | NA | NA | NA | (Intercept) | NA | NA | NA |
| Nursing home residence at time of admission | 2.6 | 1.64.4 | <0.001 | Nursing home residence or discharge 180 days prior to admission | 2.3 | 1.43.8 | 0.002 |
| Antibiotic exposure 90 days prior to admission | 1.7 | 1.02.8 | 0.054 | Positive MRSA status: 90 days prior to admission | 6.4 | 2.617.8 | <0.001 |
| Hospitalization 2 days, 90 days prior to admission | 1.6 | 1.02.6 | 0.066 | >90 days but 365 days prior to admission | 2.3 | 0.95.9 | 0.074 |
| Infusion therapy 30 days prior to admission | 1.5 | 0.82.8 | 0.173 | Cephalosporin exposure 365 days prior to admission | 1.8 | 1.12.9 | 0.019 |
| Wound care therapy 30 days prior to admission | 0.5 | 0.12.1 | 0.370 | Infusion therapy 30 days prior to admission | 1.9 | 1.03.5 | 0.044 |
| Hemodialysis therapy 30 days prior to admission | 1.8 | 0.311.2 | 0.497 | Diabetes | 1.7 | 1.02.8 | 0.044 |
| Recent immunosuppression | 0.9 | 0.51.6 | 0.670 | Direct ICU admission upon hospitalization | 1.6 | 1.02.6 | 0.053 |
Of the guideline‐defined criteria, direct admission from a nursing home was most predictive of MRSA HCAP (n = 57), followed by prior hospitalization and recent antibiotic exposure (Table 3). The cohort‐developed model of MRSA HCAP included predictors common to the CAP‐resistance model: direct admission from a nursing home or patients who were recently discharged from a nursing home, history of prior MRSA, and diabetes. Positive MRSA status within 90 days preceding admission exhibited the strongest prediction of MRSA HCAP. Exposure to anti‐pseudomonal fluoroquinolones (ciprofloxacin and levofloxacin) within the prior year was also predictive of MRSA HCAP, however, exposure to 8‐methoxy fluoroquinolone was not (crude odds ratio (OR) = 0.7 [0.3‐1.4]; final model adjusted OR = 0.6 [0.2‐1.2]). Exposure to third generation cephalosporins within the previous year was more predictive than other cephalosporin exposures, and more predictive than exposure times categorized in 90‐day increments.
| Guideline‐Defined Model of MRSA HCAP | AIC 316.3 | Cohort‐Developed Model of MRSA HCAP | AIC 279.2 | ||||
|---|---|---|---|---|---|---|---|
| Variable | OR | 95% CI | P Value | Variable | OR | 95% CI | P Value |
| |||||||
| (Intercept) | NA | NA | NA | (Intercept) | NA | NA | NA |
| Nursing home residence at time of admission | 2.6 | 1.44.8 | 0.003 | Nursing home residence or discharge 180 days prior to admission | 2.8 | 1.55.3 | 0.002 |
| Hospitalization 2 days, 90 days prior to admission | 1.8 | 1.03.5 | 0.075 | Positive MRSA status: 90 days prior to admission | 7.7 | 3.119.6 | <0.001 |
| Antibiotic exposure 90 days prior to admission | 1.6 | 0.93.3 | 0.143 | >90 days but 365 days prior to admission | 1.4 | 0.54.1 | 0.507 |
| Recent immunosuppression | 0.6 | 0.31.3 | 0.244 | Anti‐pseudomonal fluoroquinolone exposure 365 days prior to admission | 2.4 | 1.24.6 | 0.009 |
| Wound care therapy 30 days prior to admission | 0.5 | 0.03.3 | 0.582 | Diabetes | 2.2 | 1.24.3 | 0.012 |
| Infusion therapy 30 days prior to admission | 0.9 | 0.42.0 | 0.793 | Chronic inhaled corticosteroids | 2.8 | 1.17.1 | 0.031 |
| Chronic hemodialysis 30 days prior to admission* | Third generation cephalosporin exposure 365 days prior to admission | 2.1 | 1.04.1 | 0.040 | |||
Of the guideline‐defined criteria, only prior hospitalization within 90 days and admission from a nursing home were predictive of Pseudomonas aeruginosa HCAP (n = 36) (Table 4). In the cohort‐developed model of Pseudomonas aeruginosa HCAP, Pseudomonas aeruginosa was predicted by prior cephalosporin exposure within the preceding year, prior culture of Pseudomonas aeruginosa from any anatomical source within the preceding year, and chronic steroid use of 10 mg/day prednisone equivalents. Again, the model was not improved by subcategorizing cephalosporin by class or by most recent exposure time. Finally, a negative annual trend in Pseudomonas aeruginosa HCAP was evident.
| Guideline‐defined model of Pseudomonas aeruginosa HCAP | AIC 234.8 | Cohort‐developed model of Pseudomonas aeruginosa HCAP | AIC 211.1 | ||||
|---|---|---|---|---|---|---|---|
| Variable | OR | 95% CI | P Value | Variable | OR | 95% CI | P value |
| |||||||
| (Intercept) | NA | NA | NA | (Intercept) | NA | NA | NA |
| Hospitalization 2 days, 90 days prior to admission | 2.5 | 1.16.0 | 0.034 | Cephalosporin exposure 365 days prior to admission | 3.8 | 1.88.8 | <0.001 |
| Nursing home residence at time of admission | 2.1 | 1.04.6 | 0.059 | Positive Pseudomonas aeruginosa culture 365 days prior to admission | 3.3 | 1.47.8 | 0.006 |
| Chronic hemodialysis 30 days prior to admission | 5.0 | 0.631.2 | 0.093 | Chronic steroid dose of 10 mg/day prednisone equivalents prior to admission | 3.0 | 1.36.9 | 0.010 |
| Antibiotic exposure 90 days prior to admission | 1.9 | 0.84.7 | 0.150 | Year of study | 0.8 | 0.71.0 | 0.069 |
| Infusion therapy 30 days prior to admission | 1.8 | 0.74.2 | 0.172 | ||||
| Recent immunosuppression | 1.1 | 0.52.5 | 0.764 | ||||
| Wound care therapy 30 days prior to admission* | |||||||
The cohort‐developed model of CAP‐resistance was re‐estimated for MRSA and Pseudomonas aeruginosa endpoints. Only positive MRSA status within 90 days preceding admission was associated with both endpoints (OR = 8.7 [3.5‐22.1] for MRSA; OR = 4.3 [1.4‐12.2] for Pseudomonas aeruginosa). Direct or recent nursing home residence (OR = 2.4 [1.3‐4.6]) and diabetes (OR = 2.4 [1.3‐4.5]) were highly predictive of MRSA, but not Pseudomonas aeruginosa (OR = 1.8 [0.8‐3.9] for nursing home residence; OR = 1.3 [0.6‐2.7] for diabetes), respectively. Cephalosporin exposure preceding admission was highly predictive of Pseudomonas aeruginosa (OR = 4.0 [1.9‐9.3]), but not with MRSA (OR = 1.1 [0.6‐2.1]). In these models, all estimated odds ratios were >1.0, consistent with the cohort‐developed model of CAP‐resistance.
For each endpoint, the cohort‐developed model was more predictive than the guideline‐defined model (Table 5) (to view ROC curves see Supporting Figures 1 to 3 in the online version of the article.). The cohort‐developed model of CAP‐resistance re‐estimated for pathogen‐specific endpoints resulted in similar predictive performance. To assess performance of the cohort developed models by facility, aROC was calculated for each of the 3 larger sites separately and for the 3 smaller facilities combined due to limited counts. Site specific aROC ranged from 0.652 to 0.762 for CAP‐resistance, 0.725 to 0.815 for MRSA, and 0.719 to 0.801 for Pseudomonas aeruginosa. The cohort‐developed model of CAP‐resistance re‐estimated for pathogen‐specific endpoints resulted in similar predictive performance.
| Model | Outcome Variable | Predictive Variables | aROC | (95% CI) | Model Comparison | aROC Difference | (95% CI) | P Value |
|---|---|---|---|---|---|---|---|---|
| ||||||||
| 1 | CAP‐resistance | Guideline‐defined | 0.630 | (0.570, 0.691) | 2‐1 | 0.079 | (0.018, 0.139) | 0.011 |
| 2 | CAP‐resistance | Cohort‐developed | 0.709 | (0.650, 0.768) | ||||
| 3 | MRSA | Guideline‐defined | 0.638 | (0.560, 0.712) | 4‐3 | 0.135 | (0.057, 0.213) | <0.001 |
| 4 | MRSA | Cohort‐developed | 0.773 | (0.703, 0.844) | ||||
| 5 | Pseudomonas aeruginosa | Guideline‐defined | 0.680 | (0.593, 0.768) | 6‐5 | 0.090 | (0.193, 0.193) | 0.090 |
| 6 | Pseudomonas aeruginosa | Cohort‐developed | 0.770 | (0.683, 0.857) | ||||
| 7 | MRSA | Cohort‐developed from CAP‐resistance model | 0.755 | (0.682, 0.828) | 7‐4 | 0.018 | (0.067, 0.031) | 0.467 |
| 8 | Pseudomonas aeruginosa | Cohort‐developed from CAP‐resistance model | 0.755 | (0.665, 0.845) | 8‐6 | 0.015 | (0.079, 0.049) | 0.650 |
A nomogram for the cohort‐developed model of CAP‐resistance can provide the predicted probability of culturing a CAP‐resistant organism for an individual patient (Table 6). Point scores assigned to levels of variables, are summed to obtain a total score, and the total score corresponds to a predicted probability of CAP‐resistance. The prevalence of CAP‐resistance (%) from highest to lowest quartile of predicted probability was 92.9, 58.8, 32.9, and 18.5, respectively.
| A. Scoring | |
|---|---|
| Variable | Score |
| B. Predicted Probability of CAP‐Resistance* | |
| Total Score | % Chance of CAP‐Resistance |
| |
| Positive MRSA status prior to admission | |
| 90 days | +100 |
| >90 days but 365 days | +45 |
| Nursing home residence or discharge 180 days prior to admission | +45 |
| Infusion therapy 30 days prior to admission | +35 |
| Cephalosporin exposure 365 days prior to admission | +30 |
| Diabetes | +30 |
| Direct ICU admission upon hospitalization | +25 |
| <35 | <20 |
| 3565 | 2030 |
| 6590 | 3040 |
| 90110 | 4050 |
| 110130 | 5060 |
| 130155 | 6070 |
| 155185 | 7080 |
| 185230 | 8090 |
| >230 | >90 |
DISCUSSION
In this study, select ATS/IDSA guideline‐defined criteria predicted identification of CAP‐resistant organisms in patients with HCAP. Admission from a nursing home was most predictive of CAP‐resistant organisms, whereas recent hospitalization and antibiotic exposure were predictive to a lesser extent. There was weak evidence of associations between recent infusion and chronic hemodialysis criteria with MDR endpoints. Recent wound care and a composite definition of immunosuppression were not predictive of these endpoints.
The cohort‐developed model resulted in improved prediction of CAP‐resistance endpoints. Culture history, particularly history of MRSA within 90 days preceding admission, was a strong predictor of MDR endpoints. The MRSA history variable definition included cultures from all anatomical sources and nares polymerase chain reaction surveillance results, the latter increasing in 2007‐2008 due to the implementation of the VA MRSA initiative.18 This finding suggests that prior culture results should be considered when selecting empirical antimicrobial therapy, and the rapid proliferation of electronic medical records increases potential to utilize this information routinely. While the guideline‐defined nursing home admission criterion was a strong predictor of CAP‐resistance, admission from the community after recent discharge from a nursing home, in addition to direct admission from a nursing home, was also important.
Similarities in variables included in the pathogen‐specific and CAP‐resistance models reflect the importance of MRSA in defining the CAP‐resistance endpoint. Both CAP‐resistance and MRSA models included prior MRSA status, diabetes, and ICU admission, whereas cephalosporin exposure was common to the Pseudomonas aeruginosa and CAP‐resistance models. Annual trends in CAP‐resistance and MRSA recovery were not identified. The negative annual trend in Pseudomonas aeruginosa HCAP is unexplained and beyond the scope of this study. The percentage of culture‐positive admissions with Pseudomonas aeruginosa HCAP averaged 12% in 2003‐2006, but dropped to <5% in 2007‐2008. A potential explanation is that identification and isolation of patients with MRSA, as a result of the VA‐wide MRSA initiative, may have impacted Pseudomonas aeruginosa colonization by isolating patients co‐colonized with these pathogens during prior healthcare exposures. This is consistent with the observation that when the cohort‐derived CAP‐resistance model was refit with the Pseudomonas aeruginosa endpoint, recent MRSA colonization was strongly predictive of Pseudomonas aeruginosa. Despite differences between variables in pathogen‐specific and CAP‐resistant models, the CAP‐resistance model provided a similar degree of MRSA and Pseudomonas aeruginosa prediction. Finally, as a study purpose included developing best predictive models for each endpoint, and not merely identifying associations, there were other plausible models not reported.
Study strengths included use of the VISN20 Data Warehouse, which provided an integrated outpatient and inpatient medical record. This facilitated analysis of prior healthcare exposures and inpatient study endpoints. In addition, poor blood and sputum specimens and unlikely pneumonia pathogens were not included in establishing MDR endpoints. The variable set explored in regression modeling was extensive and detailed, and analysis included time and intensity‐based components of the variables. Importantly, a standardized approach to regression modeling was specified in advance, which included identification of variables with high potential for association with MDR endpoints, model selection by AIC, re‐evaluation of guideline‐defined criteria and variables of lower interest, and bootstrapped internal model validation.19
Study limitations included the use of ICD‐9 codes to establish a pneumonia diagnosis, which may lack sensitivity and specificity. However, an enhanced ICD‐9based algorithm superior to other claims‐based definitions of pneumonia was utilized.4, 20 Veterans may have received care at non‐VA facilities impacting identification of all healthcare system exposures preceding admission. Data for microbial endpoints were obtained from sterile and non‐sterile site cultures, and it was not possible to determine if the cultured organisms were truly pathogenic. While pathogen‐specific endpoints were not affected, the use of expert rules in select cases to establish CAP‐resistance may have impacted precision for this endpoint. It is also possible that refitting the cohort‐developed CAP‐resistance model for pathogen‐specific endpoints resulted in optimistic aROC due to model over‐fitting. Finally, the cohort was comprised of elderly males, and caution is warranted in extrapolating the results to other populations.
The predictive ability of the guideline‐defined criteria to identify patients with MDR pathogens has been studied. A prospective observational cohort study of 625 consecutive ICU admissions determined that the guideline‐defined criteriaprior antimicrobial treatment, nursing home residence, and prior hospitalizationwere associated with recovery of MDR colonization.21 Shorr et al., investigating a retrospective cohort of 619 patients with HCAP, reported that recent hospitalization, nursing home residence, hemodialysis, and ICU admission were associated with infections caused by CAP‐resistant organisms.22 This study did not report antimicrobial exposures. Our study complements these studies by evaluating existing HCAP guideline criteria, and identifying specific antibiotic exposure, prior culture data, comorbid illness, and immunosuppressive medications that are predictive of MDR infection.
Studies comparing the bacterial etiology of patients with pneumonia in nursing homes relative to CAP, have demonstrated mixed results in recovery of Gram‐negative MDR pathogens, but generally increased MRSA pneumonia.3 Our study suggests that a nursing home stay in the last 6 months is associated with an increased risk for MRSA, but not Pseudomonas aeruginosa, although this was limited by small sample size. Recent infusion therapy has not been previously reported to be associated with MDR pathogens in an HCAP population. In our study, this criterion was predictive of CAP‐resistance in the cohort‐developed model, but not in conjunction with other variables in the guideline‐defined model. Predictors of pathogen‐specific HCAP are limited to an aforementioned single prior study, which identified recent hospitalization, nursing home residence, and ICU admission as risk factors for MRSA HCAP.22
Many studies have investigated risks for infection with MRSA and Pseudomonas aeruginosa outside of the context of HCAP. Predictor variables in cohort‐developed pathogen‐specific models in our study are known risk factors for colonization or infection with these pathogens. For example, antecedent MRSA colonization has been noted as a strong risk factor for MRSA infection, particularly pneumonia.23, 24 Further, patients with diabetes and inhaled corticosteroid exposure are immunosuppressed and at increased risk for colonization with MRSA.25, 26 Likewise, bronchiolar colonization and corticosteroid exposures are known risk factors for pneumonia due to Pseudomonas aeruginosa.27
Many studies have identified prior antibiotic use as a risk factor for infections caused by MRSA and Pseudomonas aeruginosa. However, this criterion is excessively broad and specific antimicrobial exposures carry different magnitudes of risk. Third generation cephalosporins and anti‐pseudomonal fluoroquinolones are commonly reported antibiotics associated with risk for MRSA infection, whereas 8‐methoxy fluoroquinolones appear not to possess the same effect.2831 Likewise, cephalosporins have been reported as risk factors for MDR Pseudomonas aeruginosa infections.32
Several areas of research involving HCAP MDR risk should be investigated. First, the predictive models developed in our and other studies should be evaluated in larger, more diverse populations to establish generalizability. Second, empirical broad‐spectrum antibiotic therapy in all patients with HCAP results in overtreatment of many patients. To date, no reported models provided optimal performance for selecting empirical therapy for unstable ICU patients with HCAP, and many patients do not receive de‐escalation therapy. Thus, models to identify patients with low probability of MDR pathogens upon admission and to aid in de‐escalation are warranted. Finally, the negative trend in Pseudomonas aeruginosa HCAP requires confirmation and further study.
In conclusion, of the ATS/IDSA guideline‐defined criteria for MDR, nursing home admission, recent hospitalization, and antibiotic exposure were predictive of the recovery of CAP‐resistant organisms. Alternative models primarily based on prior culture data, specific antibiotic exposures, and immunosuppression‐related variables improved predictive performance of HCAP associated with MDR.
- American Thoracic Society; Infectious Diseases Society of America.Guidelines for the management of adults with hospital‐acquired, ventilator‐associated, and healthcare‐associated pneumonia.Am J Respir Crit Care Med.2005;171(4):388–416.
- ,,,.The etiology of health care associated pneumonia (HCAP) [abstract K‐282]. Presented at the 49th Interscience Conference on Antimicrobial Agents and Chemotherapy; September2009; San Francisco, CA.
- ,.What are the important risk factors for healthcare‐associated pneumonia?Semin Respir Crit Care Med.2009;30(1):26–35.
- ,,,.Accuracy of administrative data for identifying patients with pneumonia.Am J Med Qual.2005;20(6):319–328.
- ,,.Adapting a clinical comorbidity index for use with ICD‐9‐CM administrative databases.J Clin Epidemiol.1992;45:613–619.
- ,,,.How often is a microbial etiology identified in health care associated pneumonia (HCAP)? [abstract K‐289]. Presented at the 49th Interscience Conference on Antimicrobial Agents and Chemotherapy; September2009; San Francisco, CA.
- Fluoroquinolone use criteria. Washington D.C. Guidelines Developed by the Pharmacy Benefits Management Strategic Health Care Group and Medical Advisory Panel, Veterans Health Administration, Department of Veterans Affairs. Last update, November2006. http://www.pbm.va.gov/Clinical%20Guidance/Criteria%20For%20Use/Fluoroquinolone,%20Criteria%20for%20Use.pdf. Last accessed August 20th, 2011.
- Performance Standards for Antimicrobial Susceptibility Testing; 18th Informational Supplement. M100‐S18.Wayne, PA:Clinical Laboratory Standards Institute;2009.
- ,,.Antimicrobial activity of DC‐159a, a new fluoroquinolone, against 1,149 recently collected clinical isolates.Antimicrob Agents Chemother.2008;52(10):3763–3775.
- ,,, et al.Mortality from invasive pneumococcal pneumonia in the era of antibiotic resistance, 1995–1997.Am J Public Health.2000;90(2):223–229.
- ,.Comparative activity of moxifloxacin against Gram‐positive clinical isolates.J Antimicrob Chemother.2000;45(1):31–39.
- ,,.Antimicrobial susceptibility of extended‐spectrum‐beta‐lactamase producers and multi‐drug resistant Acinetobacter baumannii throughout the United States and comparative in vitro activity of tigecycline, a new glycylcycline antimicrobial.Diagn Microbiol Infect Dis.2007;57(4):423–428.
- ,,.Antimicrobial susceptibility profile of contemporary clinical strains of Stenotropomonas maltophila isolates: can moxifloxacin activity be predicted by levofloxacin MIC results?J Chemother.2008;20(1):38–42.
- ,,, et al.Infectious Diseases Society of America/American Thoracic Society consensus guidelines on the management of community‐acquired pneumonia in adults.Clin Infect Dis.2007;44(suppl 2):S27–S72.
- Gilbert DN, Moellering RC, Eliopoulos GM, Sande, MA, eds.The Sanford Guide to Antimicrobial Therapy.38th ed.Speryville, VA:Antimicrobial Therapy;2008.
- .A new look at the statistical model identification.IEEE Trans Automat Contr.1974;19(6):716–723.
- .Estimating the error rate of a prediction rule: improvement on cross‐validation.J Am Stat Assoc.1987;78:316–331.
- ,,, et. Al.Beyond beta: lessons learned from implementation of the Department of Veterans Affairs Methicillin‐Resistant Staphylococcus aureus Prevention Initiative.Infect Control Hosp Epidemiol.2010;31(7):763–765.
- ,,.An appraisal of multivariable logistic models in the pulmonary and critical care literature.Chest.2003;123(3):923–928.
- ,,,,,.Improved clinical outcomes with utilization of a community‐acquired pneumonia guideline.Chest.2006;130(3):794–799.
- ,,,,,.Accuracy of American Thoracic Society/Infectious Diseases Society of America criteria in predicting infection or colonization with multidrug‐resistant bacteria at intensive‐care unit admission.Clin Microbiol Infect.2009;16(7):902–908.
- ,,,.Prediction of infections due to antibiotic resistant bacteria by select risk factors for healthcare associated pneumonia.Arch Intern Med.2008;168(20):2205–2210.
- ,,,,.Methicillin‐resistant Staphylococcus aureus (MRSA) nares colonization at hospital admission and its effect on subsequent MRSA infection.Clin Infect Dis.2004;39(6):776–782.
- ,.Risk of infection and death due to methicillin‐resistant Staphylococcus aureus in long‐term carriers.Clin Infect Dis.2008;47(2):176–181.
- ,,,.Epidemiology of methicillin‐resistant Staphylococcus aureus in a university medical center day care facility.Infect Control Hosp Epidemiol.2009;30(10):985–992.
- ,,,,,.Colonization and infection with antibiotic‐resistant bacteria in a long‐term care facility.J Am Geriatr Soc.1994;42(10):1062–1069.
- ,,, et al.American Thoracic Society. Guidelines for the management of adults with community‐acquired pneumonia. Diagnosis, assessment of severity, antimicrobial therapy, and prevention.Am J Respir Crit Care Med.2001;163(7):1730–1754.
- ,.Modification in prescribing practices for third‐generation cephalosporins and ciprofloxacin is associated with a reduction in methicillin‐resistant Staphylococcus aureus bacteraemia rate.J Hosp Infect.2008;69(4):328–336.
- ,,,.Evaluation of an intervention designed to decrease the rate of nosocomial methicillin‐resistant Staphylococcus aureus infection by encouraging decreased fluoroquinolone use.Infect Control Hosp Epidemiol.2006;27(2):155–169.
- ,.Using interrupted time series analysis to assess associations of fluoroquinolone formulary changes with susceptibility of gram‐negative pathogens and isolation rates of methicillin‐resistant Staphylococcus aureus.Antimicrob Agents Chemother.2006;50(6):2106–2112.
- ,.Dichotomous selection of high‐level oxacillin resistance in Staphylococcus aureus by fluoroquinolones.Int J Antimicrob Agents.2010;36(3):216–221.
- ,,,,.Multidrug‐resistant Pseudomonas aeruginosa: risk factors and clinical impact.Antimicrob Agents Chemother.2006;50(1):43–48.
Healthcare associated pneumonia (HCAP) is defined as pneumonia that is present upon admission, and occurs in patients that have recently been hospitalized, reside in a nursing home, or have had other recent healthcare exposures. Practice guidelines developed by the American Thoracic Society (ATS) and the Infectious Diseases Society of America (IDSA), recommend strategies for the diagnosis and treatment of patients with HCAP.1 A premise of the guidelines is that recent healthcare exposure places patients at risk for infection due to multi‐drug resistant (MDR) pathogens such as methicillin‐resistant Staphylococcus aureus (MRSA) or Pseudomonas aeruginosa. In addition to criteria utilized to define HCAP, the guidelines state that recent immunosuppression and antibiotic exposure are risk factors for pneumonia due to MDR pathogens. In contrast to the treatment of community‐acquired pneumonia (CAP), the guidelines recommend empirical administration of antibiotics with activity against MRSA and Pseudomonas aeruginosa for all patients with HCAP.
We recently reported that antimicrobial resistance to CAP antibiotics (CAP‐resistance) was identified in one‐third of culture‐positive patients with HCAP.2 Data regarding the predictive ability of the guideline‐defined criteria specific to HCAP are limited.3 Evaluation and potential refinement of the criteria to identify patients at risk for MDR pathogens can aid in making antibiotic‐related treatment decisions.
The purposes of this study are to: 1) develop and validate a model to predict CAP‐resistance among patients with HCAP, and to compare the model's predictive performance to a model that includes traditional guideline‐defined risk factors; and 2) develop models to predict recovery of pathogen‐specific etiology (MRSA and Pseudomonas aeruginosa), and to compare the predictive performance of the pathogen‐specific and CAP‐resistance models.
METHODS
Patients with HCAP who were admitted to 6 Veterans Affairs Medical Centers (VAMC) in the northwestern United States between January 1, 2003 and December 31, 2008 were included in the retrospective cohort study. The cohort was identified utilizing medical records data extracted from the Veterans Integrated Service Network (VISN20) Data Warehouse. The Data Warehouse is a centralized open architecture relational database that houses medical and administrative records data for VISN20 patients. This research complies with all federal guidelines and VAMC policies relative to human subjects and clinical research.
Subjects were identified by the following pneumonia‐related discharge International Classification of Diseases (ICD‐9 CM) codes: 1) a primary diagnosis of 480‐483; 485‐487.0 (pneumonia); or 2) a primary diagnosis of 507.0 (pneumonitis), 518.8 (respiratory failure), or 0.38 (septicemia), and a secondary diagnosis of 480‐483; 485‐487.0.4 Eligibility required that patients received antibiotic therapy for pneumonia within 24 hours of admission, continue inpatient treatment for >24 hours, and meet any of the following guideline‐defined criteria: 1) hospitalization during the preceding 90 days; 2) admission from a nursing home; 3) outpatient or home wound care, outpatient or home infusion therapy, or chronic hemodialysis.1 In addition, patients not meeting guideline‐defined criteria, who had frequent healthcare system exposure, defined as 12 Emergency Department, Medicine, or Surgery clinic visits within 90 days of admission, were also included. Patients were excluded if they were directly transferred from another hospital, or had pneumonia‐related ICD‐9 codes but received inpatient care for pneumonia in a non‐VA hospital.
Study data included medical records for the year prior to admission for HCAP through 30 days afterwards. Data included: demographics; domicile preceding admission; healthcare utilization including diagnosis and procedure codes; inpatient medications administered, and outpatient prescription fills; vital signs; and laboratory test results, including cultures and susceptibilities.
Guideline‐defined criteria for predicting CAP‐resistance were similar to those used to identify the study cohort. Nursing home admission included patients who were directly admitted from a nursing home, skilled nursing facility, or domiciliary. Prior hospitalization 2 days within 90 days was calculated by summing the length of stay for all admissions during the preceding 90 days. Outpatient intravenous therapy, chronic hemodialysis, and wound care therapy was determined from medication administration records and relevant Current Procedural Terminology (CPT) or ICD‐9 procedure codes for care administered within 30 days. Antibiotic exposure was defined as administration of 1 dose of antibiotic during inpatient care, or fill of an outpatient prescription for 1 antibiotic dose within 90 days preceding admission. Immunosuppression was defined as: human immunodeficiency virus (HIV) diagnosis; white blood cell (WBC) count of 2500 cells/mm3 within 30 days of admission; corticosteroid ingestion during prior admission, or outpatient prescription fills for a corticosteroid with quantity sufficient to last 14 days preceding admission; or inpatient ingestion of, or outpatient prescription fills for, transplant or rheumatologic‐related immunosuppressants within 90 days preceding admission.
Additional variables assessed to predict CAP‐resistance were obtained as follows. First, modifications of guideline‐defined criteria were constructed. These included: direct nursing home admission, or recent nursing home stay preceding admission; total days of hospitalization within 90 days preceding admission; specific antibiotic exposures, including dates since last exposure preceding admission; and individual components of the immunosuppression criterion. Other cohort‐developed variables included: demographics; substance use history; chronic comorbidity determined by individual and composite measures of Charlson score; pulmonary disease history (eg, bronchiectasis); type and frequency of outpatient visits; consecutive (2) prescription fills for chronic medications of interest; clinical and surveillance culture results preceding admission; admitting ward; vital signs; and relevant hematology and chemistry labs.5
Sputum, blood, and bronchoscopy‐collected cultures obtained within 48 hours after admission were assessed to determine specimen acceptability. Poor sputum specimens were defined by Gram stain quantitative results indicating >10 epithelial cells (EPI) per low power field (LPF), or in the absence of quantitative results, semi‐quantitative results indicating 2‐4+EPI. Single positive blood cultures with results indicating likely contaminants were considered poor specimens. All bronchoscopy‐obtained specimens were considered acceptable. All cultures classified as poor specimens were excluded, and microbiology results were evaluated for the remaining specimens.2, 6 Organisms thought to represent colonization or contamination were excluded: coagulase‐negative (CN) Staphylococcus, Enterococcus sp, Bacillus sp, Proprionibacterium sp, and Candida sp. Recovery of a potential pneumonia pathogen from 1 acceptable culture constituted a culture‐positive admission.
CAP‐resistance was determined for each isolate. CAP‐resistance was defined as non‐susceptibility to non‐pseudomonal third generation cephalosporins (ceftriaxone or cefotaxime) or non‐pseudomonal 8‐methoxy fluoroquinolones (moxifloxacin, gatifloxacin), the VA preferred agents for treatment of CAP.7 There were differences between facilities in susceptibility reporting criteria; therefore, the following approach was used to determine CAP‐resistance. First, MRSA and Pseudomonas aeruginosa isolates were classified as CAP‐resistant. Second, susceptibility results were directly utilized to determine CAP‐resistance if both antibiotic results were available. Third, if only a surrogate antibiotic from a class was reported, a representative antibiotic consistent with Clinical Laboratory Standards Institute reporting criteria was utilized.8 Finally, expert rules determined CAP‐resistance for select potential pneumonia pathogens (eg, Haemophilus sp) if antibiotic susceptibility results for both cephalosporin and fluoroquinolone classes were not reported.815 Presence of 1 CAP‐resistant isolate resulted in a CAP‐resistant classification for an admission. MRSA and Pseudomonas aeruginosa endpoints were defined in a similar manner. Only the first admission for each patient was utilized in the analysis.
The probability of CAP‐resistance was predicted from guideline‐defined criteria (guideline‐defined model) with logistic regression. Next, non‐guideline variables were classified as high, medium, or low interest for association with CAP‐resistance. Variables were assessed for collinearity. A model of CAP‐resistance was developed from variables of high interest. Guideline‐defined criteria were omitted to allow consideration of more specific measures (eg, specific antibiotic exposures as opposed to receipt of antibiotics within the preceding 90 days) during this stage. Next, guideline‐defined criteria, and subsequently variables of lesser interest, were added in an attempt to improve the model. Annual trends and plausible interactions were considered. Model selection was by Akaike's Information Criterion (AIC).16 To promote model reliability, the final model was required to lack evidence of over‐fitting in bootstrapped internal validation.17 The guideline‐defined and cohort‐developed models were compared by difference in area under receiver operating characteristic (aROC) curves. The model development process was repeated for MRSA and Pseudomonas aeruginosa endpoints. Finally, to determine if the CAP‐resistance model sufficiently predicted pathogen‐specific MDR, the CAP‐resistance model was re‐estimated for MRSA and Pseudomonas aeruginosa endpoints. Statistical analysis was performed with R version 2.10.0 (The R Foundation for Statistical Computing, Vienna, Austria).
RESULTS
The cohort was comprised of 1300 patients with HCAP. Of these, 375 (28.8% [26.4‐31.4]) met culture‐positive criteria for potential pneumonia pathogens. CAP‐resistant organisms were identified in 118 (31.5% [26.8‐36.4]) patients within 48 hours of admission. CAP‐resistant organisms included: MRSA (49.2% [40.4‐58.1]), Pseudomonas aeruginosa (29.5% [21.9‐38.1]), Enterobacteriaceae (11.4% [6.5‐18.0]), Gram‐negative non‐enterics (8.3% [4.2‐14.4]), Streptococcus pneumoniae (1.5% [0.2‐5.4]), and opportunistic organisms (eg, Mycobacterium spp) (8.3% [4.2‐14.4]). Differences in select characteristics and exposures between culture‐positive and culture‐negative admissions, as well as CAP‐resistant and CAP‐sensitive admissions, were evident (Table 1).
| Characteristic | Culture‐Negative Admissions (n = 925) | Culture‐Positive Admissions (n = 375) | P Value | CAP‐Sensitive Admissions (n = 257) | CAP‐Resistant Admissions (n = 118) | P Value |
|---|---|---|---|---|---|---|
| ||||||
| Demographics | ||||||
| Age (mean/SD) | 71.9 (12.1) | 71.4 (12.4) | 0.44 | 70.4 (12.4) | 72.9 (12.3) | 0.07 |
| Gender (% male) | 97.1 | 98.8 | 0.07 | 98.4 | 99.2 | 1.00 |
| Primary inclusion diagnosis (%) | ||||||
| Pneumonia | 93.1 | 85.9 | <0.01 | 87.2 | 83.1 | 0.87 |
| Aspiration pneumonitis with pneumonia pneumonia witpneumonia | 1.5 | 4.3 | 0.02 | 4.6 | 3.3 | 0.48 |
| Septicemia with pneumonia | 2.6 | 6.2 | <0.01 | 5.1 | 8.5 | 0.25 |
| Respiratory failure with pneumonia | 2.8 | 3.5 | 0.50 | 3.1 | 5.1 | 0.38 |
| HCAP inclusion criteria (%) | ||||||
| Nursing home residence | 31.2 | 35.9 | 0.08 | 30.4 | 46.6 | <0.01 |
| Hospitalization of >2 days in last 90 days | 58.7 | 57.6 | 0.73 | 52.1 | 62.7 | 0.06 |
| Intravenous therapy in last 30 days | 19.5 | 20.7 | 0.61 | 19.5 | 21.2 | 0.68 |
| Outpatient wound care in last 30 days | 2.7 | 2.7 | 1.00 | 3.1 | 1.7 | 0.73 |
| Chronic dialysis in last 30 days | 2.5 | 1.7 | 0.45 | 1.2 | 2.5 | 0.38 |
| Hospitalization duration 0‐2 days in last 90 days | 10.2 | 11.2 | 0.57 | 12.5 | 5.9 | 0.22 |
| >12 ED or clinic visits in last 90 days | 44.1 | 44.6 | 0.86 | 44.0 | 41.5 | 0.74 |
| Other guideline‐defined MDR criteria (%) | ||||||
| Antibiotics in last 90 days | 63.8 | 61.6 | 0.47 | 57.2 | 66.1 | 0.11 |
| Recent immunosuppression | 19.3 | 23.9 | 0.53 | 24.1 | 22.0 | 0.70 |
| Severity of illness (%) | ||||||
| Admitted to the ICU | 21.8 | 41.6 | <0.01 | 26.3 | 38.6* | <0.01 |
| Mechanical ventilation | 5.6 | 12.7 | <0.01 | 12.1 | 12.7 | 0.87 |
| Comorbidity (%) | ||||||
| Charlson comorbidity score (mean/SD) | 4.3 (3.0) | 4.3 (3.0) | 0.85 | 4.1 (3.1) | 4.5 (2.8) | 0.20 |
| Diabetes | 33.8 | 29.2 | 0.10 | 27.2 | 39.0 | 0.07 |
| Prior antibiotic use (%) | ||||||
| Any cephalosporin | 42.0 | 39.9 | 0.48 | 32.3 | 51.7 | <0.01 |
| Third generation cephalosporin | 24.5 | 23.7 | 0.78 | 18.3 | 30.5 | 0.01 |
| Anti‐pseudomonal fluoroquinolone | 28.5 | 28.4 | 1.0 | 23.3 | 37.3 | 0.02 |
| 8‐Methoxy fluoroquinolone | 20.1 | 23.9 | 0.10 | 24.1 | 24.5 | 1.00 |
| Prior corticosteroid use (%) | ||||||
| Systemic steroids (>10 mg/day prednisone) | 11.1 | 13.2 | 0.28 | 11.3 | 16.1 | 0.24 |
| Inhaled steroids | 7.5 | 10.0 | 0.11 | 8.9 | 10.2 | 0.71 |
| Prior MDR cultured (%) | ||||||
| MRSA within <90 days | 4.2 | 7.7 | <0.01 | 2.7 | 15.3 | <0.01 |
| MRSA >90 days but <365 days | 5.6 | 6.5 | 0.54 | 3.9 | 10.2 | 0.03 |
| P. aeruginosa within 365 days | 5.7 | 11.5 | <0.01 | 5.8 | 19.5 | <0.01 |
Of the guideline‐defined criteria, direct admission from a nursing home, prior hospitalization, and recent antibiotic exposure were associated with CAP‐resistance (Table 2). The cohort‐derived CAP‐resistance model included 6 variables. Prior MRSA colonization or infection within 90 days preceding admission was strongly predictive of CAP‐resistance. A composite variable consisting of direct admission from a nursing home or admission from the community after recent discharge from a nursing home was more predictive than direct admission from a nursing home alone. Exposure to cephalosporin antibiotics within the prior year was also predictive of CAP‐resistance. Subcategorizing cephalosporins by class or by most recent exposure in 90‐day increments did not improve the model. The remaining predictors in the model were guideline‐defined infusion therapy criterion, diabetes, and intensive care unit (ICU) admission.
| Guidelinedefined model of CAPResistant HCAP | AIC 461.1 | CohortDeveloped Model of CAPresistant HCAP | AIC 431.1 | ||||
|---|---|---|---|---|---|---|---|
| Variable | OR | 95% CI | P Value | Variable | OR | 95% CI | P Value |
| |||||||
| (Intercept) | NA | NA | NA | (Intercept) | NA | NA | NA |
| Nursing home residence at time of admission | 2.6 | 1.64.4 | <0.001 | Nursing home residence or discharge 180 days prior to admission | 2.3 | 1.43.8 | 0.002 |
| Antibiotic exposure 90 days prior to admission | 1.7 | 1.02.8 | 0.054 | Positive MRSA status: 90 days prior to admission | 6.4 | 2.617.8 | <0.001 |
| Hospitalization 2 days, 90 days prior to admission | 1.6 | 1.02.6 | 0.066 | >90 days but 365 days prior to admission | 2.3 | 0.95.9 | 0.074 |
| Infusion therapy 30 days prior to admission | 1.5 | 0.82.8 | 0.173 | Cephalosporin exposure 365 days prior to admission | 1.8 | 1.12.9 | 0.019 |
| Wound care therapy 30 days prior to admission | 0.5 | 0.12.1 | 0.370 | Infusion therapy 30 days prior to admission | 1.9 | 1.03.5 | 0.044 |
| Hemodialysis therapy 30 days prior to admission | 1.8 | 0.311.2 | 0.497 | Diabetes | 1.7 | 1.02.8 | 0.044 |
| Recent immunosuppression | 0.9 | 0.51.6 | 0.670 | Direct ICU admission upon hospitalization | 1.6 | 1.02.6 | 0.053 |
Of the guideline‐defined criteria, direct admission from a nursing home was most predictive of MRSA HCAP (n = 57), followed by prior hospitalization and recent antibiotic exposure (Table 3). The cohort‐developed model of MRSA HCAP included predictors common to the CAP‐resistance model: direct admission from a nursing home or patients who were recently discharged from a nursing home, history of prior MRSA, and diabetes. Positive MRSA status within 90 days preceding admission exhibited the strongest prediction of MRSA HCAP. Exposure to anti‐pseudomonal fluoroquinolones (ciprofloxacin and levofloxacin) within the prior year was also predictive of MRSA HCAP, however, exposure to 8‐methoxy fluoroquinolone was not (crude odds ratio (OR) = 0.7 [0.3‐1.4]; final model adjusted OR = 0.6 [0.2‐1.2]). Exposure to third generation cephalosporins within the previous year was more predictive than other cephalosporin exposures, and more predictive than exposure times categorized in 90‐day increments.
| Guideline‐Defined Model of MRSA HCAP | AIC 316.3 | Cohort‐Developed Model of MRSA HCAP | AIC 279.2 | ||||
|---|---|---|---|---|---|---|---|
| Variable | OR | 95% CI | P Value | Variable | OR | 95% CI | P Value |
| |||||||
| (Intercept) | NA | NA | NA | (Intercept) | NA | NA | NA |
| Nursing home residence at time of admission | 2.6 | 1.44.8 | 0.003 | Nursing home residence or discharge 180 days prior to admission | 2.8 | 1.55.3 | 0.002 |
| Hospitalization 2 days, 90 days prior to admission | 1.8 | 1.03.5 | 0.075 | Positive MRSA status: 90 days prior to admission | 7.7 | 3.119.6 | <0.001 |
| Antibiotic exposure 90 days prior to admission | 1.6 | 0.93.3 | 0.143 | >90 days but 365 days prior to admission | 1.4 | 0.54.1 | 0.507 |
| Recent immunosuppression | 0.6 | 0.31.3 | 0.244 | Anti‐pseudomonal fluoroquinolone exposure 365 days prior to admission | 2.4 | 1.24.6 | 0.009 |
| Wound care therapy 30 days prior to admission | 0.5 | 0.03.3 | 0.582 | Diabetes | 2.2 | 1.24.3 | 0.012 |
| Infusion therapy 30 days prior to admission | 0.9 | 0.42.0 | 0.793 | Chronic inhaled corticosteroids | 2.8 | 1.17.1 | 0.031 |
| Chronic hemodialysis 30 days prior to admission* | Third generation cephalosporin exposure 365 days prior to admission | 2.1 | 1.04.1 | 0.040 | |||
Of the guideline‐defined criteria, only prior hospitalization within 90 days and admission from a nursing home were predictive of Pseudomonas aeruginosa HCAP (n = 36) (Table 4). In the cohort‐developed model of Pseudomonas aeruginosa HCAP, Pseudomonas aeruginosa was predicted by prior cephalosporin exposure within the preceding year, prior culture of Pseudomonas aeruginosa from any anatomical source within the preceding year, and chronic steroid use of 10 mg/day prednisone equivalents. Again, the model was not improved by subcategorizing cephalosporin by class or by most recent exposure time. Finally, a negative annual trend in Pseudomonas aeruginosa HCAP was evident.
| Guideline‐defined model of Pseudomonas aeruginosa HCAP | AIC 234.8 | Cohort‐developed model of Pseudomonas aeruginosa HCAP | AIC 211.1 | ||||
|---|---|---|---|---|---|---|---|
| Variable | OR | 95% CI | P Value | Variable | OR | 95% CI | P value |
| |||||||
| (Intercept) | NA | NA | NA | (Intercept) | NA | NA | NA |
| Hospitalization 2 days, 90 days prior to admission | 2.5 | 1.16.0 | 0.034 | Cephalosporin exposure 365 days prior to admission | 3.8 | 1.88.8 | <0.001 |
| Nursing home residence at time of admission | 2.1 | 1.04.6 | 0.059 | Positive Pseudomonas aeruginosa culture 365 days prior to admission | 3.3 | 1.47.8 | 0.006 |
| Chronic hemodialysis 30 days prior to admission | 5.0 | 0.631.2 | 0.093 | Chronic steroid dose of 10 mg/day prednisone equivalents prior to admission | 3.0 | 1.36.9 | 0.010 |
| Antibiotic exposure 90 days prior to admission | 1.9 | 0.84.7 | 0.150 | Year of study | 0.8 | 0.71.0 | 0.069 |
| Infusion therapy 30 days prior to admission | 1.8 | 0.74.2 | 0.172 | ||||
| Recent immunosuppression | 1.1 | 0.52.5 | 0.764 | ||||
| Wound care therapy 30 days prior to admission* | |||||||
The cohort‐developed model of CAP‐resistance was re‐estimated for MRSA and Pseudomonas aeruginosa endpoints. Only positive MRSA status within 90 days preceding admission was associated with both endpoints (OR = 8.7 [3.5‐22.1] for MRSA; OR = 4.3 [1.4‐12.2] for Pseudomonas aeruginosa). Direct or recent nursing home residence (OR = 2.4 [1.3‐4.6]) and diabetes (OR = 2.4 [1.3‐4.5]) were highly predictive of MRSA, but not Pseudomonas aeruginosa (OR = 1.8 [0.8‐3.9] for nursing home residence; OR = 1.3 [0.6‐2.7] for diabetes), respectively. Cephalosporin exposure preceding admission was highly predictive of Pseudomonas aeruginosa (OR = 4.0 [1.9‐9.3]), but not with MRSA (OR = 1.1 [0.6‐2.1]). In these models, all estimated odds ratios were >1.0, consistent with the cohort‐developed model of CAP‐resistance.
For each endpoint, the cohort‐developed model was more predictive than the guideline‐defined model (Table 5) (to view ROC curves see Supporting Figures 1 to 3 in the online version of the article.). The cohort‐developed model of CAP‐resistance re‐estimated for pathogen‐specific endpoints resulted in similar predictive performance. To assess performance of the cohort developed models by facility, aROC was calculated for each of the 3 larger sites separately and for the 3 smaller facilities combined due to limited counts. Site specific aROC ranged from 0.652 to 0.762 for CAP‐resistance, 0.725 to 0.815 for MRSA, and 0.719 to 0.801 for Pseudomonas aeruginosa. The cohort‐developed model of CAP‐resistance re‐estimated for pathogen‐specific endpoints resulted in similar predictive performance.
| Model | Outcome Variable | Predictive Variables | aROC | (95% CI) | Model Comparison | aROC Difference | (95% CI) | P Value |
|---|---|---|---|---|---|---|---|---|
| ||||||||
| 1 | CAP‐resistance | Guideline‐defined | 0.630 | (0.570, 0.691) | 2‐1 | 0.079 | (0.018, 0.139) | 0.011 |
| 2 | CAP‐resistance | Cohort‐developed | 0.709 | (0.650, 0.768) | ||||
| 3 | MRSA | Guideline‐defined | 0.638 | (0.560, 0.712) | 4‐3 | 0.135 | (0.057, 0.213) | <0.001 |
| 4 | MRSA | Cohort‐developed | 0.773 | (0.703, 0.844) | ||||
| 5 | Pseudomonas aeruginosa | Guideline‐defined | 0.680 | (0.593, 0.768) | 6‐5 | 0.090 | (0.193, 0.193) | 0.090 |
| 6 | Pseudomonas aeruginosa | Cohort‐developed | 0.770 | (0.683, 0.857) | ||||
| 7 | MRSA | Cohort‐developed from CAP‐resistance model | 0.755 | (0.682, 0.828) | 7‐4 | 0.018 | (0.067, 0.031) | 0.467 |
| 8 | Pseudomonas aeruginosa | Cohort‐developed from CAP‐resistance model | 0.755 | (0.665, 0.845) | 8‐6 | 0.015 | (0.079, 0.049) | 0.650 |
A nomogram for the cohort‐developed model of CAP‐resistance can provide the predicted probability of culturing a CAP‐resistant organism for an individual patient (Table 6). Point scores assigned to levels of variables, are summed to obtain a total score, and the total score corresponds to a predicted probability of CAP‐resistance. The prevalence of CAP‐resistance (%) from highest to lowest quartile of predicted probability was 92.9, 58.8, 32.9, and 18.5, respectively.
| A. Scoring | |
|---|---|
| Variable | Score |
| B. Predicted Probability of CAP‐Resistance* | |
| Total Score | % Chance of CAP‐Resistance |
| |
| Positive MRSA status prior to admission | |
| 90 days | +100 |
| >90 days but 365 days | +45 |
| Nursing home residence or discharge 180 days prior to admission | +45 |
| Infusion therapy 30 days prior to admission | +35 |
| Cephalosporin exposure 365 days prior to admission | +30 |
| Diabetes | +30 |
| Direct ICU admission upon hospitalization | +25 |
| <35 | <20 |
| 3565 | 2030 |
| 6590 | 3040 |
| 90110 | 4050 |
| 110130 | 5060 |
| 130155 | 6070 |
| 155185 | 7080 |
| 185230 | 8090 |
| >230 | >90 |
DISCUSSION
In this study, select ATS/IDSA guideline‐defined criteria predicted identification of CAP‐resistant organisms in patients with HCAP. Admission from a nursing home was most predictive of CAP‐resistant organisms, whereas recent hospitalization and antibiotic exposure were predictive to a lesser extent. There was weak evidence of associations between recent infusion and chronic hemodialysis criteria with MDR endpoints. Recent wound care and a composite definition of immunosuppression were not predictive of these endpoints.
The cohort‐developed model resulted in improved prediction of CAP‐resistance endpoints. Culture history, particularly history of MRSA within 90 days preceding admission, was a strong predictor of MDR endpoints. The MRSA history variable definition included cultures from all anatomical sources and nares polymerase chain reaction surveillance results, the latter increasing in 2007‐2008 due to the implementation of the VA MRSA initiative.18 This finding suggests that prior culture results should be considered when selecting empirical antimicrobial therapy, and the rapid proliferation of electronic medical records increases potential to utilize this information routinely. While the guideline‐defined nursing home admission criterion was a strong predictor of CAP‐resistance, admission from the community after recent discharge from a nursing home, in addition to direct admission from a nursing home, was also important.
Similarities in variables included in the pathogen‐specific and CAP‐resistance models reflect the importance of MRSA in defining the CAP‐resistance endpoint. Both CAP‐resistance and MRSA models included prior MRSA status, diabetes, and ICU admission, whereas cephalosporin exposure was common to the Pseudomonas aeruginosa and CAP‐resistance models. Annual trends in CAP‐resistance and MRSA recovery were not identified. The negative annual trend in Pseudomonas aeruginosa HCAP is unexplained and beyond the scope of this study. The percentage of culture‐positive admissions with Pseudomonas aeruginosa HCAP averaged 12% in 2003‐2006, but dropped to <5% in 2007‐2008. A potential explanation is that identification and isolation of patients with MRSA, as a result of the VA‐wide MRSA initiative, may have impacted Pseudomonas aeruginosa colonization by isolating patients co‐colonized with these pathogens during prior healthcare exposures. This is consistent with the observation that when the cohort‐derived CAP‐resistance model was refit with the Pseudomonas aeruginosa endpoint, recent MRSA colonization was strongly predictive of Pseudomonas aeruginosa. Despite differences between variables in pathogen‐specific and CAP‐resistant models, the CAP‐resistance model provided a similar degree of MRSA and Pseudomonas aeruginosa prediction. Finally, as a study purpose included developing best predictive models for each endpoint, and not merely identifying associations, there were other plausible models not reported.
Study strengths included use of the VISN20 Data Warehouse, which provided an integrated outpatient and inpatient medical record. This facilitated analysis of prior healthcare exposures and inpatient study endpoints. In addition, poor blood and sputum specimens and unlikely pneumonia pathogens were not included in establishing MDR endpoints. The variable set explored in regression modeling was extensive and detailed, and analysis included time and intensity‐based components of the variables. Importantly, a standardized approach to regression modeling was specified in advance, which included identification of variables with high potential for association with MDR endpoints, model selection by AIC, re‐evaluation of guideline‐defined criteria and variables of lower interest, and bootstrapped internal model validation.19
Study limitations included the use of ICD‐9 codes to establish a pneumonia diagnosis, which may lack sensitivity and specificity. However, an enhanced ICD‐9based algorithm superior to other claims‐based definitions of pneumonia was utilized.4, 20 Veterans may have received care at non‐VA facilities impacting identification of all healthcare system exposures preceding admission. Data for microbial endpoints were obtained from sterile and non‐sterile site cultures, and it was not possible to determine if the cultured organisms were truly pathogenic. While pathogen‐specific endpoints were not affected, the use of expert rules in select cases to establish CAP‐resistance may have impacted precision for this endpoint. It is also possible that refitting the cohort‐developed CAP‐resistance model for pathogen‐specific endpoints resulted in optimistic aROC due to model over‐fitting. Finally, the cohort was comprised of elderly males, and caution is warranted in extrapolating the results to other populations.
The predictive ability of the guideline‐defined criteria to identify patients with MDR pathogens has been studied. A prospective observational cohort study of 625 consecutive ICU admissions determined that the guideline‐defined criteriaprior antimicrobial treatment, nursing home residence, and prior hospitalizationwere associated with recovery of MDR colonization.21 Shorr et al., investigating a retrospective cohort of 619 patients with HCAP, reported that recent hospitalization, nursing home residence, hemodialysis, and ICU admission were associated with infections caused by CAP‐resistant organisms.22 This study did not report antimicrobial exposures. Our study complements these studies by evaluating existing HCAP guideline criteria, and identifying specific antibiotic exposure, prior culture data, comorbid illness, and immunosuppressive medications that are predictive of MDR infection.
Studies comparing the bacterial etiology of patients with pneumonia in nursing homes relative to CAP, have demonstrated mixed results in recovery of Gram‐negative MDR pathogens, but generally increased MRSA pneumonia.3 Our study suggests that a nursing home stay in the last 6 months is associated with an increased risk for MRSA, but not Pseudomonas aeruginosa, although this was limited by small sample size. Recent infusion therapy has not been previously reported to be associated with MDR pathogens in an HCAP population. In our study, this criterion was predictive of CAP‐resistance in the cohort‐developed model, but not in conjunction with other variables in the guideline‐defined model. Predictors of pathogen‐specific HCAP are limited to an aforementioned single prior study, which identified recent hospitalization, nursing home residence, and ICU admission as risk factors for MRSA HCAP.22
Many studies have investigated risks for infection with MRSA and Pseudomonas aeruginosa outside of the context of HCAP. Predictor variables in cohort‐developed pathogen‐specific models in our study are known risk factors for colonization or infection with these pathogens. For example, antecedent MRSA colonization has been noted as a strong risk factor for MRSA infection, particularly pneumonia.23, 24 Further, patients with diabetes and inhaled corticosteroid exposure are immunosuppressed and at increased risk for colonization with MRSA.25, 26 Likewise, bronchiolar colonization and corticosteroid exposures are known risk factors for pneumonia due to Pseudomonas aeruginosa.27
Many studies have identified prior antibiotic use as a risk factor for infections caused by MRSA and Pseudomonas aeruginosa. However, this criterion is excessively broad and specific antimicrobial exposures carry different magnitudes of risk. Third generation cephalosporins and anti‐pseudomonal fluoroquinolones are commonly reported antibiotics associated with risk for MRSA infection, whereas 8‐methoxy fluoroquinolones appear not to possess the same effect.2831 Likewise, cephalosporins have been reported as risk factors for MDR Pseudomonas aeruginosa infections.32
Several areas of research involving HCAP MDR risk should be investigated. First, the predictive models developed in our and other studies should be evaluated in larger, more diverse populations to establish generalizability. Second, empirical broad‐spectrum antibiotic therapy in all patients with HCAP results in overtreatment of many patients. To date, no reported models provided optimal performance for selecting empirical therapy for unstable ICU patients with HCAP, and many patients do not receive de‐escalation therapy. Thus, models to identify patients with low probability of MDR pathogens upon admission and to aid in de‐escalation are warranted. Finally, the negative trend in Pseudomonas aeruginosa HCAP requires confirmation and further study.
In conclusion, of the ATS/IDSA guideline‐defined criteria for MDR, nursing home admission, recent hospitalization, and antibiotic exposure were predictive of the recovery of CAP‐resistant organisms. Alternative models primarily based on prior culture data, specific antibiotic exposures, and immunosuppression‐related variables improved predictive performance of HCAP associated with MDR.
- American Thoracic Society; Infectious Diseases Society of America.Guidelines for the management of adults with hospital‐acquired, ventilator‐associated, and healthcare‐associated pneumonia.Am J Respir Crit Care Med.2005;171(4):388–416.
- ,,,.The etiology of health care associated pneumonia (HCAP) [abstract K‐282]. Presented at the 49th Interscience Conference on Antimicrobial Agents and Chemotherapy; September2009; San Francisco, CA.
- ,.What are the important risk factors for healthcare‐associated pneumonia?Semin Respir Crit Care Med.2009;30(1):26–35.
- ,,,.Accuracy of administrative data for identifying patients with pneumonia.Am J Med Qual.2005;20(6):319–328.
- ,,.Adapting a clinical comorbidity index for use with ICD‐9‐CM administrative databases.J Clin Epidemiol.1992;45:613–619.
- ,,,.How often is a microbial etiology identified in health care associated pneumonia (HCAP)? [abstract K‐289]. Presented at the 49th Interscience Conference on Antimicrobial Agents and Chemotherapy; September2009; San Francisco, CA.
- Fluoroquinolone use criteria. Washington D.C. Guidelines Developed by the Pharmacy Benefits Management Strategic Health Care Group and Medical Advisory Panel, Veterans Health Administration, Department of Veterans Affairs. Last update, November2006. http://www.pbm.va.gov/Clinical%20Guidance/Criteria%20For%20Use/Fluoroquinolone,%20Criteria%20for%20Use.pdf. Last accessed August 20th, 2011.
- Performance Standards for Antimicrobial Susceptibility Testing; 18th Informational Supplement. M100‐S18.Wayne, PA:Clinical Laboratory Standards Institute;2009.
- ,,.Antimicrobial activity of DC‐159a, a new fluoroquinolone, against 1,149 recently collected clinical isolates.Antimicrob Agents Chemother.2008;52(10):3763–3775.
- ,,, et al.Mortality from invasive pneumococcal pneumonia in the era of antibiotic resistance, 1995–1997.Am J Public Health.2000;90(2):223–229.
- ,.Comparative activity of moxifloxacin against Gram‐positive clinical isolates.J Antimicrob Chemother.2000;45(1):31–39.
- ,,.Antimicrobial susceptibility of extended‐spectrum‐beta‐lactamase producers and multi‐drug resistant Acinetobacter baumannii throughout the United States and comparative in vitro activity of tigecycline, a new glycylcycline antimicrobial.Diagn Microbiol Infect Dis.2007;57(4):423–428.
- ,,.Antimicrobial susceptibility profile of contemporary clinical strains of Stenotropomonas maltophila isolates: can moxifloxacin activity be predicted by levofloxacin MIC results?J Chemother.2008;20(1):38–42.
- ,,, et al.Infectious Diseases Society of America/American Thoracic Society consensus guidelines on the management of community‐acquired pneumonia in adults.Clin Infect Dis.2007;44(suppl 2):S27–S72.
- Gilbert DN, Moellering RC, Eliopoulos GM, Sande, MA, eds.The Sanford Guide to Antimicrobial Therapy.38th ed.Speryville, VA:Antimicrobial Therapy;2008.
- .A new look at the statistical model identification.IEEE Trans Automat Contr.1974;19(6):716–723.
- .Estimating the error rate of a prediction rule: improvement on cross‐validation.J Am Stat Assoc.1987;78:316–331.
- ,,, et. Al.Beyond beta: lessons learned from implementation of the Department of Veterans Affairs Methicillin‐Resistant Staphylococcus aureus Prevention Initiative.Infect Control Hosp Epidemiol.2010;31(7):763–765.
- ,,.An appraisal of multivariable logistic models in the pulmonary and critical care literature.Chest.2003;123(3):923–928.
- ,,,,,.Improved clinical outcomes with utilization of a community‐acquired pneumonia guideline.Chest.2006;130(3):794–799.
- ,,,,,.Accuracy of American Thoracic Society/Infectious Diseases Society of America criteria in predicting infection or colonization with multidrug‐resistant bacteria at intensive‐care unit admission.Clin Microbiol Infect.2009;16(7):902–908.
- ,,,.Prediction of infections due to antibiotic resistant bacteria by select risk factors for healthcare associated pneumonia.Arch Intern Med.2008;168(20):2205–2210.
- ,,,,.Methicillin‐resistant Staphylococcus aureus (MRSA) nares colonization at hospital admission and its effect on subsequent MRSA infection.Clin Infect Dis.2004;39(6):776–782.
- ,.Risk of infection and death due to methicillin‐resistant Staphylococcus aureus in long‐term carriers.Clin Infect Dis.2008;47(2):176–181.
- ,,,.Epidemiology of methicillin‐resistant Staphylococcus aureus in a university medical center day care facility.Infect Control Hosp Epidemiol.2009;30(10):985–992.
- ,,,,,.Colonization and infection with antibiotic‐resistant bacteria in a long‐term care facility.J Am Geriatr Soc.1994;42(10):1062–1069.
- ,,, et al.American Thoracic Society. Guidelines for the management of adults with community‐acquired pneumonia. Diagnosis, assessment of severity, antimicrobial therapy, and prevention.Am J Respir Crit Care Med.2001;163(7):1730–1754.
- ,.Modification in prescribing practices for third‐generation cephalosporins and ciprofloxacin is associated with a reduction in methicillin‐resistant Staphylococcus aureus bacteraemia rate.J Hosp Infect.2008;69(4):328–336.
- ,,,.Evaluation of an intervention designed to decrease the rate of nosocomial methicillin‐resistant Staphylococcus aureus infection by encouraging decreased fluoroquinolone use.Infect Control Hosp Epidemiol.2006;27(2):155–169.
- ,.Using interrupted time series analysis to assess associations of fluoroquinolone formulary changes with susceptibility of gram‐negative pathogens and isolation rates of methicillin‐resistant Staphylococcus aureus.Antimicrob Agents Chemother.2006;50(6):2106–2112.
- ,.Dichotomous selection of high‐level oxacillin resistance in Staphylococcus aureus by fluoroquinolones.Int J Antimicrob Agents.2010;36(3):216–221.
- ,,,,.Multidrug‐resistant Pseudomonas aeruginosa: risk factors and clinical impact.Antimicrob Agents Chemother.2006;50(1):43–48.
Copyright © 2011 Society of Hospital Medicine