User login
A Time Motion Study Evaluating the Impact of Geographic Cohorting of Hospitalists
Geographic cohorting (GCh, also known as “localization” or “regionalization”) refers to the practice wherein hospitalists are assigned to a single inpatient unit. Its adoption is increasing and in 2017, 30% of surveyed United States hospital medicine group leaders reported that their clinicians rounded on 1-2 units daily.1 As a component of intervention bundles, GCh is associated with reductions in mortality, length of stay, and costs.2,3
However, details on how GCh affects the hospitalist workday are unknown. Most time-motion studies of inpatient clinicians have reported the experiences of physicians in training with few specifically evaluating the workflow of attending hospitalists.4 Three studies of the attending hospitalist’s workday that were performed a decade ago excluded teams with learners, had patient loads as low as 9.4 per day, and did not differentiate between GCh and non-GCh models.5-7
The objective of this observational study was to describe and compare the workday of GCh and non-GCh hospitalists by using automated geographical-tracking methods supplemented by in-person observations.
METHODS
Setting and Participants
This work was conducted at a large academic center in the Midwestern US which adopted GCh in 2012. During the study, hospitalists staffed 11 GCh and four non-GCh teams. GCh teams aim to maintain ≥80% of their patients on their assigned unit and conduct interprofessional huddles on weekdays.3 Some units specialize in the care of specific populations (eg, patients with oncologic diagnoses), while others serve as general medical or surgical units. Non-GCh teams are assigned patients without regard to location. Resident housestaff are assigned only to GCh teams and residents and advanced practice providers (APPs) are never assigned to the same team. Based on team members, this yielded five distinct team types: GCh-hospitalist, GCh-hospitalist with APP, GCh-hospitalist with resident, non-GCh-hospitalist, and non-GCh-hospitalist with APP. Hospitalists provided verbal consent to participate. The protocol was reviewed and approved by the Indiana University Institutional Review Board. Two complementary observation modalities were used. Locator badges were used to quantify direct and indirect time unobtrusively over long periods. In-person observations were conducted to examine the workday in greater detail. Data were collected between October 2017 and May 2018.
Observations by Locator Badges
Our institution uses a system designed by Hill-Rom® (Cary, North Carolina) to facilitate staff communication. Staff wear the I-Badge® Locator Badge, which emits an infra-red signal.8 Centrally located receivers tabulate time spent by the badge wearer in each location (Appendix Figure 1). Each hospitalist was given a badge to wear at work for a minimum of six weeks, after which the I-Badge® data were downloaded.
Schedules detailing each team’s members and assigned units (if cohorted) were retrieved. For each observed day, the hospitalist was linked to his or her team type and unit. Team lists were retrieved to ascertain patient load at the start of the day. Data sources were merged to categorize observations.
Observation Categories for Locator Badge Data
The I-Badge® data provided details of how much time the hospitalist spent in each location (eg, nursing station, hallways, patient rooms). All observations in patient rooms were considered “direct care” while all other locations were categorized as “Indirect Care”. Observations were also categorized by the intensity of care provided on that unit, which included the Emergency Department (ED), Progressive Care Units (PCU), Medical-Surgical + PCU units (for units having a mixture of Medical-Surgical and PCU beds), and Medical-Surgical units.
In-person Observations
Four research assistants (RAs) were trained until interrater reliability using task times achieved an intraclass correlation coefficient of 0.98. Task categories included direct care (all time with patients), indirect care (computer interactions, communication), professional development, and travel and personal time. Interruptions were defined as “an unplanned and unscheduled task, causing a discontinuation, a noticeable break, or task switch behavior”.9 “Electronic interruptions” were caused by pagers or phones whereas in-person interruptions were “face-to-face” interruptions. When at least two tasks were performed simultaneously, it was considered multitasking. A data collection form created in REDCap was accessed on computer tablets or smartphones10 (Appendix Table 1). To limit each observation period to five hours, two RAs were scheduled each day. Observations were continued until the hospitalist reported that work activities were complete or until 5
Statistical Analysis
Due to the nested structure of the locator badge data, multilevel mode
Univariate three-level models predicting minutes spent in direct care were tested for each predictor. Predictors, described below, were selected due to their hypothesized relation to time spent in direct patient care, or to account statistically for differences among teams due to the observational nature of the study.12 Predictors were: Level 3, hospitalist characteristics (years since medical school, age, gender, international graduate, years at current hospital); Level 2, work day characteristics (number of units visited, number of patients visited, team type, weekday); and Level 1, individual observation characteristics (intensity of care on unit, number of visits to the same patient room per day
For total daily indirect care, a similar modeling process was used. A log normal distribution was used because the data was right-skewed and contained positive values. The restricted maximum likelihood method was used to calculate final estimates for models. Least square mean values for independent variables were subjected to backward transformation for interpretation. Post hoc pairwise comparisons between team types were conducted using Tukey–Kramer tests for direct and indirect care time. Analyses were conducted using SAS software version 9.4 (Cary, North Carolina).
The in-person observations were summarized using descriptive statistics. Exploratory analyses were performed using t-tests and Fisher’s exact tests to compare continuous and categorical variables respectively.
RESULTS
Locator Badge Observations
Participants
The 17 hospitalists had a mean (SD) age of 38 years (6.4); 10 (59%) were male, 7 (41%) were international medical graduates, and 10 (59%) had worked at the hospital ≥5 years. The duration of observation was <45 days for 7 hospitalists, 46-55 days for 4, and >55 days for 6, yielding observations for 666 hospitalist workdays. The mean time since medical school graduation was 13 years. Seven hospitalists were observed only in the GCh model, one was observed only in the non-GCh model, and nine were observed in both.
Team Characteristics
On average, non-GCh teams visited more units per day than GCh teams. Teams with APPs had higher patient loads (Table 1).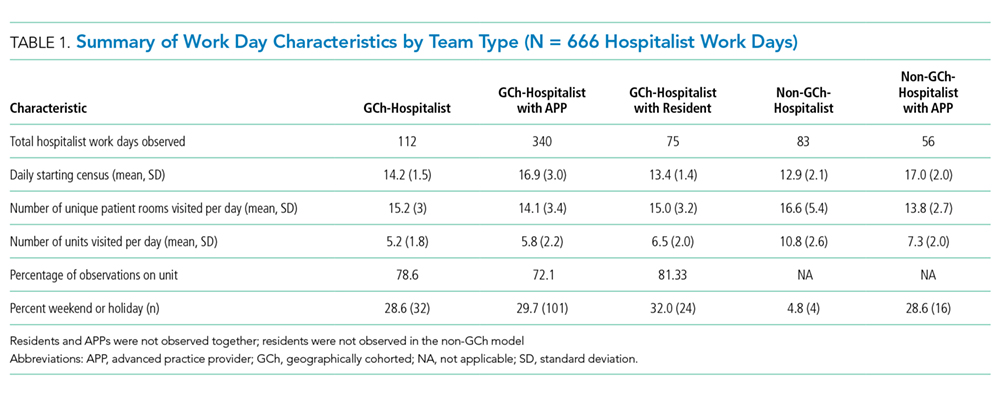
Time Observed in Direct and Indirect Care
In total, 10,522 observations were recorded in providing direct care. The average duration of a direct care encounter ranged from 4.1 to 5.8 minutes. The ratio of indirect to direct time ranged from 2.7 to 3.7 (Table 2).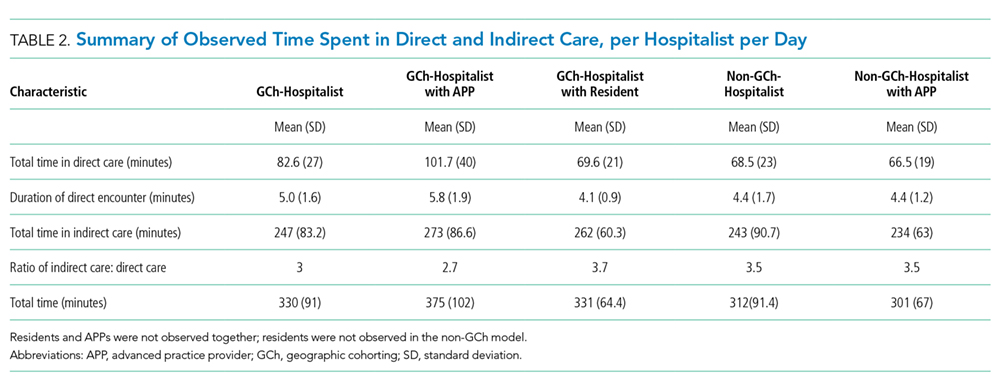
The number of times that a hospitalist visited the same patient room in one day ranged from 1 to 9. Most (84%) of the patient rooms were visited once per day. The odds that a GCh hospitalist would visit a patient more than once per day were 1.8 times higher (95% CI: 1.37, 2.34; P < .0001) than for a non-GCh hospitalist (data not shown).
Predictors Associated with Time Expenditure
Predictors significantly associated with both the duration of direct care encounters and total daily indirect care time included team type and patient count. Predicted time in direct care encounters was highest for the GCh-hospitalist team (9.5 minutes) and lowest for the GCh-hospitalist with residents team (7 minutes). Predicted total indirect care time was highest for the GCh-hospitalist with APP team (160 minutes) while the lowest expenditure in indirect care time was predicted for the non-GCh-hospitalist team (102 minutes). Increasing patient load from 10 to 20 was predicted to decrease the duration of a direct care encounter by one minute (14%) and increase the total indirect care time by a larger amount (39 min, 24%).
The duration of direct care encounters was also inversely related with years since medical school and number of visits made to same patient room. Finally, acuity of care was associated with the duration of direct care encounters with the longest predicted encounters in the ED (9.4 minutes). Physician gender and age, international graduation, years at current hospital, weekday, and the number of units visited in a day were neither associated with direct care time at P value < .05 nor improved model fit and therefore were not retained in the final model (Table 3).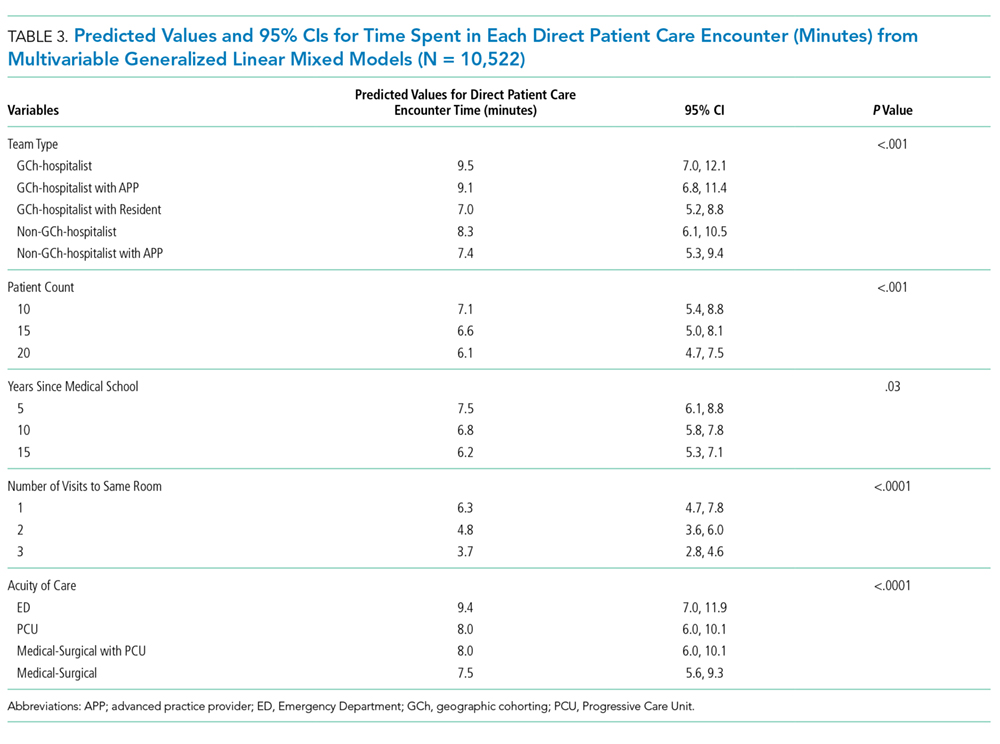
Additional predictors associated with total daily indirect care time included the number of units visited and working on a weekend or holiday. Total time spent in indirect care was predicted to increase as the number of units increased and decrease on weekends or holidays. Hospitalist characteristics were not associated with time in indirect care (Table 4).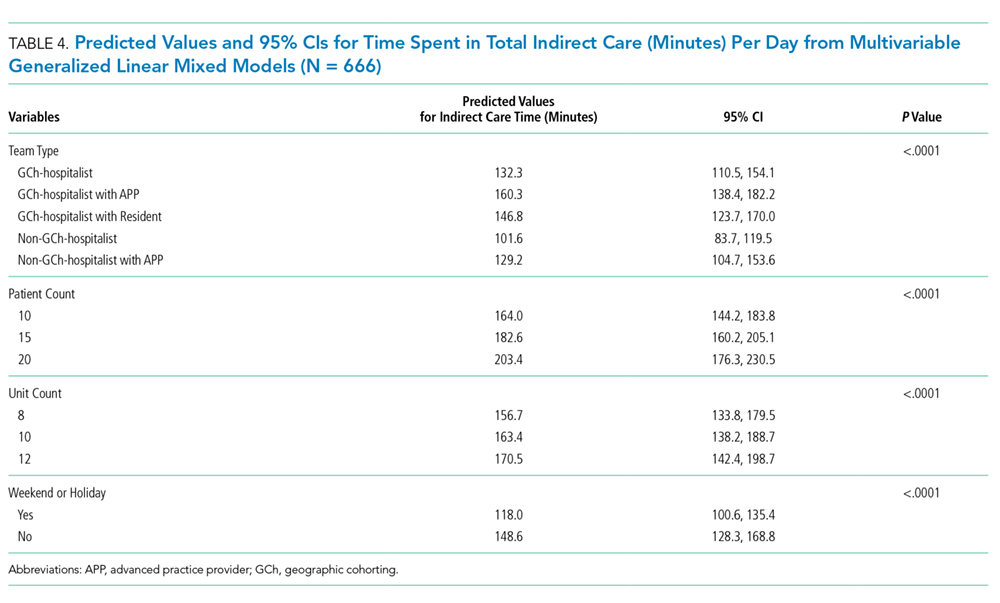
In-person Observations
Four hospitalists cohorted to general medical units and four non-GCh hospitalists were observed for one day each, yielding a total of 3,032 minutes of data. These hospitalists were on teams without residents or APPs. On average, GCh hospitalists had 78% of their patients on their assigned unit, rounded on fewer units (3 vs 6) and had two more patients at the start of the day than non-GCh hospitalists (14 vs 12). Age and gender distribution of the GCh and non-GCh hospitalists were similar.
As a percentage of total observed time, GCh hospitalists were noted to spend a larger proportion of the workday in computer interactions vs non-GCh hospitalists (56% vs 39%; P = .005). The proportion of time in other activities or locations was not statistically different between GCh and non-GCh hospitalists, including face-to-face communication (21% vs 15%), multitasking (18% vs 14%), time spent at the nursing station (58% vs 34%), direct care (15% vs 20%), and time traveling (4% vs 11%). The most frequently observed combination of multitasking was computer and phone use (59% of all multitasking) followed by computer use and face-to-face communication (17%; Appendix Figure 2).
The mean duration of an interruption was 1.3 minutes. More interruptions were observed in the GCh group than the non-GCh group (139 vs 102). Interruptions in the GCh group were face-to-face in 62% of instances and electronic in 25%. The remaining 13% were instances in which electronic and face-to-face interruptions occurred simultaneously. In the non-GCh group, 51% of interruptions were face-to-face; 47% were electronic; and 2% were simultaneous. GCh hospitalists were interrupted once every 14 minutes in the morning, with interruption frequency increasing to once every eight minutes in the afternoon. Non-GCh hospitalists were interrupted once every 13 minutes in the morning and saw interruption frequency decrease to once every 17 minutes in the afternoon. The task most frequently interrupted was computer use.
DISCUSSION
Previous investigations have studied the impact of cohorting on outcomes, including the facilitation of bedside rounding, adverse events, agreement between nurses and physicians on the plan of care, productivity, and the number of pages received.13-16 Cohorting’s benefits are theorized to include increased hospitalist time with patients, while its downsides are perceived to include increased interruptions.17,18 Neither has previously been evaluated by direct observation.
Our findings support cohorting’s association with increased hospitalist–patient time. While GCh hospitalists were observed spending 5% less time in direct care than non-GCh hospitalists by in-person observations, this difference did not achieve statistical significance and was unadjusted for hospitalist, patient load, team or patient characteristics. Using the larger badge dataset, the predicted values for time spent in direct care encounters were higher in cohorted teams. Pairwise comparisons consistently trended toward longer durations in cohorted vs noncohorted teams. The notable exception was in cohorted teams with residents, which had the shortest predicted patient visits; however, we did not have noncohorted teams with residents in our study, limiting interpretation. Additionally, the odds of repeat visits to a patient in a single day were almost twice as high in the cohorted vs noncohorted group. The magnitude of this gain, however, is estimated to be a modest 1.2 minutes for a hospitalist only team and 1.7 minutes for a hospitalist with APP team and may be insufficient to provide compassionate, patient-centered care.19
Furthermore, these gains may be eroded if patient loads are high: similar to a previous study, we found that the duration of each patient visit decreased by 14% when the load increased from 10 to 20 patients.6 The expected gains in efficiency from cohorting leads to an expectation that hospitalists can manage more patients, but such reflexive increases should be carefully considered.18
Similar to earlier investigations where hospitalists were found to spend 60 to 69% of the day in indirect care activities,5,6 hospitalists in both cohorted and noncohorted models spent approximately three times more time in indirect than direct care. Cohorting was associated with increased indirect care time. This association was expected as interdisciplinary huddles and increased nursing and physician communication are both related to cohorting.3,14 However, similar to previous reports, in-person observations revealed that the bulk of this indirect time was spent in computer interactions, rather than in interprofessional communication. Interactions with the electronic health record (EHR) consume between one-third to one-half of the day in inpatient settings.20,21 While EHRs are intended to enhance safety, they also fulfill multiple, nonclinical purposes and increase time spent on documentation.22,23 Nonclinical tasks may contribute to clinician burnout and detract from patient centeredness.22 Our findings suggest that cohorting may not offset the burden of these time-intensive EHR tasks. The larger expenditure of time spent in computer interactions observed in the GCh group may be partially explained both by the higher number of patients and the higher frequency of interruptions observed in this group; computer use was the task most frequently observed to be interrupted. While longer tasks are more likely to be interrupted, the interruption in turn further increases the time taken to complete the task.24
The interruption rates we observed are concerning. The hospitalist workday emerges as cognitively intense. GCh hospitalists were noted to be interrupted as frequently as once every eight minutes, a rate more than double that of an earlier investigation and approaching that of ED physicians.5,25,26 Interruptions and multitasking contribute to errors and a perception of increased workload and frustration for clinicians.9,27-29 Although interruptions were pervasive, GCh hospitalists were interrupted more frequently, corroborating a national survey in which hospitalists perceived that cohorting increased face-to-face interruptions.30 The prolonged availability of the cohorted hospitalist on the unit may require different strategies for promoting timely interactions while preserving uninterrupted work time. Our work, however, does not allow us to quantify appropriate and urgent interruptions that reflect improved teamwork and patient safety. Interruptions increase as patient loads increase.25 The contribution to interruptions by the higher patient census on the GCh teams cannot be quantified in this work, but without attention to these details, potential benefits from GCh may be attenuated.
Previous work has delineated variables important in determining hospitalist workload,31 and our work contributes additional considerations. Hospitalist experience and resident presence on cohorted teams was associated with shorter patient visits, while ED encounters were predicted to be the most time intensive. Increasing numbers of units visited in a day was associated with more indirect time, while weekends were associated with a lower burden of indirect care. As expected, APP presence was associated with more time in indirect care as the hospitalist spends time in providing oversight. As noted, cohorting was associated with increases in both direct and indirect care time. These findings may help inform hospital medicine groups. Additionally, attention should be paid to the fact that while support for cohorting stems from investigations in which it was used as part of a bundle of interventions,2,3 in practice, it is often implemented incompletely, with cohorted hospitalists dispersed over several units, or in isolation from other interventions.1
Our work has several limitations. As a single-center investigation, our findings may not be generalizable to other institutions. Second, we did not evaluate clinical outcomes, clinician, patient or nursing satisfaction to assess the effect of cohorting. Third, we cannot comment on whether the observed interruptions were beneficial or detrimental. Finally, while we used statistical control for the measured imbalanced variables between groups, unmeasured confounding factors between team types including differences in patient populations, pathologies and severity of illness, or the unit’s work environment and processes may have affected results.
Our work underscores the importance of paying careful attention to specific components and monitoring for unintended consequences in a complex intervention such as cohorting to allow subsequent refinement. Further studies to assess the interplay between models of care, their impact on interruptions, multitasking, errors and clinician burnout may be necessary. Such investigations will be critical to support the evolution of hospital medicine that enables it to be the driver of excellence in care.
Acknowledgments
The authors thank the participating hospitalists, research assistants, Shelly Harrison, Joni Godfrey, Mark Luetkemeyer, Deanne Kashiwagi, Tammy Kemlage, Dustin Hertel and Adeel Zaidi for their enthusiasm and support. The authors also thank Ann Cottingham, Rich Frankel and Greg Sachs from the ASPIRE program for their guidance and vision. Dr. Weiner is Chief of Health Services Research and Development at the Richard L. Roudebush Veterans Affairs Medical Center in Indianapolis, Indiana.
Disclaimer
The views expressed in this article are those of the authors and do not necessarily represent the views of the U.S. Department of Veterans Affairs.
1. O’Leary KJ, Johnson JK, Manojlovich M, Astik GJ, Williams MV. Use of unit-based interventions to improve the quality of care for hospitalized medical patients: a national survey. Jt Comm J Qual Patient Saf. 2017;43(11):573-579. https://doi.org/10.1016/j.jcjq.2017.05.008
2. Stein J, Payne C, Methvin A, et al. Reorganizing a hospital ward as an accountable care unit. J Hosp Med. 2015;10(1):36-40. https://doi.org/10.1002/jhm.2284.
3. Kara A, Johnson CS, Nicley A, Niemeier MR, Hui SL. Redesigning inpatient care: testing the effectiveness of an accountable care team model. J Hosp Med. 2015;10(12):773-779. https://doi.org/10.1002/jhm.2432.
4. Tipping MD, Forth VE, Magill DB, Englert K, Williams MV. Systematic review of time studies evaluating physicians in the hospital setting. J Hosp Med. 2010;5(6):353-359. https://doi.org/10.1002/jhm.647.
5. O’Leary KJ, Liebovitz DM, Baker DW. How hospitalists spend their time: Insights on efficiency and safety. J Hosp Med. 2006;1(2):88-93. https://doi.org/10.1002/jhm.88.
6. Tipping MD, Forth VE, O’Leary KJ, et al. Where did the day go? A time-motion study of hospitalists. J Hosp Med. 2010;5(6):323-328. https://doi.org/10.1002/jhm.790.
7. Rothberg MB, Steele JR, Wheeler J, Arora A, Priya A, Lindenauer PK. The relationship between time spent communicating and communication outcomes on a hospital medicine service. J Gen Intern Med. 2012;27(2):185-189. https://doi.org/10.1007/s11606-011-1857-8.
8. Hill-rom.com. (2019). Staff Locating | hill-rom.com. [online] Available at: https://www.hill-rom.com/ca/Products/Products-by-Category/Clinical-Workflow-Solutions/Hill-Rom-Staff-Locating/. Accessed July 7, 2019.
9. Weigl M, Müller A, Vincent C, Angerer P, Sevdalis N. The association of workflow interruptions and hospital doctors’ workload: a prospective observational study. BMJ Qual Saf. 2012;21(5):399-407. https://doi.org/10.1136/bmjqs-2011-000188.
10. Harris PA, Taylor R, Thielke R, Payne J, Gonzalez N, Conde JG. Research electronic data capture (REDCap)—A metadata-driven methodology and workflow process for providing translational research informatics support. J Biomed Inform. 2009;42(2):377-381. https://doi.org/10.1016/j.jbi.2008.08.010.
11. Snijders T, Bosker R. Multilevel Analysis. 2nd ed. London: Sage Publications; 2012.
12. Pourhoseingholi M, Baghestani A, Vahedi M. How to control confounding effects by statistical analysis. Gastroenterol Hepatol Bed Bench. 2012;5(2):79-83.
13. Huang KT, Minahan J, Brita-Rossi P, et al. All together now: impact of a regionalization and bedside rounding initiative on the efficiency and inclusiveness of clinical rounds. J Hosp Med. 2017;12(3):150-156. https://doi.org/10.12788/jhm.2696.
14. Mueller SK, Schnipper JL, Giannelli K, Roy CL, Boxer R. Impact of regionalized care on concordance of plan and preventable adverse events on general medicine services. J Hosp Med. 2016;11(9):620-627. https://doi.org/10.1002/jhm.2566.
15. O’Leary KJ, Wayne DB, Landler MP, et al. Impact of localizing physicians to hospital units on nurse—physician communication and agreement on the plan of care. J Gen Intern Med. 2009;24(11):1223-1227. https://doi.org/10.1007/s11606-009-1113-7.
16. Singh S, Tarima S, Rana V, et al. Impact of localizing general medical teams to a single nursing unit. J Hosp Med. 2012;7(7):551-556. https://doi.org/10.1002/jhm.1948.
17. Singh S, Fletcher KE. A qualitative evaluation of geographical localization of hospitalists: how unintended consequences may impact quality. J Gen Intern Med. 2014;29(7):1009-1016. https://doi.org/10.1007/s11606-014-2780-6.
18. Kara A, Johnson CS, Hui SL, Kashiwagi D. Hospital-based clinicians’ perceptions of geographic cohorting: identifying opportunities for improvement. Am J Med Qual. 2018;33(3):303-312. https://doi.org/10.1177/1062860617745123.
19. Lown BA. Seven guiding commitments: making the U.S. healthcare system more compassionate. J Patient Exp. 2014;1(2):6-15. https://doi.org/10.1177/237437431400100203.
20. Wenger N, Méan M, Castioni J, Marques-Vidal P, Waeber G, Garnier A. Allocation of internal medicine resident time in a swiss hospital: a time and motion study of day and evening shifts. Ann Intern Med. 2017;166(8):579-586. https://doi.org/10.7326/m16-2238.
21. Chen L, Guo U, Illipparambil LC, et al. Racing against the clock: internal medicine residents’ time spent on electronic health records. J Graduate Med Educ. 2015;8(1):39-44. https://doi.org/10.4300/jgme-d-15-00240.1.
22. Erickson SM, Rockwern B, Koltov M, McLean R. Putting patients first by reducing administrative tasks in health care: a position paper of the American College of Physicians. Ann Intern Med. 2017;166:659-661. https://doi.org/10.7326/m16-2697.
23. Poissant L, Pereira J, Tamblyn R, Kawasumi Y. The impact of electronic health records on time efficiency of physicians and nurses: a systematic review. J Am Med Inform Assn. 2005;12(5):505-516. https://doi.org/10.1197/jamia.m1700.
24. Coiera E. The science of interruption. Bmj Qual Saf. 2017;21(5):357-360. https://doi.org/10.1136/bmjqs-2012-00078.
25. Chisholm C, Collison E, Nelson D, Cordell W. Emergency department workplace interruptions: are emergency physicians “interrupt-driven” and “multitasking”? Academic Emerg Med. 2000;7(11):1239-1243. https://doi.org/10.1111/j.1553-2712.2000.tb00469.x.
26. Westbrook JI, Ampt A, Kearney L, Rob MI. All in a day’s work: an observational study to quantify how and with whom doctors on hospital wards spend their time. Med J Aust. 2008;188(9):506-509. https://doi.org/10.5694/j.1326-5377.2008.tb01762.x.
27. Westbrook JI, Woods A, Rob MI, Dunsmuir WT, Day RO. Association of interruptions with an increased risk and severity of medication administration errors. Arch Intern Med. 2010;170(8):683-690. https://doi.org/10.1001/archinternmed.2010.65.
28. Weigl M, Müller A, Angerer P, Hoffmann F. Workflow interruptions and mental workload in hospital pediatricians: an observational study. BMC Health Serv Res. 2014;14(1):433. https://doi.org/10.1186/1472-6963-14-433.
29. Shojania KG, Wald H, Gross R. Understanding medical error and improving patient safety in the inpatient setting. Med Clin N Am. 2002;86(4):847-867. https://doi.org/10.1016/s0025-7125(02)00016-0.
30. Kara A, Johnson CS, Hui SL, Kashiwagi D. Hospital-based clinicians’ perceptions of geographic cohorting: identifying opportunities for improvement. J Med Internet Res. 2017;6(3):106286061774512. https://doi.org/10.2196/jmir.6.3.e34.
31. Michtalik HJ, Pronovost PJ, Marsteller JA, Spetz J, Brotman DJ. Developing a model for attending physician workload and outcomes. Jama Intern Med. 2013;173(11):1026-1028. https://doi.org/10.1001/jamainternmed.2013.405.
Geographic cohorting (GCh, also known as “localization” or “regionalization”) refers to the practice wherein hospitalists are assigned to a single inpatient unit. Its adoption is increasing and in 2017, 30% of surveyed United States hospital medicine group leaders reported that their clinicians rounded on 1-2 units daily.1 As a component of intervention bundles, GCh is associated with reductions in mortality, length of stay, and costs.2,3
However, details on how GCh affects the hospitalist workday are unknown. Most time-motion studies of inpatient clinicians have reported the experiences of physicians in training with few specifically evaluating the workflow of attending hospitalists.4 Three studies of the attending hospitalist’s workday that were performed a decade ago excluded teams with learners, had patient loads as low as 9.4 per day, and did not differentiate between GCh and non-GCh models.5-7
The objective of this observational study was to describe and compare the workday of GCh and non-GCh hospitalists by using automated geographical-tracking methods supplemented by in-person observations.
METHODS
Setting and Participants
This work was conducted at a large academic center in the Midwestern US which adopted GCh in 2012. During the study, hospitalists staffed 11 GCh and four non-GCh teams. GCh teams aim to maintain ≥80% of their patients on their assigned unit and conduct interprofessional huddles on weekdays.3 Some units specialize in the care of specific populations (eg, patients with oncologic diagnoses), while others serve as general medical or surgical units. Non-GCh teams are assigned patients without regard to location. Resident housestaff are assigned only to GCh teams and residents and advanced practice providers (APPs) are never assigned to the same team. Based on team members, this yielded five distinct team types: GCh-hospitalist, GCh-hospitalist with APP, GCh-hospitalist with resident, non-GCh-hospitalist, and non-GCh-hospitalist with APP. Hospitalists provided verbal consent to participate. The protocol was reviewed and approved by the Indiana University Institutional Review Board. Two complementary observation modalities were used. Locator badges were used to quantify direct and indirect time unobtrusively over long periods. In-person observations were conducted to examine the workday in greater detail. Data were collected between October 2017 and May 2018.
Observations by Locator Badges
Our institution uses a system designed by Hill-Rom® (Cary, North Carolina) to facilitate staff communication. Staff wear the I-Badge® Locator Badge, which emits an infra-red signal.8 Centrally located receivers tabulate time spent by the badge wearer in each location (Appendix Figure 1). Each hospitalist was given a badge to wear at work for a minimum of six weeks, after which the I-Badge® data were downloaded.
Schedules detailing each team’s members and assigned units (if cohorted) were retrieved. For each observed day, the hospitalist was linked to his or her team type and unit. Team lists were retrieved to ascertain patient load at the start of the day. Data sources were merged to categorize observations.
Observation Categories for Locator Badge Data
The I-Badge® data provided details of how much time the hospitalist spent in each location (eg, nursing station, hallways, patient rooms). All observations in patient rooms were considered “direct care” while all other locations were categorized as “Indirect Care”. Observations were also categorized by the intensity of care provided on that unit, which included the Emergency Department (ED), Progressive Care Units (PCU), Medical-Surgical + PCU units (for units having a mixture of Medical-Surgical and PCU beds), and Medical-Surgical units.
In-person Observations
Four research assistants (RAs) were trained until interrater reliability using task times achieved an intraclass correlation coefficient of 0.98. Task categories included direct care (all time with patients), indirect care (computer interactions, communication), professional development, and travel and personal time. Interruptions were defined as “an unplanned and unscheduled task, causing a discontinuation, a noticeable break, or task switch behavior”.9 “Electronic interruptions” were caused by pagers or phones whereas in-person interruptions were “face-to-face” interruptions. When at least two tasks were performed simultaneously, it was considered multitasking. A data collection form created in REDCap was accessed on computer tablets or smartphones10 (Appendix Table 1). To limit each observation period to five hours, two RAs were scheduled each day. Observations were continued until the hospitalist reported that work activities were complete or until 5
Statistical Analysis
Due to the nested structure of the locator badge data, multilevel mode
Univariate three-level models predicting minutes spent in direct care were tested for each predictor. Predictors, described below, were selected due to their hypothesized relation to time spent in direct patient care, or to account statistically for differences among teams due to the observational nature of the study.12 Predictors were: Level 3, hospitalist characteristics (years since medical school, age, gender, international graduate, years at current hospital); Level 2, work day characteristics (number of units visited, number of patients visited, team type, weekday); and Level 1, individual observation characteristics (intensity of care on unit, number of visits to the same patient room per day
For total daily indirect care, a similar modeling process was used. A log normal distribution was used because the data was right-skewed and contained positive values. The restricted maximum likelihood method was used to calculate final estimates for models. Least square mean values for independent variables were subjected to backward transformation for interpretation. Post hoc pairwise comparisons between team types were conducted using Tukey–Kramer tests for direct and indirect care time. Analyses were conducted using SAS software version 9.4 (Cary, North Carolina).
The in-person observations were summarized using descriptive statistics. Exploratory analyses were performed using t-tests and Fisher’s exact tests to compare continuous and categorical variables respectively.
RESULTS
Locator Badge Observations
Participants
The 17 hospitalists had a mean (SD) age of 38 years (6.4); 10 (59%) were male, 7 (41%) were international medical graduates, and 10 (59%) had worked at the hospital ≥5 years. The duration of observation was <45 days for 7 hospitalists, 46-55 days for 4, and >55 days for 6, yielding observations for 666 hospitalist workdays. The mean time since medical school graduation was 13 years. Seven hospitalists were observed only in the GCh model, one was observed only in the non-GCh model, and nine were observed in both.
Team Characteristics
On average, non-GCh teams visited more units per day than GCh teams. Teams with APPs had higher patient loads (Table 1).
Time Observed in Direct and Indirect Care
In total, 10,522 observations were recorded in providing direct care. The average duration of a direct care encounter ranged from 4.1 to 5.8 minutes. The ratio of indirect to direct time ranged from 2.7 to 3.7 (Table 2).
The number of times that a hospitalist visited the same patient room in one day ranged from 1 to 9. Most (84%) of the patient rooms were visited once per day. The odds that a GCh hospitalist would visit a patient more than once per day were 1.8 times higher (95% CI: 1.37, 2.34; P < .0001) than for a non-GCh hospitalist (data not shown).
Predictors Associated with Time Expenditure
Predictors significantly associated with both the duration of direct care encounters and total daily indirect care time included team type and patient count. Predicted time in direct care encounters was highest for the GCh-hospitalist team (9.5 minutes) and lowest for the GCh-hospitalist with residents team (7 minutes). Predicted total indirect care time was highest for the GCh-hospitalist with APP team (160 minutes) while the lowest expenditure in indirect care time was predicted for the non-GCh-hospitalist team (102 minutes). Increasing patient load from 10 to 20 was predicted to decrease the duration of a direct care encounter by one minute (14%) and increase the total indirect care time by a larger amount (39 min, 24%).
The duration of direct care encounters was also inversely related with years since medical school and number of visits made to same patient room. Finally, acuity of care was associated with the duration of direct care encounters with the longest predicted encounters in the ED (9.4 minutes). Physician gender and age, international graduation, years at current hospital, weekday, and the number of units visited in a day were neither associated with direct care time at P value < .05 nor improved model fit and therefore were not retained in the final model (Table 3).
Additional predictors associated with total daily indirect care time included the number of units visited and working on a weekend or holiday. Total time spent in indirect care was predicted to increase as the number of units increased and decrease on weekends or holidays. Hospitalist characteristics were not associated with time in indirect care (Table 4).
In-person Observations
Four hospitalists cohorted to general medical units and four non-GCh hospitalists were observed for one day each, yielding a total of 3,032 minutes of data. These hospitalists were on teams without residents or APPs. On average, GCh hospitalists had 78% of their patients on their assigned unit, rounded on fewer units (3 vs 6) and had two more patients at the start of the day than non-GCh hospitalists (14 vs 12). Age and gender distribution of the GCh and non-GCh hospitalists were similar.
As a percentage of total observed time, GCh hospitalists were noted to spend a larger proportion of the workday in computer interactions vs non-GCh hospitalists (56% vs 39%; P = .005). The proportion of time in other activities or locations was not statistically different between GCh and non-GCh hospitalists, including face-to-face communication (21% vs 15%), multitasking (18% vs 14%), time spent at the nursing station (58% vs 34%), direct care (15% vs 20%), and time traveling (4% vs 11%). The most frequently observed combination of multitasking was computer and phone use (59% of all multitasking) followed by computer use and face-to-face communication (17%; Appendix Figure 2).
The mean duration of an interruption was 1.3 minutes. More interruptions were observed in the GCh group than the non-GCh group (139 vs 102). Interruptions in the GCh group were face-to-face in 62% of instances and electronic in 25%. The remaining 13% were instances in which electronic and face-to-face interruptions occurred simultaneously. In the non-GCh group, 51% of interruptions were face-to-face; 47% were electronic; and 2% were simultaneous. GCh hospitalists were interrupted once every 14 minutes in the morning, with interruption frequency increasing to once every eight minutes in the afternoon. Non-GCh hospitalists were interrupted once every 13 minutes in the morning and saw interruption frequency decrease to once every 17 minutes in the afternoon. The task most frequently interrupted was computer use.
DISCUSSION
Previous investigations have studied the impact of cohorting on outcomes, including the facilitation of bedside rounding, adverse events, agreement between nurses and physicians on the plan of care, productivity, and the number of pages received.13-16 Cohorting’s benefits are theorized to include increased hospitalist time with patients, while its downsides are perceived to include increased interruptions.17,18 Neither has previously been evaluated by direct observation.
Our findings support cohorting’s association with increased hospitalist–patient time. While GCh hospitalists were observed spending 5% less time in direct care than non-GCh hospitalists by in-person observations, this difference did not achieve statistical significance and was unadjusted for hospitalist, patient load, team or patient characteristics. Using the larger badge dataset, the predicted values for time spent in direct care encounters were higher in cohorted teams. Pairwise comparisons consistently trended toward longer durations in cohorted vs noncohorted teams. The notable exception was in cohorted teams with residents, which had the shortest predicted patient visits; however, we did not have noncohorted teams with residents in our study, limiting interpretation. Additionally, the odds of repeat visits to a patient in a single day were almost twice as high in the cohorted vs noncohorted group. The magnitude of this gain, however, is estimated to be a modest 1.2 minutes for a hospitalist only team and 1.7 minutes for a hospitalist with APP team and may be insufficient to provide compassionate, patient-centered care.19
Furthermore, these gains may be eroded if patient loads are high: similar to a previous study, we found that the duration of each patient visit decreased by 14% when the load increased from 10 to 20 patients.6 The expected gains in efficiency from cohorting leads to an expectation that hospitalists can manage more patients, but such reflexive increases should be carefully considered.18
Similar to earlier investigations where hospitalists were found to spend 60 to 69% of the day in indirect care activities,5,6 hospitalists in both cohorted and noncohorted models spent approximately three times more time in indirect than direct care. Cohorting was associated with increased indirect care time. This association was expected as interdisciplinary huddles and increased nursing and physician communication are both related to cohorting.3,14 However, similar to previous reports, in-person observations revealed that the bulk of this indirect time was spent in computer interactions, rather than in interprofessional communication. Interactions with the electronic health record (EHR) consume between one-third to one-half of the day in inpatient settings.20,21 While EHRs are intended to enhance safety, they also fulfill multiple, nonclinical purposes and increase time spent on documentation.22,23 Nonclinical tasks may contribute to clinician burnout and detract from patient centeredness.22 Our findings suggest that cohorting may not offset the burden of these time-intensive EHR tasks. The larger expenditure of time spent in computer interactions observed in the GCh group may be partially explained both by the higher number of patients and the higher frequency of interruptions observed in this group; computer use was the task most frequently observed to be interrupted. While longer tasks are more likely to be interrupted, the interruption in turn further increases the time taken to complete the task.24
The interruption rates we observed are concerning. The hospitalist workday emerges as cognitively intense. GCh hospitalists were noted to be interrupted as frequently as once every eight minutes, a rate more than double that of an earlier investigation and approaching that of ED physicians.5,25,26 Interruptions and multitasking contribute to errors and a perception of increased workload and frustration for clinicians.9,27-29 Although interruptions were pervasive, GCh hospitalists were interrupted more frequently, corroborating a national survey in which hospitalists perceived that cohorting increased face-to-face interruptions.30 The prolonged availability of the cohorted hospitalist on the unit may require different strategies for promoting timely interactions while preserving uninterrupted work time. Our work, however, does not allow us to quantify appropriate and urgent interruptions that reflect improved teamwork and patient safety. Interruptions increase as patient loads increase.25 The contribution to interruptions by the higher patient census on the GCh teams cannot be quantified in this work, but without attention to these details, potential benefits from GCh may be attenuated.
Previous work has delineated variables important in determining hospitalist workload,31 and our work contributes additional considerations. Hospitalist experience and resident presence on cohorted teams was associated with shorter patient visits, while ED encounters were predicted to be the most time intensive. Increasing numbers of units visited in a day was associated with more indirect time, while weekends were associated with a lower burden of indirect care. As expected, APP presence was associated with more time in indirect care as the hospitalist spends time in providing oversight. As noted, cohorting was associated with increases in both direct and indirect care time. These findings may help inform hospital medicine groups. Additionally, attention should be paid to the fact that while support for cohorting stems from investigations in which it was used as part of a bundle of interventions,2,3 in practice, it is often implemented incompletely, with cohorted hospitalists dispersed over several units, or in isolation from other interventions.1
Our work has several limitations. As a single-center investigation, our findings may not be generalizable to other institutions. Second, we did not evaluate clinical outcomes, clinician, patient or nursing satisfaction to assess the effect of cohorting. Third, we cannot comment on whether the observed interruptions were beneficial or detrimental. Finally, while we used statistical control for the measured imbalanced variables between groups, unmeasured confounding factors between team types including differences in patient populations, pathologies and severity of illness, or the unit’s work environment and processes may have affected results.
Our work underscores the importance of paying careful attention to specific components and monitoring for unintended consequences in a complex intervention such as cohorting to allow subsequent refinement. Further studies to assess the interplay between models of care, their impact on interruptions, multitasking, errors and clinician burnout may be necessary. Such investigations will be critical to support the evolution of hospital medicine that enables it to be the driver of excellence in care.
Acknowledgments
The authors thank the participating hospitalists, research assistants, Shelly Harrison, Joni Godfrey, Mark Luetkemeyer, Deanne Kashiwagi, Tammy Kemlage, Dustin Hertel and Adeel Zaidi for their enthusiasm and support. The authors also thank Ann Cottingham, Rich Frankel and Greg Sachs from the ASPIRE program for their guidance and vision. Dr. Weiner is Chief of Health Services Research and Development at the Richard L. Roudebush Veterans Affairs Medical Center in Indianapolis, Indiana.
Disclaimer
The views expressed in this article are those of the authors and do not necessarily represent the views of the U.S. Department of Veterans Affairs.
1. O’Leary KJ, Johnson JK, Manojlovich M, Astik GJ, Williams MV. Use of unit-based interventions to improve the quality of care for hospitalized medical patients: a national survey. Jt Comm J Qual Patient Saf. 2017;43(11):573-579. https://doi.org/10.1016/j.jcjq.2017.05.008
2. Stein J, Payne C, Methvin A, et al. Reorganizing a hospital ward as an accountable care unit. J Hosp Med. 2015;10(1):36-40. https://doi.org/10.1002/jhm.2284.
3. Kara A, Johnson CS, Nicley A, Niemeier MR, Hui SL. Redesigning inpatient care: testing the effectiveness of an accountable care team model. J Hosp Med. 2015;10(12):773-779. https://doi.org/10.1002/jhm.2432.
4. Tipping MD, Forth VE, Magill DB, Englert K, Williams MV. Systematic review of time studies evaluating physicians in the hospital setting. J Hosp Med. 2010;5(6):353-359. https://doi.org/10.1002/jhm.647.
5. O’Leary KJ, Liebovitz DM, Baker DW. How hospitalists spend their time: Insights on efficiency and safety. J Hosp Med. 2006;1(2):88-93. https://doi.org/10.1002/jhm.88.
6. Tipping MD, Forth VE, O’Leary KJ, et al. Where did the day go? A time-motion study of hospitalists. J Hosp Med. 2010;5(6):323-328. https://doi.org/10.1002/jhm.790.
7. Rothberg MB, Steele JR, Wheeler J, Arora A, Priya A, Lindenauer PK. The relationship between time spent communicating and communication outcomes on a hospital medicine service. J Gen Intern Med. 2012;27(2):185-189. https://doi.org/10.1007/s11606-011-1857-8.
8. Hill-rom.com. (2019). Staff Locating | hill-rom.com. [online] Available at: https://www.hill-rom.com/ca/Products/Products-by-Category/Clinical-Workflow-Solutions/Hill-Rom-Staff-Locating/. Accessed July 7, 2019.
9. Weigl M, Müller A, Vincent C, Angerer P, Sevdalis N. The association of workflow interruptions and hospital doctors’ workload: a prospective observational study. BMJ Qual Saf. 2012;21(5):399-407. https://doi.org/10.1136/bmjqs-2011-000188.
10. Harris PA, Taylor R, Thielke R, Payne J, Gonzalez N, Conde JG. Research electronic data capture (REDCap)—A metadata-driven methodology and workflow process for providing translational research informatics support. J Biomed Inform. 2009;42(2):377-381. https://doi.org/10.1016/j.jbi.2008.08.010.
11. Snijders T, Bosker R. Multilevel Analysis. 2nd ed. London: Sage Publications; 2012.
12. Pourhoseingholi M, Baghestani A, Vahedi M. How to control confounding effects by statistical analysis. Gastroenterol Hepatol Bed Bench. 2012;5(2):79-83.
13. Huang KT, Minahan J, Brita-Rossi P, et al. All together now: impact of a regionalization and bedside rounding initiative on the efficiency and inclusiveness of clinical rounds. J Hosp Med. 2017;12(3):150-156. https://doi.org/10.12788/jhm.2696.
14. Mueller SK, Schnipper JL, Giannelli K, Roy CL, Boxer R. Impact of regionalized care on concordance of plan and preventable adverse events on general medicine services. J Hosp Med. 2016;11(9):620-627. https://doi.org/10.1002/jhm.2566.
15. O’Leary KJ, Wayne DB, Landler MP, et al. Impact of localizing physicians to hospital units on nurse—physician communication and agreement on the plan of care. J Gen Intern Med. 2009;24(11):1223-1227. https://doi.org/10.1007/s11606-009-1113-7.
16. Singh S, Tarima S, Rana V, et al. Impact of localizing general medical teams to a single nursing unit. J Hosp Med. 2012;7(7):551-556. https://doi.org/10.1002/jhm.1948.
17. Singh S, Fletcher KE. A qualitative evaluation of geographical localization of hospitalists: how unintended consequences may impact quality. J Gen Intern Med. 2014;29(7):1009-1016. https://doi.org/10.1007/s11606-014-2780-6.
18. Kara A, Johnson CS, Hui SL, Kashiwagi D. Hospital-based clinicians’ perceptions of geographic cohorting: identifying opportunities for improvement. Am J Med Qual. 2018;33(3):303-312. https://doi.org/10.1177/1062860617745123.
19. Lown BA. Seven guiding commitments: making the U.S. healthcare system more compassionate. J Patient Exp. 2014;1(2):6-15. https://doi.org/10.1177/237437431400100203.
20. Wenger N, Méan M, Castioni J, Marques-Vidal P, Waeber G, Garnier A. Allocation of internal medicine resident time in a swiss hospital: a time and motion study of day and evening shifts. Ann Intern Med. 2017;166(8):579-586. https://doi.org/10.7326/m16-2238.
21. Chen L, Guo U, Illipparambil LC, et al. Racing against the clock: internal medicine residents’ time spent on electronic health records. J Graduate Med Educ. 2015;8(1):39-44. https://doi.org/10.4300/jgme-d-15-00240.1.
22. Erickson SM, Rockwern B, Koltov M, McLean R. Putting patients first by reducing administrative tasks in health care: a position paper of the American College of Physicians. Ann Intern Med. 2017;166:659-661. https://doi.org/10.7326/m16-2697.
23. Poissant L, Pereira J, Tamblyn R, Kawasumi Y. The impact of electronic health records on time efficiency of physicians and nurses: a systematic review. J Am Med Inform Assn. 2005;12(5):505-516. https://doi.org/10.1197/jamia.m1700.
24. Coiera E. The science of interruption. Bmj Qual Saf. 2017;21(5):357-360. https://doi.org/10.1136/bmjqs-2012-00078.
25. Chisholm C, Collison E, Nelson D, Cordell W. Emergency department workplace interruptions: are emergency physicians “interrupt-driven” and “multitasking”? Academic Emerg Med. 2000;7(11):1239-1243. https://doi.org/10.1111/j.1553-2712.2000.tb00469.x.
26. Westbrook JI, Ampt A, Kearney L, Rob MI. All in a day’s work: an observational study to quantify how and with whom doctors on hospital wards spend their time. Med J Aust. 2008;188(9):506-509. https://doi.org/10.5694/j.1326-5377.2008.tb01762.x.
27. Westbrook JI, Woods A, Rob MI, Dunsmuir WT, Day RO. Association of interruptions with an increased risk and severity of medication administration errors. Arch Intern Med. 2010;170(8):683-690. https://doi.org/10.1001/archinternmed.2010.65.
28. Weigl M, Müller A, Angerer P, Hoffmann F. Workflow interruptions and mental workload in hospital pediatricians: an observational study. BMC Health Serv Res. 2014;14(1):433. https://doi.org/10.1186/1472-6963-14-433.
29. Shojania KG, Wald H, Gross R. Understanding medical error and improving patient safety in the inpatient setting. Med Clin N Am. 2002;86(4):847-867. https://doi.org/10.1016/s0025-7125(02)00016-0.
30. Kara A, Johnson CS, Hui SL, Kashiwagi D. Hospital-based clinicians’ perceptions of geographic cohorting: identifying opportunities for improvement. J Med Internet Res. 2017;6(3):106286061774512. https://doi.org/10.2196/jmir.6.3.e34.
31. Michtalik HJ, Pronovost PJ, Marsteller JA, Spetz J, Brotman DJ. Developing a model for attending physician workload and outcomes. Jama Intern Med. 2013;173(11):1026-1028. https://doi.org/10.1001/jamainternmed.2013.405.
© 2019 Society of Hospital Medicine