User login
A Time Motion Study Evaluating the Impact of Geographic Cohorting of Hospitalists
Geographic cohorting (GCh, also known as “localization” or “regionalization”) refers to the practice wherein hospitalists are assigned to a single inpatient unit. Its adoption is increasing and in 2017, 30% of surveyed United States hospital medicine group leaders reported that their clinicians rounded on 1-2 units daily.1 As a component of intervention bundles, GCh is associated with reductions in mortality, length of stay, and costs.2,3
However, details on how GCh affects the hospitalist workday are unknown. Most time-motion studies of inpatient clinicians have reported the experiences of physicians in training with few specifically evaluating the workflow of attending hospitalists.4 Three studies of the attending hospitalist’s workday that were performed a decade ago excluded teams with learners, had patient loads as low as 9.4 per day, and did not differentiate between GCh and non-GCh models.5-7
The objective of this observational study was to describe and compare the workday of GCh and non-GCh hospitalists by using automated geographical-tracking methods supplemented by in-person observations.
METHODS
Setting and Participants
This work was conducted at a large academic center in the Midwestern US which adopted GCh in 2012. During the study, hospitalists staffed 11 GCh and four non-GCh teams. GCh teams aim to maintain ≥80% of their patients on their assigned unit and conduct interprofessional huddles on weekdays.3 Some units specialize in the care of specific populations (eg, patients with oncologic diagnoses), while others serve as general medical or surgical units. Non-GCh teams are assigned patients without regard to location. Resident housestaff are assigned only to GCh teams and residents and advanced practice providers (APPs) are never assigned to the same team. Based on team members, this yielded five distinct team types: GCh-hospitalist, GCh-hospitalist with APP, GCh-hospitalist with resident, non-GCh-hospitalist, and non-GCh-hospitalist with APP. Hospitalists provided verbal consent to participate. The protocol was reviewed and approved by the Indiana University Institutional Review Board. Two complementary observation modalities were used. Locator badges were used to quantify direct and indirect time unobtrusively over long periods. In-person observations were conducted to examine the workday in greater detail. Data were collected between October 2017 and May 2018.
Observations by Locator Badges
Our institution uses a system designed by Hill-Rom® (Cary, North Carolina) to facilitate staff communication. Staff wear the I-Badge® Locator Badge, which emits an infra-red signal.8 Centrally located receivers tabulate time spent by the badge wearer in each location (Appendix Figure 1). Each hospitalist was given a badge to wear at work for a minimum of six weeks, after which the I-Badge® data were downloaded.
Schedules detailing each team’s members and assigned units (if cohorted) were retrieved. For each observed day, the hospitalist was linked to his or her team type and unit. Team lists were retrieved to ascertain patient load at the start of the day. Data sources were merged to categorize observations.
Observation Categories for Locator Badge Data
The I-Badge® data provided details of how much time the hospitalist spent in each location (eg, nursing station, hallways, patient rooms). All observations in patient rooms were considered “direct care” while all other locations were categorized as “Indirect Care”. Observations were also categorized by the intensity of care provided on that unit, which included the Emergency Department (ED), Progressive Care Units (PCU), Medical-Surgical + PCU units (for units having a mixture of Medical-Surgical and PCU beds), and Medical-Surgical units.
In-person Observations
Four research assistants (RAs) were trained until interrater reliability using task times achieved an intraclass correlation coefficient of 0.98. Task categories included direct care (all time with patients), indirect care (computer interactions, communication), professional development, and travel and personal time. Interruptions were defined as “an unplanned and unscheduled task, causing a discontinuation, a noticeable break, or task switch behavior”.9 “Electronic interruptions” were caused by pagers or phones whereas in-person interruptions were “face-to-face” interruptions. When at least two tasks were performed simultaneously, it was considered multitasking. A data collection form created in REDCap was accessed on computer tablets or smartphones10 (Appendix Table 1). To limit each observation period to five hours, two RAs were scheduled each day. Observations were continued until the hospitalist reported that work activities were complete or until 5
Statistical Analysis
Due to the nested structure of the locator badge data, multilevel mode
Univariate three-level models predicting minutes spent in direct care were tested for each predictor. Predictors, described below, were selected due to their hypothesized relation to time spent in direct patient care, or to account statistically for differences among teams due to the observational nature of the study.12 Predictors were: Level 3, hospitalist characteristics (years since medical school, age, gender, international graduate, years at current hospital); Level 2, work day characteristics (number of units visited, number of patients visited, team type, weekday); and Level 1, individual observation characteristics (intensity of care on unit, number of visits to the same patient room per day
For total daily indirect care, a similar modeling process was used. A log normal distribution was used because the data was right-skewed and contained positive values. The restricted maximum likelihood method was used to calculate final estimates for models. Least square mean values for independent variables were subjected to backward transformation for interpretation. Post hoc pairwise comparisons between team types were conducted using Tukey–Kramer tests for direct and indirect care time. Analyses were conducted using SAS software version 9.4 (Cary, North Carolina).
The in-person observations were summarized using descriptive statistics. Exploratory analyses were performed using t-tests and Fisher’s exact tests to compare continuous and categorical variables respectively.
RESULTS
Locator Badge Observations
Participants
The 17 hospitalists had a mean (SD) age of 38 years (6.4); 10 (59%) were male, 7 (41%) were international medical graduates, and 10 (59%) had worked at the hospital ≥5 years. The duration of observation was <45 days for 7 hospitalists, 46-55 days for 4, and >55 days for 6, yielding observations for 666 hospitalist workdays. The mean time since medical school graduation was 13 years. Seven hospitalists were observed only in the GCh model, one was observed only in the non-GCh model, and nine were observed in both.
Team Characteristics
On average, non-GCh teams visited more units per day than GCh teams. Teams with APPs had higher patient loads (Table 1).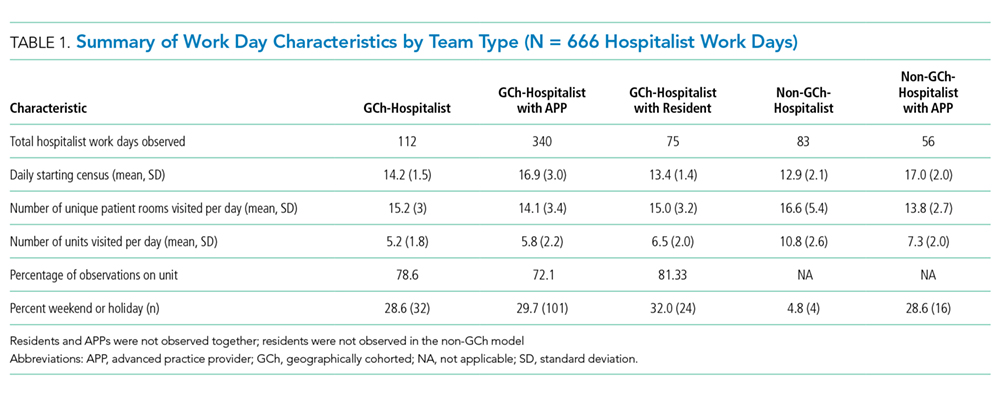
Time Observed in Direct and Indirect Care
In total, 10,522 observations were recorded in providing direct care. The average duration of a direct care encounter ranged from 4.1 to 5.8 minutes. The ratio of indirect to direct time ranged from 2.7 to 3.7 (Table 2).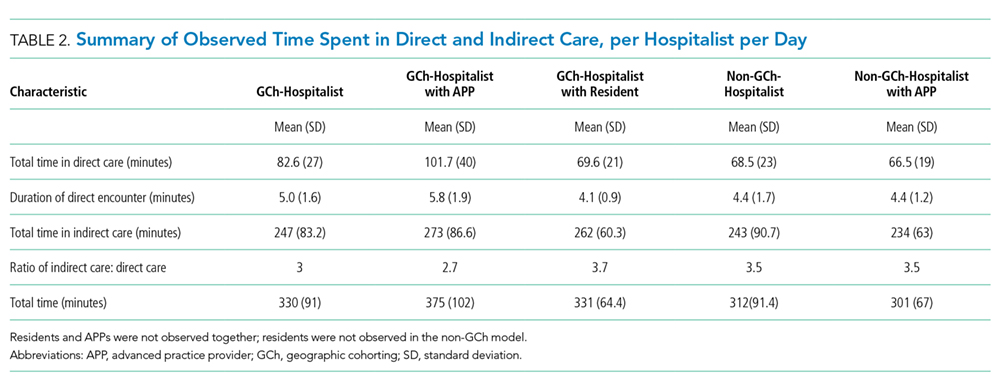
The number of times that a hospitalist visited the same patient room in one day ranged from 1 to 9. Most (84%) of the patient rooms were visited once per day. The odds that a GCh hospitalist would visit a patient more than once per day were 1.8 times higher (95% CI: 1.37, 2.34; P < .0001) than for a non-GCh hospitalist (data not shown).
Predictors Associated with Time Expenditure
Predictors significantly associated with both the duration of direct care encounters and total daily indirect care time included team type and patient count. Predicted time in direct care encounters was highest for the GCh-hospitalist team (9.5 minutes) and lowest for the GCh-hospitalist with residents team (7 minutes). Predicted total indirect care time was highest for the GCh-hospitalist with APP team (160 minutes) while the lowest expenditure in indirect care time was predicted for the non-GCh-hospitalist team (102 minutes). Increasing patient load from 10 to 20 was predicted to decrease the duration of a direct care encounter by one minute (14%) and increase the total indirect care time by a larger amount (39 min, 24%).
The duration of direct care encounters was also inversely related with years since medical school and number of visits made to same patient room. Finally, acuity of care was associated with the duration of direct care encounters with the longest predicted encounters in the ED (9.4 minutes). Physician gender and age, international graduation, years at current hospital, weekday, and the number of units visited in a day were neither associated with direct care time at P value < .05 nor improved model fit and therefore were not retained in the final model (Table 3).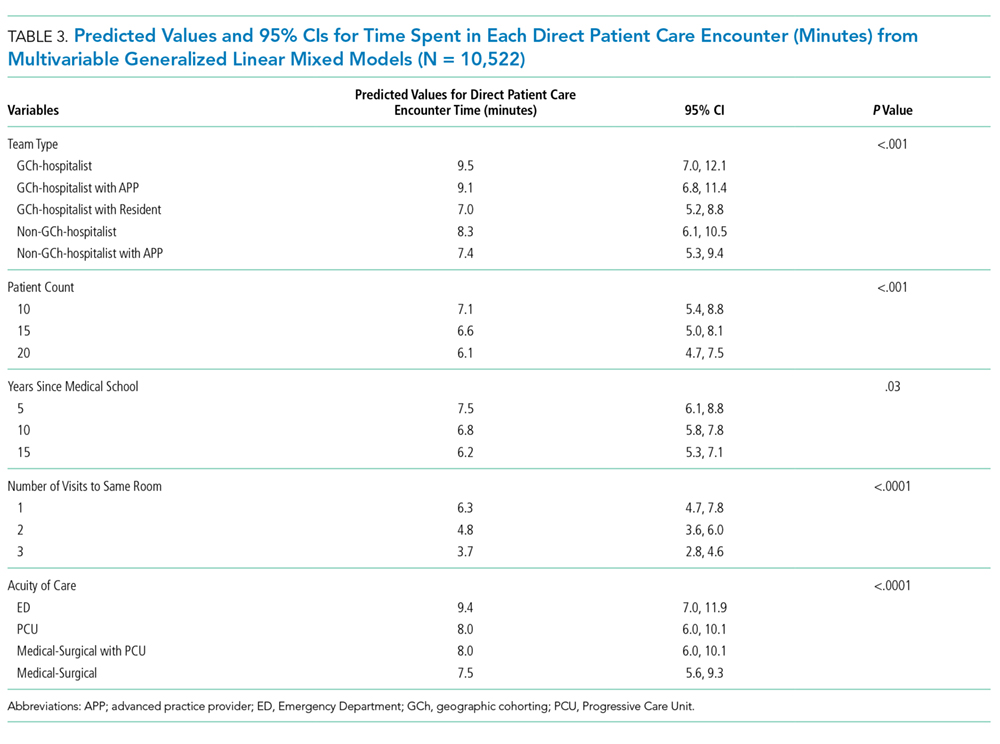
Additional predictors associated with total daily indirect care time included the number of units visited and working on a weekend or holiday. Total time spent in indirect care was predicted to increase as the number of units increased and decrease on weekends or holidays. Hospitalist characteristics were not associated with time in indirect care (Table 4).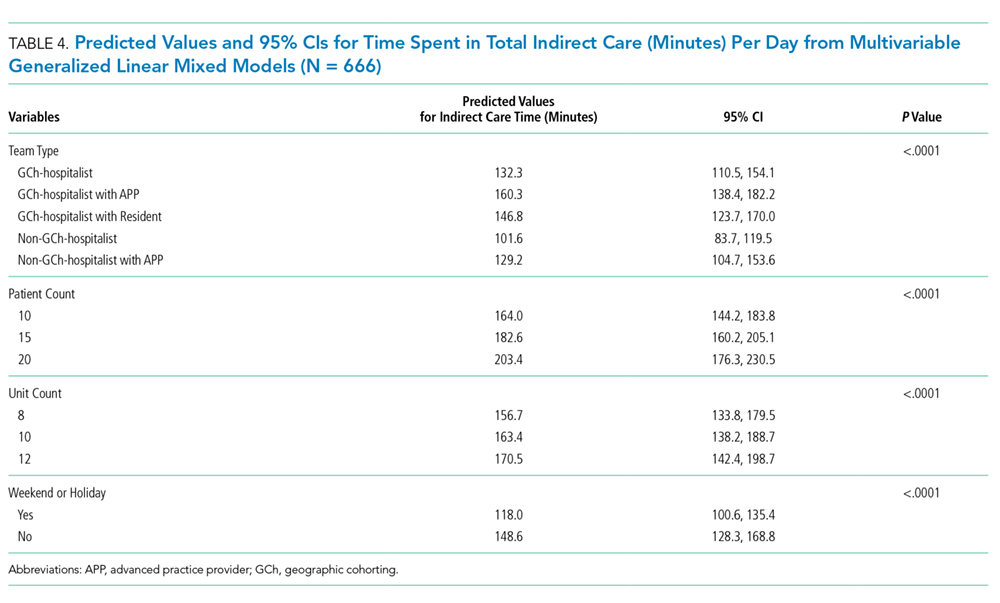
In-person Observations
Four hospitalists cohorted to general medical units and four non-GCh hospitalists were observed for one day each, yielding a total of 3,032 minutes of data. These hospitalists were on teams without residents or APPs. On average, GCh hospitalists had 78% of their patients on their assigned unit, rounded on fewer units (3 vs 6) and had two more patients at the start of the day than non-GCh hospitalists (14 vs 12). Age and gender distribution of the GCh and non-GCh hospitalists were similar.
As a percentage of total observed time, GCh hospitalists were noted to spend a larger proportion of the workday in computer interactions vs non-GCh hospitalists (56% vs 39%; P = .005). The proportion of time in other activities or locations was not statistically different between GCh and non-GCh hospitalists, including face-to-face communication (21% vs 15%), multitasking (18% vs 14%), time spent at the nursing station (58% vs 34%), direct care (15% vs 20%), and time traveling (4% vs 11%). The most frequently observed combination of multitasking was computer and phone use (59% of all multitasking) followed by computer use and face-to-face communication (17%; Appendix Figure 2).
The mean duration of an interruption was 1.3 minutes. More interruptions were observed in the GCh group than the non-GCh group (139 vs 102). Interruptions in the GCh group were face-to-face in 62% of instances and electronic in 25%. The remaining 13% were instances in which electronic and face-to-face interruptions occurred simultaneously. In the non-GCh group, 51% of interruptions were face-to-face; 47% were electronic; and 2% were simultaneous. GCh hospitalists were interrupted once every 14 minutes in the morning, with interruption frequency increasing to once every eight minutes in the afternoon. Non-GCh hospitalists were interrupted once every 13 minutes in the morning and saw interruption frequency decrease to once every 17 minutes in the afternoon. The task most frequently interrupted was computer use.
DISCUSSION
Previous investigations have studied the impact of cohorting on outcomes, including the facilitation of bedside rounding, adverse events, agreement between nurses and physicians on the plan of care, productivity, and the number of pages received.13-16 Cohorting’s benefits are theorized to include increased hospitalist time with patients, while its downsides are perceived to include increased interruptions.17,18 Neither has previously been evaluated by direct observation.
Our findings support cohorting’s association with increased hospitalist–patient time. While GCh hospitalists were observed spending 5% less time in direct care than non-GCh hospitalists by in-person observations, this difference did not achieve statistical significance and was unadjusted for hospitalist, patient load, team or patient characteristics. Using the larger badge dataset, the predicted values for time spent in direct care encounters were higher in cohorted teams. Pairwise comparisons consistently trended toward longer durations in cohorted vs noncohorted teams. The notable exception was in cohorted teams with residents, which had the shortest predicted patient visits; however, we did not have noncohorted teams with residents in our study, limiting interpretation. Additionally, the odds of repeat visits to a patient in a single day were almost twice as high in the cohorted vs noncohorted group. The magnitude of this gain, however, is estimated to be a modest 1.2 minutes for a hospitalist only team and 1.7 minutes for a hospitalist with APP team and may be insufficient to provide compassionate, patient-centered care.19
Furthermore, these gains may be eroded if patient loads are high: similar to a previous study, we found that the duration of each patient visit decreased by 14% when the load increased from 10 to 20 patients.6 The expected gains in efficiency from cohorting leads to an expectation that hospitalists can manage more patients, but such reflexive increases should be carefully considered.18
Similar to earlier investigations where hospitalists were found to spend 60 to 69% of the day in indirect care activities,5,6 hospitalists in both cohorted and noncohorted models spent approximately three times more time in indirect than direct care. Cohorting was associated with increased indirect care time. This association was expected as interdisciplinary huddles and increased nursing and physician communication are both related to cohorting.3,14 However, similar to previous reports, in-person observations revealed that the bulk of this indirect time was spent in computer interactions, rather than in interprofessional communication. Interactions with the electronic health record (EHR) consume between one-third to one-half of the day in inpatient settings.20,21 While EHRs are intended to enhance safety, they also fulfill multiple, nonclinical purposes and increase time spent on documentation.22,23 Nonclinical tasks may contribute to clinician burnout and detract from patient centeredness.22 Our findings suggest that cohorting may not offset the burden of these time-intensive EHR tasks. The larger expenditure of time spent in computer interactions observed in the GCh group may be partially explained both by the higher number of patients and the higher frequency of interruptions observed in this group; computer use was the task most frequently observed to be interrupted. While longer tasks are more likely to be interrupted, the interruption in turn further increases the time taken to complete the task.24
The interruption rates we observed are concerning. The hospitalist workday emerges as cognitively intense. GCh hospitalists were noted to be interrupted as frequently as once every eight minutes, a rate more than double that of an earlier investigation and approaching that of ED physicians.5,25,26 Interruptions and multitasking contribute to errors and a perception of increased workload and frustration for clinicians.9,27-29 Although interruptions were pervasive, GCh hospitalists were interrupted more frequently, corroborating a national survey in which hospitalists perceived that cohorting increased face-to-face interruptions.30 The prolonged availability of the cohorted hospitalist on the unit may require different strategies for promoting timely interactions while preserving uninterrupted work time. Our work, however, does not allow us to quantify appropriate and urgent interruptions that reflect improved teamwork and patient safety. Interruptions increase as patient loads increase.25 The contribution to interruptions by the higher patient census on the GCh teams cannot be quantified in this work, but without attention to these details, potential benefits from GCh may be attenuated.
Previous work has delineated variables important in determining hospitalist workload,31 and our work contributes additional considerations. Hospitalist experience and resident presence on cohorted teams was associated with shorter patient visits, while ED encounters were predicted to be the most time intensive. Increasing numbers of units visited in a day was associated with more indirect time, while weekends were associated with a lower burden of indirect care. As expected, APP presence was associated with more time in indirect care as the hospitalist spends time in providing oversight. As noted, cohorting was associated with increases in both direct and indirect care time. These findings may help inform hospital medicine groups. Additionally, attention should be paid to the fact that while support for cohorting stems from investigations in which it was used as part of a bundle of interventions,2,3 in practice, it is often implemented incompletely, with cohorted hospitalists dispersed over several units, or in isolation from other interventions.1
Our work has several limitations. As a single-center investigation, our findings may not be generalizable to other institutions. Second, we did not evaluate clinical outcomes, clinician, patient or nursing satisfaction to assess the effect of cohorting. Third, we cannot comment on whether the observed interruptions were beneficial or detrimental. Finally, while we used statistical control for the measured imbalanced variables between groups, unmeasured confounding factors between team types including differences in patient populations, pathologies and severity of illness, or the unit’s work environment and processes may have affected results.
Our work underscores the importance of paying careful attention to specific components and monitoring for unintended consequences in a complex intervention such as cohorting to allow subsequent refinement. Further studies to assess the interplay between models of care, their impact on interruptions, multitasking, errors and clinician burnout may be necessary. Such investigations will be critical to support the evolution of hospital medicine that enables it to be the driver of excellence in care.
Acknowledgments
The authors thank the participating hospitalists, research assistants, Shelly Harrison, Joni Godfrey, Mark Luetkemeyer, Deanne Kashiwagi, Tammy Kemlage, Dustin Hertel and Adeel Zaidi for their enthusiasm and support. The authors also thank Ann Cottingham, Rich Frankel and Greg Sachs from the ASPIRE program for their guidance and vision. Dr. Weiner is Chief of Health Services Research and Development at the Richard L. Roudebush Veterans Affairs Medical Center in Indianapolis, Indiana.
Disclaimer
The views expressed in this article are those of the authors and do not necessarily represent the views of the U.S. Department of Veterans Affairs.
1. O’Leary KJ, Johnson JK, Manojlovich M, Astik GJ, Williams MV. Use of unit-based interventions to improve the quality of care for hospitalized medical patients: a national survey. Jt Comm J Qual Patient Saf. 2017;43(11):573-579. https://doi.org/10.1016/j.jcjq.2017.05.008
2. Stein J, Payne C, Methvin A, et al. Reorganizing a hospital ward as an accountable care unit. J Hosp Med. 2015;10(1):36-40. https://doi.org/10.1002/jhm.2284.
3. Kara A, Johnson CS, Nicley A, Niemeier MR, Hui SL. Redesigning inpatient care: testing the effectiveness of an accountable care team model. J Hosp Med. 2015;10(12):773-779. https://doi.org/10.1002/jhm.2432.
4. Tipping MD, Forth VE, Magill DB, Englert K, Williams MV. Systematic review of time studies evaluating physicians in the hospital setting. J Hosp Med. 2010;5(6):353-359. https://doi.org/10.1002/jhm.647.
5. O’Leary KJ, Liebovitz DM, Baker DW. How hospitalists spend their time: Insights on efficiency and safety. J Hosp Med. 2006;1(2):88-93. https://doi.org/10.1002/jhm.88.
6. Tipping MD, Forth VE, O’Leary KJ, et al. Where did the day go? A time-motion study of hospitalists. J Hosp Med. 2010;5(6):323-328. https://doi.org/10.1002/jhm.790.
7. Rothberg MB, Steele JR, Wheeler J, Arora A, Priya A, Lindenauer PK. The relationship between time spent communicating and communication outcomes on a hospital medicine service. J Gen Intern Med. 2012;27(2):185-189. https://doi.org/10.1007/s11606-011-1857-8.
8. Hill-rom.com. (2019). Staff Locating | hill-rom.com. [online] Available at: https://www.hill-rom.com/ca/Products/Products-by-Category/Clinical-Workflow-Solutions/Hill-Rom-Staff-Locating/. Accessed July 7, 2019.
9. Weigl M, Müller A, Vincent C, Angerer P, Sevdalis N. The association of workflow interruptions and hospital doctors’ workload: a prospective observational study. BMJ Qual Saf. 2012;21(5):399-407. https://doi.org/10.1136/bmjqs-2011-000188.
10. Harris PA, Taylor R, Thielke R, Payne J, Gonzalez N, Conde JG. Research electronic data capture (REDCap)—A metadata-driven methodology and workflow process for providing translational research informatics support. J Biomed Inform. 2009;42(2):377-381. https://doi.org/10.1016/j.jbi.2008.08.010.
11. Snijders T, Bosker R. Multilevel Analysis. 2nd ed. London: Sage Publications; 2012.
12. Pourhoseingholi M, Baghestani A, Vahedi M. How to control confounding effects by statistical analysis. Gastroenterol Hepatol Bed Bench. 2012;5(2):79-83.
13. Huang KT, Minahan J, Brita-Rossi P, et al. All together now: impact of a regionalization and bedside rounding initiative on the efficiency and inclusiveness of clinical rounds. J Hosp Med. 2017;12(3):150-156. https://doi.org/10.12788/jhm.2696.
14. Mueller SK, Schnipper JL, Giannelli K, Roy CL, Boxer R. Impact of regionalized care on concordance of plan and preventable adverse events on general medicine services. J Hosp Med. 2016;11(9):620-627. https://doi.org/10.1002/jhm.2566.
15. O’Leary KJ, Wayne DB, Landler MP, et al. Impact of localizing physicians to hospital units on nurse—physician communication and agreement on the plan of care. J Gen Intern Med. 2009;24(11):1223-1227. https://doi.org/10.1007/s11606-009-1113-7.
16. Singh S, Tarima S, Rana V, et al. Impact of localizing general medical teams to a single nursing unit. J Hosp Med. 2012;7(7):551-556. https://doi.org/10.1002/jhm.1948.
17. Singh S, Fletcher KE. A qualitative evaluation of geographical localization of hospitalists: how unintended consequences may impact quality. J Gen Intern Med. 2014;29(7):1009-1016. https://doi.org/10.1007/s11606-014-2780-6.
18. Kara A, Johnson CS, Hui SL, Kashiwagi D. Hospital-based clinicians’ perceptions of geographic cohorting: identifying opportunities for improvement. Am J Med Qual. 2018;33(3):303-312. https://doi.org/10.1177/1062860617745123.
19. Lown BA. Seven guiding commitments: making the U.S. healthcare system more compassionate. J Patient Exp. 2014;1(2):6-15. https://doi.org/10.1177/237437431400100203.
20. Wenger N, Méan M, Castioni J, Marques-Vidal P, Waeber G, Garnier A. Allocation of internal medicine resident time in a swiss hospital: a time and motion study of day and evening shifts. Ann Intern Med. 2017;166(8):579-586. https://doi.org/10.7326/m16-2238.
21. Chen L, Guo U, Illipparambil LC, et al. Racing against the clock: internal medicine residents’ time spent on electronic health records. J Graduate Med Educ. 2015;8(1):39-44. https://doi.org/10.4300/jgme-d-15-00240.1.
22. Erickson SM, Rockwern B, Koltov M, McLean R. Putting patients first by reducing administrative tasks in health care: a position paper of the American College of Physicians. Ann Intern Med. 2017;166:659-661. https://doi.org/10.7326/m16-2697.
23. Poissant L, Pereira J, Tamblyn R, Kawasumi Y. The impact of electronic health records on time efficiency of physicians and nurses: a systematic review. J Am Med Inform Assn. 2005;12(5):505-516. https://doi.org/10.1197/jamia.m1700.
24. Coiera E. The science of interruption. Bmj Qual Saf. 2017;21(5):357-360. https://doi.org/10.1136/bmjqs-2012-00078.
25. Chisholm C, Collison E, Nelson D, Cordell W. Emergency department workplace interruptions: are emergency physicians “interrupt-driven” and “multitasking”? Academic Emerg Med. 2000;7(11):1239-1243. https://doi.org/10.1111/j.1553-2712.2000.tb00469.x.
26. Westbrook JI, Ampt A, Kearney L, Rob MI. All in a day’s work: an observational study to quantify how and with whom doctors on hospital wards spend their time. Med J Aust. 2008;188(9):506-509. https://doi.org/10.5694/j.1326-5377.2008.tb01762.x.
27. Westbrook JI, Woods A, Rob MI, Dunsmuir WT, Day RO. Association of interruptions with an increased risk and severity of medication administration errors. Arch Intern Med. 2010;170(8):683-690. https://doi.org/10.1001/archinternmed.2010.65.
28. Weigl M, Müller A, Angerer P, Hoffmann F. Workflow interruptions and mental workload in hospital pediatricians: an observational study. BMC Health Serv Res. 2014;14(1):433. https://doi.org/10.1186/1472-6963-14-433.
29. Shojania KG, Wald H, Gross R. Understanding medical error and improving patient safety in the inpatient setting. Med Clin N Am. 2002;86(4):847-867. https://doi.org/10.1016/s0025-7125(02)00016-0.
30. Kara A, Johnson CS, Hui SL, Kashiwagi D. Hospital-based clinicians’ perceptions of geographic cohorting: identifying opportunities for improvement. J Med Internet Res. 2017;6(3):106286061774512. https://doi.org/10.2196/jmir.6.3.e34.
31. Michtalik HJ, Pronovost PJ, Marsteller JA, Spetz J, Brotman DJ. Developing a model for attending physician workload and outcomes. Jama Intern Med. 2013;173(11):1026-1028. https://doi.org/10.1001/jamainternmed.2013.405.
Geographic cohorting (GCh, also known as “localization” or “regionalization”) refers to the practice wherein hospitalists are assigned to a single inpatient unit. Its adoption is increasing and in 2017, 30% of surveyed United States hospital medicine group leaders reported that their clinicians rounded on 1-2 units daily.1 As a component of intervention bundles, GCh is associated with reductions in mortality, length of stay, and costs.2,3
However, details on how GCh affects the hospitalist workday are unknown. Most time-motion studies of inpatient clinicians have reported the experiences of physicians in training with few specifically evaluating the workflow of attending hospitalists.4 Three studies of the attending hospitalist’s workday that were performed a decade ago excluded teams with learners, had patient loads as low as 9.4 per day, and did not differentiate between GCh and non-GCh models.5-7
The objective of this observational study was to describe and compare the workday of GCh and non-GCh hospitalists by using automated geographical-tracking methods supplemented by in-person observations.
METHODS
Setting and Participants
This work was conducted at a large academic center in the Midwestern US which adopted GCh in 2012. During the study, hospitalists staffed 11 GCh and four non-GCh teams. GCh teams aim to maintain ≥80% of their patients on their assigned unit and conduct interprofessional huddles on weekdays.3 Some units specialize in the care of specific populations (eg, patients with oncologic diagnoses), while others serve as general medical or surgical units. Non-GCh teams are assigned patients without regard to location. Resident housestaff are assigned only to GCh teams and residents and advanced practice providers (APPs) are never assigned to the same team. Based on team members, this yielded five distinct team types: GCh-hospitalist, GCh-hospitalist with APP, GCh-hospitalist with resident, non-GCh-hospitalist, and non-GCh-hospitalist with APP. Hospitalists provided verbal consent to participate. The protocol was reviewed and approved by the Indiana University Institutional Review Board. Two complementary observation modalities were used. Locator badges were used to quantify direct and indirect time unobtrusively over long periods. In-person observations were conducted to examine the workday in greater detail. Data were collected between October 2017 and May 2018.
Observations by Locator Badges
Our institution uses a system designed by Hill-Rom® (Cary, North Carolina) to facilitate staff communication. Staff wear the I-Badge® Locator Badge, which emits an infra-red signal.8 Centrally located receivers tabulate time spent by the badge wearer in each location (Appendix Figure 1). Each hospitalist was given a badge to wear at work for a minimum of six weeks, after which the I-Badge® data were downloaded.
Schedules detailing each team’s members and assigned units (if cohorted) were retrieved. For each observed day, the hospitalist was linked to his or her team type and unit. Team lists were retrieved to ascertain patient load at the start of the day. Data sources were merged to categorize observations.
Observation Categories for Locator Badge Data
The I-Badge® data provided details of how much time the hospitalist spent in each location (eg, nursing station, hallways, patient rooms). All observations in patient rooms were considered “direct care” while all other locations were categorized as “Indirect Care”. Observations were also categorized by the intensity of care provided on that unit, which included the Emergency Department (ED), Progressive Care Units (PCU), Medical-Surgical + PCU units (for units having a mixture of Medical-Surgical and PCU beds), and Medical-Surgical units.
In-person Observations
Four research assistants (RAs) were trained until interrater reliability using task times achieved an intraclass correlation coefficient of 0.98. Task categories included direct care (all time with patients), indirect care (computer interactions, communication), professional development, and travel and personal time. Interruptions were defined as “an unplanned and unscheduled task, causing a discontinuation, a noticeable break, or task switch behavior”.9 “Electronic interruptions” were caused by pagers or phones whereas in-person interruptions were “face-to-face” interruptions. When at least two tasks were performed simultaneously, it was considered multitasking. A data collection form created in REDCap was accessed on computer tablets or smartphones10 (Appendix Table 1). To limit each observation period to five hours, two RAs were scheduled each day. Observations were continued until the hospitalist reported that work activities were complete or until 5
Statistical Analysis
Due to the nested structure of the locator badge data, multilevel mode
Univariate three-level models predicting minutes spent in direct care were tested for each predictor. Predictors, described below, were selected due to their hypothesized relation to time spent in direct patient care, or to account statistically for differences among teams due to the observational nature of the study.12 Predictors were: Level 3, hospitalist characteristics (years since medical school, age, gender, international graduate, years at current hospital); Level 2, work day characteristics (number of units visited, number of patients visited, team type, weekday); and Level 1, individual observation characteristics (intensity of care on unit, number of visits to the same patient room per day
For total daily indirect care, a similar modeling process was used. A log normal distribution was used because the data was right-skewed and contained positive values. The restricted maximum likelihood method was used to calculate final estimates for models. Least square mean values for independent variables were subjected to backward transformation for interpretation. Post hoc pairwise comparisons between team types were conducted using Tukey–Kramer tests for direct and indirect care time. Analyses were conducted using SAS software version 9.4 (Cary, North Carolina).
The in-person observations were summarized using descriptive statistics. Exploratory analyses were performed using t-tests and Fisher’s exact tests to compare continuous and categorical variables respectively.
RESULTS
Locator Badge Observations
Participants
The 17 hospitalists had a mean (SD) age of 38 years (6.4); 10 (59%) were male, 7 (41%) were international medical graduates, and 10 (59%) had worked at the hospital ≥5 years. The duration of observation was <45 days for 7 hospitalists, 46-55 days for 4, and >55 days for 6, yielding observations for 666 hospitalist workdays. The mean time since medical school graduation was 13 years. Seven hospitalists were observed only in the GCh model, one was observed only in the non-GCh model, and nine were observed in both.
Team Characteristics
On average, non-GCh teams visited more units per day than GCh teams. Teams with APPs had higher patient loads (Table 1).
Time Observed in Direct and Indirect Care
In total, 10,522 observations were recorded in providing direct care. The average duration of a direct care encounter ranged from 4.1 to 5.8 minutes. The ratio of indirect to direct time ranged from 2.7 to 3.7 (Table 2).
The number of times that a hospitalist visited the same patient room in one day ranged from 1 to 9. Most (84%) of the patient rooms were visited once per day. The odds that a GCh hospitalist would visit a patient more than once per day were 1.8 times higher (95% CI: 1.37, 2.34; P < .0001) than for a non-GCh hospitalist (data not shown).
Predictors Associated with Time Expenditure
Predictors significantly associated with both the duration of direct care encounters and total daily indirect care time included team type and patient count. Predicted time in direct care encounters was highest for the GCh-hospitalist team (9.5 minutes) and lowest for the GCh-hospitalist with residents team (7 minutes). Predicted total indirect care time was highest for the GCh-hospitalist with APP team (160 minutes) while the lowest expenditure in indirect care time was predicted for the non-GCh-hospitalist team (102 minutes). Increasing patient load from 10 to 20 was predicted to decrease the duration of a direct care encounter by one minute (14%) and increase the total indirect care time by a larger amount (39 min, 24%).
The duration of direct care encounters was also inversely related with years since medical school and number of visits made to same patient room. Finally, acuity of care was associated with the duration of direct care encounters with the longest predicted encounters in the ED (9.4 minutes). Physician gender and age, international graduation, years at current hospital, weekday, and the number of units visited in a day were neither associated with direct care time at P value < .05 nor improved model fit and therefore were not retained in the final model (Table 3).
Additional predictors associated with total daily indirect care time included the number of units visited and working on a weekend or holiday. Total time spent in indirect care was predicted to increase as the number of units increased and decrease on weekends or holidays. Hospitalist characteristics were not associated with time in indirect care (Table 4).
In-person Observations
Four hospitalists cohorted to general medical units and four non-GCh hospitalists were observed for one day each, yielding a total of 3,032 minutes of data. These hospitalists were on teams without residents or APPs. On average, GCh hospitalists had 78% of their patients on their assigned unit, rounded on fewer units (3 vs 6) and had two more patients at the start of the day than non-GCh hospitalists (14 vs 12). Age and gender distribution of the GCh and non-GCh hospitalists were similar.
As a percentage of total observed time, GCh hospitalists were noted to spend a larger proportion of the workday in computer interactions vs non-GCh hospitalists (56% vs 39%; P = .005). The proportion of time in other activities or locations was not statistically different between GCh and non-GCh hospitalists, including face-to-face communication (21% vs 15%), multitasking (18% vs 14%), time spent at the nursing station (58% vs 34%), direct care (15% vs 20%), and time traveling (4% vs 11%). The most frequently observed combination of multitasking was computer and phone use (59% of all multitasking) followed by computer use and face-to-face communication (17%; Appendix Figure 2).
The mean duration of an interruption was 1.3 minutes. More interruptions were observed in the GCh group than the non-GCh group (139 vs 102). Interruptions in the GCh group were face-to-face in 62% of instances and electronic in 25%. The remaining 13% were instances in which electronic and face-to-face interruptions occurred simultaneously. In the non-GCh group, 51% of interruptions were face-to-face; 47% were electronic; and 2% were simultaneous. GCh hospitalists were interrupted once every 14 minutes in the morning, with interruption frequency increasing to once every eight minutes in the afternoon. Non-GCh hospitalists were interrupted once every 13 minutes in the morning and saw interruption frequency decrease to once every 17 minutes in the afternoon. The task most frequently interrupted was computer use.
DISCUSSION
Previous investigations have studied the impact of cohorting on outcomes, including the facilitation of bedside rounding, adverse events, agreement between nurses and physicians on the plan of care, productivity, and the number of pages received.13-16 Cohorting’s benefits are theorized to include increased hospitalist time with patients, while its downsides are perceived to include increased interruptions.17,18 Neither has previously been evaluated by direct observation.
Our findings support cohorting’s association with increased hospitalist–patient time. While GCh hospitalists were observed spending 5% less time in direct care than non-GCh hospitalists by in-person observations, this difference did not achieve statistical significance and was unadjusted for hospitalist, patient load, team or patient characteristics. Using the larger badge dataset, the predicted values for time spent in direct care encounters were higher in cohorted teams. Pairwise comparisons consistently trended toward longer durations in cohorted vs noncohorted teams. The notable exception was in cohorted teams with residents, which had the shortest predicted patient visits; however, we did not have noncohorted teams with residents in our study, limiting interpretation. Additionally, the odds of repeat visits to a patient in a single day were almost twice as high in the cohorted vs noncohorted group. The magnitude of this gain, however, is estimated to be a modest 1.2 minutes for a hospitalist only team and 1.7 minutes for a hospitalist with APP team and may be insufficient to provide compassionate, patient-centered care.19
Furthermore, these gains may be eroded if patient loads are high: similar to a previous study, we found that the duration of each patient visit decreased by 14% when the load increased from 10 to 20 patients.6 The expected gains in efficiency from cohorting leads to an expectation that hospitalists can manage more patients, but such reflexive increases should be carefully considered.18
Similar to earlier investigations where hospitalists were found to spend 60 to 69% of the day in indirect care activities,5,6 hospitalists in both cohorted and noncohorted models spent approximately three times more time in indirect than direct care. Cohorting was associated with increased indirect care time. This association was expected as interdisciplinary huddles and increased nursing and physician communication are both related to cohorting.3,14 However, similar to previous reports, in-person observations revealed that the bulk of this indirect time was spent in computer interactions, rather than in interprofessional communication. Interactions with the electronic health record (EHR) consume between one-third to one-half of the day in inpatient settings.20,21 While EHRs are intended to enhance safety, they also fulfill multiple, nonclinical purposes and increase time spent on documentation.22,23 Nonclinical tasks may contribute to clinician burnout and detract from patient centeredness.22 Our findings suggest that cohorting may not offset the burden of these time-intensive EHR tasks. The larger expenditure of time spent in computer interactions observed in the GCh group may be partially explained both by the higher number of patients and the higher frequency of interruptions observed in this group; computer use was the task most frequently observed to be interrupted. While longer tasks are more likely to be interrupted, the interruption in turn further increases the time taken to complete the task.24
The interruption rates we observed are concerning. The hospitalist workday emerges as cognitively intense. GCh hospitalists were noted to be interrupted as frequently as once every eight minutes, a rate more than double that of an earlier investigation and approaching that of ED physicians.5,25,26 Interruptions and multitasking contribute to errors and a perception of increased workload and frustration for clinicians.9,27-29 Although interruptions were pervasive, GCh hospitalists were interrupted more frequently, corroborating a national survey in which hospitalists perceived that cohorting increased face-to-face interruptions.30 The prolonged availability of the cohorted hospitalist on the unit may require different strategies for promoting timely interactions while preserving uninterrupted work time. Our work, however, does not allow us to quantify appropriate and urgent interruptions that reflect improved teamwork and patient safety. Interruptions increase as patient loads increase.25 The contribution to interruptions by the higher patient census on the GCh teams cannot be quantified in this work, but without attention to these details, potential benefits from GCh may be attenuated.
Previous work has delineated variables important in determining hospitalist workload,31 and our work contributes additional considerations. Hospitalist experience and resident presence on cohorted teams was associated with shorter patient visits, while ED encounters were predicted to be the most time intensive. Increasing numbers of units visited in a day was associated with more indirect time, while weekends were associated with a lower burden of indirect care. As expected, APP presence was associated with more time in indirect care as the hospitalist spends time in providing oversight. As noted, cohorting was associated with increases in both direct and indirect care time. These findings may help inform hospital medicine groups. Additionally, attention should be paid to the fact that while support for cohorting stems from investigations in which it was used as part of a bundle of interventions,2,3 in practice, it is often implemented incompletely, with cohorted hospitalists dispersed over several units, or in isolation from other interventions.1
Our work has several limitations. As a single-center investigation, our findings may not be generalizable to other institutions. Second, we did not evaluate clinical outcomes, clinician, patient or nursing satisfaction to assess the effect of cohorting. Third, we cannot comment on whether the observed interruptions were beneficial or detrimental. Finally, while we used statistical control for the measured imbalanced variables between groups, unmeasured confounding factors between team types including differences in patient populations, pathologies and severity of illness, or the unit’s work environment and processes may have affected results.
Our work underscores the importance of paying careful attention to specific components and monitoring for unintended consequences in a complex intervention such as cohorting to allow subsequent refinement. Further studies to assess the interplay between models of care, their impact on interruptions, multitasking, errors and clinician burnout may be necessary. Such investigations will be critical to support the evolution of hospital medicine that enables it to be the driver of excellence in care.
Acknowledgments
The authors thank the participating hospitalists, research assistants, Shelly Harrison, Joni Godfrey, Mark Luetkemeyer, Deanne Kashiwagi, Tammy Kemlage, Dustin Hertel and Adeel Zaidi for their enthusiasm and support. The authors also thank Ann Cottingham, Rich Frankel and Greg Sachs from the ASPIRE program for their guidance and vision. Dr. Weiner is Chief of Health Services Research and Development at the Richard L. Roudebush Veterans Affairs Medical Center in Indianapolis, Indiana.
Disclaimer
The views expressed in this article are those of the authors and do not necessarily represent the views of the U.S. Department of Veterans Affairs.
1. O’Leary KJ, Johnson JK, Manojlovich M, Astik GJ, Williams MV. Use of unit-based interventions to improve the quality of care for hospitalized medical patients: a national survey. Jt Comm J Qual Patient Saf. 2017;43(11):573-579. https://doi.org/10.1016/j.jcjq.2017.05.008
2. Stein J, Payne C, Methvin A, et al. Reorganizing a hospital ward as an accountable care unit. J Hosp Med. 2015;10(1):36-40. https://doi.org/10.1002/jhm.2284.
3. Kara A, Johnson CS, Nicley A, Niemeier MR, Hui SL. Redesigning inpatient care: testing the effectiveness of an accountable care team model. J Hosp Med. 2015;10(12):773-779. https://doi.org/10.1002/jhm.2432.
4. Tipping MD, Forth VE, Magill DB, Englert K, Williams MV. Systematic review of time studies evaluating physicians in the hospital setting. J Hosp Med. 2010;5(6):353-359. https://doi.org/10.1002/jhm.647.
5. O’Leary KJ, Liebovitz DM, Baker DW. How hospitalists spend their time: Insights on efficiency and safety. J Hosp Med. 2006;1(2):88-93. https://doi.org/10.1002/jhm.88.
6. Tipping MD, Forth VE, O’Leary KJ, et al. Where did the day go? A time-motion study of hospitalists. J Hosp Med. 2010;5(6):323-328. https://doi.org/10.1002/jhm.790.
7. Rothberg MB, Steele JR, Wheeler J, Arora A, Priya A, Lindenauer PK. The relationship between time spent communicating and communication outcomes on a hospital medicine service. J Gen Intern Med. 2012;27(2):185-189. https://doi.org/10.1007/s11606-011-1857-8.
8. Hill-rom.com. (2019). Staff Locating | hill-rom.com. [online] Available at: https://www.hill-rom.com/ca/Products/Products-by-Category/Clinical-Workflow-Solutions/Hill-Rom-Staff-Locating/. Accessed July 7, 2019.
9. Weigl M, Müller A, Vincent C, Angerer P, Sevdalis N. The association of workflow interruptions and hospital doctors’ workload: a prospective observational study. BMJ Qual Saf. 2012;21(5):399-407. https://doi.org/10.1136/bmjqs-2011-000188.
10. Harris PA, Taylor R, Thielke R, Payne J, Gonzalez N, Conde JG. Research electronic data capture (REDCap)—A metadata-driven methodology and workflow process for providing translational research informatics support. J Biomed Inform. 2009;42(2):377-381. https://doi.org/10.1016/j.jbi.2008.08.010.
11. Snijders T, Bosker R. Multilevel Analysis. 2nd ed. London: Sage Publications; 2012.
12. Pourhoseingholi M, Baghestani A, Vahedi M. How to control confounding effects by statistical analysis. Gastroenterol Hepatol Bed Bench. 2012;5(2):79-83.
13. Huang KT, Minahan J, Brita-Rossi P, et al. All together now: impact of a regionalization and bedside rounding initiative on the efficiency and inclusiveness of clinical rounds. J Hosp Med. 2017;12(3):150-156. https://doi.org/10.12788/jhm.2696.
14. Mueller SK, Schnipper JL, Giannelli K, Roy CL, Boxer R. Impact of regionalized care on concordance of plan and preventable adverse events on general medicine services. J Hosp Med. 2016;11(9):620-627. https://doi.org/10.1002/jhm.2566.
15. O’Leary KJ, Wayne DB, Landler MP, et al. Impact of localizing physicians to hospital units on nurse—physician communication and agreement on the plan of care. J Gen Intern Med. 2009;24(11):1223-1227. https://doi.org/10.1007/s11606-009-1113-7.
16. Singh S, Tarima S, Rana V, et al. Impact of localizing general medical teams to a single nursing unit. J Hosp Med. 2012;7(7):551-556. https://doi.org/10.1002/jhm.1948.
17. Singh S, Fletcher KE. A qualitative evaluation of geographical localization of hospitalists: how unintended consequences may impact quality. J Gen Intern Med. 2014;29(7):1009-1016. https://doi.org/10.1007/s11606-014-2780-6.
18. Kara A, Johnson CS, Hui SL, Kashiwagi D. Hospital-based clinicians’ perceptions of geographic cohorting: identifying opportunities for improvement. Am J Med Qual. 2018;33(3):303-312. https://doi.org/10.1177/1062860617745123.
19. Lown BA. Seven guiding commitments: making the U.S. healthcare system more compassionate. J Patient Exp. 2014;1(2):6-15. https://doi.org/10.1177/237437431400100203.
20. Wenger N, Méan M, Castioni J, Marques-Vidal P, Waeber G, Garnier A. Allocation of internal medicine resident time in a swiss hospital: a time and motion study of day and evening shifts. Ann Intern Med. 2017;166(8):579-586. https://doi.org/10.7326/m16-2238.
21. Chen L, Guo U, Illipparambil LC, et al. Racing against the clock: internal medicine residents’ time spent on electronic health records. J Graduate Med Educ. 2015;8(1):39-44. https://doi.org/10.4300/jgme-d-15-00240.1.
22. Erickson SM, Rockwern B, Koltov M, McLean R. Putting patients first by reducing administrative tasks in health care: a position paper of the American College of Physicians. Ann Intern Med. 2017;166:659-661. https://doi.org/10.7326/m16-2697.
23. Poissant L, Pereira J, Tamblyn R, Kawasumi Y. The impact of electronic health records on time efficiency of physicians and nurses: a systematic review. J Am Med Inform Assn. 2005;12(5):505-516. https://doi.org/10.1197/jamia.m1700.
24. Coiera E. The science of interruption. Bmj Qual Saf. 2017;21(5):357-360. https://doi.org/10.1136/bmjqs-2012-00078.
25. Chisholm C, Collison E, Nelson D, Cordell W. Emergency department workplace interruptions: are emergency physicians “interrupt-driven” and “multitasking”? Academic Emerg Med. 2000;7(11):1239-1243. https://doi.org/10.1111/j.1553-2712.2000.tb00469.x.
26. Westbrook JI, Ampt A, Kearney L, Rob MI. All in a day’s work: an observational study to quantify how and with whom doctors on hospital wards spend their time. Med J Aust. 2008;188(9):506-509. https://doi.org/10.5694/j.1326-5377.2008.tb01762.x.
27. Westbrook JI, Woods A, Rob MI, Dunsmuir WT, Day RO. Association of interruptions with an increased risk and severity of medication administration errors. Arch Intern Med. 2010;170(8):683-690. https://doi.org/10.1001/archinternmed.2010.65.
28. Weigl M, Müller A, Angerer P, Hoffmann F. Workflow interruptions and mental workload in hospital pediatricians: an observational study. BMC Health Serv Res. 2014;14(1):433. https://doi.org/10.1186/1472-6963-14-433.
29. Shojania KG, Wald H, Gross R. Understanding medical error and improving patient safety in the inpatient setting. Med Clin N Am. 2002;86(4):847-867. https://doi.org/10.1016/s0025-7125(02)00016-0.
30. Kara A, Johnson CS, Hui SL, Kashiwagi D. Hospital-based clinicians’ perceptions of geographic cohorting: identifying opportunities for improvement. J Med Internet Res. 2017;6(3):106286061774512. https://doi.org/10.2196/jmir.6.3.e34.
31. Michtalik HJ, Pronovost PJ, Marsteller JA, Spetz J, Brotman DJ. Developing a model for attending physician workload and outcomes. Jama Intern Med. 2013;173(11):1026-1028. https://doi.org/10.1001/jamainternmed.2013.405.
© 2019 Society of Hospital Medicine
Off Target But Hitting the Mark
A 32-year-old woman presented to the emergency department (ED) with 3 months of abdominal pain and 1 week of vomiting.
The differential diagnosis of abdominal pain is broad. This presentation could be caused by disorders of the gastrointestinal (GI), gynecologic, urinary, or, less likely, the neuromuscular systems. The presence of vomiting supports a GI cause. Pregnancy should be excluded in any woman of childbearing age presenting with abdominal pain.
Characteristics of the pain, including location, temporal characteristics, severity, and aggravating and alleviating factors, can narrow the differential diagnosis. The past medical history, including prior surgeries, menstrual, and obstetric history, is also critical.
Approximately 3 months prior to presentation, she reported a tick bite that had evolved into a circumferential targetoid rash. Her primary care provider performed serologic testing for Lyme disease, which was negative, and prescribed doxycycline, which she stopped after a week because of nausea and diffuse, achy, and constant abdominal pain. After initial improvement, symptoms recurred a week prior to presentation. The nausea was now associated with intractable vomiting and anorexia. She denied hematemesis or coffee ground emesis. Her abdominal pain intensified and radiated to her back. She lost 10 pounds over the past week. She denied headache, constipation, diarrhea, blood per rectum, melena, dysuria, vaginal discharge, or rash. She reported chills and temperatures up to 37.8 ° C at home.
She had a history of migraine headaches for which she took ibuprofen occasionally but took no other prescription or over-the-counter medications. She had never smoked, consumed 2 alcoholic beverages a month, and denied illicit drug use. She lived with her boyfriend on a farm in Indiana where she raised chickens, rabbits, and ducks.
The patient dates the onset of nausea and abdominal pain to a course of doxycycline, presumably prescribed for early Lyme disease, which was stopped after only 1 week. GI side effects, including nausea, vomiting, and upper abdominal pain, are common with doxycycline and may account for the early symptoms. However, these symptoms typically resolve promptly with drug discontinuation. Doxycycline may rarely cause esophageal and gastric ulcers, which could explain her symptoms.
Fewer than half of patients with erythema migrans caused by Lyme disease are seropositive at presentation, as there has been insufficient time for antibodies to develop. Lyme disease typically affects the skin, joints, heart, and nervous system and only rarely affects the GI tract. Acute Lyme disease can cause intestinal pseudoobstruction, splenomegaly, and mild hepatitis. Although Lyme disease is unlikely to be the cause of the current symptoms, serologic testing should be repeated and should be positive if the patient now has early disseminated disease.
Patients with Lyme disease are occasionally coinfected with a second organism. Ixodes scapularis, the tick that transmits Lyme disease in the Northeast and Midwest, can be coinfected with Babesia microti, a red cell parasite. Babesiosis can persist for months and presents with fever, malaise, and many other nonspecific symptoms, including some that this patient has: anorexia, weight loss, abdominal pain, and vomiting.
The history of migraine and intractable vomiting suggests the possibility of cyclic vomiting syndrome. This syndrome is characterized by episodic bouts of vomiting lasting from hours to as long as a week. The vomiting is often accompanied by abdominal pain and occasionally headaches. Episodes are separated by asymptomatic periods that may last months. Cyclic vomiting syndrome can occur at any age but is more common in children, those with a personal or family history of migraines, and heavy users of cannabis. At least 3 stereotypical episodes are required to make the diagnosis, so a history of prior similar symptoms should be explored.
The differential diagnosis of abdominal pain and vomiting should stay broad until a comprehensive physical exam and initial laboratory tests are performed. Volume status should be assessed by estimating jugular venous pressure and by obtaining supine and standing blood pressure measurements. The abdomen should be examined carefully, and the presence or absence of hepatomegaly, splenomegaly, masses, and ascites should be specifically noted. The presence of bradycardia, oligoarticular arthritis, or neuropathy could provide supporting evidence for Lyme disease. Pregnancy is less likely given the diffuse and persistent nature of the pain but should still be excluded.
On physical examination, she was distressed, writhing on the bed, and appearing comfortable only on her side with her knees flexed. Her temperature was 36.5 ° C, heart rate 83 beats per minute, respiratory rate 18 breaths per minute, blood pressure 143/77 mmHg, and oxygen saturation 94% while breathing ambient air. Her abdomen was diffusely tender, most markedly in the epigastrium. Abdominal rigidity, rebound tenderness, and costovertebral tenderness were absent. There was no rash; the previously reported targetoid skin lesion was no longer present. The remainder of the exam was normal.
Laboratory evaluation showed a white count of 7900/mm3, hemoglobin 14.3 gm/dL with normocytic indices, and a platelet count of 175,000/mm3. Sodium was 130 mmol/L, potassium was 3.1 mmol/L, bicarbonate 26 mmol/L, blood urea nitrogen 15 mg/dL, creatinine 0.6 mg/dL, and glucose 92 mg/dL. Serum calcium, aspartate aminotransferase, alanine aminotransferase, bilirubin, and lipase were normal. A urine pregnancy test was negative. Urine analysis was negative for nitrites and leukocyte esterase. Abdominal and pelvic computed tomography (CT) scan with intravenous (IV) contrast performed 3 days prior at an outside ED revealed a 3.4 centimeter left ovarian cyst. A subsequent transvaginal ultrasound was negative for cyst torsion and confirmed appropriate placement of an intrauterine device.
The absence of abdominal rigidity and rebound tenderness does not exclude peritonitis. A normal white blood cell count also does not reliably exclude serious intraabdominal pathology. However, the CT scan argues strongly against many common causes of abdominal pain, including appendicitis, diverticulitis, perforated ulcer, intestinal obstruction, and malignancy, assuming the symptoms have not changed since it was performed.
The patient’s laboratory studies argue against biliary obstruction, pancreatitis, pregnancy, hypercalcemia, and ongoing urinary tract infection. Patients with functional gallbladder disorders may have normal laboratory and CT findings but typically have recurrent, biliary-colic-type pain. The low serum potassium, a high blood urea nitrogen to creatinine ratio, and a low serum sodium reflect her significant vomiting. The hyponatremia is consistent with the appropriate release of antidiuretic hormone (ADH) in the setting of volume depletion. She should receive isotonic fluids plus potassium in addition to symptomatic treatment of pain and nausea. Given the severity and duration of symptoms, an esophagogastroduodenoscopy (EGD) should be performed to exclude GI mucosal disease, including peptic ulcer disease and gastritis, which may not be evident on the CT scan.
Additional diagnoses should be considered at this point. This patient has exposure to chickens, ducks, rabbits, and ticks as well as reported chills and mild temperature elevation at home. Tularemia, which can be transmitted by tick bites or exposure to infected rabbits, can cause a prolonged illness. Some patients have abdominal pain, anorexia, nausea, and weight loss, although fever is usually more prominent. Tularemia is uncommon and most frequently seen in the south-central part of the United States but has been reported throughout the country. She should be queried regarding additional exposures, including well water to assess her risk for Campylobacter infection.
Opiate withdrawal can present with pain and vomiting, but she reports no opiate use and lacks other findings such pupillary dilation or piloerection. Given the prevalence of opiate abuse, however, a toxicology screen should be performed. Hypercalcemia and diabetic ketoacidosis as metabolic causes of abdominal pain have been ruled out by her laboratory values. If no other cause is identified, other metabolic etiologies like Addison disease, familial Mediterranean fever, or porphyria should be considered.
Cyclic vomiting syndrome should still be on the differential. It is a diagnosis of exclusion requiring a history of recurrent, stereotypical episodes, which should be explicitly explored.
The patient was admitted to a medical unit by the hospitalist service and received IV normal saline, parenteral potassium, and IV pantoprazole. She underwent an EGD that revealed minor erosions in the antrum of the stomach. Biopsies were obtained.
Seven hours after the endoscopy, the patient had a brief period of confusion followed by a generalized tonic-clonic seizure lasting 1 minute. A head CT without contrast was negative for any focal abnormality. Repeat laboratory evaluation revealed that serum sodium was 125 mmol/L, and serum glucose was 113 mg/dL. She was transferred to the progressive care unit and received IV levetiracetam.
The endoscopy excluded structural abnormalities of the stomach and duodenum. The patient now has an additional problem, seizure, which needs to be incorporated in the diagnostic reasoning.
Seizures can be caused by the rapid development of severe hyponatremia, with serum sodium levels usually less than 120 mmol/L. Seizures caused by hyponatremia are typically preceded by headache and lethargy, as the intracellular movement of excess water causes cerebral edema. Hyponatremia is unlikely to be the cause of her seizure but should nevertheless be evaluated with a urine sodium concentration and serum and urine osmolality. If she is euvolemic, the IV fluids should be stopped and her free water intake should be restricted to avoid worsening the hyponatremia, as it is potentially caused by the syndrome of inappropriate ADH (SIADH).
There are many other possible causes for new onset seizures in adults, including brain tumor, head trauma, alcohol withdrawal, medications, and central nervous system infection, including Lyme disease. Lyme serologies should be repeated.
In this patient, it is likely that the seizure is a manifestation of the same illness that is causing her vomiting and abdominal pain. Seizure is not a feature of cyclic vomiting syndrome in adults. It is also not a feature of tularemia, adrenal insufficiency, or opioid withdrawal.
Acute intermittent porphyria (AIP) can cause both abdominal and neurologic problems. Hyponatremia is common during acute attacks, caused by either the inappropriate release of ADH or the appropriate release of the hormone if there is fluid loss. AIP is a rare diagnosis but could explain the uncommon combination of abdominal pain, vomiting, seizure, and hyponatremia. A spot urine porphobilinogen test should be sent to assess for AIP.
Additional laboratory studies were sent. Serum osmolality was 269 mosm/kg with a corresponding urine osmolality of 699 mosm/kg. A random urine sodium was 145 mEq/L. Thyroid stimulating hormone and cosyntropin stimulating testing were normal. IgM and IgG antibodies to Borrelia burgdorferi were negative. Urine porphobilinogen was sent. An electroencephalogram did not reveal epileptiform discharges. Magnetic resonance imaging (MRI) of the brain was significant for T2/FLAIR hyperintensity in the cortex and subcortical white matter of the occipital lobes bilaterally. Hypertonic saline and fluid restriction were initiated.
The patient’s labs are consistent with SIADH. Excessive ADH release because of volume depletion and consequent hyponatremia should have improved rapidly with the administration of saline. The high urine sodium suggests that she is now volume replete, while the high urine osmolality is consistent with the presence of excessive ADH in the absence of appropriate stimuli. In the context of normal thyroid and adrenal function, the hyponatremia is likely due to the SIADH.
Negative serologic testing for Lyme disease, 3 months after the onset of rash, excludes this diagnosis.
The MRI findings are consistent with posterior reversible encephalopathy syndrome (PRES), a clinicoradiographic syndrome of headache, altered mental status, seizure, and/or vision loss with associated white matter abnormalities of the posterior cerebral hemispheres. PRES has been reported with AIP as well as other disorders, most commonly hypertensive encephalopathy, eclampsia, and immunosuppressive drug use.
The patient’s sodium improved with fluid restriction and the administration of hypertonic saline. There was no recurrence of seizure activity. Amlodipine was initiated for blood pressure readings as high as 156/106 mmHg. A hepatobiliary scan revealed a gallbladder ejection fraction of 13%. Biopsies from her endoscopy revealed nonspecific inflammation without the presence of Helicobacter pylori. The patient was discharged home 7 days after admission after stabilization of serum sodium, improvement in her abdominal pain, and tolerance of oral intake. A plan was made for outpatient cholecystectomy.
Many causes of abdominal pain have been excluded and the remaining diagnostic possibility, porphyria, is rare. The clinicians have revisited their differential and considered other causes of abdominal pain, including functional gallbladder disorders. However, chronic cholecystitis (or functional gallbladder disorder) is not this patient’s primary problem. The diffuse, severe, and constant abdominal pain prior to admission is not typical of biliary pain, and many medical conditions and drugs, including amlodipine, can lead to a positive hepatobiliary scan. Chronic cholecystitis would not explain her seizure.
AIP remains at the top of the differential for this young woman. A urine porphobilinogen has been sent and must be followed up prior to any further workup or surgery.
One week after discharge, the patient’s urine porphobilinogen resulted at 172.8 mCmol/ (upper limits of normal 8.8). Sequencing analysis for genes coding the enzymes involved in the synthetic pathway for heme were sent. Hydroxymethylbilane synthase, coproporphyrinogen oxidase, and protoporphyrinogen oxidase mutation assays were all normal. Despite the normal genetic assays, the diagnosis of AIP was made on the basis of the clinical presentation and elevated urine porphobilinogen. The patient was referred to a hematologist and initiated on oral glucose supplements and hematin infusions.
DISCUSSION
Although abdominal pain has a broad differential, the combination of abdominal pain and neurologic or psychiatric symptoms should suggest the possibility of porphyria, especially if symptoms are recurrent or unexplained. The porphyrias are a group of disorders caused by defects in the synthetic pathway of heme, leading to an overproduction and accumulation of precursors. Heme is a component of multiple proteins, including hemoglobin, myoglobin, and the cytochrome P450 enzymes. Although it is synthesized in all tissues, the bone marrow and liver are the organs most actively involved. The porphyrias can be classified according to the primary site of the overproduction and accumulation of heme precursors (liver vs bone marrow). Although there is overlap between the 2 groups, hepatic porphyrias often present with acute neurovisceral symptoms, while the erythropoietic porphyrias often cause cutaneous photosensitivity.1
AIP is the most common hepatic porphyria with a prevalence of 1 in 20,000 in Caucasians of Western European descent.1 AIP is caused by a defect in the gene that encodes porphobilinogen deaminase, leading to the accumulation of porphobilinogen.1 The cardinal manifestation is an acute porphyric attack. While the precise mechanisms underlying the symptoms are unknown, the accumulating metabolites may be directly neurotoxic.2 Attacks are precipitated by factors that induce heme synthesis, including caloric restriction, alcohol, and certain medications, particularly those that upregulate cyP450. The most commonly implicated drugs are anesthetics, antiepileptics, sulfonamides, rifampin, and estrogen and progesterone. Attacks can also be precipitated by changes in endogenous sex hormone levels, like the increase in progesterone seen in the luteal phase of the menstrual cycle, which may account for the higher incidence of symptomatic attacks in women.3
Acute attacks of AIP may have a wide variety of presentations; the disease was referred to as the “little imitator” in the early 20th century.4 The most common symptom is acute, severe abdominal pain, which may mimic an acute abdomen. Because the pain is neuropathic rather than inflammatory, abdominal tenderness, rebound, fever, and leukocytosis are usually absent, as they were in this patient. Abdominal pain is often accompanied by neuropsychiatric symptoms, including sensory and motor neuropathy, anxiety, hallucinations, delirium, and altered level of consciousness. Seizure occurs in 20% of cases. Involvement of the autonomic nervous system causes tachycardia and new onset hypertension in the majority of patients as well as restlessness and tremor. Hyponatremia, mediated by the syndrome of inappropriate ADH secretion, occurs in nearly a third of patients.5,6 MRI findings consistent with PRES have also been described in AIP.7
The diagnosis of AIP is often delayed; diagnosis later in the disease course is associated with a poorer prognosis.8 Reported intervals between presentation and diagnosis range from several months to as long as 20 years.9 Associating the use of medications, caloric restriction, or the menstrual cycle with the exacerbation of symptoms or darkening of urine can help prompt an earlier diagnosis.6
AIP can be diagnosed by detecting a greater than 5-fold elevation of urinary porphobilinogen excretion in conjunction with the typical symptoms of an acute attack.5 Renal dysfunction causes urinary excretion of PBG to fall and serum levels to rise.10 Serum PBG levels should therefore be sent when AIP is suspected in the setting of renal dysfunction. The primary role of genetic testing in a patient who has AIP confirmed clinically and biochemically is to assist in genetic counseling and to identify asymptomatic family members.11 Genetic testing is not required to confirm the diagnosis and does not help prognosticate. It is unusual that a mutation was not detected in this case, as the current sensitivity of genetic testing is 97% to 100%.11
There are 4 principles of management of an acute porphyric attack. First, any precipitating factors such as medications should be stopped. Second, abdominal pain should be treated appropriately with opioids, if necessary. Third, if autonomic dysfunction is present, beta-blockers or clonidine should be given to treat hypertension.5 Finally, glucose and/or hemin should be administered to downregulate aminolevulinic acid (ALA) synthase by negative feedback. Downregulation of ALA synthase decreases the accumulation of the neurotoxic porphyrin precursors ALA and PBG.5 For patients with mild symptoms, glucose alone (300-500 g/d) may be enough to abort the attack.12 This can be achieved via a high-carbohydrate diet in those able to tolerate oral intake or via continuous infusions of dextrose containing fluids.5 For more severe attacks with associated polyneuropathy, respiratory muscle weakness, or seizures, or for attacks that are not resolving, heme preparations dosed at 3 to 4 mg/kg/d for 3 to 4 days are indicated.5
The recent diagnosis of acute Lyme disease was a distractor in this presentation. In Lyme endemic areas, patients with erythema migrans are treated based on the clinical presentation rather than serologic testing.13 Although this patient took only 1 week of doxycycline, testing during this hospitalization showed that she had either been cured early or had not had Lyme disease in the first place. There is no known association between Lyme disease and the porphyrias, and doxycycline is not a common precipitant of AIP attacks.14 However, the GI side effects of doxycycline may have decreased caloric intake and ultimately provoked the patient’s first attack of AIP. The clinicians in this case appropriately avoided the “target” but hit the mark by correctly diagnosing AIP.
KEY POINTS
- Consider AIP in patients with unexplained abdominal pain, especially when accompanied by neuropsychiatric symptoms and autonomic lability.
- Diagnose AIP by sending a urine PBG during a suspected acute attack.
- Treat AIP acutely by removing precipitants, treating abdominal pain, and initiating dextrose-containing fluids and hemin infusions to downregulate ALA synthase.
Acknowledgments
The authors thank the patient who enthusiastically supported the writing of this report.
Disclosure
Warren Gavin, MD has disclosed participation in expert testimony. The authors have no financial or other conflicts of interest to disclose.
1. Desnick RJ, Balwani M. The Porphyrias. In: Kasper D, Fauci A, Hauser S, Longo D, Jameson J, Loscalzo J, eds. Harrison’s Principles of Internal Medicine, 19th Edition. New York: McGraw-Hill; 2015. http://accessmedicine.mhmedical.com.proxy.medlib.uits.iu.edu/content.aspx?bookid=1130&Sectionid=79754263. Accessed June 14, 2016.
2. Bissell DM, Lai JC, Meister RK, Blanc PD. Role of Delta-aminolevulinic Acid in the Symptoms of Acute Porphyria. Am J Med. 2015;128(3):313-317. PubMed
3. Bonkovsky HL, Guo JT, Hou W, Li T, Narang T, Thapar M. Porphyrin and Heme Metabolism and the Porphyrias. Compr Physiol. 2013;3(1):365-401. PubMed
4. Crimlisk HL. The little imitator--porphyria: a neuropsychiatric disorder. J Neurol Neurosurg Psychiatry. 1997;62(4):319-328. PubMed
5. Pischik E, Kauppinen R. An update of clinical management of acute intermittent porphyria. Appl Clin Genet. 2015;8:201-214. PubMed
6. Ventura P, Cappellini MD, Biolcati G, Guida CC, Rocchi E; Gruppo Italiano Porfiria (GrIP). A challenging diagnosis for potential fatal diseases: recommendations for diagnosing acute porphyrias. Eur J Intern Med. 2014;25(6):497-505. PubMed
7. Dagens A, Gilhooley MJ. Acute intermittent porphyria leading to posterior reversible encephalopathy syndrome (PRES): a rare cause of abdominal pain and seizures. BMJ Case Rep. 2016:bcr2016215350. PubMed
8. Pischik E, Bulyanitsa A, Kazakov V, Kauppinen R. Clinical features predictive of a poor prognosis in acute porphyria. J Neurol. 2004;251(12):1538-1541. PubMed
9. Sack GH. Acute intermittent porphyria. JAMA. 1990;264(10):1290-1293. PubMed
10. Sardh E, Andersson DEH, Henrichson A, Harper P. Porphyrin precursors and porphyrins in three patients with acute intermittent porphyria and end-stage renal disease under different therapy regimes. Cell Mol Biol (Noisy-le-grand). 2009;55(1):66-71. PubMed
11. Whatley SD, Badminton MN. Role of genetic testing in the management of patients with inherited porphyria and their families. Ann Clin Biochem. 2013;50(3):204-216. PubMed
12. Anderson KE, Bloomer JR, Bonkovsky HL, et al. Recommendations for the diagnosis and treatment of the acute porphyrias. Ann Intern Med. 2005;142(6):439-450. PubMed
13. Wormser GP, Dattwyler RJ, Shapiro ED, et al. The clinical assessment, treatment, and prevention of lyme disease, human granulocytic anaplasmosis, and babesiosis: clinical practice guidelines by the Infectious Diseases Society of America. Clin Infect Dis. 2006;43(9):1089-1134. PubMed
14. American Porphyria Foundation. Drug database. http://www.porphyriafoundation.com/drug-database. Accessed July 21, 2017.
A 32-year-old woman presented to the emergency department (ED) with 3 months of abdominal pain and 1 week of vomiting.
The differential diagnosis of abdominal pain is broad. This presentation could be caused by disorders of the gastrointestinal (GI), gynecologic, urinary, or, less likely, the neuromuscular systems. The presence of vomiting supports a GI cause. Pregnancy should be excluded in any woman of childbearing age presenting with abdominal pain.
Characteristics of the pain, including location, temporal characteristics, severity, and aggravating and alleviating factors, can narrow the differential diagnosis. The past medical history, including prior surgeries, menstrual, and obstetric history, is also critical.
Approximately 3 months prior to presentation, she reported a tick bite that had evolved into a circumferential targetoid rash. Her primary care provider performed serologic testing for Lyme disease, which was negative, and prescribed doxycycline, which she stopped after a week because of nausea and diffuse, achy, and constant abdominal pain. After initial improvement, symptoms recurred a week prior to presentation. The nausea was now associated with intractable vomiting and anorexia. She denied hematemesis or coffee ground emesis. Her abdominal pain intensified and radiated to her back. She lost 10 pounds over the past week. She denied headache, constipation, diarrhea, blood per rectum, melena, dysuria, vaginal discharge, or rash. She reported chills and temperatures up to 37.8 ° C at home.
She had a history of migraine headaches for which she took ibuprofen occasionally but took no other prescription or over-the-counter medications. She had never smoked, consumed 2 alcoholic beverages a month, and denied illicit drug use. She lived with her boyfriend on a farm in Indiana where she raised chickens, rabbits, and ducks.
The patient dates the onset of nausea and abdominal pain to a course of doxycycline, presumably prescribed for early Lyme disease, which was stopped after only 1 week. GI side effects, including nausea, vomiting, and upper abdominal pain, are common with doxycycline and may account for the early symptoms. However, these symptoms typically resolve promptly with drug discontinuation. Doxycycline may rarely cause esophageal and gastric ulcers, which could explain her symptoms.
Fewer than half of patients with erythema migrans caused by Lyme disease are seropositive at presentation, as there has been insufficient time for antibodies to develop. Lyme disease typically affects the skin, joints, heart, and nervous system and only rarely affects the GI tract. Acute Lyme disease can cause intestinal pseudoobstruction, splenomegaly, and mild hepatitis. Although Lyme disease is unlikely to be the cause of the current symptoms, serologic testing should be repeated and should be positive if the patient now has early disseminated disease.
Patients with Lyme disease are occasionally coinfected with a second organism. Ixodes scapularis, the tick that transmits Lyme disease in the Northeast and Midwest, can be coinfected with Babesia microti, a red cell parasite. Babesiosis can persist for months and presents with fever, malaise, and many other nonspecific symptoms, including some that this patient has: anorexia, weight loss, abdominal pain, and vomiting.
The history of migraine and intractable vomiting suggests the possibility of cyclic vomiting syndrome. This syndrome is characterized by episodic bouts of vomiting lasting from hours to as long as a week. The vomiting is often accompanied by abdominal pain and occasionally headaches. Episodes are separated by asymptomatic periods that may last months. Cyclic vomiting syndrome can occur at any age but is more common in children, those with a personal or family history of migraines, and heavy users of cannabis. At least 3 stereotypical episodes are required to make the diagnosis, so a history of prior similar symptoms should be explored.
The differential diagnosis of abdominal pain and vomiting should stay broad until a comprehensive physical exam and initial laboratory tests are performed. Volume status should be assessed by estimating jugular venous pressure and by obtaining supine and standing blood pressure measurements. The abdomen should be examined carefully, and the presence or absence of hepatomegaly, splenomegaly, masses, and ascites should be specifically noted. The presence of bradycardia, oligoarticular arthritis, or neuropathy could provide supporting evidence for Lyme disease. Pregnancy is less likely given the diffuse and persistent nature of the pain but should still be excluded.
On physical examination, she was distressed, writhing on the bed, and appearing comfortable only on her side with her knees flexed. Her temperature was 36.5 ° C, heart rate 83 beats per minute, respiratory rate 18 breaths per minute, blood pressure 143/77 mmHg, and oxygen saturation 94% while breathing ambient air. Her abdomen was diffusely tender, most markedly in the epigastrium. Abdominal rigidity, rebound tenderness, and costovertebral tenderness were absent. There was no rash; the previously reported targetoid skin lesion was no longer present. The remainder of the exam was normal.
Laboratory evaluation showed a white count of 7900/mm3, hemoglobin 14.3 gm/dL with normocytic indices, and a platelet count of 175,000/mm3. Sodium was 130 mmol/L, potassium was 3.1 mmol/L, bicarbonate 26 mmol/L, blood urea nitrogen 15 mg/dL, creatinine 0.6 mg/dL, and glucose 92 mg/dL. Serum calcium, aspartate aminotransferase, alanine aminotransferase, bilirubin, and lipase were normal. A urine pregnancy test was negative. Urine analysis was negative for nitrites and leukocyte esterase. Abdominal and pelvic computed tomography (CT) scan with intravenous (IV) contrast performed 3 days prior at an outside ED revealed a 3.4 centimeter left ovarian cyst. A subsequent transvaginal ultrasound was negative for cyst torsion and confirmed appropriate placement of an intrauterine device.
The absence of abdominal rigidity and rebound tenderness does not exclude peritonitis. A normal white blood cell count also does not reliably exclude serious intraabdominal pathology. However, the CT scan argues strongly against many common causes of abdominal pain, including appendicitis, diverticulitis, perforated ulcer, intestinal obstruction, and malignancy, assuming the symptoms have not changed since it was performed.
The patient’s laboratory studies argue against biliary obstruction, pancreatitis, pregnancy, hypercalcemia, and ongoing urinary tract infection. Patients with functional gallbladder disorders may have normal laboratory and CT findings but typically have recurrent, biliary-colic-type pain. The low serum potassium, a high blood urea nitrogen to creatinine ratio, and a low serum sodium reflect her significant vomiting. The hyponatremia is consistent with the appropriate release of antidiuretic hormone (ADH) in the setting of volume depletion. She should receive isotonic fluids plus potassium in addition to symptomatic treatment of pain and nausea. Given the severity and duration of symptoms, an esophagogastroduodenoscopy (EGD) should be performed to exclude GI mucosal disease, including peptic ulcer disease and gastritis, which may not be evident on the CT scan.
Additional diagnoses should be considered at this point. This patient has exposure to chickens, ducks, rabbits, and ticks as well as reported chills and mild temperature elevation at home. Tularemia, which can be transmitted by tick bites or exposure to infected rabbits, can cause a prolonged illness. Some patients have abdominal pain, anorexia, nausea, and weight loss, although fever is usually more prominent. Tularemia is uncommon and most frequently seen in the south-central part of the United States but has been reported throughout the country. She should be queried regarding additional exposures, including well water to assess her risk for Campylobacter infection.
Opiate withdrawal can present with pain and vomiting, but she reports no opiate use and lacks other findings such pupillary dilation or piloerection. Given the prevalence of opiate abuse, however, a toxicology screen should be performed. Hypercalcemia and diabetic ketoacidosis as metabolic causes of abdominal pain have been ruled out by her laboratory values. If no other cause is identified, other metabolic etiologies like Addison disease, familial Mediterranean fever, or porphyria should be considered.
Cyclic vomiting syndrome should still be on the differential. It is a diagnosis of exclusion requiring a history of recurrent, stereotypical episodes, which should be explicitly explored.
The patient was admitted to a medical unit by the hospitalist service and received IV normal saline, parenteral potassium, and IV pantoprazole. She underwent an EGD that revealed minor erosions in the antrum of the stomach. Biopsies were obtained.
Seven hours after the endoscopy, the patient had a brief period of confusion followed by a generalized tonic-clonic seizure lasting 1 minute. A head CT without contrast was negative for any focal abnormality. Repeat laboratory evaluation revealed that serum sodium was 125 mmol/L, and serum glucose was 113 mg/dL. She was transferred to the progressive care unit and received IV levetiracetam.
The endoscopy excluded structural abnormalities of the stomach and duodenum. The patient now has an additional problem, seizure, which needs to be incorporated in the diagnostic reasoning.
Seizures can be caused by the rapid development of severe hyponatremia, with serum sodium levels usually less than 120 mmol/L. Seizures caused by hyponatremia are typically preceded by headache and lethargy, as the intracellular movement of excess water causes cerebral edema. Hyponatremia is unlikely to be the cause of her seizure but should nevertheless be evaluated with a urine sodium concentration and serum and urine osmolality. If she is euvolemic, the IV fluids should be stopped and her free water intake should be restricted to avoid worsening the hyponatremia, as it is potentially caused by the syndrome of inappropriate ADH (SIADH).
There are many other possible causes for new onset seizures in adults, including brain tumor, head trauma, alcohol withdrawal, medications, and central nervous system infection, including Lyme disease. Lyme serologies should be repeated.
In this patient, it is likely that the seizure is a manifestation of the same illness that is causing her vomiting and abdominal pain. Seizure is not a feature of cyclic vomiting syndrome in adults. It is also not a feature of tularemia, adrenal insufficiency, or opioid withdrawal.
Acute intermittent porphyria (AIP) can cause both abdominal and neurologic problems. Hyponatremia is common during acute attacks, caused by either the inappropriate release of ADH or the appropriate release of the hormone if there is fluid loss. AIP is a rare diagnosis but could explain the uncommon combination of abdominal pain, vomiting, seizure, and hyponatremia. A spot urine porphobilinogen test should be sent to assess for AIP.
Additional laboratory studies were sent. Serum osmolality was 269 mosm/kg with a corresponding urine osmolality of 699 mosm/kg. A random urine sodium was 145 mEq/L. Thyroid stimulating hormone and cosyntropin stimulating testing were normal. IgM and IgG antibodies to Borrelia burgdorferi were negative. Urine porphobilinogen was sent. An electroencephalogram did not reveal epileptiform discharges. Magnetic resonance imaging (MRI) of the brain was significant for T2/FLAIR hyperintensity in the cortex and subcortical white matter of the occipital lobes bilaterally. Hypertonic saline and fluid restriction were initiated.
The patient’s labs are consistent with SIADH. Excessive ADH release because of volume depletion and consequent hyponatremia should have improved rapidly with the administration of saline. The high urine sodium suggests that she is now volume replete, while the high urine osmolality is consistent with the presence of excessive ADH in the absence of appropriate stimuli. In the context of normal thyroid and adrenal function, the hyponatremia is likely due to the SIADH.
Negative serologic testing for Lyme disease, 3 months after the onset of rash, excludes this diagnosis.
The MRI findings are consistent with posterior reversible encephalopathy syndrome (PRES), a clinicoradiographic syndrome of headache, altered mental status, seizure, and/or vision loss with associated white matter abnormalities of the posterior cerebral hemispheres. PRES has been reported with AIP as well as other disorders, most commonly hypertensive encephalopathy, eclampsia, and immunosuppressive drug use.
The patient’s sodium improved with fluid restriction and the administration of hypertonic saline. There was no recurrence of seizure activity. Amlodipine was initiated for blood pressure readings as high as 156/106 mmHg. A hepatobiliary scan revealed a gallbladder ejection fraction of 13%. Biopsies from her endoscopy revealed nonspecific inflammation without the presence of Helicobacter pylori. The patient was discharged home 7 days after admission after stabilization of serum sodium, improvement in her abdominal pain, and tolerance of oral intake. A plan was made for outpatient cholecystectomy.
Many causes of abdominal pain have been excluded and the remaining diagnostic possibility, porphyria, is rare. The clinicians have revisited their differential and considered other causes of abdominal pain, including functional gallbladder disorders. However, chronic cholecystitis (or functional gallbladder disorder) is not this patient’s primary problem. The diffuse, severe, and constant abdominal pain prior to admission is not typical of biliary pain, and many medical conditions and drugs, including amlodipine, can lead to a positive hepatobiliary scan. Chronic cholecystitis would not explain her seizure.
AIP remains at the top of the differential for this young woman. A urine porphobilinogen has been sent and must be followed up prior to any further workup or surgery.
One week after discharge, the patient’s urine porphobilinogen resulted at 172.8 mCmol/ (upper limits of normal 8.8). Sequencing analysis for genes coding the enzymes involved in the synthetic pathway for heme were sent. Hydroxymethylbilane synthase, coproporphyrinogen oxidase, and protoporphyrinogen oxidase mutation assays were all normal. Despite the normal genetic assays, the diagnosis of AIP was made on the basis of the clinical presentation and elevated urine porphobilinogen. The patient was referred to a hematologist and initiated on oral glucose supplements and hematin infusions.
DISCUSSION
Although abdominal pain has a broad differential, the combination of abdominal pain and neurologic or psychiatric symptoms should suggest the possibility of porphyria, especially if symptoms are recurrent or unexplained. The porphyrias are a group of disorders caused by defects in the synthetic pathway of heme, leading to an overproduction and accumulation of precursors. Heme is a component of multiple proteins, including hemoglobin, myoglobin, and the cytochrome P450 enzymes. Although it is synthesized in all tissues, the bone marrow and liver are the organs most actively involved. The porphyrias can be classified according to the primary site of the overproduction and accumulation of heme precursors (liver vs bone marrow). Although there is overlap between the 2 groups, hepatic porphyrias often present with acute neurovisceral symptoms, while the erythropoietic porphyrias often cause cutaneous photosensitivity.1
AIP is the most common hepatic porphyria with a prevalence of 1 in 20,000 in Caucasians of Western European descent.1 AIP is caused by a defect in the gene that encodes porphobilinogen deaminase, leading to the accumulation of porphobilinogen.1 The cardinal manifestation is an acute porphyric attack. While the precise mechanisms underlying the symptoms are unknown, the accumulating metabolites may be directly neurotoxic.2 Attacks are precipitated by factors that induce heme synthesis, including caloric restriction, alcohol, and certain medications, particularly those that upregulate cyP450. The most commonly implicated drugs are anesthetics, antiepileptics, sulfonamides, rifampin, and estrogen and progesterone. Attacks can also be precipitated by changes in endogenous sex hormone levels, like the increase in progesterone seen in the luteal phase of the menstrual cycle, which may account for the higher incidence of symptomatic attacks in women.3
Acute attacks of AIP may have a wide variety of presentations; the disease was referred to as the “little imitator” in the early 20th century.4 The most common symptom is acute, severe abdominal pain, which may mimic an acute abdomen. Because the pain is neuropathic rather than inflammatory, abdominal tenderness, rebound, fever, and leukocytosis are usually absent, as they were in this patient. Abdominal pain is often accompanied by neuropsychiatric symptoms, including sensory and motor neuropathy, anxiety, hallucinations, delirium, and altered level of consciousness. Seizure occurs in 20% of cases. Involvement of the autonomic nervous system causes tachycardia and new onset hypertension in the majority of patients as well as restlessness and tremor. Hyponatremia, mediated by the syndrome of inappropriate ADH secretion, occurs in nearly a third of patients.5,6 MRI findings consistent with PRES have also been described in AIP.7
The diagnosis of AIP is often delayed; diagnosis later in the disease course is associated with a poorer prognosis.8 Reported intervals between presentation and diagnosis range from several months to as long as 20 years.9 Associating the use of medications, caloric restriction, or the menstrual cycle with the exacerbation of symptoms or darkening of urine can help prompt an earlier diagnosis.6
AIP can be diagnosed by detecting a greater than 5-fold elevation of urinary porphobilinogen excretion in conjunction with the typical symptoms of an acute attack.5 Renal dysfunction causes urinary excretion of PBG to fall and serum levels to rise.10 Serum PBG levels should therefore be sent when AIP is suspected in the setting of renal dysfunction. The primary role of genetic testing in a patient who has AIP confirmed clinically and biochemically is to assist in genetic counseling and to identify asymptomatic family members.11 Genetic testing is not required to confirm the diagnosis and does not help prognosticate. It is unusual that a mutation was not detected in this case, as the current sensitivity of genetic testing is 97% to 100%.11
There are 4 principles of management of an acute porphyric attack. First, any precipitating factors such as medications should be stopped. Second, abdominal pain should be treated appropriately with opioids, if necessary. Third, if autonomic dysfunction is present, beta-blockers or clonidine should be given to treat hypertension.5 Finally, glucose and/or hemin should be administered to downregulate aminolevulinic acid (ALA) synthase by negative feedback. Downregulation of ALA synthase decreases the accumulation of the neurotoxic porphyrin precursors ALA and PBG.5 For patients with mild symptoms, glucose alone (300-500 g/d) may be enough to abort the attack.12 This can be achieved via a high-carbohydrate diet in those able to tolerate oral intake or via continuous infusions of dextrose containing fluids.5 For more severe attacks with associated polyneuropathy, respiratory muscle weakness, or seizures, or for attacks that are not resolving, heme preparations dosed at 3 to 4 mg/kg/d for 3 to 4 days are indicated.5
The recent diagnosis of acute Lyme disease was a distractor in this presentation. In Lyme endemic areas, patients with erythema migrans are treated based on the clinical presentation rather than serologic testing.13 Although this patient took only 1 week of doxycycline, testing during this hospitalization showed that she had either been cured early or had not had Lyme disease in the first place. There is no known association between Lyme disease and the porphyrias, and doxycycline is not a common precipitant of AIP attacks.14 However, the GI side effects of doxycycline may have decreased caloric intake and ultimately provoked the patient’s first attack of AIP. The clinicians in this case appropriately avoided the “target” but hit the mark by correctly diagnosing AIP.
KEY POINTS
- Consider AIP in patients with unexplained abdominal pain, especially when accompanied by neuropsychiatric symptoms and autonomic lability.
- Diagnose AIP by sending a urine PBG during a suspected acute attack.
- Treat AIP acutely by removing precipitants, treating abdominal pain, and initiating dextrose-containing fluids and hemin infusions to downregulate ALA synthase.
Acknowledgments
The authors thank the patient who enthusiastically supported the writing of this report.
Disclosure
Warren Gavin, MD has disclosed participation in expert testimony. The authors have no financial or other conflicts of interest to disclose.
1. Desnick RJ, Balwani M. The Porphyrias. In: Kasper D, Fauci A, Hauser S, Longo D, Jameson J, Loscalzo J, eds. Harrison’s Principles of Internal Medicine, 19th Edition. New York: McGraw-Hill; 2015. http://accessmedicine.mhmedical.com.proxy.medlib.uits.iu.edu/content.aspx?bookid=1130&Sectionid=79754263. Accessed June 14, 2016.
2. Bissell DM, Lai JC, Meister RK, Blanc PD. Role of Delta-aminolevulinic Acid in the Symptoms of Acute Porphyria. Am J Med. 2015;128(3):313-317. PubMed
3. Bonkovsky HL, Guo JT, Hou W, Li T, Narang T, Thapar M. Porphyrin and Heme Metabolism and the Porphyrias. Compr Physiol. 2013;3(1):365-401. PubMed
4. Crimlisk HL. The little imitator--porphyria: a neuropsychiatric disorder. J Neurol Neurosurg Psychiatry. 1997;62(4):319-328. PubMed
5. Pischik E, Kauppinen R. An update of clinical management of acute intermittent porphyria. Appl Clin Genet. 2015;8:201-214. PubMed
6. Ventura P, Cappellini MD, Biolcati G, Guida CC, Rocchi E; Gruppo Italiano Porfiria (GrIP). A challenging diagnosis for potential fatal diseases: recommendations for diagnosing acute porphyrias. Eur J Intern Med. 2014;25(6):497-505. PubMed
7. Dagens A, Gilhooley MJ. Acute intermittent porphyria leading to posterior reversible encephalopathy syndrome (PRES): a rare cause of abdominal pain and seizures. BMJ Case Rep. 2016:bcr2016215350. PubMed
8. Pischik E, Bulyanitsa A, Kazakov V, Kauppinen R. Clinical features predictive of a poor prognosis in acute porphyria. J Neurol. 2004;251(12):1538-1541. PubMed
9. Sack GH. Acute intermittent porphyria. JAMA. 1990;264(10):1290-1293. PubMed
10. Sardh E, Andersson DEH, Henrichson A, Harper P. Porphyrin precursors and porphyrins in three patients with acute intermittent porphyria and end-stage renal disease under different therapy regimes. Cell Mol Biol (Noisy-le-grand). 2009;55(1):66-71. PubMed
11. Whatley SD, Badminton MN. Role of genetic testing in the management of patients with inherited porphyria and their families. Ann Clin Biochem. 2013;50(3):204-216. PubMed
12. Anderson KE, Bloomer JR, Bonkovsky HL, et al. Recommendations for the diagnosis and treatment of the acute porphyrias. Ann Intern Med. 2005;142(6):439-450. PubMed
13. Wormser GP, Dattwyler RJ, Shapiro ED, et al. The clinical assessment, treatment, and prevention of lyme disease, human granulocytic anaplasmosis, and babesiosis: clinical practice guidelines by the Infectious Diseases Society of America. Clin Infect Dis. 2006;43(9):1089-1134. PubMed
14. American Porphyria Foundation. Drug database. http://www.porphyriafoundation.com/drug-database. Accessed July 21, 2017.
© 2018 Society of Hospital Medicine
Identifying an Idle Line for Its Removal
Infections acquired in the hospital are termed healthcare‐associated infections (HAIs) and include central lineassociated blood stream infections (CLABSIs). Among HAIs, CLABSIs cause the highest number of preventable deaths.[1] Central venous catheters (CVCs) or central lines are commonly used in the hospital.[2] Each year their use is linked to 250,000 cases of CLABSIs in the United States.[3] Some CLABSIs may be prevented by the prompt removal of the line.[4] However, CVCs are often retained after their clinical indication has lapsed and are then referred to as idle lines.[5, 6] In this work, we propose and theoretically test a guideline to facilitate the safe removal of an idle line by observing the agreement and disagreement between actual practice and the proposed guideline.
METHODS
Setting
This work was conducted at a large, urban, tertiary care, academic health center in the United States as a collaborative effort to improve quality at our institution.[7]
Design and Patients
The reports linked with the electronic medical records at our institution include a daily, ward‐by‐ward listing of patients who have access other than a peripheral line in place. This central line dashboard accesses the information on intravenous access charted by bedside nurses to create a list of patients on every ward who have any kind of central access. Temporary central venous lines (CVLs), peripherally inserted central catheters (PICCs), ports, and dialysis catheters are all included. The unit charge nurses and managers use this dashboard to facilitate compliance with line care bundles. We used this source to identify patients with either type of CVC (CVLs or PICCs) on 8 days in August 2014, September 2014, and October 2014. Patients were included if they had a CVC and were on a general medical or surgical ward bed on audit day. CVLs at all sites were included (femoral, subclavian, and internal jugular). Patients in an intensive care unit (ICU) or progressive care unit on the day of the audit were excluded. Patients whose catheters were for chemotherapy and those admitted for a transplant or receiving palliative or hospice care were also excluded.
Data Collection
A protocol for data collection was written out, and a training session was held to review definitions, data sources, and methods to ensure consistency. Two authors (M.M. and J.D.) assisted by an experienced clinical nurse specialist collected data on the patients captured on audit days. Each chart was reviewed on the day of the audit, the 2 days preceding the audit day, and then followed until the patient was either discharged from the hospital or transferred to a higher level of care, died, or transitioned to palliative or hospice care. Demographics, details about the line, and the criteria for justified use were extracted from the electronic medical record.
Definitions
Justified and Idle Days
To justify the presence of a CVC on any given day, we used criteria that fell under 3 categories: intravenous (IV) access needs, unstable vitals, or meeting sepsis/systemic inflammatory response syndrome (SIRS) criteria (Table 1). For vital signs, a single abnormal reading was counted as fulfilling criteria for that day. If no criterion for justified use was met, the line was considered idle for that day.
|
| IV access needs |
| Expected duration of IV antibiotics >6 days |
| Administration of TPN |
| Anticipated requirement of home IV medications |
| Requirement of IV medications with documented difficult access |
| Hemorrhage requiring blood transfusions |
| Requiring more than 3 infusions |
| Requiring more than 2 infusions and blood transfusions |
| Abnormal vitals |
| Diastolic blood pressure >120 mm Hg |
| Systolic blood pressure <90 mm Hg |
| Systolic blood pressure >200 mm Hg |
| Heart rate >120 beats per minute |
| Heart rate <50 beats per minute |
| Respiratory rate >30 breaths per minute |
| Respiratory rate <10 breaths per minute |
| Oxygen saturation <90% as measured by pulse oximetry |
| Meeting SIRS criteria (2 or more of the following present) |
| Temp >38C, Temp <36C, heart rate >90 beats per minute, respiratory rate >20 breaths per minute, WBC >12,000/mm3, WBC <1,000/mm3, bandemia >10% |
Qualifying IV access needs were defined similarly to those previously used,[5, 6] whereas those for SIRS followed the current consensus.[8] To determine the number of IV medications or infusions, the medication administration record was reviewed. If 3 or more infusions were found, their compatibility was checked using the same database that nurses use at our institution. Difficult IV access was inferred from the indication for line placement, coupled with the absence of documentation of a peripheral IV. Clinical progress notes were reviewed to extract information on the length of proposed IV antibiotic courses, and discharge instructions were reviewed to verify whether the line was removed prior to discharge or not. The cutoffs for diastolic blood pressure, respiratory rate, and oxygen saturation used to label patients hemodynamically labile are the same as those used by previous authors and also constitute the definition of hypertensive urgency.[5, 9] However, we diverged from the values previously used for tachycardia, bradycardia, and systolic hypotension using heart rates >120 and <50 beats per minute (compared to >130 and <40 beats per minute) and systolics <90 mm Hg (compared to <80 mm Hg) to justify the line.[5] Early warning scores have been used to identify hospitalized ward patients who are at risk for clinical deterioration. Although each score utilizes different thresholds, the risk for clinical deterioration increases as the vitals worsen.[10] Bearing this in mind, the thresholds we elected to use are more clinically conservative and also parallel the nursing call orders currently used at our institution.
Proposed Guideline
We propose the guideline that a CVC may be safely removed the day after the first idle day.
RESULTS
A total of 126 lines were observed in 126 patients. Eighty‐three (65.9%) of the lines were PICCs. The remaining 43 (34.1%) were CVLs. The indications for line placement were distributed between the need for central access, total parenteral nutrition, or antibiotics (Table 2).
| Description | Value |
|---|---|
| |
| Age in yrs mean (SD) | 55.7 (18) |
| Gender, n (%) | |
| Female | 66 (52.4) |
| Male | 60 (47.6) |
| Type of line, n (%) | |
| PICC | 83 (65.9) |
| CVL | 43 (34.1) |
| Indication for line placement, n (%) | |
| Meds requiring central access or TPN | 36 (28.6) |
| Antibiotics | 34 (27.0) |
| Hemodynamic instability | 30 (23.8) |
| Poor access with multiple IV medications | 18 (14.3) |
| Unknown | 8 (6.3) |
| Line removed prior to discharge, n (%) | |
| Yes | 76 (60.3) |
| No | 50 (39.7) |
Out of the 126 patients, 50 (39.7%) were discharged from the hospital, died, were transferred to a higher level of care, or transitioned to palliative or hospice care with the line in place. In the remaining 76 patients, the audit captured 635 days, out of which a line was in place for 522 (82.2%) days. Of these 522 days, the line's presence was justified by our criteria for 351 (67.2%) days. The most common reason for a line to be justified on any given day was the need for antibiotics followed by the presence of SIRS criteria (Table 3). The remaining 171 (32.7%) days were idle.
| Criteria | N | % |
|---|---|---|
| ||
| No. of factors justifying use | ||
| 1 | 184 | 52.4% |
| 2 | 127 | 36.2% |
| >2 | 40 | 11.4 |
| Reason for justifying line* | ||
| Anticipate home or >6 days of antibiotic use | 181 | 51.6 |
| SIRS criteria | 124 | 35.3 |
| TPN | 96 | 27.4 |
| Hemodynamic instability based on hr and bp | 78 | 22.2 |
| Poor access with need for IV medications | 57 | 16.2 |
| Respiratory rate (<10 or >30/minute) | 25 | 7.1 |
| Active hemorrhage requiring transfusions | 12 | 3.4 |
| >3 infusions | 6 | 1.7 |
A comparison of the actual removal of the 76 central lines in practice relative to the proposed guideline of removing it the day following the first idle day is displayed in Figure 1. The central line was removed prior to our proposed guideline in 11 (14.5%) patients, and waiting for an idle day in these patients would have added 46 line days. In almost half the patients (n = 36, 47.4%), the line was removed in agreement with the proposed guideline. None of the patients in whom the line was removed prior to or in accordance with our proposed guideline required a line reinsertion. Line removal was delayed in 29 (38.2%) patients when compared to our proposed guideline. In these patients, following the guideline would have created 122 line‐free days. Most (n = 102, 83.6%) of these potential line‐free days were idle. Twenty (16.4%) were justified, of which half (n = 10) were justified by meeting SIRS criteria.

DISCUSSION
Approximately 1 in every 25 inpatients in the United States has at least 1 HAI on any given day.[11] The case fatality rate from a CLABSI may be as high as 12%, and up to 70% of these infections may be preventable.[1, 12] Interventions successful in decreasing CLABSIs have focused on patients in ICUs.[13] However, CVCs are increasingly prevalent outside the ICU, with over 4.5 million line days in non‐ICU beds reported to the National Healthcare Safety Network in 2012 compared to 2.5 million in 2010.[2, 14] However, adherence rates to infection control practices may be lower on the wards than in the ICUs.[6, 15] Consequently, although the number of CLABSIs has declined over the last decade, most are now occurring outside the ICU.[16] These trends underscore the need to develop strategies aimed at CLABSI prevention on the floors.
Analogous to the life cycle of a urinary catheter described by Meddings et al.,[17] strategies to prevent CLABSIs and other CVC‐related complications may be designed around the life cycle of a CVC. The life cycle starts with insertion and moves on to the maintenance, removal, and possible reinsertion of the line. The process thus starts with the decision to place the line. Over the last decade, this decision making has changed in part due to PICCs. This shift is reflected in PICC prevalence rates: in 2001, 11% of audited central lines were PICCs compared to 56% in 2007.[5, 6] In our audit, 66% of the CVCs were PICCs. This increase in the use of PICCs may be attributable to the ease and safety of their placement coupled with the increased availability of vascular access placement teams.[18] The risk of overuse that may result from such expediency may be countered by adhering to guidelines such as the Michigan Appropriateness Guide for Intravenous Catheters, which provides both clinically detailed guidance and an impetus for reflective decision making around intravenous access.[19]
The placement of CVCs for prolonged parenteral antibiotics may be a particular subset that bears further exploration. Similar to previous reports, we found that a large number of the CVCs were both inserted for and justified by the need for IV antibiotics.[5] Guidelines delineated by the Infectious Diseases Society of America regarding outpatient parenteral antibiotics weigh both the duration of therapy and the antimicrobial's potential for causing phlebitis when recommending the type of intravascular access.[20] Many courses may therefore be completed through peripheral or midline catheters. Developing strong partnerships between infectious disease specialists, hospitalists, and the facilities or home‐care services treating these patients may curtail the use of CVCs for antimicrobial administration.
The main focus of our work is on facilitating the safe removal of CVCs. The risk of CLABSIs increases each day a CVC is in place, and guidelines to prevent CLABSIs include recommendations to promptly remove nonessential catheters.[4, 21] There is also an emerging understanding that the risk of a PICC‐related CLABSI approaches that from a traditional central line in hospitalized patients, and PICCs confer an increased risk of venous thromboembolism.[18, 22] Although nearly half of surveyed hospitalists recently reported leaving PICCs in place until discharge day, our data suggest that this practice may be driven by the trajectory of a patient's recovery as much as by knowledge gaps related to the use of PICCs.[23] In nearly half the instances, clinical practice already mirrors our proposed guideline, with line removal coinciding with both the timing proposed by our guideline and discharge day. However, there is room for improvement, as line removal may have been expedited in the 29 patients in whom the line was retained after the first idle day. Maintaining an awareness of its presence and weighing its risks and benefits daily may facilitate the removal of a CVC. Based on the recent findings that up to a quarter of clinicians are unaware that their patients have a central line, the mere reminder of the presence of a line using such criteria may expedite its removal by triggering a purposeful reassessment of its ongoing need.[24] Premature CVC removal requiring line reinsertion is an unintended consequence that may emerge from the earlier removal of lines. In our sample, none of the patients who had lines removed either prior to or in accordance with our proposed guideline required a line reinsertion. In addition to line reinsertion, delays in laboratory testing and reporting due to the unavailability of access, increased patient discomfort, or increased workload on the bedside nurse or vascular access team must also be considered when implementing strategies aimed at decreasing line days.
We envisage using these criteria to both empower practitioners with knowledge and foster shared accountability between all team members by using a uniform tool. This can occur through partnerships between infection control, clinical nurse specialists, bedside nursing, and physicians. The electronic medical record could be leveraged to scan the record for the criteria and create a notification when the line becomes idle. In alignment with the Michigan Appropriateness Guide for Intravenous Catheters guidelines, we do not support the removal of lines by nursing staff without physician notification.[19] Such principles have been successfully harnessed in strategies to prevent both catheter‐associated urinary tract infections and CLABSIs in ICUs.[13, 25] In light of the complexity surrounding the decision making for CVCs, our criteria were focused on the wards and erred on the side of clinical caution. This clinical conservatism is apparent in the patients in whom lines were removed prior to what our guideline would propose, yet none of the patients required a line reinsertion. As concerns about recrudescent clinical instability may drive decision making around line removal, such conservatism may be warranted initially. However, the fidelity of these criteria in the clinical setting will need prospective validation. In particular, the inclusion of SIRS criteria may have led to an overestimation of justified days. Further studies may be needed to refine the criteria and find a clinical hierarchy that balances the risks and benefits of retaining a central line.
Our work has certain limitations. It is a single center's experience, and our findings may not therefore be generalizable. Except for when the indication for the line was for difficult access, we did not attempt to verify the presence of a peripheral IV. This, in combination with the inclusion of SIRS criteria, likely leads to an underestimation of idle days. In the interest of focusing on patients in whom the decision making around a line would be the least controversial, we did not continue to follow patients who were transferred to a higher level of care. It is possible, however, that these transfers were precipitated by line‐associated complications such as sepsis and would be important to track. We did not measure the agreement between data collectors, although definitions and methodologies were standardized and reviewed prior to data collection. As this was an observational assessment of a proposed guideline, we cannot predict how the recommendations generated by it will be received by clinicians. Although this may prove to be a barrier in adoption, we hope that the conversation it initiates leads to change.
Hospitalists are positioned to potentially influence the entire life cycle of a central line on the floor. Strategies can be enacted at each stage to help decrease the potential of harm from these devices to our patients. Creating and testing criteria and guidelines such as we propose represents just 1 such strategy in a multidisciplinary effort to provide the best possible care we can.
Acknowledgements
The authors thank Jennifer Dunscomb, Kristen Kelly, and their teams, and Deanna Sidwell, Todd Biggerstaff, Joan Miller, Rob Clark, and the tireless providers at Indiana University Health Methodist Hospital for their support.
Disclosures: This work was supported by the Indiana University Health Values Grant for research. The authors have no conflicts of interests to report.
- , , , , , . Estimating the proportion of healthcare‐associated infections that are reasonably preventable and the related mortality and costs. Infect Control Hosp Epidemiol. 2011;32(2):101–114.
- , , , et al. National Healthcare Safety Network (NHSN) report, data summary for 2012, device‐associated module. Am J Infect Control. 2013;41(12):1148–1166.
- , , . The risk of bloodstream infection in adults with different intravascular devices: a systematic review of 200 published prospective studies. Mayo Clin Proc. 2006;81(9):1159–1171.
- , , , et al. Guidelines for the prevention of intravascular catheter‐related infections. Clin Infect Dis. 2011;52(9):e162–e193.
- , , , et al. Temporary central venous catheter utilization patterns in a large tertiary care center: tracking the “idle central venous catheter.” Infect Control Hosp Epidemiol. 2012;33(1):50–57.
- , , , , , . Unnecessary use of central venous catheters: the need to look outside the intensive care unit. Infect Control Hosp Epidemiol. 2004;25(3):266–268.
- IU Health Methodist Hospital website. Available at: http://iuhealth.org/methodist/aboIut. Accessed October 20, 2014.
- , , , et al. Definitions for Sepsis and Organ Failure and Guidelines for the Use of Innovative Therapies in Sepsis. The ACCP/SCCM Consensus Conference Committee. American College of Chest Physicians/Society of Critical Care Medicine. Chest. 2009;136(5 suppl):e28.
- , , , , , . Acute hypertension: a systematic review and appraisal of guidelines. Ochsner J. 2014;14(4):655–663.
- , , . Predicting clinical deterioration in the hospital: the impact of outcome selection. Resuscitation. 2013;84(5):564–568.
- , , , et al. Multistate point‐prevalence survey of health care–associated infections. N Engl J Med. 2014;370(13):1198–1208.
- , , , et al. Estimating health care‐associated infections and deaths in U.S. hospitals, 2002. Public Health Rep. 2007;122(2):160–166.
- , , , et al. An intervention to decrease catheter‐related bloodstream infections in the ICU. N Engl J Med. 2006;355(26):2725–2732.
- , , , et al. Data summary for 2011, device‐associated module. Centers for Disease Control and Prevention. National Healthcare Safety Network (NHSN) Report. Available at: http://www.cdc.gov/nhsn/PDFs/dataStat/NHSN‐Report‐2011‐Data‐Summary.pdf. Published April 1, 2013. Last accessed January 2015.
- , , . Idle central venous catheter‐days pose infection risk for patients after discharge from intensive care. Am J Infect Control. 2014;42(4):453–455.
- , . Update on emerging infections: news from the Centers for Disease Control and Prevention. Vital signs: central line‐associated blood stream infections—United States, 2001, 2008, and 2009. Ann Emerg Med. 2011;58(5):447–451.
- , , , , , . Reducing unnecessary urinary catheter use and other strategies to prevent catheter‐associated urinary tract infection: an integrative review. BMJ Qual Saf. 2014;23(4):277–289.
- , , , , . The risk of bloodstream infection associated with peripherally inserted central catheters compared with central venous catheters in adults: a systematic review and meta‐analysis. Infect Control Hosp Epidemiol. 2013;34(9):908–918.
- , , , et al. The Michigan Appropriateness Guide for Intravenous Catheters (MAGIC): results from a multispecialty panel using the RAND/UCLA Appropriateness Method. Ann Intern Med. 2015;163(6 suppl):S1–S40.
- , , , et al. Practice guidelines for outpatient parenteral antimicrobial therapy. IDSA guidelines. Clin Infect Dis. 2004;38(12):1651–1672.
- , . Nonuniform risk of bloodstream infection with increasing central venous catheter‐days. Infect Control Hosp Epidemiol. 2005;26(8):715–719.
- , , , et al. Risk of venous thromboembolism associated with peripherally inserted central catheters: a systematic review and meta‐analysis. Lancet. 2013;382(9889):311–325.
- , , , , . Hospitalist experiences, practice, opinions, and knowledge regarding peripherally inserted central catheters: results of a national survey. J Hosp Med. 2013;8(11):635–638.
- , , , et al. Do clinicians know which of their patients have central venous catheters? Ann Intern Med. 2014;161(8):562.
- , , , , , . Reducing foley catheter device days in an intensive care unit: using the evidence to change practice. AACN Adv Crit Care. 2006;17(3):272–283.
Infections acquired in the hospital are termed healthcare‐associated infections (HAIs) and include central lineassociated blood stream infections (CLABSIs). Among HAIs, CLABSIs cause the highest number of preventable deaths.[1] Central venous catheters (CVCs) or central lines are commonly used in the hospital.[2] Each year their use is linked to 250,000 cases of CLABSIs in the United States.[3] Some CLABSIs may be prevented by the prompt removal of the line.[4] However, CVCs are often retained after their clinical indication has lapsed and are then referred to as idle lines.[5, 6] In this work, we propose and theoretically test a guideline to facilitate the safe removal of an idle line by observing the agreement and disagreement between actual practice and the proposed guideline.
METHODS
Setting
This work was conducted at a large, urban, tertiary care, academic health center in the United States as a collaborative effort to improve quality at our institution.[7]
Design and Patients
The reports linked with the electronic medical records at our institution include a daily, ward‐by‐ward listing of patients who have access other than a peripheral line in place. This central line dashboard accesses the information on intravenous access charted by bedside nurses to create a list of patients on every ward who have any kind of central access. Temporary central venous lines (CVLs), peripherally inserted central catheters (PICCs), ports, and dialysis catheters are all included. The unit charge nurses and managers use this dashboard to facilitate compliance with line care bundles. We used this source to identify patients with either type of CVC (CVLs or PICCs) on 8 days in August 2014, September 2014, and October 2014. Patients were included if they had a CVC and were on a general medical or surgical ward bed on audit day. CVLs at all sites were included (femoral, subclavian, and internal jugular). Patients in an intensive care unit (ICU) or progressive care unit on the day of the audit were excluded. Patients whose catheters were for chemotherapy and those admitted for a transplant or receiving palliative or hospice care were also excluded.
Data Collection
A protocol for data collection was written out, and a training session was held to review definitions, data sources, and methods to ensure consistency. Two authors (M.M. and J.D.) assisted by an experienced clinical nurse specialist collected data on the patients captured on audit days. Each chart was reviewed on the day of the audit, the 2 days preceding the audit day, and then followed until the patient was either discharged from the hospital or transferred to a higher level of care, died, or transitioned to palliative or hospice care. Demographics, details about the line, and the criteria for justified use were extracted from the electronic medical record.
Definitions
Justified and Idle Days
To justify the presence of a CVC on any given day, we used criteria that fell under 3 categories: intravenous (IV) access needs, unstable vitals, or meeting sepsis/systemic inflammatory response syndrome (SIRS) criteria (Table 1). For vital signs, a single abnormal reading was counted as fulfilling criteria for that day. If no criterion for justified use was met, the line was considered idle for that day.
|
| IV access needs |
| Expected duration of IV antibiotics >6 days |
| Administration of TPN |
| Anticipated requirement of home IV medications |
| Requirement of IV medications with documented difficult access |
| Hemorrhage requiring blood transfusions |
| Requiring more than 3 infusions |
| Requiring more than 2 infusions and blood transfusions |
| Abnormal vitals |
| Diastolic blood pressure >120 mm Hg |
| Systolic blood pressure <90 mm Hg |
| Systolic blood pressure >200 mm Hg |
| Heart rate >120 beats per minute |
| Heart rate <50 beats per minute |
| Respiratory rate >30 breaths per minute |
| Respiratory rate <10 breaths per minute |
| Oxygen saturation <90% as measured by pulse oximetry |
| Meeting SIRS criteria (2 or more of the following present) |
| Temp >38C, Temp <36C, heart rate >90 beats per minute, respiratory rate >20 breaths per minute, WBC >12,000/mm3, WBC <1,000/mm3, bandemia >10% |
Qualifying IV access needs were defined similarly to those previously used,[5, 6] whereas those for SIRS followed the current consensus.[8] To determine the number of IV medications or infusions, the medication administration record was reviewed. If 3 or more infusions were found, their compatibility was checked using the same database that nurses use at our institution. Difficult IV access was inferred from the indication for line placement, coupled with the absence of documentation of a peripheral IV. Clinical progress notes were reviewed to extract information on the length of proposed IV antibiotic courses, and discharge instructions were reviewed to verify whether the line was removed prior to discharge or not. The cutoffs for diastolic blood pressure, respiratory rate, and oxygen saturation used to label patients hemodynamically labile are the same as those used by previous authors and also constitute the definition of hypertensive urgency.[5, 9] However, we diverged from the values previously used for tachycardia, bradycardia, and systolic hypotension using heart rates >120 and <50 beats per minute (compared to >130 and <40 beats per minute) and systolics <90 mm Hg (compared to <80 mm Hg) to justify the line.[5] Early warning scores have been used to identify hospitalized ward patients who are at risk for clinical deterioration. Although each score utilizes different thresholds, the risk for clinical deterioration increases as the vitals worsen.[10] Bearing this in mind, the thresholds we elected to use are more clinically conservative and also parallel the nursing call orders currently used at our institution.
Proposed Guideline
We propose the guideline that a CVC may be safely removed the day after the first idle day.
RESULTS
A total of 126 lines were observed in 126 patients. Eighty‐three (65.9%) of the lines were PICCs. The remaining 43 (34.1%) were CVLs. The indications for line placement were distributed between the need for central access, total parenteral nutrition, or antibiotics (Table 2).
| Description | Value |
|---|---|
| |
| Age in yrs mean (SD) | 55.7 (18) |
| Gender, n (%) | |
| Female | 66 (52.4) |
| Male | 60 (47.6) |
| Type of line, n (%) | |
| PICC | 83 (65.9) |
| CVL | 43 (34.1) |
| Indication for line placement, n (%) | |
| Meds requiring central access or TPN | 36 (28.6) |
| Antibiotics | 34 (27.0) |
| Hemodynamic instability | 30 (23.8) |
| Poor access with multiple IV medications | 18 (14.3) |
| Unknown | 8 (6.3) |
| Line removed prior to discharge, n (%) | |
| Yes | 76 (60.3) |
| No | 50 (39.7) |
Out of the 126 patients, 50 (39.7%) were discharged from the hospital, died, were transferred to a higher level of care, or transitioned to palliative or hospice care with the line in place. In the remaining 76 patients, the audit captured 635 days, out of which a line was in place for 522 (82.2%) days. Of these 522 days, the line's presence was justified by our criteria for 351 (67.2%) days. The most common reason for a line to be justified on any given day was the need for antibiotics followed by the presence of SIRS criteria (Table 3). The remaining 171 (32.7%) days were idle.
| Criteria | N | % |
|---|---|---|
| ||
| No. of factors justifying use | ||
| 1 | 184 | 52.4% |
| 2 | 127 | 36.2% |
| >2 | 40 | 11.4 |
| Reason for justifying line* | ||
| Anticipate home or >6 days of antibiotic use | 181 | 51.6 |
| SIRS criteria | 124 | 35.3 |
| TPN | 96 | 27.4 |
| Hemodynamic instability based on hr and bp | 78 | 22.2 |
| Poor access with need for IV medications | 57 | 16.2 |
| Respiratory rate (<10 or >30/minute) | 25 | 7.1 |
| Active hemorrhage requiring transfusions | 12 | 3.4 |
| >3 infusions | 6 | 1.7 |
A comparison of the actual removal of the 76 central lines in practice relative to the proposed guideline of removing it the day following the first idle day is displayed in Figure 1. The central line was removed prior to our proposed guideline in 11 (14.5%) patients, and waiting for an idle day in these patients would have added 46 line days. In almost half the patients (n = 36, 47.4%), the line was removed in agreement with the proposed guideline. None of the patients in whom the line was removed prior to or in accordance with our proposed guideline required a line reinsertion. Line removal was delayed in 29 (38.2%) patients when compared to our proposed guideline. In these patients, following the guideline would have created 122 line‐free days. Most (n = 102, 83.6%) of these potential line‐free days were idle. Twenty (16.4%) were justified, of which half (n = 10) were justified by meeting SIRS criteria.
DISCUSSION
Approximately 1 in every 25 inpatients in the United States has at least 1 HAI on any given day.[11] The case fatality rate from a CLABSI may be as high as 12%, and up to 70% of these infections may be preventable.[1, 12] Interventions successful in decreasing CLABSIs have focused on patients in ICUs.[13] However, CVCs are increasingly prevalent outside the ICU, with over 4.5 million line days in non‐ICU beds reported to the National Healthcare Safety Network in 2012 compared to 2.5 million in 2010.[2, 14] However, adherence rates to infection control practices may be lower on the wards than in the ICUs.[6, 15] Consequently, although the number of CLABSIs has declined over the last decade, most are now occurring outside the ICU.[16] These trends underscore the need to develop strategies aimed at CLABSI prevention on the floors.
Analogous to the life cycle of a urinary catheter described by Meddings et al.,[17] strategies to prevent CLABSIs and other CVC‐related complications may be designed around the life cycle of a CVC. The life cycle starts with insertion and moves on to the maintenance, removal, and possible reinsertion of the line. The process thus starts with the decision to place the line. Over the last decade, this decision making has changed in part due to PICCs. This shift is reflected in PICC prevalence rates: in 2001, 11% of audited central lines were PICCs compared to 56% in 2007.[5, 6] In our audit, 66% of the CVCs were PICCs. This increase in the use of PICCs may be attributable to the ease and safety of their placement coupled with the increased availability of vascular access placement teams.[18] The risk of overuse that may result from such expediency may be countered by adhering to guidelines such as the Michigan Appropriateness Guide for Intravenous Catheters, which provides both clinically detailed guidance and an impetus for reflective decision making around intravenous access.[19]
The placement of CVCs for prolonged parenteral antibiotics may be a particular subset that bears further exploration. Similar to previous reports, we found that a large number of the CVCs were both inserted for and justified by the need for IV antibiotics.[5] Guidelines delineated by the Infectious Diseases Society of America regarding outpatient parenteral antibiotics weigh both the duration of therapy and the antimicrobial's potential for causing phlebitis when recommending the type of intravascular access.[20] Many courses may therefore be completed through peripheral or midline catheters. Developing strong partnerships between infectious disease specialists, hospitalists, and the facilities or home‐care services treating these patients may curtail the use of CVCs for antimicrobial administration.
The main focus of our work is on facilitating the safe removal of CVCs. The risk of CLABSIs increases each day a CVC is in place, and guidelines to prevent CLABSIs include recommendations to promptly remove nonessential catheters.[4, 21] There is also an emerging understanding that the risk of a PICC‐related CLABSI approaches that from a traditional central line in hospitalized patients, and PICCs confer an increased risk of venous thromboembolism.[18, 22] Although nearly half of surveyed hospitalists recently reported leaving PICCs in place until discharge day, our data suggest that this practice may be driven by the trajectory of a patient's recovery as much as by knowledge gaps related to the use of PICCs.[23] In nearly half the instances, clinical practice already mirrors our proposed guideline, with line removal coinciding with both the timing proposed by our guideline and discharge day. However, there is room for improvement, as line removal may have been expedited in the 29 patients in whom the line was retained after the first idle day. Maintaining an awareness of its presence and weighing its risks and benefits daily may facilitate the removal of a CVC. Based on the recent findings that up to a quarter of clinicians are unaware that their patients have a central line, the mere reminder of the presence of a line using such criteria may expedite its removal by triggering a purposeful reassessment of its ongoing need.[24] Premature CVC removal requiring line reinsertion is an unintended consequence that may emerge from the earlier removal of lines. In our sample, none of the patients who had lines removed either prior to or in accordance with our proposed guideline required a line reinsertion. In addition to line reinsertion, delays in laboratory testing and reporting due to the unavailability of access, increased patient discomfort, or increased workload on the bedside nurse or vascular access team must also be considered when implementing strategies aimed at decreasing line days.
We envisage using these criteria to both empower practitioners with knowledge and foster shared accountability between all team members by using a uniform tool. This can occur through partnerships between infection control, clinical nurse specialists, bedside nursing, and physicians. The electronic medical record could be leveraged to scan the record for the criteria and create a notification when the line becomes idle. In alignment with the Michigan Appropriateness Guide for Intravenous Catheters guidelines, we do not support the removal of lines by nursing staff without physician notification.[19] Such principles have been successfully harnessed in strategies to prevent both catheter‐associated urinary tract infections and CLABSIs in ICUs.[13, 25] In light of the complexity surrounding the decision making for CVCs, our criteria were focused on the wards and erred on the side of clinical caution. This clinical conservatism is apparent in the patients in whom lines were removed prior to what our guideline would propose, yet none of the patients required a line reinsertion. As concerns about recrudescent clinical instability may drive decision making around line removal, such conservatism may be warranted initially. However, the fidelity of these criteria in the clinical setting will need prospective validation. In particular, the inclusion of SIRS criteria may have led to an overestimation of justified days. Further studies may be needed to refine the criteria and find a clinical hierarchy that balances the risks and benefits of retaining a central line.
Our work has certain limitations. It is a single center's experience, and our findings may not therefore be generalizable. Except for when the indication for the line was for difficult access, we did not attempt to verify the presence of a peripheral IV. This, in combination with the inclusion of SIRS criteria, likely leads to an underestimation of idle days. In the interest of focusing on patients in whom the decision making around a line would be the least controversial, we did not continue to follow patients who were transferred to a higher level of care. It is possible, however, that these transfers were precipitated by line‐associated complications such as sepsis and would be important to track. We did not measure the agreement between data collectors, although definitions and methodologies were standardized and reviewed prior to data collection. As this was an observational assessment of a proposed guideline, we cannot predict how the recommendations generated by it will be received by clinicians. Although this may prove to be a barrier in adoption, we hope that the conversation it initiates leads to change.
Hospitalists are positioned to potentially influence the entire life cycle of a central line on the floor. Strategies can be enacted at each stage to help decrease the potential of harm from these devices to our patients. Creating and testing criteria and guidelines such as we propose represents just 1 such strategy in a multidisciplinary effort to provide the best possible care we can.
Acknowledgements
The authors thank Jennifer Dunscomb, Kristen Kelly, and their teams, and Deanna Sidwell, Todd Biggerstaff, Joan Miller, Rob Clark, and the tireless providers at Indiana University Health Methodist Hospital for their support.
Disclosures: This work was supported by the Indiana University Health Values Grant for research. The authors have no conflicts of interests to report.
- , , , , , . Estimating the proportion of healthcare‐associated infections that are reasonably preventable and the related mortality and costs. Infect Control Hosp Epidemiol. 2011;32(2):101–114.
- , , , et al. National Healthcare Safety Network (NHSN) report, data summary for 2012, device‐associated module. Am J Infect Control. 2013;41(12):1148–1166.
- , , . The risk of bloodstream infection in adults with different intravascular devices: a systematic review of 200 published prospective studies. Mayo Clin Proc. 2006;81(9):1159–1171.
- , , , et al. Guidelines for the prevention of intravascular catheter‐related infections. Clin Infect Dis. 2011;52(9):e162–e193.
- , , , et al. Temporary central venous catheter utilization patterns in a large tertiary care center: tracking the “idle central venous catheter.” Infect Control Hosp Epidemiol. 2012;33(1):50–57.
- , , , , , . Unnecessary use of central venous catheters: the need to look outside the intensive care unit. Infect Control Hosp Epidemiol. 2004;25(3):266–268.
- IU Health Methodist Hospital website. Available at: http://iuhealth.org/methodist/aboIut. Accessed October 20, 2014.
- , , , et al. Definitions for Sepsis and Organ Failure and Guidelines for the Use of Innovative Therapies in Sepsis. The ACCP/SCCM Consensus Conference Committee. American College of Chest Physicians/Society of Critical Care Medicine. Chest. 2009;136(5 suppl):e28.
- , , , , , . Acute hypertension: a systematic review and appraisal of guidelines. Ochsner J. 2014;14(4):655–663.
- , , . Predicting clinical deterioration in the hospital: the impact of outcome selection. Resuscitation. 2013;84(5):564–568.
- , , , et al. Multistate point‐prevalence survey of health care–associated infections. N Engl J Med. 2014;370(13):1198–1208.
- , , , et al. Estimating health care‐associated infections and deaths in U.S. hospitals, 2002. Public Health Rep. 2007;122(2):160–166.
- , , , et al. An intervention to decrease catheter‐related bloodstream infections in the ICU. N Engl J Med. 2006;355(26):2725–2732.
- , , , et al. Data summary for 2011, device‐associated module. Centers for Disease Control and Prevention. National Healthcare Safety Network (NHSN) Report. Available at: http://www.cdc.gov/nhsn/PDFs/dataStat/NHSN‐Report‐2011‐Data‐Summary.pdf. Published April 1, 2013. Last accessed January 2015.
- , , . Idle central venous catheter‐days pose infection risk for patients after discharge from intensive care. Am J Infect Control. 2014;42(4):453–455.
- , . Update on emerging infections: news from the Centers for Disease Control and Prevention. Vital signs: central line‐associated blood stream infections—United States, 2001, 2008, and 2009. Ann Emerg Med. 2011;58(5):447–451.
- , , , , , . Reducing unnecessary urinary catheter use and other strategies to prevent catheter‐associated urinary tract infection: an integrative review. BMJ Qual Saf. 2014;23(4):277–289.
- , , , , . The risk of bloodstream infection associated with peripherally inserted central catheters compared with central venous catheters in adults: a systematic review and meta‐analysis. Infect Control Hosp Epidemiol. 2013;34(9):908–918.
- , , , et al. The Michigan Appropriateness Guide for Intravenous Catheters (MAGIC): results from a multispecialty panel using the RAND/UCLA Appropriateness Method. Ann Intern Med. 2015;163(6 suppl):S1–S40.
- , , , et al. Practice guidelines for outpatient parenteral antimicrobial therapy. IDSA guidelines. Clin Infect Dis. 2004;38(12):1651–1672.
- , . Nonuniform risk of bloodstream infection with increasing central venous catheter‐days. Infect Control Hosp Epidemiol. 2005;26(8):715–719.
- , , , et al. Risk of venous thromboembolism associated with peripherally inserted central catheters: a systematic review and meta‐analysis. Lancet. 2013;382(9889):311–325.
- , , , , . Hospitalist experiences, practice, opinions, and knowledge regarding peripherally inserted central catheters: results of a national survey. J Hosp Med. 2013;8(11):635–638.
- , , , et al. Do clinicians know which of their patients have central venous catheters? Ann Intern Med. 2014;161(8):562.
- , , , , , . Reducing foley catheter device days in an intensive care unit: using the evidence to change practice. AACN Adv Crit Care. 2006;17(3):272–283.
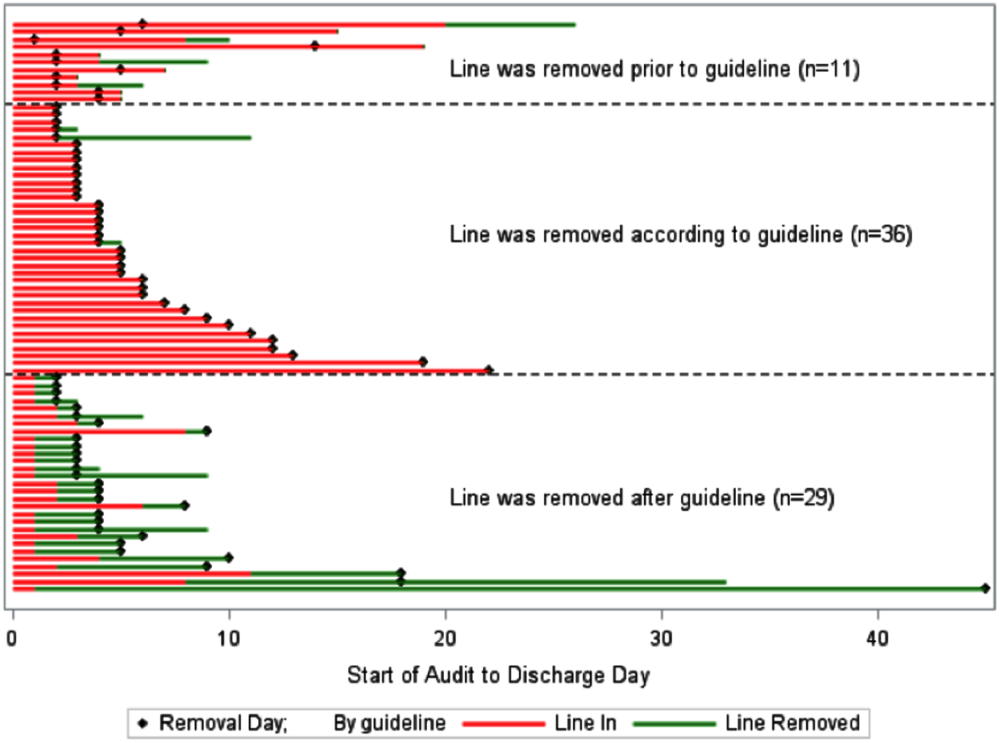
Redesigning Inpatient Care
Despite an estimated annual $2.6 trillion expenditure on healthcare, the United States performs poorly on indicators of health and harm during care.[1, 2, 3] Hospitals around the nation are working to improve the care they deliver. We describe a model developed at our institution and report the evaluation of the outcomes associated with its implementation on the general medical and surgical units. The Indiana University Institutional Review Board approved this work.
SETTING AND DEFINITIONS
Indiana University Health Methodist Hospital (MH) is an academic center in Indianapolis, Indiana, serving over 30,000 patients annually.[4] In 2012, responding to the coexisting needs to improve quality and contain costs, the MH leadership team redesigned care in the hospital. The new model centers around accountable care teams (ACTs). Each ACT is a geographically defined set of providers accepting ownership for the clinical, service, and financial outcomes of their respective inpatient unit. The units studied are described in Table 1.
| Unit | No. of Beds | Predominant Diagnosis (Maximum Domain Score)* | |
|---|---|---|---|
| |||
| Medical units with progressive‐care beds | 1 | 33 | Pulmonary (3.4, 3.5, 5) |
| 2 | 28 | Cardiology (4.8, 3.5, 4) | |
| 3 | 24 | General medical (4.8, 3.5, 4) | |
| Medical units without progressive‐care beds | 4 | 36 | Renal/diabetic (4, 3.5, 5) |
| 5 | 24 | General medical (3.75, 4, 5) | |
| Surgical units with progressive‐care beds | 6 | 51 | Cardiothoracic surgery/cardiology (4, 4, 5) |
| 7 | 29 | Trauma/general surgery (3.75, 3.5, 5) | |
| 8 | 23 | Neurosurgical/neurological (4.8, 5, 5) | |
| 9 | 24 | Neurosurgical/neurological (4.4, 4.5, 5) | |
| Surgical units without progressive‐care beds | 10 | 29 | General/urologic/gynecologic/plastic surgery (3.4, 3, 2) |
| 11 | 26 | Orthopedic surgery (4.6, 4, 5) | |
THE ACT MODEL
The model comprises 8 interventions rooted in 3 foundational domains: (1) enhancing interprofessional collaboration (IPC), (2) enabling data‐driven decisions, and (3) providing leadership. Each intervention is briefly described under its main focus (see Supporting Information, Appendix A, in the online version of this article for further details).
Enhancing IPC
Geographical Cohorting of Patients and Providers
Hospitalist providers are localized for 4 consecutive months to 1 unit. An interdisciplinary team including a case manager, clinical nurse specialist, pharmacist, nutritionist, and social worker also serve each unit. Learners (residents, pharmacy, and medical students) are embedded in the team when rotating on the hospital medicine service. The presence of unit‐based nurse managers and charge nurses predates the model and is retained.
Bedside Collaborative Rounding
Geographically cohorted providers round on their patients with the bedside nurse guided by a customizable script.
Daily Huddle
The hospitalist, learners, and the interdisciplinary team for the unit meet each weekday to discuss patients' needs for a safe transition out of the hospital. Each unit determined the timing, location, and script for the huddle while retaining the focus on discharge planning (see Supporting Information, Appendix A2, in the online version of this article for a sample script).
Hospitalist and Specialty Comanagement Agreements
Guidelines delineating responsibilities for providers of each specialty were developed. Examples include orders pertaining to the management of a dialysis catheter in a patient with end‐stage renal disease, the removal of drains in postsurgical patients, and wound care.
Unit White Board
Each unit has a white board at the nursing station. Similar to the huddle, it is focused on discharge planning.
Enabling Data‐Driven Decisions
Monthly Review of Unit‐Level Data
Data analytics at our institution developed a data dashboard. Key metrics including length of stay (LOS), patient satisfaction scores, readmission rates, and costs are tracked and attributed to the discharging unit. The data are collated monthly by the ACT program director and distributed to each unit's leadership. Monthly interdisciplinary meetings are held to review trends. Learners are encouraged but not required to attend.
Weekly Patient Satisfaction Rounding
The unit's nurse manager and physician leader conduct weekly satisfaction rounds on patients. The conversation is open‐ended and focused on eliciting positive and negative experiences.
Providing Leadership
Designated hospitalist and, where relevant, specialty leaders are committed to serve each unit for at least 1 year as a resource for both medical and operational problem solving. The leader stays closely connected with the unit's nurse manager. In addition to day‐to‐day troubleshooting, the leader is responsible for monitoring outcome trends. There is currently no stipend, training, or other incentive offered for the role.
Implementation Timelines and ACT Scores
The development of the ACTs started in the spring of 2012. Physician, nursing, and pharmacy support was sought, and a pilot unit was formed in August 2012. The model was cascaded hospital wide by December 2013, with support from the ACT program director (A.N.). The program director observed and scored the uptake of each intervention by each unit monthly. A score of 1 denoted no implementation, whereas 5 denoted complete implementation. The criteria for scoring are presented in Table 2. The monthly scores for all 8 interventions in each of the 11 units were averaged as an overall ACT score, which reflects the implementation dose of the ACT model. Monthly domain scores for enhancing IPC and enabling data‐driven decisions were also calculated as the average score within each domain. This yielded 3 domain scores. Figure 1A plots by month the overall ACT score for the medical and surgical units, and Figure 1B plots the implementation score for the 3 domains between August 2012 and December 2013 for all units. The uptake of the interventions varied between units. This allowed our analysis to explore the dose relationships between the model and outcomes independent of underlying time trends that may be affected by concomitant initiatives.
| 1 | 2 | 3 | 4 | 5 | |
|---|---|---|---|---|---|
| |||||
| Geographical cohorting of patients and the ACT* | None | At least 1 discipline comprising the ACT is unit based | All disciplines comprising the ACT except the hospitalist unit based | All disciplines including the hospitalist unit based | 4 + 80% of hospitalist provider's patients on the unit |
| Bedside collaborative rounding | None | Occurring 1 day a week on at least 25% of the patients on the unit | Occurring 2 to 3 days a week on at least 50% of the patients on the unit | Occurring 3 to 4 days a week on at least 75% of the patients on the unit | Occurring MondayFriday on all patients on the unit |
| Daily huddle | None | Occurring daily, 1 out of 4 ACT disciplines represented, at least 25% of patients on the unit discussed | Occurring daily, 2 out of 4 ACT disciplines represented, at least 50% of patients on the unit discussed | Occurring daily, 3 out of 4 ACT disciplines represented, at least 75% of patients on the unit discussed | Occurring daily, all disciplines of the ACT represented, all patients on the unit discussed |
| Hospitalist and specialty comanagement agreements | None | One out of 3 specialists represented on the unit collaborating with the hospitalists on at least 25% of relevant patients | One out of 3 specialists represented on the unit collaborating with the hospitalists on at least 50% of relevant patients | Two out of 3 specialists on the unit collaborating with the hospitalists on at least 75% of relevant patients | All specialists on the unit collaborating with the hospitalists on all relevant patients on the unit |
| Unit white board | None | Present but only used by nursing | Present and used by all ACT disciplines except physician providers | Present and used by entire ACT; use inconsistent | Present and used MondayFriday by all disciplines of ACT |
| Monthly review of unit level data | None | Nurse manager reviewing data with ACT program director | Nurse manager and unit leader reviewing data with ACT program director | Meeting either not consistently occurring monthly or not consistently attended by entire ACT | Monthly meeting with entire ACT |
| Weekly patient satisfaction rounding | None | Nurse manager performing up to 1 week a month | Nurse manager performing weekly | Nurse and physician leader performing up to 3 times a month | Nurse and physician leader performing weekly |
| Leadership | None | For units with specialties, either hospitalist or specialist leader identified | Both hospitalist and specialist leader Identified | Both hospitalist and specialist leaders (where applicable) identified and partially engaged in leadership role | Both hospitalist and specialist leaders (where applicable) identified and engaged in leadership role |
Outcomes
Monthly data between August 2012 and December 2013 were analyzed.
Measures of Value
MH is a member of the University Health Consortium, which measures outcomes of participants relative to their peers. MH measures LOS index as a ratio of observed LOS to expected LOS that is adjusted for severity of illness.[5]
Variable direct costs (VDCs) are costs that a hospital can save if a service is not provided.[6] A hospital's case‐mix index (CMI) represents the average diagnosis‐related group relative weight for that hospital. We track VDCs adjusted for CMI (CMI‐adjusted VDC).[7]
Thirty‐day readmission rate is the percentage of cases that are readmitted to MH within 30 days of discharge from the index admission.[8]
Measures of Patient Satisfaction
The Hospital Consumer Assessment of Healthcare Providers and Systems (HCAHPS) survey covers topics relevant to a patient's experience in the hospital.[9] Patient satisfaction scores are tracked by responses to the HCAHPS survey.
Measures of Provider Satisfaction
Hospitalist and specialty providers, leadership, and case management teams were surveyed via email through SurveyMonkey in July 2014. The survey included Likert responses that elicited opinions and comments about the ACT model.
Statistical Methods
The primary predictor of interest was the monthly overall ACT score. We also explored the domain scores as well as the individual scores for each intervention. Generalized linear mixed models were fit to investigate the association between each predictor (overall ACT score, ACT domain scores, and individual implementation scores) and each outcome (LOS index, CMI‐adjusted VDC, 30‐day readmission rate, and overall patient satisfaction). The model for testing each ACT score also included covariates of inpatient units as a random effect, as well as date and type of unit as fixed effects. We set the statistical significance level at 0.01 and reported 99% confidence intervals.
Descriptive statistics were used to report the provider satisfaction survey results.
RESULTS
The overall ACT score was associated with LOS index and CMI‐adjusted VDC (both P < 0.001). For every 1‐unit increase in the overall ACT score, LOS index decreased by 0.078 and CMI‐adjusted VDC decreased by $273.99 (Table 3).
| Length of Stay Index | CMI Adjusted VDC | |||
|---|---|---|---|---|
| Estimate (99% CI)* | P Value | Estimate (99% CI)* | P Value | |
| ||||
| Overall ACT Score | 0.078 (0.123 to 0.032) | <0.001 | 274.0 (477.31 to 70.68) | <0.001 |
| Enhancing IPC | 0.071 (0.117 to 0.026) | <0.001 | 284.7 (488.08 to 81.23) | <0.001 |
| Enabling data‐driven decisions | 0.044 (0.080 to 0.009) | 0.002 | 145.4 (304.57 to 13.81) | 0.02 |
| Providing leadership | 0.027 (0.049 to 0.005) | 0.001 | 69.9 (169.00 to 29.26) | 0.07 |
Looking at domains, enhancing IPC resulted in statistically significant decreases in both LOS index and CMI‐adjusted VDC, but providing leadership and enabling data‐driven decisions decreased only the LOS index. Most of the 8 individual interventions were associated with at least 1 of these 2 outcomes. (Even where the associations were not significant, they were all in the direction of decreasing LOS and cost). In these models, the covariate of type of units (medical vs surgical) was not associated with LOS or cost. There was no significant time trend in LOS or cost, except in models where an intervention had no association with either outcome. Inclusion of all individual effective interventions in the same statistical model to assess their relative contributions was not possible because they were highly correlated (correlations 0.450.89).
Thirty‐day readmissions and patient satisfaction were not significantly associated with the overall ACT score, but exploratory analyses showed that patient satisfaction increased with the implementation of geographical cohorting (P = 0.007).
Survey Results
The response rate was 87% (96/110). Between 85% and 96% of respondents either agreed or strongly agreed that the ACT model had improved the quality and safety of the care delivered, improved communication between providers and patients, and improved their own engagement and job satisfaction. Overall, 78% of the respondents either agreed or strongly agreed that the model improved efficiency (Table 4). Suggestions for improvements revolved around increasing the emphasis on patient centeredness and bedside nursing engagement.
| The ACT Model | Strongly Agree, n (%) | Agree, n (%) | Disagree, n (%) | Strongly Disagree, n (%) |
|---|---|---|---|---|
| ||||
| Has improved the quality and safety of patient care | 46 (47.9) | 46 (47.9) | 2 (2.1) | 2 (2.1) |
| Has improved communication with patients and families | 42 (43.7) | 47 (49.0) | 5 (5.2) | 2 (2.1) |
| Has improved your efficiency/productivity | 31 (32.6) | 43 (45.3) | 17 (17.9) | 4 (4.2) |
| Has improved your engagement and job satisfaction | 33 (34.4) | 49 (51.0) | 10 (10.4) | 4 (4.2) |
| Is a better model of delivering patient care | 45 (47.4) | 44 (46.3) | 2 (2.1) | 4 (4.2) |
DISCUSSION
The serious problems in US healthcare constitute an urgent imperative to innovate and reform.[10] Inpatient care reflects 31% of the expenditure on healthcare, and in 2010, 35.1 million patients were discharged from the hospital after spending an average of 4.8 days as an inpatient.[11] These figures represent an immense opportunity to intervene. Measuring the impact of quality improvement efforts is often complicated by concomitant changes that affect outcomes over the interval studied. Our approach allowed us to detect statistically significant changes in LOS index and CMI‐adjusted VDC associated with the ACT implementation dose that could be separated from the underlying time trends.
The ACT model we describe is rooted in improving 3 foundational domains; quantifying each intervention's compartmentalized contribution, however, proved difficult. Each intervention intertwines with the others to create changes in attitudes, knowledge, and culture that are difficult to measure yet may synergistically affect outcomes. For example, although geographical cohorting appears to have the strongest statistical association with outcomes, this may be mediated by how it enables other processes to take place more effectively. Based on this analysis, therefore, the ACT model may best be considered a bundled intervention.
The team caring for a patient during hospitalization is so complex that fewer than a quarter of patients know their physician's or nurse's name.[12] This complexity impairs communication between patients and providers and between the providers themselves. Communication failures are consistently identified as root causes in sentinel events reported to the Joint Commission.[13] IPC is the process by which different professional groups work together to positively impact health care. IPC overlaps with communication, coordination, and teamwork, and improvements in IPC may improve care.[14] Some elements of the model we describe have been tested previously.[15, 16, 17] Localization of teams may increase productivity and the frequency with which physicians and nurses communicate. Localization also decreases the number of pages received and steps walked by providers during a workday.[15, 16, 17] However, these studies reported a trend toward an increase in the LOS and neutral effects on cost and readmission rates. We found statistically significant decreases in both LOS and cost associated with the geographic cohorting of patients and providers. Notably, our model localized not only the physician providers but also the interdisciplinary team of pharmacists, clinical nurse specialists, case managers, and social workers. This proximity may facilitate IPC between all members that culminates in improved efficiency. The possibility of delays in discharges to avoid new admissions in a geographically structured team has previously been raised to explain the associated increases in LOS.[16, 17] The accountability of each unit for its metrics, the communication between nursing and physicians, and the timely availability of the unit's performance data aligns everyone toward a shared goal and provides some protection from an unintended consequence.
Structured interdisciplinary rounds decrease adverse events and improve teamwork ratings.[18, 19] The huddle in our model is a forum to collaborate between disciplines that proved to be effective in decreasing LOS and costs. Our huddle aims to discuss all the patients on the unit. This allows the team to assist each other in problem solving for the entire unit and not just the patients on the geographically cohorted team. This approach, in addition to the improved IPC fostered by the ACT model, may help explain how benefits in LOS and costs permeated across all 11 diverse units despite the presence of patients who are not directly served by the geographically cohorted team.
High‐performing clinical systems maintain an awareness of their overarching mission and unit‐based leaders can influence the frontline by reiterating the organizational mission and aligning efforts with outcomes.[20] Our leadership model is similar to those described by other institutions in the strong partnerships between physicians and nursing.[21] As outlined by Kim et al., investing in the professional development of the unit leaders may help them fulfill their roles and serve the organization better.[21]
The fragmentation and lack of ownership over the continuum of patient care causes duplication and waste. The proposal in the Accountable Care Act to create accountable care organizations is rooted in the understanding that providers and organizations will seek out new ways of improving quality when held accountable for their outcomes.[22] To foster ownership and accountability, reporting of metrics at the unit level is needed. Furthermore, an informational infrastructure is critical, as improvements cannot occur without the availability of data to both monitor performance and measure the effect of interventions.[10, 23] Even without any other interventions, providing feedback alone is an effective way of changing practices.[24] According to Berwick et al., this phenomenon reflects practitioners' intrinsic motivation to simply want to be better.[25] Our monthly review of each unit's data is an effective way to provide timely feedback to the frontline that sparks pride, ownership, and innovative thinking.
Based on our mean ACT score and CMI‐adjusted VDC reductions alone, we estimate savings of $649.36 per hospitalization (mean increase in ACT implementation of 2.37 times reduction in cost index of $273.99 per unit increase in overall ACT score). This figure does not include savings realized through reductions in LOS. This is a small decrease relative to the mean cost of hospitalization, yet when compounded over the annual MH census, it would result in substantial savings. The model relied on the restructuring of the existing workforce and the only direct additional cost was the early salary support for the ACT program director.
Limitations
We recognize several limitations. It is a single center's experience and may not be generalizable. The diffusion of knowledge and culture carried between units and the relatively rapid implementation timeline did not allow for a control unit. A single observer assigned our implementation scores, and therefore we cannot report measures of inter‐rater reliability. However, defined criteria and direct observations were used wherever possible. Although administratively available data have their limitations, where available, we used measurements that are adjusted for severity of illness and CMI. We therefore feel that this dataset is an accurate representation of currently reported national quality indicators.
FURTHER DIRECTIONS
Although there is a need to improve our healthcare system, interventions should be deliberate and evidence based wherever possible.[26] Geographic cohorting may decrease the frequency of paging interruptions for physicians and practitioners while increasing face‐to‐face interruptions.[27] The net effect on safety with this trade‐off should be investigated.
The presence of an intervention does not guarantee its success. Despite geographic cohorting and interdisciplinary meetings, communication that influences physician decision making may not improve.[28] Although instruments to measure ratings of team work and collaboration are available, focusing on clinically relevant outcomes of teamwork, such as prevention of harm, may be more empowering feedback for the frontline. Formal cost‐benefit analyses and outcomes related to physician and nursing retention will be equally important for assessing the sustainability of the model. Involving patients and their caregivers and inviting their perspectives as care is redesigned will also be critical in maintaining patient centeredness. Research addressing interventions to mediate preventable readmission risk and understanding the drivers of patient satisfaction is also needed.
The true value of the model may be in its potential to monitor and drive change within itself. Continuously aligning aims, incentives, performance measures, and feedback will help support this innovation and drive. This affects not only patient care but creates microcosms within which research and education can thrive. We hope that our experience will help guide other institutions as we all strive in our journey to improve the care we deliver.
Acknowledgements
The authors thank the Indiana University Health Physicians hospitalists at MH, Sandy Janitz and Decision Support, the Indiana University Health executive leadership team, Robert Clark, Malaz Boustani, Dennis Watson, Nadia Adams, Todd Biggerstaff, Deanne Kashiwagi, and the tireless providers at MH for their support.
Disclosure: This work was supported by a grant from the Indiana University Health Values Fund. The authors have no conflicts of interest to disclose.
- Committee on Quality of Health Care in America; Institute of Medicine. Crossing the Quality Chasm: A New Health System for the 21st Century. Washington, DC: The National Academies Press; 2001.
- . Is US health really the best in the world? JAMA. 2000;284(4):483–485.
- , , , , , . Temporal trends in rates of patient harm resulting from medical care. N Engl J Med. 2010;363(22):2124–2134.
- Indiana University Health. Available at: http://iuhealth.org/methodist/aboIut/. Accessed October 20, 2014.
- University Health Consortium. Available at: https://www.uhc.edu/docs/45014769_QSS_dashboard_FAQs.pdf. Accessed October 23, 2014.
- , , , et al. Distribution of variable vs fixed costs of hospital care. JAMA. 1999;281(7):644–649.
- Centers for Medicare and Medicaid Services. Case mix index. Available at: http://www.cms.gov/Medicare/Medicare‐Fee‐for‐Service‐Payment/AcuteInpatientPPS/Acute‐Inpatient‐Files‐for‐Download‐Items/CMS022630.html. Accessed May 4, 2015.
- University Health Consortium. Available at: https://www.uhc.edu. Accessed October 23, 2014.
- Centers for Medicare and Medicaid Services. Hospital Consumer Assessment of Healthcare Providers and Systems. HCAHPS survey content and administration. Centers for Medicare 280(11):1000–1005.
- Centers for Disease Control and Prevention. FastStats. Available at: http://www.cdc.gov/nchs/fastats/default.htm. Accessed October 27, 2014.
- , . Does your patient know your name? An approach to enhancing patients' awareness of their caretaker's name. J Healthc Qual. 2005;27(4):53–56.
- The Joint Commission. Sentinel event data: root causes by event type 2004‐third quarter. Available at: http://www.jointcommissionorg. Available at: http://www.jointcommission.org/assets/1/18/Root_Causes_by_Event_Type_2004-2Q2013.pdf. Accessed March 26, 2014.
- , , . Interprofessional collaboration: effects of practice‐based interventions on professional practice and healthcare outcomes. Cochrane Database Syst Rev. 2009;(3):CD000072.
- , , , et al. Impact of localizing physicians to hospital units on nurse–physician communication and agreement on the plan of care. J Gen Intern Med. 2009;24(11):1223–1227.
- , , , et al. Impact of localizing general medical teams to a single nursing unit. J Hosp Med. 2012;7(7):551–556.
- , , , et al. Implementation of a physician assistant/hospitalist service in an academic medical center: impact on efficiency and patient outcomes. J Hosp Med. 2008;3(5):361–368.
- , , , , , . Improving teamwork: impact of structured interdisciplinary rounds on a medical teaching unit. J Gen Intern Med. 2010;25(8):826–832.
- , , , ; High Performance Teams and the Hospital of the Future Project Team. Interdisciplinary teamwork in hospitals: a review and practical recommendations for improvement. J Hosp Med. 2011;7(1):48–54.
- , , , , , . Microsystems in health care: part 8. Developing people and improving work life: what front‐line staff told us. Jt Comm J Qual Saf. 2003;29(10):512–522.
- , , , , , . Unit‐based interprofessional leadership models in six US hospitals. J Hosp Med. 2014;9(8):545–550.
- , , , . Creating accountable care organizations: the extended hospital medical staff. Health Aff (Millwood). 2007;26(1):w44–w57.
- , . Using performance measurement to drive improvement: a road map for change. Med Care. 2003;41(1 suppl):I48–I60.
- , . Changing physicians' practices. N Engl J Med. 1993;329(17):1271–1273.
- , , . Connections between quality measurement and improvement. Med Care. 2003;41(1 suppl):I30–I38.
- , , . The tension between needing to improve care and knowing how to do it. N Engl J Med. 2007;357(6):608–613.
- , . A qualitative evaluation of geographical localization of hospitalists: how unintended consequences may impact quality. J Gen Intern Med. 2014;29(7):1009–1016.
- , , , , . Disengaged: a qualitative study of communication and collaboration between physicians and other professions on general internal medicine wards. BMC Health Serv Res. 2013;13:494.
Despite an estimated annual $2.6 trillion expenditure on healthcare, the United States performs poorly on indicators of health and harm during care.[1, 2, 3] Hospitals around the nation are working to improve the care they deliver. We describe a model developed at our institution and report the evaluation of the outcomes associated with its implementation on the general medical and surgical units. The Indiana University Institutional Review Board approved this work.
SETTING AND DEFINITIONS
Indiana University Health Methodist Hospital (MH) is an academic center in Indianapolis, Indiana, serving over 30,000 patients annually.[4] In 2012, responding to the coexisting needs to improve quality and contain costs, the MH leadership team redesigned care in the hospital. The new model centers around accountable care teams (ACTs). Each ACT is a geographically defined set of providers accepting ownership for the clinical, service, and financial outcomes of their respective inpatient unit. The units studied are described in Table 1.
| Unit | No. of Beds | Predominant Diagnosis (Maximum Domain Score)* | |
|---|---|---|---|
| |||
| Medical units with progressive‐care beds | 1 | 33 | Pulmonary (3.4, 3.5, 5) |
| 2 | 28 | Cardiology (4.8, 3.5, 4) | |
| 3 | 24 | General medical (4.8, 3.5, 4) | |
| Medical units without progressive‐care beds | 4 | 36 | Renal/diabetic (4, 3.5, 5) |
| 5 | 24 | General medical (3.75, 4, 5) | |
| Surgical units with progressive‐care beds | 6 | 51 | Cardiothoracic surgery/cardiology (4, 4, 5) |
| 7 | 29 | Trauma/general surgery (3.75, 3.5, 5) | |
| 8 | 23 | Neurosurgical/neurological (4.8, 5, 5) | |
| 9 | 24 | Neurosurgical/neurological (4.4, 4.5, 5) | |
| Surgical units without progressive‐care beds | 10 | 29 | General/urologic/gynecologic/plastic surgery (3.4, 3, 2) |
| 11 | 26 | Orthopedic surgery (4.6, 4, 5) | |
THE ACT MODEL
The model comprises 8 interventions rooted in 3 foundational domains: (1) enhancing interprofessional collaboration (IPC), (2) enabling data‐driven decisions, and (3) providing leadership. Each intervention is briefly described under its main focus (see Supporting Information, Appendix A, in the online version of this article for further details).
Enhancing IPC
Geographical Cohorting of Patients and Providers
Hospitalist providers are localized for 4 consecutive months to 1 unit. An interdisciplinary team including a case manager, clinical nurse specialist, pharmacist, nutritionist, and social worker also serve each unit. Learners (residents, pharmacy, and medical students) are embedded in the team when rotating on the hospital medicine service. The presence of unit‐based nurse managers and charge nurses predates the model and is retained.
Bedside Collaborative Rounding
Geographically cohorted providers round on their patients with the bedside nurse guided by a customizable script.
Daily Huddle
The hospitalist, learners, and the interdisciplinary team for the unit meet each weekday to discuss patients' needs for a safe transition out of the hospital. Each unit determined the timing, location, and script for the huddle while retaining the focus on discharge planning (see Supporting Information, Appendix A2, in the online version of this article for a sample script).
Hospitalist and Specialty Comanagement Agreements
Guidelines delineating responsibilities for providers of each specialty were developed. Examples include orders pertaining to the management of a dialysis catheter in a patient with end‐stage renal disease, the removal of drains in postsurgical patients, and wound care.
Unit White Board
Each unit has a white board at the nursing station. Similar to the huddle, it is focused on discharge planning.
Enabling Data‐Driven Decisions
Monthly Review of Unit‐Level Data
Data analytics at our institution developed a data dashboard. Key metrics including length of stay (LOS), patient satisfaction scores, readmission rates, and costs are tracked and attributed to the discharging unit. The data are collated monthly by the ACT program director and distributed to each unit's leadership. Monthly interdisciplinary meetings are held to review trends. Learners are encouraged but not required to attend.
Weekly Patient Satisfaction Rounding
The unit's nurse manager and physician leader conduct weekly satisfaction rounds on patients. The conversation is open‐ended and focused on eliciting positive and negative experiences.
Providing Leadership
Designated hospitalist and, where relevant, specialty leaders are committed to serve each unit for at least 1 year as a resource for both medical and operational problem solving. The leader stays closely connected with the unit's nurse manager. In addition to day‐to‐day troubleshooting, the leader is responsible for monitoring outcome trends. There is currently no stipend, training, or other incentive offered for the role.
Implementation Timelines and ACT Scores
The development of the ACTs started in the spring of 2012. Physician, nursing, and pharmacy support was sought, and a pilot unit was formed in August 2012. The model was cascaded hospital wide by December 2013, with support from the ACT program director (A.N.). The program director observed and scored the uptake of each intervention by each unit monthly. A score of 1 denoted no implementation, whereas 5 denoted complete implementation. The criteria for scoring are presented in Table 2. The monthly scores for all 8 interventions in each of the 11 units were averaged as an overall ACT score, which reflects the implementation dose of the ACT model. Monthly domain scores for enhancing IPC and enabling data‐driven decisions were also calculated as the average score within each domain. This yielded 3 domain scores. Figure 1A plots by month the overall ACT score for the medical and surgical units, and Figure 1B plots the implementation score for the 3 domains between August 2012 and December 2013 for all units. The uptake of the interventions varied between units. This allowed our analysis to explore the dose relationships between the model and outcomes independent of underlying time trends that may be affected by concomitant initiatives.
| 1 | 2 | 3 | 4 | 5 | |
|---|---|---|---|---|---|
| |||||
| Geographical cohorting of patients and the ACT* | None | At least 1 discipline comprising the ACT is unit based | All disciplines comprising the ACT except the hospitalist unit based | All disciplines including the hospitalist unit based | 4 + 80% of hospitalist provider's patients on the unit |
| Bedside collaborative rounding | None | Occurring 1 day a week on at least 25% of the patients on the unit | Occurring 2 to 3 days a week on at least 50% of the patients on the unit | Occurring 3 to 4 days a week on at least 75% of the patients on the unit | Occurring MondayFriday on all patients on the unit |
| Daily huddle | None | Occurring daily, 1 out of 4 ACT disciplines represented, at least 25% of patients on the unit discussed | Occurring daily, 2 out of 4 ACT disciplines represented, at least 50% of patients on the unit discussed | Occurring daily, 3 out of 4 ACT disciplines represented, at least 75% of patients on the unit discussed | Occurring daily, all disciplines of the ACT represented, all patients on the unit discussed |
| Hospitalist and specialty comanagement agreements | None | One out of 3 specialists represented on the unit collaborating with the hospitalists on at least 25% of relevant patients | One out of 3 specialists represented on the unit collaborating with the hospitalists on at least 50% of relevant patients | Two out of 3 specialists on the unit collaborating with the hospitalists on at least 75% of relevant patients | All specialists on the unit collaborating with the hospitalists on all relevant patients on the unit |
| Unit white board | None | Present but only used by nursing | Present and used by all ACT disciplines except physician providers | Present and used by entire ACT; use inconsistent | Present and used MondayFriday by all disciplines of ACT |
| Monthly review of unit level data | None | Nurse manager reviewing data with ACT program director | Nurse manager and unit leader reviewing data with ACT program director | Meeting either not consistently occurring monthly or not consistently attended by entire ACT | Monthly meeting with entire ACT |
| Weekly patient satisfaction rounding | None | Nurse manager performing up to 1 week a month | Nurse manager performing weekly | Nurse and physician leader performing up to 3 times a month | Nurse and physician leader performing weekly |
| Leadership | None | For units with specialties, either hospitalist or specialist leader identified | Both hospitalist and specialist leader Identified | Both hospitalist and specialist leaders (where applicable) identified and partially engaged in leadership role | Both hospitalist and specialist leaders (where applicable) identified and engaged in leadership role |
Outcomes
Monthly data between August 2012 and December 2013 were analyzed.
Measures of Value
MH is a member of the University Health Consortium, which measures outcomes of participants relative to their peers. MH measures LOS index as a ratio of observed LOS to expected LOS that is adjusted for severity of illness.[5]
Variable direct costs (VDCs) are costs that a hospital can save if a service is not provided.[6] A hospital's case‐mix index (CMI) represents the average diagnosis‐related group relative weight for that hospital. We track VDCs adjusted for CMI (CMI‐adjusted VDC).[7]
Thirty‐day readmission rate is the percentage of cases that are readmitted to MH within 30 days of discharge from the index admission.[8]
Measures of Patient Satisfaction
The Hospital Consumer Assessment of Healthcare Providers and Systems (HCAHPS) survey covers topics relevant to a patient's experience in the hospital.[9] Patient satisfaction scores are tracked by responses to the HCAHPS survey.
Measures of Provider Satisfaction
Hospitalist and specialty providers, leadership, and case management teams were surveyed via email through SurveyMonkey in July 2014. The survey included Likert responses that elicited opinions and comments about the ACT model.
Statistical Methods
The primary predictor of interest was the monthly overall ACT score. We also explored the domain scores as well as the individual scores for each intervention. Generalized linear mixed models were fit to investigate the association between each predictor (overall ACT score, ACT domain scores, and individual implementation scores) and each outcome (LOS index, CMI‐adjusted VDC, 30‐day readmission rate, and overall patient satisfaction). The model for testing each ACT score also included covariates of inpatient units as a random effect, as well as date and type of unit as fixed effects. We set the statistical significance level at 0.01 and reported 99% confidence intervals.
Descriptive statistics were used to report the provider satisfaction survey results.
RESULTS
The overall ACT score was associated with LOS index and CMI‐adjusted VDC (both P < 0.001). For every 1‐unit increase in the overall ACT score, LOS index decreased by 0.078 and CMI‐adjusted VDC decreased by $273.99 (Table 3).
| Length of Stay Index | CMI Adjusted VDC | |||
|---|---|---|---|---|
| Estimate (99% CI)* | P Value | Estimate (99% CI)* | P Value | |
| ||||
| Overall ACT Score | 0.078 (0.123 to 0.032) | <0.001 | 274.0 (477.31 to 70.68) | <0.001 |
| Enhancing IPC | 0.071 (0.117 to 0.026) | <0.001 | 284.7 (488.08 to 81.23) | <0.001 |
| Enabling data‐driven decisions | 0.044 (0.080 to 0.009) | 0.002 | 145.4 (304.57 to 13.81) | 0.02 |
| Providing leadership | 0.027 (0.049 to 0.005) | 0.001 | 69.9 (169.00 to 29.26) | 0.07 |
Looking at domains, enhancing IPC resulted in statistically significant decreases in both LOS index and CMI‐adjusted VDC, but providing leadership and enabling data‐driven decisions decreased only the LOS index. Most of the 8 individual interventions were associated with at least 1 of these 2 outcomes. (Even where the associations were not significant, they were all in the direction of decreasing LOS and cost). In these models, the covariate of type of units (medical vs surgical) was not associated with LOS or cost. There was no significant time trend in LOS or cost, except in models where an intervention had no association with either outcome. Inclusion of all individual effective interventions in the same statistical model to assess their relative contributions was not possible because they were highly correlated (correlations 0.450.89).
Thirty‐day readmissions and patient satisfaction were not significantly associated with the overall ACT score, but exploratory analyses showed that patient satisfaction increased with the implementation of geographical cohorting (P = 0.007).
Survey Results
The response rate was 87% (96/110). Between 85% and 96% of respondents either agreed or strongly agreed that the ACT model had improved the quality and safety of the care delivered, improved communication between providers and patients, and improved their own engagement and job satisfaction. Overall, 78% of the respondents either agreed or strongly agreed that the model improved efficiency (Table 4). Suggestions for improvements revolved around increasing the emphasis on patient centeredness and bedside nursing engagement.
| The ACT Model | Strongly Agree, n (%) | Agree, n (%) | Disagree, n (%) | Strongly Disagree, n (%) |
|---|---|---|---|---|
| ||||
| Has improved the quality and safety of patient care | 46 (47.9) | 46 (47.9) | 2 (2.1) | 2 (2.1) |
| Has improved communication with patients and families | 42 (43.7) | 47 (49.0) | 5 (5.2) | 2 (2.1) |
| Has improved your efficiency/productivity | 31 (32.6) | 43 (45.3) | 17 (17.9) | 4 (4.2) |
| Has improved your engagement and job satisfaction | 33 (34.4) | 49 (51.0) | 10 (10.4) | 4 (4.2) |
| Is a better model of delivering patient care | 45 (47.4) | 44 (46.3) | 2 (2.1) | 4 (4.2) |
DISCUSSION
The serious problems in US healthcare constitute an urgent imperative to innovate and reform.[10] Inpatient care reflects 31% of the expenditure on healthcare, and in 2010, 35.1 million patients were discharged from the hospital after spending an average of 4.8 days as an inpatient.[11] These figures represent an immense opportunity to intervene. Measuring the impact of quality improvement efforts is often complicated by concomitant changes that affect outcomes over the interval studied. Our approach allowed us to detect statistically significant changes in LOS index and CMI‐adjusted VDC associated with the ACT implementation dose that could be separated from the underlying time trends.
The ACT model we describe is rooted in improving 3 foundational domains; quantifying each intervention's compartmentalized contribution, however, proved difficult. Each intervention intertwines with the others to create changes in attitudes, knowledge, and culture that are difficult to measure yet may synergistically affect outcomes. For example, although geographical cohorting appears to have the strongest statistical association with outcomes, this may be mediated by how it enables other processes to take place more effectively. Based on this analysis, therefore, the ACT model may best be considered a bundled intervention.
The team caring for a patient during hospitalization is so complex that fewer than a quarter of patients know their physician's or nurse's name.[12] This complexity impairs communication between patients and providers and between the providers themselves. Communication failures are consistently identified as root causes in sentinel events reported to the Joint Commission.[13] IPC is the process by which different professional groups work together to positively impact health care. IPC overlaps with communication, coordination, and teamwork, and improvements in IPC may improve care.[14] Some elements of the model we describe have been tested previously.[15, 16, 17] Localization of teams may increase productivity and the frequency with which physicians and nurses communicate. Localization also decreases the number of pages received and steps walked by providers during a workday.[15, 16, 17] However, these studies reported a trend toward an increase in the LOS and neutral effects on cost and readmission rates. We found statistically significant decreases in both LOS and cost associated with the geographic cohorting of patients and providers. Notably, our model localized not only the physician providers but also the interdisciplinary team of pharmacists, clinical nurse specialists, case managers, and social workers. This proximity may facilitate IPC between all members that culminates in improved efficiency. The possibility of delays in discharges to avoid new admissions in a geographically structured team has previously been raised to explain the associated increases in LOS.[16, 17] The accountability of each unit for its metrics, the communication between nursing and physicians, and the timely availability of the unit's performance data aligns everyone toward a shared goal and provides some protection from an unintended consequence.
Structured interdisciplinary rounds decrease adverse events and improve teamwork ratings.[18, 19] The huddle in our model is a forum to collaborate between disciplines that proved to be effective in decreasing LOS and costs. Our huddle aims to discuss all the patients on the unit. This allows the team to assist each other in problem solving for the entire unit and not just the patients on the geographically cohorted team. This approach, in addition to the improved IPC fostered by the ACT model, may help explain how benefits in LOS and costs permeated across all 11 diverse units despite the presence of patients who are not directly served by the geographically cohorted team.
High‐performing clinical systems maintain an awareness of their overarching mission and unit‐based leaders can influence the frontline by reiterating the organizational mission and aligning efforts with outcomes.[20] Our leadership model is similar to those described by other institutions in the strong partnerships between physicians and nursing.[21] As outlined by Kim et al., investing in the professional development of the unit leaders may help them fulfill their roles and serve the organization better.[21]
The fragmentation and lack of ownership over the continuum of patient care causes duplication and waste. The proposal in the Accountable Care Act to create accountable care organizations is rooted in the understanding that providers and organizations will seek out new ways of improving quality when held accountable for their outcomes.[22] To foster ownership and accountability, reporting of metrics at the unit level is needed. Furthermore, an informational infrastructure is critical, as improvements cannot occur without the availability of data to both monitor performance and measure the effect of interventions.[10, 23] Even without any other interventions, providing feedback alone is an effective way of changing practices.[24] According to Berwick et al., this phenomenon reflects practitioners' intrinsic motivation to simply want to be better.[25] Our monthly review of each unit's data is an effective way to provide timely feedback to the frontline that sparks pride, ownership, and innovative thinking.
Based on our mean ACT score and CMI‐adjusted VDC reductions alone, we estimate savings of $649.36 per hospitalization (mean increase in ACT implementation of 2.37 times reduction in cost index of $273.99 per unit increase in overall ACT score). This figure does not include savings realized through reductions in LOS. This is a small decrease relative to the mean cost of hospitalization, yet when compounded over the annual MH census, it would result in substantial savings. The model relied on the restructuring of the existing workforce and the only direct additional cost was the early salary support for the ACT program director.
Limitations
We recognize several limitations. It is a single center's experience and may not be generalizable. The diffusion of knowledge and culture carried between units and the relatively rapid implementation timeline did not allow for a control unit. A single observer assigned our implementation scores, and therefore we cannot report measures of inter‐rater reliability. However, defined criteria and direct observations were used wherever possible. Although administratively available data have their limitations, where available, we used measurements that are adjusted for severity of illness and CMI. We therefore feel that this dataset is an accurate representation of currently reported national quality indicators.
FURTHER DIRECTIONS
Although there is a need to improve our healthcare system, interventions should be deliberate and evidence based wherever possible.[26] Geographic cohorting may decrease the frequency of paging interruptions for physicians and practitioners while increasing face‐to‐face interruptions.[27] The net effect on safety with this trade‐off should be investigated.
The presence of an intervention does not guarantee its success. Despite geographic cohorting and interdisciplinary meetings, communication that influences physician decision making may not improve.[28] Although instruments to measure ratings of team work and collaboration are available, focusing on clinically relevant outcomes of teamwork, such as prevention of harm, may be more empowering feedback for the frontline. Formal cost‐benefit analyses and outcomes related to physician and nursing retention will be equally important for assessing the sustainability of the model. Involving patients and their caregivers and inviting their perspectives as care is redesigned will also be critical in maintaining patient centeredness. Research addressing interventions to mediate preventable readmission risk and understanding the drivers of patient satisfaction is also needed.
The true value of the model may be in its potential to monitor and drive change within itself. Continuously aligning aims, incentives, performance measures, and feedback will help support this innovation and drive. This affects not only patient care but creates microcosms within which research and education can thrive. We hope that our experience will help guide other institutions as we all strive in our journey to improve the care we deliver.
Acknowledgements
The authors thank the Indiana University Health Physicians hospitalists at MH, Sandy Janitz and Decision Support, the Indiana University Health executive leadership team, Robert Clark, Malaz Boustani, Dennis Watson, Nadia Adams, Todd Biggerstaff, Deanne Kashiwagi, and the tireless providers at MH for their support.
Disclosure: This work was supported by a grant from the Indiana University Health Values Fund. The authors have no conflicts of interest to disclose.
- Committee on Quality of Health Care in America; Institute of Medicine. Crossing the Quality Chasm: A New Health System for the 21st Century. Washington, DC: The National Academies Press; 2001.
- . Is US health really the best in the world? JAMA. 2000;284(4):483–485.
- , , , , , . Temporal trends in rates of patient harm resulting from medical care. N Engl J Med. 2010;363(22):2124–2134.
- Indiana University Health. Available at: http://iuhealth.org/methodist/aboIut/. Accessed October 20, 2014.
- University Health Consortium. Available at: https://www.uhc.edu/docs/45014769_QSS_dashboard_FAQs.pdf. Accessed October 23, 2014.
- , , , et al. Distribution of variable vs fixed costs of hospital care. JAMA. 1999;281(7):644–649.
- Centers for Medicare and Medicaid Services. Case mix index. Available at: http://www.cms.gov/Medicare/Medicare‐Fee‐for‐Service‐Payment/AcuteInpatientPPS/Acute‐Inpatient‐Files‐for‐Download‐Items/CMS022630.html. Accessed May 4, 2015.
- University Health Consortium. Available at: https://www.uhc.edu. Accessed October 23, 2014.
- Centers for Medicare and Medicaid Services. Hospital Consumer Assessment of Healthcare Providers and Systems. HCAHPS survey content and administration. Centers for Medicare 280(11):1000–1005.
- Centers for Disease Control and Prevention. FastStats. Available at: http://www.cdc.gov/nchs/fastats/default.htm. Accessed October 27, 2014.
- , . Does your patient know your name? An approach to enhancing patients' awareness of their caretaker's name. J Healthc Qual. 2005;27(4):53–56.
- The Joint Commission. Sentinel event data: root causes by event type 2004‐third quarter. Available at: http://www.jointcommissionorg. Available at: http://www.jointcommission.org/assets/1/18/Root_Causes_by_Event_Type_2004-2Q2013.pdf. Accessed March 26, 2014.
- , , . Interprofessional collaboration: effects of practice‐based interventions on professional practice and healthcare outcomes. Cochrane Database Syst Rev. 2009;(3):CD000072.
- , , , et al. Impact of localizing physicians to hospital units on nurse–physician communication and agreement on the plan of care. J Gen Intern Med. 2009;24(11):1223–1227.
- , , , et al. Impact of localizing general medical teams to a single nursing unit. J Hosp Med. 2012;7(7):551–556.
- , , , et al. Implementation of a physician assistant/hospitalist service in an academic medical center: impact on efficiency and patient outcomes. J Hosp Med. 2008;3(5):361–368.
- , , , , , . Improving teamwork: impact of structured interdisciplinary rounds on a medical teaching unit. J Gen Intern Med. 2010;25(8):826–832.
- , , , ; High Performance Teams and the Hospital of the Future Project Team. Interdisciplinary teamwork in hospitals: a review and practical recommendations for improvement. J Hosp Med. 2011;7(1):48–54.
- , , , , , . Microsystems in health care: part 8. Developing people and improving work life: what front‐line staff told us. Jt Comm J Qual Saf. 2003;29(10):512–522.
- , , , , , . Unit‐based interprofessional leadership models in six US hospitals. J Hosp Med. 2014;9(8):545–550.
- , , , . Creating accountable care organizations: the extended hospital medical staff. Health Aff (Millwood). 2007;26(1):w44–w57.
- , . Using performance measurement to drive improvement: a road map for change. Med Care. 2003;41(1 suppl):I48–I60.
- , . Changing physicians' practices. N Engl J Med. 1993;329(17):1271–1273.
- , , . Connections between quality measurement and improvement. Med Care. 2003;41(1 suppl):I30–I38.
- , , . The tension between needing to improve care and knowing how to do it. N Engl J Med. 2007;357(6):608–613.
- , . A qualitative evaluation of geographical localization of hospitalists: how unintended consequences may impact quality. J Gen Intern Med. 2014;29(7):1009–1016.
- , , , , . Disengaged: a qualitative study of communication and collaboration between physicians and other professions on general internal medicine wards. BMC Health Serv Res. 2013;13:494.
© 2015 Society of Hospital Medicine
