User login
Redesigning Inpatient Care
Despite an estimated annual $2.6 trillion expenditure on healthcare, the United States performs poorly on indicators of health and harm during care.[1, 2, 3] Hospitals around the nation are working to improve the care they deliver. We describe a model developed at our institution and report the evaluation of the outcomes associated with its implementation on the general medical and surgical units. The Indiana University Institutional Review Board approved this work.
SETTING AND DEFINITIONS
Indiana University Health Methodist Hospital (MH) is an academic center in Indianapolis, Indiana, serving over 30,000 patients annually.[4] In 2012, responding to the coexisting needs to improve quality and contain costs, the MH leadership team redesigned care in the hospital. The new model centers around accountable care teams (ACTs). Each ACT is a geographically defined set of providers accepting ownership for the clinical, service, and financial outcomes of their respective inpatient unit. The units studied are described in Table 1.
| Unit | No. of Beds | Predominant Diagnosis (Maximum Domain Score)* | |
|---|---|---|---|
| |||
| Medical units with progressive‐care beds | 1 | 33 | Pulmonary (3.4, 3.5, 5) |
| 2 | 28 | Cardiology (4.8, 3.5, 4) | |
| 3 | 24 | General medical (4.8, 3.5, 4) | |
| Medical units without progressive‐care beds | 4 | 36 | Renal/diabetic (4, 3.5, 5) |
| 5 | 24 | General medical (3.75, 4, 5) | |
| Surgical units with progressive‐care beds | 6 | 51 | Cardiothoracic surgery/cardiology (4, 4, 5) |
| 7 | 29 | Trauma/general surgery (3.75, 3.5, 5) | |
| 8 | 23 | Neurosurgical/neurological (4.8, 5, 5) | |
| 9 | 24 | Neurosurgical/neurological (4.4, 4.5, 5) | |
| Surgical units without progressive‐care beds | 10 | 29 | General/urologic/gynecologic/plastic surgery (3.4, 3, 2) |
| 11 | 26 | Orthopedic surgery (4.6, 4, 5) | |
THE ACT MODEL
The model comprises 8 interventions rooted in 3 foundational domains: (1) enhancing interprofessional collaboration (IPC), (2) enabling data‐driven decisions, and (3) providing leadership. Each intervention is briefly described under its main focus (see Supporting Information, Appendix A, in the online version of this article for further details).
Enhancing IPC
Geographical Cohorting of Patients and Providers
Hospitalist providers are localized for 4 consecutive months to 1 unit. An interdisciplinary team including a case manager, clinical nurse specialist, pharmacist, nutritionist, and social worker also serve each unit. Learners (residents, pharmacy, and medical students) are embedded in the team when rotating on the hospital medicine service. The presence of unit‐based nurse managers and charge nurses predates the model and is retained.
Bedside Collaborative Rounding
Geographically cohorted providers round on their patients with the bedside nurse guided by a customizable script.
Daily Huddle
The hospitalist, learners, and the interdisciplinary team for the unit meet each weekday to discuss patients' needs for a safe transition out of the hospital. Each unit determined the timing, location, and script for the huddle while retaining the focus on discharge planning (see Supporting Information, Appendix A2, in the online version of this article for a sample script).
Hospitalist and Specialty Comanagement Agreements
Guidelines delineating responsibilities for providers of each specialty were developed. Examples include orders pertaining to the management of a dialysis catheter in a patient with end‐stage renal disease, the removal of drains in postsurgical patients, and wound care.
Unit White Board
Each unit has a white board at the nursing station. Similar to the huddle, it is focused on discharge planning.
Enabling Data‐Driven Decisions
Monthly Review of Unit‐Level Data
Data analytics at our institution developed a data dashboard. Key metrics including length of stay (LOS), patient satisfaction scores, readmission rates, and costs are tracked and attributed to the discharging unit. The data are collated monthly by the ACT program director and distributed to each unit's leadership. Monthly interdisciplinary meetings are held to review trends. Learners are encouraged but not required to attend.
Weekly Patient Satisfaction Rounding
The unit's nurse manager and physician leader conduct weekly satisfaction rounds on patients. The conversation is open‐ended and focused on eliciting positive and negative experiences.
Providing Leadership
Designated hospitalist and, where relevant, specialty leaders are committed to serve each unit for at least 1 year as a resource for both medical and operational problem solving. The leader stays closely connected with the unit's nurse manager. In addition to day‐to‐day troubleshooting, the leader is responsible for monitoring outcome trends. There is currently no stipend, training, or other incentive offered for the role.
Implementation Timelines and ACT Scores
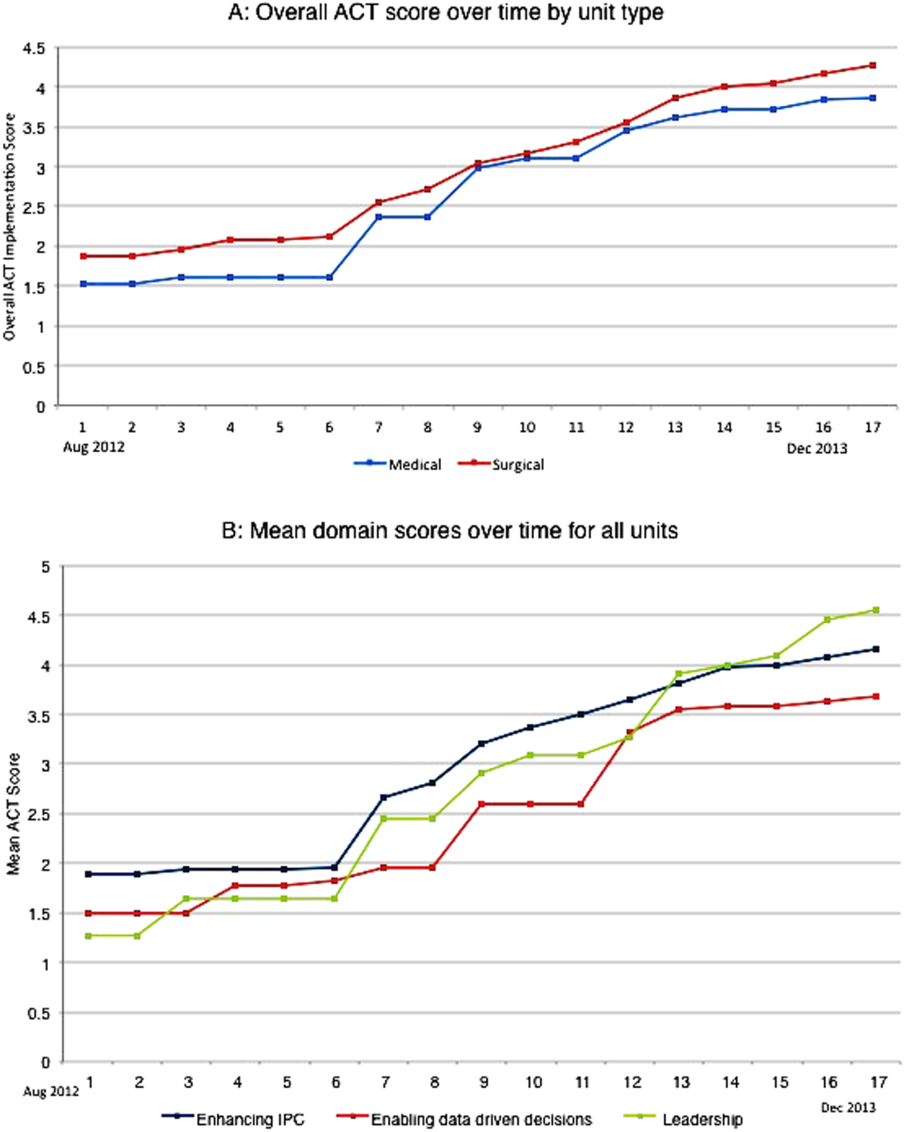
The development of the ACTs started in the spring of 2012. Physician, nursing, and pharmacy support was sought, and a pilot unit was formed in August 2012. The model was cascaded hospital wide by December 2013, with support from the ACT program director (A.N.). The program director observed and scored the uptake of each intervention by each unit monthly. A score of 1 denoted no implementation, whereas 5 denoted complete implementation. The criteria for scoring are presented in Table 2. The monthly scores for all 8 interventions in each of the 11 units were averaged as an overall ACT score, which reflects the implementation dose of the ACT model. Monthly domain scores for enhancing IPC and enabling data‐driven decisions were also calculated as the average score within each domain. This yielded 3 domain scores. Figure 1A plots by month the overall ACT score for the medical and surgical units, and Figure 1B plots the implementation score for the 3 domains between August 2012 and December 2013 for all units. The uptake of the interventions varied between units. This allowed our analysis to explore the dose relationships between the model and outcomes independent of underlying time trends that may be affected by concomitant initiatives.
| 1 | 2 | 3 | 4 | 5 | |
|---|---|---|---|---|---|
| |||||
| Geographical cohorting of patients and the ACT* | None | At least 1 discipline comprising the ACT is unit based | All disciplines comprising the ACT except the hospitalist unit based | All disciplines including the hospitalist unit based | 4 + 80% of hospitalist provider's patients on the unit |
| Bedside collaborative rounding | None | Occurring 1 day a week on at least 25% of the patients on the unit | Occurring 2 to 3 days a week on at least 50% of the patients on the unit | Occurring 3 to 4 days a week on at least 75% of the patients on the unit | Occurring MondayFriday on all patients on the unit |
| Daily huddle | None | Occurring daily, 1 out of 4 ACT disciplines represented, at least 25% of patients on the unit discussed | Occurring daily, 2 out of 4 ACT disciplines represented, at least 50% of patients on the unit discussed | Occurring daily, 3 out of 4 ACT disciplines represented, at least 75% of patients on the unit discussed | Occurring daily, all disciplines of the ACT represented, all patients on the unit discussed |
| Hospitalist and specialty comanagement agreements | None | One out of 3 specialists represented on the unit collaborating with the hospitalists on at least 25% of relevant patients | One out of 3 specialists represented on the unit collaborating with the hospitalists on at least 50% of relevant patients | Two out of 3 specialists on the unit collaborating with the hospitalists on at least 75% of relevant patients | All specialists on the unit collaborating with the hospitalists on all relevant patients on the unit |
| Unit white board | None | Present but only used by nursing | Present and used by all ACT disciplines except physician providers | Present and used by entire ACT; use inconsistent | Present and used MondayFriday by all disciplines of ACT |
| Monthly review of unit level data | None | Nurse manager reviewing data with ACT program director | Nurse manager and unit leader reviewing data with ACT program director | Meeting either not consistently occurring monthly or not consistently attended by entire ACT | Monthly meeting with entire ACT |
| Weekly patient satisfaction rounding | None | Nurse manager performing up to 1 week a month | Nurse manager performing weekly | Nurse and physician leader performing up to 3 times a month | Nurse and physician leader performing weekly |
| Leadership | None | For units with specialties, either hospitalist or specialist leader identified | Both hospitalist and specialist leader Identified | Both hospitalist and specialist leaders (where applicable) identified and partially engaged in leadership role | Both hospitalist and specialist leaders (where applicable) identified and engaged in leadership role |
Outcomes
Monthly data between August 2012 and December 2013 were analyzed.
Measures of Value
MH is a member of the University Health Consortium, which measures outcomes of participants relative to their peers. MH measures LOS index as a ratio of observed LOS to expected LOS that is adjusted for severity of illness.[5]
Variable direct costs (VDCs) are costs that a hospital can save if a service is not provided.[6] A hospital's case‐mix index (CMI) represents the average diagnosis‐related group relative weight for that hospital. We track VDCs adjusted for CMI (CMI‐adjusted VDC).[7]
Thirty‐day readmission rate is the percentage of cases that are readmitted to MH within 30 days of discharge from the index admission.[8]
Measures of Patient Satisfaction
The Hospital Consumer Assessment of Healthcare Providers and Systems (HCAHPS) survey covers topics relevant to a patient's experience in the hospital.[9] Patient satisfaction scores are tracked by responses to the HCAHPS survey.
Measures of Provider Satisfaction
Hospitalist and specialty providers, leadership, and case management teams were surveyed via email through SurveyMonkey in July 2014. The survey included Likert responses that elicited opinions and comments about the ACT model.
Statistical Methods
The primary predictor of interest was the monthly overall ACT score. We also explored the domain scores as well as the individual scores for each intervention. Generalized linear mixed models were fit to investigate the association between each predictor (overall ACT score, ACT domain scores, and individual implementation scores) and each outcome (LOS index, CMI‐adjusted VDC, 30‐day readmission rate, and overall patient satisfaction). The model for testing each ACT score also included covariates of inpatient units as a random effect, as well as date and type of unit as fixed effects. We set the statistical significance level at 0.01 and reported 99% confidence intervals.
Descriptive statistics were used to report the provider satisfaction survey results.
RESULTS
The overall ACT score was associated with LOS index and CMI‐adjusted VDC (both P < 0.001). For every 1‐unit increase in the overall ACT score, LOS index decreased by 0.078 and CMI‐adjusted VDC decreased by $273.99 (Table 3).
| Length of Stay Index | CMI Adjusted VDC | |||
|---|---|---|---|---|
| Estimate (99% CI)* | P Value | Estimate (99% CI)* | P Value | |
| ||||
| Overall ACT Score | 0.078 (0.123 to 0.032) | <0.001 | 274.0 (477.31 to 70.68) | <0.001 |
| Enhancing IPC | 0.071 (0.117 to 0.026) | <0.001 | 284.7 (488.08 to 81.23) | <0.001 |
| Enabling data‐driven decisions | 0.044 (0.080 to 0.009) | 0.002 | 145.4 (304.57 to 13.81) | 0.02 |
| Providing leadership | 0.027 (0.049 to 0.005) | 0.001 | 69.9 (169.00 to 29.26) | 0.07 |
Looking at domains, enhancing IPC resulted in statistically significant decreases in both LOS index and CMI‐adjusted VDC, but providing leadership and enabling data‐driven decisions decreased only the LOS index. Most of the 8 individual interventions were associated with at least 1 of these 2 outcomes. (Even where the associations were not significant, they were all in the direction of decreasing LOS and cost). In these models, the covariate of type of units (medical vs surgical) was not associated with LOS or cost. There was no significant time trend in LOS or cost, except in models where an intervention had no association with either outcome. Inclusion of all individual effective interventions in the same statistical model to assess their relative contributions was not possible because they were highly correlated (correlations 0.450.89).
Thirty‐day readmissions and patient satisfaction were not significantly associated with the overall ACT score, but exploratory analyses showed that patient satisfaction increased with the implementation of geographical cohorting (P = 0.007).
Survey Results
The response rate was 87% (96/110). Between 85% and 96% of respondents either agreed or strongly agreed that the ACT model had improved the quality and safety of the care delivered, improved communication between providers and patients, and improved their own engagement and job satisfaction. Overall, 78% of the respondents either agreed or strongly agreed that the model improved efficiency (Table 4). Suggestions for improvements revolved around increasing the emphasis on patient centeredness and bedside nursing engagement.
| The ACT Model | Strongly Agree, n (%) | Agree, n (%) | Disagree, n (%) | Strongly Disagree, n (%) |
|---|---|---|---|---|
| ||||
| Has improved the quality and safety of patient care | 46 (47.9) | 46 (47.9) | 2 (2.1) | 2 (2.1) |
| Has improved communication with patients and families | 42 (43.7) | 47 (49.0) | 5 (5.2) | 2 (2.1) |
| Has improved your efficiency/productivity | 31 (32.6) | 43 (45.3) | 17 (17.9) | 4 (4.2) |
| Has improved your engagement and job satisfaction | 33 (34.4) | 49 (51.0) | 10 (10.4) | 4 (4.2) |
| Is a better model of delivering patient care | 45 (47.4) | 44 (46.3) | 2 (2.1) | 4 (4.2) |
DISCUSSION
The serious problems in US healthcare constitute an urgent imperative to innovate and reform.[10] Inpatient care reflects 31% of the expenditure on healthcare, and in 2010, 35.1 million patients were discharged from the hospital after spending an average of 4.8 days as an inpatient.[11] These figures represent an immense opportunity to intervene. Measuring the impact of quality improvement efforts is often complicated by concomitant changes that affect outcomes over the interval studied. Our approach allowed us to detect statistically significant changes in LOS index and CMI‐adjusted VDC associated with the ACT implementation dose that could be separated from the underlying time trends.
The ACT model we describe is rooted in improving 3 foundational domains; quantifying each intervention's compartmentalized contribution, however, proved difficult. Each intervention intertwines with the others to create changes in attitudes, knowledge, and culture that are difficult to measure yet may synergistically affect outcomes. For example, although geographical cohorting appears to have the strongest statistical association with outcomes, this may be mediated by how it enables other processes to take place more effectively. Based on this analysis, therefore, the ACT model may best be considered a bundled intervention.
The team caring for a patient during hospitalization is so complex that fewer than a quarter of patients know their physician's or nurse's name.[12] This complexity impairs communication between patients and providers and between the providers themselves. Communication failures are consistently identified as root causes in sentinel events reported to the Joint Commission.[13] IPC is the process by which different professional groups work together to positively impact health care. IPC overlaps with communication, coordination, and teamwork, and improvements in IPC may improve care.[14] Some elements of the model we describe have been tested previously.[15, 16, 17] Localization of teams may increase productivity and the frequency with which physicians and nurses communicate. Localization also decreases the number of pages received and steps walked by providers during a workday.[15, 16, 17] However, these studies reported a trend toward an increase in the LOS and neutral effects on cost and readmission rates. We found statistically significant decreases in both LOS and cost associated with the geographic cohorting of patients and providers. Notably, our model localized not only the physician providers but also the interdisciplinary team of pharmacists, clinical nurse specialists, case managers, and social workers. This proximity may facilitate IPC between all members that culminates in improved efficiency. The possibility of delays in discharges to avoid new admissions in a geographically structured team has previously been raised to explain the associated increases in LOS.[16, 17] The accountability of each unit for its metrics, the communication between nursing and physicians, and the timely availability of the unit's performance data aligns everyone toward a shared goal and provides some protection from an unintended consequence.
Structured interdisciplinary rounds decrease adverse events and improve teamwork ratings.[18, 19] The huddle in our model is a forum to collaborate between disciplines that proved to be effective in decreasing LOS and costs. Our huddle aims to discuss all the patients on the unit. This allows the team to assist each other in problem solving for the entire unit and not just the patients on the geographically cohorted team. This approach, in addition to the improved IPC fostered by the ACT model, may help explain how benefits in LOS and costs permeated across all 11 diverse units despite the presence of patients who are not directly served by the geographically cohorted team.
High‐performing clinical systems maintain an awareness of their overarching mission and unit‐based leaders can influence the frontline by reiterating the organizational mission and aligning efforts with outcomes.[20] Our leadership model is similar to those described by other institutions in the strong partnerships between physicians and nursing.[21] As outlined by Kim et al., investing in the professional development of the unit leaders may help them fulfill their roles and serve the organization better.[21]
The fragmentation and lack of ownership over the continuum of patient care causes duplication and waste. The proposal in the Accountable Care Act to create accountable care organizations is rooted in the understanding that providers and organizations will seek out new ways of improving quality when held accountable for their outcomes.[22] To foster ownership and accountability, reporting of metrics at the unit level is needed. Furthermore, an informational infrastructure is critical, as improvements cannot occur without the availability of data to both monitor performance and measure the effect of interventions.[10, 23] Even without any other interventions, providing feedback alone is an effective way of changing practices.[24] According to Berwick et al., this phenomenon reflects practitioners' intrinsic motivation to simply want to be better.[25] Our monthly review of each unit's data is an effective way to provide timely feedback to the frontline that sparks pride, ownership, and innovative thinking.
Based on our mean ACT score and CMI‐adjusted VDC reductions alone, we estimate savings of $649.36 per hospitalization (mean increase in ACT implementation of 2.37 times reduction in cost index of $273.99 per unit increase in overall ACT score). This figure does not include savings realized through reductions in LOS. This is a small decrease relative to the mean cost of hospitalization, yet when compounded over the annual MH census, it would result in substantial savings. The model relied on the restructuring of the existing workforce and the only direct additional cost was the early salary support for the ACT program director.
Limitations
We recognize several limitations. It is a single center's experience and may not be generalizable. The diffusion of knowledge and culture carried between units and the relatively rapid implementation timeline did not allow for a control unit. A single observer assigned our implementation scores, and therefore we cannot report measures of inter‐rater reliability. However, defined criteria and direct observations were used wherever possible. Although administratively available data have their limitations, where available, we used measurements that are adjusted for severity of illness and CMI. We therefore feel that this dataset is an accurate representation of currently reported national quality indicators.
FURTHER DIRECTIONS
Although there is a need to improve our healthcare system, interventions should be deliberate and evidence based wherever possible.[26] Geographic cohorting may decrease the frequency of paging interruptions for physicians and practitioners while increasing face‐to‐face interruptions.[27] The net effect on safety with this trade‐off should be investigated.
The presence of an intervention does not guarantee its success. Despite geographic cohorting and interdisciplinary meetings, communication that influences physician decision making may not improve.[28] Although instruments to measure ratings of team work and collaboration are available, focusing on clinically relevant outcomes of teamwork, such as prevention of harm, may be more empowering feedback for the frontline. Formal cost‐benefit analyses and outcomes related to physician and nursing retention will be equally important for assessing the sustainability of the model. Involving patients and their caregivers and inviting their perspectives as care is redesigned will also be critical in maintaining patient centeredness. Research addressing interventions to mediate preventable readmission risk and understanding the drivers of patient satisfaction is also needed.
The true value of the model may be in its potential to monitor and drive change within itself. Continuously aligning aims, incentives, performance measures, and feedback will help support this innovation and drive. This affects not only patient care but creates microcosms within which research and education can thrive. We hope that our experience will help guide other institutions as we all strive in our journey to improve the care we deliver.
Acknowledgements
The authors thank the Indiana University Health Physicians hospitalists at MH, Sandy Janitz and Decision Support, the Indiana University Health executive leadership team, Robert Clark, Malaz Boustani, Dennis Watson, Nadia Adams, Todd Biggerstaff, Deanne Kashiwagi, and the tireless providers at MH for their support.
Disclosure: This work was supported by a grant from the Indiana University Health Values Fund. The authors have no conflicts of interest to disclose.
- Committee on Quality of Health Care in America; Institute of Medicine. Crossing the Quality Chasm: A New Health System for the 21st Century. Washington, DC: The National Academies Press; 2001.
- . Is US health really the best in the world? JAMA. 2000;284(4):483–485.
- , , , , , . Temporal trends in rates of patient harm resulting from medical care. N Engl J Med. 2010;363(22):2124–2134.
- Indiana University Health. Available at: http://iuhealth.org/methodist/aboIut/. Accessed October 20, 2014.
- University Health Consortium. Available at: https://www.uhc.edu/docs/45014769_QSS_dashboard_FAQs.pdf. Accessed October 23, 2014.
- , , , et al. Distribution of variable vs fixed costs of hospital care. JAMA. 1999;281(7):644–649.
- Centers for Medicare and Medicaid Services. Case mix index. Available at: http://www.cms.gov/Medicare/Medicare‐Fee‐for‐Service‐Payment/AcuteInpatientPPS/Acute‐Inpatient‐Files‐for‐Download‐Items/CMS022630.html. Accessed May 4, 2015.
- University Health Consortium. Available at: https://www.uhc.edu. Accessed October 23, 2014.
- Centers for Medicare and Medicaid Services. Hospital Consumer Assessment of Healthcare Providers and Systems. HCAHPS survey content and administration. Centers for Medicare 280(11):1000–1005.
- Centers for Disease Control and Prevention. FastStats. Available at: http://www.cdc.gov/nchs/fastats/default.htm. Accessed October 27, 2014.
- , . Does your patient know your name? An approach to enhancing patients' awareness of their caretaker's name. J Healthc Qual. 2005;27(4):53–56.
- The Joint Commission. Sentinel event data: root causes by event type 2004‐third quarter. Available at: http://www.jointcommissionorg. Available at: http://www.jointcommission.org/assets/1/18/Root_Causes_by_Event_Type_2004-2Q2013.pdf. Accessed March 26, 2014.
- , , . Interprofessional collaboration: effects of practice‐based interventions on professional practice and healthcare outcomes. Cochrane Database Syst Rev. 2009;(3):CD000072.
- , , , et al. Impact of localizing physicians to hospital units on nurse–physician communication and agreement on the plan of care. J Gen Intern Med. 2009;24(11):1223–1227.
- , , , et al. Impact of localizing general medical teams to a single nursing unit. J Hosp Med. 2012;7(7):551–556.
- , , , et al. Implementation of a physician assistant/hospitalist service in an academic medical center: impact on efficiency and patient outcomes. J Hosp Med. 2008;3(5):361–368.
- , , , , , . Improving teamwork: impact of structured interdisciplinary rounds on a medical teaching unit. J Gen Intern Med. 2010;25(8):826–832.
- , , , ; High Performance Teams and the Hospital of the Future Project Team. Interdisciplinary teamwork in hospitals: a review and practical recommendations for improvement. J Hosp Med. 2011;7(1):48–54.
- , , , , , . Microsystems in health care: part 8. Developing people and improving work life: what front‐line staff told us. Jt Comm J Qual Saf. 2003;29(10):512–522.
- , , , , , . Unit‐based interprofessional leadership models in six US hospitals. J Hosp Med. 2014;9(8):545–550.
- , , , . Creating accountable care organizations: the extended hospital medical staff. Health Aff (Millwood). 2007;26(1):w44–w57.
- , . Using performance measurement to drive improvement: a road map for change. Med Care. 2003;41(1 suppl):I48–I60.
- , . Changing physicians' practices. N Engl J Med. 1993;329(17):1271–1273.
- , , . Connections between quality measurement and improvement. Med Care. 2003;41(1 suppl):I30–I38.
- , , . The tension between needing to improve care and knowing how to do it. N Engl J Med. 2007;357(6):608–613.
- , . A qualitative evaluation of geographical localization of hospitalists: how unintended consequences may impact quality. J Gen Intern Med. 2014;29(7):1009–1016.
- , , , , . Disengaged: a qualitative study of communication and collaboration between physicians and other professions on general internal medicine wards. BMC Health Serv Res. 2013;13:494.
Despite an estimated annual $2.6 trillion expenditure on healthcare, the United States performs poorly on indicators of health and harm during care.[1, 2, 3] Hospitals around the nation are working to improve the care they deliver. We describe a model developed at our institution and report the evaluation of the outcomes associated with its implementation on the general medical and surgical units. The Indiana University Institutional Review Board approved this work.
SETTING AND DEFINITIONS
Indiana University Health Methodist Hospital (MH) is an academic center in Indianapolis, Indiana, serving over 30,000 patients annually.[4] In 2012, responding to the coexisting needs to improve quality and contain costs, the MH leadership team redesigned care in the hospital. The new model centers around accountable care teams (ACTs). Each ACT is a geographically defined set of providers accepting ownership for the clinical, service, and financial outcomes of their respective inpatient unit. The units studied are described in Table 1.
| Unit | No. of Beds | Predominant Diagnosis (Maximum Domain Score)* | |
|---|---|---|---|
| |||
| Medical units with progressive‐care beds | 1 | 33 | Pulmonary (3.4, 3.5, 5) |
| 2 | 28 | Cardiology (4.8, 3.5, 4) | |
| 3 | 24 | General medical (4.8, 3.5, 4) | |
| Medical units without progressive‐care beds | 4 | 36 | Renal/diabetic (4, 3.5, 5) |
| 5 | 24 | General medical (3.75, 4, 5) | |
| Surgical units with progressive‐care beds | 6 | 51 | Cardiothoracic surgery/cardiology (4, 4, 5) |
| 7 | 29 | Trauma/general surgery (3.75, 3.5, 5) | |
| 8 | 23 | Neurosurgical/neurological (4.8, 5, 5) | |
| 9 | 24 | Neurosurgical/neurological (4.4, 4.5, 5) | |
| Surgical units without progressive‐care beds | 10 | 29 | General/urologic/gynecologic/plastic surgery (3.4, 3, 2) |
| 11 | 26 | Orthopedic surgery (4.6, 4, 5) | |
THE ACT MODEL
The model comprises 8 interventions rooted in 3 foundational domains: (1) enhancing interprofessional collaboration (IPC), (2) enabling data‐driven decisions, and (3) providing leadership. Each intervention is briefly described under its main focus (see Supporting Information, Appendix A, in the online version of this article for further details).
Enhancing IPC
Geographical Cohorting of Patients and Providers
Hospitalist providers are localized for 4 consecutive months to 1 unit. An interdisciplinary team including a case manager, clinical nurse specialist, pharmacist, nutritionist, and social worker also serve each unit. Learners (residents, pharmacy, and medical students) are embedded in the team when rotating on the hospital medicine service. The presence of unit‐based nurse managers and charge nurses predates the model and is retained.
Bedside Collaborative Rounding
Geographically cohorted providers round on their patients with the bedside nurse guided by a customizable script.
Daily Huddle
The hospitalist, learners, and the interdisciplinary team for the unit meet each weekday to discuss patients' needs for a safe transition out of the hospital. Each unit determined the timing, location, and script for the huddle while retaining the focus on discharge planning (see Supporting Information, Appendix A2, in the online version of this article for a sample script).
Hospitalist and Specialty Comanagement Agreements
Guidelines delineating responsibilities for providers of each specialty were developed. Examples include orders pertaining to the management of a dialysis catheter in a patient with end‐stage renal disease, the removal of drains in postsurgical patients, and wound care.
Unit White Board
Each unit has a white board at the nursing station. Similar to the huddle, it is focused on discharge planning.
Enabling Data‐Driven Decisions
Monthly Review of Unit‐Level Data
Data analytics at our institution developed a data dashboard. Key metrics including length of stay (LOS), patient satisfaction scores, readmission rates, and costs are tracked and attributed to the discharging unit. The data are collated monthly by the ACT program director and distributed to each unit's leadership. Monthly interdisciplinary meetings are held to review trends. Learners are encouraged but not required to attend.
Weekly Patient Satisfaction Rounding
The unit's nurse manager and physician leader conduct weekly satisfaction rounds on patients. The conversation is open‐ended and focused on eliciting positive and negative experiences.
Providing Leadership
Designated hospitalist and, where relevant, specialty leaders are committed to serve each unit for at least 1 year as a resource for both medical and operational problem solving. The leader stays closely connected with the unit's nurse manager. In addition to day‐to‐day troubleshooting, the leader is responsible for monitoring outcome trends. There is currently no stipend, training, or other incentive offered for the role.
Implementation Timelines and ACT Scores
The development of the ACTs started in the spring of 2012. Physician, nursing, and pharmacy support was sought, and a pilot unit was formed in August 2012. The model was cascaded hospital wide by December 2013, with support from the ACT program director (A.N.). The program director observed and scored the uptake of each intervention by each unit monthly. A score of 1 denoted no implementation, whereas 5 denoted complete implementation. The criteria for scoring are presented in Table 2. The monthly scores for all 8 interventions in each of the 11 units were averaged as an overall ACT score, which reflects the implementation dose of the ACT model. Monthly domain scores for enhancing IPC and enabling data‐driven decisions were also calculated as the average score within each domain. This yielded 3 domain scores. Figure 1A plots by month the overall ACT score for the medical and surgical units, and Figure 1B plots the implementation score for the 3 domains between August 2012 and December 2013 for all units. The uptake of the interventions varied between units. This allowed our analysis to explore the dose relationships between the model and outcomes independent of underlying time trends that may be affected by concomitant initiatives.
| 1 | 2 | 3 | 4 | 5 | |
|---|---|---|---|---|---|
| |||||
| Geographical cohorting of patients and the ACT* | None | At least 1 discipline comprising the ACT is unit based | All disciplines comprising the ACT except the hospitalist unit based | All disciplines including the hospitalist unit based | 4 + 80% of hospitalist provider's patients on the unit |
| Bedside collaborative rounding | None | Occurring 1 day a week on at least 25% of the patients on the unit | Occurring 2 to 3 days a week on at least 50% of the patients on the unit | Occurring 3 to 4 days a week on at least 75% of the patients on the unit | Occurring MondayFriday on all patients on the unit |
| Daily huddle | None | Occurring daily, 1 out of 4 ACT disciplines represented, at least 25% of patients on the unit discussed | Occurring daily, 2 out of 4 ACT disciplines represented, at least 50% of patients on the unit discussed | Occurring daily, 3 out of 4 ACT disciplines represented, at least 75% of patients on the unit discussed | Occurring daily, all disciplines of the ACT represented, all patients on the unit discussed |
| Hospitalist and specialty comanagement agreements | None | One out of 3 specialists represented on the unit collaborating with the hospitalists on at least 25% of relevant patients | One out of 3 specialists represented on the unit collaborating with the hospitalists on at least 50% of relevant patients | Two out of 3 specialists on the unit collaborating with the hospitalists on at least 75% of relevant patients | All specialists on the unit collaborating with the hospitalists on all relevant patients on the unit |
| Unit white board | None | Present but only used by nursing | Present and used by all ACT disciplines except physician providers | Present and used by entire ACT; use inconsistent | Present and used MondayFriday by all disciplines of ACT |
| Monthly review of unit level data | None | Nurse manager reviewing data with ACT program director | Nurse manager and unit leader reviewing data with ACT program director | Meeting either not consistently occurring monthly or not consistently attended by entire ACT | Monthly meeting with entire ACT |
| Weekly patient satisfaction rounding | None | Nurse manager performing up to 1 week a month | Nurse manager performing weekly | Nurse and physician leader performing up to 3 times a month | Nurse and physician leader performing weekly |
| Leadership | None | For units with specialties, either hospitalist or specialist leader identified | Both hospitalist and specialist leader Identified | Both hospitalist and specialist leaders (where applicable) identified and partially engaged in leadership role | Both hospitalist and specialist leaders (where applicable) identified and engaged in leadership role |
Outcomes
Monthly data between August 2012 and December 2013 were analyzed.
Measures of Value
MH is a member of the University Health Consortium, which measures outcomes of participants relative to their peers. MH measures LOS index as a ratio of observed LOS to expected LOS that is adjusted for severity of illness.[5]
Variable direct costs (VDCs) are costs that a hospital can save if a service is not provided.[6] A hospital's case‐mix index (CMI) represents the average diagnosis‐related group relative weight for that hospital. We track VDCs adjusted for CMI (CMI‐adjusted VDC).[7]
Thirty‐day readmission rate is the percentage of cases that are readmitted to MH within 30 days of discharge from the index admission.[8]
Measures of Patient Satisfaction
The Hospital Consumer Assessment of Healthcare Providers and Systems (HCAHPS) survey covers topics relevant to a patient's experience in the hospital.[9] Patient satisfaction scores are tracked by responses to the HCAHPS survey.
Measures of Provider Satisfaction
Hospitalist and specialty providers, leadership, and case management teams were surveyed via email through SurveyMonkey in July 2014. The survey included Likert responses that elicited opinions and comments about the ACT model.
Statistical Methods
The primary predictor of interest was the monthly overall ACT score. We also explored the domain scores as well as the individual scores for each intervention. Generalized linear mixed models were fit to investigate the association between each predictor (overall ACT score, ACT domain scores, and individual implementation scores) and each outcome (LOS index, CMI‐adjusted VDC, 30‐day readmission rate, and overall patient satisfaction). The model for testing each ACT score also included covariates of inpatient units as a random effect, as well as date and type of unit as fixed effects. We set the statistical significance level at 0.01 and reported 99% confidence intervals.
Descriptive statistics were used to report the provider satisfaction survey results.
RESULTS
The overall ACT score was associated with LOS index and CMI‐adjusted VDC (both P < 0.001). For every 1‐unit increase in the overall ACT score, LOS index decreased by 0.078 and CMI‐adjusted VDC decreased by $273.99 (Table 3).
| Length of Stay Index | CMI Adjusted VDC | |||
|---|---|---|---|---|
| Estimate (99% CI)* | P Value | Estimate (99% CI)* | P Value | |
| ||||
| Overall ACT Score | 0.078 (0.123 to 0.032) | <0.001 | 274.0 (477.31 to 70.68) | <0.001 |
| Enhancing IPC | 0.071 (0.117 to 0.026) | <0.001 | 284.7 (488.08 to 81.23) | <0.001 |
| Enabling data‐driven decisions | 0.044 (0.080 to 0.009) | 0.002 | 145.4 (304.57 to 13.81) | 0.02 |
| Providing leadership | 0.027 (0.049 to 0.005) | 0.001 | 69.9 (169.00 to 29.26) | 0.07 |
Looking at domains, enhancing IPC resulted in statistically significant decreases in both LOS index and CMI‐adjusted VDC, but providing leadership and enabling data‐driven decisions decreased only the LOS index. Most of the 8 individual interventions were associated with at least 1 of these 2 outcomes. (Even where the associations were not significant, they were all in the direction of decreasing LOS and cost). In these models, the covariate of type of units (medical vs surgical) was not associated with LOS or cost. There was no significant time trend in LOS or cost, except in models where an intervention had no association with either outcome. Inclusion of all individual effective interventions in the same statistical model to assess their relative contributions was not possible because they were highly correlated (correlations 0.450.89).
Thirty‐day readmissions and patient satisfaction were not significantly associated with the overall ACT score, but exploratory analyses showed that patient satisfaction increased with the implementation of geographical cohorting (P = 0.007).
Survey Results
The response rate was 87% (96/110). Between 85% and 96% of respondents either agreed or strongly agreed that the ACT model had improved the quality and safety of the care delivered, improved communication between providers and patients, and improved their own engagement and job satisfaction. Overall, 78% of the respondents either agreed or strongly agreed that the model improved efficiency (Table 4). Suggestions for improvements revolved around increasing the emphasis on patient centeredness and bedside nursing engagement.
| The ACT Model | Strongly Agree, n (%) | Agree, n (%) | Disagree, n (%) | Strongly Disagree, n (%) |
|---|---|---|---|---|
| ||||
| Has improved the quality and safety of patient care | 46 (47.9) | 46 (47.9) | 2 (2.1) | 2 (2.1) |
| Has improved communication with patients and families | 42 (43.7) | 47 (49.0) | 5 (5.2) | 2 (2.1) |
| Has improved your efficiency/productivity | 31 (32.6) | 43 (45.3) | 17 (17.9) | 4 (4.2) |
| Has improved your engagement and job satisfaction | 33 (34.4) | 49 (51.0) | 10 (10.4) | 4 (4.2) |
| Is a better model of delivering patient care | 45 (47.4) | 44 (46.3) | 2 (2.1) | 4 (4.2) |
DISCUSSION
The serious problems in US healthcare constitute an urgent imperative to innovate and reform.[10] Inpatient care reflects 31% of the expenditure on healthcare, and in 2010, 35.1 million patients were discharged from the hospital after spending an average of 4.8 days as an inpatient.[11] These figures represent an immense opportunity to intervene. Measuring the impact of quality improvement efforts is often complicated by concomitant changes that affect outcomes over the interval studied. Our approach allowed us to detect statistically significant changes in LOS index and CMI‐adjusted VDC associated with the ACT implementation dose that could be separated from the underlying time trends.
The ACT model we describe is rooted in improving 3 foundational domains; quantifying each intervention's compartmentalized contribution, however, proved difficult. Each intervention intertwines with the others to create changes in attitudes, knowledge, and culture that are difficult to measure yet may synergistically affect outcomes. For example, although geographical cohorting appears to have the strongest statistical association with outcomes, this may be mediated by how it enables other processes to take place more effectively. Based on this analysis, therefore, the ACT model may best be considered a bundled intervention.
The team caring for a patient during hospitalization is so complex that fewer than a quarter of patients know their physician's or nurse's name.[12] This complexity impairs communication between patients and providers and between the providers themselves. Communication failures are consistently identified as root causes in sentinel events reported to the Joint Commission.[13] IPC is the process by which different professional groups work together to positively impact health care. IPC overlaps with communication, coordination, and teamwork, and improvements in IPC may improve care.[14] Some elements of the model we describe have been tested previously.[15, 16, 17] Localization of teams may increase productivity and the frequency with which physicians and nurses communicate. Localization also decreases the number of pages received and steps walked by providers during a workday.[15, 16, 17] However, these studies reported a trend toward an increase in the LOS and neutral effects on cost and readmission rates. We found statistically significant decreases in both LOS and cost associated with the geographic cohorting of patients and providers. Notably, our model localized not only the physician providers but also the interdisciplinary team of pharmacists, clinical nurse specialists, case managers, and social workers. This proximity may facilitate IPC between all members that culminates in improved efficiency. The possibility of delays in discharges to avoid new admissions in a geographically structured team has previously been raised to explain the associated increases in LOS.[16, 17] The accountability of each unit for its metrics, the communication between nursing and physicians, and the timely availability of the unit's performance data aligns everyone toward a shared goal and provides some protection from an unintended consequence.
Structured interdisciplinary rounds decrease adverse events and improve teamwork ratings.[18, 19] The huddle in our model is a forum to collaborate between disciplines that proved to be effective in decreasing LOS and costs. Our huddle aims to discuss all the patients on the unit. This allows the team to assist each other in problem solving for the entire unit and not just the patients on the geographically cohorted team. This approach, in addition to the improved IPC fostered by the ACT model, may help explain how benefits in LOS and costs permeated across all 11 diverse units despite the presence of patients who are not directly served by the geographically cohorted team.
High‐performing clinical systems maintain an awareness of their overarching mission and unit‐based leaders can influence the frontline by reiterating the organizational mission and aligning efforts with outcomes.[20] Our leadership model is similar to those described by other institutions in the strong partnerships between physicians and nursing.[21] As outlined by Kim et al., investing in the professional development of the unit leaders may help them fulfill their roles and serve the organization better.[21]
The fragmentation and lack of ownership over the continuum of patient care causes duplication and waste. The proposal in the Accountable Care Act to create accountable care organizations is rooted in the understanding that providers and organizations will seek out new ways of improving quality when held accountable for their outcomes.[22] To foster ownership and accountability, reporting of metrics at the unit level is needed. Furthermore, an informational infrastructure is critical, as improvements cannot occur without the availability of data to both monitor performance and measure the effect of interventions.[10, 23] Even without any other interventions, providing feedback alone is an effective way of changing practices.[24] According to Berwick et al., this phenomenon reflects practitioners' intrinsic motivation to simply want to be better.[25] Our monthly review of each unit's data is an effective way to provide timely feedback to the frontline that sparks pride, ownership, and innovative thinking.
Based on our mean ACT score and CMI‐adjusted VDC reductions alone, we estimate savings of $649.36 per hospitalization (mean increase in ACT implementation of 2.37 times reduction in cost index of $273.99 per unit increase in overall ACT score). This figure does not include savings realized through reductions in LOS. This is a small decrease relative to the mean cost of hospitalization, yet when compounded over the annual MH census, it would result in substantial savings. The model relied on the restructuring of the existing workforce and the only direct additional cost was the early salary support for the ACT program director.
Limitations
We recognize several limitations. It is a single center's experience and may not be generalizable. The diffusion of knowledge and culture carried between units and the relatively rapid implementation timeline did not allow for a control unit. A single observer assigned our implementation scores, and therefore we cannot report measures of inter‐rater reliability. However, defined criteria and direct observations were used wherever possible. Although administratively available data have their limitations, where available, we used measurements that are adjusted for severity of illness and CMI. We therefore feel that this dataset is an accurate representation of currently reported national quality indicators.
FURTHER DIRECTIONS
Although there is a need to improve our healthcare system, interventions should be deliberate and evidence based wherever possible.[26] Geographic cohorting may decrease the frequency of paging interruptions for physicians and practitioners while increasing face‐to‐face interruptions.[27] The net effect on safety with this trade‐off should be investigated.
The presence of an intervention does not guarantee its success. Despite geographic cohorting and interdisciplinary meetings, communication that influences physician decision making may not improve.[28] Although instruments to measure ratings of team work and collaboration are available, focusing on clinically relevant outcomes of teamwork, such as prevention of harm, may be more empowering feedback for the frontline. Formal cost‐benefit analyses and outcomes related to physician and nursing retention will be equally important for assessing the sustainability of the model. Involving patients and their caregivers and inviting their perspectives as care is redesigned will also be critical in maintaining patient centeredness. Research addressing interventions to mediate preventable readmission risk and understanding the drivers of patient satisfaction is also needed.
The true value of the model may be in its potential to monitor and drive change within itself. Continuously aligning aims, incentives, performance measures, and feedback will help support this innovation and drive. This affects not only patient care but creates microcosms within which research and education can thrive. We hope that our experience will help guide other institutions as we all strive in our journey to improve the care we deliver.
Acknowledgements
The authors thank the Indiana University Health Physicians hospitalists at MH, Sandy Janitz and Decision Support, the Indiana University Health executive leadership team, Robert Clark, Malaz Boustani, Dennis Watson, Nadia Adams, Todd Biggerstaff, Deanne Kashiwagi, and the tireless providers at MH for their support.
Disclosure: This work was supported by a grant from the Indiana University Health Values Fund. The authors have no conflicts of interest to disclose.
- Committee on Quality of Health Care in America; Institute of Medicine. Crossing the Quality Chasm: A New Health System for the 21st Century. Washington, DC: The National Academies Press; 2001.
- . Is US health really the best in the world? JAMA. 2000;284(4):483–485.
- , , , , , . Temporal trends in rates of patient harm resulting from medical care. N Engl J Med. 2010;363(22):2124–2134.
- Indiana University Health. Available at: http://iuhealth.org/methodist/aboIut/. Accessed October 20, 2014.
- University Health Consortium. Available at: https://www.uhc.edu/docs/45014769_QSS_dashboard_FAQs.pdf. Accessed October 23, 2014.
- , , , et al. Distribution of variable vs fixed costs of hospital care. JAMA. 1999;281(7):644–649.
- Centers for Medicare and Medicaid Services. Case mix index. Available at: http://www.cms.gov/Medicare/Medicare‐Fee‐for‐Service‐Payment/AcuteInpatientPPS/Acute‐Inpatient‐Files‐for‐Download‐Items/CMS022630.html. Accessed May 4, 2015.
- University Health Consortium. Available at: https://www.uhc.edu. Accessed October 23, 2014.
- Centers for Medicare and Medicaid Services. Hospital Consumer Assessment of Healthcare Providers and Systems. HCAHPS survey content and administration. Centers for Medicare 280(11):1000–1005.
- Centers for Disease Control and Prevention. FastStats. Available at: http://www.cdc.gov/nchs/fastats/default.htm. Accessed October 27, 2014.
- , . Does your patient know your name? An approach to enhancing patients' awareness of their caretaker's name. J Healthc Qual. 2005;27(4):53–56.
- The Joint Commission. Sentinel event data: root causes by event type 2004‐third quarter. Available at: http://www.jointcommissionorg. Available at: http://www.jointcommission.org/assets/1/18/Root_Causes_by_Event_Type_2004-2Q2013.pdf. Accessed March 26, 2014.
- , , . Interprofessional collaboration: effects of practice‐based interventions on professional practice and healthcare outcomes. Cochrane Database Syst Rev. 2009;(3):CD000072.
- , , , et al. Impact of localizing physicians to hospital units on nurse–physician communication and agreement on the plan of care. J Gen Intern Med. 2009;24(11):1223–1227.
- , , , et al. Impact of localizing general medical teams to a single nursing unit. J Hosp Med. 2012;7(7):551–556.
- , , , et al. Implementation of a physician assistant/hospitalist service in an academic medical center: impact on efficiency and patient outcomes. J Hosp Med. 2008;3(5):361–368.
- , , , , , . Improving teamwork: impact of structured interdisciplinary rounds on a medical teaching unit. J Gen Intern Med. 2010;25(8):826–832.
- , , , ; High Performance Teams and the Hospital of the Future Project Team. Interdisciplinary teamwork in hospitals: a review and practical recommendations for improvement. J Hosp Med. 2011;7(1):48–54.
- , , , , , . Microsystems in health care: part 8. Developing people and improving work life: what front‐line staff told us. Jt Comm J Qual Saf. 2003;29(10):512–522.
- , , , , , . Unit‐based interprofessional leadership models in six US hospitals. J Hosp Med. 2014;9(8):545–550.
- , , , . Creating accountable care organizations: the extended hospital medical staff. Health Aff (Millwood). 2007;26(1):w44–w57.
- , . Using performance measurement to drive improvement: a road map for change. Med Care. 2003;41(1 suppl):I48–I60.
- , . Changing physicians' practices. N Engl J Med. 1993;329(17):1271–1273.
- , , . Connections between quality measurement and improvement. Med Care. 2003;41(1 suppl):I30–I38.
- , , . The tension between needing to improve care and knowing how to do it. N Engl J Med. 2007;357(6):608–613.
- , . A qualitative evaluation of geographical localization of hospitalists: how unintended consequences may impact quality. J Gen Intern Med. 2014;29(7):1009–1016.
- , , , , . Disengaged: a qualitative study of communication and collaboration between physicians and other professions on general internal medicine wards. BMC Health Serv Res. 2013;13:494.
© 2015 Society of Hospital Medicine
