User login
Predictors of County-Level Home Modification Use Across the US
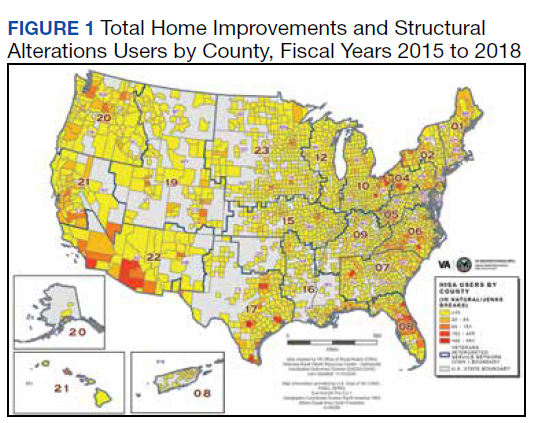
This article is part of a series of articles on the Home Improvements and Structural Alterations program (HISA), a home modification (HM) program within the Veterans Health Administration (VHA). HISA is a benefit awarded to veterans with disabilities (VWDs) and is instrumental in affording physical accessibility and structural alterations to veterans’ homes.1 The overarching goals of this project are to describe and understand HISA use by VWDs. Previous work has shown geographical variation in the number of HISA prescriptions across counties in the US (Figure 1).1 The current work seeks to describe and predict the county-level rates of HISA use. Information about what predicts HISA utilization at the county level is important because it enhances understanding of program utilization at a national level. The long-term goal of the series is to provide knowledge about HM services within VHA to improve community-based independent living of VWDs by increasing awareness and utilization of HM services.
Background
A health care professional (HCP) approves a HM support award by evaluating the practicality of the support to improve the built environment of a given veteran’s disability.1,2 Previously we detailed some of the preliminary research into the HISA program, including HISA user demographic and clinical characteristics, types of HMs received, user suggestions for improvement, and geospatial analysis of HISA prescriptions concentration.1-4
The geospatial analyses of HISA prescriptions revealed clusters of high numbers of HISA users (hot spots) and low numbers of HISA users (cold spots), indicating that HISA is either not prescribed or uniformly used across the US. The previous research prompted investigation into county-level variables that may impact HISA utilization rates. This inquiry focuses on county characteristics associated with HISA use rates, such as measures of clinical care and quality of care (eg, access to health services variables, lack of insurance, preventable hospital stays), physical environment, and sociodemographic characteristics. Clinical care and quality of care measures promote the interaction with HCPs. Moreover, access to health care is an important indicator of health outcomes.5,6 An individual’s capacity to access health services, such as a HM program, greatly impacts well-being, safety, independence, and health.2,4 Well-being, safety, independence, and health become compromised if individuals cannot access care, if needed care is lacking in their area, if HCPs are not available, or are unwilling to provide care due to lack of insurance coverage.7-12 In locations where health care services are minimal due to lack of specialists or health care facilities, the quality of (or access to) care may be compromised, resulting in preventable conditions becoming problematic.13,14 These conditions may result in unnecessary hospitalizations for conditions that could have been treated during routine care. Financial barriers to care particularly among low-income people and the uninsured have proven detrimental to health.15,16 On the other hand, preventable hospital stays are a quality of care measure (ie, a proxy for poor quality of care). HISA operates within a health care system; thus, it is imperative to include these measures impacting health.
In this study, we sought to identify county-level predictors—in particular, county-level proxies for access to care—that may be associated with county-level HISA use. We define HISA utilization rate as the percentage of a county’s VHA patients who have received a HISA award.
Methods
This study used data from the National Prosthetics Patient Database (NPPD), US Department of Veterans Affairs (VA) medical database inpatient and outpatient datasets, VHA Support Service Center (VSSC) data cubes, and the County Health Rankings database (CHRD). First, the study cohort was identified from NPPD users who have obtained a HISA award from fiscal years (FY) 2015 to 2018. Analysis started with FY 2015 following new regulations (38 CFR § 17) governing the operations of the HISA program.2 The study cohort was matched with records from NPPD and VA inpatient and outpatient datasets to obtain information about the veterans’ demographic characteristics and their HM characteristics and costs. The number of VHA end-of-year (EOY) patients per county was extracted from the VSSC Current Enrollment Cube, which was used in calculation of the county-level HISA utilization rate.17 Finally, zip code–based locational data were used to calculate approximate drive time and distance from the HISA user’s approximate location to the facility where they received their HM prescription. Drive times and drive distances were calculated with Esri ArcGIS Pro (v2.6.3) by placing zip code centroid and VHA facilities on a nationwide road network that contains both road speeds and distances.
Calculations
Patient-level data were aggregated up to county-level variables by calculating the sum, mean, or percent per county. HISA user sample characteristics, including sex, race, rurality (urban, rural), marital status, and Class 1 vs Class 2 disability-related eligibility groups, were aggregated to the county level by calculating percentages of HISA users of the given characteristics out of total HISA users in the county. Disability-related eligibility groups (Class 1 vs Class 2 HISA users) determines the maximum lifetime award dollar amount. Specifically, those with service-connected disabilities or those with a ≥ 50% disability rating (regardless of whether or not their disability is service connected) are classified as Class 1 HISA users and are eligible to receive a maximum lifetime award of $6800. Those with a recorded disability that is not connected to their military service, and who have a disability rating of < 50% are classified as Class 2 HISA users and are eligible to receive a lifetime maximum award of $2000.
The county-level number of HISA users was used as the numerator for calculation of county-level HISA utilization rate. Counties with zero HISA users were excluded. The number of EOY VHA patients per county in FY 2018 was divided by 1000 and used as the denominator in the calculation of county-level HISA utilization rate. Thus, the outcome variable is HISA utilization rate per 1000 VHA patients in FY 2018 (HISA utilization rate).
County-Level Variables
County-level variables were downloaded from the 2020 CHRD.5,6 An explanation of the CHRD model and the factors used in this study are shown in the eAppendix (available at doi: 10.12788/fp.0279).6 County-level aggregated HISA user data and the CHRD data were matched using county Federal Information Processing Standards codes. Access to care measures collected from CHRD included percentages uninsured and ratios of population to primary care physicians, dentists, mental health professionals, and other primary care professionals. Other CHRD measures included those for quality of care (rate of preventable hospital stay) and housing quality (percent of households with high housing costs, percent of households with overcrowding, percent of households with lack of kitchen or plumbing, percent of households with severe housing cost burden, percent of homeownership). Of secondary interest was county population rurality, as previous research findings showed the annual average of HISA users who are from rural areas ranged from 30 to 35%.
Analysis Methods
SAS (v9.4), R (v4.0.2), and RStudio (v1.3.1093) were used for data preparation and analysis.18 Multiple regression analysis was used to predict county-level utilization rate from county-level variables. Sociodemographic characteristics from CHRD and HISA data were included as important control predictors in the regression model, though our focus for this paper are the access to care and housing quality predictors.
Model diagnostics (examination of model residuals, Breusch-Godfrey test, Breusch-Pagan test) revealed significant heteroskedasticity of the model; thus, robust standard errors and associated P values were computed using the R estimatr package (v0.30.2).19 Some predictor variables of interest (eg, ratio of mental health professionals) were removed during the model building process either due to problems of multicollinearity or excessive missingness that would have resulted in listwise deletion.
Results
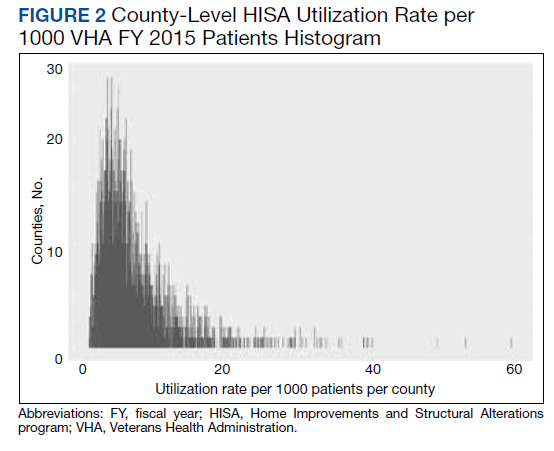
County-level HISA utilization rate per 1000 EOY VHA patients ranged from 0.09 to 59.7%, with a 6.6% mean and 5% median (Figure 2). The data were highly positively skewed. The final model included 33 total predictor variables (Table 1). The final regression model was a significantly better predictor of county-level HISA utilization rate than a null model (F[33-2184], 10.18; P < .001). The adjusted model R2 showed that the overall model accounted for approximately 23% of variance in county-level HISA utilization rate (Table 2).
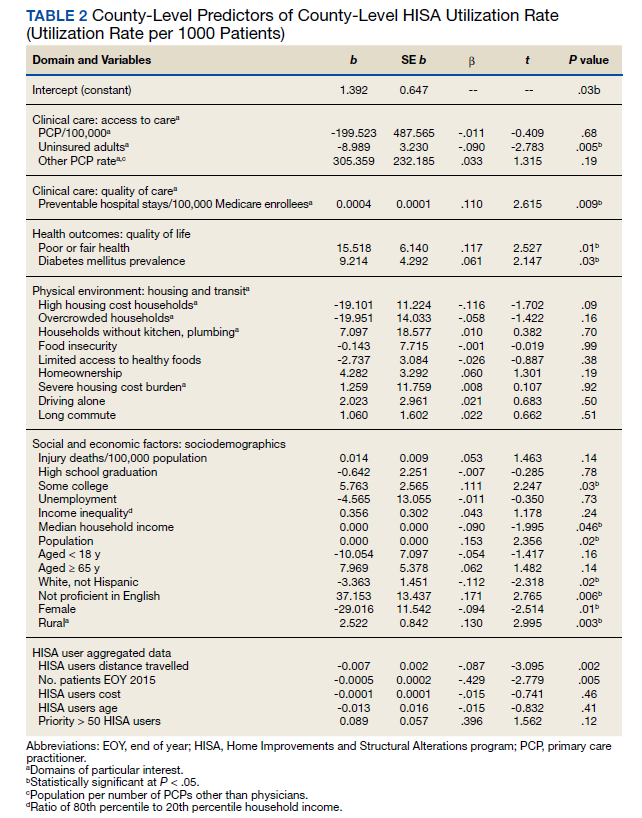
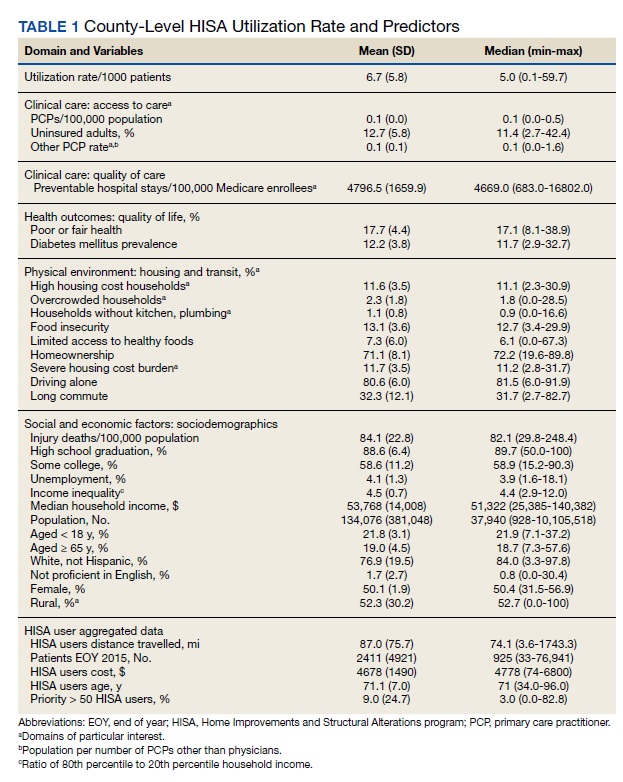
Among the primary variables of interest, percent uninsured adults and rate of preventable hospital stays emerged as significant predictors of county-level HISA utilization rate. Specifically, county percentage of uninsured adults was negatively related to county-level HISA utilization rate (b = -8.99, P = .005), indicating that the higher the proportion of uninsured adults—with all other predictors held constant—the lower the HISA utilization rate. Percent uninsured adults ranged from 2.7 to 42.4% across counties, with a mean (SD) of 12.7% (5.8%) and 11.4% median.
County rate of preventable hospital stays, however, was significantly and positively related to county-level HISA utilization rate (b = .0004, P = .009), indicating that the higher the rate of preventable hospital stays—with all other predictors held constant—the higher the HISA utilization rate. The direction of this effect is the opposite of the direction of the effect of percent uninsured adults (positive rather than negative), even though both could be considered measures of access to care. The standardized β for these 2 predictors indicate that county rate of preventable hospital stays is a somewhat stronger predictor of county-level HISA utilization rate than is county percent of uninsured adults (β = .11 and β = -.09, respectively). Rate of preventable hospital stays ranged from 683 to 16,802 across counties included in this analysis, with a mean (SD) of 4,796.5 (1659.9) and a 4669 median.
Of secondary interest was county rurality. The county-level percentage of rural residents was significantly and positively related to county-level HISA utilization rate, indicating that the higher the proportion of individuals within county considered rural—all other predictors held constant—the higher the HISA utilization rate. The mean (SD) percentage of rural residents per county was 52.3% (30.2) and 52.7 % median.
Discussion
This study examined whether county-level characteristics, specifically variables for access to care, quality of care, and housing quality, were predictive of a county’s HISA utilization rate. Given that this series of work on the HISA program is (to our knowledge) the first of its kind, and given the exploratory nature of this analysis, we did not have specific predictions for the effects of any one given variable. Nevertheless, some of the results were surprising, and we believe they warrant additional study. In particular, the opposing direction of effects for access to care and quality of care variables were hard to reconcile.
The county percent of uninsured adults (an access to care variable, specifically, a proxy for poor access to care) was negatively associated with county-level HISA utilization rate, whereas the county rate of preventable hospital stays (a quality of care variable, but also potentially an access to care variable, and specifically, proxies for poor quality of care or poor access to care) was positively associated with county-level HISA utilization rate. To describe the relationships more generally, one coefficient in the regression model indicated that the poorer the access to care, the lower the HISA utilization rate (higher percent of uninsured adults predicts lower HISA utilization rate), while another coefficient in the regression model indicated the poorer the quality of and access to care, the higher the HISA utilization rate (higher rate of preventable hospital stays predicts higher HISA utilization rate). Future study is warranted to disentangle and reconcile the various community-level predictors of this service.
Housing quality measures (eg, percent of households with high housing costs, percent of households with overcrowding, percent of households with lack of kitchen or plumbing, percent of households with severe housing cost burden, and percent of homeownership) are important in the consideration of whether a HM will be performed or should be performed. For example, if a person is cost burdened by the amount of expenditure spent in housing there will be little discretionary funds to perform a HM. Individuals who do not own their home may experience complications in obtaining permission from landlords to perform a HM. County-level predictors of housing quality (percent of households with high housing costs, overcrowding, and lack of kitchen or plumbing) were not significantly associated with county-level HISA utilization rate but are also nevertheless relevant to the discussion of home modifications. Of particular interest is the percent of households with lack of kitchen or plumbing variable, which was positively related to county-level HISA utilization rate although not statistically significant. HM elements related to the kitchen (eg, heighten countertop) add to the accessibility of the home allowing for the performing of activities of daily living such as cooking. Between FY 2015 and FY 2018, we discovered 131 prescriptions for kitchen (n = 90) and plumbing (n = 41) HMs, which is a very small proportion of the 30,780 total HMs (there were 24,397 bathroom HMs). The nonsignificant coefficient for this variable may reflect the small number of veterans that obtained these HM.
Limitations
The potentially conflicting direction of effects for a significant access to care variable (percent uninsured adults) and a significant access to care and quality of care variable (preventable hospital stays) are interesting and warrant additional study, but the inability to interpret or explain this apparent inconsistency constitutes a limitation of the current data and analyses presented here. Another limitation is that this analysis uses county-level predictors for what is ultimately an individual-level outcome. It would have been ideal to have both individual- and county-level data to conduct a multilevel analysis; in particular, individual-level data within counties of individuals (both veterans and nonveterans) who did not receive a HISA award (including both those who applied and were denied, and who did not apply) would be highly valuable.
Conclusions
Our continuing research into veterans’ use of HM fills a gap in the literature about the characteristics of HISA users, the impact of county-level variables on the use of HISA, and the geographic distribution and use of HISA within the VHA. While it is important to examine the influence of broader systems on individual outcomes, there could be myriad other factors that are more proximal and more closely related to whether any one individual applies for, let alone receives, a HISA award. Indeed, a low overall adjusted model R2 indicates that there is considerable variability in county-level HISA utilization rate that was not accounted for by the current model; this further speaks to warranted additional study.
More research is needed to understand and account for geographical variation in HISA utilization rate across the US. However, this work serves as an exploratory first step at quantifying and predicting HISA utilization rate at a broad level, with the ultimate goal of increasing access to HMs for veterans with disabilities.
Acknowledgments
This research was supported by grant 15521 from the US Department of Veterans Affairs, Office of Rural Health. Furthermore, the research was supported in part by grant K12 HD055929 from the National Institutes of Health. We want to acknowledge Cheri E. Knecht, Project Coordinator, for her assistance throughout all aspects of our research study and for her thoughtful contributions during the writing of this manuscript.
1. Semeah LM, Ahrentzen S, Jia H, Cowper-Ripley DC, Levy CE, Mann WC. The home improvements and structural alterations benefits program: veterans with disabilities and home accessibility. J Disability Policy Studies. 2017;28(1):43-51. doi:10.1177/1044207317696275
2. Semeah LM, Wang X, Cowper Ripley DC, Lee MJ, Ahonle ZJ, Ganesh SP, et al. Improving health through a home modification service for veterans. In: Fiedler BA, ed. Three Facets of Public Health and Paths to Improvements. Academic Press; 2020:381-416.
3. Semeah LM, Ahrentzen S, Cowper-Ripley DC, Santos-Roman LM, Beamish JO, Farley K. Rental housing needs and barriers from the perspective of veterans with disabilities. Housing Policy Debate. 2019;29(4):542-558. doi:10.1080/10511482.2018.1543203
4. Semeah LM, Ganesh SP, Wang X, et al. Home modification and health services utilization by rural and urban veterans with disabilities. Housing Policy Debate. 2021;31(6):862-874.doi:10.1080/10511482.2020.1858923
5. University of Wisconsin Population Health Institute. County health rankings model. Accessed May 13, 2022. https://www.countyhealthrankings.org/about-us
6. Remington PL, Catlin BB, Gennuso KP. The County Health Rankings: rationale and methods. Popul Health Metr. 2015;13(11). doi:10.1186/s12963-015-0044-2
7. National Academies of Sciences, Engineering, and Medicine. Health-Care Utilization as a Proxy in Disability Determination. Washington, DC: The National Academies Press; 2018.
8. Douthit N, Kiv S, Dwolatzky T, Biswas S. Exposing some important barriers to health care access in the rural USA. Public Health. 2015;129(6):611-20. doi:10.1016/j.puhe.2015.04.001
9. Medicaid and Chip Payment and Access Commission (MACPAC). Medicaid access in brief: adults’ experiences in obtaining medical care. November 2016. Accessed May 13, 2022. https://www.macpac.gov/publication/access-in-brief-adults-experiences-in-obtaining-medical-care
10. Tolbert J, Orgera, K, Damico A. Key facts about the uninsured population. November 6, 2020. Accessed May 13, 2022. https://www.kff.org/uninsured/issue-brief/key-facts-about-the-uninsured-population
11. Meit M, Knudson A, Gilbert T, et al. The 2014 update of the rural-urban chartbook, 2014. October 2014. Accessed May 13, 2022. http://www.ruralhealthresearch.org
12. National Center for Health Statistics (US). Report No.: 2016-1232. Health, United States, 2015: with special feature on racial and ethnic health disparities. Hyattsville, MD: National Center for Health Statistics.
13. Broussard DL, Mason KE, Carruth AR, Carton TW. Assessing potentially preventable hospitalizations at the county level: a comparison of measures using Medicare data and state hospital discharge data. Popul Health Manag. 2018;21(6):438-445. doi:10.1089/pop.2017.0141
14. Pezzin LE, Bogner HR, Kurichi JE, et al. Preventable hospitalizations, barriers to care, and disability. Medicine (Baltimore). 2018;97:e0691 doi:10.1097/MD.0000000000010691
15. Davis K, Ballreich J. Equitable access to care: how the United States ranks internationally. N Engl J Med. 2014;371(17):1567-70. doi:10.1056/NEJMp1406707
16. Squires D, Anderson C. U.S. health care from a global perspective: spending, use of services, prices, and health in 13 countries. Issue Brief (Commonw Fund). 2015;15:1-15.
17. VHA Service Support Center. Current enrollment cube (vssc.med.va.gov). Retrieved August 06, 2019. [Data not verified.]
18. Bunn A, Korpela M. R: A language and environment for statistical computing: an introduction to dplR. January 29, 2021. Accessed May 13, 2022. http://r.meteo.uni.wroc.pl/web/packages/dplR/vignettes/intro-dplR.pdf
19. Sheppard BH, Hartwick J, Warshaw PR. The theory of reasoned action: a meta-analysis of past research with recommendations for modifications and future research. J Consumer Research. 1988;15(3):325-343. doi:10.1086/209170
This article is part of a series of articles on the Home Improvements and Structural Alterations program (HISA), a home modification (HM) program within the Veterans Health Administration (VHA). HISA is a benefit awarded to veterans with disabilities (VWDs) and is instrumental in affording physical accessibility and structural alterations to veterans’ homes.1 The overarching goals of this project are to describe and understand HISA use by VWDs. Previous work has shown geographical variation in the number of HISA prescriptions across counties in the US (Figure 1).1 The current work seeks to describe and predict the county-level rates of HISA use. Information about what predicts HISA utilization at the county level is important because it enhances understanding of program utilization at a national level. The long-term goal of the series is to provide knowledge about HM services within VHA to improve community-based independent living of VWDs by increasing awareness and utilization of HM services.
Background
A health care professional (HCP) approves a HM support award by evaluating the practicality of the support to improve the built environment of a given veteran’s disability.1,2 Previously we detailed some of the preliminary research into the HISA program, including HISA user demographic and clinical characteristics, types of HMs received, user suggestions for improvement, and geospatial analysis of HISA prescriptions concentration.1-4
The geospatial analyses of HISA prescriptions revealed clusters of high numbers of HISA users (hot spots) and low numbers of HISA users (cold spots), indicating that HISA is either not prescribed or uniformly used across the US. The previous research prompted investigation into county-level variables that may impact HISA utilization rates. This inquiry focuses on county characteristics associated with HISA use rates, such as measures of clinical care and quality of care (eg, access to health services variables, lack of insurance, preventable hospital stays), physical environment, and sociodemographic characteristics. Clinical care and quality of care measures promote the interaction with HCPs. Moreover, access to health care is an important indicator of health outcomes.5,6 An individual’s capacity to access health services, such as a HM program, greatly impacts well-being, safety, independence, and health.2,4 Well-being, safety, independence, and health become compromised if individuals cannot access care, if needed care is lacking in their area, if HCPs are not available, or are unwilling to provide care due to lack of insurance coverage.7-12 In locations where health care services are minimal due to lack of specialists or health care facilities, the quality of (or access to) care may be compromised, resulting in preventable conditions becoming problematic.13,14 These conditions may result in unnecessary hospitalizations for conditions that could have been treated during routine care. Financial barriers to care particularly among low-income people and the uninsured have proven detrimental to health.15,16 On the other hand, preventable hospital stays are a quality of care measure (ie, a proxy for poor quality of care). HISA operates within a health care system; thus, it is imperative to include these measures impacting health.
In this study, we sought to identify county-level predictors—in particular, county-level proxies for access to care—that may be associated with county-level HISA use. We define HISA utilization rate as the percentage of a county’s VHA patients who have received a HISA award.
Methods
This study used data from the National Prosthetics Patient Database (NPPD), US Department of Veterans Affairs (VA) medical database inpatient and outpatient datasets, VHA Support Service Center (VSSC) data cubes, and the County Health Rankings database (CHRD). First, the study cohort was identified from NPPD users who have obtained a HISA award from fiscal years (FY) 2015 to 2018. Analysis started with FY 2015 following new regulations (38 CFR § 17) governing the operations of the HISA program.2 The study cohort was matched with records from NPPD and VA inpatient and outpatient datasets to obtain information about the veterans’ demographic characteristics and their HM characteristics and costs. The number of VHA end-of-year (EOY) patients per county was extracted from the VSSC Current Enrollment Cube, which was used in calculation of the county-level HISA utilization rate.17 Finally, zip code–based locational data were used to calculate approximate drive time and distance from the HISA user’s approximate location to the facility where they received their HM prescription. Drive times and drive distances were calculated with Esri ArcGIS Pro (v2.6.3) by placing zip code centroid and VHA facilities on a nationwide road network that contains both road speeds and distances.
Calculations
Patient-level data were aggregated up to county-level variables by calculating the sum, mean, or percent per county. HISA user sample characteristics, including sex, race, rurality (urban, rural), marital status, and Class 1 vs Class 2 disability-related eligibility groups, were aggregated to the county level by calculating percentages of HISA users of the given characteristics out of total HISA users in the county. Disability-related eligibility groups (Class 1 vs Class 2 HISA users) determines the maximum lifetime award dollar amount. Specifically, those with service-connected disabilities or those with a ≥ 50% disability rating (regardless of whether or not their disability is service connected) are classified as Class 1 HISA users and are eligible to receive a maximum lifetime award of $6800. Those with a recorded disability that is not connected to their military service, and who have a disability rating of < 50% are classified as Class 2 HISA users and are eligible to receive a lifetime maximum award of $2000.
The county-level number of HISA users was used as the numerator for calculation of county-level HISA utilization rate. Counties with zero HISA users were excluded. The number of EOY VHA patients per county in FY 2018 was divided by 1000 and used as the denominator in the calculation of county-level HISA utilization rate. Thus, the outcome variable is HISA utilization rate per 1000 VHA patients in FY 2018 (HISA utilization rate).
County-Level Variables
County-level variables were downloaded from the 2020 CHRD.5,6 An explanation of the CHRD model and the factors used in this study are shown in the eAppendix (available at doi: 10.12788/fp.0279).6 County-level aggregated HISA user data and the CHRD data were matched using county Federal Information Processing Standards codes. Access to care measures collected from CHRD included percentages uninsured and ratios of population to primary care physicians, dentists, mental health professionals, and other primary care professionals. Other CHRD measures included those for quality of care (rate of preventable hospital stay) and housing quality (percent of households with high housing costs, percent of households with overcrowding, percent of households with lack of kitchen or plumbing, percent of households with severe housing cost burden, percent of homeownership). Of secondary interest was county population rurality, as previous research findings showed the annual average of HISA users who are from rural areas ranged from 30 to 35%.
Analysis Methods
SAS (v9.4), R (v4.0.2), and RStudio (v1.3.1093) were used for data preparation and analysis.18 Multiple regression analysis was used to predict county-level utilization rate from county-level variables. Sociodemographic characteristics from CHRD and HISA data were included as important control predictors in the regression model, though our focus for this paper are the access to care and housing quality predictors.
Model diagnostics (examination of model residuals, Breusch-Godfrey test, Breusch-Pagan test) revealed significant heteroskedasticity of the model; thus, robust standard errors and associated P values were computed using the R estimatr package (v0.30.2).19 Some predictor variables of interest (eg, ratio of mental health professionals) were removed during the model building process either due to problems of multicollinearity or excessive missingness that would have resulted in listwise deletion.
Results
County-level HISA utilization rate per 1000 EOY VHA patients ranged from 0.09 to 59.7%, with a 6.6% mean and 5% median (Figure 2). The data were highly positively skewed. The final model included 33 total predictor variables (Table 1). The final regression model was a significantly better predictor of county-level HISA utilization rate than a null model (F[33-2184], 10.18; P < .001). The adjusted model R2 showed that the overall model accounted for approximately 23% of variance in county-level HISA utilization rate (Table 2).
Among the primary variables of interest, percent uninsured adults and rate of preventable hospital stays emerged as significant predictors of county-level HISA utilization rate. Specifically, county percentage of uninsured adults was negatively related to county-level HISA utilization rate (b = -8.99, P = .005), indicating that the higher the proportion of uninsured adults—with all other predictors held constant—the lower the HISA utilization rate. Percent uninsured adults ranged from 2.7 to 42.4% across counties, with a mean (SD) of 12.7% (5.8%) and 11.4% median.
County rate of preventable hospital stays, however, was significantly and positively related to county-level HISA utilization rate (b = .0004, P = .009), indicating that the higher the rate of preventable hospital stays—with all other predictors held constant—the higher the HISA utilization rate. The direction of this effect is the opposite of the direction of the effect of percent uninsured adults (positive rather than negative), even though both could be considered measures of access to care. The standardized β for these 2 predictors indicate that county rate of preventable hospital stays is a somewhat stronger predictor of county-level HISA utilization rate than is county percent of uninsured adults (β = .11 and β = -.09, respectively). Rate of preventable hospital stays ranged from 683 to 16,802 across counties included in this analysis, with a mean (SD) of 4,796.5 (1659.9) and a 4669 median.
Of secondary interest was county rurality. The county-level percentage of rural residents was significantly and positively related to county-level HISA utilization rate, indicating that the higher the proportion of individuals within county considered rural—all other predictors held constant—the higher the HISA utilization rate. The mean (SD) percentage of rural residents per county was 52.3% (30.2) and 52.7 % median.
Discussion
This study examined whether county-level characteristics, specifically variables for access to care, quality of care, and housing quality, were predictive of a county’s HISA utilization rate. Given that this series of work on the HISA program is (to our knowledge) the first of its kind, and given the exploratory nature of this analysis, we did not have specific predictions for the effects of any one given variable. Nevertheless, some of the results were surprising, and we believe they warrant additional study. In particular, the opposing direction of effects for access to care and quality of care variables were hard to reconcile.
The county percent of uninsured adults (an access to care variable, specifically, a proxy for poor access to care) was negatively associated with county-level HISA utilization rate, whereas the county rate of preventable hospital stays (a quality of care variable, but also potentially an access to care variable, and specifically, proxies for poor quality of care or poor access to care) was positively associated with county-level HISA utilization rate. To describe the relationships more generally, one coefficient in the regression model indicated that the poorer the access to care, the lower the HISA utilization rate (higher percent of uninsured adults predicts lower HISA utilization rate), while another coefficient in the regression model indicated the poorer the quality of and access to care, the higher the HISA utilization rate (higher rate of preventable hospital stays predicts higher HISA utilization rate). Future study is warranted to disentangle and reconcile the various community-level predictors of this service.
Housing quality measures (eg, percent of households with high housing costs, percent of households with overcrowding, percent of households with lack of kitchen or plumbing, percent of households with severe housing cost burden, and percent of homeownership) are important in the consideration of whether a HM will be performed or should be performed. For example, if a person is cost burdened by the amount of expenditure spent in housing there will be little discretionary funds to perform a HM. Individuals who do not own their home may experience complications in obtaining permission from landlords to perform a HM. County-level predictors of housing quality (percent of households with high housing costs, overcrowding, and lack of kitchen or plumbing) were not significantly associated with county-level HISA utilization rate but are also nevertheless relevant to the discussion of home modifications. Of particular interest is the percent of households with lack of kitchen or plumbing variable, which was positively related to county-level HISA utilization rate although not statistically significant. HM elements related to the kitchen (eg, heighten countertop) add to the accessibility of the home allowing for the performing of activities of daily living such as cooking. Between FY 2015 and FY 2018, we discovered 131 prescriptions for kitchen (n = 90) and plumbing (n = 41) HMs, which is a very small proportion of the 30,780 total HMs (there were 24,397 bathroom HMs). The nonsignificant coefficient for this variable may reflect the small number of veterans that obtained these HM.
Limitations
The potentially conflicting direction of effects for a significant access to care variable (percent uninsured adults) and a significant access to care and quality of care variable (preventable hospital stays) are interesting and warrant additional study, but the inability to interpret or explain this apparent inconsistency constitutes a limitation of the current data and analyses presented here. Another limitation is that this analysis uses county-level predictors for what is ultimately an individual-level outcome. It would have been ideal to have both individual- and county-level data to conduct a multilevel analysis; in particular, individual-level data within counties of individuals (both veterans and nonveterans) who did not receive a HISA award (including both those who applied and were denied, and who did not apply) would be highly valuable.
Conclusions
Our continuing research into veterans’ use of HM fills a gap in the literature about the characteristics of HISA users, the impact of county-level variables on the use of HISA, and the geographic distribution and use of HISA within the VHA. While it is important to examine the influence of broader systems on individual outcomes, there could be myriad other factors that are more proximal and more closely related to whether any one individual applies for, let alone receives, a HISA award. Indeed, a low overall adjusted model R2 indicates that there is considerable variability in county-level HISA utilization rate that was not accounted for by the current model; this further speaks to warranted additional study.
More research is needed to understand and account for geographical variation in HISA utilization rate across the US. However, this work serves as an exploratory first step at quantifying and predicting HISA utilization rate at a broad level, with the ultimate goal of increasing access to HMs for veterans with disabilities.
Acknowledgments
This research was supported by grant 15521 from the US Department of Veterans Affairs, Office of Rural Health. Furthermore, the research was supported in part by grant K12 HD055929 from the National Institutes of Health. We want to acknowledge Cheri E. Knecht, Project Coordinator, for her assistance throughout all aspects of our research study and for her thoughtful contributions during the writing of this manuscript.
1. Semeah LM, Ahrentzen S, Jia H, Cowper-Ripley DC, Levy CE, Mann WC. The home improvements and structural alterations benefits program: veterans with disabilities and home accessibility. J Disability Policy Studies. 2017;28(1):43-51. doi:10.1177/1044207317696275
2. Semeah LM, Wang X, Cowper Ripley DC, Lee MJ, Ahonle ZJ, Ganesh SP, et al. Improving health through a home modification service for veterans. In: Fiedler BA, ed. Three Facets of Public Health and Paths to Improvements. Academic Press; 2020:381-416.
3. Semeah LM, Ahrentzen S, Cowper-Ripley DC, Santos-Roman LM, Beamish JO, Farley K. Rental housing needs and barriers from the perspective of veterans with disabilities. Housing Policy Debate. 2019;29(4):542-558. doi:10.1080/10511482.2018.1543203
4. Semeah LM, Ganesh SP, Wang X, et al. Home modification and health services utilization by rural and urban veterans with disabilities. Housing Policy Debate. 2021;31(6):862-874.doi:10.1080/10511482.2020.1858923
5. University of Wisconsin Population Health Institute. County health rankings model. Accessed May 13, 2022. https://www.countyhealthrankings.org/about-us
6. Remington PL, Catlin BB, Gennuso KP. The County Health Rankings: rationale and methods. Popul Health Metr. 2015;13(11). doi:10.1186/s12963-015-0044-2
7. National Academies of Sciences, Engineering, and Medicine. Health-Care Utilization as a Proxy in Disability Determination. Washington, DC: The National Academies Press; 2018.
8. Douthit N, Kiv S, Dwolatzky T, Biswas S. Exposing some important barriers to health care access in the rural USA. Public Health. 2015;129(6):611-20. doi:10.1016/j.puhe.2015.04.001
9. Medicaid and Chip Payment and Access Commission (MACPAC). Medicaid access in brief: adults’ experiences in obtaining medical care. November 2016. Accessed May 13, 2022. https://www.macpac.gov/publication/access-in-brief-adults-experiences-in-obtaining-medical-care
10. Tolbert J, Orgera, K, Damico A. Key facts about the uninsured population. November 6, 2020. Accessed May 13, 2022. https://www.kff.org/uninsured/issue-brief/key-facts-about-the-uninsured-population
11. Meit M, Knudson A, Gilbert T, et al. The 2014 update of the rural-urban chartbook, 2014. October 2014. Accessed May 13, 2022. http://www.ruralhealthresearch.org
12. National Center for Health Statistics (US). Report No.: 2016-1232. Health, United States, 2015: with special feature on racial and ethnic health disparities. Hyattsville, MD: National Center for Health Statistics.
13. Broussard DL, Mason KE, Carruth AR, Carton TW. Assessing potentially preventable hospitalizations at the county level: a comparison of measures using Medicare data and state hospital discharge data. Popul Health Manag. 2018;21(6):438-445. doi:10.1089/pop.2017.0141
14. Pezzin LE, Bogner HR, Kurichi JE, et al. Preventable hospitalizations, barriers to care, and disability. Medicine (Baltimore). 2018;97:e0691 doi:10.1097/MD.0000000000010691
15. Davis K, Ballreich J. Equitable access to care: how the United States ranks internationally. N Engl J Med. 2014;371(17):1567-70. doi:10.1056/NEJMp1406707
16. Squires D, Anderson C. U.S. health care from a global perspective: spending, use of services, prices, and health in 13 countries. Issue Brief (Commonw Fund). 2015;15:1-15.
17. VHA Service Support Center. Current enrollment cube (vssc.med.va.gov). Retrieved August 06, 2019. [Data not verified.]
18. Bunn A, Korpela M. R: A language and environment for statistical computing: an introduction to dplR. January 29, 2021. Accessed May 13, 2022. http://r.meteo.uni.wroc.pl/web/packages/dplR/vignettes/intro-dplR.pdf
19. Sheppard BH, Hartwick J, Warshaw PR. The theory of reasoned action: a meta-analysis of past research with recommendations for modifications and future research. J Consumer Research. 1988;15(3):325-343. doi:10.1086/209170