User login
Predictors of County-Level Home Modification Use Across the US
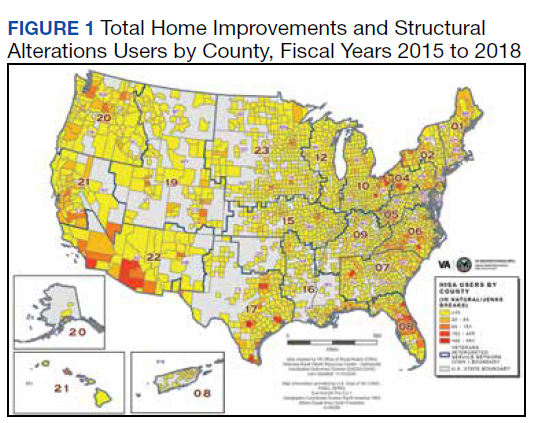
This article is part of a series of articles on the Home Improvements and Structural Alterations program (HISA), a home modification (HM) program within the Veterans Health Administration (VHA). HISA is a benefit awarded to veterans with disabilities (VWDs) and is instrumental in affording physical accessibility and structural alterations to veterans’ homes.1 The overarching goals of this project are to describe and understand HISA use by VWDs. Previous work has shown geographical variation in the number of HISA prescriptions across counties in the US (Figure 1).1 The current work seeks to describe and predict the county-level rates of HISA use. Information about what predicts HISA utilization at the county level is important because it enhances understanding of program utilization at a national level. The long-term goal of the series is to provide knowledge about HM services within VHA to improve community-based independent living of VWDs by increasing awareness and utilization of HM services.
Background
A health care professional (HCP) approves a HM support award by evaluating the practicality of the support to improve the built environment of a given veteran’s disability.1,2 Previously we detailed some of the preliminary research into the HISA program, including HISA user demographic and clinical characteristics, types of HMs received, user suggestions for improvement, and geospatial analysis of HISA prescriptions concentration.1-4
The geospatial analyses of HISA prescriptions revealed clusters of high numbers of HISA users (hot spots) and low numbers of HISA users (cold spots), indicating that HISA is either not prescribed or uniformly used across the US. The previous research prompted investigation into county-level variables that may impact HISA utilization rates. This inquiry focuses on county characteristics associated with HISA use rates, such as measures of clinical care and quality of care (eg, access to health services variables, lack of insurance, preventable hospital stays), physical environment, and sociodemographic characteristics. Clinical care and quality of care measures promote the interaction with HCPs. Moreover, access to health care is an important indicator of health outcomes.5,6 An individual’s capacity to access health services, such as a HM program, greatly impacts well-being, safety, independence, and health.2,4 Well-being, safety, independence, and health become compromised if individuals cannot access care, if needed care is lacking in their area, if HCPs are not available, or are unwilling to provide care due to lack of insurance coverage.7-12 In locations where health care services are minimal due to lack of specialists or health care facilities, the quality of (or access to) care may be compromised, resulting in preventable conditions becoming problematic.13,14 These conditions may result in unnecessary hospitalizations for conditions that could have been treated during routine care. Financial barriers to care particularly among low-income people and the uninsured have proven detrimental to health.15,16 On the other hand, preventable hospital stays are a quality of care measure (ie, a proxy for poor quality of care). HISA operates within a health care system; thus, it is imperative to include these measures impacting health.
In this study, we sought to identify county-level predictors—in particular, county-level proxies for access to care—that may be associated with county-level HISA use. We define HISA utilization rate as the percentage of a county’s VHA patients who have received a HISA award.
Methods
This study used data from the National Prosthetics Patient Database (NPPD), US Department of Veterans Affairs (VA) medical database inpatient and outpatient datasets, VHA Support Service Center (VSSC) data cubes, and the County Health Rankings database (CHRD). First, the study cohort was identified from NPPD users who have obtained a HISA award from fiscal years (FY) 2015 to 2018. Analysis started with FY 2015 following new regulations (38 CFR § 17) governing the operations of the HISA program.2 The study cohort was matched with records from NPPD and VA inpatient and outpatient datasets to obtain information about the veterans’ demographic characteristics and their HM characteristics and costs. The number of VHA end-of-year (EOY) patients per county was extracted from the VSSC Current Enrollment Cube, which was used in calculation of the county-level HISA utilization rate.17 Finally, zip code–based locational data were used to calculate approximate drive time and distance from the HISA user’s approximate location to the facility where they received their HM prescription. Drive times and drive distances were calculated with Esri ArcGIS Pro (v2.6.3) by placing zip code centroid and VHA facilities on a nationwide road network that contains both road speeds and distances.
Calculations
Patient-level data were aggregated up to county-level variables by calculating the sum, mean, or percent per county. HISA user sample characteristics, including sex, race, rurality (urban, rural), marital status, and Class 1 vs Class 2 disability-related eligibility groups, were aggregated to the county level by calculating percentages of HISA users of the given characteristics out of total HISA users in the county. Disability-related eligibility groups (Class 1 vs Class 2 HISA users) determines the maximum lifetime award dollar amount. Specifically, those with service-connected disabilities or those with a ≥ 50% disability rating (regardless of whether or not their disability is service connected) are classified as Class 1 HISA users and are eligible to receive a maximum lifetime award of $6800. Those with a recorded disability that is not connected to their military service, and who have a disability rating of < 50% are classified as Class 2 HISA users and are eligible to receive a lifetime maximum award of $2000.
The county-level number of HISA users was used as the numerator for calculation of county-level HISA utilization rate. Counties with zero HISA users were excluded. The number of EOY VHA patients per county in FY 2018 was divided by 1000 and used as the denominator in the calculation of county-level HISA utilization rate. Thus, the outcome variable is HISA utilization rate per 1000 VHA patients in FY 2018 (HISA utilization rate).
County-Level Variables
County-level variables were downloaded from the 2020 CHRD.5,6 An explanation of the CHRD model and the factors used in this study are shown in the eAppendix (available at doi: 10.12788/fp.0279).6 County-level aggregated HISA user data and the CHRD data were matched using county Federal Information Processing Standards codes. Access to care measures collected from CHRD included percentages uninsured and ratios of population to primary care physicians, dentists, mental health professionals, and other primary care professionals. Other CHRD measures included those for quality of care (rate of preventable hospital stay) and housing quality (percent of households with high housing costs, percent of households with overcrowding, percent of households with lack of kitchen or plumbing, percent of households with severe housing cost burden, percent of homeownership). Of secondary interest was county population rurality, as previous research findings showed the annual average of HISA users who are from rural areas ranged from 30 to 35%.
Analysis Methods
SAS (v9.4), R (v4.0.2), and RStudio (v1.3.1093) were used for data preparation and analysis.18 Multiple regression analysis was used to predict county-level utilization rate from county-level variables. Sociodemographic characteristics from CHRD and HISA data were included as important control predictors in the regression model, though our focus for this paper are the access to care and housing quality predictors.
Model diagnostics (examination of model residuals, Breusch-Godfrey test, Breusch-Pagan test) revealed significant heteroskedasticity of the model; thus, robust standard errors and associated P values were computed using the R estimatr package (v0.30.2).19 Some predictor variables of interest (eg, ratio of mental health professionals) were removed during the model building process either due to problems of multicollinearity or excessive missingness that would have resulted in listwise deletion.
Results
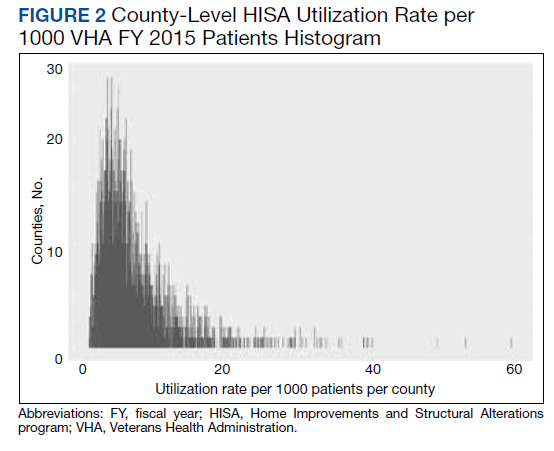
County-level HISA utilization rate per 1000 EOY VHA patients ranged from 0.09 to 59.7%, with a 6.6% mean and 5% median (Figure 2). The data were highly positively skewed. The final model included 33 total predictor variables (Table 1). The final regression model was a significantly better predictor of county-level HISA utilization rate than a null model (F[33-2184], 10.18; P < .001). The adjusted model R2 showed that the overall model accounted for approximately 23% of variance in county-level HISA utilization rate (Table 2).
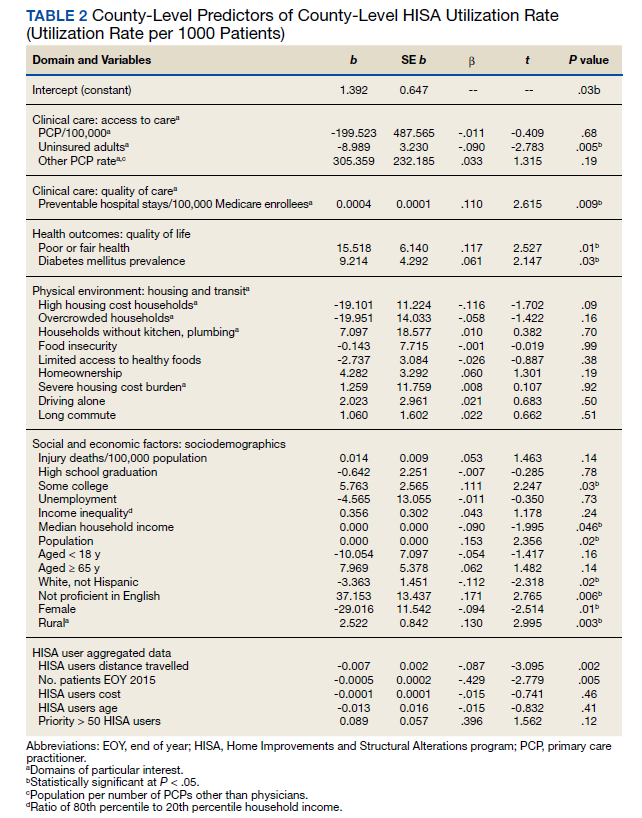
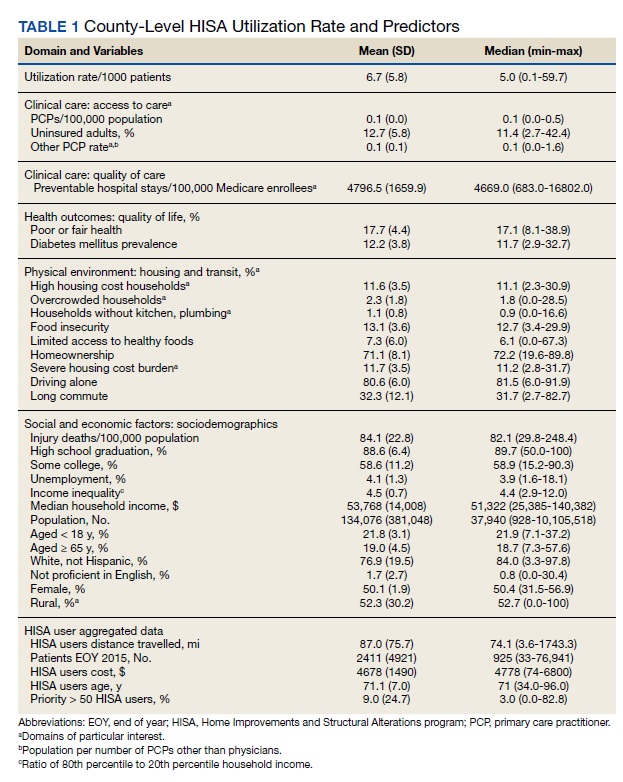
Among the primary variables of interest, percent uninsured adults and rate of preventable hospital stays emerged as significant predictors of county-level HISA utilization rate. Specifically, county percentage of uninsured adults was negatively related to county-level HISA utilization rate (b = -8.99, P = .005), indicating that the higher the proportion of uninsured adults—with all other predictors held constant—the lower the HISA utilization rate. Percent uninsured adults ranged from 2.7 to 42.4% across counties, with a mean (SD) of 12.7% (5.8%) and 11.4% median.
County rate of preventable hospital stays, however, was significantly and positively related to county-level HISA utilization rate (b = .0004, P = .009), indicating that the higher the rate of preventable hospital stays—with all other predictors held constant—the higher the HISA utilization rate. The direction of this effect is the opposite of the direction of the effect of percent uninsured adults (positive rather than negative), even though both could be considered measures of access to care. The standardized β for these 2 predictors indicate that county rate of preventable hospital stays is a somewhat stronger predictor of county-level HISA utilization rate than is county percent of uninsured adults (β = .11 and β = -.09, respectively). Rate of preventable hospital stays ranged from 683 to 16,802 across counties included in this analysis, with a mean (SD) of 4,796.5 (1659.9) and a 4669 median.
Of secondary interest was county rurality. The county-level percentage of rural residents was significantly and positively related to county-level HISA utilization rate, indicating that the higher the proportion of individuals within county considered rural—all other predictors held constant—the higher the HISA utilization rate. The mean (SD) percentage of rural residents per county was 52.3% (30.2) and 52.7 % median.
Discussion
This study examined whether county-level characteristics, specifically variables for access to care, quality of care, and housing quality, were predictive of a county’s HISA utilization rate. Given that this series of work on the HISA program is (to our knowledge) the first of its kind, and given the exploratory nature of this analysis, we did not have specific predictions for the effects of any one given variable. Nevertheless, some of the results were surprising, and we believe they warrant additional study. In particular, the opposing direction of effects for access to care and quality of care variables were hard to reconcile.
The county percent of uninsured adults (an access to care variable, specifically, a proxy for poor access to care) was negatively associated with county-level HISA utilization rate, whereas the county rate of preventable hospital stays (a quality of care variable, but also potentially an access to care variable, and specifically, proxies for poor quality of care or poor access to care) was positively associated with county-level HISA utilization rate. To describe the relationships more generally, one coefficient in the regression model indicated that the poorer the access to care, the lower the HISA utilization rate (higher percent of uninsured adults predicts lower HISA utilization rate), while another coefficient in the regression model indicated the poorer the quality of and access to care, the higher the HISA utilization rate (higher rate of preventable hospital stays predicts higher HISA utilization rate). Future study is warranted to disentangle and reconcile the various community-level predictors of this service.
Housing quality measures (eg, percent of households with high housing costs, percent of households with overcrowding, percent of households with lack of kitchen or plumbing, percent of households with severe housing cost burden, and percent of homeownership) are important in the consideration of whether a HM will be performed or should be performed. For example, if a person is cost burdened by the amount of expenditure spent in housing there will be little discretionary funds to perform a HM. Individuals who do not own their home may experience complications in obtaining permission from landlords to perform a HM. County-level predictors of housing quality (percent of households with high housing costs, overcrowding, and lack of kitchen or plumbing) were not significantly associated with county-level HISA utilization rate but are also nevertheless relevant to the discussion of home modifications. Of particular interest is the percent of households with lack of kitchen or plumbing variable, which was positively related to county-level HISA utilization rate although not statistically significant. HM elements related to the kitchen (eg, heighten countertop) add to the accessibility of the home allowing for the performing of activities of daily living such as cooking. Between FY 2015 and FY 2018, we discovered 131 prescriptions for kitchen (n = 90) and plumbing (n = 41) HMs, which is a very small proportion of the 30,780 total HMs (there were 24,397 bathroom HMs). The nonsignificant coefficient for this variable may reflect the small number of veterans that obtained these HM.
Limitations
The potentially conflicting direction of effects for a significant access to care variable (percent uninsured adults) and a significant access to care and quality of care variable (preventable hospital stays) are interesting and warrant additional study, but the inability to interpret or explain this apparent inconsistency constitutes a limitation of the current data and analyses presented here. Another limitation is that this analysis uses county-level predictors for what is ultimately an individual-level outcome. It would have been ideal to have both individual- and county-level data to conduct a multilevel analysis; in particular, individual-level data within counties of individuals (both veterans and nonveterans) who did not receive a HISA award (including both those who applied and were denied, and who did not apply) would be highly valuable.
Conclusions
Our continuing research into veterans’ use of HM fills a gap in the literature about the characteristics of HISA users, the impact of county-level variables on the use of HISA, and the geographic distribution and use of HISA within the VHA. While it is important to examine the influence of broader systems on individual outcomes, there could be myriad other factors that are more proximal and more closely related to whether any one individual applies for, let alone receives, a HISA award. Indeed, a low overall adjusted model R2 indicates that there is considerable variability in county-level HISA utilization rate that was not accounted for by the current model; this further speaks to warranted additional study.
More research is needed to understand and account for geographical variation in HISA utilization rate across the US. However, this work serves as an exploratory first step at quantifying and predicting HISA utilization rate at a broad level, with the ultimate goal of increasing access to HMs for veterans with disabilities.
Acknowledgments
This research was supported by grant 15521 from the US Department of Veterans Affairs, Office of Rural Health. Furthermore, the research was supported in part by grant K12 HD055929 from the National Institutes of Health. We want to acknowledge Cheri E. Knecht, Project Coordinator, for her assistance throughout all aspects of our research study and for her thoughtful contributions during the writing of this manuscript.
1. Semeah LM, Ahrentzen S, Jia H, Cowper-Ripley DC, Levy CE, Mann WC. The home improvements and structural alterations benefits program: veterans with disabilities and home accessibility. J Disability Policy Studies. 2017;28(1):43-51. doi:10.1177/1044207317696275
2. Semeah LM, Wang X, Cowper Ripley DC, Lee MJ, Ahonle ZJ, Ganesh SP, et al. Improving health through a home modification service for veterans. In: Fiedler BA, ed. Three Facets of Public Health and Paths to Improvements. Academic Press; 2020:381-416.
3. Semeah LM, Ahrentzen S, Cowper-Ripley DC, Santos-Roman LM, Beamish JO, Farley K. Rental housing needs and barriers from the perspective of veterans with disabilities. Housing Policy Debate. 2019;29(4):542-558. doi:10.1080/10511482.2018.1543203
4. Semeah LM, Ganesh SP, Wang X, et al. Home modification and health services utilization by rural and urban veterans with disabilities. Housing Policy Debate. 2021;31(6):862-874.doi:10.1080/10511482.2020.1858923
5. University of Wisconsin Population Health Institute. County health rankings model. Accessed May 13, 2022. https://www.countyhealthrankings.org/about-us
6. Remington PL, Catlin BB, Gennuso KP. The County Health Rankings: rationale and methods. Popul Health Metr. 2015;13(11). doi:10.1186/s12963-015-0044-2
7. National Academies of Sciences, Engineering, and Medicine. Health-Care Utilization as a Proxy in Disability Determination. Washington, DC: The National Academies Press; 2018.
8. Douthit N, Kiv S, Dwolatzky T, Biswas S. Exposing some important barriers to health care access in the rural USA. Public Health. 2015;129(6):611-20. doi:10.1016/j.puhe.2015.04.001
9. Medicaid and Chip Payment and Access Commission (MACPAC). Medicaid access in brief: adults’ experiences in obtaining medical care. November 2016. Accessed May 13, 2022. https://www.macpac.gov/publication/access-in-brief-adults-experiences-in-obtaining-medical-care
10. Tolbert J, Orgera, K, Damico A. Key facts about the uninsured population. November 6, 2020. Accessed May 13, 2022. https://www.kff.org/uninsured/issue-brief/key-facts-about-the-uninsured-population
11. Meit M, Knudson A, Gilbert T, et al. The 2014 update of the rural-urban chartbook, 2014. October 2014. Accessed May 13, 2022. http://www.ruralhealthresearch.org
12. National Center for Health Statistics (US). Report No.: 2016-1232. Health, United States, 2015: with special feature on racial and ethnic health disparities. Hyattsville, MD: National Center for Health Statistics.
13. Broussard DL, Mason KE, Carruth AR, Carton TW. Assessing potentially preventable hospitalizations at the county level: a comparison of measures using Medicare data and state hospital discharge data. Popul Health Manag. 2018;21(6):438-445. doi:10.1089/pop.2017.0141
14. Pezzin LE, Bogner HR, Kurichi JE, et al. Preventable hospitalizations, barriers to care, and disability. Medicine (Baltimore). 2018;97:e0691 doi:10.1097/MD.0000000000010691
15. Davis K, Ballreich J. Equitable access to care: how the United States ranks internationally. N Engl J Med. 2014;371(17):1567-70. doi:10.1056/NEJMp1406707
16. Squires D, Anderson C. U.S. health care from a global perspective: spending, use of services, prices, and health in 13 countries. Issue Brief (Commonw Fund). 2015;15:1-15.
17. VHA Service Support Center. Current enrollment cube (vssc.med.va.gov). Retrieved August 06, 2019. [Data not verified.]
18. Bunn A, Korpela M. R: A language and environment for statistical computing: an introduction to dplR. January 29, 2021. Accessed May 13, 2022. http://r.meteo.uni.wroc.pl/web/packages/dplR/vignettes/intro-dplR.pdf
19. Sheppard BH, Hartwick J, Warshaw PR. The theory of reasoned action: a meta-analysis of past research with recommendations for modifications and future research. J Consumer Research. 1988;15(3):325-343. doi:10.1086/209170
This article is part of a series of articles on the Home Improvements and Structural Alterations program (HISA), a home modification (HM) program within the Veterans Health Administration (VHA). HISA is a benefit awarded to veterans with disabilities (VWDs) and is instrumental in affording physical accessibility and structural alterations to veterans’ homes.1 The overarching goals of this project are to describe and understand HISA use by VWDs. Previous work has shown geographical variation in the number of HISA prescriptions across counties in the US (Figure 1).1 The current work seeks to describe and predict the county-level rates of HISA use. Information about what predicts HISA utilization at the county level is important because it enhances understanding of program utilization at a national level. The long-term goal of the series is to provide knowledge about HM services within VHA to improve community-based independent living of VWDs by increasing awareness and utilization of HM services.
Background
A health care professional (HCP) approves a HM support award by evaluating the practicality of the support to improve the built environment of a given veteran’s disability.1,2 Previously we detailed some of the preliminary research into the HISA program, including HISA user demographic and clinical characteristics, types of HMs received, user suggestions for improvement, and geospatial analysis of HISA prescriptions concentration.1-4
The geospatial analyses of HISA prescriptions revealed clusters of high numbers of HISA users (hot spots) and low numbers of HISA users (cold spots), indicating that HISA is either not prescribed or uniformly used across the US. The previous research prompted investigation into county-level variables that may impact HISA utilization rates. This inquiry focuses on county characteristics associated with HISA use rates, such as measures of clinical care and quality of care (eg, access to health services variables, lack of insurance, preventable hospital stays), physical environment, and sociodemographic characteristics. Clinical care and quality of care measures promote the interaction with HCPs. Moreover, access to health care is an important indicator of health outcomes.5,6 An individual’s capacity to access health services, such as a HM program, greatly impacts well-being, safety, independence, and health.2,4 Well-being, safety, independence, and health become compromised if individuals cannot access care, if needed care is lacking in their area, if HCPs are not available, or are unwilling to provide care due to lack of insurance coverage.7-12 In locations where health care services are minimal due to lack of specialists or health care facilities, the quality of (or access to) care may be compromised, resulting in preventable conditions becoming problematic.13,14 These conditions may result in unnecessary hospitalizations for conditions that could have been treated during routine care. Financial barriers to care particularly among low-income people and the uninsured have proven detrimental to health.15,16 On the other hand, preventable hospital stays are a quality of care measure (ie, a proxy for poor quality of care). HISA operates within a health care system; thus, it is imperative to include these measures impacting health.
In this study, we sought to identify county-level predictors—in particular, county-level proxies for access to care—that may be associated with county-level HISA use. We define HISA utilization rate as the percentage of a county’s VHA patients who have received a HISA award.
Methods
This study used data from the National Prosthetics Patient Database (NPPD), US Department of Veterans Affairs (VA) medical database inpatient and outpatient datasets, VHA Support Service Center (VSSC) data cubes, and the County Health Rankings database (CHRD). First, the study cohort was identified from NPPD users who have obtained a HISA award from fiscal years (FY) 2015 to 2018. Analysis started with FY 2015 following new regulations (38 CFR § 17) governing the operations of the HISA program.2 The study cohort was matched with records from NPPD and VA inpatient and outpatient datasets to obtain information about the veterans’ demographic characteristics and their HM characteristics and costs. The number of VHA end-of-year (EOY) patients per county was extracted from the VSSC Current Enrollment Cube, which was used in calculation of the county-level HISA utilization rate.17 Finally, zip code–based locational data were used to calculate approximate drive time and distance from the HISA user’s approximate location to the facility where they received their HM prescription. Drive times and drive distances were calculated with Esri ArcGIS Pro (v2.6.3) by placing zip code centroid and VHA facilities on a nationwide road network that contains both road speeds and distances.
Calculations
Patient-level data were aggregated up to county-level variables by calculating the sum, mean, or percent per county. HISA user sample characteristics, including sex, race, rurality (urban, rural), marital status, and Class 1 vs Class 2 disability-related eligibility groups, were aggregated to the county level by calculating percentages of HISA users of the given characteristics out of total HISA users in the county. Disability-related eligibility groups (Class 1 vs Class 2 HISA users) determines the maximum lifetime award dollar amount. Specifically, those with service-connected disabilities or those with a ≥ 50% disability rating (regardless of whether or not their disability is service connected) are classified as Class 1 HISA users and are eligible to receive a maximum lifetime award of $6800. Those with a recorded disability that is not connected to their military service, and who have a disability rating of < 50% are classified as Class 2 HISA users and are eligible to receive a lifetime maximum award of $2000.
The county-level number of HISA users was used as the numerator for calculation of county-level HISA utilization rate. Counties with zero HISA users were excluded. The number of EOY VHA patients per county in FY 2018 was divided by 1000 and used as the denominator in the calculation of county-level HISA utilization rate. Thus, the outcome variable is HISA utilization rate per 1000 VHA patients in FY 2018 (HISA utilization rate).
County-Level Variables
County-level variables were downloaded from the 2020 CHRD.5,6 An explanation of the CHRD model and the factors used in this study are shown in the eAppendix (available at doi: 10.12788/fp.0279).6 County-level aggregated HISA user data and the CHRD data were matched using county Federal Information Processing Standards codes. Access to care measures collected from CHRD included percentages uninsured and ratios of population to primary care physicians, dentists, mental health professionals, and other primary care professionals. Other CHRD measures included those for quality of care (rate of preventable hospital stay) and housing quality (percent of households with high housing costs, percent of households with overcrowding, percent of households with lack of kitchen or plumbing, percent of households with severe housing cost burden, percent of homeownership). Of secondary interest was county population rurality, as previous research findings showed the annual average of HISA users who are from rural areas ranged from 30 to 35%.
Analysis Methods
SAS (v9.4), R (v4.0.2), and RStudio (v1.3.1093) were used for data preparation and analysis.18 Multiple regression analysis was used to predict county-level utilization rate from county-level variables. Sociodemographic characteristics from CHRD and HISA data were included as important control predictors in the regression model, though our focus for this paper are the access to care and housing quality predictors.
Model diagnostics (examination of model residuals, Breusch-Godfrey test, Breusch-Pagan test) revealed significant heteroskedasticity of the model; thus, robust standard errors and associated P values were computed using the R estimatr package (v0.30.2).19 Some predictor variables of interest (eg, ratio of mental health professionals) were removed during the model building process either due to problems of multicollinearity or excessive missingness that would have resulted in listwise deletion.
Results
County-level HISA utilization rate per 1000 EOY VHA patients ranged from 0.09 to 59.7%, with a 6.6% mean and 5% median (Figure 2). The data were highly positively skewed. The final model included 33 total predictor variables (Table 1). The final regression model was a significantly better predictor of county-level HISA utilization rate than a null model (F[33-2184], 10.18; P < .001). The adjusted model R2 showed that the overall model accounted for approximately 23% of variance in county-level HISA utilization rate (Table 2).
Among the primary variables of interest, percent uninsured adults and rate of preventable hospital stays emerged as significant predictors of county-level HISA utilization rate. Specifically, county percentage of uninsured adults was negatively related to county-level HISA utilization rate (b = -8.99, P = .005), indicating that the higher the proportion of uninsured adults—with all other predictors held constant—the lower the HISA utilization rate. Percent uninsured adults ranged from 2.7 to 42.4% across counties, with a mean (SD) of 12.7% (5.8%) and 11.4% median.
County rate of preventable hospital stays, however, was significantly and positively related to county-level HISA utilization rate (b = .0004, P = .009), indicating that the higher the rate of preventable hospital stays—with all other predictors held constant—the higher the HISA utilization rate. The direction of this effect is the opposite of the direction of the effect of percent uninsured adults (positive rather than negative), even though both could be considered measures of access to care. The standardized β for these 2 predictors indicate that county rate of preventable hospital stays is a somewhat stronger predictor of county-level HISA utilization rate than is county percent of uninsured adults (β = .11 and β = -.09, respectively). Rate of preventable hospital stays ranged from 683 to 16,802 across counties included in this analysis, with a mean (SD) of 4,796.5 (1659.9) and a 4669 median.
Of secondary interest was county rurality. The county-level percentage of rural residents was significantly and positively related to county-level HISA utilization rate, indicating that the higher the proportion of individuals within county considered rural—all other predictors held constant—the higher the HISA utilization rate. The mean (SD) percentage of rural residents per county was 52.3% (30.2) and 52.7 % median.
Discussion
This study examined whether county-level characteristics, specifically variables for access to care, quality of care, and housing quality, were predictive of a county’s HISA utilization rate. Given that this series of work on the HISA program is (to our knowledge) the first of its kind, and given the exploratory nature of this analysis, we did not have specific predictions for the effects of any one given variable. Nevertheless, some of the results were surprising, and we believe they warrant additional study. In particular, the opposing direction of effects for access to care and quality of care variables were hard to reconcile.
The county percent of uninsured adults (an access to care variable, specifically, a proxy for poor access to care) was negatively associated with county-level HISA utilization rate, whereas the county rate of preventable hospital stays (a quality of care variable, but also potentially an access to care variable, and specifically, proxies for poor quality of care or poor access to care) was positively associated with county-level HISA utilization rate. To describe the relationships more generally, one coefficient in the regression model indicated that the poorer the access to care, the lower the HISA utilization rate (higher percent of uninsured adults predicts lower HISA utilization rate), while another coefficient in the regression model indicated the poorer the quality of and access to care, the higher the HISA utilization rate (higher rate of preventable hospital stays predicts higher HISA utilization rate). Future study is warranted to disentangle and reconcile the various community-level predictors of this service.
Housing quality measures (eg, percent of households with high housing costs, percent of households with overcrowding, percent of households with lack of kitchen or plumbing, percent of households with severe housing cost burden, and percent of homeownership) are important in the consideration of whether a HM will be performed or should be performed. For example, if a person is cost burdened by the amount of expenditure spent in housing there will be little discretionary funds to perform a HM. Individuals who do not own their home may experience complications in obtaining permission from landlords to perform a HM. County-level predictors of housing quality (percent of households with high housing costs, overcrowding, and lack of kitchen or plumbing) were not significantly associated with county-level HISA utilization rate but are also nevertheless relevant to the discussion of home modifications. Of particular interest is the percent of households with lack of kitchen or plumbing variable, which was positively related to county-level HISA utilization rate although not statistically significant. HM elements related to the kitchen (eg, heighten countertop) add to the accessibility of the home allowing for the performing of activities of daily living such as cooking. Between FY 2015 and FY 2018, we discovered 131 prescriptions for kitchen (n = 90) and plumbing (n = 41) HMs, which is a very small proportion of the 30,780 total HMs (there were 24,397 bathroom HMs). The nonsignificant coefficient for this variable may reflect the small number of veterans that obtained these HM.
Limitations
The potentially conflicting direction of effects for a significant access to care variable (percent uninsured adults) and a significant access to care and quality of care variable (preventable hospital stays) are interesting and warrant additional study, but the inability to interpret or explain this apparent inconsistency constitutes a limitation of the current data and analyses presented here. Another limitation is that this analysis uses county-level predictors for what is ultimately an individual-level outcome. It would have been ideal to have both individual- and county-level data to conduct a multilevel analysis; in particular, individual-level data within counties of individuals (both veterans and nonveterans) who did not receive a HISA award (including both those who applied and were denied, and who did not apply) would be highly valuable.
Conclusions
Our continuing research into veterans’ use of HM fills a gap in the literature about the characteristics of HISA users, the impact of county-level variables on the use of HISA, and the geographic distribution and use of HISA within the VHA. While it is important to examine the influence of broader systems on individual outcomes, there could be myriad other factors that are more proximal and more closely related to whether any one individual applies for, let alone receives, a HISA award. Indeed, a low overall adjusted model R2 indicates that there is considerable variability in county-level HISA utilization rate that was not accounted for by the current model; this further speaks to warranted additional study.
More research is needed to understand and account for geographical variation in HISA utilization rate across the US. However, this work serves as an exploratory first step at quantifying and predicting HISA utilization rate at a broad level, with the ultimate goal of increasing access to HMs for veterans with disabilities.
Acknowledgments
This research was supported by grant 15521 from the US Department of Veterans Affairs, Office of Rural Health. Furthermore, the research was supported in part by grant K12 HD055929 from the National Institutes of Health. We want to acknowledge Cheri E. Knecht, Project Coordinator, for her assistance throughout all aspects of our research study and for her thoughtful contributions during the writing of this manuscript.
1. Semeah LM, Ahrentzen S, Jia H, Cowper-Ripley DC, Levy CE, Mann WC. The home improvements and structural alterations benefits program: veterans with disabilities and home accessibility. J Disability Policy Studies. 2017;28(1):43-51. doi:10.1177/1044207317696275
2. Semeah LM, Wang X, Cowper Ripley DC, Lee MJ, Ahonle ZJ, Ganesh SP, et al. Improving health through a home modification service for veterans. In: Fiedler BA, ed. Three Facets of Public Health and Paths to Improvements. Academic Press; 2020:381-416.
3. Semeah LM, Ahrentzen S, Cowper-Ripley DC, Santos-Roman LM, Beamish JO, Farley K. Rental housing needs and barriers from the perspective of veterans with disabilities. Housing Policy Debate. 2019;29(4):542-558. doi:10.1080/10511482.2018.1543203
4. Semeah LM, Ganesh SP, Wang X, et al. Home modification and health services utilization by rural and urban veterans with disabilities. Housing Policy Debate. 2021;31(6):862-874.doi:10.1080/10511482.2020.1858923
5. University of Wisconsin Population Health Institute. County health rankings model. Accessed May 13, 2022. https://www.countyhealthrankings.org/about-us
6. Remington PL, Catlin BB, Gennuso KP. The County Health Rankings: rationale and methods. Popul Health Metr. 2015;13(11). doi:10.1186/s12963-015-0044-2
7. National Academies of Sciences, Engineering, and Medicine. Health-Care Utilization as a Proxy in Disability Determination. Washington, DC: The National Academies Press; 2018.
8. Douthit N, Kiv S, Dwolatzky T, Biswas S. Exposing some important barriers to health care access in the rural USA. Public Health. 2015;129(6):611-20. doi:10.1016/j.puhe.2015.04.001
9. Medicaid and Chip Payment and Access Commission (MACPAC). Medicaid access in brief: adults’ experiences in obtaining medical care. November 2016. Accessed May 13, 2022. https://www.macpac.gov/publication/access-in-brief-adults-experiences-in-obtaining-medical-care
10. Tolbert J, Orgera, K, Damico A. Key facts about the uninsured population. November 6, 2020. Accessed May 13, 2022. https://www.kff.org/uninsured/issue-brief/key-facts-about-the-uninsured-population
11. Meit M, Knudson A, Gilbert T, et al. The 2014 update of the rural-urban chartbook, 2014. October 2014. Accessed May 13, 2022. http://www.ruralhealthresearch.org
12. National Center for Health Statistics (US). Report No.: 2016-1232. Health, United States, 2015: with special feature on racial and ethnic health disparities. Hyattsville, MD: National Center for Health Statistics.
13. Broussard DL, Mason KE, Carruth AR, Carton TW. Assessing potentially preventable hospitalizations at the county level: a comparison of measures using Medicare data and state hospital discharge data. Popul Health Manag. 2018;21(6):438-445. doi:10.1089/pop.2017.0141
14. Pezzin LE, Bogner HR, Kurichi JE, et al. Preventable hospitalizations, barriers to care, and disability. Medicine (Baltimore). 2018;97:e0691 doi:10.1097/MD.0000000000010691
15. Davis K, Ballreich J. Equitable access to care: how the United States ranks internationally. N Engl J Med. 2014;371(17):1567-70. doi:10.1056/NEJMp1406707
16. Squires D, Anderson C. U.S. health care from a global perspective: spending, use of services, prices, and health in 13 countries. Issue Brief (Commonw Fund). 2015;15:1-15.
17. VHA Service Support Center. Current enrollment cube (vssc.med.va.gov). Retrieved August 06, 2019. [Data not verified.]
18. Bunn A, Korpela M. R: A language and environment for statistical computing: an introduction to dplR. January 29, 2021. Accessed May 13, 2022. http://r.meteo.uni.wroc.pl/web/packages/dplR/vignettes/intro-dplR.pdf
19. Sheppard BH, Hartwick J, Warshaw PR. The theory of reasoned action: a meta-analysis of past research with recommendations for modifications and future research. J Consumer Research. 1988;15(3):325-343. doi:10.1086/209170
Home Modifications for Rural Veterans With Disabilities
The US Department of Veterans Affairs (VA) created the Home Improvements and Structural Alterations (HISA) program to help provide necessary home modifications (HMs) to veterans with disabilities (VWDs) that will facilitate the provision of medical services at home and improve home accessibility and functional independence. The Veterans Health Administration (VHA) has more than 9 million veteran enrollees; of those, 2.7 million are classified as rural or highly rural.1 Rural veterans (RVs) possess higher rate of disability compared with that of urban veterans.2-5 RVs have unequal access to screening of ambulatory care sensitive conditions (eg, hypertension, diabetes mellitus).6 Furthermore, RVs are at risk of poor medical outcomes due to distance from health care facilities and specialist care, which can be a barrier to emergency care when issues arise. These barriers, among others, are associated with compromised health quality of life and health outcomes for RVs.3,6 The HISA program may be key to decreasing falls and other serious mishaps in the home. Therefore, understanding use of the HISA program by RVs is important. However, to date little information has been available regarding use of HISA benefits by RVs or characteristics of RVs who receive HISA benefits.
HISA Alterations Program
HISA was initially developed by VA to improve veterans’ transition from acute medical care to home.7,8 However, to obtain HISA grants currently, there is an average 3 to 6 months application process.7 Through the HISA program, VWDs can be prescribed the following HMs, including (but not limited to): flooring replacement, permanent ramps, roll-in showers, installation of central air-conditioning systems, improved lighting, kitchen/bathroom modifications, and home inspections. The HMs prescribed depend on an assessment of medical need by health care providers (HCPs).8
As time passed and the veteran population aged, the program now primarily helps ensure the ability to enter into essential areas and safety in the home.5 The amount of a HISA payment is based on whether a veteran’s health condition is related to military service as defined by the VHA service connection medical evaluation process. Barriers to obtaining a HISA HM can include difficulty in navigating the evaluation process and difficulty in finding a qualified contractor or builder to do the HM.7
This article aims to: (1) Detail the sociodemographic and clinical characteristics of rural HISA users (RHUs); (2) report on HISA usage patterns in number, types, and cost of HMs; (3) compare use amid the diverse VA medical centers (VAMCs) and related complexity levels and Veterans Integrated Service Networks (VISNs); and (4) examine the relationship between travel time/distance and HISA utilization. The long-term goal is to provide accurate information to researchers, HM administrators, health care providers and policy makers on HISA program utilization by rural VWDs, which may help improve its use and bring awareness of its users. This study was approved by the affiliate University of Florida Institutional Review Board and VA research and development committee at the North Florida/South Georgia Veterans Health System.
Methods
Data were obtained from 3 VA sources: the National Prosthetics Patient Database (NPPD), the VHA Medical Inpatient Dataset, and the VHA Outpatient Dataset.7 The NPPD is a national administrative database that contains information on prosthetic-associated products ordered by HCPs for patients, such as portable ramps, handrails, home oxygen equipment, and orthotic and prosthetic apparatus. Data obtained from the NPPD included cost of HMs, clinical characteristics, VISN, and VAMC. VA facilities are categorized into complexity levels 1a, 1b, 1c, 2, and 3. Complexity level 1a to 1c VAMCs address medical cases that entail “heightening involvedness,” meaning a larger number of patients presented with medical concerns needing medical specialists. Complexity levels 2 and 3 have fewer resources, lower patient numbers, and less medically complex patients. Finally, the VHA Medical Inpatient and Outpatient Datasets administrated by VA Informatics and Computing Infrastructure, consist of in-depth health services national data on inpatient and outpatient encounters and procedures.
The study cohort was divided into those with service-connected conditions (Class 1) or those with conditions not related to military service (Class 2). If veterans were identified in both classes, they were assigned to Class 1. The cost variable is determined by using the veterans’ classification. Class 1 veterans receive a lifetime limit of $6800, and Class 2 veterans receive a lifetime limit of $2000. A Class 2 veteran with ≥ 50% disability rating is eligible for a HISA lifetime limit of $6800. Whenever a value exceeds allowed limit of $6800 or $2000, due to data entry error or other reasons, the study team reassigned the cost value to the maximum allowed value.
Travel distance and time were derived by loading patient zip codes and HISA facility locations into the geographical information system program and using the nearest facility and find-route tools. These tools used a road network that simulates real-world driving conditions to calculate distance.
Study Variables
VWDs of any age, gender, and race/ethnicity who qualified for HISA and received HMs from fiscal year ( FY) 2015 through FY 2018 were identified (N = 30,823). Most VWDs were nonrural subjects (n = 19,970), and 43 had no Federal Information Processing System data. The final study cohort consisted of 10,810 HISA recipients. The NPPD, inpatient and outpatient data were merged by scrambled social security numbers to retrieve the following data: age, gender, race, ethnicity, marital status, Class (1 or 2), mean and total number of inpatient days, and type of HMs prescribed.
We also recorded rurality using the VA Rural-Urban Commuting Areas (RUCA) system, but we combined the rural and highly rural designation.1 Census tracts with a RUCA score of 10.0 are deemed highly rural, the remainder are considered rural except those with a RUCA score of 1.0 or 1.1. Travel time and distance from a veteran’s home to the VA facility that provided the HISA prescription were determined from zip codes. The current study focuses on VAMCs prescribing stations (affiliated sites of administrative parent medical facilities) where the HISA users obtained the HM, not the parent station (administrative parent medical facilities).
HISA Utilization
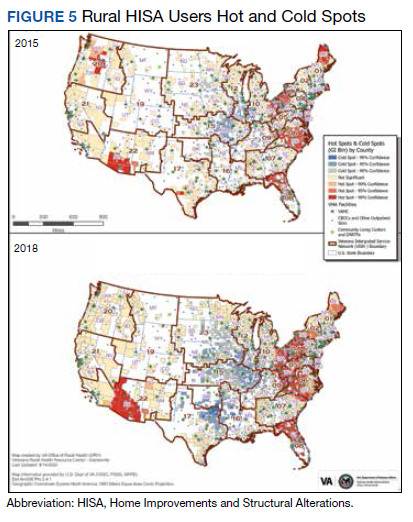
To characterize HISA utilization geographically and over time, the number of users were mapped by county. Areas where users were increasing (hot spots) or decreasing (cold spots) also were mapped. The maps were created using Environmental Systems Research Institute ArcGIS Pro 2.2.1 software. We chose to use natural breaks (Jenks) data classification method in a choropleth to symbolize the change over time map. We then used the Getis Ord GI* optimized hot spot analysis tool in the ArcGIS Pro spatial statistics tool set to generate the hot/cold spot maps. This tool identifies clusters of high values (hot spots) and low values (cold spots) creating a new output layer, RHUs by county, with a Z score, P value, and CI for each county. The Gi Bin field classifies statistically significant hot and cold spots. Counties sorted into the ± 3 category (bin) have a clustering characteristic (eg, with neighboring counties) that is statistically significant with a 99% CI; the ± 2 bin indicates a 95% CI for those county clustering sorted therein; ± 1 reflects a 90% CI; and 0 bin contains county features that have no statistical significant clustering with neighboring counties.
Data Analysis
Data were cleaned and analyzed using SAS 9.4 and R 3.5.3. Descriptive statistics are provided for sociodemographic characteristics, clinical characteristics, and class. ANOVA and t tests were used to compare continuous variables between groups, while χ2 and Fisher exact tests were used for dichotomous and categorical outcome variables. The threshold for statistical significance for these tests was set at α = .001.
Results
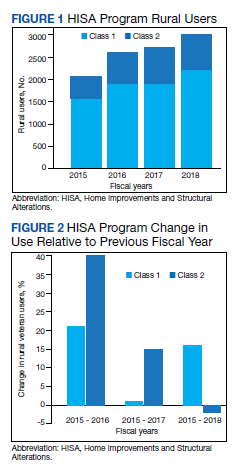
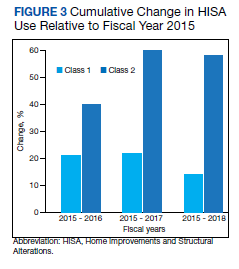
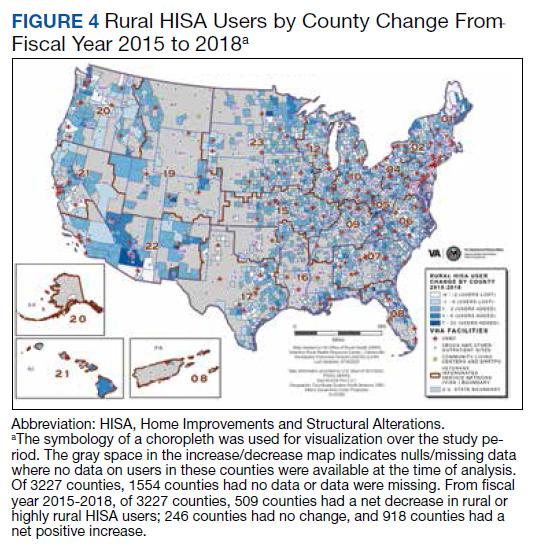
There were 10,810 RHUs from FY 2015 through FY 2018 and HISA utilization increased each year (Figure 1). Although some years may show usage decreases relative to previous fiscal years, the cumulative trends showed an increase relative to FY 2015 for both Classes of RVs (Figure 2). There was a 45.4% increase from FY 2015 to FY 2018 with a mean 13.6% yearly increase. Class 1 increased 21.0% and Class 2 increased 39.5% from FY 2015 to FY 2016 (Figure 3).
Most RHUs were male, White, and married. Class 1 and Class 2 RHUs differed significantly by age, race, marital status, and disability conditions: Class 1 RHUs were aged 6.6 years younger with a mean age of 69.1 years compared with 75.7 years for Class 2 users. For Class 1 RHUs, a plurality (29.4%) were aged 65 to 69 years; while a plurality (41.4%) of Class 2 users were aged ≥ 80 years. Musculoskeletal was the most common identified type of condition for all RHUs (Table 1).
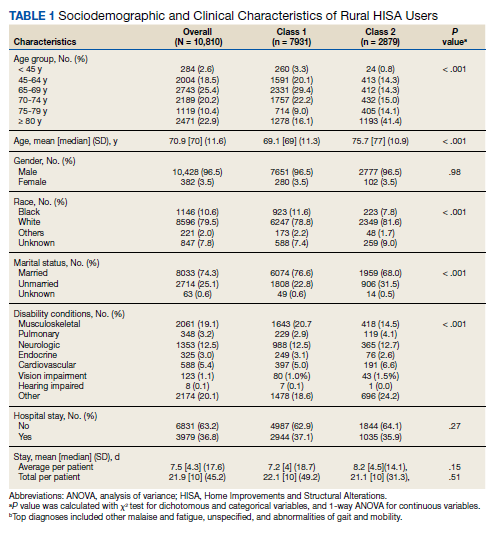
To better understand HISA utilization patterns and net RHUs per county, we used a map to detail RHUs by county and change over time (Figure 4). Additionally, we compared US counties by RHUs from FY 2015 to FY 2018 and determined how clusters of high numbers of RHUs (hot spots) and low numbers of RHUs (cold spots) shifted over this period (Figure 5). While HISA utilization grew over the study period, the net count of RHUs per county varied by 9 to 20 persons/county. The population of RHUs increased over time in the Southwest, Southeast, and over much of the East/Northeast, while in the Central and Midwest regions, number of RHUs seems to decrease in population and/or use of the system. The cold spots in the Midwest and South Central US seem to increase with a significant relationship to neighboring counties having a low number of RHUs.
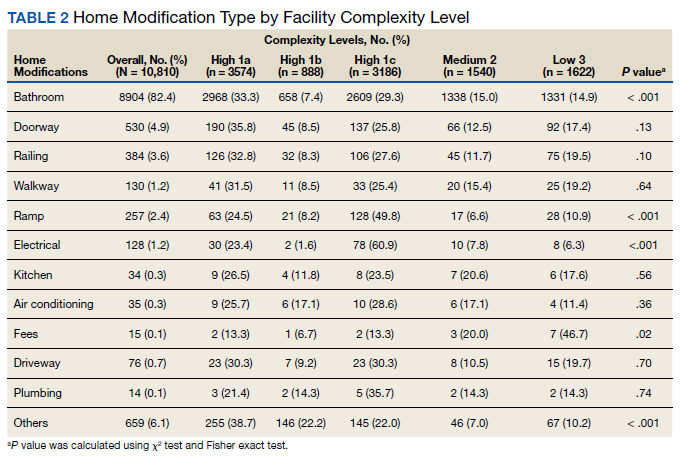
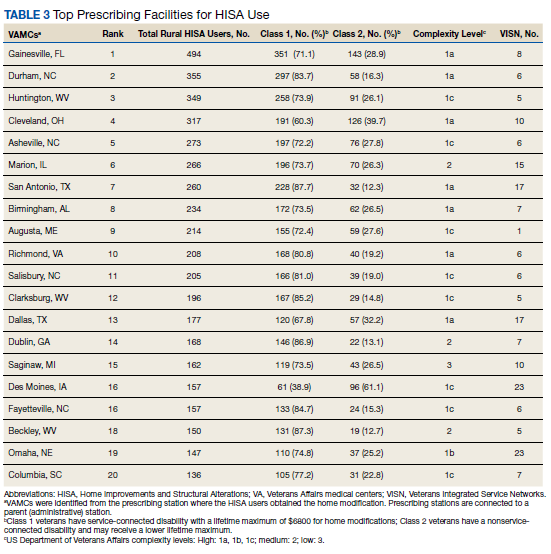
There were 11,166 HM prescribed to RHUs (Table 2). Bathroom HMs also were the dominant HM type for all facilities regardless of complexity levels (Table 3). The San Antonio, Texas, VAMC demonstrated the highest Class 1 vs Class 2 difference in HISA use (Class 1: 87.7% and Class 2: 12.3%). Except for the Des Moines VAMC, all other VAMCs showed HISA use > 60% by Class 1.
Cost Data
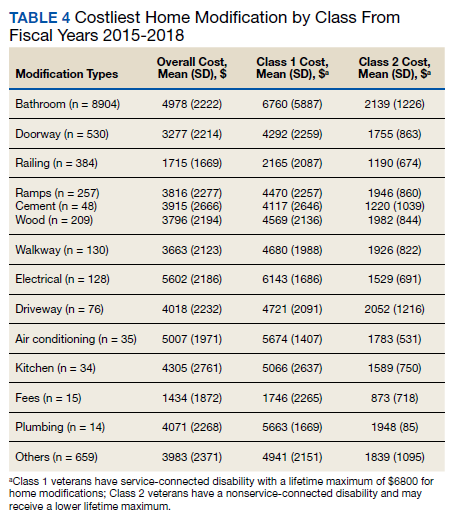
Air-conditioning installation ($5007) was the costliest HM overall (Table 4), closely followed by bathroom ($4978) and kitchen modifications ($4305). Bathroom renovations were the costliest HM type for both Class 1 and Class 2, closely followed by electrical repair and air-conditioning installation for Class 1 and driveway reconstruction and wooden ramp construction for Class 2.
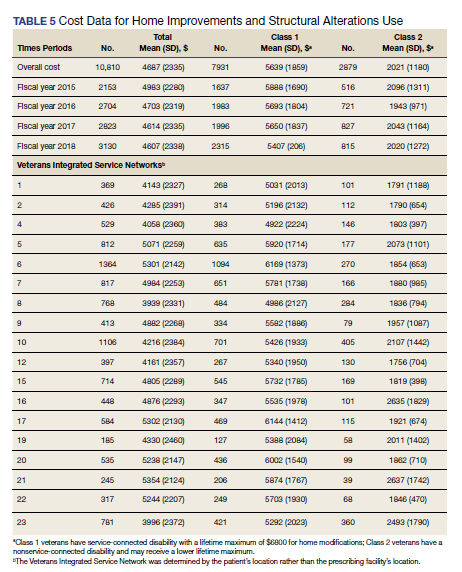
The mean award received for HM was $4687 (Table 5). While the number of RHUs increased from FY 2015 to FY 2016, the average cost decreased, both overall ($280) and for Class 1 ($195) and Class 2 ($153). Except for a small decline in the number of Class 2 HISA recipients from FY 2017 to FY 2018, overall, the number of RHUs continuously grew from FY 2015 to FY 2018: 977 for the overall cohort, 678 for Class 1 and 299 for Class 2. Despite the obvious gain in the number of RHUs, the average costs did not notably change over time. VISN 21 had the highest mean cost, followed by VISNs 17, 6, 22, and 20.
Travel
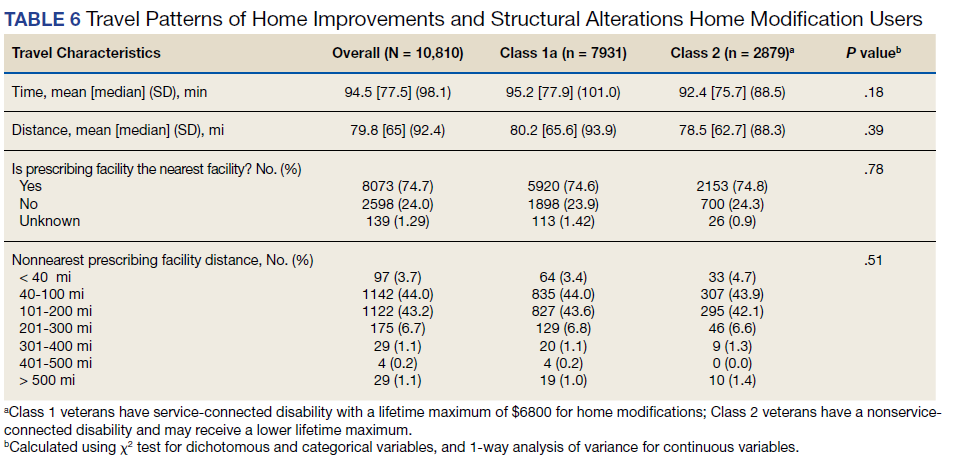
Travel time and distance to the HISA prescribing facility differed significantly between Class 1 and Class 2 HISA users. RHUs had to travel about 95 minutes from their place of residence to access the HISA benefits program. There were no statistically significant differences between Class 1 and 2 users with respect to travel time and distance traveled (Table 6).
The majority of Class 1 and Class 2 veterans accessed the HISA from their nearest facility. However, nearly one-quarter of both Class 1 and 2 RHUs (24% each) did not. Among the 2598 who accessed the nonnearest facility, 97 (3.7%) accessed a facility that is ≤ 40 miles. Many (44%) users traveled 40 to 100 miles, and another 43.2% traveled 100 to 200 miles from their residence to access a HM prescription. Some 2598 users (1.1%) traveled > 500 miles to access a facility.
Discussion
Although utilization of the HISA program has steadily increased, overall participation by subpopulations such as RHUs can still be improved significantly. Veterans aged ≤ 46 years who have a disability that is common to those receiving HISA benefits have low HISA utilization. Similarly, veterans with sensory disabilities also have low use. These subpopulations are among those in great need of attention and services.
A study by Lucas and Zelaya, using the 2016 National Health Interview Survey data with an aim to measure degree of vision problems, dual sensory impairment, and hearing trouble in male veterans aged ≥ 18 years, found that veterans were more likely to report dual sensory impairment and balance difficulties when compared with nonveterans.9 The number of female veterans is growing but had very low representation in this study.10 This emerging VHA population requires information and education on their HM benefits.
Home Modifications
The most common HM prescribed for RHUs was for the bathroom. Further investigation is warranted as to why, given the diversity of HM types that the grant covers, low prescription rates exist across most of the HM types. There may be a lack of knowledge by providers and VWD as to the range of HMs that can be awarded under the grant. It is important that HCPs and veterans receive education on HISA HM options.
Semeah and colleagues pointed out the need for an assessment of the HISA HM ordering system to ensure that multiple HMs items (eg, kitchen, air conditioning, fees, driveway, and plumbing) are listed among the forced choices shown to clinicians to select from.7 Poor housing in rural America is widespread: 63% of rural dwellings need renovations and/or repairs to be accessible to individuals with disabilities, with > 6.7 million rural homes having no or faulty plumbing or kitchens; yet in this study, prescriptions for these HMs accounted for < 1%.11,12
VISN 6 had the most HISA awards with 1364, while VISN 21 had the fewest (245). Across all VISNs, Class 1 RHUs received more prescriptions than did Class 2 RHUs. Future research may seek to examine whether prescribers are fully aware of the eligibility of HM prescription to Class 2 veterans. VISN 21 ($5354); VISN 17 ($5302); and VISN 6 ($5301) had the highest mean HM expenditures. The national mean cost for HISA HMs were $4978 for bathrooms and $4305 for kitchens; for non-HISA HMs in FY 2017, the mean costs were $6362 and $12,255, respectively. A noteworthy concern is whether the maximum grant limit awards are sufficient to perform more expensive and complex HMs, such as the kitchen or major bathroom alternations.13
Facilities categorized as 1a, 1b, or 1c provided
North Florida/Sough Georgia was the highest-prescribing VAMC with 39% more HM prescriptions than the second highest prescribing facility (Durham, NC). Unfortunately, the data presented here cannot establish causality for the large variance difference between the top facilities, and the skewed distribution of total RHUs across VAMCs.
Travel-Related Variables
HISA beneficiaries face significant travel-related challenges. Just 3.6% of RHUs could access a facility within 40 miles of their home and 43.2% traveled 100 to 200 miles from their home to access a HM prescription. Further exploration is warranted to understand how travel patterns impact access to or the uptake of HISA.
RVs already have problems with accessing care because of long travel time.14,15 The choice or necessity to travel to a farther facility for HISA prescription is problematic for RVs, especially when transportation is often reported in the literature as a barrier to resources for people living in rural communities.15-17 When patients have travel barriers, they wait longer to obtain medical services and often wait for their conditions to worsen before seeking services.15,18 Once HM is completed, telerehabilitation is an effective delivery method used for delivering health care services to people in remote places.18,19 Considering that HISA use has the potential to improve quality of life, afford comfort, facilitate the accomplishment of activities of daily living for RVs, it is important that future studies examine how existing telehealth technologies can be used to improve HISA access.
Future Directions
County-level analyses is warranted in future studies exploring potential variables associated with HISA use; for example, county-level rates of primary care physicians and other HCPs. Future research should explore how long distance travel impacts the HISA application process and HM implementation. Further research also should focus on the HISA application structure and process to identify causes of delays. The HISA application process takes a mean 6 months to complete, yet the duration of hospital stays is 1 to 3 weeks, thus it is impossible to connect HISA to hospital discharge, which was the original intent of the program. Future research can examine how telehealth services can expedite HISA obtainment and coordination of the application process. Future research also may study the possible causes of the wide variations in HM prescriptions per facility. It is also important that educational programs provide information on the array of HM items that veterans can obtain.
Conclusions
In our previous study of the HISA cohort (2011-2017), we documented that an increase in utilization of the HISA program was warranted based on the low national budgetary appropriation and identification of significant low participation by vulnerable subpopulations, including veterans residing in rural areas or having returned from recent conflicts.7 The present study documents national utilization patterns, demographic profiles, and clinical characteristics of RHUs from FY 2015 through FY 2018, data that may be useful to policy makers and HISA administrators in predicting future use and users. It is important to note that the data and information presented in this article identify trends. The work in no way establishes a gold standard or any targeted goal of utilization. Future research could focus on conceptualizing or theorizing what steps are necessary to set such a gold standard of utilization rate and steps toward achievement.
Acknowledgments
This research was supported by grant 15521 from the US Department of Veterans Affairs, Office of Rural Health . Furthermore, the research was supported in part by grant K12 HD055929 from the National Institutes of Health.
1. US Department of Veterans Affairs, Veteran Health Administration, Office of Rural Health. Rural veteran health care challenges. Updated February 9, 2021. Accessed June 11, 2021. https://www.ruralhealth.va.gov/aboutus/ruralvets.asp
2. Holder, K.A. Veterans in rural America, 2011–2015. Published January 2017. Accessed June 11, 2021. https://www.census.gov/content/dam/Census/library/publications/2017/acs/acs-36.pdf
3. Pezzin LE, Bogner HR, Kurichi JE, et al. Preventable hospitalizations, barriers to care, and disability. Medicine (Baltimore). 2018;97(19):e0691. doi:10.1097/MD.0000000000010691
4. Rosenbach ML. Access and satisfaction within the disabled Medicare population. Health Care Financ Rev. 1995;17(2):147-167.
5. Semeah LM, Ganesh SP, Wang X, et al. Home modification and health services utilization in rural and urban veterans with disabilities. Housing Policy Debate. 2021. Published online: March 4, 2021. doi:10.1080/10511482.2020.1858923
6. Spoont M, Greer N, Su J, Fitzgerald P, Rutks I, and Wilt TJ. Rural vs. urban ambulatory health care: A Systematic Review. Published May 2011. Accessed June 11, 2021. https://www.hsrd.research.va.gov/publications/esp/ambulatory.pdf
7. Semeah LM, Wang X, Cowper Ripley DC, et al. Improving health through a home modification service for veterans. In: Fiedler BA, ed. Three Facets of Public Health and Paths to Improvements. Academic Press; 2020:381-416.
8. Semeah LM, Ahrentzen S, Jia H, Cowper-Ripley DC, Levy CE, Mann WC. The home improvements and structural alterations benefits program: veterans with disabilities and home accessibility. J Disability Policy Studies. 2017;28(1):43-51. doi:10.1177/1044207317696275
9. Lucas, JW, Zelaya, CE. Hearing difficulty, vision trouble, and balance problems among male veterans and nonveterans. Published June 12, 2020. Accessed June 11, 2021. https://www.cdc.gov/nchs/data/nhsr/nhsr142-508.pdf
10. US Department of Veterans Affairs, National Center for Veterans Analysis and Statistics. Women veterans report: the past, present, and future of women veterans. Published February 2017. Accessed June 11, 2021. https://www.va.gov/vetdata/docs/SpecialReports/Women_Veterans_2015_Final.pdf
11. US Department of Housing and Urban Development, Office of Policy Development and Research. Housing challenges of rural seniors. Published 2017. Accessed June 11, 2021. https://www.huduser.gov/portal/periodicals/em/summer17/highlight1.html
12. Pendall R, Goodman L, Zhu J, Gold A. The future of rural housing. Published October 2016. Accessed June 11, 202.1 https://www.urban.org/sites/default/files/publication/85101/2000972-the-future-of-rural-housing_6.pdf
13. Joint Center for Housing Studies at Harvard University. Improving America’s housing 2019. Published 2019. Accessed June 11, 2021. https://www.jchs.harvard.edu/sites/default/files/reports/files/Harvard_JCHS_Improving_Americas_Housing_2019.pdf
14. Schooley BL, Horan TA, Lee PW, West PA. Rural veteran access to healthcare services: investigating the role of information and communication technologies in overcoming spatial barriers. Perspect Health Inf Manag. 2010;7(Spring):1f. Published 2010 Apr 1.
15. Ripley DC, Kwong PL, Vogel WB, Kurichi JE, Bates BE, Davenport C. How does geographic access affect in-hospital mortality for veterans with acute ischemic stroke?. Med Care. 2015;53(6):501-509. doi:10.1097/MLR.0000000000000366
16. Cowper-Ripley DC, Reker DM, Hayes J, et al. Geographic access to VHA rehabilitation services for traumatically injured veterans. Fed Pract. 2009;26(10):28-39.
17. Smith M, Towne S, Herrera-Venson A, Cameron K, Horel S, Ory M, et al. Delivery of fall prevention interventions for at-risk older adults in rural areas: Findings from a national dissemination. International journal of environmental research and public health. 2018;15:2798. doi: 10.3390/ijerph15122798
18. Hale-Gallardo JL, Kreider CM, Jia H, et al. Telerehabilitation for Rural Veterans: A Qualitative Assessment of Barriers and Facilitators to Implementation. J Multidiscip Healthc. 2020;13:559-570. doi:10.2147/JMDH.S247267
19. Sarfo FS, Akassi J, Kyem G, et al. Long-Term Outcomes of Stroke in a Ghanaian Outpatient Clinic. J Stroke Cerebrovasc Dis. 2018;27(4):1090-1099. doi:10.1016/j.jstrokecerebrovasdis.2017.11.017
The US Department of Veterans Affairs (VA) created the Home Improvements and Structural Alterations (HISA) program to help provide necessary home modifications (HMs) to veterans with disabilities (VWDs) that will facilitate the provision of medical services at home and improve home accessibility and functional independence. The Veterans Health Administration (VHA) has more than 9 million veteran enrollees; of those, 2.7 million are classified as rural or highly rural.1 Rural veterans (RVs) possess higher rate of disability compared with that of urban veterans.2-5 RVs have unequal access to screening of ambulatory care sensitive conditions (eg, hypertension, diabetes mellitus).6 Furthermore, RVs are at risk of poor medical outcomes due to distance from health care facilities and specialist care, which can be a barrier to emergency care when issues arise. These barriers, among others, are associated with compromised health quality of life and health outcomes for RVs.3,6 The HISA program may be key to decreasing falls and other serious mishaps in the home. Therefore, understanding use of the HISA program by RVs is important. However, to date little information has been available regarding use of HISA benefits by RVs or characteristics of RVs who receive HISA benefits.
HISA Alterations Program
HISA was initially developed by VA to improve veterans’ transition from acute medical care to home.7,8 However, to obtain HISA grants currently, there is an average 3 to 6 months application process.7 Through the HISA program, VWDs can be prescribed the following HMs, including (but not limited to): flooring replacement, permanent ramps, roll-in showers, installation of central air-conditioning systems, improved lighting, kitchen/bathroom modifications, and home inspections. The HMs prescribed depend on an assessment of medical need by health care providers (HCPs).8
As time passed and the veteran population aged, the program now primarily helps ensure the ability to enter into essential areas and safety in the home.5 The amount of a HISA payment is based on whether a veteran’s health condition is related to military service as defined by the VHA service connection medical evaluation process. Barriers to obtaining a HISA HM can include difficulty in navigating the evaluation process and difficulty in finding a qualified contractor or builder to do the HM.7
This article aims to: (1) Detail the sociodemographic and clinical characteristics of rural HISA users (RHUs); (2) report on HISA usage patterns in number, types, and cost of HMs; (3) compare use amid the diverse VA medical centers (VAMCs) and related complexity levels and Veterans Integrated Service Networks (VISNs); and (4) examine the relationship between travel time/distance and HISA utilization. The long-term goal is to provide accurate information to researchers, HM administrators, health care providers and policy makers on HISA program utilization by rural VWDs, which may help improve its use and bring awareness of its users. This study was approved by the affiliate University of Florida Institutional Review Board and VA research and development committee at the North Florida/South Georgia Veterans Health System.
Methods
Data were obtained from 3 VA sources: the National Prosthetics Patient Database (NPPD), the VHA Medical Inpatient Dataset, and the VHA Outpatient Dataset.7 The NPPD is a national administrative database that contains information on prosthetic-associated products ordered by HCPs for patients, such as portable ramps, handrails, home oxygen equipment, and orthotic and prosthetic apparatus. Data obtained from the NPPD included cost of HMs, clinical characteristics, VISN, and VAMC. VA facilities are categorized into complexity levels 1a, 1b, 1c, 2, and 3. Complexity level 1a to 1c VAMCs address medical cases that entail “heightening involvedness,” meaning a larger number of patients presented with medical concerns needing medical specialists. Complexity levels 2 and 3 have fewer resources, lower patient numbers, and less medically complex patients. Finally, the VHA Medical Inpatient and Outpatient Datasets administrated by VA Informatics and Computing Infrastructure, consist of in-depth health services national data on inpatient and outpatient encounters and procedures.
The study cohort was divided into those with service-connected conditions (Class 1) or those with conditions not related to military service (Class 2). If veterans were identified in both classes, they were assigned to Class 1. The cost variable is determined by using the veterans’ classification. Class 1 veterans receive a lifetime limit of $6800, and Class 2 veterans receive a lifetime limit of $2000. A Class 2 veteran with ≥ 50% disability rating is eligible for a HISA lifetime limit of $6800. Whenever a value exceeds allowed limit of $6800 or $2000, due to data entry error or other reasons, the study team reassigned the cost value to the maximum allowed value.
Travel distance and time were derived by loading patient zip codes and HISA facility locations into the geographical information system program and using the nearest facility and find-route tools. These tools used a road network that simulates real-world driving conditions to calculate distance.
Study Variables
VWDs of any age, gender, and race/ethnicity who qualified for HISA and received HMs from fiscal year ( FY) 2015 through FY 2018 were identified (N = 30,823). Most VWDs were nonrural subjects (n = 19,970), and 43 had no Federal Information Processing System data. The final study cohort consisted of 10,810 HISA recipients. The NPPD, inpatient and outpatient data were merged by scrambled social security numbers to retrieve the following data: age, gender, race, ethnicity, marital status, Class (1 or 2), mean and total number of inpatient days, and type of HMs prescribed.
We also recorded rurality using the VA Rural-Urban Commuting Areas (RUCA) system, but we combined the rural and highly rural designation.1 Census tracts with a RUCA score of 10.0 are deemed highly rural, the remainder are considered rural except those with a RUCA score of 1.0 or 1.1. Travel time and distance from a veteran’s home to the VA facility that provided the HISA prescription were determined from zip codes. The current study focuses on VAMCs prescribing stations (affiliated sites of administrative parent medical facilities) where the HISA users obtained the HM, not the parent station (administrative parent medical facilities).
HISA Utilization
To characterize HISA utilization geographically and over time, the number of users were mapped by county. Areas where users were increasing (hot spots) or decreasing (cold spots) also were mapped. The maps were created using Environmental Systems Research Institute ArcGIS Pro 2.2.1 software. We chose to use natural breaks (Jenks) data classification method in a choropleth to symbolize the change over time map. We then used the Getis Ord GI* optimized hot spot analysis tool in the ArcGIS Pro spatial statistics tool set to generate the hot/cold spot maps. This tool identifies clusters of high values (hot spots) and low values (cold spots) creating a new output layer, RHUs by county, with a Z score, P value, and CI for each county. The Gi Bin field classifies statistically significant hot and cold spots. Counties sorted into the ± 3 category (bin) have a clustering characteristic (eg, with neighboring counties) that is statistically significant with a 99% CI; the ± 2 bin indicates a 95% CI for those county clustering sorted therein; ± 1 reflects a 90% CI; and 0 bin contains county features that have no statistical significant clustering with neighboring counties.
Data Analysis
Data were cleaned and analyzed using SAS 9.4 and R 3.5.3. Descriptive statistics are provided for sociodemographic characteristics, clinical characteristics, and class. ANOVA and t tests were used to compare continuous variables between groups, while χ2 and Fisher exact tests were used for dichotomous and categorical outcome variables. The threshold for statistical significance for these tests was set at α = .001.
Results
There were 10,810 RHUs from FY 2015 through FY 2018 and HISA utilization increased each year (Figure 1). Although some years may show usage decreases relative to previous fiscal years, the cumulative trends showed an increase relative to FY 2015 for both Classes of RVs (Figure 2). There was a 45.4% increase from FY 2015 to FY 2018 with a mean 13.6% yearly increase. Class 1 increased 21.0% and Class 2 increased 39.5% from FY 2015 to FY 2016 (Figure 3).
Most RHUs were male, White, and married. Class 1 and Class 2 RHUs differed significantly by age, race, marital status, and disability conditions: Class 1 RHUs were aged 6.6 years younger with a mean age of 69.1 years compared with 75.7 years for Class 2 users. For Class 1 RHUs, a plurality (29.4%) were aged 65 to 69 years; while a plurality (41.4%) of Class 2 users were aged ≥ 80 years. Musculoskeletal was the most common identified type of condition for all RHUs (Table 1).
To better understand HISA utilization patterns and net RHUs per county, we used a map to detail RHUs by county and change over time (Figure 4). Additionally, we compared US counties by RHUs from FY 2015 to FY 2018 and determined how clusters of high numbers of RHUs (hot spots) and low numbers of RHUs (cold spots) shifted over this period (Figure 5). While HISA utilization grew over the study period, the net count of RHUs per county varied by 9 to 20 persons/county. The population of RHUs increased over time in the Southwest, Southeast, and over much of the East/Northeast, while in the Central and Midwest regions, number of RHUs seems to decrease in population and/or use of the system. The cold spots in the Midwest and South Central US seem to increase with a significant relationship to neighboring counties having a low number of RHUs.
There were 11,166 HM prescribed to RHUs (Table 2). Bathroom HMs also were the dominant HM type for all facilities regardless of complexity levels (Table 3). The San Antonio, Texas, VAMC demonstrated the highest Class 1 vs Class 2 difference in HISA use (Class 1: 87.7% and Class 2: 12.3%). Except for the Des Moines VAMC, all other VAMCs showed HISA use > 60% by Class 1.
Cost Data
Air-conditioning installation ($5007) was the costliest HM overall (Table 4), closely followed by bathroom ($4978) and kitchen modifications ($4305). Bathroom renovations were the costliest HM type for both Class 1 and Class 2, closely followed by electrical repair and air-conditioning installation for Class 1 and driveway reconstruction and wooden ramp construction for Class 2.
The mean award received for HM was $4687 (Table 5). While the number of RHUs increased from FY 2015 to FY 2016, the average cost decreased, both overall ($280) and for Class 1 ($195) and Class 2 ($153). Except for a small decline in the number of Class 2 HISA recipients from FY 2017 to FY 2018, overall, the number of RHUs continuously grew from FY 2015 to FY 2018: 977 for the overall cohort, 678 for Class 1 and 299 for Class 2. Despite the obvious gain in the number of RHUs, the average costs did not notably change over time. VISN 21 had the highest mean cost, followed by VISNs 17, 6, 22, and 20.
Travel
Travel time and distance to the HISA prescribing facility differed significantly between Class 1 and Class 2 HISA users. RHUs had to travel about 95 minutes from their place of residence to access the HISA benefits program. There were no statistically significant differences between Class 1 and 2 users with respect to travel time and distance traveled (Table 6).
The majority of Class 1 and Class 2 veterans accessed the HISA from their nearest facility. However, nearly one-quarter of both Class 1 and 2 RHUs (24% each) did not. Among the 2598 who accessed the nonnearest facility, 97 (3.7%) accessed a facility that is ≤ 40 miles. Many (44%) users traveled 40 to 100 miles, and another 43.2% traveled 100 to 200 miles from their residence to access a HM prescription. Some 2598 users (1.1%) traveled > 500 miles to access a facility.
Discussion
Although utilization of the HISA program has steadily increased, overall participation by subpopulations such as RHUs can still be improved significantly. Veterans aged ≤ 46 years who have a disability that is common to those receiving HISA benefits have low HISA utilization. Similarly, veterans with sensory disabilities also have low use. These subpopulations are among those in great need of attention and services.
A study by Lucas and Zelaya, using the 2016 National Health Interview Survey data with an aim to measure degree of vision problems, dual sensory impairment, and hearing trouble in male veterans aged ≥ 18 years, found that veterans were more likely to report dual sensory impairment and balance difficulties when compared with nonveterans.9 The number of female veterans is growing but had very low representation in this study.10 This emerging VHA population requires information and education on their HM benefits.
Home Modifications
The most common HM prescribed for RHUs was for the bathroom. Further investigation is warranted as to why, given the diversity of HM types that the grant covers, low prescription rates exist across most of the HM types. There may be a lack of knowledge by providers and VWD as to the range of HMs that can be awarded under the grant. It is important that HCPs and veterans receive education on HISA HM options.
Semeah and colleagues pointed out the need for an assessment of the HISA HM ordering system to ensure that multiple HMs items (eg, kitchen, air conditioning, fees, driveway, and plumbing) are listed among the forced choices shown to clinicians to select from.7 Poor housing in rural America is widespread: 63% of rural dwellings need renovations and/or repairs to be accessible to individuals with disabilities, with > 6.7 million rural homes having no or faulty plumbing or kitchens; yet in this study, prescriptions for these HMs accounted for < 1%.11,12
VISN 6 had the most HISA awards with 1364, while VISN 21 had the fewest (245). Across all VISNs, Class 1 RHUs received more prescriptions than did Class 2 RHUs. Future research may seek to examine whether prescribers are fully aware of the eligibility of HM prescription to Class 2 veterans. VISN 21 ($5354); VISN 17 ($5302); and VISN 6 ($5301) had the highest mean HM expenditures. The national mean cost for HISA HMs were $4978 for bathrooms and $4305 for kitchens; for non-HISA HMs in FY 2017, the mean costs were $6362 and $12,255, respectively. A noteworthy concern is whether the maximum grant limit awards are sufficient to perform more expensive and complex HMs, such as the kitchen or major bathroom alternations.13
Facilities categorized as 1a, 1b, or 1c provided
North Florida/Sough Georgia was the highest-prescribing VAMC with 39% more HM prescriptions than the second highest prescribing facility (Durham, NC). Unfortunately, the data presented here cannot establish causality for the large variance difference between the top facilities, and the skewed distribution of total RHUs across VAMCs.
Travel-Related Variables
HISA beneficiaries face significant travel-related challenges. Just 3.6% of RHUs could access a facility within 40 miles of their home and 43.2% traveled 100 to 200 miles from their home to access a HM prescription. Further exploration is warranted to understand how travel patterns impact access to or the uptake of HISA.
RVs already have problems with accessing care because of long travel time.14,15 The choice or necessity to travel to a farther facility for HISA prescription is problematic for RVs, especially when transportation is often reported in the literature as a barrier to resources for people living in rural communities.15-17 When patients have travel barriers, they wait longer to obtain medical services and often wait for their conditions to worsen before seeking services.15,18 Once HM is completed, telerehabilitation is an effective delivery method used for delivering health care services to people in remote places.18,19 Considering that HISA use has the potential to improve quality of life, afford comfort, facilitate the accomplishment of activities of daily living for RVs, it is important that future studies examine how existing telehealth technologies can be used to improve HISA access.
Future Directions
County-level analyses is warranted in future studies exploring potential variables associated with HISA use; for example, county-level rates of primary care physicians and other HCPs. Future research should explore how long distance travel impacts the HISA application process and HM implementation. Further research also should focus on the HISA application structure and process to identify causes of delays. The HISA application process takes a mean 6 months to complete, yet the duration of hospital stays is 1 to 3 weeks, thus it is impossible to connect HISA to hospital discharge, which was the original intent of the program. Future research can examine how telehealth services can expedite HISA obtainment and coordination of the application process. Future research also may study the possible causes of the wide variations in HM prescriptions per facility. It is also important that educational programs provide information on the array of HM items that veterans can obtain.
Conclusions
In our previous study of the HISA cohort (2011-2017), we documented that an increase in utilization of the HISA program was warranted based on the low national budgetary appropriation and identification of significant low participation by vulnerable subpopulations, including veterans residing in rural areas or having returned from recent conflicts.7 The present study documents national utilization patterns, demographic profiles, and clinical characteristics of RHUs from FY 2015 through FY 2018, data that may be useful to policy makers and HISA administrators in predicting future use and users. It is important to note that the data and information presented in this article identify trends. The work in no way establishes a gold standard or any targeted goal of utilization. Future research could focus on conceptualizing or theorizing what steps are necessary to set such a gold standard of utilization rate and steps toward achievement.
Acknowledgments
This research was supported by grant 15521 from the US Department of Veterans Affairs, Office of Rural Health . Furthermore, the research was supported in part by grant K12 HD055929 from the National Institutes of Health.
1. US Department of Veterans Affairs, Veteran Health Administration, Office of Rural Health. Rural veteran health care challenges. Updated February 9, 2021. Accessed June 11, 2021. https://www.ruralhealth.va.gov/aboutus/ruralvets.asp
2. Holder, K.A. Veterans in rural America, 2011–2015. Published January 2017. Accessed June 11, 2021. https://www.census.gov/content/dam/Census/library/publications/2017/acs/acs-36.pdf
3. Pezzin LE, Bogner HR, Kurichi JE, et al. Preventable hospitalizations, barriers to care, and disability. Medicine (Baltimore). 2018;97(19):e0691. doi:10.1097/MD.0000000000010691
4. Rosenbach ML. Access and satisfaction within the disabled Medicare population. Health Care Financ Rev. 1995;17(2):147-167.
5. Semeah LM, Ganesh SP, Wang X, et al. Home modification and health services utilization in rural and urban veterans with disabilities. Housing Policy Debate. 2021. Published online: March 4, 2021. doi:10.1080/10511482.2020.1858923
6. Spoont M, Greer N, Su J, Fitzgerald P, Rutks I, and Wilt TJ. Rural vs. urban ambulatory health care: A Systematic Review. Published May 2011. Accessed June 11, 2021. https://www.hsrd.research.va.gov/publications/esp/ambulatory.pdf
7. Semeah LM, Wang X, Cowper Ripley DC, et al. Improving health through a home modification service for veterans. In: Fiedler BA, ed. Three Facets of Public Health and Paths to Improvements. Academic Press; 2020:381-416.
8. Semeah LM, Ahrentzen S, Jia H, Cowper-Ripley DC, Levy CE, Mann WC. The home improvements and structural alterations benefits program: veterans with disabilities and home accessibility. J Disability Policy Studies. 2017;28(1):43-51. doi:10.1177/1044207317696275
9. Lucas, JW, Zelaya, CE. Hearing difficulty, vision trouble, and balance problems among male veterans and nonveterans. Published June 12, 2020. Accessed June 11, 2021. https://www.cdc.gov/nchs/data/nhsr/nhsr142-508.pdf
10. US Department of Veterans Affairs, National Center for Veterans Analysis and Statistics. Women veterans report: the past, present, and future of women veterans. Published February 2017. Accessed June 11, 2021. https://www.va.gov/vetdata/docs/SpecialReports/Women_Veterans_2015_Final.pdf
11. US Department of Housing and Urban Development, Office of Policy Development and Research. Housing challenges of rural seniors. Published 2017. Accessed June 11, 2021. https://www.huduser.gov/portal/periodicals/em/summer17/highlight1.html
12. Pendall R, Goodman L, Zhu J, Gold A. The future of rural housing. Published October 2016. Accessed June 11, 202.1 https://www.urban.org/sites/default/files/publication/85101/2000972-the-future-of-rural-housing_6.pdf
13. Joint Center for Housing Studies at Harvard University. Improving America’s housing 2019. Published 2019. Accessed June 11, 2021. https://www.jchs.harvard.edu/sites/default/files/reports/files/Harvard_JCHS_Improving_Americas_Housing_2019.pdf
14. Schooley BL, Horan TA, Lee PW, West PA. Rural veteran access to healthcare services: investigating the role of information and communication technologies in overcoming spatial barriers. Perspect Health Inf Manag. 2010;7(Spring):1f. Published 2010 Apr 1.
15. Ripley DC, Kwong PL, Vogel WB, Kurichi JE, Bates BE, Davenport C. How does geographic access affect in-hospital mortality for veterans with acute ischemic stroke?. Med Care. 2015;53(6):501-509. doi:10.1097/MLR.0000000000000366
16. Cowper-Ripley DC, Reker DM, Hayes J, et al. Geographic access to VHA rehabilitation services for traumatically injured veterans. Fed Pract. 2009;26(10):28-39.
17. Smith M, Towne S, Herrera-Venson A, Cameron K, Horel S, Ory M, et al. Delivery of fall prevention interventions for at-risk older adults in rural areas: Findings from a national dissemination. International journal of environmental research and public health. 2018;15:2798. doi: 10.3390/ijerph15122798
18. Hale-Gallardo JL, Kreider CM, Jia H, et al. Telerehabilitation for Rural Veterans: A Qualitative Assessment of Barriers and Facilitators to Implementation. J Multidiscip Healthc. 2020;13:559-570. doi:10.2147/JMDH.S247267
19. Sarfo FS, Akassi J, Kyem G, et al. Long-Term Outcomes of Stroke in a Ghanaian Outpatient Clinic. J Stroke Cerebrovasc Dis. 2018;27(4):1090-1099. doi:10.1016/j.jstrokecerebrovasdis.2017.11.017
Trends in VA Telerehabilitation Patients and Encounters Over Time and by Rurality
Historically, the Veterans Health Administration (VHA) has excelled at improving veterans’ access to health care and enhancing foundational services, such as prosthetics and other veteran-centric services, and this continues to be the VHA’s top priority.1 Travel distance and time are often barriers to accessing health care for many veterans.2-11 For veterans with disabilities who must overcome additional physical, cognitive, and emotional obstacles to access vital rehabilitation services, these geographic obstacles are magnified. Further compounding the challenge is that rehabilitation therapies frequently require multiple encounters. Telerehabilitation is a promising solution for veterans in need of rehabilitation to regain optimal functioning. This alternative mode of service delivery can help veterans overcome geographic access barriers by delivering health care directly to veterans in their homes or nearby community-based outpatient clinics.12,13
A growing body of evidence supports telerehabilitation. In a 2017 systematic review and meta-analysis, Cottrell and colleagues reviewed and analyzed data from 13 studies that met their inclusion criteria; specifically, their meta-analytic sample comprised adults aged ≥ 18 years presenting with any diagnosed primary musculoskeletal condition; treatment interventions via a real-time telerehabilitation medium, trials that had a comparison group with the same condition; provided clinical outcomes data, and included published randomized and nonrandomized controlled trials.14 Based on their aggregated results, they concluded that real-time telerehabilitation was effective in improving physical function (standardized mean difference [SMD], 0.63; 95% CI, 0.92-2.33; I2, 93%), and reducing pain (SMD, 0.66; 95% CI, −0.27- .60; I2, 96%) in patients with any diagnosed primary musculoskeletal condition.14
Two other systematic reviews conducted by Pietrzak and colleagues and Agostini and colleagues also demonstrated the clinical effectiveness of telerehabilitation.15,16 Clinical effectiveness was defined as changes in health, functional status, and satisfaction with the telerehabilitation services delivered. The studies examined in the review included those that provided online self-management and education in addition to exercise via teleconferencing in real time.
Pietrzak and colleagues found that Internet-based osteoarthritis self-management interventions significantly improved 4 of 6 health status measures reviewed (ie, pain, fatigue, activity limitation, health distress, disability, and self‐reported global health).15 User acceptance and satisfaction were high (≥ 70% satisfied) in all studies meeting the inclusion criteria.
Agostini and colleagues found that telerehabilitation was more effective than other modes of delivering rehabilitation to regain motor function in cardiac (SMD, 0.24; 95% CI, 0.04-0.43) and total knee arthroplasty (Timed Up and Go test: SMD, −5.17; 95% CI, −9.79- −0.55) patients.16 Some evidence from VHA and non-VHA studies also support the use of telerehabilitation to reduce health care costs,17-19 improve treatment adherence,12,20 and enhance patient physical, cognitive and mobility function, as well as patient satisfaction and health-related quality of life.13,21-24
Since the first recorded use of telehealth in 1959, the application of technology to deliver health care, including rehabilitation services, has increased exponentially.14 In fiscal year (FY) 2017 alone, the VA provided > 2 million episodes of care for > 700,000 veterans using telehealth services.2
Although the process for accessing telerehabilitation may vary throughout the VA, typically a few common factors make a veteran eligible for this mode of rehabilitation care delivery: Veterans must meet criteria for a specific program (eg, amputation, occupational therapy, and physical therapy) and receive VA care from a VA medical facility or clinic that offers telehealth services. Care providers must believe that the veteran would benefit from telerehabilitation (eg, limited mobility and long-distance travel to the facility) and that they would be able to receive an appropriate consult. The veteran must meet the following requirements: (1) willingness to consent to a visit via telehealth; (2) access to required equipment/e-mail; and (3) a caregiver to assist if they are unable to complete a visit independently.
In this article, we provide an overview of the growth of telerehabilitation in the VHA. Data are presented for specific telerehabilitation programs over time and by rurality.
Methods
The VHA Support Service Center works with VHA program offices and field users to provide field-focused business, clinical, and special topic reports. An online portal provides access to these customizable reports organized as data cubes, which represent data dimensions (ie, clinic type) and measures (ie, number of unique patients). For this study, we used the Connected Care, Telehealth, Call Centers Clinical Video Telehealth/Store and Forward Telehealth data cube clinical stop codes to identify the numbers of telerehabilitation veteran users and encounters across time. The following telerehabilitation clinic-stop codes were selected: 197 (polytrauma/traumatic brain injury [TBI]–individuals), 201 (Physical Medicine and Rehabilitation [PM&R] Service), 205 (physical therapy), 206 (occupational therapy), 211 (PM&R amputation clinic), 418 (amputation clinic), 214 (kinesiotherapy), and 240 (PM&R assistive technology clinic). Data for total unique patients served and the total number of encounters were extracted at the national level and by rurality from FY 2012 to FY 2017, providing the past 5 years of VHA telerehabilitation data.
It is important to note that in FY 2015, the VHA changed its definition of rurality to a rural-urban commuting areas (RUCA)-based system (www.ruralhealth.va.gov/rural-definition.asp). Prior to FY 2015, the VHA used the US Census Bureau (CB) urbanized area definitions. According to CB, an urbanized area contains a central city and surrounding area that totals > 50,000 in population. It also includes places outside of urbanized areas with populations > 2,500. Rural areas are defined as all other areas. VHA added a third category, highly rural, which is defined as areas that had < 7 people per square mile. In the RUCA system, each census tract defined by the CB is given a score. The VHA definitions are as follows:
- Urban (U)—census tracts with RUCA scores of 1.0 or 1.1. These tracts are determined by the CB as being in an urban core and having the majority of their workers commute within that same core (1.0). If 30% to 49% commute to an even larger urban core, then the code is 1.1;
- Rural (R)—all tracts not receiving scores in the urban or highly rural tiers; and
- Highly rural (H)—tracts with a RUCA score of 10.0. These are the most remote occupied land areas. Less than 10% of workers travel to CB-defined urbanized areas or urban clusters.
In addition, VHA recently added an “I” category to complement “U,” “R,” and “H.” The “I” value is assigned to veterans living on the US insular islands (ie, territories): Guam, American Samoa, Northern Marianas, and US Virgin Islands. For the analysis by rurality in this study, we excluded veterans living in the insular islands and those of unknown rurality (< 1.0% of patients and encounters). Further, because the numbers of highly rural veterans were relatively small (< 2% of patients and encounters), the rural and highly rural categories were combined and compared with urban-dwelling veterans.
Results
Overall, the workload for telerehabilitation nearly quadrupled over the 5-year period (Table 1 and Figure 1). 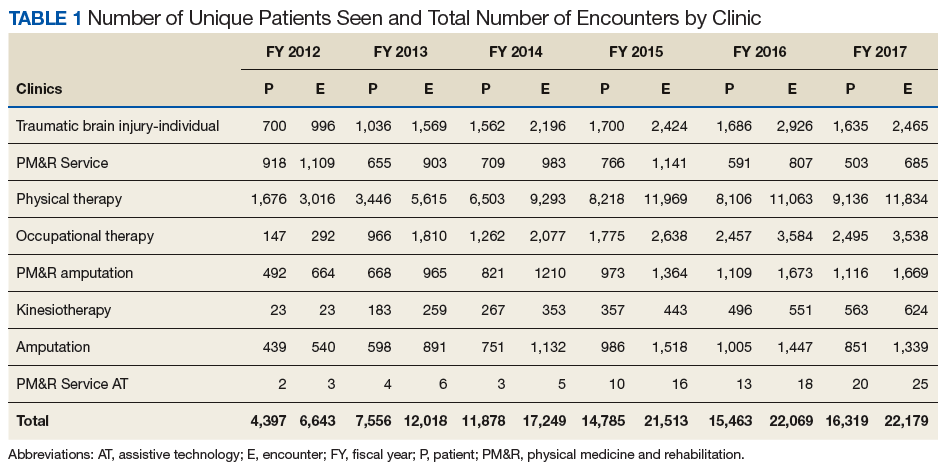
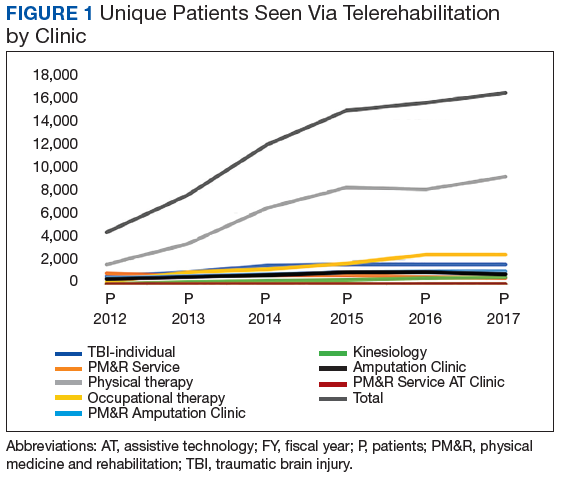
Interesting trends were seen by clinic type. Some clinics increased substantially, whereas others showed only moderate increases, and in 1 case (PM&R Service), a decrease. For example, there is significant growth in the number of patients and encounters involving physical therapy through telerehabilitation. This telerehabilitation clinic increased its workload from 1,676 patients with 3,016 encounters in FY 2012 to 9,136 patients with 11,834 encounters in FY 2017, accounting for 62.6% of total growth in patients and 56.8% of total growth in encounters.
Other clinics showing substantial growth over time included occupational therapy and polytrauma/TBI-individual secondary evaluation. Kinesiotherapy telerehabilitation was almost nonexistent in the VHA during FY 2012, with only 23 patients having 23 encounters. By FY 2017, there were 563 patients with 624 kinesiotherapy telerehabilitation encounters, equating to staggering increases in 5 years: 2,348% for patients and 2,613% for encounters. Similarly, the Physical Medicine and Rehabilitation Assistive Technology clinics had very low numbers in FY 2012 (patients, 2; encounters, 3) and increased over time; albeit, at a slow rate.
Trends by Rurality
Trends by rural location of patients and encounters must be interpreted with caution because of the changing rural definition between FY 2014 and FY 2015 (Tables 2 and 3; Figures 3 and 4). 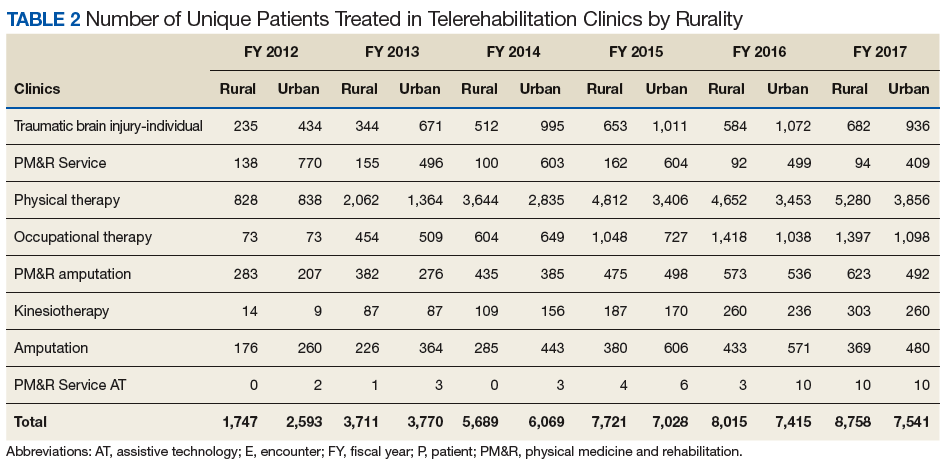
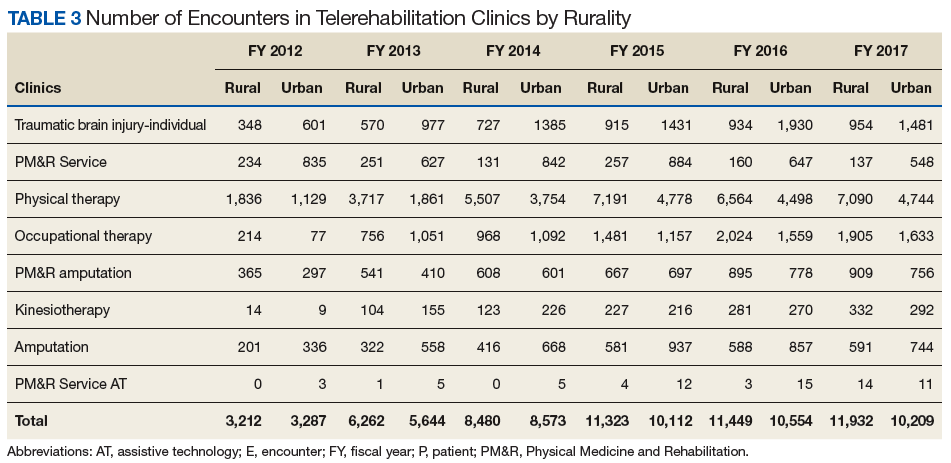
The increased total number of patients seen between FY 2012 and FY 2014 (old definition) was 225% for rural veterans vs 134% for urban veterans. Between FY 2015 and FY 2017 (new definition), the increase was lower for both groups (rural, 13.4%; urban, 7.3%), but rural veterans still increased at a higher rate than did urban dwellers. 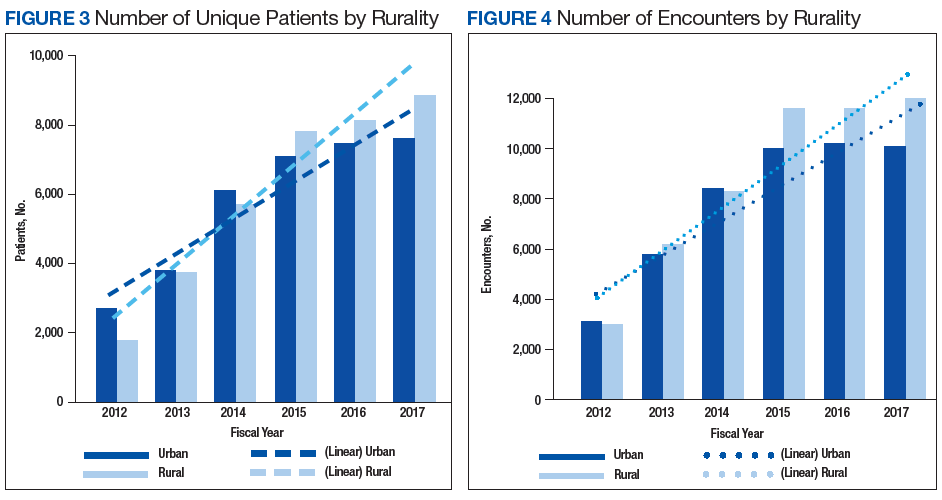
Discussion
Our primary aim was to provide data on the growth of telerehabilitation in the VHA over the past 5 years. Our secondary aim was to examine growth in the use of telerehabilitation by rurality. Specifically, we provided an overview of telerehabilitation growth in terms of unique patients and overall encounters in the VHA by rurality from FY 2012 to FY 2014 and FY 2015 to FY 2017 using the following programs: Polytrauma/TBI, PM&R Service, physical therapy, occupational therapy, PM&R amputation clinic, amputation clinic, kinesiotherapy, and PM&R assistive technology clinic. Our findings demonstrated a noteworthy increase in telerehabilitation encounters and unique patients over time for these programs. These findings were consistent with the overall trend of continued growth and expansion of telehealth within the VHA.
Our findings reveal an upward trend in the total number of rural encounters and rural unique patients despite the change in the VA’s definition of rurality in FY 2015. To our knowledge, urban and rural use of telerehabilitation has not been examined previously. Under both definitions of rurality, encounters and unique patients show an important increase over time, and by year-end 2017, more than half of all patients and encounters were attributed to rural patients (53.7% and 53.9%, respectively). Indeed, the upward trend may have been more pronounced if the rural definition had not changed in FY 2015. Our early VHA stroke patients study on the difference between rural-urban patients and taxonomies showed that the RUCA definition was more likely to reduce the number of rural patients by 8.5% than the early definition used by the VHA.26
It is notable that although the use of tele-delivery of rehabilitation has continually increased, the rate of this increase was steeper from FY 2012 to FY 2014 than FY 2015 to FY 2017. For the programs under consideration in this study, the total number of rural patients/encounters increased throughout the observed periods. However, urban patients and encounters increased through FY 2016 and experienced a slight decrease in FY 2017.
The appearance of a slower rate of increase may be due to a rapid initial rate of increase through early adopters and “crossing the diffusion chasm,” a well-documented process of slower diffusion between the time of invention to penetration that often characterizes the spread of successful telehealth innovations
With an emphasis on increasing access to rehabilitation services, the VHA can expect to see a continuing increase in both the number and the percentage of telerehabilitation rural patients and encounters. The VHA has several telerehabilitation initiatives underway through the VHA’s Physical Medicine and Rehabilitation Telerehabilitation Enterprise Wide Initiative (TREWI) and Rural Veterans Telerehabilitation Initiative. These projects demonstrate the feasibility of this delivery approach and facilitate integration of this modality in clinical workflows. However, to sustain these efforts, facilities will need more infrastructure and personnel resources dedicated to the delivery of services.
In an ongoing evaluation of the TREWI, several factors seem to influence the uptake of the VHA Office of Rural Health TREWI programs. These factors are the presence or absence of a local site champion; the quality of hospital leadership support; the quality of past relationships between telerehabilitation sending sites and receiving sites; barriers to getting a telehealth service agreement in place; the availability of space; administrative know-how on setting up clinics appropriately; time involved to bring on staff; contracting issues; equipment availability and installation; cultural issues in embracing technologic innovation; training burden; hassle factors; and limited funds. Although early adopters may be able to negotiate and push through many of the barriers associated with the diffusion of telerehabilitation, the numerous barriers may slow its larger systemwide diffusion.
Telerehabilitation is a promising mode to deliver care to rural veterans who otherwise may not have access to this type of specialty care. Therefore, the identification of elements that foster telerehabilitation growth in future investigations can assist policy makers and key stakeholders in optimally leveraging program resources for maximal productivity. Future studies investigating the drivers of increases in telerehabilitation growth by rurality are warranted. Furthermore, more research is needed to examine telerehabilitation growth quality of care outcomes (eg, patient and provider satisfaction) to ensure that care is not only timely and accessible, but of high quality.
Conclusion
Disparities between rural and urban veterans compel a mode of expanding delivery of care. The VHA has embraced the use of telehealth modalities to extend its reach of rehabilitation services to veterans with disability and rehabilitation needs. Growth in telerehabilitation rural patient encounters increases access to rehabilitative care, reduces patient and caregiver travel burden, and helps ensure treatment adherence. Telerehabilitation utilization (unique patients and total encounters) is growing more rapidly for rural veterans than for their urban counterparts. Overall, telerehabilitation is filling a gap for rural veterans, as well as veterans in general with challenges in accessibility to health care. In order to make full use of the telerehabilitation services across its health care system, VA health care facilities may need to expand their effort in telerehabilitation dissemination and education among providers and veterans, particularly among providers who are less familiar with telerehabilitation services and among veterans who live in rural or highly rural areas and need special rehabilitation care.
1. Shane L. What’s in the VA secretary’s 10-point plan to reform his department? https://rebootcamp.militarytimes.com/news/pentagon-congress/2017/02/28/what-s-in-the-va-secretary-s-10-point-plan-to-reform-his-department. Published February 28, 2017. Accessed November 21, 2018.
2. Burgess JF, DeFiore DA. The effect of distance to a VA facility on the choice and level of utilization of VA outpatient services. Soc Science Med. 1994;39(1):95-104.
3. LaVela SL, Smith B, Weaver FM, Miskevics SA. Geographical proximity and health care utilization in veterans with SCI&D in the USA. Soc Science Med. 2004;59:2387-2399.
4. Piette JD, Moos RH. The influence of distance on ambulatory care use, death, and readmission following a myocardial infarction. Health Serv Res. 1996;31(5):573-591.
5. Schmitt SK, Phibbs CS, Piette JD. The influence of distance on utilization of outpatient mental health aftercare following inpatient substance abuse treatment. Addictive Behav. 2003;28(6):1183-1192.
6. Fortney JC, Booth BM, Blow FC, Bunn JY. The effects of travel barriers and age on the utilization of alcoholism treatment aftercare. Am J Drug Alcohol Abuse. 1995;21(3):391-406.
7. McCarthy JF, Blow FC, Valenstein M, et al. Veterans Affairs Health System and mental health treatment retention among patients with serious mental illness: evaluating accessibility and availability barriers. Health Serv Res. 2007;42(3):1042-1060.
8. Mooney C, Zwanziger J, Phibbs CS, Schmitt S. Is travel distance a barrier to veterans’ use of VA hospitals for medical surgical care? Soc Sci Med. 2000;50(12):1743-1755.
9. Friedman SA, Frayne SM, Berg E, et al. Travel time and attrition from VHA care among women veterans: how far is too far? Med Care. 2015;53(4)(suppl 1):S15-S22.
10. Buzza C, Ono SS, Turvey C, et al. Distance is relative: unpacking a principal barrier in rural healthcare. J Gen Intern Med. 2011;26(suppl 2):648-654.
11. Goins RT, Williams KA, Carter MW, Spencer SM, Solovieva T. Perceived barriers to health care access among rural older adults: a qualitative study. J Rural Health. 2005;21(3):206-213.
12. Kairy D, Lehoux P, Vincent C, Visintin M. A systematic review of clinical outcomes, clinical process, healthcare utilization and costs associated with telerehabilitation. Disabil Rehabil. 2009;31(6):427-447.
13. McCue M, Fairman A, Pramuka M. Enhancing quality of life through telerehabilitation. Phys Med Rehabil Clin N Am. 2010;21(1):195-205.
14. Cottrell MA, Galea OA, O’Leary SP, Hill AJ, Russell TG. Real-time telerehabilitation for the treatment of musculoskeletal conditions is effective and comparable to standard practice: a systematic review and meta-analysis. Clin Rehabil. 2017;31(5):625-638.
15. Pietrzak E, Cotea C, Pullman S, Nasveld P. Self-management and rehabilitation in osteoarthritis: is there a place for internet-based interventions? Telemed J E Health. 2013;19(10):800-805.
16. Agostini M, Moja L, Banzi R, et al. Telerehabilitation and recovery of motor function: a systematic review and meta-analysis. J Telemed Telecare. 2015;21(4):202-213.
17. Kortke H, Stromeyer H, Zittermann A, et al. New East-Westfalian Postoperative Therapy Concept: A telemedicine guide for the study of ambulatory rehabilitation of patients after cardiac surgery. Telemed J E-Health. 2006;12(4):475-483.
18. Tousignant M, Boissy P, Corriveau H, Moffet H. In home telerehabilitation for older adults after discharge from an acute hospital or rehabilitation unit: A proof-of- concept study and costs estimation. Disabil Rehabil Assist Technol. 2006;1(4):209-216.
19. Sanford JA, Griffiths PC, Richardson P, et al. The effects of in-home rehabilitation on task self-efficacy in mobility-impaired adults: a randomized clinical trial. J Am Geriatr Soc. 2006;54(11):1641-1648.
20. Nakamura K, Takano T, Akao C. The effectiveness of videophones in home healthcare for the elderly. Med Care. 1999;37(2):117-125.
21. Levy CE, Silverman E, Jia H, Geiss M, Omura D. Effects of physical therapy delivery via home video telerehabilitation on functional and health-related quality of life outcomes. J Rehabil Res Dev. 2015;52(3):361-370.
22. Guilfoyle C, Wootton R, Hassall S, et al. User satisfaction with allied health services delivered to residential facilities via videoconferencing. J Telemed Telecare. 2003;9(1):S52-S54.23. Mair F, Whitten P. Systematic review of studies of patient satisfaction with telemedicine. BMJ. 2000;320(7248):1517-1520.
24. Williams T L, May C R, Esmail A. Limitations of patient satisfaction studies in telehealthcare: a systematic review of the literature. Telemed J E-Health. 2001;7(4):293-316.
25. US Department of Veterans Affairs, Office of Telehealth Services. http://vaww.telehealth.va.gov/quality/data/index.asp. Accessed June 1, 2018. [Nonpublic document; source not verified.]
26. Jia H, Cowper D, Tang Y, et al. Post-acute stroke rehabilitation utilization: Are there difference between rural-urban patients and taxonomies? J Rural Health. 2012;28(3):242-247.
27. Cho S, Mathiassen L, Gallivan M. Crossing the chasm: from adoption to diffusion of a telehealth innovation. In: León G, Bernardos AM, Casar JR, Kautz K, De Gross JI, eds. Open IT-Based Innovation: Moving Towards Cooperative IT Transfer and Knowledge Diffusion. Boston, MA: Springer; 2008.
28. Broderick A, Lindeman D. Scaling telehealth programs: lessons from early adopters. https://www.commonwealthfund.org/publications/case-study/2013/jan/scaling-telehealth-programs-lessons-early-adopters. Published January 2013. Accessed June 1, 2018.
Historically, the Veterans Health Administration (VHA) has excelled at improving veterans’ access to health care and enhancing foundational services, such as prosthetics and other veteran-centric services, and this continues to be the VHA’s top priority.1 Travel distance and time are often barriers to accessing health care for many veterans.2-11 For veterans with disabilities who must overcome additional physical, cognitive, and emotional obstacles to access vital rehabilitation services, these geographic obstacles are magnified. Further compounding the challenge is that rehabilitation therapies frequently require multiple encounters. Telerehabilitation is a promising solution for veterans in need of rehabilitation to regain optimal functioning. This alternative mode of service delivery can help veterans overcome geographic access barriers by delivering health care directly to veterans in their homes or nearby community-based outpatient clinics.12,13
A growing body of evidence supports telerehabilitation. In a 2017 systematic review and meta-analysis, Cottrell and colleagues reviewed and analyzed data from 13 studies that met their inclusion criteria; specifically, their meta-analytic sample comprised adults aged ≥ 18 years presenting with any diagnosed primary musculoskeletal condition; treatment interventions via a real-time telerehabilitation medium, trials that had a comparison group with the same condition; provided clinical outcomes data, and included published randomized and nonrandomized controlled trials.14 Based on their aggregated results, they concluded that real-time telerehabilitation was effective in improving physical function (standardized mean difference [SMD], 0.63; 95% CI, 0.92-2.33; I2, 93%), and reducing pain (SMD, 0.66; 95% CI, −0.27- .60; I2, 96%) in patients with any diagnosed primary musculoskeletal condition.14
Two other systematic reviews conducted by Pietrzak and colleagues and Agostini and colleagues also demonstrated the clinical effectiveness of telerehabilitation.15,16 Clinical effectiveness was defined as changes in health, functional status, and satisfaction with the telerehabilitation services delivered. The studies examined in the review included those that provided online self-management and education in addition to exercise via teleconferencing in real time.
Pietrzak and colleagues found that Internet-based osteoarthritis self-management interventions significantly improved 4 of 6 health status measures reviewed (ie, pain, fatigue, activity limitation, health distress, disability, and self‐reported global health).15 User acceptance and satisfaction were high (≥ 70% satisfied) in all studies meeting the inclusion criteria.
Agostini and colleagues found that telerehabilitation was more effective than other modes of delivering rehabilitation to regain motor function in cardiac (SMD, 0.24; 95% CI, 0.04-0.43) and total knee arthroplasty (Timed Up and Go test: SMD, −5.17; 95% CI, −9.79- −0.55) patients.16 Some evidence from VHA and non-VHA studies also support the use of telerehabilitation to reduce health care costs,17-19 improve treatment adherence,12,20 and enhance patient physical, cognitive and mobility function, as well as patient satisfaction and health-related quality of life.13,21-24
Since the first recorded use of telehealth in 1959, the application of technology to deliver health care, including rehabilitation services, has increased exponentially.14 In fiscal year (FY) 2017 alone, the VA provided > 2 million episodes of care for > 700,000 veterans using telehealth services.2
Although the process for accessing telerehabilitation may vary throughout the VA, typically a few common factors make a veteran eligible for this mode of rehabilitation care delivery: Veterans must meet criteria for a specific program (eg, amputation, occupational therapy, and physical therapy) and receive VA care from a VA medical facility or clinic that offers telehealth services. Care providers must believe that the veteran would benefit from telerehabilitation (eg, limited mobility and long-distance travel to the facility) and that they would be able to receive an appropriate consult. The veteran must meet the following requirements: (1) willingness to consent to a visit via telehealth; (2) access to required equipment/e-mail; and (3) a caregiver to assist if they are unable to complete a visit independently.
In this article, we provide an overview of the growth of telerehabilitation in the VHA. Data are presented for specific telerehabilitation programs over time and by rurality.
Methods
The VHA Support Service Center works with VHA program offices and field users to provide field-focused business, clinical, and special topic reports. An online portal provides access to these customizable reports organized as data cubes, which represent data dimensions (ie, clinic type) and measures (ie, number of unique patients). For this study, we used the Connected Care, Telehealth, Call Centers Clinical Video Telehealth/Store and Forward Telehealth data cube clinical stop codes to identify the numbers of telerehabilitation veteran users and encounters across time. The following telerehabilitation clinic-stop codes were selected: 197 (polytrauma/traumatic brain injury [TBI]–individuals), 201 (Physical Medicine and Rehabilitation [PM&R] Service), 205 (physical therapy), 206 (occupational therapy), 211 (PM&R amputation clinic), 418 (amputation clinic), 214 (kinesiotherapy), and 240 (PM&R assistive technology clinic). Data for total unique patients served and the total number of encounters were extracted at the national level and by rurality from FY 2012 to FY 2017, providing the past 5 years of VHA telerehabilitation data.
It is important to note that in FY 2015, the VHA changed its definition of rurality to a rural-urban commuting areas (RUCA)-based system (www.ruralhealth.va.gov/rural-definition.asp). Prior to FY 2015, the VHA used the US Census Bureau (CB) urbanized area definitions. According to CB, an urbanized area contains a central city and surrounding area that totals > 50,000 in population. It also includes places outside of urbanized areas with populations > 2,500. Rural areas are defined as all other areas. VHA added a third category, highly rural, which is defined as areas that had < 7 people per square mile. In the RUCA system, each census tract defined by the CB is given a score. The VHA definitions are as follows:
- Urban (U)—census tracts with RUCA scores of 1.0 or 1.1. These tracts are determined by the CB as being in an urban core and having the majority of their workers commute within that same core (1.0). If 30% to 49% commute to an even larger urban core, then the code is 1.1;
- Rural (R)—all tracts not receiving scores in the urban or highly rural tiers; and
- Highly rural (H)—tracts with a RUCA score of 10.0. These are the most remote occupied land areas. Less than 10% of workers travel to CB-defined urbanized areas or urban clusters.
In addition, VHA recently added an “I” category to complement “U,” “R,” and “H.” The “I” value is assigned to veterans living on the US insular islands (ie, territories): Guam, American Samoa, Northern Marianas, and US Virgin Islands. For the analysis by rurality in this study, we excluded veterans living in the insular islands and those of unknown rurality (< 1.0% of patients and encounters). Further, because the numbers of highly rural veterans were relatively small (< 2% of patients and encounters), the rural and highly rural categories were combined and compared with urban-dwelling veterans.
Results
Overall, the workload for telerehabilitation nearly quadrupled over the 5-year period (Table 1 and Figure 1).
Interesting trends were seen by clinic type. Some clinics increased substantially, whereas others showed only moderate increases, and in 1 case (PM&R Service), a decrease. For example, there is significant growth in the number of patients and encounters involving physical therapy through telerehabilitation. This telerehabilitation clinic increased its workload from 1,676 patients with 3,016 encounters in FY 2012 to 9,136 patients with 11,834 encounters in FY 2017, accounting for 62.6% of total growth in patients and 56.8% of total growth in encounters.
Other clinics showing substantial growth over time included occupational therapy and polytrauma/TBI-individual secondary evaluation. Kinesiotherapy telerehabilitation was almost nonexistent in the VHA during FY 2012, with only 23 patients having 23 encounters. By FY 2017, there were 563 patients with 624 kinesiotherapy telerehabilitation encounters, equating to staggering increases in 5 years: 2,348% for patients and 2,613% for encounters. Similarly, the Physical Medicine and Rehabilitation Assistive Technology clinics had very low numbers in FY 2012 (patients, 2; encounters, 3) and increased over time; albeit, at a slow rate.
Trends by Rurality
Trends by rural location of patients and encounters must be interpreted with caution because of the changing rural definition between FY 2014 and FY 2015 (Tables 2 and 3; Figures 3 and 4).
The increased total number of patients seen between FY 2012 and FY 2014 (old definition) was 225% for rural veterans vs 134% for urban veterans. Between FY 2015 and FY 2017 (new definition), the increase was lower for both groups (rural, 13.4%; urban, 7.3%), but rural veterans still increased at a higher rate than did urban dwellers.
Discussion
Our primary aim was to provide data on the growth of telerehabilitation in the VHA over the past 5 years. Our secondary aim was to examine growth in the use of telerehabilitation by rurality. Specifically, we provided an overview of telerehabilitation growth in terms of unique patients and overall encounters in the VHA by rurality from FY 2012 to FY 2014 and FY 2015 to FY 2017 using the following programs: Polytrauma/TBI, PM&R Service, physical therapy, occupational therapy, PM&R amputation clinic, amputation clinic, kinesiotherapy, and PM&R assistive technology clinic. Our findings demonstrated a noteworthy increase in telerehabilitation encounters and unique patients over time for these programs. These findings were consistent with the overall trend of continued growth and expansion of telehealth within the VHA.
Our findings reveal an upward trend in the total number of rural encounters and rural unique patients despite the change in the VA’s definition of rurality in FY 2015. To our knowledge, urban and rural use of telerehabilitation has not been examined previously. Under both definitions of rurality, encounters and unique patients show an important increase over time, and by year-end 2017, more than half of all patients and encounters were attributed to rural patients (53.7% and 53.9%, respectively). Indeed, the upward trend may have been more pronounced if the rural definition had not changed in FY 2015. Our early VHA stroke patients study on the difference between rural-urban patients and taxonomies showed that the RUCA definition was more likely to reduce the number of rural patients by 8.5% than the early definition used by the VHA.26
It is notable that although the use of tele-delivery of rehabilitation has continually increased, the rate of this increase was steeper from FY 2012 to FY 2014 than FY 2015 to FY 2017. For the programs under consideration in this study, the total number of rural patients/encounters increased throughout the observed periods. However, urban patients and encounters increased through FY 2016 and experienced a slight decrease in FY 2017.
The appearance of a slower rate of increase may be due to a rapid initial rate of increase through early adopters and “crossing the diffusion chasm,” a well-documented process of slower diffusion between the time of invention to penetration that often characterizes the spread of successful telehealth innovations
With an emphasis on increasing access to rehabilitation services, the VHA can expect to see a continuing increase in both the number and the percentage of telerehabilitation rural patients and encounters. The VHA has several telerehabilitation initiatives underway through the VHA’s Physical Medicine and Rehabilitation Telerehabilitation Enterprise Wide Initiative (TREWI) and Rural Veterans Telerehabilitation Initiative. These projects demonstrate the feasibility of this delivery approach and facilitate integration of this modality in clinical workflows. However, to sustain these efforts, facilities will need more infrastructure and personnel resources dedicated to the delivery of services.
In an ongoing evaluation of the TREWI, several factors seem to influence the uptake of the VHA Office of Rural Health TREWI programs. These factors are the presence or absence of a local site champion; the quality of hospital leadership support; the quality of past relationships between telerehabilitation sending sites and receiving sites; barriers to getting a telehealth service agreement in place; the availability of space; administrative know-how on setting up clinics appropriately; time involved to bring on staff; contracting issues; equipment availability and installation; cultural issues in embracing technologic innovation; training burden; hassle factors; and limited funds. Although early adopters may be able to negotiate and push through many of the barriers associated with the diffusion of telerehabilitation, the numerous barriers may slow its larger systemwide diffusion.
Telerehabilitation is a promising mode to deliver care to rural veterans who otherwise may not have access to this type of specialty care. Therefore, the identification of elements that foster telerehabilitation growth in future investigations can assist policy makers and key stakeholders in optimally leveraging program resources for maximal productivity. Future studies investigating the drivers of increases in telerehabilitation growth by rurality are warranted. Furthermore, more research is needed to examine telerehabilitation growth quality of care outcomes (eg, patient and provider satisfaction) to ensure that care is not only timely and accessible, but of high quality.
Conclusion
Disparities between rural and urban veterans compel a mode of expanding delivery of care. The VHA has embraced the use of telehealth modalities to extend its reach of rehabilitation services to veterans with disability and rehabilitation needs. Growth in telerehabilitation rural patient encounters increases access to rehabilitative care, reduces patient and caregiver travel burden, and helps ensure treatment adherence. Telerehabilitation utilization (unique patients and total encounters) is growing more rapidly for rural veterans than for their urban counterparts. Overall, telerehabilitation is filling a gap for rural veterans, as well as veterans in general with challenges in accessibility to health care. In order to make full use of the telerehabilitation services across its health care system, VA health care facilities may need to expand their effort in telerehabilitation dissemination and education among providers and veterans, particularly among providers who are less familiar with telerehabilitation services and among veterans who live in rural or highly rural areas and need special rehabilitation care.
1. Shane L. What’s in the VA secretary’s 10-point plan to reform his department? https://rebootcamp.militarytimes.com/news/pentagon-congress/2017/02/28/what-s-in-the-va-secretary-s-10-point-plan-to-reform-his-department. Published February 28, 2017. Accessed November 21, 2018.
2. Burgess JF, DeFiore DA. The effect of distance to a VA facility on the choice and level of utilization of VA outpatient services. Soc Science Med. 1994;39(1):95-104.
3. LaVela SL, Smith B, Weaver FM, Miskevics SA. Geographical proximity and health care utilization in veterans with SCI&D in the USA. Soc Science Med. 2004;59:2387-2399.
4. Piette JD, Moos RH. The influence of distance on ambulatory care use, death, and readmission following a myocardial infarction. Health Serv Res. 1996;31(5):573-591.
5. Schmitt SK, Phibbs CS, Piette JD. The influence of distance on utilization of outpatient mental health aftercare following inpatient substance abuse treatment. Addictive Behav. 2003;28(6):1183-1192.
6. Fortney JC, Booth BM, Blow FC, Bunn JY. The effects of travel barriers and age on the utilization of alcoholism treatment aftercare. Am J Drug Alcohol Abuse. 1995;21(3):391-406.
7. McCarthy JF, Blow FC, Valenstein M, et al. Veterans Affairs Health System and mental health treatment retention among patients with serious mental illness: evaluating accessibility and availability barriers. Health Serv Res. 2007;42(3):1042-1060.
8. Mooney C, Zwanziger J, Phibbs CS, Schmitt S. Is travel distance a barrier to veterans’ use of VA hospitals for medical surgical care? Soc Sci Med. 2000;50(12):1743-1755.
9. Friedman SA, Frayne SM, Berg E, et al. Travel time and attrition from VHA care among women veterans: how far is too far? Med Care. 2015;53(4)(suppl 1):S15-S22.
10. Buzza C, Ono SS, Turvey C, et al. Distance is relative: unpacking a principal barrier in rural healthcare. J Gen Intern Med. 2011;26(suppl 2):648-654.
11. Goins RT, Williams KA, Carter MW, Spencer SM, Solovieva T. Perceived barriers to health care access among rural older adults: a qualitative study. J Rural Health. 2005;21(3):206-213.
12. Kairy D, Lehoux P, Vincent C, Visintin M. A systematic review of clinical outcomes, clinical process, healthcare utilization and costs associated with telerehabilitation. Disabil Rehabil. 2009;31(6):427-447.
13. McCue M, Fairman A, Pramuka M. Enhancing quality of life through telerehabilitation. Phys Med Rehabil Clin N Am. 2010;21(1):195-205.
14. Cottrell MA, Galea OA, O’Leary SP, Hill AJ, Russell TG. Real-time telerehabilitation for the treatment of musculoskeletal conditions is effective and comparable to standard practice: a systematic review and meta-analysis. Clin Rehabil. 2017;31(5):625-638.
15. Pietrzak E, Cotea C, Pullman S, Nasveld P. Self-management and rehabilitation in osteoarthritis: is there a place for internet-based interventions? Telemed J E Health. 2013;19(10):800-805.
16. Agostini M, Moja L, Banzi R, et al. Telerehabilitation and recovery of motor function: a systematic review and meta-analysis. J Telemed Telecare. 2015;21(4):202-213.
17. Kortke H, Stromeyer H, Zittermann A, et al. New East-Westfalian Postoperative Therapy Concept: A telemedicine guide for the study of ambulatory rehabilitation of patients after cardiac surgery. Telemed J E-Health. 2006;12(4):475-483.
18. Tousignant M, Boissy P, Corriveau H, Moffet H. In home telerehabilitation for older adults after discharge from an acute hospital or rehabilitation unit: A proof-of- concept study and costs estimation. Disabil Rehabil Assist Technol. 2006;1(4):209-216.
19. Sanford JA, Griffiths PC, Richardson P, et al. The effects of in-home rehabilitation on task self-efficacy in mobility-impaired adults: a randomized clinical trial. J Am Geriatr Soc. 2006;54(11):1641-1648.
20. Nakamura K, Takano T, Akao C. The effectiveness of videophones in home healthcare for the elderly. Med Care. 1999;37(2):117-125.
21. Levy CE, Silverman E, Jia H, Geiss M, Omura D. Effects of physical therapy delivery via home video telerehabilitation on functional and health-related quality of life outcomes. J Rehabil Res Dev. 2015;52(3):361-370.
22. Guilfoyle C, Wootton R, Hassall S, et al. User satisfaction with allied health services delivered to residential facilities via videoconferencing. J Telemed Telecare. 2003;9(1):S52-S54.23. Mair F, Whitten P. Systematic review of studies of patient satisfaction with telemedicine. BMJ. 2000;320(7248):1517-1520.
24. Williams T L, May C R, Esmail A. Limitations of patient satisfaction studies in telehealthcare: a systematic review of the literature. Telemed J E-Health. 2001;7(4):293-316.
25. US Department of Veterans Affairs, Office of Telehealth Services. http://vaww.telehealth.va.gov/quality/data/index.asp. Accessed June 1, 2018. [Nonpublic document; source not verified.]
26. Jia H, Cowper D, Tang Y, et al. Post-acute stroke rehabilitation utilization: Are there difference between rural-urban patients and taxonomies? J Rural Health. 2012;28(3):242-247.
27. Cho S, Mathiassen L, Gallivan M. Crossing the chasm: from adoption to diffusion of a telehealth innovation. In: León G, Bernardos AM, Casar JR, Kautz K, De Gross JI, eds. Open IT-Based Innovation: Moving Towards Cooperative IT Transfer and Knowledge Diffusion. Boston, MA: Springer; 2008.
28. Broderick A, Lindeman D. Scaling telehealth programs: lessons from early adopters. https://www.commonwealthfund.org/publications/case-study/2013/jan/scaling-telehealth-programs-lessons-early-adopters. Published January 2013. Accessed June 1, 2018.