User login
Predictors of County-Level Home Modification Use Across the US
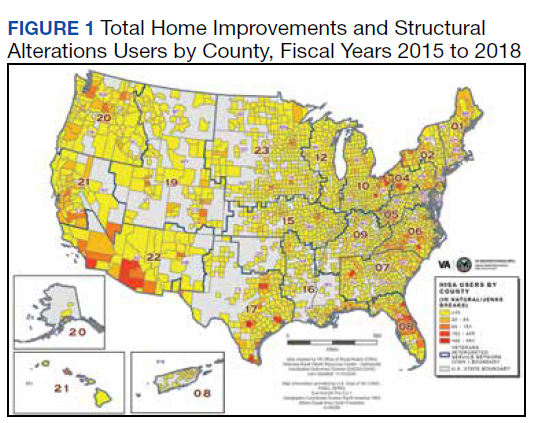
This article is part of a series of articles on the Home Improvements and Structural Alterations program (HISA), a home modification (HM) program within the Veterans Health Administration (VHA). HISA is a benefit awarded to veterans with disabilities (VWDs) and is instrumental in affording physical accessibility and structural alterations to veterans’ homes.1 The overarching goals of this project are to describe and understand HISA use by VWDs. Previous work has shown geographical variation in the number of HISA prescriptions across counties in the US (Figure 1).1 The current work seeks to describe and predict the county-level rates of HISA use. Information about what predicts HISA utilization at the county level is important because it enhances understanding of program utilization at a national level. The long-term goal of the series is to provide knowledge about HM services within VHA to improve community-based independent living of VWDs by increasing awareness and utilization of HM services.
Background
A health care professional (HCP) approves a HM support award by evaluating the practicality of the support to improve the built environment of a given veteran’s disability.1,2 Previously we detailed some of the preliminary research into the HISA program, including HISA user demographic and clinical characteristics, types of HMs received, user suggestions for improvement, and geospatial analysis of HISA prescriptions concentration.1-4
The geospatial analyses of HISA prescriptions revealed clusters of high numbers of HISA users (hot spots) and low numbers of HISA users (cold spots), indicating that HISA is either not prescribed or uniformly used across the US. The previous research prompted investigation into county-level variables that may impact HISA utilization rates. This inquiry focuses on county characteristics associated with HISA use rates, such as measures of clinical care and quality of care (eg, access to health services variables, lack of insurance, preventable hospital stays), physical environment, and sociodemographic characteristics. Clinical care and quality of care measures promote the interaction with HCPs. Moreover, access to health care is an important indicator of health outcomes.5,6 An individual’s capacity to access health services, such as a HM program, greatly impacts well-being, safety, independence, and health.2,4 Well-being, safety, independence, and health become compromised if individuals cannot access care, if needed care is lacking in their area, if HCPs are not available, or are unwilling to provide care due to lack of insurance coverage.7-12 In locations where health care services are minimal due to lack of specialists or health care facilities, the quality of (or access to) care may be compromised, resulting in preventable conditions becoming problematic.13,14 These conditions may result in unnecessary hospitalizations for conditions that could have been treated during routine care. Financial barriers to care particularly among low-income people and the uninsured have proven detrimental to health.15,16 On the other hand, preventable hospital stays are a quality of care measure (ie, a proxy for poor quality of care). HISA operates within a health care system; thus, it is imperative to include these measures impacting health.
In this study, we sought to identify county-level predictors—in particular, county-level proxies for access to care—that may be associated with county-level HISA use. We define HISA utilization rate as the percentage of a county’s VHA patients who have received a HISA award.
Methods
This study used data from the National Prosthetics Patient Database (NPPD), US Department of Veterans Affairs (VA) medical database inpatient and outpatient datasets, VHA Support Service Center (VSSC) data cubes, and the County Health Rankings database (CHRD). First, the study cohort was identified from NPPD users who have obtained a HISA award from fiscal years (FY) 2015 to 2018. Analysis started with FY 2015 following new regulations (38 CFR § 17) governing the operations of the HISA program.2 The study cohort was matched with records from NPPD and VA inpatient and outpatient datasets to obtain information about the veterans’ demographic characteristics and their HM characteristics and costs. The number of VHA end-of-year (EOY) patients per county was extracted from the VSSC Current Enrollment Cube, which was used in calculation of the county-level HISA utilization rate.17 Finally, zip code–based locational data were used to calculate approximate drive time and distance from the HISA user’s approximate location to the facility where they received their HM prescription. Drive times and drive distances were calculated with Esri ArcGIS Pro (v2.6.3) by placing zip code centroid and VHA facilities on a nationwide road network that contains both road speeds and distances.
Calculations
Patient-level data were aggregated up to county-level variables by calculating the sum, mean, or percent per county. HISA user sample characteristics, including sex, race, rurality (urban, rural), marital status, and Class 1 vs Class 2 disability-related eligibility groups, were aggregated to the county level by calculating percentages of HISA users of the given characteristics out of total HISA users in the county. Disability-related eligibility groups (Class 1 vs Class 2 HISA users) determines the maximum lifetime award dollar amount. Specifically, those with service-connected disabilities or those with a ≥ 50% disability rating (regardless of whether or not their disability is service connected) are classified as Class 1 HISA users and are eligible to receive a maximum lifetime award of $6800. Those with a recorded disability that is not connected to their military service, and who have a disability rating of < 50% are classified as Class 2 HISA users and are eligible to receive a lifetime maximum award of $2000.
The county-level number of HISA users was used as the numerator for calculation of county-level HISA utilization rate. Counties with zero HISA users were excluded. The number of EOY VHA patients per county in FY 2018 was divided by 1000 and used as the denominator in the calculation of county-level HISA utilization rate. Thus, the outcome variable is HISA utilization rate per 1000 VHA patients in FY 2018 (HISA utilization rate).
County-Level Variables
County-level variables were downloaded from the 2020 CHRD.5,6 An explanation of the CHRD model and the factors used in this study are shown in the eAppendix (available at doi: 10.12788/fp.0279).6 County-level aggregated HISA user data and the CHRD data were matched using county Federal Information Processing Standards codes. Access to care measures collected from CHRD included percentages uninsured and ratios of population to primary care physicians, dentists, mental health professionals, and other primary care professionals. Other CHRD measures included those for quality of care (rate of preventable hospital stay) and housing quality (percent of households with high housing costs, percent of households with overcrowding, percent of households with lack of kitchen or plumbing, percent of households with severe housing cost burden, percent of homeownership). Of secondary interest was county population rurality, as previous research findings showed the annual average of HISA users who are from rural areas ranged from 30 to 35%.
Analysis Methods
SAS (v9.4), R (v4.0.2), and RStudio (v1.3.1093) were used for data preparation and analysis.18 Multiple regression analysis was used to predict county-level utilization rate from county-level variables. Sociodemographic characteristics from CHRD and HISA data were included as important control predictors in the regression model, though our focus for this paper are the access to care and housing quality predictors.
Model diagnostics (examination of model residuals, Breusch-Godfrey test, Breusch-Pagan test) revealed significant heteroskedasticity of the model; thus, robust standard errors and associated P values were computed using the R estimatr package (v0.30.2).19 Some predictor variables of interest (eg, ratio of mental health professionals) were removed during the model building process either due to problems of multicollinearity or excessive missingness that would have resulted in listwise deletion.
Results
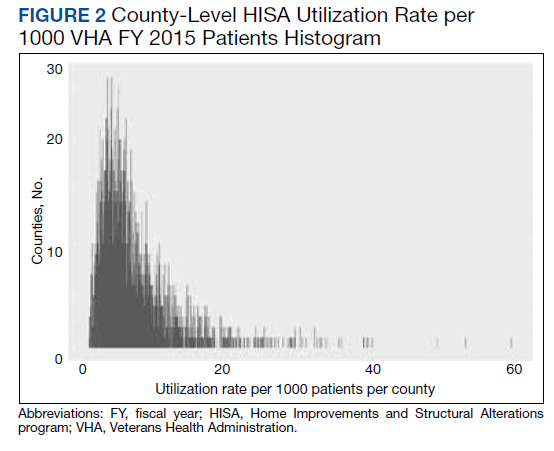
County-level HISA utilization rate per 1000 EOY VHA patients ranged from 0.09 to 59.7%, with a 6.6% mean and 5% median (Figure 2). The data were highly positively skewed. The final model included 33 total predictor variables (Table 1). The final regression model was a significantly better predictor of county-level HISA utilization rate than a null model (F[33-2184], 10.18; P < .001). The adjusted model R2 showed that the overall model accounted for approximately 23% of variance in county-level HISA utilization rate (Table 2).
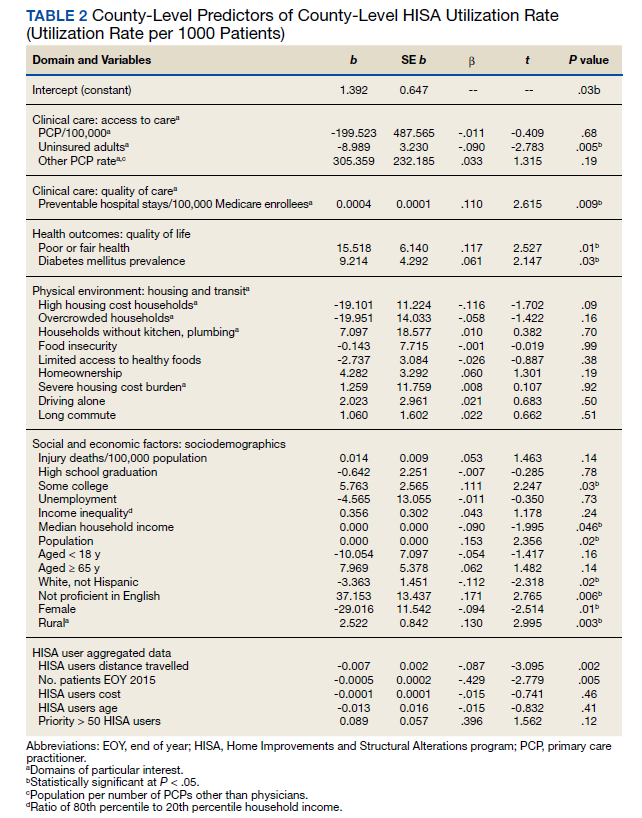
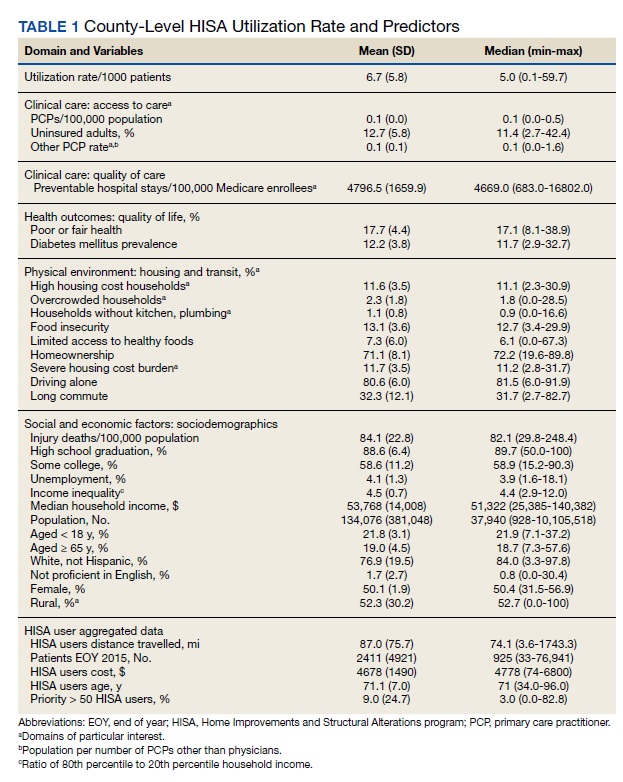
Among the primary variables of interest, percent uninsured adults and rate of preventable hospital stays emerged as significant predictors of county-level HISA utilization rate. Specifically, county percentage of uninsured adults was negatively related to county-level HISA utilization rate (b = -8.99, P = .005), indicating that the higher the proportion of uninsured adults—with all other predictors held constant—the lower the HISA utilization rate. Percent uninsured adults ranged from 2.7 to 42.4% across counties, with a mean (SD) of 12.7% (5.8%) and 11.4% median.
County rate of preventable hospital stays, however, was significantly and positively related to county-level HISA utilization rate (b = .0004, P = .009), indicating that the higher the rate of preventable hospital stays—with all other predictors held constant—the higher the HISA utilization rate. The direction of this effect is the opposite of the direction of the effect of percent uninsured adults (positive rather than negative), even though both could be considered measures of access to care. The standardized β for these 2 predictors indicate that county rate of preventable hospital stays is a somewhat stronger predictor of county-level HISA utilization rate than is county percent of uninsured adults (β = .11 and β = -.09, respectively). Rate of preventable hospital stays ranged from 683 to 16,802 across counties included in this analysis, with a mean (SD) of 4,796.5 (1659.9) and a 4669 median.
Of secondary interest was county rurality. The county-level percentage of rural residents was significantly and positively related to county-level HISA utilization rate, indicating that the higher the proportion of individuals within county considered rural—all other predictors held constant—the higher the HISA utilization rate. The mean (SD) percentage of rural residents per county was 52.3% (30.2) and 52.7 % median.
Discussion
This study examined whether county-level characteristics, specifically variables for access to care, quality of care, and housing quality, were predictive of a county’s HISA utilization rate. Given that this series of work on the HISA program is (to our knowledge) the first of its kind, and given the exploratory nature of this analysis, we did not have specific predictions for the effects of any one given variable. Nevertheless, some of the results were surprising, and we believe they warrant additional study. In particular, the opposing direction of effects for access to care and quality of care variables were hard to reconcile.
The county percent of uninsured adults (an access to care variable, specifically, a proxy for poor access to care) was negatively associated with county-level HISA utilization rate, whereas the county rate of preventable hospital stays (a quality of care variable, but also potentially an access to care variable, and specifically, proxies for poor quality of care or poor access to care) was positively associated with county-level HISA utilization rate. To describe the relationships more generally, one coefficient in the regression model indicated that the poorer the access to care, the lower the HISA utilization rate (higher percent of uninsured adults predicts lower HISA utilization rate), while another coefficient in the regression model indicated the poorer the quality of and access to care, the higher the HISA utilization rate (higher rate of preventable hospital stays predicts higher HISA utilization rate). Future study is warranted to disentangle and reconcile the various community-level predictors of this service.
Housing quality measures (eg, percent of households with high housing costs, percent of households with overcrowding, percent of households with lack of kitchen or plumbing, percent of households with severe housing cost burden, and percent of homeownership) are important in the consideration of whether a HM will be performed or should be performed. For example, if a person is cost burdened by the amount of expenditure spent in housing there will be little discretionary funds to perform a HM. Individuals who do not own their home may experience complications in obtaining permission from landlords to perform a HM. County-level predictors of housing quality (percent of households with high housing costs, overcrowding, and lack of kitchen or plumbing) were not significantly associated with county-level HISA utilization rate but are also nevertheless relevant to the discussion of home modifications. Of particular interest is the percent of households with lack of kitchen or plumbing variable, which was positively related to county-level HISA utilization rate although not statistically significant. HM elements related to the kitchen (eg, heighten countertop) add to the accessibility of the home allowing for the performing of activities of daily living such as cooking. Between FY 2015 and FY 2018, we discovered 131 prescriptions for kitchen (n = 90) and plumbing (n = 41) HMs, which is a very small proportion of the 30,780 total HMs (there were 24,397 bathroom HMs). The nonsignificant coefficient for this variable may reflect the small number of veterans that obtained these HM.
Limitations
The potentially conflicting direction of effects for a significant access to care variable (percent uninsured adults) and a significant access to care and quality of care variable (preventable hospital stays) are interesting and warrant additional study, but the inability to interpret or explain this apparent inconsistency constitutes a limitation of the current data and analyses presented here. Another limitation is that this analysis uses county-level predictors for what is ultimately an individual-level outcome. It would have been ideal to have both individual- and county-level data to conduct a multilevel analysis; in particular, individual-level data within counties of individuals (both veterans and nonveterans) who did not receive a HISA award (including both those who applied and were denied, and who did not apply) would be highly valuable.
Conclusions
Our continuing research into veterans’ use of HM fills a gap in the literature about the characteristics of HISA users, the impact of county-level variables on the use of HISA, and the geographic distribution and use of HISA within the VHA. While it is important to examine the influence of broader systems on individual outcomes, there could be myriad other factors that are more proximal and more closely related to whether any one individual applies for, let alone receives, a HISA award. Indeed, a low overall adjusted model R2 indicates that there is considerable variability in county-level HISA utilization rate that was not accounted for by the current model; this further speaks to warranted additional study.
More research is needed to understand and account for geographical variation in HISA utilization rate across the US. However, this work serves as an exploratory first step at quantifying and predicting HISA utilization rate at a broad level, with the ultimate goal of increasing access to HMs for veterans with disabilities.
Acknowledgments
This research was supported by grant 15521 from the US Department of Veterans Affairs, Office of Rural Health. Furthermore, the research was supported in part by grant K12 HD055929 from the National Institutes of Health. We want to acknowledge Cheri E. Knecht, Project Coordinator, for her assistance throughout all aspects of our research study and for her thoughtful contributions during the writing of this manuscript.
1. Semeah LM, Ahrentzen S, Jia H, Cowper-Ripley DC, Levy CE, Mann WC. The home improvements and structural alterations benefits program: veterans with disabilities and home accessibility. J Disability Policy Studies. 2017;28(1):43-51. doi:10.1177/1044207317696275
2. Semeah LM, Wang X, Cowper Ripley DC, Lee MJ, Ahonle ZJ, Ganesh SP, et al. Improving health through a home modification service for veterans. In: Fiedler BA, ed. Three Facets of Public Health and Paths to Improvements. Academic Press; 2020:381-416.
3. Semeah LM, Ahrentzen S, Cowper-Ripley DC, Santos-Roman LM, Beamish JO, Farley K. Rental housing needs and barriers from the perspective of veterans with disabilities. Housing Policy Debate. 2019;29(4):542-558. doi:10.1080/10511482.2018.1543203
4. Semeah LM, Ganesh SP, Wang X, et al. Home modification and health services utilization by rural and urban veterans with disabilities. Housing Policy Debate. 2021;31(6):862-874.doi:10.1080/10511482.2020.1858923
5. University of Wisconsin Population Health Institute. County health rankings model. Accessed May 13, 2022. https://www.countyhealthrankings.org/about-us
6. Remington PL, Catlin BB, Gennuso KP. The County Health Rankings: rationale and methods. Popul Health Metr. 2015;13(11). doi:10.1186/s12963-015-0044-2
7. National Academies of Sciences, Engineering, and Medicine. Health-Care Utilization as a Proxy in Disability Determination. Washington, DC: The National Academies Press; 2018.
8. Douthit N, Kiv S, Dwolatzky T, Biswas S. Exposing some important barriers to health care access in the rural USA. Public Health. 2015;129(6):611-20. doi:10.1016/j.puhe.2015.04.001
9. Medicaid and Chip Payment and Access Commission (MACPAC). Medicaid access in brief: adults’ experiences in obtaining medical care. November 2016. Accessed May 13, 2022. https://www.macpac.gov/publication/access-in-brief-adults-experiences-in-obtaining-medical-care
10. Tolbert J, Orgera, K, Damico A. Key facts about the uninsured population. November 6, 2020. Accessed May 13, 2022. https://www.kff.org/uninsured/issue-brief/key-facts-about-the-uninsured-population
11. Meit M, Knudson A, Gilbert T, et al. The 2014 update of the rural-urban chartbook, 2014. October 2014. Accessed May 13, 2022. http://www.ruralhealthresearch.org
12. National Center for Health Statistics (US). Report No.: 2016-1232. Health, United States, 2015: with special feature on racial and ethnic health disparities. Hyattsville, MD: National Center for Health Statistics.
13. Broussard DL, Mason KE, Carruth AR, Carton TW. Assessing potentially preventable hospitalizations at the county level: a comparison of measures using Medicare data and state hospital discharge data. Popul Health Manag. 2018;21(6):438-445. doi:10.1089/pop.2017.0141
14. Pezzin LE, Bogner HR, Kurichi JE, et al. Preventable hospitalizations, barriers to care, and disability. Medicine (Baltimore). 2018;97:e0691 doi:10.1097/MD.0000000000010691
15. Davis K, Ballreich J. Equitable access to care: how the United States ranks internationally. N Engl J Med. 2014;371(17):1567-70. doi:10.1056/NEJMp1406707
16. Squires D, Anderson C. U.S. health care from a global perspective: spending, use of services, prices, and health in 13 countries. Issue Brief (Commonw Fund). 2015;15:1-15.
17. VHA Service Support Center. Current enrollment cube (vssc.med.va.gov). Retrieved August 06, 2019. [Data not verified.]
18. Bunn A, Korpela M. R: A language and environment for statistical computing: an introduction to dplR. January 29, 2021. Accessed May 13, 2022. http://r.meteo.uni.wroc.pl/web/packages/dplR/vignettes/intro-dplR.pdf
19. Sheppard BH, Hartwick J, Warshaw PR. The theory of reasoned action: a meta-analysis of past research with recommendations for modifications and future research. J Consumer Research. 1988;15(3):325-343. doi:10.1086/209170
This article is part of a series of articles on the Home Improvements and Structural Alterations program (HISA), a home modification (HM) program within the Veterans Health Administration (VHA). HISA is a benefit awarded to veterans with disabilities (VWDs) and is instrumental in affording physical accessibility and structural alterations to veterans’ homes.1 The overarching goals of this project are to describe and understand HISA use by VWDs. Previous work has shown geographical variation in the number of HISA prescriptions across counties in the US (Figure 1).1 The current work seeks to describe and predict the county-level rates of HISA use. Information about what predicts HISA utilization at the county level is important because it enhances understanding of program utilization at a national level. The long-term goal of the series is to provide knowledge about HM services within VHA to improve community-based independent living of VWDs by increasing awareness and utilization of HM services.
Background
A health care professional (HCP) approves a HM support award by evaluating the practicality of the support to improve the built environment of a given veteran’s disability.1,2 Previously we detailed some of the preliminary research into the HISA program, including HISA user demographic and clinical characteristics, types of HMs received, user suggestions for improvement, and geospatial analysis of HISA prescriptions concentration.1-4
The geospatial analyses of HISA prescriptions revealed clusters of high numbers of HISA users (hot spots) and low numbers of HISA users (cold spots), indicating that HISA is either not prescribed or uniformly used across the US. The previous research prompted investigation into county-level variables that may impact HISA utilization rates. This inquiry focuses on county characteristics associated with HISA use rates, such as measures of clinical care and quality of care (eg, access to health services variables, lack of insurance, preventable hospital stays), physical environment, and sociodemographic characteristics. Clinical care and quality of care measures promote the interaction with HCPs. Moreover, access to health care is an important indicator of health outcomes.5,6 An individual’s capacity to access health services, such as a HM program, greatly impacts well-being, safety, independence, and health.2,4 Well-being, safety, independence, and health become compromised if individuals cannot access care, if needed care is lacking in their area, if HCPs are not available, or are unwilling to provide care due to lack of insurance coverage.7-12 In locations where health care services are minimal due to lack of specialists or health care facilities, the quality of (or access to) care may be compromised, resulting in preventable conditions becoming problematic.13,14 These conditions may result in unnecessary hospitalizations for conditions that could have been treated during routine care. Financial barriers to care particularly among low-income people and the uninsured have proven detrimental to health.15,16 On the other hand, preventable hospital stays are a quality of care measure (ie, a proxy for poor quality of care). HISA operates within a health care system; thus, it is imperative to include these measures impacting health.
In this study, we sought to identify county-level predictors—in particular, county-level proxies for access to care—that may be associated with county-level HISA use. We define HISA utilization rate as the percentage of a county’s VHA patients who have received a HISA award.
Methods
This study used data from the National Prosthetics Patient Database (NPPD), US Department of Veterans Affairs (VA) medical database inpatient and outpatient datasets, VHA Support Service Center (VSSC) data cubes, and the County Health Rankings database (CHRD). First, the study cohort was identified from NPPD users who have obtained a HISA award from fiscal years (FY) 2015 to 2018. Analysis started with FY 2015 following new regulations (38 CFR § 17) governing the operations of the HISA program.2 The study cohort was matched with records from NPPD and VA inpatient and outpatient datasets to obtain information about the veterans’ demographic characteristics and their HM characteristics and costs. The number of VHA end-of-year (EOY) patients per county was extracted from the VSSC Current Enrollment Cube, which was used in calculation of the county-level HISA utilization rate.17 Finally, zip code–based locational data were used to calculate approximate drive time and distance from the HISA user’s approximate location to the facility where they received their HM prescription. Drive times and drive distances were calculated with Esri ArcGIS Pro (v2.6.3) by placing zip code centroid and VHA facilities on a nationwide road network that contains both road speeds and distances.
Calculations
Patient-level data were aggregated up to county-level variables by calculating the sum, mean, or percent per county. HISA user sample characteristics, including sex, race, rurality (urban, rural), marital status, and Class 1 vs Class 2 disability-related eligibility groups, were aggregated to the county level by calculating percentages of HISA users of the given characteristics out of total HISA users in the county. Disability-related eligibility groups (Class 1 vs Class 2 HISA users) determines the maximum lifetime award dollar amount. Specifically, those with service-connected disabilities or those with a ≥ 50% disability rating (regardless of whether or not their disability is service connected) are classified as Class 1 HISA users and are eligible to receive a maximum lifetime award of $6800. Those with a recorded disability that is not connected to their military service, and who have a disability rating of < 50% are classified as Class 2 HISA users and are eligible to receive a lifetime maximum award of $2000.
The county-level number of HISA users was used as the numerator for calculation of county-level HISA utilization rate. Counties with zero HISA users were excluded. The number of EOY VHA patients per county in FY 2018 was divided by 1000 and used as the denominator in the calculation of county-level HISA utilization rate. Thus, the outcome variable is HISA utilization rate per 1000 VHA patients in FY 2018 (HISA utilization rate).
County-Level Variables
County-level variables were downloaded from the 2020 CHRD.5,6 An explanation of the CHRD model and the factors used in this study are shown in the eAppendix (available at doi: 10.12788/fp.0279).6 County-level aggregated HISA user data and the CHRD data were matched using county Federal Information Processing Standards codes. Access to care measures collected from CHRD included percentages uninsured and ratios of population to primary care physicians, dentists, mental health professionals, and other primary care professionals. Other CHRD measures included those for quality of care (rate of preventable hospital stay) and housing quality (percent of households with high housing costs, percent of households with overcrowding, percent of households with lack of kitchen or plumbing, percent of households with severe housing cost burden, percent of homeownership). Of secondary interest was county population rurality, as previous research findings showed the annual average of HISA users who are from rural areas ranged from 30 to 35%.
Analysis Methods
SAS (v9.4), R (v4.0.2), and RStudio (v1.3.1093) were used for data preparation and analysis.18 Multiple regression analysis was used to predict county-level utilization rate from county-level variables. Sociodemographic characteristics from CHRD and HISA data were included as important control predictors in the regression model, though our focus for this paper are the access to care and housing quality predictors.
Model diagnostics (examination of model residuals, Breusch-Godfrey test, Breusch-Pagan test) revealed significant heteroskedasticity of the model; thus, robust standard errors and associated P values were computed using the R estimatr package (v0.30.2).19 Some predictor variables of interest (eg, ratio of mental health professionals) were removed during the model building process either due to problems of multicollinearity or excessive missingness that would have resulted in listwise deletion.
Results
County-level HISA utilization rate per 1000 EOY VHA patients ranged from 0.09 to 59.7%, with a 6.6% mean and 5% median (Figure 2). The data were highly positively skewed. The final model included 33 total predictor variables (Table 1). The final regression model was a significantly better predictor of county-level HISA utilization rate than a null model (F[33-2184], 10.18; P < .001). The adjusted model R2 showed that the overall model accounted for approximately 23% of variance in county-level HISA utilization rate (Table 2).
Among the primary variables of interest, percent uninsured adults and rate of preventable hospital stays emerged as significant predictors of county-level HISA utilization rate. Specifically, county percentage of uninsured adults was negatively related to county-level HISA utilization rate (b = -8.99, P = .005), indicating that the higher the proportion of uninsured adults—with all other predictors held constant—the lower the HISA utilization rate. Percent uninsured adults ranged from 2.7 to 42.4% across counties, with a mean (SD) of 12.7% (5.8%) and 11.4% median.
County rate of preventable hospital stays, however, was significantly and positively related to county-level HISA utilization rate (b = .0004, P = .009), indicating that the higher the rate of preventable hospital stays—with all other predictors held constant—the higher the HISA utilization rate. The direction of this effect is the opposite of the direction of the effect of percent uninsured adults (positive rather than negative), even though both could be considered measures of access to care. The standardized β for these 2 predictors indicate that county rate of preventable hospital stays is a somewhat stronger predictor of county-level HISA utilization rate than is county percent of uninsured adults (β = .11 and β = -.09, respectively). Rate of preventable hospital stays ranged from 683 to 16,802 across counties included in this analysis, with a mean (SD) of 4,796.5 (1659.9) and a 4669 median.
Of secondary interest was county rurality. The county-level percentage of rural residents was significantly and positively related to county-level HISA utilization rate, indicating that the higher the proportion of individuals within county considered rural—all other predictors held constant—the higher the HISA utilization rate. The mean (SD) percentage of rural residents per county was 52.3% (30.2) and 52.7 % median.
Discussion
This study examined whether county-level characteristics, specifically variables for access to care, quality of care, and housing quality, were predictive of a county’s HISA utilization rate. Given that this series of work on the HISA program is (to our knowledge) the first of its kind, and given the exploratory nature of this analysis, we did not have specific predictions for the effects of any one given variable. Nevertheless, some of the results were surprising, and we believe they warrant additional study. In particular, the opposing direction of effects for access to care and quality of care variables were hard to reconcile.
The county percent of uninsured adults (an access to care variable, specifically, a proxy for poor access to care) was negatively associated with county-level HISA utilization rate, whereas the county rate of preventable hospital stays (a quality of care variable, but also potentially an access to care variable, and specifically, proxies for poor quality of care or poor access to care) was positively associated with county-level HISA utilization rate. To describe the relationships more generally, one coefficient in the regression model indicated that the poorer the access to care, the lower the HISA utilization rate (higher percent of uninsured adults predicts lower HISA utilization rate), while another coefficient in the regression model indicated the poorer the quality of and access to care, the higher the HISA utilization rate (higher rate of preventable hospital stays predicts higher HISA utilization rate). Future study is warranted to disentangle and reconcile the various community-level predictors of this service.
Housing quality measures (eg, percent of households with high housing costs, percent of households with overcrowding, percent of households with lack of kitchen or plumbing, percent of households with severe housing cost burden, and percent of homeownership) are important in the consideration of whether a HM will be performed or should be performed. For example, if a person is cost burdened by the amount of expenditure spent in housing there will be little discretionary funds to perform a HM. Individuals who do not own their home may experience complications in obtaining permission from landlords to perform a HM. County-level predictors of housing quality (percent of households with high housing costs, overcrowding, and lack of kitchen or plumbing) were not significantly associated with county-level HISA utilization rate but are also nevertheless relevant to the discussion of home modifications. Of particular interest is the percent of households with lack of kitchen or plumbing variable, which was positively related to county-level HISA utilization rate although not statistically significant. HM elements related to the kitchen (eg, heighten countertop) add to the accessibility of the home allowing for the performing of activities of daily living such as cooking. Between FY 2015 and FY 2018, we discovered 131 prescriptions for kitchen (n = 90) and plumbing (n = 41) HMs, which is a very small proportion of the 30,780 total HMs (there were 24,397 bathroom HMs). The nonsignificant coefficient for this variable may reflect the small number of veterans that obtained these HM.
Limitations
The potentially conflicting direction of effects for a significant access to care variable (percent uninsured adults) and a significant access to care and quality of care variable (preventable hospital stays) are interesting and warrant additional study, but the inability to interpret or explain this apparent inconsistency constitutes a limitation of the current data and analyses presented here. Another limitation is that this analysis uses county-level predictors for what is ultimately an individual-level outcome. It would have been ideal to have both individual- and county-level data to conduct a multilevel analysis; in particular, individual-level data within counties of individuals (both veterans and nonveterans) who did not receive a HISA award (including both those who applied and were denied, and who did not apply) would be highly valuable.
Conclusions
Our continuing research into veterans’ use of HM fills a gap in the literature about the characteristics of HISA users, the impact of county-level variables on the use of HISA, and the geographic distribution and use of HISA within the VHA. While it is important to examine the influence of broader systems on individual outcomes, there could be myriad other factors that are more proximal and more closely related to whether any one individual applies for, let alone receives, a HISA award. Indeed, a low overall adjusted model R2 indicates that there is considerable variability in county-level HISA utilization rate that was not accounted for by the current model; this further speaks to warranted additional study.
More research is needed to understand and account for geographical variation in HISA utilization rate across the US. However, this work serves as an exploratory first step at quantifying and predicting HISA utilization rate at a broad level, with the ultimate goal of increasing access to HMs for veterans with disabilities.
Acknowledgments
This research was supported by grant 15521 from the US Department of Veterans Affairs, Office of Rural Health. Furthermore, the research was supported in part by grant K12 HD055929 from the National Institutes of Health. We want to acknowledge Cheri E. Knecht, Project Coordinator, for her assistance throughout all aspects of our research study and for her thoughtful contributions during the writing of this manuscript.
1. Semeah LM, Ahrentzen S, Jia H, Cowper-Ripley DC, Levy CE, Mann WC. The home improvements and structural alterations benefits program: veterans with disabilities and home accessibility. J Disability Policy Studies. 2017;28(1):43-51. doi:10.1177/1044207317696275
2. Semeah LM, Wang X, Cowper Ripley DC, Lee MJ, Ahonle ZJ, Ganesh SP, et al. Improving health through a home modification service for veterans. In: Fiedler BA, ed. Three Facets of Public Health and Paths to Improvements. Academic Press; 2020:381-416.
3. Semeah LM, Ahrentzen S, Cowper-Ripley DC, Santos-Roman LM, Beamish JO, Farley K. Rental housing needs and barriers from the perspective of veterans with disabilities. Housing Policy Debate. 2019;29(4):542-558. doi:10.1080/10511482.2018.1543203
4. Semeah LM, Ganesh SP, Wang X, et al. Home modification and health services utilization by rural and urban veterans with disabilities. Housing Policy Debate. 2021;31(6):862-874.doi:10.1080/10511482.2020.1858923
5. University of Wisconsin Population Health Institute. County health rankings model. Accessed May 13, 2022. https://www.countyhealthrankings.org/about-us
6. Remington PL, Catlin BB, Gennuso KP. The County Health Rankings: rationale and methods. Popul Health Metr. 2015;13(11). doi:10.1186/s12963-015-0044-2
7. National Academies of Sciences, Engineering, and Medicine. Health-Care Utilization as a Proxy in Disability Determination. Washington, DC: The National Academies Press; 2018.
8. Douthit N, Kiv S, Dwolatzky T, Biswas S. Exposing some important barriers to health care access in the rural USA. Public Health. 2015;129(6):611-20. doi:10.1016/j.puhe.2015.04.001
9. Medicaid and Chip Payment and Access Commission (MACPAC). Medicaid access in brief: adults’ experiences in obtaining medical care. November 2016. Accessed May 13, 2022. https://www.macpac.gov/publication/access-in-brief-adults-experiences-in-obtaining-medical-care
10. Tolbert J, Orgera, K, Damico A. Key facts about the uninsured population. November 6, 2020. Accessed May 13, 2022. https://www.kff.org/uninsured/issue-brief/key-facts-about-the-uninsured-population
11. Meit M, Knudson A, Gilbert T, et al. The 2014 update of the rural-urban chartbook, 2014. October 2014. Accessed May 13, 2022. http://www.ruralhealthresearch.org
12. National Center for Health Statistics (US). Report No.: 2016-1232. Health, United States, 2015: with special feature on racial and ethnic health disparities. Hyattsville, MD: National Center for Health Statistics.
13. Broussard DL, Mason KE, Carruth AR, Carton TW. Assessing potentially preventable hospitalizations at the county level: a comparison of measures using Medicare data and state hospital discharge data. Popul Health Manag. 2018;21(6):438-445. doi:10.1089/pop.2017.0141
14. Pezzin LE, Bogner HR, Kurichi JE, et al. Preventable hospitalizations, barriers to care, and disability. Medicine (Baltimore). 2018;97:e0691 doi:10.1097/MD.0000000000010691
15. Davis K, Ballreich J. Equitable access to care: how the United States ranks internationally. N Engl J Med. 2014;371(17):1567-70. doi:10.1056/NEJMp1406707
16. Squires D, Anderson C. U.S. health care from a global perspective: spending, use of services, prices, and health in 13 countries. Issue Brief (Commonw Fund). 2015;15:1-15.
17. VHA Service Support Center. Current enrollment cube (vssc.med.va.gov). Retrieved August 06, 2019. [Data not verified.]
18. Bunn A, Korpela M. R: A language and environment for statistical computing: an introduction to dplR. January 29, 2021. Accessed May 13, 2022. http://r.meteo.uni.wroc.pl/web/packages/dplR/vignettes/intro-dplR.pdf
19. Sheppard BH, Hartwick J, Warshaw PR. The theory of reasoned action: a meta-analysis of past research with recommendations for modifications and future research. J Consumer Research. 1988;15(3):325-343. doi:10.1086/209170
Drug Overdose and Suicide Among Veteran Enrollees in the VHA: Comparison Among Local, Regional, and National Data
Suicide is the 10th leading cause of death in the US. In 2017, there were 47,173 deaths by suicide (14 deaths per 100,000 people), representing a 33% increase from 1999.1 In 2017 veterans accounted for 13.5% of all suicide deaths among US adults, although veterans comprised only 7.9% of the adult population; the age- and sex-adjusted suicide rate was 1.5 times higher for veterans than that of nonveteran adults.2,3
Among veteran users of Veterans Health Administration (VHA) services, mental health and substance use disorders, chronic medical conditions, and chronic pain are associated with an increased risk for suicide.3 About one-half of VHA veterans have been diagnosed with chronic pain.4 A chronic pain diagnosis (eg, back pain, migraine, and psychogenic pain) increased the risk of death by suicide even after adjusting for comorbid psychiatric diagnoses, according to a study on pain and suicide among US veterans.5
One-quarter of veterans received an opioid prescription during VHA outpatient care in 2012.4 Increased prescribing of opioid medications has been associated with opioid overdose and suicides.6-10 Opioids are the most common drugs found in suicide by overdose.11 The rate of opioid-related suicide deaths is 13 times higher among individuals with opioid use disorder (OUD) than it is for those without OUD.12 The rate of OUD diagnosis among VHA users was 7 times higher than that for non-VHA users.13
In the US the age-adjusted rate of drug overdose deaths increased from 6 per 100,000 persons in 1999 to 22 per 100,000 in 2017.14 Drug overdoses accounted for 52,404 US deaths in 2015; 33,091 (63.1%) were from opioids.15 In 2017, there were 70,237 drug overdose deaths; 67.8% involved opioids (ie, 5 per 100,000 population represent prescription opioids).16
The VHA is committed to reducing opioid use and veteran suicide prevention. In 2013 the VHA launched the Opioid Safety Initiative employing 4 strategies: education, pain management, risk management, and addiction treatment.17 To address the opioid epidemic, the North Florida/South Georgia Veteran Health System (NF/SGVHS) developed and implemented a multispecialty Opioid Risk Reduction Program that is fully integrated with mental health and addiction services. The purpose of the NF/SGVHS one-stop pain addiction clinic is to provide a treatment program for chronic pain and addiction. The program includes elements of a whole health approach to pain care, including battlefield and traditional acupuncture. The focus went beyond replacing pharmacologic treatments with a complementary integrative health approach to helping veterans regain control of their lives through empowerment, skill building, shared goal setting, and reinforcing self-management.
The self-management programs include a pain school for patient education, a pain psychology program, and a yoga program, all stressing self-management offered onsite and via telehealth. Special effort was directed to identify patients with OUD and opioid dependence. Many of these patients were transitioned to buprenorphine, a potent analgesic that suppresses opioid cravings and withdrawal symptoms associated with stopping opioids. The clinic was structured so that patients could be seen often for follow-up and support. In addition, open lines of communication and referral were set up between this clinic, the interventional pain clinic, and the physical medicine and rehabilitation service. A detailed description of this program has been published elsewhere.18
The number of veterans receiving opioid prescription across the VHA system decreased by 172,000 prescriptions quarterly between 2012 and 2016.19 Fewer veterans were prescribed high doses of opioids or concomitant interacting medicines and more veterans were receiving nonopioid therapies.19 The prescription reduction across the VHA has varied. For example, from 2012 to 2017 the NF/SGVHS reported an 87% reduction of opioid prescriptions (≥ 100 mg morphine equivalents/d), compared with the VHA national average reduction of 49%.18
Vigorous opioid reduction is controversial. In a systematic review on opioid reduction, Frank and colleagues reported some beneficial effects of opioid reduction, such as increased health-related quality of life.20 However, another study suggested a risk of increased pain with opioid tapering.21 The literature findings on the association between prescription opioid use and suicide are mixed. The VHA Office of Mental Health and Suicide Prevention literature review reported that veterans were at increased risk of committing suicide within the first 6 months of discontinuing opioid therapy.22 Another study reported that veterans who discontinued long-term opioid treatment had an increased risk for suicidal ideation.23 However, higher doses of opioids were associated with an increased risk for suicide among individuals with chronic pain.10 The link between opioid tapering and the risk of suicide or overdose is uncertain.
Bohnert and Ilgen suggested that discontinuing prescription opioids leads to suicide without examining the risk factors that influenced discontinuation is ill-informed.7 Strong evidence about the association or relationship among opioid use, overdose, and suicide is needed. To increase our understanding of that association, Bohnert and Ilgen argued for multifaceted interventions that simultaneously address the shared causes and risk factors for OUD,7 such as the multispecialty Opioid Risk Reduction Program at NF/SGVHS.
Because of the reported association between robust integrated mental health and addiction, primary care pain clinic intervention, and the higher rate of opioid tapering in NF/SGVHS,18 this study aims to describe the pattern of overdose diagnosis (opioid overdose and nonopioid overdose) and pattern of suicide rates among veterans enrolled in NF/SGVHS, Veterans Integrated Service Network (VISN) 8, and the entire VA health care system during 2012 to 2016.The study reviewed and compared overdose diagnosis and suicide rates among veterans across NF/SGVHS and 2 other levels of the VA health care system to determine whether there were variances in the pattern of overdose/suicide rates and to explore these differences.
Methods
In this retrospective study, aggregate data were obtained from several sources. First, the drug overdose data were extracted from the VA Support Service Center (VSSC) medical diagnosis cube. We reviewed the literature for opioid codes reported in the literature and compared these reported opioid International Classification of Diseases, Ninth Revision (ICD-9) and International Classification of Diseases, 10th Revision (ICD-10) codes with the local facility patient-level comprehensive overdose diagnosis codes. Based on the comparison, we found 98 ICD-9 and ICD-10 overdose diagnosis codes and ran the modified codes against the VSSC national database. Overdose data were aggregated by facility and fiscal year, and the overdose rates (per 1,000) were calculated for unique veteran users at the 3 levels (NF/SGVHS, VISN 8, and VA national) as the denominator.
Each of the 18 VISNs comprise multiple VAMCs and clinics within a geographic region. VISN 8 encompasses most of Florida and portions of southern Georgia and the Caribbean (Puerto Rico, US Virgin Islands), including NF/SGVHS.
In this study, drug overdose refers to the overdose or poisoning from all drugs (ie, opioids, cocaine, amphetamines, sedatives, etc) and defined as any unintentional (accidental), deliberate, or intent undetermined drug poisoning.24 The suicide data for this study were drawn from the VA Suicide Prevention Program at 3 different levels: NF/SGVHS, VISN 8, and VHA national. Suicide is death caused by an intentional act of injuring oneself with the intent to die.25
This descriptive study compared the rate of annual drug overdoses (per 1,000 enrollees) between NF/SGVHS, VISN 8, and VHA national from 2012 to 2016. It also compared the annual rate of suicide per 100,000 enrollees across these 3 levels of the VHA. The overdose and suicide rates and numbers are mutually exclusive, meaning the VISN 8 data do not include the NF/SGVHS information, and the national data excluded data from VISN 8 and NF/SGVHS. This approach helped improve the quality of multiple level comparisons for different levels of the VHA system.
Results
Figure 1 shows the pattern of overdose diagnosis by rates (per 1,000) across the study period (2012 to 2016) and compares patterns at 3 levels of VHA (NF/SGVHS, VISN 8, and VHA national). The average annual rate of overdose diagnoses for NF/SGVHS during the study was slightly higher (16.8 per 1,000) than that of VISN 8 (16 per 1,000) and VHA national (15.3 per 1,000), but by the end of the study period the NF/SGVHS rate (18.6 per 1,000) nearly matched the national rate (18.2 per 1,000) and was lower than the VISN 8 rate (20.4 per 1,000). Additionally, NF/SGVHS had less variability (SD, 1.34) in yearly average overdose rates compared with VISN 8 (SD, 2.96), and VHA national (SD, 1.69).
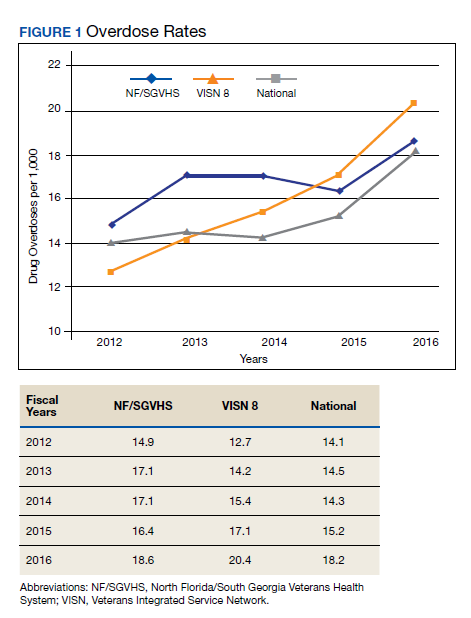
From 2013 to 2014 the overdose diagnosis rate for NF/SGVHS remained the same (17.1 per 1,000). A similar pattern was observed for the VHA national data, whereas the VISN 8 data showed a steady increase during the same period. In 2015, the NF/SGVHS had 0.7 per 1,000 decrease in overdose diagnosis rate, whereas VISN 8 and VHA national data showed 1.7 per 1,000 and 0.9 per 1,000 increases, respectively. During the last year of the study (2016), there was a dramatic increase in overdose diagnosis for all the health care systems, ranging from 2.2 per 1,000 for NF/SGVHS to 3.3 per 1,000 for VISN 8.
Figure 2 shows the annual rates (per 100,000 individuals) of suicide for NF/SGVHS, VISN 8, and VHA national. The suicide pattern for VISN 8 shows a cyclical acceleration and deceleration trend across the study period. From 2012 to 2014, the VHA national data show a steady increase of about 1 per 100,000 from year to year. On the contrary, NF/SGVHS shows a low suicide rate from year to year within the same period with a rate of 10 per 100,000 in 2013 compared with the previous year. Although the NF/SGVHS suicide rate increased in 2016 (10.4 per 100,000), it remained lower than that of VISN 8 (10.7 per 100,00) and VHA national (38.2 per 100,000).
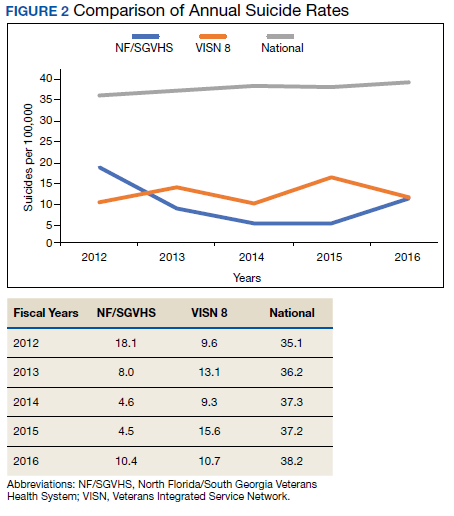
This study shows that NF/SGVHS had the lowest average annual rate of suicide (9.1 per 100,000) during the study period, which was 4 times lower than that of VHA national and 2.6 times lower than VISN 8.
Discussion
This study described and compared the distribution pattern of overdose (nonopioid and opioid) and suicide rates at different levels of the VHA system. Although VHA implemented systemwide opioid tapering in 2013, little is known about the association between opioid tapering and overdose and suicide. We believe a retrospective examination regarding overdose and suicide among VHA users at 3 different levels of the system from 2012 to 2016 could contribute to the discussion regarding the potential risks and benefits of discontinuing opioids.
First, the average annual rate of overdose diagnosis for NF/SGVHS during the study period was slightly higher (16.8 per 1,000) compared with those of VISN 8 (16.0 per 1,000) and VHA national (15.3 per 1,000) with a general pattern of increase and minimum variations in the rates observed during the study period among the 3 levels of the system. These increased overdose patterns are consistent with other reports in the literature.14 By the end of the study period, the NF/SGVHS rate (18.6 per 1,000) nearly matched the national rate (18.2 per 1,000) and was lower than VISN 8 (20.4 per 1,000). During the last year of the study period (2016), there was a dramatic increase in overdose diagnosis for all health care systems ranging from 2.2 per 1,000 for NF/SGVHS to 3.3 per 1,000 for VISN 8, which might be because of the VHA systemwide change of diagnosis code from ICD-9 to ICD-10, which includes more detailed diagnosis codes.
Second, our results showed that NF/SGVHS had the lowest average annual suicide rate (9.1 per 100,000) during the study period, which is one-fourth the VHA national rate and 2.6 per 100,000 lower than the VISN 8 rate. According to Bohnert and Ilgen,programs that improve the quality of pain care, expand access to psychotherapy, and increase access to medication-assisted treatment for OUDs could reduce suicide by drug overdose.7 We suggest that the low suicide rate at NF/SGVHS and the difference in the suicide rates between the NF/SGVHS and VISN 8 and VHA national data might be associated with the practice-based biopsychosocial interventions implemented at NF/SGVHS.
Our data showed a rise in the incidence of suicide at the NF/SGVHS in 2016. We are not aware of a local change in conditions, policy, and practice that would account for this increase. Suicide is variable, and data are likely to show spikes and valleys. Based on the available data, although the incidence of suicides at the NF/SGVHS in 2016 was higher, it remained below the VISN 8 and national VHA rate. This study seems to support the practice of tapering or stopping opioids within the context of a multidisciplinary approach that offers frequent follow-up, nonopioid options, and treatment of opioid addiction/dependence.
Limitations
The research findings of this study are limited by the retrospective and descriptive nature of its design. However, the findings might provide important information for understanding variations of overdose and suicide among VHA enrollees. Studies that use more robust methodologies are warranted to clinically investigate the impact of a multispecialty opioid risk reduction program targeting chronic pain and addiction management and identify best practices of opioid reduction and any unintended consequences that might arise from opioid tapering.26 Further, we did not have access to the VA national overdose and suicide data after 2016. Similar to most retrospective data studies, ours might be limited by availability of national overdose and suicide data after 2016. It is important for future studies to cross-validate our study findings.
Conclusions
The NF/SGVHS developed and implemented a biopsychosocial model of pain treatment that includes multicomponent primary care integrated with mental health and addiction services as well as the interventional pain and physical medicine and rehabilitation services. The presence of this program, during a period when the facility was tapering opioids is likely to account for at least part of the relative reduction in suicide.
1. American Foundation for Suicide Prevention. Suicide statistics. https://afsp.org/about-suicide/suicide-statistics. Updated 2019. Accessed September 2, 2020.
2. Shane L 3rd. New veteran suicide numbers raise concerns among experts hoping for positive news. https://www.militarytimes.com/news/pentagon-congress/2019/10/09/new-veteran-suicide-numbers-raise-concerns-among-experts-hoping-for-positive-news. Published October 9, 2019. Accessed July 23, 2020.
3. Veterans Health Administration, Office of Mental Health and Suicide Prevention. Veteran suicide data report, 2005–2017. https://www.mentalhealth.va.gov/docs/data-sheets/2019/2019_National_Veteran_Suicide_Prevention_Annual_Report_508.pdf. Published September 2019. Accessed July 20, 2020.
4. Gallagher RM. Advancing the pain agenda in the veteran population. Anesthesiol Clin. 2016;34(2):357-378. doi:10.1016/j.anclin.2016.01.003
5. Ilgen MA, Kleinberg F, Ignacio RV, et al. Noncancer pain conditions and risk of suicide. JAMA Psychiatry. 2013;70(7):692-697. doi:10.1001/jamapsychiatry.2013.908
6. Frenk SM, Porter KS, Paulozzi LJ. Prescription opioid analgesic use among adults: United States, 1999-2012. National Center for Health Statistics data brief. https://www.cdc.gov/nchs/products/databriefs/db189.htm. Published February 25, 2015. Accessed July 20, 2020.
7. Bohnert ASB, Ilgen MA. Understanding links among opioid use, overdose, and suicide. N Engl J Med. 2019;380(14):71-79. doi:10.1056/NEJMc1901540
8. Dunn KM, Saunders KW, Rutter CM, et al. Opioid prescriptions for chronic pain and overdose: a cohort study. Ann Intern Med. 2010;152(2):85-92. doi:10.7326/0003-4819-152-2-201001190-00006
9. Gomes T, Mamdani MM, Dhalla IA, Paterson JM, Juurlink DN. Opioid dose and drug-related mortality in patients with nonmalignant pain. Arch Intern Med. 2011;171(7):686-691. doi:10.1001/archinternmed.2011.117
10. Ilgen MA, Bohnert AS, Ganoczy D, Bair MJ, McCarthy JF, Blow FC. Opioid dose and risk of suicide. Pain. 2016;157(5):1079-1084. doi:10.1097/j.pain.0000000000000484
11. Sinyor M, Howlett A, Cheung AH, Schaffer A. Substances used in completed suicide by overdose in Toronto: an observational study of coroner’s data. Can J Psychiatry. 2012;57(3):184-191. doi:10.1177/070674371205700308
12. Wilcox HC, Conner KR, Caine ED. Association of alcohol and drug use disorders and completed suicide: an empirical review of cohort studies. Drug Alcohol Depend. 2004;76(suppl):S11-S19 doi:10.1016/j.drugalcdep.2004.08.003.
13. Baser OL, Mardekian XJ, Schaaf D, Wang L, Joshi AV. Prevalence of diagnosed opioid abuse and its economic burden in the Veterans Health Administration. Pain Pract. 2014;14(5):437-445. doi:10.1111/papr.12097
14. Hedegaard H, Warner M, Miniño AM. Drug overdose deaths in the united states, 1999-2015. National Center for Health Statistics data brief. https://www.cdc.gov/nchs/data/databriefs/db273.pdf. Published February 2017. Accessed July 20, 2020.
15. Rudd RA, Seth P, David F, Scholl L. Increases in drug and opioid-involved overdose deaths—United States, 2010-2015. MMWR Morb Mortal Wkly Rep. 2016;65(50-51):1445-1452. doi:10.15585/mmwr.mm655051e1
16. Scholl L, Seth P, Kariisa M, Wilson N, Baldwin G. Drug and opioid-involved overdose deaths—United States, 2013-2017. MMWR Morb Mortal Wkly Rep. 2019,67(5152):1419-1427. doi:10.15585/mmwr.mm675152e1
17. US Department of Veterans Affairs and Department of Defense. VA/DOD clinical practice guideline for opioid therapy for chronic pain version 3.0. https://www.healthquality.va.gov/guidelines/pain/cot. Updated March 1, 2018. Accessed July 20, 2020.
18. Vaughn IA, Beyth RJ, Ayers ML, et al. Multispecialty opioid risk reduction program targeting chronic pain and addiction management in veterans. Fed Pract. 2019;36(9):406-411.
19. Gellad WF, Good CB, Shulkin DJ. Addressing the opioid epidemic in the United States: lessons from the Department of Veterans Affairs. JAMA Intern Med. 2017;177(5):611-612. doi:10.1001/jamainternmed.2017.0147
20. Frank JW, Lovejoy TI, Becker WC, et al. Patient outcomes in dose reduction or discontinuation of long-term opioid therapy: a systematic review. Ann Intern Med. 2017;167(3):181-191. doi:10.7326/M17-0598
21. Berna C, Kulich RJ, Rathmell JP. Tapering long-term opioid therapy in chronic noncancer pain: evidence and recommendations for everyday practice. Mayo Clin Proc. 2015;90(6):828-842. doi:10.1016/j.mayocp.2015.04.003
22. Veterans Health Administration, Office of Mental Health and Suicide Prevention. Opioid use and suicide risk. https://www.mentalhealth.va.gov/suicide_prevention/docs/Literature_Review_Opioid_Use_and_Suicide_Risk_508_FINAL_04-26-2019.pdf. Published April 26, 2019. Accessed July 20, 2020.
23. Demidenko MI, Dobscha SK, Morasco BJ, Meath THA, Ilgen MA, Lovejoy TI. Suicidal ideation and suicidal self-directed violence following clinician-initiated prescription opioid discontinuation among long-term opioid users. Gen Hosp Psychiatry. 2017;47:29-35. doi:10.1016/j.genhosppsych.2017.04.011
24. National Institute on Drug Abuse. Intentional versus unintentional overdose deaths. https://www.drugabuse.gov/related-topics/treatment/intentional-vs-unintentional-overdose-deaths. Updated February 13, 2017. Accessed July 20, 2020.
25. Centers for Disease Control and Prevention. Preventing suicide. https://www.cdc.gov/violenceprevention/pdf/suicide-factsheet.pdf. Published 2018. Accessed July 20, 2020.
26. Webster LR. Pain and suicide: the other side of the opioid story. Pain Med. 2014;15(3):345-346. doi:10.1111/pme.12398
Suicide is the 10th leading cause of death in the US. In 2017, there were 47,173 deaths by suicide (14 deaths per 100,000 people), representing a 33% increase from 1999.1 In 2017 veterans accounted for 13.5% of all suicide deaths among US adults, although veterans comprised only 7.9% of the adult population; the age- and sex-adjusted suicide rate was 1.5 times higher for veterans than that of nonveteran adults.2,3
Among veteran users of Veterans Health Administration (VHA) services, mental health and substance use disorders, chronic medical conditions, and chronic pain are associated with an increased risk for suicide.3 About one-half of VHA veterans have been diagnosed with chronic pain.4 A chronic pain diagnosis (eg, back pain, migraine, and psychogenic pain) increased the risk of death by suicide even after adjusting for comorbid psychiatric diagnoses, according to a study on pain and suicide among US veterans.5
One-quarter of veterans received an opioid prescription during VHA outpatient care in 2012.4 Increased prescribing of opioid medications has been associated with opioid overdose and suicides.6-10 Opioids are the most common drugs found in suicide by overdose.11 The rate of opioid-related suicide deaths is 13 times higher among individuals with opioid use disorder (OUD) than it is for those without OUD.12 The rate of OUD diagnosis among VHA users was 7 times higher than that for non-VHA users.13
In the US the age-adjusted rate of drug overdose deaths increased from 6 per 100,000 persons in 1999 to 22 per 100,000 in 2017.14 Drug overdoses accounted for 52,404 US deaths in 2015; 33,091 (63.1%) were from opioids.15 In 2017, there were 70,237 drug overdose deaths; 67.8% involved opioids (ie, 5 per 100,000 population represent prescription opioids).16
The VHA is committed to reducing opioid use and veteran suicide prevention. In 2013 the VHA launched the Opioid Safety Initiative employing 4 strategies: education, pain management, risk management, and addiction treatment.17 To address the opioid epidemic, the North Florida/South Georgia Veteran Health System (NF/SGVHS) developed and implemented a multispecialty Opioid Risk Reduction Program that is fully integrated with mental health and addiction services. The purpose of the NF/SGVHS one-stop pain addiction clinic is to provide a treatment program for chronic pain and addiction. The program includes elements of a whole health approach to pain care, including battlefield and traditional acupuncture. The focus went beyond replacing pharmacologic treatments with a complementary integrative health approach to helping veterans regain control of their lives through empowerment, skill building, shared goal setting, and reinforcing self-management.
The self-management programs include a pain school for patient education, a pain psychology program, and a yoga program, all stressing self-management offered onsite and via telehealth. Special effort was directed to identify patients with OUD and opioid dependence. Many of these patients were transitioned to buprenorphine, a potent analgesic that suppresses opioid cravings and withdrawal symptoms associated with stopping opioids. The clinic was structured so that patients could be seen often for follow-up and support. In addition, open lines of communication and referral were set up between this clinic, the interventional pain clinic, and the physical medicine and rehabilitation service. A detailed description of this program has been published elsewhere.18
The number of veterans receiving opioid prescription across the VHA system decreased by 172,000 prescriptions quarterly between 2012 and 2016.19 Fewer veterans were prescribed high doses of opioids or concomitant interacting medicines and more veterans were receiving nonopioid therapies.19 The prescription reduction across the VHA has varied. For example, from 2012 to 2017 the NF/SGVHS reported an 87% reduction of opioid prescriptions (≥ 100 mg morphine equivalents/d), compared with the VHA national average reduction of 49%.18
Vigorous opioid reduction is controversial. In a systematic review on opioid reduction, Frank and colleagues reported some beneficial effects of opioid reduction, such as increased health-related quality of life.20 However, another study suggested a risk of increased pain with opioid tapering.21 The literature findings on the association between prescription opioid use and suicide are mixed. The VHA Office of Mental Health and Suicide Prevention literature review reported that veterans were at increased risk of committing suicide within the first 6 months of discontinuing opioid therapy.22 Another study reported that veterans who discontinued long-term opioid treatment had an increased risk for suicidal ideation.23 However, higher doses of opioids were associated with an increased risk for suicide among individuals with chronic pain.10 The link between opioid tapering and the risk of suicide or overdose is uncertain.
Bohnert and Ilgen suggested that discontinuing prescription opioids leads to suicide without examining the risk factors that influenced discontinuation is ill-informed.7 Strong evidence about the association or relationship among opioid use, overdose, and suicide is needed. To increase our understanding of that association, Bohnert and Ilgen argued for multifaceted interventions that simultaneously address the shared causes and risk factors for OUD,7 such as the multispecialty Opioid Risk Reduction Program at NF/SGVHS.
Because of the reported association between robust integrated mental health and addiction, primary care pain clinic intervention, and the higher rate of opioid tapering in NF/SGVHS,18 this study aims to describe the pattern of overdose diagnosis (opioid overdose and nonopioid overdose) and pattern of suicide rates among veterans enrolled in NF/SGVHS, Veterans Integrated Service Network (VISN) 8, and the entire VA health care system during 2012 to 2016.The study reviewed and compared overdose diagnosis and suicide rates among veterans across NF/SGVHS and 2 other levels of the VA health care system to determine whether there were variances in the pattern of overdose/suicide rates and to explore these differences.
Methods
In this retrospective study, aggregate data were obtained from several sources. First, the drug overdose data were extracted from the VA Support Service Center (VSSC) medical diagnosis cube. We reviewed the literature for opioid codes reported in the literature and compared these reported opioid International Classification of Diseases, Ninth Revision (ICD-9) and International Classification of Diseases, 10th Revision (ICD-10) codes with the local facility patient-level comprehensive overdose diagnosis codes. Based on the comparison, we found 98 ICD-9 and ICD-10 overdose diagnosis codes and ran the modified codes against the VSSC national database. Overdose data were aggregated by facility and fiscal year, and the overdose rates (per 1,000) were calculated for unique veteran users at the 3 levels (NF/SGVHS, VISN 8, and VA national) as the denominator.
Each of the 18 VISNs comprise multiple VAMCs and clinics within a geographic region. VISN 8 encompasses most of Florida and portions of southern Georgia and the Caribbean (Puerto Rico, US Virgin Islands), including NF/SGVHS.
In this study, drug overdose refers to the overdose or poisoning from all drugs (ie, opioids, cocaine, amphetamines, sedatives, etc) and defined as any unintentional (accidental), deliberate, or intent undetermined drug poisoning.24 The suicide data for this study were drawn from the VA Suicide Prevention Program at 3 different levels: NF/SGVHS, VISN 8, and VHA national. Suicide is death caused by an intentional act of injuring oneself with the intent to die.25
This descriptive study compared the rate of annual drug overdoses (per 1,000 enrollees) between NF/SGVHS, VISN 8, and VHA national from 2012 to 2016. It also compared the annual rate of suicide per 100,000 enrollees across these 3 levels of the VHA. The overdose and suicide rates and numbers are mutually exclusive, meaning the VISN 8 data do not include the NF/SGVHS information, and the national data excluded data from VISN 8 and NF/SGVHS. This approach helped improve the quality of multiple level comparisons for different levels of the VHA system.
Results
Figure 1 shows the pattern of overdose diagnosis by rates (per 1,000) across the study period (2012 to 2016) and compares patterns at 3 levels of VHA (NF/SGVHS, VISN 8, and VHA national). The average annual rate of overdose diagnoses for NF/SGVHS during the study was slightly higher (16.8 per 1,000) than that of VISN 8 (16 per 1,000) and VHA national (15.3 per 1,000), but by the end of the study period the NF/SGVHS rate (18.6 per 1,000) nearly matched the national rate (18.2 per 1,000) and was lower than the VISN 8 rate (20.4 per 1,000). Additionally, NF/SGVHS had less variability (SD, 1.34) in yearly average overdose rates compared with VISN 8 (SD, 2.96), and VHA national (SD, 1.69).
From 2013 to 2014 the overdose diagnosis rate for NF/SGVHS remained the same (17.1 per 1,000). A similar pattern was observed for the VHA national data, whereas the VISN 8 data showed a steady increase during the same period. In 2015, the NF/SGVHS had 0.7 per 1,000 decrease in overdose diagnosis rate, whereas VISN 8 and VHA national data showed 1.7 per 1,000 and 0.9 per 1,000 increases, respectively. During the last year of the study (2016), there was a dramatic increase in overdose diagnosis for all the health care systems, ranging from 2.2 per 1,000 for NF/SGVHS to 3.3 per 1,000 for VISN 8.
Figure 2 shows the annual rates (per 100,000 individuals) of suicide for NF/SGVHS, VISN 8, and VHA national. The suicide pattern for VISN 8 shows a cyclical acceleration and deceleration trend across the study period. From 2012 to 2014, the VHA national data show a steady increase of about 1 per 100,000 from year to year. On the contrary, NF/SGVHS shows a low suicide rate from year to year within the same period with a rate of 10 per 100,000 in 2013 compared with the previous year. Although the NF/SGVHS suicide rate increased in 2016 (10.4 per 100,000), it remained lower than that of VISN 8 (10.7 per 100,00) and VHA national (38.2 per 100,000).
This study shows that NF/SGVHS had the lowest average annual rate of suicide (9.1 per 100,000) during the study period, which was 4 times lower than that of VHA national and 2.6 times lower than VISN 8.
Discussion
This study described and compared the distribution pattern of overdose (nonopioid and opioid) and suicide rates at different levels of the VHA system. Although VHA implemented systemwide opioid tapering in 2013, little is known about the association between opioid tapering and overdose and suicide. We believe a retrospective examination regarding overdose and suicide among VHA users at 3 different levels of the system from 2012 to 2016 could contribute to the discussion regarding the potential risks and benefits of discontinuing opioids.
First, the average annual rate of overdose diagnosis for NF/SGVHS during the study period was slightly higher (16.8 per 1,000) compared with those of VISN 8 (16.0 per 1,000) and VHA national (15.3 per 1,000) with a general pattern of increase and minimum variations in the rates observed during the study period among the 3 levels of the system. These increased overdose patterns are consistent with other reports in the literature.14 By the end of the study period, the NF/SGVHS rate (18.6 per 1,000) nearly matched the national rate (18.2 per 1,000) and was lower than VISN 8 (20.4 per 1,000). During the last year of the study period (2016), there was a dramatic increase in overdose diagnosis for all health care systems ranging from 2.2 per 1,000 for NF/SGVHS to 3.3 per 1,000 for VISN 8, which might be because of the VHA systemwide change of diagnosis code from ICD-9 to ICD-10, which includes more detailed diagnosis codes.
Second, our results showed that NF/SGVHS had the lowest average annual suicide rate (9.1 per 100,000) during the study period, which is one-fourth the VHA national rate and 2.6 per 100,000 lower than the VISN 8 rate. According to Bohnert and Ilgen,programs that improve the quality of pain care, expand access to psychotherapy, and increase access to medication-assisted treatment for OUDs could reduce suicide by drug overdose.7 We suggest that the low suicide rate at NF/SGVHS and the difference in the suicide rates between the NF/SGVHS and VISN 8 and VHA national data might be associated with the practice-based biopsychosocial interventions implemented at NF/SGVHS.
Our data showed a rise in the incidence of suicide at the NF/SGVHS in 2016. We are not aware of a local change in conditions, policy, and practice that would account for this increase. Suicide is variable, and data are likely to show spikes and valleys. Based on the available data, although the incidence of suicides at the NF/SGVHS in 2016 was higher, it remained below the VISN 8 and national VHA rate. This study seems to support the practice of tapering or stopping opioids within the context of a multidisciplinary approach that offers frequent follow-up, nonopioid options, and treatment of opioid addiction/dependence.
Limitations
The research findings of this study are limited by the retrospective and descriptive nature of its design. However, the findings might provide important information for understanding variations of overdose and suicide among VHA enrollees. Studies that use more robust methodologies are warranted to clinically investigate the impact of a multispecialty opioid risk reduction program targeting chronic pain and addiction management and identify best practices of opioid reduction and any unintended consequences that might arise from opioid tapering.26 Further, we did not have access to the VA national overdose and suicide data after 2016. Similar to most retrospective data studies, ours might be limited by availability of national overdose and suicide data after 2016. It is important for future studies to cross-validate our study findings.
Conclusions
The NF/SGVHS developed and implemented a biopsychosocial model of pain treatment that includes multicomponent primary care integrated with mental health and addiction services as well as the interventional pain and physical medicine and rehabilitation services. The presence of this program, during a period when the facility was tapering opioids is likely to account for at least part of the relative reduction in suicide.
1. American Foundation for Suicide Prevention. Suicide statistics. https://afsp.org/about-suicide/suicide-statistics. Updated 2019. Accessed September 2, 2020.
2. Shane L 3rd. New veteran suicide numbers raise concerns among experts hoping for positive news. https://www.militarytimes.com/news/pentagon-congress/2019/10/09/new-veteran-suicide-numbers-raise-concerns-among-experts-hoping-for-positive-news. Published October 9, 2019. Accessed July 23, 2020.
3. Veterans Health Administration, Office of Mental Health and Suicide Prevention. Veteran suicide data report, 2005–2017. https://www.mentalhealth.va.gov/docs/data-sheets/2019/2019_National_Veteran_Suicide_Prevention_Annual_Report_508.pdf. Published September 2019. Accessed July 20, 2020.
4. Gallagher RM. Advancing the pain agenda in the veteran population. Anesthesiol Clin. 2016;34(2):357-378. doi:10.1016/j.anclin.2016.01.003
5. Ilgen MA, Kleinberg F, Ignacio RV, et al. Noncancer pain conditions and risk of suicide. JAMA Psychiatry. 2013;70(7):692-697. doi:10.1001/jamapsychiatry.2013.908
6. Frenk SM, Porter KS, Paulozzi LJ. Prescription opioid analgesic use among adults: United States, 1999-2012. National Center for Health Statistics data brief. https://www.cdc.gov/nchs/products/databriefs/db189.htm. Published February 25, 2015. Accessed July 20, 2020.
7. Bohnert ASB, Ilgen MA. Understanding links among opioid use, overdose, and suicide. N Engl J Med. 2019;380(14):71-79. doi:10.1056/NEJMc1901540
8. Dunn KM, Saunders KW, Rutter CM, et al. Opioid prescriptions for chronic pain and overdose: a cohort study. Ann Intern Med. 2010;152(2):85-92. doi:10.7326/0003-4819-152-2-201001190-00006
9. Gomes T, Mamdani MM, Dhalla IA, Paterson JM, Juurlink DN. Opioid dose and drug-related mortality in patients with nonmalignant pain. Arch Intern Med. 2011;171(7):686-691. doi:10.1001/archinternmed.2011.117
10. Ilgen MA, Bohnert AS, Ganoczy D, Bair MJ, McCarthy JF, Blow FC. Opioid dose and risk of suicide. Pain. 2016;157(5):1079-1084. doi:10.1097/j.pain.0000000000000484
11. Sinyor M, Howlett A, Cheung AH, Schaffer A. Substances used in completed suicide by overdose in Toronto: an observational study of coroner’s data. Can J Psychiatry. 2012;57(3):184-191. doi:10.1177/070674371205700308
12. Wilcox HC, Conner KR, Caine ED. Association of alcohol and drug use disorders and completed suicide: an empirical review of cohort studies. Drug Alcohol Depend. 2004;76(suppl):S11-S19 doi:10.1016/j.drugalcdep.2004.08.003.
13. Baser OL, Mardekian XJ, Schaaf D, Wang L, Joshi AV. Prevalence of diagnosed opioid abuse and its economic burden in the Veterans Health Administration. Pain Pract. 2014;14(5):437-445. doi:10.1111/papr.12097
14. Hedegaard H, Warner M, Miniño AM. Drug overdose deaths in the united states, 1999-2015. National Center for Health Statistics data brief. https://www.cdc.gov/nchs/data/databriefs/db273.pdf. Published February 2017. Accessed July 20, 2020.
15. Rudd RA, Seth P, David F, Scholl L. Increases in drug and opioid-involved overdose deaths—United States, 2010-2015. MMWR Morb Mortal Wkly Rep. 2016;65(50-51):1445-1452. doi:10.15585/mmwr.mm655051e1
16. Scholl L, Seth P, Kariisa M, Wilson N, Baldwin G. Drug and opioid-involved overdose deaths—United States, 2013-2017. MMWR Morb Mortal Wkly Rep. 2019,67(5152):1419-1427. doi:10.15585/mmwr.mm675152e1
17. US Department of Veterans Affairs and Department of Defense. VA/DOD clinical practice guideline for opioid therapy for chronic pain version 3.0. https://www.healthquality.va.gov/guidelines/pain/cot. Updated March 1, 2018. Accessed July 20, 2020.
18. Vaughn IA, Beyth RJ, Ayers ML, et al. Multispecialty opioid risk reduction program targeting chronic pain and addiction management in veterans. Fed Pract. 2019;36(9):406-411.
19. Gellad WF, Good CB, Shulkin DJ. Addressing the opioid epidemic in the United States: lessons from the Department of Veterans Affairs. JAMA Intern Med. 2017;177(5):611-612. doi:10.1001/jamainternmed.2017.0147
20. Frank JW, Lovejoy TI, Becker WC, et al. Patient outcomes in dose reduction or discontinuation of long-term opioid therapy: a systematic review. Ann Intern Med. 2017;167(3):181-191. doi:10.7326/M17-0598
21. Berna C, Kulich RJ, Rathmell JP. Tapering long-term opioid therapy in chronic noncancer pain: evidence and recommendations for everyday practice. Mayo Clin Proc. 2015;90(6):828-842. doi:10.1016/j.mayocp.2015.04.003
22. Veterans Health Administration, Office of Mental Health and Suicide Prevention. Opioid use and suicide risk. https://www.mentalhealth.va.gov/suicide_prevention/docs/Literature_Review_Opioid_Use_and_Suicide_Risk_508_FINAL_04-26-2019.pdf. Published April 26, 2019. Accessed July 20, 2020.
23. Demidenko MI, Dobscha SK, Morasco BJ, Meath THA, Ilgen MA, Lovejoy TI. Suicidal ideation and suicidal self-directed violence following clinician-initiated prescription opioid discontinuation among long-term opioid users. Gen Hosp Psychiatry. 2017;47:29-35. doi:10.1016/j.genhosppsych.2017.04.011
24. National Institute on Drug Abuse. Intentional versus unintentional overdose deaths. https://www.drugabuse.gov/related-topics/treatment/intentional-vs-unintentional-overdose-deaths. Updated February 13, 2017. Accessed July 20, 2020.
25. Centers for Disease Control and Prevention. Preventing suicide. https://www.cdc.gov/violenceprevention/pdf/suicide-factsheet.pdf. Published 2018. Accessed July 20, 2020.
26. Webster LR. Pain and suicide: the other side of the opioid story. Pain Med. 2014;15(3):345-346. doi:10.1111/pme.12398