User login
Hepatitis C Clinical Dashboards: Improving Liver Specialty Care Access and Quality
The VHA cares for 170,000 patients with chronic hepatitis C virus (HCV) infection, making it the largest single provider of medical care to chronic HCV patients in the U.S.1 Although HCV treatment rates within the VHA outpace those of the private sector, only half of patients with HCV infection within the VHA have accessed a liver specialist and less than a quarter have received antiviral medication.2-4
Newer HCV treatment regimens promise treatment sustained virologic response (SVR) rates—a marker of viral clearance posttreatment—of ≥ 90% in most cases but require careful patient selection and management.5 In particular, the estimated 24% of patients with HCV infection with advanced liver disease require more rapid consideration for therapy to reduce complications of cirrhosis such as liver failure, hepatocellular carcinoma, and death.6 With the advent of promising HCV therapies and rising rates of cirrhosis, there is an urgent need for population health management approach to deliver HCV care more widely and effectively.5,7
Rationale for Clinical Dashboards
Although the VHA hosts the largest integrated electronic medical record (EMR) system in the U.S., an EMR on its own does not guarantee improved patient care or access.8 EMRs can be used to document health care delivery, but they do not routinely provide information about the burden of disease in a population, nor do they identify patients most in need of care.
Clinical dashboards are tools that are geared to provide clinicians with relevant data to improve patient care. Early clinical dashboard development across the VHA was primary care focused, targeting patients with diabetes, ischemic heart disease, and hypertension. This national primary care dashboard provides clinically relevant, actionable data and enables the clinical provider to track patient progress. In addition, regional data can be aggregated for use by VISN managers.
While the impact of dashboards on quality of care is not well investigated, it remains a vital tool with the potential to transform care.9
HCV dashboards have been developed by individual VISNs and facilities across the VHA. HCV dashboards serve to identify patients most in need of antiviral therapy, expand outreach to those previously unseen by specialty care, sort patients by severity of liver disease, track treatment status, and calculate SVR.
Current HCV dashboards incorporate elements derived from the VA Corporate Data Warehouse (CDW), a national VA data repository consisting of data from all facilities’ electronic medical record systems. Updated information from the previous day is made available in VISN data warehouses and is refreshed nightly. The final result is user-friendly clinical data available in near-real time to dashboard users.
VISN 21 HCV Dashboard
Purpose and Elements
The VISN 21 HCV dashboard will be discussed as a prototype. Graphics of the VISN 21 dashboard interface are presented in Figure 1 and Figure 2. The VISN 21 HCV dashboard was developed by pharmacists with specialty training in medical informatics, health care analytics, and data management. The dashboard addresses 3 previously unmet needs in HCV care: population management, patient treatment outcome tracking, and administrative planning.
Population management. The VISN 21 HCV dashboard allows for a centralized approach to care across a large geographic area containing multiple facilities. One important function is to identify patients with advanced liver disease as well as those who have not been seen in specialty care within the previous 2 years. It also allows for pretreatment screening through identification of HCV viral characteristics (eg, genotype, viral load) and selected comorbidities (eg, renal function, mental health conditions) that may influence candidacy for specific antiviral therapies. Individual patient reports can be stratified by facility (eg, clinic or VAMC) to identify the burden of disease within a specific location.
Patient treatment outcome tracking. The HCV dashboard allows tracking of the numbers and characteristics of patients who have previously received antiviral therapy. The number of patients achieving virologic cure may be tracked at the VISN and station levels, or displayed based on user-selected parameters, such as treatment history.
Administrative planning. The high costs of HCV antiviral medication requires careful budgetary planning and close communication with local and regional leadership. The VISN 21 HCV dashboard provides information crucial to assessing future treatment needs. Specifically, it allows administrators to view the number of patients actively being treated. The dashboard also allows for comparison of treatment rates among different facilities and help allocate resources where needed.
Design Architecture
To construct the source data for the dashboards, relevant data elements are pulled into a base table using Structured Query Language (SQL) code. Subsequently, SQL Server Reporting Services (SSRS) (Microsoft, Redmond, WA) compiles the dashboard output into an interactive and user-friendly interface that can be tailored to individual end users’ needs.
Dashboard development process. Through collaboration and survey of clinical providers, clinical factors necessary to decide patient and treatment readiness were identified. Relevant data elements include HCV genotype, selected medical and psychiatric comorbidities, prior receipt of treatment, and presence of advanced liver disease. While liver disease severity may be determined by invasive means, such as liver biopsy, the dashboard offers a noninvasive assessment using laboratory values (eg, calculated Fibrosis 4 score, Model for End Stage Liver Disease score).10,11
Once dashboard elements were selected, the variables were operationalized using data available in the CDW within the prescription, diagnostic, and laboratory data tables. As code was written, output was validated through chart review to ensure accuracy. Further validation was performed through comparison of the dashboard data with the clinical case registry, a registry of HCV viremic confirmed patients. Throughout dashboard development, the product was presented to end users to solicit requests for modifications. The code was refined over time to incorporate end user input.
Dashboard user interface. SSRS allows users to customize reports based on any variables defined within the data set including facility, severity of disease, HCV genotype, and prior antiviral treatment history among others. Results are displayed with summary information, including the total number of patients in the selected cohort, the number of patients who have been referred to a specialty liver clinic, and the number of patients who have been determined to achieve SVR. The end user has the option to export the results to excel for further use (eg, patient lists for telephone follow-up).
User recruitment. After piloting, the VISN 21 HCV dashboard was introduced during monthly pharmacy meetings and clinical telehealth encounters with providers. Feedback was solicited during the presentations and through postdevelopment surveys. In particular, providers requested spreadsheet-friendly formatting, additional informational fields consisting of mental health and substance abuse diagnoses, and identification of all patients with HCV regardless
of disease severity. A key element of dashboard refinement includes enhancing usability by solicitation of user feedback with subsequent tailoring of the user interface.12
Challenges
Many challenges exist in clinical dashboard development, expansion, and implementation including data integrity, workflow, and work culture. Data elements are often variable within a single facility, and this variation increases when identifying the same elements across facilities. For example, a laboratory test name (eg, “serum creatinine”) may exist with 2 to 3 different labels (eg, “creat,” “SCr,” “serum Cr”) within a single facility. As the variation increases, potential for inappropriate laboratory tests may be increased. Specialty clinic names also vary within and between facilities.
Local nomenclature for HCV clinic names may include “liver,” “infectious disease,” “hepatitis c,” or some variation, making it crucial for the dashboard developer to work closely with clinical staff to accurately matchspecialty clinic names being pulled from the data warehouse. Given the complexities of naming nomenclature within VA data, dashboard development requires a substantial investment of code customization and validation.
Ongoing dashboard maintenance is another important challenge due to the need for staff trained in SQL coding and familiarity with VA data warehouse architecture. Consequently, until the VHA dedicates resources to maintain such dashboards, only VISNs with existing technical knowledge and staffing will benefit from dashboards.
Usability, typically defined as “…effectiveness, efficiency and satisfaction with which the intended users can achieve their tasks in the intended context of product use,” is an additional consideration as the HCV clinical dashboard disseminates nationally.13 Standard clinic workflow is not always conducive to the use of dashboards. VHA providers use the Computerized Patient Record System (CPRS) to review and document patient notes. However, accessing the HCV dashboard involves a site hosted outside of CPRS, thereby requiring the user to take several extra steps. These and other usability factors will need to be considered as the dashboard disseminates more widely.
Finally, data describing the effectiveness of clinical dashboards is very limited. VISN 21 is tracking the number of users accessing the dashboard. However, further study is needed to determine if clinical dashboards improve patient access and quality of care as well as factors to enhance usability
Conclusion
Clinical dashboards have the ability to transform each clinical provider into a population health manager who can readily identify patients most in need of care within their facility catchment area and beyond. As HCV dashboard development and implementation grows across the VHA, there is a need to pair clinical and technological advancements with greater patient outreach and shared best practices. Understanding the factors that tie improved quality of care with usability as well as investment in dashboard development and related efforts will likely keep the VHA in the forefront of chronic care delivery.
Author disclosures
The authors report no actual or potential conflicts of interest with regard to this article.
Disclaimer
The opinions expressed herein are those of the authors and do not necessarily reflect those of Federal Practitioner, Frontline Medical Communications Inc., the U.S. Government, or any of its agencies. This article may discuss unlabeled or investigational use of certain drugs. Please review complete prescribing information for specific drugs or drug combinations—including indications, contraindications, warnings, and adverse effects—before administering pharmacologic therapy to patients.
1. Dominitz JA, Boyko EJ, Koepsell TD, et al. Elevated prevalence of hepatitis C infection in users of United States veterans medical centers. Hepatology. 2005;41(1):88-96.
2. United States Department of Veterans Affairs. HCV Viremic Veterans in VHA Care in 2013 with First Fill in the Year or Ever Filled a VHA Outpatient Prescription for a HCV Antiviral Medication for the Nation, by VISN and by Station Description. http://vaww.hepatitis.va.gov/data-reports/ccr2013/RegMed-AnyFirstEverInCare-Jan14-HCVVir-HCV-2013-All.asp. Accessed October 10, 2014.
3. Rongey C, Shen H, Hamilton N, Backus LI, Asch SM, Knight S. Impact of rural residence and health system structure on quality of liver care. PloS One. 2013;8(12):e84826.
4. Beste LA, Ioannou GN. Prevalence and Treatment of Chronic Hepatitis C Virus Infection in the U.S. Department of Veterans Affairs [published online ahead of print January 19, 2015]. Epidemiologic Reviews. doi: 10.1093/epirev/mxu002.
5. Lawitz E, Poordad FF, Pang PS, et al. Sofosbuvir and ledipasvir fixed-dose combination with and without ribavirin in treatment-naive and previously treated patients with genotype 1 hepatitis C virus infection (LONESTAR): an openlabel, randomised, phase 2 trial [published correction appears in Lancet. 2014;383(9920):870]. Lancet. 2014;383(9916):515-523.
6. United States Department of Veterans Affairs. HCV Viremic Veterans in VHA Care in 2013 who had a VHA Diagnosis of Fibrosis/Cirrhosis by FIB-4 in the year for the Nation, by VISN and by Station. http://vaww.hepatitis.va.gov/data-reports/ccr2013/Cond-FIB4CurInCare-Jan14HCVVir-2013-All.asp. Accessed October 10, 2014.
7. Kanwal F, Hoang T, Kramer JR, et al. Increasing prevalence of HCC and cirrhosis in patients with chronic hepatitis C virus infection. Gastroenterology. 2011;140(4):1182-1188.e1.
8. Furukawa MF, King J, Patel V, Hsiao CJ, Adler-Milstein J, Jha AK. Despite substantial progress in EHR adoption, health information exchange and patient engagement remain low in office settings. Health Aff (Millwood). 2014;33(9):1672-1679.
9. Vrieze SI, Docherty A, Thuras P, et al. Best practices: The electronic medical record is an invaluable clinical tool: Let’s start using it. Psychiatric Serv. 2013;64(10):946-949.
10. Vallet-Pichard A, Mallet V, Nalpas B, et al. FIB-4: An inexpensive and accurate marker of fibrosis in HCV infection. Comparison with liver biopsy and fibrotest. Hepatology. 2007;46(1):32-36.
11. Kamath PS, Kim WR; Advanced Liver Disease Study Group. The model for endstage liver disease (MELD). Hepatology. 2007;45(3):797-805.
12. Goldberg L, Lide B, Lowry S, et al. Usability and accessibility in consumer health informatics current trends and future challenges. Am J Prev Med. 2011;40(5 suppl 2):S187-S197.
13. Schumacher RM, Lowry SZ; National Institute of Standards and Technology. NIST Guide to the Processes Approach for Improving the Usability of Electronic Health Records. http://www.nist.gov/itl/hit/upload/Guide_Final_Publication_Version.pdf. Published November 29, 2010. Accessed November 24, 2014.
The VHA cares for 170,000 patients with chronic hepatitis C virus (HCV) infection, making it the largest single provider of medical care to chronic HCV patients in the U.S.1 Although HCV treatment rates within the VHA outpace those of the private sector, only half of patients with HCV infection within the VHA have accessed a liver specialist and less than a quarter have received antiviral medication.2-4
Newer HCV treatment regimens promise treatment sustained virologic response (SVR) rates—a marker of viral clearance posttreatment—of ≥ 90% in most cases but require careful patient selection and management.5 In particular, the estimated 24% of patients with HCV infection with advanced liver disease require more rapid consideration for therapy to reduce complications of cirrhosis such as liver failure, hepatocellular carcinoma, and death.6 With the advent of promising HCV therapies and rising rates of cirrhosis, there is an urgent need for population health management approach to deliver HCV care more widely and effectively.5,7
Rationale for Clinical Dashboards
Although the VHA hosts the largest integrated electronic medical record (EMR) system in the U.S., an EMR on its own does not guarantee improved patient care or access.8 EMRs can be used to document health care delivery, but they do not routinely provide information about the burden of disease in a population, nor do they identify patients most in need of care.
Clinical dashboards are tools that are geared to provide clinicians with relevant data to improve patient care. Early clinical dashboard development across the VHA was primary care focused, targeting patients with diabetes, ischemic heart disease, and hypertension. This national primary care dashboard provides clinically relevant, actionable data and enables the clinical provider to track patient progress. In addition, regional data can be aggregated for use by VISN managers.
While the impact of dashboards on quality of care is not well investigated, it remains a vital tool with the potential to transform care.9
HCV dashboards have been developed by individual VISNs and facilities across the VHA. HCV dashboards serve to identify patients most in need of antiviral therapy, expand outreach to those previously unseen by specialty care, sort patients by severity of liver disease, track treatment status, and calculate SVR.
Current HCV dashboards incorporate elements derived from the VA Corporate Data Warehouse (CDW), a national VA data repository consisting of data from all facilities’ electronic medical record systems. Updated information from the previous day is made available in VISN data warehouses and is refreshed nightly. The final result is user-friendly clinical data available in near-real time to dashboard users.
VISN 21 HCV Dashboard
Purpose and Elements
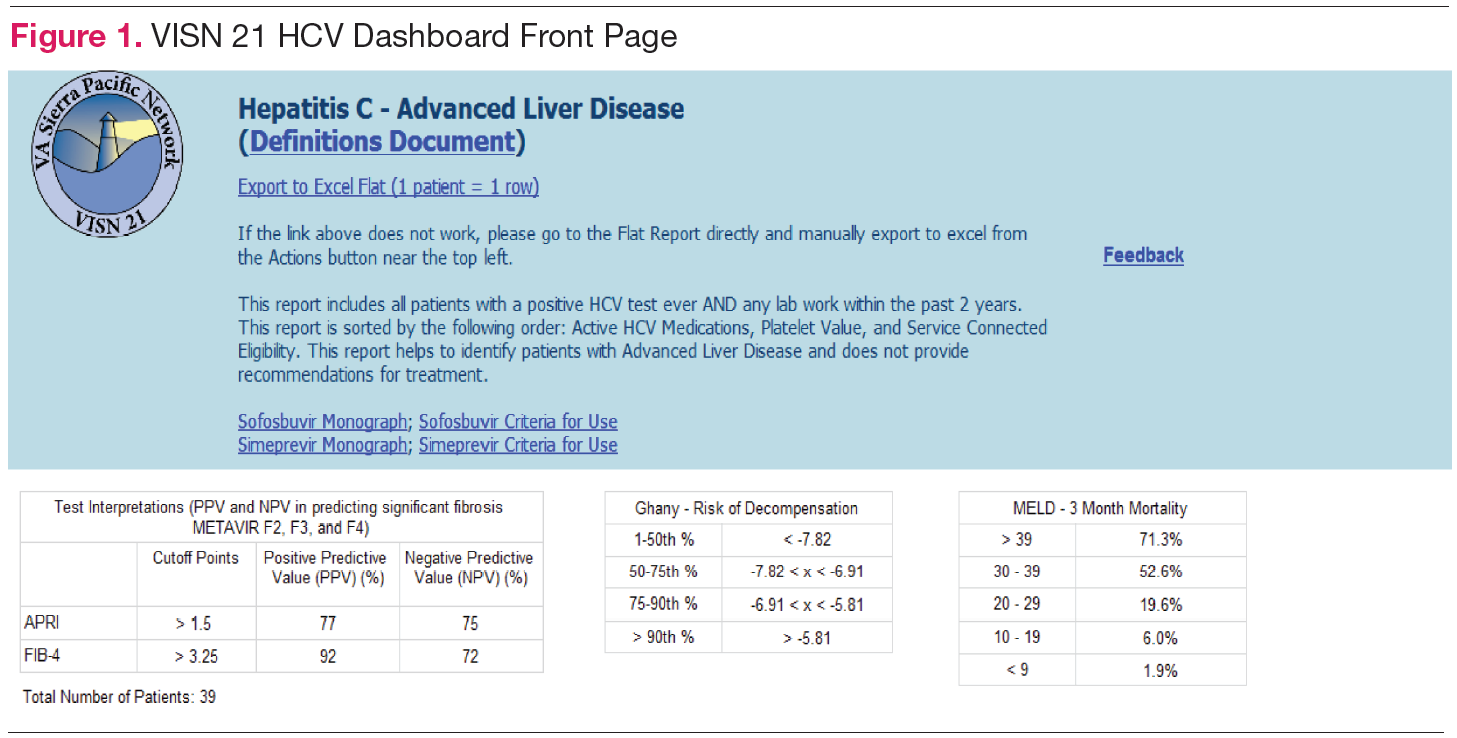
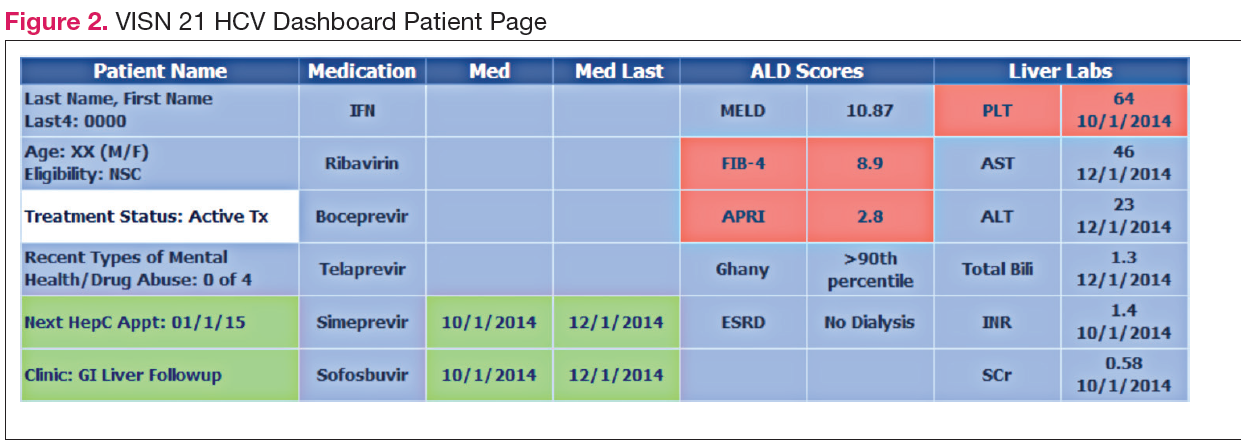
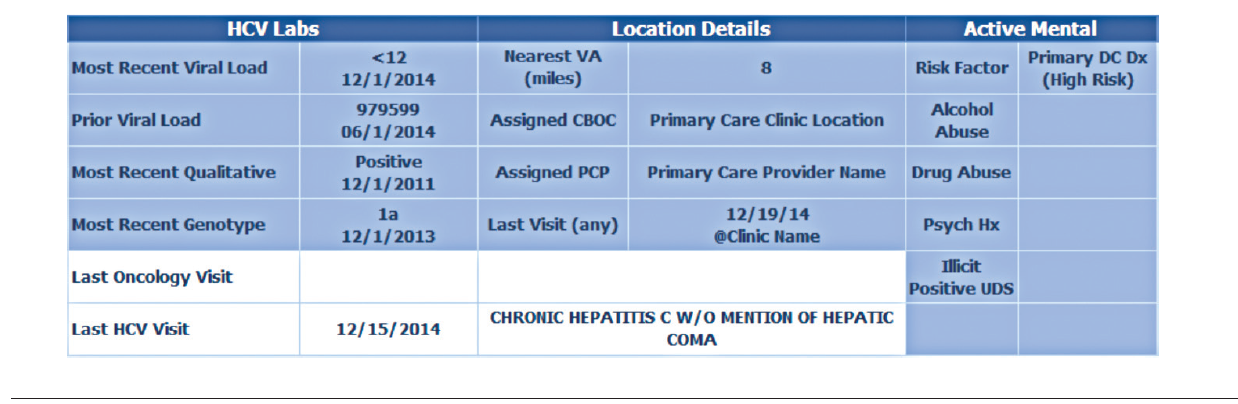
The VISN 21 HCV dashboard will be discussed as a prototype. Graphics of the VISN 21 dashboard interface are presented in Figure 1 and Figure 2. The VISN 21 HCV dashboard was developed by pharmacists with specialty training in medical informatics, health care analytics, and data management. The dashboard addresses 3 previously unmet needs in HCV care: population management, patient treatment outcome tracking, and administrative planning.
Population management. The VISN 21 HCV dashboard allows for a centralized approach to care across a large geographic area containing multiple facilities. One important function is to identify patients with advanced liver disease as well as those who have not been seen in specialty care within the previous 2 years. It also allows for pretreatment screening through identification of HCV viral characteristics (eg, genotype, viral load) and selected comorbidities (eg, renal function, mental health conditions) that may influence candidacy for specific antiviral therapies. Individual patient reports can be stratified by facility (eg, clinic or VAMC) to identify the burden of disease within a specific location.
Patient treatment outcome tracking. The HCV dashboard allows tracking of the numbers and characteristics of patients who have previously received antiviral therapy. The number of patients achieving virologic cure may be tracked at the VISN and station levels, or displayed based on user-selected parameters, such as treatment history.
Administrative planning. The high costs of HCV antiviral medication requires careful budgetary planning and close communication with local and regional leadership. The VISN 21 HCV dashboard provides information crucial to assessing future treatment needs. Specifically, it allows administrators to view the number of patients actively being treated. The dashboard also allows for comparison of treatment rates among different facilities and help allocate resources where needed.
Design Architecture
To construct the source data for the dashboards, relevant data elements are pulled into a base table using Structured Query Language (SQL) code. Subsequently, SQL Server Reporting Services (SSRS) (Microsoft, Redmond, WA) compiles the dashboard output into an interactive and user-friendly interface that can be tailored to individual end users’ needs.
Dashboard development process. Through collaboration and survey of clinical providers, clinical factors necessary to decide patient and treatment readiness were identified. Relevant data elements include HCV genotype, selected medical and psychiatric comorbidities, prior receipt of treatment, and presence of advanced liver disease. While liver disease severity may be determined by invasive means, such as liver biopsy, the dashboard offers a noninvasive assessment using laboratory values (eg, calculated Fibrosis 4 score, Model for End Stage Liver Disease score).10,11
Once dashboard elements were selected, the variables were operationalized using data available in the CDW within the prescription, diagnostic, and laboratory data tables. As code was written, output was validated through chart review to ensure accuracy. Further validation was performed through comparison of the dashboard data with the clinical case registry, a registry of HCV viremic confirmed patients. Throughout dashboard development, the product was presented to end users to solicit requests for modifications. The code was refined over time to incorporate end user input.
Dashboard user interface. SSRS allows users to customize reports based on any variables defined within the data set including facility, severity of disease, HCV genotype, and prior antiviral treatment history among others. Results are displayed with summary information, including the total number of patients in the selected cohort, the number of patients who have been referred to a specialty liver clinic, and the number of patients who have been determined to achieve SVR. The end user has the option to export the results to excel for further use (eg, patient lists for telephone follow-up).
User recruitment. After piloting, the VISN 21 HCV dashboard was introduced during monthly pharmacy meetings and clinical telehealth encounters with providers. Feedback was solicited during the presentations and through postdevelopment surveys. In particular, providers requested spreadsheet-friendly formatting, additional informational fields consisting of mental health and substance abuse diagnoses, and identification of all patients with HCV regardless
of disease severity. A key element of dashboard refinement includes enhancing usability by solicitation of user feedback with subsequent tailoring of the user interface.12
Challenges
Many challenges exist in clinical dashboard development, expansion, and implementation including data integrity, workflow, and work culture. Data elements are often variable within a single facility, and this variation increases when identifying the same elements across facilities. For example, a laboratory test name (eg, “serum creatinine”) may exist with 2 to 3 different labels (eg, “creat,” “SCr,” “serum Cr”) within a single facility. As the variation increases, potential for inappropriate laboratory tests may be increased. Specialty clinic names also vary within and between facilities.
Local nomenclature for HCV clinic names may include “liver,” “infectious disease,” “hepatitis c,” or some variation, making it crucial for the dashboard developer to work closely with clinical staff to accurately matchspecialty clinic names being pulled from the data warehouse. Given the complexities of naming nomenclature within VA data, dashboard development requires a substantial investment of code customization and validation.
Ongoing dashboard maintenance is another important challenge due to the need for staff trained in SQL coding and familiarity with VA data warehouse architecture. Consequently, until the VHA dedicates resources to maintain such dashboards, only VISNs with existing technical knowledge and staffing will benefit from dashboards.
Usability, typically defined as “…effectiveness, efficiency and satisfaction with which the intended users can achieve their tasks in the intended context of product use,” is an additional consideration as the HCV clinical dashboard disseminates nationally.13 Standard clinic workflow is not always conducive to the use of dashboards. VHA providers use the Computerized Patient Record System (CPRS) to review and document patient notes. However, accessing the HCV dashboard involves a site hosted outside of CPRS, thereby requiring the user to take several extra steps. These and other usability factors will need to be considered as the dashboard disseminates more widely.
Finally, data describing the effectiveness of clinical dashboards is very limited. VISN 21 is tracking the number of users accessing the dashboard. However, further study is needed to determine if clinical dashboards improve patient access and quality of care as well as factors to enhance usability
Conclusion
Clinical dashboards have the ability to transform each clinical provider into a population health manager who can readily identify patients most in need of care within their facility catchment area and beyond. As HCV dashboard development and implementation grows across the VHA, there is a need to pair clinical and technological advancements with greater patient outreach and shared best practices. Understanding the factors that tie improved quality of care with usability as well as investment in dashboard development and related efforts will likely keep the VHA in the forefront of chronic care delivery.
Author disclosures
The authors report no actual or potential conflicts of interest with regard to this article.
Disclaimer
The opinions expressed herein are those of the authors and do not necessarily reflect those of Federal Practitioner, Frontline Medical Communications Inc., the U.S. Government, or any of its agencies. This article may discuss unlabeled or investigational use of certain drugs. Please review complete prescribing information for specific drugs or drug combinations—including indications, contraindications, warnings, and adverse effects—before administering pharmacologic therapy to patients.
The VHA cares for 170,000 patients with chronic hepatitis C virus (HCV) infection, making it the largest single provider of medical care to chronic HCV patients in the U.S.1 Although HCV treatment rates within the VHA outpace those of the private sector, only half of patients with HCV infection within the VHA have accessed a liver specialist and less than a quarter have received antiviral medication.2-4
Newer HCV treatment regimens promise treatment sustained virologic response (SVR) rates—a marker of viral clearance posttreatment—of ≥ 90% in most cases but require careful patient selection and management.5 In particular, the estimated 24% of patients with HCV infection with advanced liver disease require more rapid consideration for therapy to reduce complications of cirrhosis such as liver failure, hepatocellular carcinoma, and death.6 With the advent of promising HCV therapies and rising rates of cirrhosis, there is an urgent need for population health management approach to deliver HCV care more widely and effectively.5,7
Rationale for Clinical Dashboards
Although the VHA hosts the largest integrated electronic medical record (EMR) system in the U.S., an EMR on its own does not guarantee improved patient care or access.8 EMRs can be used to document health care delivery, but they do not routinely provide information about the burden of disease in a population, nor do they identify patients most in need of care.
Clinical dashboards are tools that are geared to provide clinicians with relevant data to improve patient care. Early clinical dashboard development across the VHA was primary care focused, targeting patients with diabetes, ischemic heart disease, and hypertension. This national primary care dashboard provides clinically relevant, actionable data and enables the clinical provider to track patient progress. In addition, regional data can be aggregated for use by VISN managers.
While the impact of dashboards on quality of care is not well investigated, it remains a vital tool with the potential to transform care.9
HCV dashboards have been developed by individual VISNs and facilities across the VHA. HCV dashboards serve to identify patients most in need of antiviral therapy, expand outreach to those previously unseen by specialty care, sort patients by severity of liver disease, track treatment status, and calculate SVR.
Current HCV dashboards incorporate elements derived from the VA Corporate Data Warehouse (CDW), a national VA data repository consisting of data from all facilities’ electronic medical record systems. Updated information from the previous day is made available in VISN data warehouses and is refreshed nightly. The final result is user-friendly clinical data available in near-real time to dashboard users.
VISN 21 HCV Dashboard
Purpose and Elements
The VISN 21 HCV dashboard will be discussed as a prototype. Graphics of the VISN 21 dashboard interface are presented in Figure 1 and Figure 2. The VISN 21 HCV dashboard was developed by pharmacists with specialty training in medical informatics, health care analytics, and data management. The dashboard addresses 3 previously unmet needs in HCV care: population management, patient treatment outcome tracking, and administrative planning.
Population management. The VISN 21 HCV dashboard allows for a centralized approach to care across a large geographic area containing multiple facilities. One important function is to identify patients with advanced liver disease as well as those who have not been seen in specialty care within the previous 2 years. It also allows for pretreatment screening through identification of HCV viral characteristics (eg, genotype, viral load) and selected comorbidities (eg, renal function, mental health conditions) that may influence candidacy for specific antiviral therapies. Individual patient reports can be stratified by facility (eg, clinic or VAMC) to identify the burden of disease within a specific location.
Patient treatment outcome tracking. The HCV dashboard allows tracking of the numbers and characteristics of patients who have previously received antiviral therapy. The number of patients achieving virologic cure may be tracked at the VISN and station levels, or displayed based on user-selected parameters, such as treatment history.
Administrative planning. The high costs of HCV antiviral medication requires careful budgetary planning and close communication with local and regional leadership. The VISN 21 HCV dashboard provides information crucial to assessing future treatment needs. Specifically, it allows administrators to view the number of patients actively being treated. The dashboard also allows for comparison of treatment rates among different facilities and help allocate resources where needed.
Design Architecture
To construct the source data for the dashboards, relevant data elements are pulled into a base table using Structured Query Language (SQL) code. Subsequently, SQL Server Reporting Services (SSRS) (Microsoft, Redmond, WA) compiles the dashboard output into an interactive and user-friendly interface that can be tailored to individual end users’ needs.
Dashboard development process. Through collaboration and survey of clinical providers, clinical factors necessary to decide patient and treatment readiness were identified. Relevant data elements include HCV genotype, selected medical and psychiatric comorbidities, prior receipt of treatment, and presence of advanced liver disease. While liver disease severity may be determined by invasive means, such as liver biopsy, the dashboard offers a noninvasive assessment using laboratory values (eg, calculated Fibrosis 4 score, Model for End Stage Liver Disease score).10,11
Once dashboard elements were selected, the variables were operationalized using data available in the CDW within the prescription, diagnostic, and laboratory data tables. As code was written, output was validated through chart review to ensure accuracy. Further validation was performed through comparison of the dashboard data with the clinical case registry, a registry of HCV viremic confirmed patients. Throughout dashboard development, the product was presented to end users to solicit requests for modifications. The code was refined over time to incorporate end user input.
Dashboard user interface. SSRS allows users to customize reports based on any variables defined within the data set including facility, severity of disease, HCV genotype, and prior antiviral treatment history among others. Results are displayed with summary information, including the total number of patients in the selected cohort, the number of patients who have been referred to a specialty liver clinic, and the number of patients who have been determined to achieve SVR. The end user has the option to export the results to excel for further use (eg, patient lists for telephone follow-up).
User recruitment. After piloting, the VISN 21 HCV dashboard was introduced during monthly pharmacy meetings and clinical telehealth encounters with providers. Feedback was solicited during the presentations and through postdevelopment surveys. In particular, providers requested spreadsheet-friendly formatting, additional informational fields consisting of mental health and substance abuse diagnoses, and identification of all patients with HCV regardless
of disease severity. A key element of dashboard refinement includes enhancing usability by solicitation of user feedback with subsequent tailoring of the user interface.12
Challenges
Many challenges exist in clinical dashboard development, expansion, and implementation including data integrity, workflow, and work culture. Data elements are often variable within a single facility, and this variation increases when identifying the same elements across facilities. For example, a laboratory test name (eg, “serum creatinine”) may exist with 2 to 3 different labels (eg, “creat,” “SCr,” “serum Cr”) within a single facility. As the variation increases, potential for inappropriate laboratory tests may be increased. Specialty clinic names also vary within and between facilities.
Local nomenclature for HCV clinic names may include “liver,” “infectious disease,” “hepatitis c,” or some variation, making it crucial for the dashboard developer to work closely with clinical staff to accurately matchspecialty clinic names being pulled from the data warehouse. Given the complexities of naming nomenclature within VA data, dashboard development requires a substantial investment of code customization and validation.
Ongoing dashboard maintenance is another important challenge due to the need for staff trained in SQL coding and familiarity with VA data warehouse architecture. Consequently, until the VHA dedicates resources to maintain such dashboards, only VISNs with existing technical knowledge and staffing will benefit from dashboards.
Usability, typically defined as “…effectiveness, efficiency and satisfaction with which the intended users can achieve their tasks in the intended context of product use,” is an additional consideration as the HCV clinical dashboard disseminates nationally.13 Standard clinic workflow is not always conducive to the use of dashboards. VHA providers use the Computerized Patient Record System (CPRS) to review and document patient notes. However, accessing the HCV dashboard involves a site hosted outside of CPRS, thereby requiring the user to take several extra steps. These and other usability factors will need to be considered as the dashboard disseminates more widely.
Finally, data describing the effectiveness of clinical dashboards is very limited. VISN 21 is tracking the number of users accessing the dashboard. However, further study is needed to determine if clinical dashboards improve patient access and quality of care as well as factors to enhance usability
Conclusion
Clinical dashboards have the ability to transform each clinical provider into a population health manager who can readily identify patients most in need of care within their facility catchment area and beyond. As HCV dashboard development and implementation grows across the VHA, there is a need to pair clinical and technological advancements with greater patient outreach and shared best practices. Understanding the factors that tie improved quality of care with usability as well as investment in dashboard development and related efforts will likely keep the VHA in the forefront of chronic care delivery.
Author disclosures
The authors report no actual or potential conflicts of interest with regard to this article.
Disclaimer
The opinions expressed herein are those of the authors and do not necessarily reflect those of Federal Practitioner, Frontline Medical Communications Inc., the U.S. Government, or any of its agencies. This article may discuss unlabeled or investigational use of certain drugs. Please review complete prescribing information for specific drugs or drug combinations—including indications, contraindications, warnings, and adverse effects—before administering pharmacologic therapy to patients.
1. Dominitz JA, Boyko EJ, Koepsell TD, et al. Elevated prevalence of hepatitis C infection in users of United States veterans medical centers. Hepatology. 2005;41(1):88-96.
2. United States Department of Veterans Affairs. HCV Viremic Veterans in VHA Care in 2013 with First Fill in the Year or Ever Filled a VHA Outpatient Prescription for a HCV Antiviral Medication for the Nation, by VISN and by Station Description. http://vaww.hepatitis.va.gov/data-reports/ccr2013/RegMed-AnyFirstEverInCare-Jan14-HCVVir-HCV-2013-All.asp. Accessed October 10, 2014.
3. Rongey C, Shen H, Hamilton N, Backus LI, Asch SM, Knight S. Impact of rural residence and health system structure on quality of liver care. PloS One. 2013;8(12):e84826.
4. Beste LA, Ioannou GN. Prevalence and Treatment of Chronic Hepatitis C Virus Infection in the U.S. Department of Veterans Affairs [published online ahead of print January 19, 2015]. Epidemiologic Reviews. doi: 10.1093/epirev/mxu002.
5. Lawitz E, Poordad FF, Pang PS, et al. Sofosbuvir and ledipasvir fixed-dose combination with and without ribavirin in treatment-naive and previously treated patients with genotype 1 hepatitis C virus infection (LONESTAR): an openlabel, randomised, phase 2 trial [published correction appears in Lancet. 2014;383(9920):870]. Lancet. 2014;383(9916):515-523.
6. United States Department of Veterans Affairs. HCV Viremic Veterans in VHA Care in 2013 who had a VHA Diagnosis of Fibrosis/Cirrhosis by FIB-4 in the year for the Nation, by VISN and by Station. http://vaww.hepatitis.va.gov/data-reports/ccr2013/Cond-FIB4CurInCare-Jan14HCVVir-2013-All.asp. Accessed October 10, 2014.
7. Kanwal F, Hoang T, Kramer JR, et al. Increasing prevalence of HCC and cirrhosis in patients with chronic hepatitis C virus infection. Gastroenterology. 2011;140(4):1182-1188.e1.
8. Furukawa MF, King J, Patel V, Hsiao CJ, Adler-Milstein J, Jha AK. Despite substantial progress in EHR adoption, health information exchange and patient engagement remain low in office settings. Health Aff (Millwood). 2014;33(9):1672-1679.
9. Vrieze SI, Docherty A, Thuras P, et al. Best practices: The electronic medical record is an invaluable clinical tool: Let’s start using it. Psychiatric Serv. 2013;64(10):946-949.
10. Vallet-Pichard A, Mallet V, Nalpas B, et al. FIB-4: An inexpensive and accurate marker of fibrosis in HCV infection. Comparison with liver biopsy and fibrotest. Hepatology. 2007;46(1):32-36.
11. Kamath PS, Kim WR; Advanced Liver Disease Study Group. The model for endstage liver disease (MELD). Hepatology. 2007;45(3):797-805.
12. Goldberg L, Lide B, Lowry S, et al. Usability and accessibility in consumer health informatics current trends and future challenges. Am J Prev Med. 2011;40(5 suppl 2):S187-S197.
13. Schumacher RM, Lowry SZ; National Institute of Standards and Technology. NIST Guide to the Processes Approach for Improving the Usability of Electronic Health Records. http://www.nist.gov/itl/hit/upload/Guide_Final_Publication_Version.pdf. Published November 29, 2010. Accessed November 24, 2014.