User login
A high proportion of SARS-CoV-2–infected university students are asymptomatic
Many individuals infected with SARS-CoV-2 never become symptomatic. In a South Korean study, these infected individuals remained asymptomatic for a prolonged period while maintaining the same viral load as symptomatic patients, suggesting that they are just as infectious.1 A narrative review found high rates of asymptomatic disease in several younger populations, including women in an obstetric ward (88%), the crew of an aircraft carrier (58%), and prisoners (96%).2 However, there is no published research on the percentage of university students who are asymptomatic.
Methods
The University of Georgia (UGA) began classes on August 20, 2020. Shortly before the beginning of classes, UGA implemented a surveillance program for asymptomatic students, faculty, and staff, testing 300 to 450 people per day. Initially, during Weeks 1 and 2 of data collection, anyone could choose to be tested. In Weeks 3 and 4, students, faculty, and staff were randomly invited to participate.
Over the 4-week period beginning on August 17, we calculated the percent of positive cases in surveillance testing and applied this percentage to the entire UGA student population (n = 38,920) to estimate the total number of asymptomatic COVID-19 students each week.3 Data for symptomatic cases were also reported by the university on a weekly basis. This included positive tests from the University Health Center, as well as voluntary reporting using a smartphone app from other sites.
Positive tests in symptomatic individuals were not stratified by student vs nonstudent until Week 3; students comprised 95% of positive symptomatic reports in Week 3 and 99% in Week 4, so we conservatively estimated that 95% of symptomatic cases in Weeks 1 and 2 were students. These data were used to estimate the percentage of SARS-CoV-2–positive students who were asymptomatic.
Results
Our results are summarized in the table. The percentage of asymptomatic students testing positive in surveillance testing was 3.4% in Week 1 and rose steadily to 9% by Week 4. We estimated that there were 1303 asymptomatic cases among students in Week 1, increasing to 3487 asymptomatic positive students on campus by Week 4. The estimated percentage of asymptomatic students infected with SARS-CoV-2 ranged from 73% to 92.5% by week and was 81.1% overall.

Discussion
During the reporting period from August 17 to September 13, the 7-day moving average of new cases in Clarke County (home of UGA) increased from 30 to 83 per 100,000 persons/day (https://dph.georgia.gov/covid-19-daily-status-report). During this period, there were large increases in the number of infected students, more than 80% of whom were asymptomatic. With the assumption that anyone could be infected even if asymptomatic, these numbers highlight the importance for infection control to prevent potential spread within a community by taking universal precautions such as wearing a mask, following physical distancing guidelines, and handwashing.
Limitations. First, reporting of positive tests in symptomatic individuals is highly encouraged but not required. The large drop in symptomatic positive test reports between Weeks 3 and 4, with no change in test positivity in surveillance of asymptomatic students (8.9% vs 9%), suggests that students may have chosen to be tested elsewhere in conjunction with evaluation of their symptoms and/or not reported positive tests, possibly to avoid mandatory isolation and other restrictions on their activities. Further evidence to support no change in actual infection rates comes from testing for virus in wastewater, which also remained unchanged.4
Continue to: Second, each week's surveillance...
Second, each week’s surveillance population is not a true random sample, so extrapolating this estimate to the full student population could over- or undercount asymptomatic cases depending on the direction of bias (ie, healthy volunteer bias vs test avoidance by those with high-risk behaviors).
Finally, some students who were positive in surveillance testing may have been presymptomatic, rather than asymptomatic.
In conclusion, we estimate that approximately 80% of students infected with SARS-CoV-2 are asymptomatic. This is consistent with other studies in young adult populations.2
Mark H. Ebell, MD, MS
Cassie Chupp, MPH
Michelle Bentivegna, MPH
Department of Epidemiology and Biostatistics, College of Public Health, University of Georgia, Athens
ebell@uga.edu
The authors reported no potential conflict of interest relevant to this article.
1. Lee S, Kim T, Lee E, et al. Clinical course and molecular viral shedding among asymptomatic and symptomatic patients with SARS-CoV-2 infection in a community treatment center in the Republic of Korea [published online ahead of print August 6, 2020]. JAMA Intern Med. doi:10.1001/jamainternmed.2020.3862
2. Oran DP, Topol EJ. Prevalence of asymptomatic SARS-CoV-2 infection : a narrative review. Ann Intern Med. 2020;173:362-367.
3. UGA by the Numbers. University of Georgia Web site. www.uga.edu/facts.php. Updated August 2020. Accessed October 20, 2020.
4. Lott M, Norfolk W, Robertson M, et al. Wastewater surveillance for SARS-CoV-2 in Athens, GA. COVID-19 Portal: Center for the Ecology of Infectious Diseases, University of Georgia Web site. www.covid19.uga.edu/wastewater-athens.html. Updated October 15, 2020. Accessed October 20, 2020.
Many individuals infected with SARS-CoV-2 never become symptomatic. In a South Korean study, these infected individuals remained asymptomatic for a prolonged period while maintaining the same viral load as symptomatic patients, suggesting that they are just as infectious.1 A narrative review found high rates of asymptomatic disease in several younger populations, including women in an obstetric ward (88%), the crew of an aircraft carrier (58%), and prisoners (96%).2 However, there is no published research on the percentage of university students who are asymptomatic.
Methods
The University of Georgia (UGA) began classes on August 20, 2020. Shortly before the beginning of classes, UGA implemented a surveillance program for asymptomatic students, faculty, and staff, testing 300 to 450 people per day. Initially, during Weeks 1 and 2 of data collection, anyone could choose to be tested. In Weeks 3 and 4, students, faculty, and staff were randomly invited to participate.
Over the 4-week period beginning on August 17, we calculated the percent of positive cases in surveillance testing and applied this percentage to the entire UGA student population (n = 38,920) to estimate the total number of asymptomatic COVID-19 students each week.3 Data for symptomatic cases were also reported by the university on a weekly basis. This included positive tests from the University Health Center, as well as voluntary reporting using a smartphone app from other sites.
Positive tests in symptomatic individuals were not stratified by student vs nonstudent until Week 3; students comprised 95% of positive symptomatic reports in Week 3 and 99% in Week 4, so we conservatively estimated that 95% of symptomatic cases in Weeks 1 and 2 were students. These data were used to estimate the percentage of SARS-CoV-2–positive students who were asymptomatic.
Results
Our results are summarized in the table. The percentage of asymptomatic students testing positive in surveillance testing was 3.4% in Week 1 and rose steadily to 9% by Week 4. We estimated that there were 1303 asymptomatic cases among students in Week 1, increasing to 3487 asymptomatic positive students on campus by Week 4. The estimated percentage of asymptomatic students infected with SARS-CoV-2 ranged from 73% to 92.5% by week and was 81.1% overall.
Discussion
During the reporting period from August 17 to September 13, the 7-day moving average of new cases in Clarke County (home of UGA) increased from 30 to 83 per 100,000 persons/day (https://dph.georgia.gov/covid-19-daily-status-report). During this period, there were large increases in the number of infected students, more than 80% of whom were asymptomatic. With the assumption that anyone could be infected even if asymptomatic, these numbers highlight the importance for infection control to prevent potential spread within a community by taking universal precautions such as wearing a mask, following physical distancing guidelines, and handwashing.
Limitations. First, reporting of positive tests in symptomatic individuals is highly encouraged but not required. The large drop in symptomatic positive test reports between Weeks 3 and 4, with no change in test positivity in surveillance of asymptomatic students (8.9% vs 9%), suggests that students may have chosen to be tested elsewhere in conjunction with evaluation of their symptoms and/or not reported positive tests, possibly to avoid mandatory isolation and other restrictions on their activities. Further evidence to support no change in actual infection rates comes from testing for virus in wastewater, which also remained unchanged.4
Continue to: Second, each week's surveillance...
Second, each week’s surveillance population is not a true random sample, so extrapolating this estimate to the full student population could over- or undercount asymptomatic cases depending on the direction of bias (ie, healthy volunteer bias vs test avoidance by those with high-risk behaviors).
Finally, some students who were positive in surveillance testing may have been presymptomatic, rather than asymptomatic.
In conclusion, we estimate that approximately 80% of students infected with SARS-CoV-2 are asymptomatic. This is consistent with other studies in young adult populations.2
Mark H. Ebell, MD, MS
Cassie Chupp, MPH
Michelle Bentivegna, MPH
Department of Epidemiology and Biostatistics, College of Public Health, University of Georgia, Athens
ebell@uga.edu
The authors reported no potential conflict of interest relevant to this article.
1. Lee S, Kim T, Lee E, et al. Clinical course and molecular viral shedding among asymptomatic and symptomatic patients with SARS-CoV-2 infection in a community treatment center in the Republic of Korea [published online ahead of print August 6, 2020]. JAMA Intern Med. doi:10.1001/jamainternmed.2020.3862
2. Oran DP, Topol EJ. Prevalence of asymptomatic SARS-CoV-2 infection : a narrative review. Ann Intern Med. 2020;173:362-367.
3. UGA by the Numbers. University of Georgia Web site. www.uga.edu/facts.php. Updated August 2020. Accessed October 20, 2020.
4. Lott M, Norfolk W, Robertson M, et al. Wastewater surveillance for SARS-CoV-2 in Athens, GA. COVID-19 Portal: Center for the Ecology of Infectious Diseases, University of Georgia Web site. www.covid19.uga.edu/wastewater-athens.html. Updated October 15, 2020. Accessed October 20, 2020.

Intensive Glucose Control in Type 2 Diabetes Mellitus Reduces CV Events, but Not Mortality, After 10 Years
Clinical question: Are there long-term benefits to more intensive glycemic control in patients with type 2 diabetes mellitus?
Bottom line: After approximately 10 years of follow-up, this study found 1 fewer cardiovascular event per 116 person-years among a group of patients (97% men) randomized to receive tight glycemic control, but found no reduction in mortality. This result must be balanced against the results from other trials, which saw a mixed bag of benefits and harms with long-term follow-up. It is important to note that even the intensive glycemic control group had a mean hemoglobin A1c of 6.9%, not 6% or 6.5% as some guidelines advocate.
Reference: Hayward RA, Reaven PD, Wiitala WL, et al, for the VADT Investigators. Follow-up of glycemic control and cardiovascular outcomes in type 2 diabetes. N Engl J Med 2015;372(23):2197-2206.
Study design: Cohort (prospective); (LOE: 2b)
Setting: Outpatient (any)
Synopsis: The Veteran's Affairs Diabetes Trial (VADT) originally randomized 1791 veterans with type 2 diabetes mellitus to receive intensive or usual glycemic control, and achieved mean hemoglobin A1C levels of 6.9% and 8.4%, respectively, after a median of 5.6 years. The original trial found a nonsignificant trend toward fewer cardiovascular events in the intensive therapy group, but no change in mortality. Two other large, similar trials reported similar findings, although one found increased mortality in the intensive glycemic control group. Follow-up studies for these 2 other trials have had mixed results, one finding increased mortality and no change in events, with the other finding fewer events but no change in mortality.
The current study linked patients in the original VADT to national disease registries (92% of participants) and also to regular record reviews and surveys (77% agreed to participte). The median follow-up was 9.8 years for cardiovascular events and 11.8 years for assessment of total mortality. They found a small but statistically significant reduction in the primary combined outcome of myocardial infarction , stroke, new or worsening heart failure, cardiovascular death, or amputation (44.1 vs 52.7 per 1000 person-years; P = .04). There was no significant difference between groups in the likelihood of cardiovascular death or all-cause mortality. The greatest contribution to the reduction in cardiovascular events was fewer nonfatal myocardial infarctions.
Mark H. Ebell, MD, MS, is an associate professor at the University of Georgia in Athens, editor-in-chief of Essential Evidence, and deputy editor of the American Family Physician journal.
Simplifying the language of evidence to improve patient care
- Several taxonomies exist for rating individual studies and the strength of recommendations, making the analysis of evidence confusing for practitioners.
- A new grading scale—the Strength of Recommendation Taxonomy (SORT)—will be used by several family medicine and primary care journals (required or optional), allowing readers to learn 1 consistently applied taxonomy of evidence.
- SORT is built around the information mastery framework, which emphasizes the use of patient-oriented outcomes that measure changes in morbidity or mortality. Levels of evidence from 1 to 3 for individual studies also are defined.
- An A-level recommendation is based on consistent and good-quality patient-oriented evidence; a B-level recommendation is based on inconsistent or limited-quality patient-oriented evidence; and a C-level recommendation is based on consensus, usual practice, opinion, disease-oriented evidence, or case series for studies of diagnosis, treatment, prevention, or screening.
Review articles (or overviews) are highly valued by physicians as a way to keep up-to-date with the medical literature. Sometimes though, these articles are based more on the authors’ personal experience, or anecdotes, or incomplete surveys of the literature than on a comprehensive collection of the best available evidence. To improve the quality of review articles, there is an ongoing effort in the medical publishing field to use more explicit grading of the strength of evidence on which recommendations are based.1-4
Making evidence easier to understand
Several journals, including American Family Physician and Journal of Family Practice, have adopted evidence-grading scales that are used in particular articles. Other organizations and publications have also developed evidence-grading scales. The diversity of these scales can be confusing for readers. More than 100 grading scales are in use by various medical publications.5 A level B recommendation in 1 journal may not mean the same thing in another. Even within 1 issue of a journal, evidence-grading scales often vary among the articles. Journal readers do not have the time, energy, or interest to interpret multiple grading scales, and more complex scales are difficult to integrate into daily practice.
Therefore the editors of the US family medicine and primary care journals (ie, American Family Physician, Family Medicine, Journal of Family Practice, Journal of the American Board of Family Practice, and BMJ-USA) and the Family Practice Inquiries Network (FPIN) came together to develop a unified taxonomy for the strength of recommendations based on a body of evidence. The new taxonomy should fulfill several objectives:
- Be uniform in most family medicine journals and electronic databases
- Allow authors to evaluate the strength of recommendation of a body of evidence
- Allow authors to rate the level of evidence for an individual study
- Be comprehensive and allow authors to evaluate studies of screening, diagnosis, therapy, prevention, and prognosis
- Be easy to use and not too time-consuming for authors, reviewers, and editors who may be content experts but not experts in critical appraisal or clinical epidemiology
- Be straightforward enough that primary care physicians can readily integrate the recommendations into daily practice.
Defining terms of evidence
A number of relevant terms must be defined for clarification.
Disease-oriented outcomes. These outcomes include intermediate, histopathologic, physiologic, or surrogate results (eg, blood sugar, blood pressure, flow rate, coronary plaque thickness) that may or may not reflect improvements in patient outcomes.
Patient-oriented outcomes. These are outcomes that matter to patients and help them live longer or better lives, including reduced morbidity, mortality, or symptoms, improved quality of life, or lower cost.
Level of evidence. The validity of an individual study is based on an assessment of its study design. According to some methodologies,6 levels of evidence can refer not only to individual studies but also to the quality of evidence from multiple studies about a specific question or the quality of evidence supporting a clinical intervention. For simplicity and consistency in this proposal, we use the term level of evidence to refer to individual studies.
Strength of recommendation. The strength (or grade) of a recommendation for clinical practice is based on a body of evidence (typically more than 1 study). This approach takes into account the level of evidence of individual studies, the type of outcomes measured by these studies (patient-oriented or disease-oriented), the number, consistency, and coherence of the evidence as a whole, and the relationship between benefits, harms, and costs.
Practice guideline (evidence-based). These guidelines are recommendations for practice that involve a comprehensive search of the literature, an evaluation of the quality of individual studies, and recommendation grades that reflect the quality of the supporting evidence. All search, critical appraisal, and grading methods should be described explicitly and be replicable by similarly skilled authors.
Practice guideline (consensus). Consensus guidelines are recommendations for practice based on expert opinions that typically do not include a systematic search, an assessment of the quality of individual studies, or a system to label the strength of recommendations explicitly.
Research evidence. This evidence is presented in publications of original research, involving collection of original data or the systematic review of other original research publications. It does not include editorials, opinion pieces, or review articles (other than systematic reviews or meta-analyses).
Review article. A nonsystematic overview of a topic is a review article. In most cases, it is not based on an exhaustive, structured review of the literature and does not evaluate the quality of included studies systematically.
Systematic reviews and meta-analyses. A systematic review is a critical assessment of existing evidence that addresses a focused clinical question, includes a comprehensive literature search, appraises the quality of studies, and reports results in a systematic manner. If the studies report comparable quantitative data and have a low degree of variation in their findings, a meta-analysis can be performed to derive a summary estimate of effect.
Most strength-of-evidence scales lack key elements
In March 2002, the Agency for Healthcare Research and Quality (AHRQ) published a report that summarized the state-of-the-art in methods of rating the strength of evidence.5 The report identified a large number of systems for rating the quality of individual studies: 20 for systematic reviews, 49 for randomized controlled trials, 19 for observational studies, and 18 for diagnostic test studies. It also identified 40 scales that graded the strength of a body of evidence consisting of 1 or more studies.
The authors of the AHRQ report proposed that any system for grading the strength of evidence should consider 3 key elements: quality, quantity, and consistency. Quality is the extent to which the identified studies minimize the opportunity for bias and is synonymous with the concept of validity. Quantity is the number of studies and subjects included in those studies. Consistency is the extent to which findings are similar between different studies on the same topic. Only 7 of the 40 systems identified and addressed all 3 elements.6-11
Strength of Recommendation Taxonomy (SORT) contains the key elements
The authors of this article represent the major family medicine journals in the United States and a large family practice academic consortium. Our process began with a series of electronic mail exchanges, was developed during a meeting of the editors, and continued through another series of electronic mail exchanges.
We decided our taxonomy for rating the strength of a recommendation should address the 3 key elements identified in the AHRQ report: quality, quantity, and consistency of evidence. We also were committed to creating a grading scale that could be applied by authors with varying degrees of expertise in evidence-based medicine and clinical epidemiology, and interpreted by physicians with little or no formal training in these areas. We believed that the taxonomy should address the issue of patientoriented evidence versus disease-oriented evidence explicitly and be consistent with the information mastery framework proposed by Slawson and Shaughnessy.2
After considering these criteria and reviewing the existing taxonomies for grading the strength of a recommendation, we decided that a new taxonomy was needed to reflect the needs of our specialty. Existing grading scales were focused on a particular kind of study (ie, prevention or treatment), were too complex, or did not take into account the type of outcome.
Our proposed taxonomy is called the Strength of Recommendations Taxonomy (SORT), and it is shown in Table 1. The taxonomy includes ratings of A, B, or C for the strength of recommendation for a body of evidence. The taxonomy also explains whether a body of evidence represents good-quality or limited-quality evidence, and whether evidence is consistent or inconsistent. The quality of individual studies is rated 1, 2, or 3; numbers are used to distinguish ratings of individual studies from the letters A, B, and C used to evaluate the strength of a recommendation based on a body of evidence. Figure 1 provides information about how to determine the strength of recommendation for management recommendations, and Figure 2 explains how to determine the level of evidence for an individual study. These 2 algorithms should be helpful to authors preparing papers for submission to family medicine journals. The algorithms are to be considered general guidelines, and special circumstances may dictate assignment of a different strength of recommendation (eg, a single, large, well-designed study in a diverse population may warrant an A-level recommendation).
Recommendations based only on improvements in surrogate or disease-oriented outcomes are always categorized as level C, because improvements in disease-oriented outcomes are not always associated with improve-ments in patient-oriented outcomes, as exemplified by several well-known findings from the medical literature. For example, doxazosin lowers blood pressure in African American patients—a seemingly beneficial outcome—but it also increases mortality.12 Similarly, encainide and flecainide reduce the incidence of arrhythmias after acute myocardial infarction, but they also increase mortality.13 Finasteride improves urinary flow rates, but it does not significantly improve urinary tract symptoms in patients with benign prostatic hypertrophy,14 while arthroscopic surgery for osteoarthritis of the knee improves the appearance of cartilage but does not reduce pain or improve joint function.15 Additional examples of clinical situations where disease-oriented evidence disagrees with patient—oriented evidence are shown in Table 2.12-24 Examples of how to apply the taxonomy are given in Table 3.
TABLE 1
How recommendations are graded for strength, and underlying individual studies are rated for quality
| In general, only key recommendations for readers require a grade of the “Strength of Recommendation.” Recommendations should be based on the highest quality evidence available. For example, vitamin E was found in some cohort studies (level 2 study quality) to have a benefit for cardiovascular protection, but good-quality randomized trials (level 1) have not confirmed this effect. Therefore, it is preferable to base clinical recommendations in a manuscript on the level 1 studies. | |||
| Strength of recommendation | Definition | ||
| A | Recommendation based on consistent and good-quality patient-oriented evidence.* | ||
| B | Recommendation based on inconsistent or limited-quality patient-oriented evidence.* | ||
| C | Recommendation based on consensus, usual practice, opinion, disease-oriented evidence,* or case series for studies of diagnosis, treatment, prevention, or screening | ||
| Use the following scheme to determine whether a study measuring patient-oriented outcomes is of good or limited quality, and whether the results are consistent or inconsistent between studies. | |||
| Study quality | Type of Study | ||
| Diagnosis | Treatment/prevention/screening | Prognosis | |
| Level 1—good-quality patient-oriented evidence | Validated clinical decision rule | SR/meta-analysis of RCTs with consistent findings | SR/meta-analysis of good-quality cohort studies |
| SR/meta-analysis of high-quality studies | High-quality individual RCT‡ All-or-none study§ | Prospective cohort study with good follow-up | |
| High-quality diagnostic cohort study† | |||
| Level 2—limited-quality patient-oriented evidence | Unvalidated clinical decision rule | SR/meta-analysis lower-quality clinical trials or of studies with inconsistent findings | SR/meta-analysis of lower-quality cohort studies or with inconsistent results |
| SR/meta-analysis of lower-quality studies or studies with inconsistent findings | Lower-quality clinical trial‡ or prospective cohort study Cohort study | Retrospective cohort study with poor follow-up | |
| Lower-quality diagnostic cohort study or diagnostic case-control study§ | Case-control study | Case-control study Case series | |
| Level 3—other evidence | Consensus guidelines, extrapolations from bench research, usual practice, opinion, other evidence disease-oriented evidence (intermediate or physiologic outcomes only), or case series for studies of diagnosis, treatment, prevention, or screening | ||
| Consistency across studies | |||
| Consistent | Most studies found similar or at least coherent conclusions (coherence means that differences are explainable); or If high-quality and up-to-date systematic reviews or meta-analyses exist, they support the recommendation | ||
| Inconsistent | Considerable variation among study findings and lack of coherence; or If high-quality and up-to-date systematic reviews or meta-analyses exist, they do not find consistent evidence in favor of the recommendation | ||
| *Patient-oriented evidence measures outcomes that matter to patients: morbidity, mortality, symptom improvement, cost reduction, and quality of life. Disease-oriented evidence measures intermediate, physiologic, or surrogate end points that may or may not reflect improvements in patient outcomes (ie, blood pressure, blood chemistry, physiologic function, and pathologic findings). | |||
| † High-quality diagnostic cohort study: cohort design, adequate size, adequate spectrum of patients, blinding, and a consistent, well-defined reference standard. | |||
| ‡ High-quality RCT: allocation concealed, blinding if possible, intention-to-treat analysis, adequate statistical power, adequate follow-up (greater than 80 percent). | |||
| § In an all-or-none study, the treatment causes a dramatic change in outcomes, such as antibiotics for meningitis or surgery for appendicitis, which precludes study in a controlled trial. | |||
| SR, systematic review; RCT, randomized controlled trial | |||
TABLE 2
Examples of inconsistency between disease-oriented and patient-oriented outcomes
| Therapy | Disease-oriented outcome | Patient-oriented outcome |
|---|---|---|
| Doxazosin for blood pressure12 | Reduces blood pressure | Increases morality in African Americans |
| Lidocaine for arrhythmia following acute myocardial infarction13 | Suppresses arrhythmias | Increases mortality |
| Finasteride for benign prostatic hypertrophy14 | Improves urinary flow rate | No clinically important change in symptom scores |
| Sleeping infants on their stomach or side16 | Knowledge of anatomy and physiology suggests that this will decrease the risk of aspiration | Increases risk of sudden infant death syndrome |
| Vitamin E for heart disease17 | Reduces levels of free radicals | No change in mortality |
| Histamine antagonists and proton pump inhibitors for nonulcer dyspepsia18 | Significantly reduces gastric pH levels | Little or no improvement in symptoms in patients with non-gastroesophageal reflux disease, nonulcer dyspepsia |
| Arthroscopic surgery for osteoarthritis of the knee15 | Improves appearance of cartilage after debridement | No change in function or symptoms at 1 year |
| Hormone therapy19 | Reduces low-density lipoprotein cholesterol, increases high-density lipoprotein cholesterol | No decrease in cardiovascular or all-cause mortality; an increase in cardiovascular events in all-cause mortality; an increase in cardiovascular events in women older than 60 years (Women’s Health Initiative) with combined hormone therapy |
| Insulin therapy in type 2 diabetes mellitus20 | Keeps blood sugar below 120 mg/dL (6.7 mmol/l) | Does not reduce overall mortality |
| Sodium fluoride for fracture prevention21 | Increases bone density | Does not reduce fracture rate |
| Lidocaine prophylaxis following acute myocardial infarction22 | Suppresses arrhythmias | Increases mortality |
| Clofibrate for hyperlipidemia23 | Reduces lipids | Does not reduce mortality |
| Beta-blockers for heart failure24 | Reduces cardiac output | Reduces mortality in moderate to severe disease |
TABLE 3
Examples of how to apply the SORT in practice
| Example 1: While a number of observational studies (level of evidence—2) suggested a cardiovascular benefit from vitamin E, a large, well-designed, randomized trial with a diverse patient population (level of evidence—1) showed the opposite. The strength of recommendation against routine, long-term use of vitamin E to prevent heart disease, based on the best available evidence, should be A. |
| Example 2: A Cochrane review finds 7 clinical trials that are consistent in their support of a mechanical intervention for low back pain, but the trials were poorly designed (ie, unblinded, nonrandomized, or with allocation to groups unconcealed). In this case, the strength of recommendation in favor of these mechanical interventions is B (consistent but lower-quality clinical trials). |
| Example 3: A meta-analysis finds 9 high-quality clinical trials of the use of a new drug in the treatment of pulmonary fibrosis. Two of the studies find harm, 2 find no benefit, and 5 show some benefit. The strength of recommendation in favor of this drug would be B (inconsistent results of good-quality, randomized controlled trials). |
| Example 4: A new drug increases the forced expiratory volume in 1 second (FEV1) and peak flow rate in patients with an acute asthma exacerbation. Data on symptom improvement is lacking. The strength of recommendation in favor of using this drug is C (disease-oriented evidence only). |
FIGURE 1
Determining the strength of a recommendation based on a body of evidence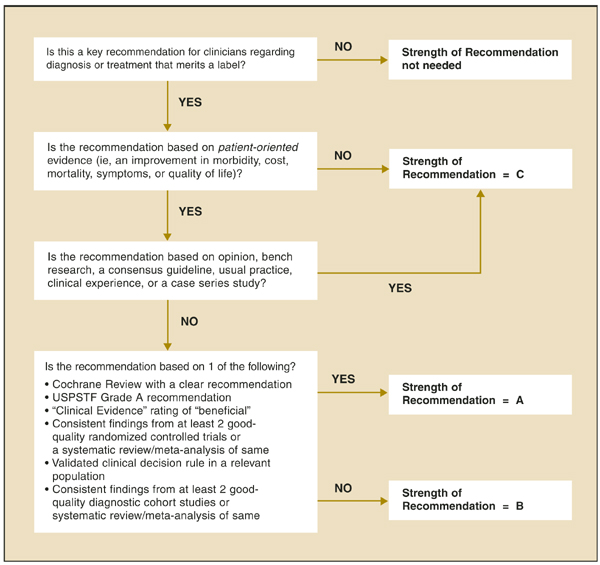
FIGURE 2
Determining the level of evidence for an individual study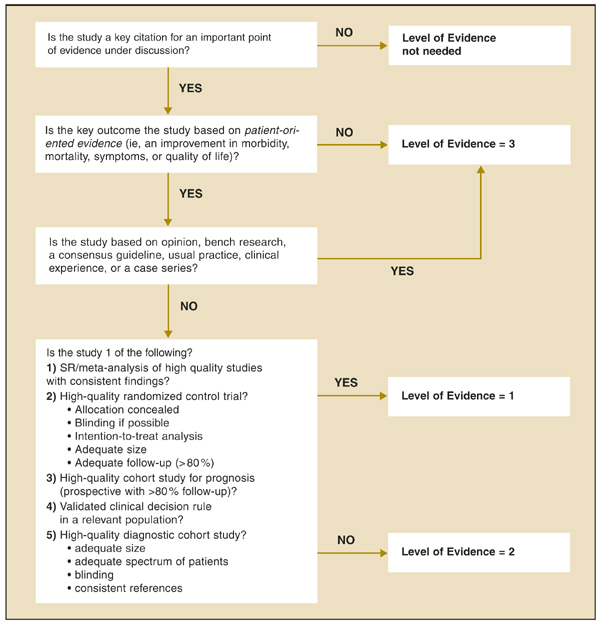
The advantages of SORT
We believe there are several advantages to our proposed taxonomy. It is straightforward and comprehensive, is easily applied by authors and physicians, and explicitly addresses the issue of patient-oriented versus disease-oriented evidence. The latter attribute distinguishes SORT from most other evidence grading scales. These strengths also create some limitations. Some clinicians may be concerned that the taxonomy is not as detailed in its assessment of study designs as others, such as that of the Centre for Evidence-Based Medicine (CEBM).25 However, the primary difference between the 2 taxonomies is that the CEBM version distinguishes between good and poor observational studies while the SORT version does not. We concluded that the advantages of a system that provides the physician with a clear recommendation that is strong (A), moderate (B), or weak (C) in its support of a particular intervention outweighs the theoretic benefit of distinguishing between lower quality and higher quality observational studies, particularly because there is no objective evidence that the latter distinction carries important differences in clinical recommendations.
Any publication applying SORT (or any other evidence-based taxonomy) should describe carefully the search process that preceded the assignment of a SORT rating. For example, authors could perform a comprehensive search of MEDLINE and the gray literature, a comprehensive search of MEDLINE alone, or a more focused search of MEDLINE plus secondary evidence-based sources of information.
Walkovers: Creating linkages with SORT
Some organizations, such as the CEBM,25 the Cochrane Collaboration,7 and the US Preventive Services Task Force (USPSTF),6 have developed their own grading scales for the strength of recommendations based on a body of evidence and are unlikely to abandon them. Other organizations, such as FPIN,26 publish their work in a variety of settings and must be able to move between taxonomies. We have developed a set of optional walkovers that suggest how authors, editors, and readers might move from 1 taxonomy to another. Walkovers for the CEBM and USPSTF taxonomies are shown in Table 4.
Many authors and experts in evidence-based medicine use the “Level of Evidence” taxonomy from the CEBM to rate the quality of individual studies.25 A walkover from the 5-level CEBM scale to the simpler 3-level SORT scale for individual studies is shown in Table 5.
TABLE 4
Suggested walkovers between taxonomies for assessing the strength of a recommendation based on a body of evidence
| SORT | CEBM | BMJ’s Clinical Evidence |
|---|---|---|
| A. Recommendation based on consistent and good-quality patient-oriented evidence | A. Consistent level 1 studies | Beneficial |
| B. Recommendation based on inconsistent or limited-quality patient-oriented evidence | B. Consistent level 2 or 3 studies or extrapolations from level 1 studies | Likely to be beneficial Likely to be ineffective or harmful (recommendation against) |
| C. Level 4 studies or extrapola-tions from level 2 or 3 studies | Unlikely to be beneficial (recommendation against) | |
| C. Recommendation based on consensus, usual practice, disease-oriented evidence, case series for studies of treatment or screening, and/on opinion | D. Level 5 evidence or troublingly inconsistent inconclusive studies of of any level | Unknown effectiveness |
| SORT, Strength of Evidence Taxonomy; CEBM, Centre for Evidence-Based Medicine; BMJ, BMJ Publishing Group. | ||
TABLE 5
Suggested walkover between CEBM and SORT for assessing the level of evidence of an individual study
| SORT | CEBM | |
|---|---|---|
| Treatment/screening | Other categories | |
| Level 1 | Levels 1a to 1c | Levels 1a to 1c |
| Level 2 | Level 2 or 3 | Levels 2 to 4 |
| Level 3 | Level 4 or 5 and any study that measures measures intermediate or surrogate outcomes | Level 5 andany study that intermediate or surrogate outcomes |
| CEBM, Centre for Evidence-Based Medicine; | ||
| SORT, Strength of Recommendation Taxonomy | ||
SORT can improve patient care
The SORT is a comprehensive taxonomy for evaluating the strength of a recommendation based on a body of evidence and the quality of an individual study. If applied consistently by authors and editors in the family medicine literature, it has the potential to make it easier for physicians to apply the results of research in their practice through the information mastery approach and to incorporate evidence-based medicine into their patient care.
Like any such grading scale, it is a work in progress. As we learn more about biases in study design, and as the authors and readers who use the taxonomy become more sophisticated about principles of information mastery, evidence-based medicine, and critical appraisal, it is likely to evolve. We remain open to suggestions from the primary care community for refining and improving SORT.
Acknowledgments
The authors thank Lee Green, MD, MPH, John Epling, MD, Kurt Stange, MD, PhD, and Margaret Gourlay, MD, for helpful comments on the manuscript. The authors indicate that they do not have any conflicts of interest. Sources of funding: none reported. This article has been simultaneously published in print and online by American Family Physician, Journal of Family Practice, Journal of the American Board of Family Practice, and online by Family Practice Inquiries Network. Copyright © 2004 American Family Physician, a publication of the American Academy of Family Physicians. All rights reserved.
1. Evidence-based medicine . A new approach to teaching the practice of medicine. JAMA 1992;268:2420-2425.
2. Slawson DC, Shaughnessy AF, Bennett JH. Becoming a medical information master: feeling good about not knowing everything. J Fam Pract 1994;38:505-513.
3. Shaughnessy AF, Slawson DC, Bennett JH. Becoming an information master: a guidebook to the medical information jungle. J Fam Pract 1994;39:489-499.
4. Siwek J, Gourlay ML, Slawson DC, Shaughnessy AF. How to write an evidence-based clinical review article. Am Fam Physician 2002;65:251-258.
5. Systems to rate the strength of scientific evidence. Summary, evidence report/technology assessment: number 47. AHRQ pub. no. 02-E015, March 2002. Agency for Healthcare Research and Quality, Rockville, Md. Available at: www.ahrq.gov/clinic/epcsums/strengthsum.htm. Accessed on November 13, 2003.
6. Harris RP, Helfand M, Woolf SH, Lohr KN, Mulrow CD, Teutsch SM, et al. Current methods of the U.S. Preventive Services Task Force: a review of the process. Am J Prev Med 2001;20(3 suppl):21-35.
7. Clarke M, Oxman AD. Cochrane reviewer’s handbook 4.0. The Cochrane Collaboration, 2003. Available at: www.cochrane.org/resources/handbook/handbook.pdf. Accessed on November 13, 2003.
8. Gyorkos TW, Tannenbaum TN, Abrahamowicz M, Oxman AD, Scott EA, Millson ME, et al. An approach to the development of practice guidelines for community health interventions. Can J Public Health 1994;85(suppl 1):S8-S13.
9. Briss PA, Zaza S, Pappaioanou M, et al. Developing an evidence-based guide to community preventive services—methods. Am J Prev Med 2000;18(1 suppl):35-43.
10. Greer N, Mosser G, Logan G, Halaas GW. A practical approach to evidence grading. Jt Comm J Qual Improv 2000;26:700-712.
11. Guyatt GH, Haynes RB, Jaeschke RZ, et al. Users’ guides to the medical literature: XXV. Evidence-based medicine: principles for applying the users’ guides to patient care. JAMA 2000;284:1290-1296.
12. Major cardiovascular events in hypertensive patients randomized to doxazosin vs chlorthalidone: the antihypertensive and lipid-lowering treatment to prevent heart attack trial (ALLHAT) JAMA 2000;283:1967-1975.
13. Echt DS, Liebson PR, Mitchell LB, et al. Mortality and morbidity in patients receiving encainide, flecainide, or placebo. N Engl J Med 1991;324:781-788.
14. Lepor H, Williford WO, Barry MJ, et al. The efficacy of terazosin, finasteride, or both in benign prostatic hyperplasia. N Engl J Med 1996;335:533-539.
15. Moseley JB, O’Malley K, Petersen NJ, et al. A controlled trial of arthroscopic surgery for osteoarthritis of the knee. N Engl J Med 2002;347:81-88.
16. Dwyer T, Ponsonby AL. Sudden infant death syndrome: after the “back to sleep” campaign. BMJ 1996;313:180-181.
17. Yusuf S, Dagenais G, Pogue J, Bosch J, Sleight P. Vitamin E supplementation and cardiovascular events in high-risk patients. N Engl J Med 2000;342:154-160.
18. Moayyedi P, Soo S, Deeks J, Delaney B, Innes M, Forman D. Pharmacological interventions for non-ulcer dyspepsia. Cochrane Database Syst Rev 2003;(1):CD001960.-
19. Rossouw JE, Anderson GL, Prentice RL, et al. Risks and benefits of estrogen plus progestin in healthy postmenopausal women: principal results from the Women’s Health Initiative randomized controlled trial. JAMA 2002;288:321-333.
20. Intensive blood-glucose control with sulphonylureas or insulin compared with conventional treatment and risk of complications in patients with type 2 diabetes (UKPDS 33). Lancet 1998;352:837-853.
21. Meunier PJ, Sebert JL, Reginster JY, et al. Fluoride salts are no better at preventing new vertebral fractures than calcium-vitamin D in postmenopausal osteoporosis: the FAVO Study. Osteoporos Int 1998;8:4-12.
22. MacMahon S, Collins R, Peto R, Koster RW, Yusuf S. Effects of prophylactic lidocaine in suspected acute myocardial infarction. An overview of results from the randomized, controlled trials. JAMA 1988;260:1910-1916.
23. Grumbach K. How effective is drug treatment of hypercholesterolemia? A guided tour of the major clinical trials for the primary care physician. J Am Board Fam Pract 1991;4:437-445.
24. Heidenreich PA, Lee TT, Massie BM. Effect of beta-blockade on mortality in patients with heart failure: a metaanalysis of randomized clinical trials. J Am Coll Cardiol 1997;30:27-34.
25. Centre for Evidence-Based Medicine. Levels of evidence and grades of recommendation. Available at: www.cebm.net/levels_of_evidence.asp. Accessed on November 13, 2003.
26. Family Practice Inquiries Network. (FPIN). Available at: www.fpin.org. Accessed on November 13, 2003.
- Several taxonomies exist for rating individual studies and the strength of recommendations, making the analysis of evidence confusing for practitioners.
- A new grading scale—the Strength of Recommendation Taxonomy (SORT)—will be used by several family medicine and primary care journals (required or optional), allowing readers to learn 1 consistently applied taxonomy of evidence.
- SORT is built around the information mastery framework, which emphasizes the use of patient-oriented outcomes that measure changes in morbidity or mortality. Levels of evidence from 1 to 3 for individual studies also are defined.
- An A-level recommendation is based on consistent and good-quality patient-oriented evidence; a B-level recommendation is based on inconsistent or limited-quality patient-oriented evidence; and a C-level recommendation is based on consensus, usual practice, opinion, disease-oriented evidence, or case series for studies of diagnosis, treatment, prevention, or screening.
Review articles (or overviews) are highly valued by physicians as a way to keep up-to-date with the medical literature. Sometimes though, these articles are based more on the authors’ personal experience, or anecdotes, or incomplete surveys of the literature than on a comprehensive collection of the best available evidence. To improve the quality of review articles, there is an ongoing effort in the medical publishing field to use more explicit grading of the strength of evidence on which recommendations are based.1-4
Making evidence easier to understand
Several journals, including American Family Physician and Journal of Family Practice, have adopted evidence-grading scales that are used in particular articles. Other organizations and publications have also developed evidence-grading scales. The diversity of these scales can be confusing for readers. More than 100 grading scales are in use by various medical publications.5 A level B recommendation in 1 journal may not mean the same thing in another. Even within 1 issue of a journal, evidence-grading scales often vary among the articles. Journal readers do not have the time, energy, or interest to interpret multiple grading scales, and more complex scales are difficult to integrate into daily practice.
Therefore the editors of the US family medicine and primary care journals (ie, American Family Physician, Family Medicine, Journal of Family Practice, Journal of the American Board of Family Practice, and BMJ-USA) and the Family Practice Inquiries Network (FPIN) came together to develop a unified taxonomy for the strength of recommendations based on a body of evidence. The new taxonomy should fulfill several objectives:
- Be uniform in most family medicine journals and electronic databases
- Allow authors to evaluate the strength of recommendation of a body of evidence
- Allow authors to rate the level of evidence for an individual study
- Be comprehensive and allow authors to evaluate studies of screening, diagnosis, therapy, prevention, and prognosis
- Be easy to use and not too time-consuming for authors, reviewers, and editors who may be content experts but not experts in critical appraisal or clinical epidemiology
- Be straightforward enough that primary care physicians can readily integrate the recommendations into daily practice.
Defining terms of evidence
A number of relevant terms must be defined for clarification.
Disease-oriented outcomes. These outcomes include intermediate, histopathologic, physiologic, or surrogate results (eg, blood sugar, blood pressure, flow rate, coronary plaque thickness) that may or may not reflect improvements in patient outcomes.
Patient-oriented outcomes. These are outcomes that matter to patients and help them live longer or better lives, including reduced morbidity, mortality, or symptoms, improved quality of life, or lower cost.
Level of evidence. The validity of an individual study is based on an assessment of its study design. According to some methodologies,6 levels of evidence can refer not only to individual studies but also to the quality of evidence from multiple studies about a specific question or the quality of evidence supporting a clinical intervention. For simplicity and consistency in this proposal, we use the term level of evidence to refer to individual studies.
Strength of recommendation. The strength (or grade) of a recommendation for clinical practice is based on a body of evidence (typically more than 1 study). This approach takes into account the level of evidence of individual studies, the type of outcomes measured by these studies (patient-oriented or disease-oriented), the number, consistency, and coherence of the evidence as a whole, and the relationship between benefits, harms, and costs.
Practice guideline (evidence-based). These guidelines are recommendations for practice that involve a comprehensive search of the literature, an evaluation of the quality of individual studies, and recommendation grades that reflect the quality of the supporting evidence. All search, critical appraisal, and grading methods should be described explicitly and be replicable by similarly skilled authors.
Practice guideline (consensus). Consensus guidelines are recommendations for practice based on expert opinions that typically do not include a systematic search, an assessment of the quality of individual studies, or a system to label the strength of recommendations explicitly.
Research evidence. This evidence is presented in publications of original research, involving collection of original data or the systematic review of other original research publications. It does not include editorials, opinion pieces, or review articles (other than systematic reviews or meta-analyses).
Review article. A nonsystematic overview of a topic is a review article. In most cases, it is not based on an exhaustive, structured review of the literature and does not evaluate the quality of included studies systematically.
Systematic reviews and meta-analyses. A systematic review is a critical assessment of existing evidence that addresses a focused clinical question, includes a comprehensive literature search, appraises the quality of studies, and reports results in a systematic manner. If the studies report comparable quantitative data and have a low degree of variation in their findings, a meta-analysis can be performed to derive a summary estimate of effect.
Most strength-of-evidence scales lack key elements
In March 2002, the Agency for Healthcare Research and Quality (AHRQ) published a report that summarized the state-of-the-art in methods of rating the strength of evidence.5 The report identified a large number of systems for rating the quality of individual studies: 20 for systematic reviews, 49 for randomized controlled trials, 19 for observational studies, and 18 for diagnostic test studies. It also identified 40 scales that graded the strength of a body of evidence consisting of 1 or more studies.
The authors of the AHRQ report proposed that any system for grading the strength of evidence should consider 3 key elements: quality, quantity, and consistency. Quality is the extent to which the identified studies minimize the opportunity for bias and is synonymous with the concept of validity. Quantity is the number of studies and subjects included in those studies. Consistency is the extent to which findings are similar between different studies on the same topic. Only 7 of the 40 systems identified and addressed all 3 elements.6-11
Strength of Recommendation Taxonomy (SORT) contains the key elements
The authors of this article represent the major family medicine journals in the United States and a large family practice academic consortium. Our process began with a series of electronic mail exchanges, was developed during a meeting of the editors, and continued through another series of electronic mail exchanges.
We decided our taxonomy for rating the strength of a recommendation should address the 3 key elements identified in the AHRQ report: quality, quantity, and consistency of evidence. We also were committed to creating a grading scale that could be applied by authors with varying degrees of expertise in evidence-based medicine and clinical epidemiology, and interpreted by physicians with little or no formal training in these areas. We believed that the taxonomy should address the issue of patientoriented evidence versus disease-oriented evidence explicitly and be consistent with the information mastery framework proposed by Slawson and Shaughnessy.2
After considering these criteria and reviewing the existing taxonomies for grading the strength of a recommendation, we decided that a new taxonomy was needed to reflect the needs of our specialty. Existing grading scales were focused on a particular kind of study (ie, prevention or treatment), were too complex, or did not take into account the type of outcome.
Our proposed taxonomy is called the Strength of Recommendations Taxonomy (SORT), and it is shown in Table 1. The taxonomy includes ratings of A, B, or C for the strength of recommendation for a body of evidence. The taxonomy also explains whether a body of evidence represents good-quality or limited-quality evidence, and whether evidence is consistent or inconsistent. The quality of individual studies is rated 1, 2, or 3; numbers are used to distinguish ratings of individual studies from the letters A, B, and C used to evaluate the strength of a recommendation based on a body of evidence. Figure 1 provides information about how to determine the strength of recommendation for management recommendations, and Figure 2 explains how to determine the level of evidence for an individual study. These 2 algorithms should be helpful to authors preparing papers for submission to family medicine journals. The algorithms are to be considered general guidelines, and special circumstances may dictate assignment of a different strength of recommendation (eg, a single, large, well-designed study in a diverse population may warrant an A-level recommendation).
Recommendations based only on improvements in surrogate or disease-oriented outcomes are always categorized as level C, because improvements in disease-oriented outcomes are not always associated with improve-ments in patient-oriented outcomes, as exemplified by several well-known findings from the medical literature. For example, doxazosin lowers blood pressure in African American patients—a seemingly beneficial outcome—but it also increases mortality.12 Similarly, encainide and flecainide reduce the incidence of arrhythmias after acute myocardial infarction, but they also increase mortality.13 Finasteride improves urinary flow rates, but it does not significantly improve urinary tract symptoms in patients with benign prostatic hypertrophy,14 while arthroscopic surgery for osteoarthritis of the knee improves the appearance of cartilage but does not reduce pain or improve joint function.15 Additional examples of clinical situations where disease-oriented evidence disagrees with patient—oriented evidence are shown in Table 2.12-24 Examples of how to apply the taxonomy are given in Table 3.
TABLE 1
How recommendations are graded for strength, and underlying individual studies are rated for quality
| In general, only key recommendations for readers require a grade of the “Strength of Recommendation.” Recommendations should be based on the highest quality evidence available. For example, vitamin E was found in some cohort studies (level 2 study quality) to have a benefit for cardiovascular protection, but good-quality randomized trials (level 1) have not confirmed this effect. Therefore, it is preferable to base clinical recommendations in a manuscript on the level 1 studies. | |||
| Strength of recommendation | Definition | ||
| A | Recommendation based on consistent and good-quality patient-oriented evidence.* | ||
| B | Recommendation based on inconsistent or limited-quality patient-oriented evidence.* | ||
| C | Recommendation based on consensus, usual practice, opinion, disease-oriented evidence,* or case series for studies of diagnosis, treatment, prevention, or screening | ||
| Use the following scheme to determine whether a study measuring patient-oriented outcomes is of good or limited quality, and whether the results are consistent or inconsistent between studies. | |||
| Study quality | Type of Study | ||
| Diagnosis | Treatment/prevention/screening | Prognosis | |
| Level 1—good-quality patient-oriented evidence | Validated clinical decision rule | SR/meta-analysis of RCTs with consistent findings | SR/meta-analysis of good-quality cohort studies |
| SR/meta-analysis of high-quality studies | High-quality individual RCT‡ All-or-none study§ | Prospective cohort study with good follow-up | |
| High-quality diagnostic cohort study† | |||
| Level 2—limited-quality patient-oriented evidence | Unvalidated clinical decision rule | SR/meta-analysis lower-quality clinical trials or of studies with inconsistent findings | SR/meta-analysis of lower-quality cohort studies or with inconsistent results |
| SR/meta-analysis of lower-quality studies or studies with inconsistent findings | Lower-quality clinical trial‡ or prospective cohort study Cohort study | Retrospective cohort study with poor follow-up | |
| Lower-quality diagnostic cohort study or diagnostic case-control study§ | Case-control study | Case-control study Case series | |
| Level 3—other evidence | Consensus guidelines, extrapolations from bench research, usual practice, opinion, other evidence disease-oriented evidence (intermediate or physiologic outcomes only), or case series for studies of diagnosis, treatment, prevention, or screening | ||
| Consistency across studies | |||
| Consistent | Most studies found similar or at least coherent conclusions (coherence means that differences are explainable); or If high-quality and up-to-date systematic reviews or meta-analyses exist, they support the recommendation | ||
| Inconsistent | Considerable variation among study findings and lack of coherence; or If high-quality and up-to-date systematic reviews or meta-analyses exist, they do not find consistent evidence in favor of the recommendation | ||
| *Patient-oriented evidence measures outcomes that matter to patients: morbidity, mortality, symptom improvement, cost reduction, and quality of life. Disease-oriented evidence measures intermediate, physiologic, or surrogate end points that may or may not reflect improvements in patient outcomes (ie, blood pressure, blood chemistry, physiologic function, and pathologic findings). | |||
| † High-quality diagnostic cohort study: cohort design, adequate size, adequate spectrum of patients, blinding, and a consistent, well-defined reference standard. | |||
| ‡ High-quality RCT: allocation concealed, blinding if possible, intention-to-treat analysis, adequate statistical power, adequate follow-up (greater than 80 percent). | |||
| § In an all-or-none study, the treatment causes a dramatic change in outcomes, such as antibiotics for meningitis or surgery for appendicitis, which precludes study in a controlled trial. | |||
| SR, systematic review; RCT, randomized controlled trial | |||
TABLE 2
Examples of inconsistency between disease-oriented and patient-oriented outcomes
| Therapy | Disease-oriented outcome | Patient-oriented outcome |
|---|---|---|
| Doxazosin for blood pressure12 | Reduces blood pressure | Increases morality in African Americans |
| Lidocaine for arrhythmia following acute myocardial infarction13 | Suppresses arrhythmias | Increases mortality |
| Finasteride for benign prostatic hypertrophy14 | Improves urinary flow rate | No clinically important change in symptom scores |
| Sleeping infants on their stomach or side16 | Knowledge of anatomy and physiology suggests that this will decrease the risk of aspiration | Increases risk of sudden infant death syndrome |
| Vitamin E for heart disease17 | Reduces levels of free radicals | No change in mortality |
| Histamine antagonists and proton pump inhibitors for nonulcer dyspepsia18 | Significantly reduces gastric pH levels | Little or no improvement in symptoms in patients with non-gastroesophageal reflux disease, nonulcer dyspepsia |
| Arthroscopic surgery for osteoarthritis of the knee15 | Improves appearance of cartilage after debridement | No change in function or symptoms at 1 year |
| Hormone therapy19 | Reduces low-density lipoprotein cholesterol, increases high-density lipoprotein cholesterol | No decrease in cardiovascular or all-cause mortality; an increase in cardiovascular events in all-cause mortality; an increase in cardiovascular events in women older than 60 years (Women’s Health Initiative) with combined hormone therapy |
| Insulin therapy in type 2 diabetes mellitus20 | Keeps blood sugar below 120 mg/dL (6.7 mmol/l) | Does not reduce overall mortality |
| Sodium fluoride for fracture prevention21 | Increases bone density | Does not reduce fracture rate |
| Lidocaine prophylaxis following acute myocardial infarction22 | Suppresses arrhythmias | Increases mortality |
| Clofibrate for hyperlipidemia23 | Reduces lipids | Does not reduce mortality |
| Beta-blockers for heart failure24 | Reduces cardiac output | Reduces mortality in moderate to severe disease |
TABLE 3
Examples of how to apply the SORT in practice
| Example 1: While a number of observational studies (level of evidence—2) suggested a cardiovascular benefit from vitamin E, a large, well-designed, randomized trial with a diverse patient population (level of evidence—1) showed the opposite. The strength of recommendation against routine, long-term use of vitamin E to prevent heart disease, based on the best available evidence, should be A. |
| Example 2: A Cochrane review finds 7 clinical trials that are consistent in their support of a mechanical intervention for low back pain, but the trials were poorly designed (ie, unblinded, nonrandomized, or with allocation to groups unconcealed). In this case, the strength of recommendation in favor of these mechanical interventions is B (consistent but lower-quality clinical trials). |
| Example 3: A meta-analysis finds 9 high-quality clinical trials of the use of a new drug in the treatment of pulmonary fibrosis. Two of the studies find harm, 2 find no benefit, and 5 show some benefit. The strength of recommendation in favor of this drug would be B (inconsistent results of good-quality, randomized controlled trials). |
| Example 4: A new drug increases the forced expiratory volume in 1 second (FEV1) and peak flow rate in patients with an acute asthma exacerbation. Data on symptom improvement is lacking. The strength of recommendation in favor of using this drug is C (disease-oriented evidence only). |
FIGURE 1
Determining the strength of a recommendation based on a body of evidence
FIGURE 2
Determining the level of evidence for an individual study
The advantages of SORT
We believe there are several advantages to our proposed taxonomy. It is straightforward and comprehensive, is easily applied by authors and physicians, and explicitly addresses the issue of patient-oriented versus disease-oriented evidence. The latter attribute distinguishes SORT from most other evidence grading scales. These strengths also create some limitations. Some clinicians may be concerned that the taxonomy is not as detailed in its assessment of study designs as others, such as that of the Centre for Evidence-Based Medicine (CEBM).25 However, the primary difference between the 2 taxonomies is that the CEBM version distinguishes between good and poor observational studies while the SORT version does not. We concluded that the advantages of a system that provides the physician with a clear recommendation that is strong (A), moderate (B), or weak (C) in its support of a particular intervention outweighs the theoretic benefit of distinguishing between lower quality and higher quality observational studies, particularly because there is no objective evidence that the latter distinction carries important differences in clinical recommendations.
Any publication applying SORT (or any other evidence-based taxonomy) should describe carefully the search process that preceded the assignment of a SORT rating. For example, authors could perform a comprehensive search of MEDLINE and the gray literature, a comprehensive search of MEDLINE alone, or a more focused search of MEDLINE plus secondary evidence-based sources of information.
Walkovers: Creating linkages with SORT
Some organizations, such as the CEBM,25 the Cochrane Collaboration,7 and the US Preventive Services Task Force (USPSTF),6 have developed their own grading scales for the strength of recommendations based on a body of evidence and are unlikely to abandon them. Other organizations, such as FPIN,26 publish their work in a variety of settings and must be able to move between taxonomies. We have developed a set of optional walkovers that suggest how authors, editors, and readers might move from 1 taxonomy to another. Walkovers for the CEBM and USPSTF taxonomies are shown in Table 4.
Many authors and experts in evidence-based medicine use the “Level of Evidence” taxonomy from the CEBM to rate the quality of individual studies.25 A walkover from the 5-level CEBM scale to the simpler 3-level SORT scale for individual studies is shown in Table 5.
TABLE 4
Suggested walkovers between taxonomies for assessing the strength of a recommendation based on a body of evidence
| SORT | CEBM | BMJ’s Clinical Evidence |
|---|---|---|
| A. Recommendation based on consistent and good-quality patient-oriented evidence | A. Consistent level 1 studies | Beneficial |
| B. Recommendation based on inconsistent or limited-quality patient-oriented evidence | B. Consistent level 2 or 3 studies or extrapolations from level 1 studies | Likely to be beneficial Likely to be ineffective or harmful (recommendation against) |
| C. Level 4 studies or extrapola-tions from level 2 or 3 studies | Unlikely to be beneficial (recommendation against) | |
| C. Recommendation based on consensus, usual practice, disease-oriented evidence, case series for studies of treatment or screening, and/on opinion | D. Level 5 evidence or troublingly inconsistent inconclusive studies of of any level | Unknown effectiveness |
| SORT, Strength of Evidence Taxonomy; CEBM, Centre for Evidence-Based Medicine; BMJ, BMJ Publishing Group. | ||
TABLE 5
Suggested walkover between CEBM and SORT for assessing the level of evidence of an individual study
| SORT | CEBM | |
|---|---|---|
| Treatment/screening | Other categories | |
| Level 1 | Levels 1a to 1c | Levels 1a to 1c |
| Level 2 | Level 2 or 3 | Levels 2 to 4 |
| Level 3 | Level 4 or 5 and any study that measures measures intermediate or surrogate outcomes | Level 5 andany study that intermediate or surrogate outcomes |
| CEBM, Centre for Evidence-Based Medicine; | ||
| SORT, Strength of Recommendation Taxonomy | ||
SORT can improve patient care
The SORT is a comprehensive taxonomy for evaluating the strength of a recommendation based on a body of evidence and the quality of an individual study. If applied consistently by authors and editors in the family medicine literature, it has the potential to make it easier for physicians to apply the results of research in their practice through the information mastery approach and to incorporate evidence-based medicine into their patient care.
Like any such grading scale, it is a work in progress. As we learn more about biases in study design, and as the authors and readers who use the taxonomy become more sophisticated about principles of information mastery, evidence-based medicine, and critical appraisal, it is likely to evolve. We remain open to suggestions from the primary care community for refining and improving SORT.
Acknowledgments
The authors thank Lee Green, MD, MPH, John Epling, MD, Kurt Stange, MD, PhD, and Margaret Gourlay, MD, for helpful comments on the manuscript. The authors indicate that they do not have any conflicts of interest. Sources of funding: none reported. This article has been simultaneously published in print and online by American Family Physician, Journal of Family Practice, Journal of the American Board of Family Practice, and online by Family Practice Inquiries Network. Copyright © 2004 American Family Physician, a publication of the American Academy of Family Physicians. All rights reserved.
1. Evidence-based medicine . A new approach to teaching the practice of medicine. JAMA 1992;268:2420-2425.
2. Slawson DC, Shaughnessy AF, Bennett JH. Becoming a medical information master: feeling good about not knowing everything. J Fam Pract 1994;38:505-513.
3. Shaughnessy AF, Slawson DC, Bennett JH. Becoming an information master: a guidebook to the medical information jungle. J Fam Pract 1994;39:489-499.
4. Siwek J, Gourlay ML, Slawson DC, Shaughnessy AF. How to write an evidence-based clinical review article. Am Fam Physician 2002;65:251-258.
5. Systems to rate the strength of scientific evidence. Summary, evidence report/technology assessment: number 47. AHRQ pub. no. 02-E015, March 2002. Agency for Healthcare Research and Quality, Rockville, Md. Available at: www.ahrq.gov/clinic/epcsums/strengthsum.htm. Accessed on November 13, 2003.
6. Harris RP, Helfand M, Woolf SH, Lohr KN, Mulrow CD, Teutsch SM, et al. Current methods of the U.S. Preventive Services Task Force: a review of the process. Am J Prev Med 2001;20(3 suppl):21-35.
7. Clarke M, Oxman AD. Cochrane reviewer’s handbook 4.0. The Cochrane Collaboration, 2003. Available at: www.cochrane.org/resources/handbook/handbook.pdf. Accessed on November 13, 2003.
8. Gyorkos TW, Tannenbaum TN, Abrahamowicz M, Oxman AD, Scott EA, Millson ME, et al. An approach to the development of practice guidelines for community health interventions. Can J Public Health 1994;85(suppl 1):S8-S13.
9. Briss PA, Zaza S, Pappaioanou M, et al. Developing an evidence-based guide to community preventive services—methods. Am J Prev Med 2000;18(1 suppl):35-43.
10. Greer N, Mosser G, Logan G, Halaas GW. A practical approach to evidence grading. Jt Comm J Qual Improv 2000;26:700-712.
11. Guyatt GH, Haynes RB, Jaeschke RZ, et al. Users’ guides to the medical literature: XXV. Evidence-based medicine: principles for applying the users’ guides to patient care. JAMA 2000;284:1290-1296.
12. Major cardiovascular events in hypertensive patients randomized to doxazosin vs chlorthalidone: the antihypertensive and lipid-lowering treatment to prevent heart attack trial (ALLHAT) JAMA 2000;283:1967-1975.
13. Echt DS, Liebson PR, Mitchell LB, et al. Mortality and morbidity in patients receiving encainide, flecainide, or placebo. N Engl J Med 1991;324:781-788.
14. Lepor H, Williford WO, Barry MJ, et al. The efficacy of terazosin, finasteride, or both in benign prostatic hyperplasia. N Engl J Med 1996;335:533-539.
15. Moseley JB, O’Malley K, Petersen NJ, et al. A controlled trial of arthroscopic surgery for osteoarthritis of the knee. N Engl J Med 2002;347:81-88.
16. Dwyer T, Ponsonby AL. Sudden infant death syndrome: after the “back to sleep” campaign. BMJ 1996;313:180-181.
17. Yusuf S, Dagenais G, Pogue J, Bosch J, Sleight P. Vitamin E supplementation and cardiovascular events in high-risk patients. N Engl J Med 2000;342:154-160.
18. Moayyedi P, Soo S, Deeks J, Delaney B, Innes M, Forman D. Pharmacological interventions for non-ulcer dyspepsia. Cochrane Database Syst Rev 2003;(1):CD001960.-
19. Rossouw JE, Anderson GL, Prentice RL, et al. Risks and benefits of estrogen plus progestin in healthy postmenopausal women: principal results from the Women’s Health Initiative randomized controlled trial. JAMA 2002;288:321-333.
20. Intensive blood-glucose control with sulphonylureas or insulin compared with conventional treatment and risk of complications in patients with type 2 diabetes (UKPDS 33). Lancet 1998;352:837-853.
21. Meunier PJ, Sebert JL, Reginster JY, et al. Fluoride salts are no better at preventing new vertebral fractures than calcium-vitamin D in postmenopausal osteoporosis: the FAVO Study. Osteoporos Int 1998;8:4-12.
22. MacMahon S, Collins R, Peto R, Koster RW, Yusuf S. Effects of prophylactic lidocaine in suspected acute myocardial infarction. An overview of results from the randomized, controlled trials. JAMA 1988;260:1910-1916.
23. Grumbach K. How effective is drug treatment of hypercholesterolemia? A guided tour of the major clinical trials for the primary care physician. J Am Board Fam Pract 1991;4:437-445.
24. Heidenreich PA, Lee TT, Massie BM. Effect of beta-blockade on mortality in patients with heart failure: a metaanalysis of randomized clinical trials. J Am Coll Cardiol 1997;30:27-34.
25. Centre for Evidence-Based Medicine. Levels of evidence and grades of recommendation. Available at: www.cebm.net/levels_of_evidence.asp. Accessed on November 13, 2003.
26. Family Practice Inquiries Network. (FPIN). Available at: www.fpin.org. Accessed on November 13, 2003.
To Our Readers
This issue of JFP presents the results of the Prevention and Competing Demands in Primary Care Study with guest editors Benjamin Crabtree, PhD, Will Miller, MD, MA, and Kurt Stange, MD, PhD. This is the very best kind of research—designed and executed by an interdisciplinary team of family practice researchers and participating community-based family practices. The researchers spent thousands of hours observing family physicians and their staffs as they went about the task of caring for families, using a process described by Crabtree and colleagues.1
For clinicians, reading these articles can be like looking in the mirror, and will bring to mind many specific patient encounters. Use this as an opportunity for reflection: How can I do a better job of meeting the needs of our patients? How does my practice differ from those around me? Is my variation appropriate or inappropriate?
Variation in family practice is an important theme of this landmark study. Most agree there is too much variability in the translation of scientific evidence into practice: The same patient with an upper respiratory infection may or may not receive a chest x-ray, an antibiotic, a decongestant, or a follow-up visit, depending on which family physician she sees. At the same time, a rigid application of protocols will not necessarily improve outcomes—particularly if they eliminate the variation that comes from attempts to meet the unique needs of patients, families, and communities.
Miller and coworkers2 applied complexity science to our practices and gained some valuable insights. Sometimes small changes can yield great benefits, and large efforts can generate little improvement in outcomes. Understanding these complex systems gives us a framework for developing locally applicable quality improvement approaches.
You will see your own patients in the 8 archetypes proposed to describe the different kinds of “frequent fliers” in the study by Smucker and colleagues.3 The identification of these archetypes is important for future research and for understanding our own practices.
Like the frequent attender, the patient in emotional distress is an important part of our daily clinical life. Robinson and coworkers4 discovered 4 different approaches that physicians use in dealing with these patients. Which do you use? Knowing may help you to meet patient needs not addressed by your current approach.
Most quality improvement interventions focus on one behavior at a time without considering the competing demands and opportunities inherent in the family practice approach. Jaén and colleagues5 found, for example, there are often good reasons for not asking about smoking habits. Our patients might be better served by focusing our efforts on particularly teachable moments and attending to other aspects of primary care that are more urgent.
Most family physicians agree that too often we use antibiotics unnecessarily. In their fascinating study, Scott and coworkers6 observed almost 300 such patient encounters and classified the approaches that patients take to pressure physicians for antibiotics. Recognizing the (sometimes subtle) pressure to prescribe antibiotics is key to educating our patients and increasing the appropriateness of our prescribing behavior.
Two additional articles in this series appear in full on the JFP Web site at www.jfponline.com. The study by Main and colleagues7 identifies 6 ways that family members who accompany patients have an impact on patient care. The second article by Aita and coworkers8 takes a careful look at staffing in 18 family practices to understand how decisions are made and the implications for meeting patient needs with different types of staff members.
The Prevention and Competing Demands in Primary Care Study presented here offers important insights for all family physicians and for those who seek to understand family practice. These insights can help us take the important first steps toward improving the care of our patients.
1. Crabtree BF, Miller WL, Stange KC. Understanding practice from the ground up. J Fam Pract 2001;50:881-87.
2. Miller WL, McDaniel RR, Jr, Crabtree BF, Stange KC. Practice jazz: understanding variation in family practices using complexity science. J Fam Pract 2001;50:872-78.
3. Smucker DR, Zink T, Susman JL, Crabtree BF. A framework for understanding visits by frequent attenders in family practice. J Fam Pract 2001;50:847-52.
4. Robinson WD, Prest LA, Sussman JL, Rouse J, Crabtee BF. Technician, friend, detective, healer: family physicians’ reponses to emotional distress. J Fam Pract 2001;50:864-70.
5. Jaén CR, McIlvain, H, Pol L, Phillips RL, Flocke S, Crabtree BF. Tailoring tobacco counseling to the competing demands in the clinical encounter. J Fam Pract 2001;50:859-63.
6. Scott JG, Cohen D, DiCicco-Bloom B, Orzano AJ, Jaén CR, Crabtree BF. Unnecessary antibiotic use in acute respiratory infections. J Fam Pract 2001;50:853-58.
7. Main DS, Holcomb S, Dickinson P, Crabtree BF. The effect of families on the process of outpatient visits in family practice. J Fam Pract 2001;50:888.-
8. Aita V, Dodendorf DM, Lebsack JA, Tallia AF, Crabtree BF. Patient care staffing patterns and rols in community-based practices. 2001;50:889.
This issue of JFP presents the results of the Prevention and Competing Demands in Primary Care Study with guest editors Benjamin Crabtree, PhD, Will Miller, MD, MA, and Kurt Stange, MD, PhD. This is the very best kind of research—designed and executed by an interdisciplinary team of family practice researchers and participating community-based family practices. The researchers spent thousands of hours observing family physicians and their staffs as they went about the task of caring for families, using a process described by Crabtree and colleagues.1
For clinicians, reading these articles can be like looking in the mirror, and will bring to mind many specific patient encounters. Use this as an opportunity for reflection: How can I do a better job of meeting the needs of our patients? How does my practice differ from those around me? Is my variation appropriate or inappropriate?
Variation in family practice is an important theme of this landmark study. Most agree there is too much variability in the translation of scientific evidence into practice: The same patient with an upper respiratory infection may or may not receive a chest x-ray, an antibiotic, a decongestant, or a follow-up visit, depending on which family physician she sees. At the same time, a rigid application of protocols will not necessarily improve outcomes—particularly if they eliminate the variation that comes from attempts to meet the unique needs of patients, families, and communities.
Miller and coworkers2 applied complexity science to our practices and gained some valuable insights. Sometimes small changes can yield great benefits, and large efforts can generate little improvement in outcomes. Understanding these complex systems gives us a framework for developing locally applicable quality improvement approaches.
You will see your own patients in the 8 archetypes proposed to describe the different kinds of “frequent fliers” in the study by Smucker and colleagues.3 The identification of these archetypes is important for future research and for understanding our own practices.
Like the frequent attender, the patient in emotional distress is an important part of our daily clinical life. Robinson and coworkers4 discovered 4 different approaches that physicians use in dealing with these patients. Which do you use? Knowing may help you to meet patient needs not addressed by your current approach.
Most quality improvement interventions focus on one behavior at a time without considering the competing demands and opportunities inherent in the family practice approach. Jaén and colleagues5 found, for example, there are often good reasons for not asking about smoking habits. Our patients might be better served by focusing our efforts on particularly teachable moments and attending to other aspects of primary care that are more urgent.
Most family physicians agree that too often we use antibiotics unnecessarily. In their fascinating study, Scott and coworkers6 observed almost 300 such patient encounters and classified the approaches that patients take to pressure physicians for antibiotics. Recognizing the (sometimes subtle) pressure to prescribe antibiotics is key to educating our patients and increasing the appropriateness of our prescribing behavior.
Two additional articles in this series appear in full on the JFP Web site at www.jfponline.com. The study by Main and colleagues7 identifies 6 ways that family members who accompany patients have an impact on patient care. The second article by Aita and coworkers8 takes a careful look at staffing in 18 family practices to understand how decisions are made and the implications for meeting patient needs with different types of staff members.
The Prevention and Competing Demands in Primary Care Study presented here offers important insights for all family physicians and for those who seek to understand family practice. These insights can help us take the important first steps toward improving the care of our patients.
1. Crabtree BF, Miller WL, Stange KC. Understanding practice from the ground up. J Fam Pract 2001;50:881-87.
2. Miller WL, McDaniel RR, Jr, Crabtree BF, Stange KC. Practice jazz: understanding variation in family practices using complexity science. J Fam Pract 2001;50:872-78.
3. Smucker DR, Zink T, Susman JL, Crabtree BF. A framework for understanding visits by frequent attenders in family practice. J Fam Pract 2001;50:847-52.
4. Robinson WD, Prest LA, Sussman JL, Rouse J, Crabtee BF. Technician, friend, detective, healer: family physicians’ reponses to emotional distress. J Fam Pract 2001;50:864-70.
5. Jaén CR, McIlvain, H, Pol L, Phillips RL, Flocke S, Crabtree BF. Tailoring tobacco counseling to the competing demands in the clinical encounter. J Fam Pract 2001;50:859-63.
6. Scott JG, Cohen D, DiCicco-Bloom B, Orzano AJ, Jaén CR, Crabtree BF. Unnecessary antibiotic use in acute respiratory infections. J Fam Pract 2001;50:853-58.
7. Main DS, Holcomb S, Dickinson P, Crabtree BF. The effect of families on the process of outpatient visits in family practice. J Fam Pract 2001;50:888.-
8. Aita V, Dodendorf DM, Lebsack JA, Tallia AF, Crabtree BF. Patient care staffing patterns and rols in community-based practices. 2001;50:889.
Becoming an ePhysician
Being an effective manager of information is a central task for family physicians, yet many ignore the most powerful information management tool ever invented: the computer. This month’s issue of JFP features several articles that describe how family physicians have begun to integrate information technology into their practices. Couchman and colleagues1 found that most patients expected their physicians to use E-mail, and wanted to use it to get prescription refills, test results, and the answers to routine medical questions. Particularly interesting was the expectation of speed: 3 out of 4 expected to get laboratory results within 24 hours.
In a second study, Campbell and coworkers2 report their experiences of introducing computer and telemedicine technologies to physicians in rural Missouri. They met with varying degrees of resistance and wisely suggest tailoring the approach to the setting. When working with sites that are more skeptical of change, you have to first justify the need for technology, and then convince physicians that it can make their lives easier and improve the care they deliver to patients.
Implementing an outpatient electronic medical record is an expensive undertaking that can reduce, rather than enhance, productivity. Three strategies can reduce the risks of making the transition to an electronic medical record. In a guerilla strategy, individual physicians buy hand-held computers, run network cable in the middle of the night, and experiment with wireless communication. This can be disruptive, but it is also a good way to build interest among other physicians and gain experience with new technologies. After all, it is difficult to stop a determined computer geek. In a pilot strategy, one clinic in a group of clinics or one department in a multispecialty group adopts an electronic medical record. The guinea pigs should include technologically proficient physicians who can serve as peer role models, and if possible the rollout should take place during a slower clinical period, such as the summer. The experience gained can then be used to facilitate adoption of the system in other sites.
Finally, a halfway strategy shifts some but not all clinical tasks to an electronic system. Fox and colleagues3 describe one such strategy in their article on handheld electronic prescribing systems, and the enthusiasm of these family physicians is infectious. The great thing about hand-held prescribing systems is that they do not involve a major paradigm shift: You are still writing prescriptions on a small flat object. Now, however, you also have drug information, formularies, and the patient’s current medication list at your fingertips. Most physicians can learn to use them in 15 minutes, and they can immediately improve the quality of care. With the recent attention on medical errors and patient safety, these systems are a no-brainer.
So where can you begin? Get an E-mail account and use it. Throw away your planner and buy a Palm, Visor, or PocketPC hand-held computer.4 Load it with cheap and useful medical information; upcoming articles in JFP will highlight free software for these systems. Learn how to use a Web browser, and bookmark 10 really helpful medical sites, like the JFP Web site (www.jfponline.com). Start thinking about electronic medical record systems: Learn about their features, vendors, and what questions to ask.5 Years from now, saying that you do not use a computer will sound as strange as saying that you do not use a stethoscope. It is time to get started.
1. Couchman GR, Forjuoh SN, Rascoe TG. E-mail communications in family practice: what do patients expect? J Fam Pract 2001;50:414-418.
2. Campbell JD, Harris KD, Hodge R. Introducing telemedicine technology to rural physicians and settings. J Fam Pract 2001;50:419-24.
3. Fox GN, Weidmann E, Diamond DE, Korbey AA. Technology in family medicine: hand-held electronic prescribing. J Fam Pract 2001;50:449-454.
4. Ebell MH, Rovner D. Information in the palm of your hand. J Fam Pract 2000; 49:243-51. Available at: jfponline.com/content/2000/03/jfp_0300_02430.asp.
5. Rehm S, Kraft S. Electronic medical records: The FPM Vendor Survey. Fam Pract Manage 2001. Available at: www.aafp.org/fpm/20010100/45elec.html.
Being an effective manager of information is a central task for family physicians, yet many ignore the most powerful information management tool ever invented: the computer. This month’s issue of JFP features several articles that describe how family physicians have begun to integrate information technology into their practices. Couchman and colleagues1 found that most patients expected their physicians to use E-mail, and wanted to use it to get prescription refills, test results, and the answers to routine medical questions. Particularly interesting was the expectation of speed: 3 out of 4 expected to get laboratory results within 24 hours.
In a second study, Campbell and coworkers2 report their experiences of introducing computer and telemedicine technologies to physicians in rural Missouri. They met with varying degrees of resistance and wisely suggest tailoring the approach to the setting. When working with sites that are more skeptical of change, you have to first justify the need for technology, and then convince physicians that it can make their lives easier and improve the care they deliver to patients.
Implementing an outpatient electronic medical record is an expensive undertaking that can reduce, rather than enhance, productivity. Three strategies can reduce the risks of making the transition to an electronic medical record. In a guerilla strategy, individual physicians buy hand-held computers, run network cable in the middle of the night, and experiment with wireless communication. This can be disruptive, but it is also a good way to build interest among other physicians and gain experience with new technologies. After all, it is difficult to stop a determined computer geek. In a pilot strategy, one clinic in a group of clinics or one department in a multispecialty group adopts an electronic medical record. The guinea pigs should include technologically proficient physicians who can serve as peer role models, and if possible the rollout should take place during a slower clinical period, such as the summer. The experience gained can then be used to facilitate adoption of the system in other sites.
Finally, a halfway strategy shifts some but not all clinical tasks to an electronic system. Fox and colleagues3 describe one such strategy in their article on handheld electronic prescribing systems, and the enthusiasm of these family physicians is infectious. The great thing about hand-held prescribing systems is that they do not involve a major paradigm shift: You are still writing prescriptions on a small flat object. Now, however, you also have drug information, formularies, and the patient’s current medication list at your fingertips. Most physicians can learn to use them in 15 minutes, and they can immediately improve the quality of care. With the recent attention on medical errors and patient safety, these systems are a no-brainer.
So where can you begin? Get an E-mail account and use it. Throw away your planner and buy a Palm, Visor, or PocketPC hand-held computer.4 Load it with cheap and useful medical information; upcoming articles in JFP will highlight free software for these systems. Learn how to use a Web browser, and bookmark 10 really helpful medical sites, like the JFP Web site (www.jfponline.com). Start thinking about electronic medical record systems: Learn about their features, vendors, and what questions to ask.5 Years from now, saying that you do not use a computer will sound as strange as saying that you do not use a stethoscope. It is time to get started.
1. Couchman GR, Forjuoh SN, Rascoe TG. E-mail communications in family practice: what do patients expect? J Fam Pract 2001;50:414-418.
2. Campbell JD, Harris KD, Hodge R. Introducing telemedicine technology to rural physicians and settings. J Fam Pract 2001;50:419-24.
3. Fox GN, Weidmann E, Diamond DE, Korbey AA. Technology in family medicine: hand-held electronic prescribing. J Fam Pract 2001;50:449-454.
4. Ebell MH, Rovner D. Information in the palm of your hand. J Fam Pract 2000; 49:243-51. Available at: jfponline.com/content/2000/03/jfp_0300_02430.asp.
5. Rehm S, Kraft S. Electronic medical records: The FPM Vendor Survey. Fam Pract Manage 2001. Available at: www.aafp.org/fpm/20010100/45elec.html.
Evaluation of the Patient with Suspected Deep Vein Thrombosis
Pain and swelling of a leg is a relatively common presenting complaint in primary care practice. In the 1995 National Ambulatory Medical Care Survey, 1.3% of patients presenting to family physicians had a complaint of leg pain or swelling.1 Although this complaint often has a benign cause, it is important to carefully evaluate these patients because they may have deep vein thrombosis (DVT). A population-based study showed that 48 of 100,000 persons are given the diagnosis of DVT every year, which corresponds to 1 to 2 patients per year in a typical family physician’s panel of patients.2
Patients with a clotting abnormality who are pregnant, undergo a period of immobilization, or are diagnosed with a malignancy are at higher than average risk of DVT. In addition to the morbidity associated with DVT, approximately 40% of patients with DVT have a pulmonary embolism (PE), although most of these are clinically silent, and it is not clear whether aggressive work-up to diagnose PE in patients with DVT is indicated.3
This article describes an approach to the evaluation of patients with suspected DVT. The focus will be on making the best possible use of the history and physical examination by using our knowledge of the probability of DVT and validated clinical decision rules. This information will guide the interpretation of diagnostic tests such as d-dimer and duplex venous ultrasound.1
Differential diagnosis
There are many causes of leg pain and edema, including musculoskeletal injury, congestive heart failure, hepatic disease, mechanical obstruction of lymphatic drainage, cellulitis, malnutrition, thyroid disease, Baker cysts, chronic venous insufficiency, and venous thrombosis. Unfortunately, no detailed data are available for the percentage of patients given these diagnoses among all patients presenting with leg pain and swelling. Among all patients with leg pain with and without swelling only 3.3% had thrombophlebitis in a large Dutch series.4
A number of studies reporting data on the percentage of patients with suspected DVT who are referred for diagnostic testing and have the diagnosis confirmed are summarized in Table 1. As a rule of thumb, for every 100 outpatients with suspected DVT 16 will have a proximal DVT and 4 will have a distal DVT.
Using the history and physical examination
Individual signs and symptoms are of relatively little value in the diagnosis of DVT. The well-designed studies5,6 generally find a lower sensitivity or specificity for physical examination findings than poorly designed studies.7 The accuracy of individual history and examination findings are outlined in Table 2 using only data from the highest-quality study. Homan sign (long taught as a useful clinical sign) is of no value in the diagnosis of DVT and should be omitted from the examination.
However, groups of signs and symptoms can be useful. Wells and colleagues developed a clinical rule that combines the results of 9 carefully defined signs and symptoms Figure 1. They subsequently validated this rule in a later study using a different group of patients and found it useful for stratifying patients into separate groups by risk of having a DVT.8-10 This validation study included outpatients referred for the evaluation of suspected DVT to a tertiary care hospital thrombosis clinic. Patients were excluded if they were pregnant, had a lower extremity amputation, were suspected of having a PE, had symptoms for more than 60 days, or were currently using anticoagulants. The mean age was 57.1 years; 40% were men; and 16% were given a diagnosis of DVT. Thus, these data would generalize to a family practice setting. Patients who fell into the low-risk group based on this rule had a 3% risk of DVT; those in the moderate risk group, 17%; and those in the high-risk group, 75%. This information will determine how we interpret the results of the noninvasive tests.
Diagnostic tests
Tests for the diagnosis of DVT include impedance plethysmography, magnetic resonance imaging (MRI), duplex venous ultrasound, and contrast venography. The latter is an invasive test, typically considered the reference standard. The accuracy of noninvasive tests varies with the study population (symptomatic vs asymptomatic) and the type of DVT being diagnosed (proximal, distal, or any). The tests are generally much less accurate in asymptomatic patients and less accurate for distal DVTs. The data for impedance plethysmography and ultrasound are summarized in Table 3 for symptomatic patients.11-13 Although duplex venous ultrasound is clearly the preferred test, impedance plethysmography is an acceptable alternative if ultrasound is not available.
Although there is considerable interest in MRI, studies to date have been small14-16 or have had serious methodologic limitations, such as a failure to blind the radiologists, a retrospective design, or a poor quality reference standard.17-19 In these studies, the sensitivity ranges from 80% to 100% and the specificity from 93% to 100% when compared with contrast venography. Consideration of MRI should currently be limited to cases where venography is considered but there are concerns over the use of contrast, and where there is considerable local experience with the technique.20,21
Some physicians advocate repeating the duplex venous ultrasound in patients with an initial negative test result, if the suspicion for DVT remains. Two studies with a total of 2107 patients repeated the ultrasound 5 to 7 days later, if the first ultrasound result was normal; patients with 2 normal ultrasound results did not receive anticoagulation.22,23 Only 0.6% of these patients had a thromboembolic complication (DVT or pulmonary embolism) during the next 3 months, and only 1 of these occurred during the week between ultrasounds. A third study repeated the ultrasound 1 day and again 6 days later in patients with a normal initial ultrasound results.24 Of 390 patients with 3 normal ultrasound results, only 6 had a thromboembolic complication during the next 3 months. Thus, in patients with 2 normal results 1 week apart, the risk of a thromboembolic complication during the next 3 months is approximately 1%.
D-dimer is a fibrin degradation product, and elevated levels are associated with an increased risk of DVT. Different d-dimer assays vary considerably in their performance. Latex agglutination assays are fast and cheap but not very accurate; they are therefore not recommended. Microplate enzyme-linked immunoassays (ELISAs) are accurate but expensive; membrane ELISAs are less expensive and nearly as accurate. The accuracy of one of the most widely used d-dimer tests (SimpliRED) is shown in Table 3. Note that a negative d-dimer test rersult alone does not rule out DVT; 2% to 5% of patients with suspected DVT and a negative d-dimer result actually have DVT. This is similar to the performance of ultrasound alone in unselected patients with suspected DVT. Because of the differences between tests, clinicians should learn which test is used by their laboratory and should advocate for use of the most accurate available test.
The d-dimer test is most useful in a patient with a moderate risk of DVT and a normal duplex venous ultrasound result. In one study, only 1 of 598 patients with normal ultrasound and normal d-dimer test results (membrane ELISA; Instant-IA d-dimer kit, Stago, Asnieres, France) developed a DVT in the next 3 months. Of 88 patients with normal duplex venous ultrasound results but elevated d-dimer levels, 5 had a DVT detected 1 week later with a repeat ultrasound, and an additional 2 had venous thromboembolic complications during the next 3 months.25
Approaching the patient
Evaluating all patients with suspected DVT in the same way risks overdiagnosing low-risk patients and underdiagnosing high-risk patients. The history and physical examination can guide the selection and interpretation of further diagnostic tests. Begin by using the Wells clinical decision rule Figure 1 to put the patient in the low-, moderate-, or high-risk group. Remember that this rule was developed in nonpregnant patients with a first DVT. For pregnant patients or those with a history of previous DVT, you should have a higher index of suspicion.
Next, use the algorithm in Figure 2 to guide your evaluation. DVT can be considered adequately ruled out in low-risk patients with a negative ultrasound result and in moderate-risk patients with normal d-dimer and normal ultrasound results. Moderate-risk patients with a normal initial result on ultrasound but an abnormal d-dimer level should have a repeat ultrasound in 1 week. Moderate- and high-risk patients with an abnormal ultrasound result should be treated for DVT. High-risk patients with a normal ultrasound result still have a fairly high probability of DVT and should have a venogram to establish the diagnosis. In high-risk patients normal ultrasound and normal d-dimer results do not adequately rule out DVT.
Of course, this algorithm should not be used inflexibly. Patients with new or progressive symptoms (eg, a person with suspected DVT who develops signs and symptoms of PE) should be evaluated immediately. Pregnant patients and patients with a history of DVT should be evaluated more aggressively, because their overall risk of DVT is higher.
All correspondence should be addressed to Mark H. Ebell, MD, MS, 330 Snapfinger Drive, Athens, GA 30605. E-mail: ebell@msu.edu.
1. US Department of Health and Human Services. National Ambulatory Medical Care Survey (1995). NCHS CD-ROM Series 13, No. 11, SETS Version 1.221. Washington, DC: US Department of Health and Human Services; 1997.
2. Anderson FA, Wheeler HB, Goldberg RJ, et al. A population-based perspective of the hospital incidence and case-fatality rates of deep vein thrombosis and pulmonary embolism: the Worcester DVT study. Arch Intern Med 1991;151:933-38.
3. Meignan M, Rosso J, Gauthier H, et al. Systematic lung scans reveal a high frequency of silent pulmonary embolism in patients with proximal deep venous thrombosis. Arch Intern Med 2000;160:159-65.
4. Lamberts H. In Het Huis van de huisarts. Verslag van het Transitieproject. Lelystad: Meditekst, 2nd edition, 1994.
5. Sandler DA, Duncan JS, Ward P, et al. Diagnosis of deep-vein thrombosis: comparison of clinical evaluation, ultrasound, plethysmography, and venoscan with x-ray venogram. Lancet 1984;2:716-18.
6. O’Donnell TF, Jr, Abbott WM, Athanasoulis CA, Millan VG, Callow AD. Diagnosis of deep venous thrombosis in the outpatient by venography. Surg Gynecol Obstet 1980;150:69-74.
7. McLachlan J, Richards T, Paterson JC. An evaluation of clinical signs in the diagnosis of venous thrombosis. Arch Surg 1962;85:738-44.
8. Wells PS, Hirsh J, Anderson DR, et al. Accuracy of clinical assessment of deep-vein thrombosis. Lancet 1995;345:1326-30.
9. Wells P, Anderson DR, Bormanis J, et al. Value of assessment of pretest probability of deep-vein thrombosis in clinical management. Lancet 1997;350:1795-98.
10. Wells PS, Hirsch J, Anderson DR, et al. A simple clinical model for the diagnosis of deep-vein thrombosis combined with impedance plethysmography: potential for an improvement in the diagnostic process. J Intern Med 1998;243:15-23.
11. Kearon C, Julian JA, Newman TE, Ginsberg JS. for the McMaster Diagnostic Imaging Practice Guidelines Initiative. Noninvasive diagnosis of deep venous thrombosis. Ann Intern Med 1998;128:663-77.
12. Anderson DR, Wells PS, Stiell I, et al. Management of patients with suspected deep vein thrombosis in the Emergency Department: combining use of a clinical diagnosis model with d-dimer testing. J Emerg Med 2000;19:225-30.
13. Wildberger JE, Vorwerk D, Kilbinger M, et al. Bedside testing (SimpliRED) in the diagnosis of deep vein thrombosis: evaluation of 250 patients. Invest Radiol 1998;33:232-35.
14. Spritzer CE, Sostman HD, Wilkes DC, Coleman RE. Deep venous thrombosis: experience with gradient-echo MR imaging in 66 patients. Radiology 1990;177:235-41.
15. Moody AR, Pollock JG, O’Connor AR, Bagnall M. Lower-limb deep venous thrombosis: direct MR imaging of the thrombus. Radiology 1998;209:349-55.
16. Vukov LF, Berquist TH, King BF. Magnetic resonance imaging for calf deep venous thrombophlebitis. Ann Emerg Med 1991;20:497-99.
17. Laissy JP, Cinqualbre A, Loshkajian A, et al. Assessment of deep venous thrombosis in the lower limbs and pelvis: MR venography versus duplex Doppler sonography. Am J Roentgenol 1996;167:971-75.
18. Erdman WA, Jayson HT, Redman HC, et al. Deep venous thrombosis of extremities: role of MR imaging in the diagnosis. Radiology 1990;174:425-31.
19. Spritzer CE, Norconk JJ, Sostman HD, Coleman RE. Detection of deep venous thrombosis by magnetic resonance imaging. Chest 1993;104:54-60.
20. ACCP Consensus Committee on Pulmonary Embolism. Opinions regarding the diagnosis and management of venous thromboembolic disease chest. 1998;113:499-504.
21. American Thoracic Society. The diagnostic approach to acute venous thromboembolism clinical practice guideline. Am J Respir Crit Care Med 1999;160:1043-66.
22. Cogo A, Lensing AW, Koopman MW, et al. Compression ultrasonography for diagnostic management of patients with clinically suspected deep vein thrombosis: prospective cohort study. BMJ 1998;316:17-20.
23. Birdwell BG, Raskob GE, Whitsett TL, et al. The clinical validity of normal compression ultrasonography in outpatients suspected of having deep venous thrombosis. Ann Intern Med 1998;128:1-7.
24. Heijboer H, Buller HR, Lensing AW, et al. A comparison of real-time compression ultrasonography with impedance plethysmography for the diagnosis of deep-vein thrombosis in symptomatic outpatients. N Engl J Med 1993;329:1365-69.
25. Bernardi F, Prandoni P, Lensing AWA, et al. D-dimer testing as an adjunct to ultrasonography in patients with clinically suspected deep vein thrombosis: prospective cohort study. BMJ 1998;317:1037-40.
Pain and swelling of a leg is a relatively common presenting complaint in primary care practice. In the 1995 National Ambulatory Medical Care Survey, 1.3% of patients presenting to family physicians had a complaint of leg pain or swelling.1 Although this complaint often has a benign cause, it is important to carefully evaluate these patients because they may have deep vein thrombosis (DVT). A population-based study showed that 48 of 100,000 persons are given the diagnosis of DVT every year, which corresponds to 1 to 2 patients per year in a typical family physician’s panel of patients.2
Patients with a clotting abnormality who are pregnant, undergo a period of immobilization, or are diagnosed with a malignancy are at higher than average risk of DVT. In addition to the morbidity associated with DVT, approximately 40% of patients with DVT have a pulmonary embolism (PE), although most of these are clinically silent, and it is not clear whether aggressive work-up to diagnose PE in patients with DVT is indicated.3
This article describes an approach to the evaluation of patients with suspected DVT. The focus will be on making the best possible use of the history and physical examination by using our knowledge of the probability of DVT and validated clinical decision rules. This information will guide the interpretation of diagnostic tests such as d-dimer and duplex venous ultrasound.1
Differential diagnosis
There are many causes of leg pain and edema, including musculoskeletal injury, congestive heart failure, hepatic disease, mechanical obstruction of lymphatic drainage, cellulitis, malnutrition, thyroid disease, Baker cysts, chronic venous insufficiency, and venous thrombosis. Unfortunately, no detailed data are available for the percentage of patients given these diagnoses among all patients presenting with leg pain and swelling. Among all patients with leg pain with and without swelling only 3.3% had thrombophlebitis in a large Dutch series.4
A number of studies reporting data on the percentage of patients with suspected DVT who are referred for diagnostic testing and have the diagnosis confirmed are summarized in Table 1. As a rule of thumb, for every 100 outpatients with suspected DVT 16 will have a proximal DVT and 4 will have a distal DVT.
Using the history and physical examination
Individual signs and symptoms are of relatively little value in the diagnosis of DVT. The well-designed studies5,6 generally find a lower sensitivity or specificity for physical examination findings than poorly designed studies.7 The accuracy of individual history and examination findings are outlined in Table 2 using only data from the highest-quality study. Homan sign (long taught as a useful clinical sign) is of no value in the diagnosis of DVT and should be omitted from the examination.
However, groups of signs and symptoms can be useful. Wells and colleagues developed a clinical rule that combines the results of 9 carefully defined signs and symptoms Figure 1. They subsequently validated this rule in a later study using a different group of patients and found it useful for stratifying patients into separate groups by risk of having a DVT.8-10 This validation study included outpatients referred for the evaluation of suspected DVT to a tertiary care hospital thrombosis clinic. Patients were excluded if they were pregnant, had a lower extremity amputation, were suspected of having a PE, had symptoms for more than 60 days, or were currently using anticoagulants. The mean age was 57.1 years; 40% were men; and 16% were given a diagnosis of DVT. Thus, these data would generalize to a family practice setting. Patients who fell into the low-risk group based on this rule had a 3% risk of DVT; those in the moderate risk group, 17%; and those in the high-risk group, 75%. This information will determine how we interpret the results of the noninvasive tests.
Diagnostic tests
Tests for the diagnosis of DVT include impedance plethysmography, magnetic resonance imaging (MRI), duplex venous ultrasound, and contrast venography. The latter is an invasive test, typically considered the reference standard. The accuracy of noninvasive tests varies with the study population (symptomatic vs asymptomatic) and the type of DVT being diagnosed (proximal, distal, or any). The tests are generally much less accurate in asymptomatic patients and less accurate for distal DVTs. The data for impedance plethysmography and ultrasound are summarized in Table 3 for symptomatic patients.11-13 Although duplex venous ultrasound is clearly the preferred test, impedance plethysmography is an acceptable alternative if ultrasound is not available.
Although there is considerable interest in MRI, studies to date have been small14-16 or have had serious methodologic limitations, such as a failure to blind the radiologists, a retrospective design, or a poor quality reference standard.17-19 In these studies, the sensitivity ranges from 80% to 100% and the specificity from 93% to 100% when compared with contrast venography. Consideration of MRI should currently be limited to cases where venography is considered but there are concerns over the use of contrast, and where there is considerable local experience with the technique.20,21
Some physicians advocate repeating the duplex venous ultrasound in patients with an initial negative test result, if the suspicion for DVT remains. Two studies with a total of 2107 patients repeated the ultrasound 5 to 7 days later, if the first ultrasound result was normal; patients with 2 normal ultrasound results did not receive anticoagulation.22,23 Only 0.6% of these patients had a thromboembolic complication (DVT or pulmonary embolism) during the next 3 months, and only 1 of these occurred during the week between ultrasounds. A third study repeated the ultrasound 1 day and again 6 days later in patients with a normal initial ultrasound results.24 Of 390 patients with 3 normal ultrasound results, only 6 had a thromboembolic complication during the next 3 months. Thus, in patients with 2 normal results 1 week apart, the risk of a thromboembolic complication during the next 3 months is approximately 1%.
D-dimer is a fibrin degradation product, and elevated levels are associated with an increased risk of DVT. Different d-dimer assays vary considerably in their performance. Latex agglutination assays are fast and cheap but not very accurate; they are therefore not recommended. Microplate enzyme-linked immunoassays (ELISAs) are accurate but expensive; membrane ELISAs are less expensive and nearly as accurate. The accuracy of one of the most widely used d-dimer tests (SimpliRED) is shown in Table 3. Note that a negative d-dimer test rersult alone does not rule out DVT; 2% to 5% of patients with suspected DVT and a negative d-dimer result actually have DVT. This is similar to the performance of ultrasound alone in unselected patients with suspected DVT. Because of the differences between tests, clinicians should learn which test is used by their laboratory and should advocate for use of the most accurate available test.
The d-dimer test is most useful in a patient with a moderate risk of DVT and a normal duplex venous ultrasound result. In one study, only 1 of 598 patients with normal ultrasound and normal d-dimer test results (membrane ELISA; Instant-IA d-dimer kit, Stago, Asnieres, France) developed a DVT in the next 3 months. Of 88 patients with normal duplex venous ultrasound results but elevated d-dimer levels, 5 had a DVT detected 1 week later with a repeat ultrasound, and an additional 2 had venous thromboembolic complications during the next 3 months.25
Approaching the patient
Evaluating all patients with suspected DVT in the same way risks overdiagnosing low-risk patients and underdiagnosing high-risk patients. The history and physical examination can guide the selection and interpretation of further diagnostic tests. Begin by using the Wells clinical decision rule Figure 1 to put the patient in the low-, moderate-, or high-risk group. Remember that this rule was developed in nonpregnant patients with a first DVT. For pregnant patients or those with a history of previous DVT, you should have a higher index of suspicion.
Next, use the algorithm in Figure 2 to guide your evaluation. DVT can be considered adequately ruled out in low-risk patients with a negative ultrasound result and in moderate-risk patients with normal d-dimer and normal ultrasound results. Moderate-risk patients with a normal initial result on ultrasound but an abnormal d-dimer level should have a repeat ultrasound in 1 week. Moderate- and high-risk patients with an abnormal ultrasound result should be treated for DVT. High-risk patients with a normal ultrasound result still have a fairly high probability of DVT and should have a venogram to establish the diagnosis. In high-risk patients normal ultrasound and normal d-dimer results do not adequately rule out DVT.
Of course, this algorithm should not be used inflexibly. Patients with new or progressive symptoms (eg, a person with suspected DVT who develops signs and symptoms of PE) should be evaluated immediately. Pregnant patients and patients with a history of DVT should be evaluated more aggressively, because their overall risk of DVT is higher.
All correspondence should be addressed to Mark H. Ebell, MD, MS, 330 Snapfinger Drive, Athens, GA 30605. E-mail: ebell@msu.edu.
1. US Department of Health and Human Services. National Ambulatory Medical Care Survey (1995). NCHS CD-ROM Series 13, No. 11, SETS Version 1.221. Washington, DC: US Department of Health and Human Services; 1997.
2. Anderson FA, Wheeler HB, Goldberg RJ, et al. A population-based perspective of the hospital incidence and case-fatality rates of deep vein thrombosis and pulmonary embolism: the Worcester DVT study. Arch Intern Med 1991;151:933-38.
3. Meignan M, Rosso J, Gauthier H, et al. Systematic lung scans reveal a high frequency of silent pulmonary embolism in patients with proximal deep venous thrombosis. Arch Intern Med 2000;160:159-65.
4. Lamberts H. In Het Huis van de huisarts. Verslag van het Transitieproject. Lelystad: Meditekst, 2nd edition, 1994.
5. Sandler DA, Duncan JS, Ward P, et al. Diagnosis of deep-vein thrombosis: comparison of clinical evaluation, ultrasound, plethysmography, and venoscan with x-ray venogram. Lancet 1984;2:716-18.
6. O’Donnell TF, Jr, Abbott WM, Athanasoulis CA, Millan VG, Callow AD. Diagnosis of deep venous thrombosis in the outpatient by venography. Surg Gynecol Obstet 1980;150:69-74.
7. McLachlan J, Richards T, Paterson JC. An evaluation of clinical signs in the diagnosis of venous thrombosis. Arch Surg 1962;85:738-44.
8. Wells PS, Hirsh J, Anderson DR, et al. Accuracy of clinical assessment of deep-vein thrombosis. Lancet 1995;345:1326-30.
9. Wells P, Anderson DR, Bormanis J, et al. Value of assessment of pretest probability of deep-vein thrombosis in clinical management. Lancet 1997;350:1795-98.
10. Wells PS, Hirsch J, Anderson DR, et al. A simple clinical model for the diagnosis of deep-vein thrombosis combined with impedance plethysmography: potential for an improvement in the diagnostic process. J Intern Med 1998;243:15-23.
11. Kearon C, Julian JA, Newman TE, Ginsberg JS. for the McMaster Diagnostic Imaging Practice Guidelines Initiative. Noninvasive diagnosis of deep venous thrombosis. Ann Intern Med 1998;128:663-77.
12. Anderson DR, Wells PS, Stiell I, et al. Management of patients with suspected deep vein thrombosis in the Emergency Department: combining use of a clinical diagnosis model with d-dimer testing. J Emerg Med 2000;19:225-30.
13. Wildberger JE, Vorwerk D, Kilbinger M, et al. Bedside testing (SimpliRED) in the diagnosis of deep vein thrombosis: evaluation of 250 patients. Invest Radiol 1998;33:232-35.
14. Spritzer CE, Sostman HD, Wilkes DC, Coleman RE. Deep venous thrombosis: experience with gradient-echo MR imaging in 66 patients. Radiology 1990;177:235-41.
15. Moody AR, Pollock JG, O’Connor AR, Bagnall M. Lower-limb deep venous thrombosis: direct MR imaging of the thrombus. Radiology 1998;209:349-55.
16. Vukov LF, Berquist TH, King BF. Magnetic resonance imaging for calf deep venous thrombophlebitis. Ann Emerg Med 1991;20:497-99.
17. Laissy JP, Cinqualbre A, Loshkajian A, et al. Assessment of deep venous thrombosis in the lower limbs and pelvis: MR venography versus duplex Doppler sonography. Am J Roentgenol 1996;167:971-75.
18. Erdman WA, Jayson HT, Redman HC, et al. Deep venous thrombosis of extremities: role of MR imaging in the diagnosis. Radiology 1990;174:425-31.
19. Spritzer CE, Norconk JJ, Sostman HD, Coleman RE. Detection of deep venous thrombosis by magnetic resonance imaging. Chest 1993;104:54-60.
20. ACCP Consensus Committee on Pulmonary Embolism. Opinions regarding the diagnosis and management of venous thromboembolic disease chest. 1998;113:499-504.
21. American Thoracic Society. The diagnostic approach to acute venous thromboembolism clinical practice guideline. Am J Respir Crit Care Med 1999;160:1043-66.
22. Cogo A, Lensing AW, Koopman MW, et al. Compression ultrasonography for diagnostic management of patients with clinically suspected deep vein thrombosis: prospective cohort study. BMJ 1998;316:17-20.
23. Birdwell BG, Raskob GE, Whitsett TL, et al. The clinical validity of normal compression ultrasonography in outpatients suspected of having deep venous thrombosis. Ann Intern Med 1998;128:1-7.
24. Heijboer H, Buller HR, Lensing AW, et al. A comparison of real-time compression ultrasonography with impedance plethysmography for the diagnosis of deep-vein thrombosis in symptomatic outpatients. N Engl J Med 1993;329:1365-69.
25. Bernardi F, Prandoni P, Lensing AWA, et al. D-dimer testing as an adjunct to ultrasonography in patients with clinically suspected deep vein thrombosis: prospective cohort study. BMJ 1998;317:1037-40.
What is a reasonable initial approach to the patient with fatigue?
Half of all patients presenting with fatigue have a psychological cause. Patients with a history of anxiety or depression or those with a duration of symptoms for more than 3 months are more likely to remain symptomatic 6 months later. Physicians should perform a physical examination, take a thorough history, and screen patients for depression using a validated primary care instrument, such as the Beck Depression Inventory or Prime-MD. Physicians may also consider a directed laboratory evaluation with sedimentation rate, blood count, and glycohemoglobin and thyroid stimulating hormone (TSH) levels, particularly in older patients.
Grade of Recommendation: C, based on case series and expert opinion
Recommendations from others
A guideline developed by a group of family physicians1 provides the best overview of the topic. They recommend performing a detailed history and physical examination with further investigation reserved for patients with signs and symptoms of treatable causes of fatigue, such as anemia or hypothyroidism. They also recommend a somewhat more aggressive approach to investigation for patients older than 65 years.
Evidence summary
Before evaluating a patient presenting with fatigue, we must know the differential diagnosis in primary care practice for this complaint. Approximately 10% of patients visiting a primary care practice report fatigue of at least 1 month’s duration.2 Ridsdale identified 220 British patients presenting to a general practitioner with a chief complaint of fatigue. Physicians performed a thorough history and physical; took a complete blood count; tested the levels of blood or urine glucose, electrolytes, sedimentation rate, TSH, and urea; and tested for mononucleosis (if younger than 40). Only 19 (8%) were given a diagnosis based on the laboratory evaluation: 8 had anemia, 3 were hypothyroid, 3 had mononucleosis, 3 had other infections, 1 had diabetes, and 1 had carcinomatosis.3Table 1 shows results from 4 other series of fatigued patients.
Regarding prognosis, 59% of patients were still fatigued after 6 months.3 Patients with a previous diagnosis of anxiety or depression (odds ratio [OR] =3.0; 95% confidence interval [CI], 1.4 - 6.1), those with symptoms for more than 3 months (OR= 2.1, 95% CI, 1.1 - 4.1), and those with more education (OR=3.5; 95% CI, 3.2 - 3.8) were more likely to remain fatigued at follow-up.3,7
To summarize, of 100 patients presenting to a primary care physician with fatigue, approximately 25 will be depressed; 25 will have another psychiatric diagnosis, such as dysthymia or anxiety; 15 will have an infection, such as hepatitis, cytomegalovirus, or mononucleosis; 15 will have another physiological cause of fatigue, such as undiagnosed diabetes, anemia, or hypothyroidism; and 20 will remain undiagnosed.
A recent systematic review of case-finding instruments for depression in primary care found that most instruments are similar in accuracy (84% sensitive, 72% specific).8 If applied to a group of fatigued patients with a 25% probability of depression, 50% of patients with an abnormal result on one of these case-finding instruments would be depressed compared with only 7% who had a normal or negative result. A primary care physician’s clinical impression based on their interview of a patient has not been formally evaluated for its accuracy in the diagnosis of depression. A 2-question screen has good sensitivity but poor specificity (43% of nondepressed patients will be labeled as depressed by this instrument).9
Jeffery L. Belden, MD
Family Health Care (private practice) Columbia, Missouri
E-mail: Jbeldenmd@trib.net
The evidence reviewed and the recommendations fit fairly well with my clinical impressions and approach to patients presenting with fatigue. However, I find that a substantial proportion have sleep deprivation, lack of adequate exercise, or their life is in some way out of balance (too much work, stress, or busyness with inadequate play, replenishment, or spiritual reflection and renewal). I am not convinced of the value of a routine sedimentation rate test unless the patient is elderly, has some other historical factor suggesting its utility, or has absolutely no other explanation for their symptoms. I seldom use depression-screening instruments since I simply take a history focused on depressive symptoms. Use of a depression screen before I enter the room would help focus and shorten the visit, and detect cases of depression I might otherwise miss. I will consider implementing such a practice for patients who present with fatigue or insomnia.
1. Godwin M, Delva D, Miller K, et al. Investigating fatigue of less than 6 month’s duration: Guidelines for family physicians. Can Fam Phys 1999;45:373-9.
2. David A, Pelosi A, McDonald E, et al. Tired, weak, or in need of rest: fatigue among general practice attenders. BMJ 1990;301:1199-202.
3. Ridsdale L, Evans A, Jerrett W, et al. Patients with fatigue in general practice: a prospective study. BMJ 1993;307:103-6.
4. Morrison JD. Fatigue as a presenting complain in family practice. J Fam Pract 1980;10:795-801.
5. Sugarman JR, Berg AO. Evaluation of fatigue in a family practice. J Fam Pract 1984;19:643-7.
6. Elnicki M, Shockcor WT, Brick E, Beynon D. Evaluating the compliant of fatigue in primary care: diagnoses and outcomes. Am J Med 1992;93:303-6.
7. Valdini AF, Steinhardt S, Valicenti J, Jaffe A. A one-year follow-up of fatigued patients. J Fam Pract 1988;26:33-8.
8. Mulrow CD, Williams JW, Gerety MB, et al. Case-finding instruments for depression in primary care settings. Ann Intern Med 1995;123:913-21.
9. Case-finding instruments for depression. Two questions are as good as many. J Gen Intern Med. 1997;12:439-45.
Half of all patients presenting with fatigue have a psychological cause. Patients with a history of anxiety or depression or those with a duration of symptoms for more than 3 months are more likely to remain symptomatic 6 months later. Physicians should perform a physical examination, take a thorough history, and screen patients for depression using a validated primary care instrument, such as the Beck Depression Inventory or Prime-MD. Physicians may also consider a directed laboratory evaluation with sedimentation rate, blood count, and glycohemoglobin and thyroid stimulating hormone (TSH) levels, particularly in older patients.
Grade of Recommendation: C, based on case series and expert opinion
Recommendations from others
A guideline developed by a group of family physicians1 provides the best overview of the topic. They recommend performing a detailed history and physical examination with further investigation reserved for patients with signs and symptoms of treatable causes of fatigue, such as anemia or hypothyroidism. They also recommend a somewhat more aggressive approach to investigation for patients older than 65 years.
Evidence summary
Before evaluating a patient presenting with fatigue, we must know the differential diagnosis in primary care practice for this complaint. Approximately 10% of patients visiting a primary care practice report fatigue of at least 1 month’s duration.2 Ridsdale identified 220 British patients presenting to a general practitioner with a chief complaint of fatigue. Physicians performed a thorough history and physical; took a complete blood count; tested the levels of blood or urine glucose, electrolytes, sedimentation rate, TSH, and urea; and tested for mononucleosis (if younger than 40). Only 19 (8%) were given a diagnosis based on the laboratory evaluation: 8 had anemia, 3 were hypothyroid, 3 had mononucleosis, 3 had other infections, 1 had diabetes, and 1 had carcinomatosis.3Table 1 shows results from 4 other series of fatigued patients.
Regarding prognosis, 59% of patients were still fatigued after 6 months.3 Patients with a previous diagnosis of anxiety or depression (odds ratio [OR] =3.0; 95% confidence interval [CI], 1.4 - 6.1), those with symptoms for more than 3 months (OR= 2.1, 95% CI, 1.1 - 4.1), and those with more education (OR=3.5; 95% CI, 3.2 - 3.8) were more likely to remain fatigued at follow-up.3,7
To summarize, of 100 patients presenting to a primary care physician with fatigue, approximately 25 will be depressed; 25 will have another psychiatric diagnosis, such as dysthymia or anxiety; 15 will have an infection, such as hepatitis, cytomegalovirus, or mononucleosis; 15 will have another physiological cause of fatigue, such as undiagnosed diabetes, anemia, or hypothyroidism; and 20 will remain undiagnosed.
A recent systematic review of case-finding instruments for depression in primary care found that most instruments are similar in accuracy (84% sensitive, 72% specific).8 If applied to a group of fatigued patients with a 25% probability of depression, 50% of patients with an abnormal result on one of these case-finding instruments would be depressed compared with only 7% who had a normal or negative result. A primary care physician’s clinical impression based on their interview of a patient has not been formally evaluated for its accuracy in the diagnosis of depression. A 2-question screen has good sensitivity but poor specificity (43% of nondepressed patients will be labeled as depressed by this instrument).9
Jeffery L. Belden, MD
Family Health Care (private practice) Columbia, Missouri
E-mail: Jbeldenmd@trib.net
The evidence reviewed and the recommendations fit fairly well with my clinical impressions and approach to patients presenting with fatigue. However, I find that a substantial proportion have sleep deprivation, lack of adequate exercise, or their life is in some way out of balance (too much work, stress, or busyness with inadequate play, replenishment, or spiritual reflection and renewal). I am not convinced of the value of a routine sedimentation rate test unless the patient is elderly, has some other historical factor suggesting its utility, or has absolutely no other explanation for their symptoms. I seldom use depression-screening instruments since I simply take a history focused on depressive symptoms. Use of a depression screen before I enter the room would help focus and shorten the visit, and detect cases of depression I might otherwise miss. I will consider implementing such a practice for patients who present with fatigue or insomnia.
1. Godwin M, Delva D, Miller K, et al. Investigating fatigue of less than 6 month’s duration: Guidelines for family physicians. Can Fam Phys 1999;45:373-9.
2. David A, Pelosi A, McDonald E, et al. Tired, weak, or in need of rest: fatigue among general practice attenders. BMJ 1990;301:1199-202.
3. Ridsdale L, Evans A, Jerrett W, et al. Patients with fatigue in general practice: a prospective study. BMJ 1993;307:103-6.
4. Morrison JD. Fatigue as a presenting complain in family practice. J Fam Pract 1980;10:795-801.
5. Sugarman JR, Berg AO. Evaluation of fatigue in a family practice. J Fam Pract 1984;19:643-7.
6. Elnicki M, Shockcor WT, Brick E, Beynon D. Evaluating the compliant of fatigue in primary care: diagnoses and outcomes. Am J Med 1992;93:303-6.
7. Valdini AF, Steinhardt S, Valicenti J, Jaffe A. A one-year follow-up of fatigued patients. J Fam Pract 1988;26:33-8.
8. Mulrow CD, Williams JW, Gerety MB, et al. Case-finding instruments for depression in primary care settings. Ann Intern Med 1995;123:913-21.
9. Case-finding instruments for depression. Two questions are as good as many. J Gen Intern Med. 1997;12:439-45.
New Features for the New Year: What They Are and How to Use Them
Keeping up to date with the most relevant high-quality medical information is an important challenge for family physicians. In addition to being a leading source of original research, The Journal of Family Practice has been an innovator in this area with Patient-Oriented Evidence that Matters (POEMs). Each month the editors of the feature review more than 90 journals, identify the 8 most important POEMs, and then a team of skilled reviewers critically appraises them for our readers. More than 450 POEMs have been written to date, and they’ve become an important resource for evidence-based practice.
POEMs are a tool for foraging—the daily, weekly, and monthly task of reviewing new information from the medical literature and integrating it into practice. However, as pointed out in last month’s editorial by Steve Woolf, MD, MPH, POEMs are only part of the story. Each POEM is one skein in the larger tapestry that makes up a patient care decision.
In this issue of JFP we are launching 2 new features that help round out your medical information needs. “Applied Evidence” and “Clinical Inquiries” are now grouped with POEMs under the heading “Putting Evidence into Practice.” Applied Evidence, coordinated by Associate Editor Cheryl Flynn, MD, MS, is a monthly series of review articles aimed at clinicians. Each article will tackle the evaluation of a common clinical problem or treatment of a common condition in primary care practice. The authors of Applied Evidence reviews will be asked to focus on the best available evidence and organize it using a concise, structured, evidence-based format. This format is described in detail on our Web site, www.jfponline.com. We’ve also provided a glossary of evidence-based terms, a key to how we rate the quality of evidence, and a link to a free on-line course in Information Mastery on our Web site.
The topics for Applied Evidence reviews were developed after careful study of the most common problems facing family physicians in clinical practice. Our goal is to cover the breadth of family practice and to help family physicians provide the highest quality of care for their patients based on the best available evidence. Dr Flynn and I have written the first 2 reviews to get our series started. Authors interested in writing for this series are encouraged to contact Dr Flynn (flynnc@upstate.edu). We still welcome formal systematic reviews and meta-analyses that focus on a narrower clinical question and exhaustively review the literature. These will be published under “Original Research.”
The second new feature is Clinical Inquiries, edited by Bernard Ewigman, MD, MSPH, James Stevermer MD, MSPH, and Erik Lindbloom, MD, MSPH, of the University of Missouri. This is the first tangible product of the Family Practice Inquiries Network (FPIN). I am confident that FPIN will be an important source of high-quality medical information for primary care physicians in the years to come, and I am pleased that we are partners in this important effort. Each month we will answer real questions from family physicians in clinical practice using a concise, structured format. Each answer will include a brief review of the evidence focused on the highest-quality studies and systematic reviews, a summary of what others recommend, and a clinical commentary. If you are interested in writing for this feature, please contact Dr Lindbloom (LindbloomE@health.missouri.edu).
New times and new challenges call for new tools. POEMs, Applied Evidence, and Clinical Inquiries will give you the tools you need as a family physician to master your information needs and to continue to provide the highest possible quality of care to your patients.
A Systematic Review of Troponin T and I Values as a Prognostic Tool for Patients with Chest Pain
OBJECTIVE: The accuracy of the troponin T and I test as a prognostic tool for patients with chest pain varies considerably depending on the patient population, the cutoff for an abnormal test result, and other factors. The goal of our systematic review was to synthesize the best available evidence on this topic.
SEARCH STRATEGY: We searched the MEDLINE database, bibliographies of identified articles, and articles identified from a previous meta-analysis of diagnosis.
SELECTION CRITERIA: We included cohort studies that had at least 80% follow-up and reported useful data.
DATA COLLECTION AND ANALYSIS: Data from each study were abstracted by 2 investigators. We calculated sensitivity and specificity for the prediction of death, fatal or nonfatal myocardial infarction (MI), or any cardiac event for each combination of patient population, troponin test, interval from admission to blood draw, and cutoff for an abnormal test result.
MAIN RESULTS: For patients with chest pain and a normal electrocardiogram, the peak troponin I level drawn 6 or more hours after the onset of chest pain is useful for identifying patients at low risk of death or nonfatal MI at 30 days (negative likelihood ratio=0.07; probability of outcome=0.3% with a negative test, given a pretest probability of 4.4%). For patients with unstable angina, the sensitivity of troponin I for the identification of patients who die or have a nonfatal MI in the next 30 days is only 59%, and the specificity is only 79%. The sensitivity and specificity varied widely for patients with unstable angina or non-Q-wave MI depending on the inclusion criteria, cutoff used, timing of the blood draw, duration of follow-up, and other factors.
CONCLUSIONS: If the peak troponin T or I level measured at least 6 hours after the onset of chest pain symptoms is in the normal range in a patient with a normal electrocardiogram, it is very unlikely that the patient will die or have a nonfatal MI in the next 30 days (1%). The initial troponin value is not as helpful as the peak value at least 6 hours after the onset of chest pain. An abnormal troponin test result for patients with unstable angina or non-Q-wave MI identifies a subset at greater risk of death.
Not all patients with acute chest pain can be monitored as inpatients. Some are sent home with instructions to follow up with their personal physician, while others have noninvasive cardiovascular testing scheduled as outpatients. Formal protocols that use the history, physical examination, laboratory tests, or noninvasive testing have been developed and shown to reduce costs and improve outcomes.1-4
Recently, it has been suggested that troponin T and I values may be useful for prognosis in patients with acute chest pain in the emergency department.5,6 These enzymes are released by damaged cardiac muscle. However, the accuracy of troponin levels for the diagnosis of acute myocardial infarction (MI) varies considerably, depending on the specific test used, cutoff to define an abnormal test result, and timing of the blood test in relation to the onset of chest pain.7 The usefulness of these tests for prognosis is likely to be affected by the same factors.
The authors of several previous meta-analyses have considered this question. However, all of these studies had significant limitations. Wu and colleagues5 published a meta-analysis in 1995 that obviously could not include the large number of studies published since that time. The meta-analysis by Ollatidoye and colleagues6 included more studies but did not distinguish between different cutoffs to define an abnormal test result, combined all intervals from 4 days to 1095 days into a single summary estimate, and did not consider the time at which the troponin test was drawn in relation to either emergency department arrival or the onset of chest pain. In our study, we systematically reviewed the evidence for the accuracy of troponin T and I values in determining the prognosis of patients presenting to the emergency department with chest pain, unstable angina, and other acute coronary syndromes.
Methods
Search Strategy
We conducted searches of the MEDLINE database in June 1999 and December 1999 (the second search was of 1999 only). We used the following search strategy: troponin [text word] or troponin [MeSH] and prognosis [MeSH]. Studies were limited to those that provided an abstract, were written in English or German, and used human subjects. The October through December 1999 issues of the American Journal of Cardiology, the Journal of the American College of Cardiology, the American Heart Journal, and Clinical Chemistry were hand-searched. We also reviewed the bibliographies of articles meeting the final inclusion criteria. The abstract of each article was reviewed by one of the investigators, and articles were evaluated in detail if troponin levels were used to predict the prognosis of patients with chest pain, unstable angina, or other acute coronary syndromes.
Inclusion Criteria and Assessment of Study Quality
Inclusion criteria were designed to identify only those studies meeting Level 1b criteria, as defined by the Centre for Evidence-Based Medicine (cebm.jr2.ox.ac.uk/docs/levels.html). These inclusion criteria are:
- Prospective cohort study
- Adult patients with acute chest pain or other acute coronary syndrome
- At least 80% follow-up of patients
- Death, fatal or nonfatal MI, or any cardiac event at some point following hospital discharge
We excluded studies reporting only in-hospital outcomes and those without sufficient data to calculate sensitivity or specificity for at least one outcome.
Data Abstraction
Two independent investigators (either ME and DW or ME and LW) reviewed each article and abstracted data related to study quality, inclusion criteria, and test characteristics. Any discrepancies were resolved by consensus decision. The following data were abstracted: reference, study design, percentage of follow-up, outcomes measured, inclusion criteria for patients in the study, and data needed to calculate sensitivity or specificity.
Statistical Analysis
The primary outcomes were the test characteristics (sensitivity, specificity, post-test probability positive and negative, and positive and negative likelihood ratios* [LR+ and LR-, respectively]) for each combination of inclusion criteria, diagnostic test, and patient outcome.
Where possible, summary estimates of sensitivity and specificity were made using a DerSimonian and Laird random effects model. Sensitivity and specificity were pooled independently and weighted by the inverse of the variance using MetaTest software (version 0.6, Joseph Lau, MD, used with permission). If a fixed effects model and a random effects model calculated similar estimates of sensitivity or specificity, the statistic was deemed homogenous, and the more conservative random effects model result was reported. If the fixed effects model and the random effects model gave estimates that were different in a clinically meaningful way, the statistic was deemed heterogeneous, and only a range was reported.
Results
Twenty-eight studies met the inclusion criteria and had usable data for our systematic review.6,8-34 Two studies used the research version of the Baxter Stratus enzyme-linked immunosorbent assay troponin I assay. A cutoff of 3.1 ng/mL corresponds to a cutoff of 0.6 in the commercial version of this assay.15,19 One study28 measured the troponin T level at 10 or more hours after the onset of chest pain. This was included with studies measuring the peak value within the first 24 hours. The study by Kerr and Dunt10 measured the troponin T value at 14 hours after the onset of chest pain. The study by Janorkar and colleagues31 followed patients for a variable length of time with a mean follow-up of 9 months and a standard deviation of 4 months.
In general, the studies used a wide variety of cutoffs, durations of follow-up, inclusion criteria, and outcomes. We have organized the results in 3 tables on the basis of the 3 populations studied in the available literature. [Table 1] shows data for patients with chest pain syndromes, [Table 2] for patients with unstable angina, and [Table 3] for patients with unstable angina or non-Q-wave MI. Unstable angina was generally defined as chest pain accompanied by electrocardiogram (ECG) changes but without evidence of MI, and non-Q-wave MI was defined on the basis of clinical and biochemical criteria for MI but without Q waves on the ECG.
Patients with Chest Pain
Troponin I. Only 1 study14 of patients with chest pain used the troponin I test, in this case a rapid bedside assay. It included 773 patients with chest pain and a normal ECG and used death or nonfatal MI as the outcome. The authors reported a sensitivity of 0.94, a specificity of 0.81, an LR+ of 5.0, and a very low LR- of 0.07.
Troponin T. Only 2 studies examined the accuracy of troponin T in patients with nontraumatic chest pain.11,20 However, neither reported the rates of death or nonfatal MI during follow-up in a way that allowed calculation of sensitivity and specificity. The range of sensitivity for any cardiac event was from 0.31 to 0.54, the specificity from 0.78 to 0.92, the LR+ from 2.4 to 3.8, and the LR- from 0.6 to 0.7. Among patients with chest pain and a normal ECG, Hamm and coworkers14 reported an LR+ of 6.1 and an LR- of 0.2. Three studies included patients with chest pain who were admitted to rule out MI and were followed for 180 days to 2 years.8-10 They reported a range of sensitivity of 0.52 to 0.67, specificity from 0.72 to 0.83, LR+ from 2.3 to 3.2, and LR- from 0.5 to 0.6.
Patients with Unstable Angina
Troponin I. Three studies of troponin I included patients with unstable angina and used the outcome of death during follow-up. The duration of follow-up ranged from 30 days to 9 months, and the cutoff for an abnormal test result was from 0.6 to 1.5 ng/mL.19,21,31 The sensitivity varied widely from 0.5 to 1.0; however, 2 of the studies were small, with only 2 deaths in each study. The largest study found a sensitivity of only 0.52 and specificity of 0.73.21 For studies of troponin I using death or nonfatal MI as an outcome, results from 3 studies15,18,22 could be combined, because the study designs were similar. They used a cutoff of 0.6 ng/mL, followed patients for 30 days, and used the peak troponin value in the first 8 to 72 hours. The summary test characteristics for these 3 studies were a sensitivity of 0.59, a specificity of 0.79, an LR+ of 2.8, and an LR- of 0.5.
Troponin T. Using unstable angina to determine inclusion and 30 days as the duration of follow-up, several studies found a low sensitivity of troponin T as a prognostic test. Three studies of unstable angina were quite similar in design and inclusion, using a cutoff of 0.1 ng/mL, blood drawn on admission to the emergency department, and an outcome of death at 30 days.16,21,24 The summary test characteristics for these studies were a sensitivity of 0.63, a specificity of 0.66, an LR+ of 1.9, and an LR- of 0.6.
Depending on the combination of cutoff, timing of the blood draw, and duration of follow-up, a positive troponin T had a range of sensitivity from 0.38 to 0.63 and of specificity from 0.77 to 0.95 for the outcome of death or nonfatal MI at 30 days.6,18,19,23,26,27 Two studies 18.19 were similar in design, and their test characteristics could be combined (sensitivity=0.44, specificity=0.81, LR+=2.3, and LR-=0.7).
Patients with Unstable Angina or Non-Q-Wave MI
Troponin I .A positive troponin I in patients with unstable angina or non-Q-wave MI produced sensitivities from 0.72 to 0.78 and specificities from 0.59 to 0.60 for the outcome of death at 30 to 42 days.18,34 For the outcome of death or nonfatal Ml using the same inclusion criteria, the range of sensitivity was from 0.59 to 1.00 and of specificity was from 0.60 to 0.74.18,32,33
Troponin T. For an outcome of death, the LR+ was 1.3 to 1.8, and the LR- was 0.0 to 0.3.18,29 The study29 with an LR- of 0.0 had no false-negatives and a sensitivity of 1.0; it used a very low cutoff of 0.06 for an abnormal test result. Using the same cohort with a cutoff of 0.2, the investigators found a sensitivity of 0.72 and a specificity of 0.45. As expected, a lower cutoff improved the sensitivity of the test.
Discussion
Although one goal of systemic reviews is to pool study data from multiple sources to calculate summary measures of test accuracy, not all reviews can achieve that goal. In our study, a lack of standardization in study parameters limited our ability to combine summary estimates effectively. However, we have identified several important guidelines for clinicians using the troponin test and for future research in this area.
Most studies of the troponin test have evaluated it in patients with unstable angina or unstable angina and non-Q-wave MI. Although the test has some value in the non-Q-wave MI patients for identifying higher-risk and lower-risk groups, all such patients would generally be admitted to the hospital and followed closely. For primary care and emergency physicians evaluating a patient with chest pain in the emergency department, an important goal is to identify patients for whom adverse cardiac events such as death or nonfatal MI are unlikely in the near future. These patients could be sent home to follow up with their primary care physician and possibly undergo noninvasive testing as outpatients.
Unfortunately, only a few studies have included patients with chest pain or patients with chest pain and a normal ECG. The most useful study is that of Hamm and colleagues.14 In their study of 773 patients with chest pain and no ST elevation, troponin T and I both had a low LR- for the identification of patients at low risk of death or nonfatal MI in the 30 days following their episode of chest pain. Only 1 in 300 patients with a normal ECG and normal troponin I 6 hours after the onset of chest pain had an adverse outcome in the 30 days after hospital discharge and only 1 in 100 of those with normal ECG and normal troponin T. Although the troponin T test actually had a lower LR- and was potentially more useful, this test is not widely available in the United States. More studies of both troponin T and I are needed among patients with chest pain or chest pain and normal ECG to validate the findings of Hamm and coworkers.
Using a lower cutoff for abnormal with troponin T improves the sensitivity of the test. Lindahl and colleagues29 found a sensitivity of 1.0 at a cutoff of 0.06 for the outcome of death in a study of patients with unstable angina or non-Q-wave MI; the sensitivity was only 0.86 for a cutoff of 0.2. Other pairs of studies had a similar pattern, which was expected. Future studies should report the sensitivity and specificity of the tests for several cutoffs, including lower values such as 0.05 ng/mL for troponin T.
Also, the sensitivity of troponin was improved when the peak value in the first 6 to 24 hours of admission was used instead of the value on admission to the emergency department. For example, among patients with unstable angina the sensitivity was 0.63 when blood was drawn on admission to the emergency department16,21,24 and 1.0 when the peak value in the first 16 hours was used.24 This makes physiologic sense, since patients presenting early in the course of their episode of unstable angina or MI may have undetectable levels of troponin which rise as the episode progresses.
Recommendations for future research
To facilitate future meta-analyses, we recommend the following parameters for the design of studies of troponin. First, studies should use larger populations and standardize their inclusion and testing criteria. We also recommend durations of follow-up of 7 days, 30 days, and 1 year. Although a longer duration is helpful in predicting the patient’s overall prognosis, shorter durations are more useful for identifying patients who can be discharged for close outpatient follow-up and noninvasive testing. Cutoffs of 0.05 ng/mL, 0.10 ng/mL, and 0.20 ng/mL for troponin T and cutoffs of 0.3 and 0.6 for troponin I should be used. Authors should report the test characteristics for several cutoffs and also for ranges of troponin, such as less than 0.05 ng/mL, 0.06 ng/mL to 0.10 ng/mL, and greater than 0.10 ng/mL. In addition, we recommend that sensitivity and specificity be reported both for the initial value on admission to the emergency department and for peak values after 12 and 24 hours. Finally, standard definitions for inclusion criteria and outcomes should be used, such as the Braunwald criteria* for unstable angina and the World Health Organization criteria for acute MI.
We also suggest that valuable information would be added if population demographics were reported in study results. Although most studies considered patient demographics carefully in determining study eligibility, they did not report those characteristics in their findings. It is not clear, for example, that the test performs similarly in younger and older patients, in men and women, or in different ethnic or racial groups.
Finally, we recommend that more studies evaluate the accuracy of troponin I in prognosis, particularly among patients with chest pain syndromes. Of the 28 studies we analyzed, only 11 measured troponin I and only 1 enrolled patients who had chest pain and a normal ECG.
Recommendations for practice
If the peak troponin T or I level measured at least 6 hours after the onset of chest pain symptoms is in the normal range and the ECG is normal, it is very unlikely that the patient will die or have a nonfatal MI in the next 30 days (1%).14 It is important to note that decisions about care should be made on the basis of the troponin value and ECG and in light of the patient’s clinical presentation and comorbidities, and that this finding is based on only 1 study, albeit a large one. The initial troponin value is not as helpful as the peak value at least 6 hours after the onset of chest pain. An abnormal troponin test in patients with unstable angina or non-Q-wave MI identifies a subset at greater risk of death; those patients should be closely monitored.
Acknowledgments
This project was supported by the Michigan Consortium for Family Practice Research, one of 3 research centers funded by the American Academy of Family Physicians. We wish to acknowledge the assistance of Dan Flewelling in the literature search and of Deb Richardson in the preparation of the manuscript.
1. TH, Juarez G, Cook EF, et al. Ruling out acute myocardial infarction: a prospective multicenter validation of a 12-hour strategy for patients at low risk. N Engl J Med 1991;324:1239-46.
2. TH, Cook EF, Weisberg M, Sargent RK, Wilson C, Goldman L. Acute chest pain in the emergency room: identification and examination of low risk patients. Arch Intern Med 1985;145:65-69.
3. RR, Zalenski RJ, Mensay EK, et al. Costs of an emergency department based accelerated diagnostic protocol vs hospitalization in patients with chest pain: a randomized controlled trial. JAMA 1997;278:1670-76.
4. ME, Smars PA, Reeder GS, et al. A clinical trial of a chest-pain observation unit for patients with unstable angina. N Engl J Med 1998;339:1882-88.
5. Software, version 0.6. Joseph Lau, MD, New England Medical Center. Used with permission.
6. AG, Wu AH, Feng YJ, Waters D. Prognostic role of troponin T versus troponin I in unstable angina pectoris for cardiac events with meta-analysis comparing published studies. Am J Cardiol 1998;81:1405-10.
7. MH, Flynn C, Fiewelling D. A systematic review of troponin T and I for diagnosing acute myocardial infarction. J Fam Pract 2000;49:550-56.
8. J, Horder M, Gerhardt W, et al. Diagnostic performance and prognostic value of serum troponin T in suspected acute myocardial infarction. Scand J Clin Lab Invest 1993;53:677-85.
9. J, Nissen H, Horder M, Thygesen K. Independent prognostic value of serum creatine kinase isoenzyme MB mass, cardiac troponin T and myosin light chain levels in suspected acute myocardial infarction. Am Coll Cardiol 1995;25:574-81.
10. GD, Dunt DR. Early prediction of risk in patients with suspected unstable angina using serum troponin T. Aust NZ J Med 1997;27:554-60.
11. GB, Beaudreau RW, Chan DW, DeLong D, Kelley CA, Kelen GD. Use of troponin T and creatine kinase-MB subunit levels for risk stratification of emergency department patients with possible myocardial ischemia. Ann Emerg Med 1998;31:19-29.
12. EM, Sacks DB, Rifai N, McCabe CH, Cannon CP, Braunwald E. Time to positivity of a rapid bedside assay for cardiac-specific troponin T predicts prognosis in acute coronary syndromes: a thrombolysis in myocardial infarction (TIMI) 11A substudy. J Am Coll Cardiol 1998;31:326-30.
13. ER, Ryan T, Segar D, et al. Clinical utility of troponin T levels and echocardiography in the emergency department. Am Heart J 1998;135:253-60.
14. CW, Goldmann B, Heeschen C, Kreymann G, Berger J, Meinertz T. Emergency room triage of patients with acute chest pain by means of rapid testing for cardiac troponin T or troponin 1. N Engi J Med 1997;337:1648-53.
15. M, Oftani F, Ferrini D, et al. Prognostic influence of elevated values of cardiac troponin I in patients with unstable angina. Circulation 1997;95:2053-59.
16. EM, Armstrong PW, Christenson RH, et al. Cardiac troponin T levels for risk stratification in acute myocardial ischemia. N Engl J Med 1996;335:1333-41.
17. Winter RJ, Koster RW, Schotveld JH, Sturk A, van Stallen JP, Sanders GT. Prognostic value of troponin T, myoglobin, and CK-MB mass in patients presenting with chest pain without acute myocardial infarction. Heart 1996;75:235-39.
18. MS, Thygesen K, Ravkilde J, Heickendorff L. Applicability of cardiac troponin T and I for early risk stratification in unstable coronary artery disease. Circulation 1997;96:2578-85.
19. F, Galvani M, Ferrini D, Ladenson JH, et al. Direct comparison of early elevations of cardiac troponin T and I in patients with clinical unstable angina. Am Heart J 1999;137:284-91.
20. MR, Kaufmann KH, Chen IW, et al. Measurement of cardiac troponin T is an effective method for predicting complications among emergency department patients with chest pain. Ann Emerg Med 1998;31:539-49.
21. RH, Duh SH, Newby LK, et al. Cardiac troponin T and cardiac troponin 1: relative values in short-term risk stratification of patients with acute coronary syndromes. Clin Chem 1998;44:494-501.
22. E, Chiappino I, Bergerone S, et al. Prognostic implications of detection of troponin I in patients with unstable angina pectoris. Am J Cardiol 1998;82:971-73.
23. AG, Quaranta G, Liuzzo G, et al. Incremental prognostic value of serum levels of troponin T and C-reactive protein on admission in patients with unstable angina pectoris. Am J Cardiol 1998;82:715-19.
24. LK, Christenson RH, Ohman EM, et al. Value of serial troponin T measures for early and late risk stratification in patients with acute coronary syndromes. Circulation 1998;98:1853-59.
25. L, Luscher MS, Clemmensen P, Thygesen K, Grande P. Very early risk stratification using combined ECG and biochemical assessment in patients with unstable coronary artery disease. TRIM substudy. Circulation 1998;98:2004-09.
26. P, Collinson P, Mosely D, et al. Prospective study of the role of cardiac troponin T in patients admitted with unstable angina. BMJ 1996;313:262-64.
27. BL, Andersen K, Dellborg M, et al. Admission risk assessment by cardiac troponin T in unstable coronary artery disease: additional prognostic information from continuous ST segment monitoring. J Am Coll Cardiol 1999;33:1519-27.
28. CR, et al. Diagnostic accuracy, angiographic correlates and long-term risk stratification with the troponin T ultra sensitive rapid assay in chest pain patients at low risk for acute myocardial infarction. Eur Heart J 1998;19 (suppl N):N42-47.
29. B, Andren B, Ohlsson J, Penge P, Wallentin L. Risk stratification in unstable coronary artery disease: additive value of troponin T determinations and pre-discharge exercise tests. Eur Heart J 1997;18:762-70.
30. VJ, Kumar DS, Baruah DK. Serum troponin T in unstable angina-a preliminary report. Indian Heart J 1994;46:89-90.
31. S, Koning R, Eitchaninoff H, et al. Relation between serum cardiac troponin I values and severity of clinical, electrocardiographic and quantitative angiographic features in unstable angina. Indian Heart J 1999;51:31-34.
32. Winter RJ, Bholasingh R, Lijmer JG, et al. Independent prognostic value of creactive protein and troponin I in patients with unstable angina or non-Q-wave myocardial infarction. Cardiovascular Res 1999;42:240-45.
33. S, Nishimura S, Tashiro Y, et al. Cardiac troponin-I in diagnosis and prognosis of unstable coronary artery disease. Clin Chem 1997;43:Sl 57.-
34. EM, Tanasijevic MJ, Thompson B, et al. Cardiac-specific troponin I levels to predict the risk of mortality in patients with acute coronary syndromes. N Engl J Med 1996;335:1342-9
OBJECTIVE: The accuracy of the troponin T and I test as a prognostic tool for patients with chest pain varies considerably depending on the patient population, the cutoff for an abnormal test result, and other factors. The goal of our systematic review was to synthesize the best available evidence on this topic.
SEARCH STRATEGY: We searched the MEDLINE database, bibliographies of identified articles, and articles identified from a previous meta-analysis of diagnosis.
SELECTION CRITERIA: We included cohort studies that had at least 80% follow-up and reported useful data.
DATA COLLECTION AND ANALYSIS: Data from each study were abstracted by 2 investigators. We calculated sensitivity and specificity for the prediction of death, fatal or nonfatal myocardial infarction (MI), or any cardiac event for each combination of patient population, troponin test, interval from admission to blood draw, and cutoff for an abnormal test result.
MAIN RESULTS: For patients with chest pain and a normal electrocardiogram, the peak troponin I level drawn 6 or more hours after the onset of chest pain is useful for identifying patients at low risk of death or nonfatal MI at 30 days (negative likelihood ratio=0.07; probability of outcome=0.3% with a negative test, given a pretest probability of 4.4%). For patients with unstable angina, the sensitivity of troponin I for the identification of patients who die or have a nonfatal MI in the next 30 days is only 59%, and the specificity is only 79%. The sensitivity and specificity varied widely for patients with unstable angina or non-Q-wave MI depending on the inclusion criteria, cutoff used, timing of the blood draw, duration of follow-up, and other factors.
CONCLUSIONS: If the peak troponin T or I level measured at least 6 hours after the onset of chest pain symptoms is in the normal range in a patient with a normal electrocardiogram, it is very unlikely that the patient will die or have a nonfatal MI in the next 30 days (1%). The initial troponin value is not as helpful as the peak value at least 6 hours after the onset of chest pain. An abnormal troponin test result for patients with unstable angina or non-Q-wave MI identifies a subset at greater risk of death.
Not all patients with acute chest pain can be monitored as inpatients. Some are sent home with instructions to follow up with their personal physician, while others have noninvasive cardiovascular testing scheduled as outpatients. Formal protocols that use the history, physical examination, laboratory tests, or noninvasive testing have been developed and shown to reduce costs and improve outcomes.1-4
Recently, it has been suggested that troponin T and I values may be useful for prognosis in patients with acute chest pain in the emergency department.5,6 These enzymes are released by damaged cardiac muscle. However, the accuracy of troponin levels for the diagnosis of acute myocardial infarction (MI) varies considerably, depending on the specific test used, cutoff to define an abnormal test result, and timing of the blood test in relation to the onset of chest pain.7 The usefulness of these tests for prognosis is likely to be affected by the same factors.
The authors of several previous meta-analyses have considered this question. However, all of these studies had significant limitations. Wu and colleagues5 published a meta-analysis in 1995 that obviously could not include the large number of studies published since that time. The meta-analysis by Ollatidoye and colleagues6 included more studies but did not distinguish between different cutoffs to define an abnormal test result, combined all intervals from 4 days to 1095 days into a single summary estimate, and did not consider the time at which the troponin test was drawn in relation to either emergency department arrival or the onset of chest pain. In our study, we systematically reviewed the evidence for the accuracy of troponin T and I values in determining the prognosis of patients presenting to the emergency department with chest pain, unstable angina, and other acute coronary syndromes.
Methods
Search Strategy
We conducted searches of the MEDLINE database in June 1999 and December 1999 (the second search was of 1999 only). We used the following search strategy: troponin [text word] or troponin [MeSH] and prognosis [MeSH]. Studies were limited to those that provided an abstract, were written in English or German, and used human subjects. The October through December 1999 issues of the American Journal of Cardiology, the Journal of the American College of Cardiology, the American Heart Journal, and Clinical Chemistry were hand-searched. We also reviewed the bibliographies of articles meeting the final inclusion criteria. The abstract of each article was reviewed by one of the investigators, and articles were evaluated in detail if troponin levels were used to predict the prognosis of patients with chest pain, unstable angina, or other acute coronary syndromes.
Inclusion Criteria and Assessment of Study Quality
Inclusion criteria were designed to identify only those studies meeting Level 1b criteria, as defined by the Centre for Evidence-Based Medicine (cebm.jr2.ox.ac.uk/docs/levels.html). These inclusion criteria are:
- Prospective cohort study
- Adult patients with acute chest pain or other acute coronary syndrome
- At least 80% follow-up of patients
- Death, fatal or nonfatal MI, or any cardiac event at some point following hospital discharge
We excluded studies reporting only in-hospital outcomes and those without sufficient data to calculate sensitivity or specificity for at least one outcome.
Data Abstraction
Two independent investigators (either ME and DW or ME and LW) reviewed each article and abstracted data related to study quality, inclusion criteria, and test characteristics. Any discrepancies were resolved by consensus decision. The following data were abstracted: reference, study design, percentage of follow-up, outcomes measured, inclusion criteria for patients in the study, and data needed to calculate sensitivity or specificity.
Statistical Analysis
The primary outcomes were the test characteristics (sensitivity, specificity, post-test probability positive and negative, and positive and negative likelihood ratios* [LR+ and LR-, respectively]) for each combination of inclusion criteria, diagnostic test, and patient outcome.
Where possible, summary estimates of sensitivity and specificity were made using a DerSimonian and Laird random effects model. Sensitivity and specificity were pooled independently and weighted by the inverse of the variance using MetaTest software (version 0.6, Joseph Lau, MD, used with permission). If a fixed effects model and a random effects model calculated similar estimates of sensitivity or specificity, the statistic was deemed homogenous, and the more conservative random effects model result was reported. If the fixed effects model and the random effects model gave estimates that were different in a clinically meaningful way, the statistic was deemed heterogeneous, and only a range was reported.
Results
Twenty-eight studies met the inclusion criteria and had usable data for our systematic review.6,8-34 Two studies used the research version of the Baxter Stratus enzyme-linked immunosorbent assay troponin I assay. A cutoff of 3.1 ng/mL corresponds to a cutoff of 0.6 in the commercial version of this assay.15,19 One study28 measured the troponin T level at 10 or more hours after the onset of chest pain. This was included with studies measuring the peak value within the first 24 hours. The study by Kerr and Dunt10 measured the troponin T value at 14 hours after the onset of chest pain. The study by Janorkar and colleagues31 followed patients for a variable length of time with a mean follow-up of 9 months and a standard deviation of 4 months.
In general, the studies used a wide variety of cutoffs, durations of follow-up, inclusion criteria, and outcomes. We have organized the results in 3 tables on the basis of the 3 populations studied in the available literature. [Table 1] shows data for patients with chest pain syndromes, [Table 2] for patients with unstable angina, and [Table 3] for patients with unstable angina or non-Q-wave MI. Unstable angina was generally defined as chest pain accompanied by electrocardiogram (ECG) changes but without evidence of MI, and non-Q-wave MI was defined on the basis of clinical and biochemical criteria for MI but without Q waves on the ECG.
Patients with Chest Pain
Troponin I. Only 1 study14 of patients with chest pain used the troponin I test, in this case a rapid bedside assay. It included 773 patients with chest pain and a normal ECG and used death or nonfatal MI as the outcome. The authors reported a sensitivity of 0.94, a specificity of 0.81, an LR+ of 5.0, and a very low LR- of 0.07.
Troponin T. Only 2 studies examined the accuracy of troponin T in patients with nontraumatic chest pain.11,20 However, neither reported the rates of death or nonfatal MI during follow-up in a way that allowed calculation of sensitivity and specificity. The range of sensitivity for any cardiac event was from 0.31 to 0.54, the specificity from 0.78 to 0.92, the LR+ from 2.4 to 3.8, and the LR- from 0.6 to 0.7. Among patients with chest pain and a normal ECG, Hamm and coworkers14 reported an LR+ of 6.1 and an LR- of 0.2. Three studies included patients with chest pain who were admitted to rule out MI and were followed for 180 days to 2 years.8-10 They reported a range of sensitivity of 0.52 to 0.67, specificity from 0.72 to 0.83, LR+ from 2.3 to 3.2, and LR- from 0.5 to 0.6.
Patients with Unstable Angina
Troponin I. Three studies of troponin I included patients with unstable angina and used the outcome of death during follow-up. The duration of follow-up ranged from 30 days to 9 months, and the cutoff for an abnormal test result was from 0.6 to 1.5 ng/mL.19,21,31 The sensitivity varied widely from 0.5 to 1.0; however, 2 of the studies were small, with only 2 deaths in each study. The largest study found a sensitivity of only 0.52 and specificity of 0.73.21 For studies of troponin I using death or nonfatal MI as an outcome, results from 3 studies15,18,22 could be combined, because the study designs were similar. They used a cutoff of 0.6 ng/mL, followed patients for 30 days, and used the peak troponin value in the first 8 to 72 hours. The summary test characteristics for these 3 studies were a sensitivity of 0.59, a specificity of 0.79, an LR+ of 2.8, and an LR- of 0.5.
Troponin T. Using unstable angina to determine inclusion and 30 days as the duration of follow-up, several studies found a low sensitivity of troponin T as a prognostic test. Three studies of unstable angina were quite similar in design and inclusion, using a cutoff of 0.1 ng/mL, blood drawn on admission to the emergency department, and an outcome of death at 30 days.16,21,24 The summary test characteristics for these studies were a sensitivity of 0.63, a specificity of 0.66, an LR+ of 1.9, and an LR- of 0.6.
Depending on the combination of cutoff, timing of the blood draw, and duration of follow-up, a positive troponin T had a range of sensitivity from 0.38 to 0.63 and of specificity from 0.77 to 0.95 for the outcome of death or nonfatal MI at 30 days.6,18,19,23,26,27 Two studies 18.19 were similar in design, and their test characteristics could be combined (sensitivity=0.44, specificity=0.81, LR+=2.3, and LR-=0.7).
Patients with Unstable Angina or Non-Q-Wave MI
Troponin I .A positive troponin I in patients with unstable angina or non-Q-wave MI produced sensitivities from 0.72 to 0.78 and specificities from 0.59 to 0.60 for the outcome of death at 30 to 42 days.18,34 For the outcome of death or nonfatal Ml using the same inclusion criteria, the range of sensitivity was from 0.59 to 1.00 and of specificity was from 0.60 to 0.74.18,32,33
Troponin T. For an outcome of death, the LR+ was 1.3 to 1.8, and the LR- was 0.0 to 0.3.18,29 The study29 with an LR- of 0.0 had no false-negatives and a sensitivity of 1.0; it used a very low cutoff of 0.06 for an abnormal test result. Using the same cohort with a cutoff of 0.2, the investigators found a sensitivity of 0.72 and a specificity of 0.45. As expected, a lower cutoff improved the sensitivity of the test.
Discussion
Although one goal of systemic reviews is to pool study data from multiple sources to calculate summary measures of test accuracy, not all reviews can achieve that goal. In our study, a lack of standardization in study parameters limited our ability to combine summary estimates effectively. However, we have identified several important guidelines for clinicians using the troponin test and for future research in this area.
Most studies of the troponin test have evaluated it in patients with unstable angina or unstable angina and non-Q-wave MI. Although the test has some value in the non-Q-wave MI patients for identifying higher-risk and lower-risk groups, all such patients would generally be admitted to the hospital and followed closely. For primary care and emergency physicians evaluating a patient with chest pain in the emergency department, an important goal is to identify patients for whom adverse cardiac events such as death or nonfatal MI are unlikely in the near future. These patients could be sent home to follow up with their primary care physician and possibly undergo noninvasive testing as outpatients.
Unfortunately, only a few studies have included patients with chest pain or patients with chest pain and a normal ECG. The most useful study is that of Hamm and colleagues.14 In their study of 773 patients with chest pain and no ST elevation, troponin T and I both had a low LR- for the identification of patients at low risk of death or nonfatal MI in the 30 days following their episode of chest pain. Only 1 in 300 patients with a normal ECG and normal troponin I 6 hours after the onset of chest pain had an adverse outcome in the 30 days after hospital discharge and only 1 in 100 of those with normal ECG and normal troponin T. Although the troponin T test actually had a lower LR- and was potentially more useful, this test is not widely available in the United States. More studies of both troponin T and I are needed among patients with chest pain or chest pain and normal ECG to validate the findings of Hamm and coworkers.
Using a lower cutoff for abnormal with troponin T improves the sensitivity of the test. Lindahl and colleagues29 found a sensitivity of 1.0 at a cutoff of 0.06 for the outcome of death in a study of patients with unstable angina or non-Q-wave MI; the sensitivity was only 0.86 for a cutoff of 0.2. Other pairs of studies had a similar pattern, which was expected. Future studies should report the sensitivity and specificity of the tests for several cutoffs, including lower values such as 0.05 ng/mL for troponin T.
Also, the sensitivity of troponin was improved when the peak value in the first 6 to 24 hours of admission was used instead of the value on admission to the emergency department. For example, among patients with unstable angina the sensitivity was 0.63 when blood was drawn on admission to the emergency department16,21,24 and 1.0 when the peak value in the first 16 hours was used.24 This makes physiologic sense, since patients presenting early in the course of their episode of unstable angina or MI may have undetectable levels of troponin which rise as the episode progresses.
Recommendations for future research
To facilitate future meta-analyses, we recommend the following parameters for the design of studies of troponin. First, studies should use larger populations and standardize their inclusion and testing criteria. We also recommend durations of follow-up of 7 days, 30 days, and 1 year. Although a longer duration is helpful in predicting the patient’s overall prognosis, shorter durations are more useful for identifying patients who can be discharged for close outpatient follow-up and noninvasive testing. Cutoffs of 0.05 ng/mL, 0.10 ng/mL, and 0.20 ng/mL for troponin T and cutoffs of 0.3 and 0.6 for troponin I should be used. Authors should report the test characteristics for several cutoffs and also for ranges of troponin, such as less than 0.05 ng/mL, 0.06 ng/mL to 0.10 ng/mL, and greater than 0.10 ng/mL. In addition, we recommend that sensitivity and specificity be reported both for the initial value on admission to the emergency department and for peak values after 12 and 24 hours. Finally, standard definitions for inclusion criteria and outcomes should be used, such as the Braunwald criteria* for unstable angina and the World Health Organization criteria for acute MI.
We also suggest that valuable information would be added if population demographics were reported in study results. Although most studies considered patient demographics carefully in determining study eligibility, they did not report those characteristics in their findings. It is not clear, for example, that the test performs similarly in younger and older patients, in men and women, or in different ethnic or racial groups.
Finally, we recommend that more studies evaluate the accuracy of troponin I in prognosis, particularly among patients with chest pain syndromes. Of the 28 studies we analyzed, only 11 measured troponin I and only 1 enrolled patients who had chest pain and a normal ECG.
Recommendations for practice
If the peak troponin T or I level measured at least 6 hours after the onset of chest pain symptoms is in the normal range and the ECG is normal, it is very unlikely that the patient will die or have a nonfatal MI in the next 30 days (1%).14 It is important to note that decisions about care should be made on the basis of the troponin value and ECG and in light of the patient’s clinical presentation and comorbidities, and that this finding is based on only 1 study, albeit a large one. The initial troponin value is not as helpful as the peak value at least 6 hours after the onset of chest pain. An abnormal troponin test in patients with unstable angina or non-Q-wave MI identifies a subset at greater risk of death; those patients should be closely monitored.
Acknowledgments
This project was supported by the Michigan Consortium for Family Practice Research, one of 3 research centers funded by the American Academy of Family Physicians. We wish to acknowledge the assistance of Dan Flewelling in the literature search and of Deb Richardson in the preparation of the manuscript.
1. TH, Juarez G, Cook EF, et al. Ruling out acute myocardial infarction: a prospective multicenter validation of a 12-hour strategy for patients at low risk. N Engl J Med 1991;324:1239-46.
2. TH, Cook EF, Weisberg M, Sargent RK, Wilson C, Goldman L. Acute chest pain in the emergency room: identification and examination of low risk patients. Arch Intern Med 1985;145:65-69.
3. RR, Zalenski RJ, Mensay EK, et al. Costs of an emergency department based accelerated diagnostic protocol vs hospitalization in patients with chest pain: a randomized controlled trial. JAMA 1997;278:1670-76.
4. ME, Smars PA, Reeder GS, et al. A clinical trial of a chest-pain observation unit for patients with unstable angina. N Engl J Med 1998;339:1882-88.
5. Software, version 0.6. Joseph Lau, MD, New England Medical Center. Used with permission.
6. AG, Wu AH, Feng YJ, Waters D. Prognostic role of troponin T versus troponin I in unstable angina pectoris for cardiac events with meta-analysis comparing published studies. Am J Cardiol 1998;81:1405-10.
7. MH, Flynn C, Fiewelling D. A systematic review of troponin T and I for diagnosing acute myocardial infarction. J Fam Pract 2000;49:550-56.
8. J, Horder M, Gerhardt W, et al. Diagnostic performance and prognostic value of serum troponin T in suspected acute myocardial infarction. Scand J Clin Lab Invest 1993;53:677-85.
9. J, Nissen H, Horder M, Thygesen K. Independent prognostic value of serum creatine kinase isoenzyme MB mass, cardiac troponin T and myosin light chain levels in suspected acute myocardial infarction. Am Coll Cardiol 1995;25:574-81.
10. GD, Dunt DR. Early prediction of risk in patients with suspected unstable angina using serum troponin T. Aust NZ J Med 1997;27:554-60.
11. GB, Beaudreau RW, Chan DW, DeLong D, Kelley CA, Kelen GD. Use of troponin T and creatine kinase-MB subunit levels for risk stratification of emergency department patients with possible myocardial ischemia. Ann Emerg Med 1998;31:19-29.
12. EM, Sacks DB, Rifai N, McCabe CH, Cannon CP, Braunwald E. Time to positivity of a rapid bedside assay for cardiac-specific troponin T predicts prognosis in acute coronary syndromes: a thrombolysis in myocardial infarction (TIMI) 11A substudy. J Am Coll Cardiol 1998;31:326-30.
13. ER, Ryan T, Segar D, et al. Clinical utility of troponin T levels and echocardiography in the emergency department. Am Heart J 1998;135:253-60.
14. CW, Goldmann B, Heeschen C, Kreymann G, Berger J, Meinertz T. Emergency room triage of patients with acute chest pain by means of rapid testing for cardiac troponin T or troponin 1. N Engi J Med 1997;337:1648-53.
15. M, Oftani F, Ferrini D, et al. Prognostic influence of elevated values of cardiac troponin I in patients with unstable angina. Circulation 1997;95:2053-59.
16. EM, Armstrong PW, Christenson RH, et al. Cardiac troponin T levels for risk stratification in acute myocardial ischemia. N Engl J Med 1996;335:1333-41.
17. Winter RJ, Koster RW, Schotveld JH, Sturk A, van Stallen JP, Sanders GT. Prognostic value of troponin T, myoglobin, and CK-MB mass in patients presenting with chest pain without acute myocardial infarction. Heart 1996;75:235-39.
18. MS, Thygesen K, Ravkilde J, Heickendorff L. Applicability of cardiac troponin T and I for early risk stratification in unstable coronary artery disease. Circulation 1997;96:2578-85.
19. F, Galvani M, Ferrini D, Ladenson JH, et al. Direct comparison of early elevations of cardiac troponin T and I in patients with clinical unstable angina. Am Heart J 1999;137:284-91.
20. MR, Kaufmann KH, Chen IW, et al. Measurement of cardiac troponin T is an effective method for predicting complications among emergency department patients with chest pain. Ann Emerg Med 1998;31:539-49.
21. RH, Duh SH, Newby LK, et al. Cardiac troponin T and cardiac troponin 1: relative values in short-term risk stratification of patients with acute coronary syndromes. Clin Chem 1998;44:494-501.
22. E, Chiappino I, Bergerone S, et al. Prognostic implications of detection of troponin I in patients with unstable angina pectoris. Am J Cardiol 1998;82:971-73.
23. AG, Quaranta G, Liuzzo G, et al. Incremental prognostic value of serum levels of troponin T and C-reactive protein on admission in patients with unstable angina pectoris. Am J Cardiol 1998;82:715-19.
24. LK, Christenson RH, Ohman EM, et al. Value of serial troponin T measures for early and late risk stratification in patients with acute coronary syndromes. Circulation 1998;98:1853-59.
25. L, Luscher MS, Clemmensen P, Thygesen K, Grande P. Very early risk stratification using combined ECG and biochemical assessment in patients with unstable coronary artery disease. TRIM substudy. Circulation 1998;98:2004-09.
26. P, Collinson P, Mosely D, et al. Prospective study of the role of cardiac troponin T in patients admitted with unstable angina. BMJ 1996;313:262-64.
27. BL, Andersen K, Dellborg M, et al. Admission risk assessment by cardiac troponin T in unstable coronary artery disease: additional prognostic information from continuous ST segment monitoring. J Am Coll Cardiol 1999;33:1519-27.
28. CR, et al. Diagnostic accuracy, angiographic correlates and long-term risk stratification with the troponin T ultra sensitive rapid assay in chest pain patients at low risk for acute myocardial infarction. Eur Heart J 1998;19 (suppl N):N42-47.
29. B, Andren B, Ohlsson J, Penge P, Wallentin L. Risk stratification in unstable coronary artery disease: additive value of troponin T determinations and pre-discharge exercise tests. Eur Heart J 1997;18:762-70.
30. VJ, Kumar DS, Baruah DK. Serum troponin T in unstable angina-a preliminary report. Indian Heart J 1994;46:89-90.
31. S, Koning R, Eitchaninoff H, et al. Relation between serum cardiac troponin I values and severity of clinical, electrocardiographic and quantitative angiographic features in unstable angina. Indian Heart J 1999;51:31-34.
32. Winter RJ, Bholasingh R, Lijmer JG, et al. Independent prognostic value of creactive protein and troponin I in patients with unstable angina or non-Q-wave myocardial infarction. Cardiovascular Res 1999;42:240-45.
33. S, Nishimura S, Tashiro Y, et al. Cardiac troponin-I in diagnosis and prognosis of unstable coronary artery disease. Clin Chem 1997;43:Sl 57.-
34. EM, Tanasijevic MJ, Thompson B, et al. Cardiac-specific troponin I levels to predict the risk of mortality in patients with acute coronary syndromes. N Engl J Med 1996;335:1342-9
A Systematic Review of Troponin T and I for Diagnosing Acute Myocardial Infarction
SEARCH STRATEGY: We searched the MEDLINE database using the following strategy: troponin (text word) and diagnosis (medical subject heading [MeSH]) or troponin/diagnostic use (MeSH). The references of articles meeting our inclusion criteria were searched for a dditional articles.
SELECTION CRITERIA: We evaluated each study for quality. Only prospective blinded cohort studies with an adequate reference standard were included in the analysis.
DATA COLLECTION/ANALYSIS: Data from each study were abstracted by 2 investigators. We graphed sensitivity and specificity for different points in time from arrival in the ED or from the onset of pain and calculated summary estimates when appropriate and possible.
MAIN RESULTS: Sensitivity increases for both troponin T and I from 10% to 45% within 1 hour of the onset of pain (depending on the cutoff) to more than 90% at 8 or more hours. Specificity declines gradually from 87% to 80% from 1 to 12 hours after the onset of chest pain for troponin T and is approximately 95% for troponin I. The peak abnormal value in the first 24 hours after admission to the ED has an area under the receiver operating characteristic curve of 0.99 and is very useful at ruling out AMI if negative.
CONCLUSIONS: Although troponin T and I values are useful tools for the diagnosis of AMI, they must be interpreted according to the number of hours from the onset of chest pain. The test is particularly useful at ruling out MI when the value is negative at 8 or more hours after the onset of chest pain.
How accurate are troponin T and I values for the diagnosis of acute myocardial infarction in adult patients presenting to the emergency department?
Until recently, creatine kinase (CK) and creatine kinase, myocardial bound (CK-MB) fractions were used most often for evaluating patients with acute chest pain and suspected acute myocardial infarction (AMI). The World Health Organization (WHO) criteria for diagnosing AMI include elevation in this blood test result, along with typical electrocardiographic changes and a history compatible with ischemia.1 Recently, elevations in the serum troponin T and troponin I levels have been used both to test for AMI and to predict adverse cardiac events.2
However, interpretation of the troponin test results can be problematic. The test characteristics vary considerably, depending on the cutoff used to define abnormal, the troponin fraction used (T or I), and the time from the onset of myocardial ischemia. For example, increases in the cutoff number will decrease sensitivity but improve specificity.3 Because the troponin tests rely on damage to myocardial cells and the release of troponins into the circulation, sensitivity initially increases with the number of hours from the onset of chest pain, then decreases as the enzyme is cleared from the circulation. However, many of the reports on which current estimates of sensitivity and specificity are based do not report the time from the onset of symptoms or only provide the worst value in the first 24 hours. Decision making in the emergency department (ED) is often based on earlier values, and it is therefore important to carefully describe the accuracy of the test at different times.2
One previous meta-analysis of the use of troponins for diagnosing AMI was published.4 Unfortunately, it had several limitations. The literature review was abbreviated, and numerous important articles have been published since the review was completed. There was no assessment of study quality, and the outcome used was adverse cardiac events rather than diagnosis of AMI. We report the results of a systematic review of the literature documenting use of troponins for diagnosing AMI, with assessment of the quality of the studies and synthesis of results when appropriate.
Methods
Search Strategy
We conducted a search of the MEDLINE database in June 1999 using the following strategy: troponin (text word) and diagnosis (medical subject heading [MeSH]) or troponin/diagnostic use (MeSH). This initial search identified approximately 800 articles. The abstract of each article was reviewed, and articles were evaluated in detail if: (1) troponins were used in the diagnosis of heart disease; (2) the study involved human subjects; and (3) the articles were written in English, German, French, or Spanish. A total of 114 articles met these basic criteria. A second search of the 1999 literature took place in December 1999, and 10 additional articles that met the basic criteria were identified.
Inclusion Criteria and Assessment of Study Quality
We included studies in the analysis if, after a review of the full article, they met the following inclusion criteria:
- The study design was prospective data collection, consecutive or nonconsecutive patient enrollment (but not case-control), and the physician determining whether the patient had an AMI was blinded to the troponin results.
- The study population was of adult patients with acute chest pain.
- The WHO reference standard or similar criteria was used to diagnose AMI.
- The authors reported data for calculating sensitivity or specificity for at least one point from the onset of pain or presentation to the ED for troponin T or I.
The WHO criteria for diagnosing AMI require 2 of the following: clinical history, typical electrocardiogram changes, and an increase of CK and CK-MB activity. Case-series studies of only patients with AMI were included for the calculation of sensitivity. We further classified studies meeting these basic criteria as level I or II depending on whether the patient enrollment was clearly stated as consecutive (level I), or nonconsecutive or unspecified (level II).
Data Abstraction
Two independent investigators (either ME and DF or CF and DF) reviewed each article for study quality and inclusion criteria. We resolved any discrepancies by consensus decision. Two articles were in French or German, and only one investigator reviewed each of these. Neither study met inclusion criteria.
We abstracted the following data from each article: setting, variables required for evaluation of study quality, time from onset of chest pain or admission to the ED, and cutoff value(s) for abnormal levels of troponin T or I. If a range of 4 hours or less was reported for the time from onset of pain or the time from arrival at the ED, the mean time was used as a point estimate. Ranges of greater than 4 hours were discarded. For example, if a study reported the specificity for blood drawn between 4 and 6 hours after presentation to the ED, this range was recorded as a point estimate of 5 hours. We compared the data abstracted by each of the 2 reviewers, and all discrepancies were resolved by consensus decision. If it appeared that additional data might have been collected but not reported, we contacted the authors of the articles by postal or electronic mail.
Statistical Analysis
The primary outcomes were the test characteristics (sensitivity, specificity, predictive values, and positive and negative likelihood ratios) for each test at different points in time. Sensitivity is the proportion of patients with AMI who have an abnormal troponin test result, and specificity is the proportion without AMI who have a normal troponin test result. The positive and negative likelihood ratios are calculated using the following equations:
Positive likelihood ratio=sensitivity/(100-specificity)
Negative likelihood ratio=(100-sensitivity)/specificity
The positive and negative likelihood ratios correspond to the clinical concepts of ruling in and ruling out disease. Thus, a higher positive likelihood ratio means that a test result is better for ruling in disease when positive, and a lower negative likelihood ratio means that a test result is better for ruling out disease when negative. When possible, we made summary estimates of sensitivity and specificity using a DerSimonian and Laird random effects model. Sensitivity and specificity were pooled independently and weighted by the inverse of the variance using the MetaTest software (Joseph Lau, MD, New England Medical Center, Boston, Mass). If a fixed effects model (Mantel-Haenszel, chi-square) and a random effects model (DerSimonian and Laird) calculated similar estimates of sensitivity or specificity the studies were homogenous, and we reported the more conservative random effects model result. If the fixed effects model and random effects model gave estimates that were different in a clinically meaningful way, the studies were heterogeneous, and only a range was reported.
We drew summary receiver operating characteristic (ROC) curves, and calculated the weighted area under the curve by the method of Moses5 using the MetaTest software. The area under the ROC curve is a measure of the ability of a test to discriminate between healthy and diseased individuals, and it is equal to the proportion of patients correctly classified in a forced-choice comparison. Models for sensitivity and specificity versus hours from the onset of chest pain and models for sensitivity and specificity versus cutoff level were fitted using SPSS 9.0 software (SPSS, Chicago, Ill). The choice of linear or logarithmic model was based on inspection of the data.
Results
Eleven studies met level I criteria for quality,6-16 and an additional 8 met level II criteria.17-24 Study characteristics are summarized in Table 1. Most studies only reported data for the time from presentation to the ED, rather than the time from onset of chest pain.
Test Accuracy by Time from the Onset of Symptoms
Figure 1 shows the sensitivity for studies of troponin T using cutoffs of 0.1,7,8,14 0.2,6,14,19 and 0.519 plotted against the number of hours from the onset of chest pain. Specificity was similar for all 3 cutoffs and is plotted as a single line. The authors of most of these studies evaluated the widely used enzyme-linked immunoassay test from Boehringer-Mannheim. The following equations plot the logarithmic curves for sensitivity shown on the graph and allow for the calculation of the sensitivity and specificity of troponin T for any number of hours following the onset of chest pain (note that these equations are only valid over the range for which data are available; ie, 0-12 hours from the onset of chest pain):
Cutoff 0.1: sensitivity=(-0.0011 × hours2) + (0.0634 × hours) + 0.4036
Cutoff 0.2: sensitivity=(-0.0132 × hours2) + (0.2363 × hours) - 0.0862
Cutoff 0.5: sensitivity=(-0.0111 × hours2) + (0.223 × hours) - 0.0981
All cutoffs: specificity=(-.0084 × hours) + 0.8821
Data from high-quality studies were more limited for troponin I. Only 4 level I studies reported data for troponin I,10,11,13,15 and only one of these reported results for sensitivity and specificity for different times from the onset of symptoms. The authors of that study13 only reported the sensitivity and specificity for ranges of 6, 12, 24, and 72 hours and used a cutoff of 2.5 ng/mL. Sensitivity was 17% in the 0 to 6-hour range, 92% in the 6 to 12-hour range, and 100% for the highest value in the 12 to 24-hour range. The specificity was 95% from 0 to 12 hours, and 98% from 12 to 24 hours. The corresponding positive and negative likelihood ratios are 3.4 and 0.9 for the 0 to 6-hour range, 18.4 and 0.08 for the 6 to 12-hour range, and 50 and 0.01 for the 12 to 24-hour range. A single level II study of a bedside troponin I test24 measured the sensitivity as a function on the hours from the onset of chest pain, using a cutoff of 0.1 ng/mL. This graph is shown in Figure 2. The formula for sensitivity is:
Sensitivity=(-0.0128 × hours2) + (0.2438 × hours) - 0.0971
Sensitivity does not exceed 80% until 5 hours after the onset of chest pain. Specificity was not reported in this study.
Test Accuracy by Time After Admission
The authors of 5 studies reported the sensitivity and specificity measured from the time of arrival at the ED. Summary estimates of the sensitivity and specificity for troponin T, using a cutoff of 0.2 ng/mL at the time of admission, were 33% and 93% (values from the fixed effects model were 35% and 94%). The corresponding positive and negative likelihood ratios are 4.7 and 0.7, and the weighted area under the ROC curve is 0.77.14,18,19,22,23 Using the peak value of troponin T in the first 24 hours and a cutoff of 0.2, the sensitivity and specificity are 98% and 87% (values from the fixed effects model were 98% and 89%). The corresponding positive and negative likelihood ratios are 7.5 and 0.02, and the weighted area under the ROC curve is 0.99.19,16,20
Discussion
We have summarized the existing data on the accuracy of troponin T and I values as diagnostic tests for AMI for patients with acute chest pain. These data are summarized for clinicians in Table 2. The sensitivities and specificities in Table 2 are estimated from the best-fit curves shown in Figure 2. Note that for troponin I, sensitivity data are from one study24 and specificity from another.13 Nomograms can help physicians interpret the results of troponin T and troponin I at different times from the onset of chest pain and for different pretest probabilities of AMI.* Although troponin I appears to be better at ruling in MI than troponin T, these results are based on a single small study.
The most important take-home message for clinicians is that the sensitivity of the troponin tests, like that of any other cardiac enzyme, is highly dependent on the number of hours since the onset of chest pain. The test is insensitive (ie, will miss many cases of AMI) within the first 6 hours after the onset of chest pain, when patients often present to the ED. However, by 12 or more hours after pain onset the test is quite sensitive, and a negative troponin value is strong evidence against the presence of AMI.
Diagnostic tests are symmetric if a positive test result as effectively rules in disease as a negative test result rules it out. For example, a test with a positive likelihood ratio of 5 and a negative likelihood ratio of 0.2 (1/5) would be symmetric. Examination of the likelihood ratios reveals that the troponin tests are asymmetric with respect to the positive and negative likelihood ratios. However, this relationship is not consistent. Troponin T and I are very useful at ruling out AMI when the value is negative at 10 or more hours from the onset of chest pain (negative likelihood ratio 0.1). However, a negative test value early in the course of the episode of chest pain does very little to reduce the likelihood of AMI. A positive troponin T value, however, is only moderately useful at ruling in AMI when blood was drawn 6 or more hours after the onset of pain (positive likelihood ratio=~5). Although a positive troponin I value from blood drawn 6 or more hours after the onset of pain appears to be very useful at ruling in AMI (positive likelihood ratio=~15), this is based on one relatively small study. While asymmetry is neither good nor bad, it is important to recognize when interpreting test results.
Limitations
An important limitation of any systematic review of this topic is the wide variety of cutoffs, manufacturers, processes, and reagents used in the studies. Ideally, each clinical site will identify for its physicians the optimal cutoffs for each test at each point in time. This is probably unrealistic, however, and we hope our results will guide physicians in the absence of such data. Although differences in the manufacturing of a particular test may affect the sensitivity and specificity, there was no clear pattern in these data, and other differences between study populations, settings, and inclusion criteria made it difficult to quantify the magnitude of this effect.
The diagnosis of AMI is only one use of troponin and other biochemical markers. Risk stratification is another important goal, and a future systematic review will evaluate the ability of troponin T and I to stratify patients into high-risk and low-risk groups for adverse cardiac events.
Recommendations for future research
Although an important goal of systematic reviews is to provide summary estimates of the accuracy of diagnostic tests, it is equally important to use these results to guide further research. Because the sensitivity of troponin T and I is so dependent on the number of hours from the onset of chest pain, future studies should always record this time when the blood is drawn. Using time from the admission to the ED is less useful, because pain could have begun any time before arrival. Also, the investigators of future studies should use the WHO criteria for AMI, ensure blinding of the diagnosing physicians to the results of the troponin test, and provide adequate data for future systematic reviews and meta-analyses. Finally, studies should measure troponin T and I, myoglobin, and CK so their accuracy can be compared for both diagnosis and prognosis.
Recommendations for clinical practice
Although troponin T and I are useful for the diagnosis of AMI, clinicians should interpret the results according to the number of hours from the onset of chest pain, whenever possible. Table 2 and the nomograms on the Journal’s Web site (www.jfampract.com) can assist in this task. A peak value of troponin T of less than 0.2 in the first 24 hours after arrival in the ED is strong evidence against the presence of AMI; a normal troponin T or I value from blood drawn 8 or more hours after the onset of chest pain is also strong evidence against its presence. However, a normal value of troponin T or I at the time of admission or within 4 or fewer hours of the onset of pain does not significantly reduce the likelihood of AMI. Abnormal values of troponin T or I from blood drawn 8 or more hours after the onset of chest pain are moderately strong evidence in favor of the presence of AMI, particularly for patients who are otherwise at high risk.
Acknowledgments
This work was supported by the Michigan Consortium for Family Practice Research, one of 3 research centers funded by the American Academy of Family Physicians and its members. The authors do not have any financial or professional connection to the manufacturer of any test kits. We wish to thank Ian Katz, MD; Alan Wu, MD; Johannes Mair, MD; Hugo Katus, MD; and Bernd Puschendorff, MD, for their willingness to share their original data for this systematic review. We also wish to thank Deb Richardson for her assistance with the preparation of this manuscript.
1. Nomenclature and criteria for diagnosis of ischemic heart disease. Report of the Joint International Society and Federation of Cardiology/World Health Organization Task Force on Standardization of Clinical Nomenclature. Circulation 1979;59:607-9.
2. Panteghini M, Apple FS, Christenson RH, Dati F, Mair J, Wu AH. for the IFCC Scientific Division. Committee on Standardization of Markers of Cardiac Damage. Use of biochemical markers in acute coronary syndromes. Clin Chem Lab Med 1999;37:687-93.
3. Sloane PD, Slatt LM, Curtis P, Ebell MH. eds. Essentials of family medicine. 3rd ed. Philadelphia, Pa: Lippincott, Williams, and Wilkins; 1998;213-5.
4. Ollatidoye AG, Wu AH, Feng YJ, Waters D. Prognostic role of troponin T versus troponin I in unstable angina pectoris for cardiac events with meta-analysis comparing published studies. Am J Cardiol 1998;81:1405-10.
5. Hasselblad V, McCrory DC. Meta-analytic tools for medical decision-making: a practical guide. Med Decis Mak 1997;15:81-96.
6. Antman E, Grudzien C, Sacks D. Evaluation of a rapid bedside assay for detection of serum cardiac troponin T. JAMA 1995;273:1279-82.
7. Bakker AJ, Koelemay MJW, Gorgeis JPMC, et al. Failure of new biochemical markers to exclude acute myocardial infarction at admission. Lancet 1993;342:1220-2.
8. Bakker A, Koelemay MJW, van Vlies B, et al. Exclusion of acute myocrdial infarction: the value of measuring creatine kinase slope. Eur J Clin Chem Clin Biochem 1995;33:351-63.
9. Ravildke J, Horder M, Gerhardt W, et al. Diagnostic performance and prognostic value of serum troponin T in suspected acute myocardial infarction. Scand J Clin Lab Invest 1993;53:677-85.
10. Adams JE, Schechtman KB, Landt Y, Ladenson JH, Jaffe AS. Comparable detection of acute myocardial infarction by creatine kinase MB isoenzyme and cardiac troponin I. Clin Chem 1994;40:1291-5.
11. D’Costa M, Fleming E, Patterson MC. Cardiac troponin I for the diagnosis of acute myocardial infarction in the emergency department. Am J Clin Pathol 1997;108:550-5.
12. Katus HA, Remppis A, Neumann FJ, et al. Diagnostic efficiency of troponin T measurement in acute myocardial infarction. Circulation 1991;83:902-12.
13. Wu AHB, Feng YJ, Contois JH, Pervaiz S. Comparison of myoglobin, creatine kinase-MB, and cardiac troponin I for diagnosis of acute myocardial infarction. Ann Clin Lab Sci 1996;26:291-300.
14. Katz IA, Irwig L, Vinen JD, et al. Biochemical markers of acute myocardial infarction: stratedgies for improving their clinical usefulness. Ann Clin Biochem 1998;35:393-9.
15. Heeschen C, Goldmann BU, Moeller RH, Hamm CW. Analytical performance and clinical application of a new rapid bedside assay for the detection of serum cardiac troponin I. Clin Chem 1998;44:1925-30.
16. Johnson PA, Goldman L, Sacks DB, et al. Cardiac troponin T as a marker for myocardial ischemia in patients seen at the emergency department for acute chest pain. Am Heart J 1999;137:1137-44.
17. Mair J, Smidt J, Lechleitner P, Dienstl F, Puschendorf B. A decision tree for the early diagnosis of acute myocardial infarction in nontraumatic chest pain patients at hospital admission. Chest 1995;108:1502-09.
18. Mach F, Lovis C, Chevrolet JC, et al. Rapid bedside whole cardiospecific toponin T immunoassay for the diagnosis of acute myocardial infaraction. Am J Cardiol 1995;75:842-5.
19. Mair J, Artner-Dworzak E, Lechleitner P, et al. Cardiac troponin T in diagnosis of acute myocardial infarction. Clin Chem 1996;37:845-52.
20. Sayre MR, Kaufmann KH, Chen I, et al. Measurement of cardiac troponin T is an effective method for predicting complications among emergency department patients with chest pain. Ann Emerg Med 1998;31:539-49.
21. Christenson RH, Apple FS, Morgan DL, et al. Cardiac troponin I measurement with the ACCESS immunoassay system: analytical and clinical performance characteristics. Clin Chem 1998;44:52-60.
22. Baxter MS, Brogan GX, Harchelroad FP, Jr. Evaluation of a bedside whole-blood rapid troponin T assay in the emergency department. Acad Emerg Med 1997;4:1018-24.
23. Lindahl B, Venge P, Walllentin. Early diagnosis and exclusion of acute myocardial infarction using biochemical monitoring. Coron Artery Dis 1995;6:321-8.
24. Mair J, Genser N, Morandell D, et al. Cardiac troponin I in the diagnosis of myocardial injury and infarction. Clin Chim Acta 1996;245:19-38.
SEARCH STRATEGY: We searched the MEDLINE database using the following strategy: troponin (text word) and diagnosis (medical subject heading [MeSH]) or troponin/diagnostic use (MeSH). The references of articles meeting our inclusion criteria were searched for a dditional articles.
SELECTION CRITERIA: We evaluated each study for quality. Only prospective blinded cohort studies with an adequate reference standard were included in the analysis.
DATA COLLECTION/ANALYSIS: Data from each study were abstracted by 2 investigators. We graphed sensitivity and specificity for different points in time from arrival in the ED or from the onset of pain and calculated summary estimates when appropriate and possible.
MAIN RESULTS: Sensitivity increases for both troponin T and I from 10% to 45% within 1 hour of the onset of pain (depending on the cutoff) to more than 90% at 8 or more hours. Specificity declines gradually from 87% to 80% from 1 to 12 hours after the onset of chest pain for troponin T and is approximately 95% for troponin I. The peak abnormal value in the first 24 hours after admission to the ED has an area under the receiver operating characteristic curve of 0.99 and is very useful at ruling out AMI if negative.
CONCLUSIONS: Although troponin T and I values are useful tools for the diagnosis of AMI, they must be interpreted according to the number of hours from the onset of chest pain. The test is particularly useful at ruling out MI when the value is negative at 8 or more hours after the onset of chest pain.
How accurate are troponin T and I values for the diagnosis of acute myocardial infarction in adult patients presenting to the emergency department?
Until recently, creatine kinase (CK) and creatine kinase, myocardial bound (CK-MB) fractions were used most often for evaluating patients with acute chest pain and suspected acute myocardial infarction (AMI). The World Health Organization (WHO) criteria for diagnosing AMI include elevation in this blood test result, along with typical electrocardiographic changes and a history compatible with ischemia.1 Recently, elevations in the serum troponin T and troponin I levels have been used both to test for AMI and to predict adverse cardiac events.2
However, interpretation of the troponin test results can be problematic. The test characteristics vary considerably, depending on the cutoff used to define abnormal, the troponin fraction used (T or I), and the time from the onset of myocardial ischemia. For example, increases in the cutoff number will decrease sensitivity but improve specificity.3 Because the troponin tests rely on damage to myocardial cells and the release of troponins into the circulation, sensitivity initially increases with the number of hours from the onset of chest pain, then decreases as the enzyme is cleared from the circulation. However, many of the reports on which current estimates of sensitivity and specificity are based do not report the time from the onset of symptoms or only provide the worst value in the first 24 hours. Decision making in the emergency department (ED) is often based on earlier values, and it is therefore important to carefully describe the accuracy of the test at different times.2
One previous meta-analysis of the use of troponins for diagnosing AMI was published.4 Unfortunately, it had several limitations. The literature review was abbreviated, and numerous important articles have been published since the review was completed. There was no assessment of study quality, and the outcome used was adverse cardiac events rather than diagnosis of AMI. We report the results of a systematic review of the literature documenting use of troponins for diagnosing AMI, with assessment of the quality of the studies and synthesis of results when appropriate.
Methods
Search Strategy
We conducted a search of the MEDLINE database in June 1999 using the following strategy: troponin (text word) and diagnosis (medical subject heading [MeSH]) or troponin/diagnostic use (MeSH). This initial search identified approximately 800 articles. The abstract of each article was reviewed, and articles were evaluated in detail if: (1) troponins were used in the diagnosis of heart disease; (2) the study involved human subjects; and (3) the articles were written in English, German, French, or Spanish. A total of 114 articles met these basic criteria. A second search of the 1999 literature took place in December 1999, and 10 additional articles that met the basic criteria were identified.
Inclusion Criteria and Assessment of Study Quality
We included studies in the analysis if, after a review of the full article, they met the following inclusion criteria:
- The study design was prospective data collection, consecutive or nonconsecutive patient enrollment (but not case-control), and the physician determining whether the patient had an AMI was blinded to the troponin results.
- The study population was of adult patients with acute chest pain.
- The WHO reference standard or similar criteria was used to diagnose AMI.
- The authors reported data for calculating sensitivity or specificity for at least one point from the onset of pain or presentation to the ED for troponin T or I.
The WHO criteria for diagnosing AMI require 2 of the following: clinical history, typical electrocardiogram changes, and an increase of CK and CK-MB activity. Case-series studies of only patients with AMI were included for the calculation of sensitivity. We further classified studies meeting these basic criteria as level I or II depending on whether the patient enrollment was clearly stated as consecutive (level I), or nonconsecutive or unspecified (level II).
Data Abstraction
Two independent investigators (either ME and DF or CF and DF) reviewed each article for study quality and inclusion criteria. We resolved any discrepancies by consensus decision. Two articles were in French or German, and only one investigator reviewed each of these. Neither study met inclusion criteria.
We abstracted the following data from each article: setting, variables required for evaluation of study quality, time from onset of chest pain or admission to the ED, and cutoff value(s) for abnormal levels of troponin T or I. If a range of 4 hours or less was reported for the time from onset of pain or the time from arrival at the ED, the mean time was used as a point estimate. Ranges of greater than 4 hours were discarded. For example, if a study reported the specificity for blood drawn between 4 and 6 hours after presentation to the ED, this range was recorded as a point estimate of 5 hours. We compared the data abstracted by each of the 2 reviewers, and all discrepancies were resolved by consensus decision. If it appeared that additional data might have been collected but not reported, we contacted the authors of the articles by postal or electronic mail.
Statistical Analysis
The primary outcomes were the test characteristics (sensitivity, specificity, predictive values, and positive and negative likelihood ratios) for each test at different points in time. Sensitivity is the proportion of patients with AMI who have an abnormal troponin test result, and specificity is the proportion without AMI who have a normal troponin test result. The positive and negative likelihood ratios are calculated using the following equations:
Positive likelihood ratio=sensitivity/(100-specificity)
Negative likelihood ratio=(100-sensitivity)/specificity
The positive and negative likelihood ratios correspond to the clinical concepts of ruling in and ruling out disease. Thus, a higher positive likelihood ratio means that a test result is better for ruling in disease when positive, and a lower negative likelihood ratio means that a test result is better for ruling out disease when negative. When possible, we made summary estimates of sensitivity and specificity using a DerSimonian and Laird random effects model. Sensitivity and specificity were pooled independently and weighted by the inverse of the variance using the MetaTest software (Joseph Lau, MD, New England Medical Center, Boston, Mass). If a fixed effects model (Mantel-Haenszel, chi-square) and a random effects model (DerSimonian and Laird) calculated similar estimates of sensitivity or specificity the studies were homogenous, and we reported the more conservative random effects model result. If the fixed effects model and random effects model gave estimates that were different in a clinically meaningful way, the studies were heterogeneous, and only a range was reported.
We drew summary receiver operating characteristic (ROC) curves, and calculated the weighted area under the curve by the method of Moses5 using the MetaTest software. The area under the ROC curve is a measure of the ability of a test to discriminate between healthy and diseased individuals, and it is equal to the proportion of patients correctly classified in a forced-choice comparison. Models for sensitivity and specificity versus hours from the onset of chest pain and models for sensitivity and specificity versus cutoff level were fitted using SPSS 9.0 software (SPSS, Chicago, Ill). The choice of linear or logarithmic model was based on inspection of the data.
Results
Eleven studies met level I criteria for quality,6-16 and an additional 8 met level II criteria.17-24 Study characteristics are summarized in Table 1. Most studies only reported data for the time from presentation to the ED, rather than the time from onset of chest pain.
Test Accuracy by Time from the Onset of Symptoms
Figure 1 shows the sensitivity for studies of troponin T using cutoffs of 0.1,7,8,14 0.2,6,14,19 and 0.519 plotted against the number of hours from the onset of chest pain. Specificity was similar for all 3 cutoffs and is plotted as a single line. The authors of most of these studies evaluated the widely used enzyme-linked immunoassay test from Boehringer-Mannheim. The following equations plot the logarithmic curves for sensitivity shown on the graph and allow for the calculation of the sensitivity and specificity of troponin T for any number of hours following the onset of chest pain (note that these equations are only valid over the range for which data are available; ie, 0-12 hours from the onset of chest pain):
Cutoff 0.1: sensitivity=(-0.0011 × hours2) + (0.0634 × hours) + 0.4036
Cutoff 0.2: sensitivity=(-0.0132 × hours2) + (0.2363 × hours) - 0.0862
Cutoff 0.5: sensitivity=(-0.0111 × hours2) + (0.223 × hours) - 0.0981
All cutoffs: specificity=(-.0084 × hours) + 0.8821
Data from high-quality studies were more limited for troponin I. Only 4 level I studies reported data for troponin I,10,11,13,15 and only one of these reported results for sensitivity and specificity for different times from the onset of symptoms. The authors of that study13 only reported the sensitivity and specificity for ranges of 6, 12, 24, and 72 hours and used a cutoff of 2.5 ng/mL. Sensitivity was 17% in the 0 to 6-hour range, 92% in the 6 to 12-hour range, and 100% for the highest value in the 12 to 24-hour range. The specificity was 95% from 0 to 12 hours, and 98% from 12 to 24 hours. The corresponding positive and negative likelihood ratios are 3.4 and 0.9 for the 0 to 6-hour range, 18.4 and 0.08 for the 6 to 12-hour range, and 50 and 0.01 for the 12 to 24-hour range. A single level II study of a bedside troponin I test24 measured the sensitivity as a function on the hours from the onset of chest pain, using a cutoff of 0.1 ng/mL. This graph is shown in Figure 2. The formula for sensitivity is:
Sensitivity=(-0.0128 × hours2) + (0.2438 × hours) - 0.0971
Sensitivity does not exceed 80% until 5 hours after the onset of chest pain. Specificity was not reported in this study.
Test Accuracy by Time After Admission
The authors of 5 studies reported the sensitivity and specificity measured from the time of arrival at the ED. Summary estimates of the sensitivity and specificity for troponin T, using a cutoff of 0.2 ng/mL at the time of admission, were 33% and 93% (values from the fixed effects model were 35% and 94%). The corresponding positive and negative likelihood ratios are 4.7 and 0.7, and the weighted area under the ROC curve is 0.77.14,18,19,22,23 Using the peak value of troponin T in the first 24 hours and a cutoff of 0.2, the sensitivity and specificity are 98% and 87% (values from the fixed effects model were 98% and 89%). The corresponding positive and negative likelihood ratios are 7.5 and 0.02, and the weighted area under the ROC curve is 0.99.19,16,20
Discussion
We have summarized the existing data on the accuracy of troponin T and I values as diagnostic tests for AMI for patients with acute chest pain. These data are summarized for clinicians in Table 2. The sensitivities and specificities in Table 2 are estimated from the best-fit curves shown in Figure 2. Note that for troponin I, sensitivity data are from one study24 and specificity from another.13 Nomograms can help physicians interpret the results of troponin T and troponin I at different times from the onset of chest pain and for different pretest probabilities of AMI.* Although troponin I appears to be better at ruling in MI than troponin T, these results are based on a single small study.
The most important take-home message for clinicians is that the sensitivity of the troponin tests, like that of any other cardiac enzyme, is highly dependent on the number of hours since the onset of chest pain. The test is insensitive (ie, will miss many cases of AMI) within the first 6 hours after the onset of chest pain, when patients often present to the ED. However, by 12 or more hours after pain onset the test is quite sensitive, and a negative troponin value is strong evidence against the presence of AMI.
Diagnostic tests are symmetric if a positive test result as effectively rules in disease as a negative test result rules it out. For example, a test with a positive likelihood ratio of 5 and a negative likelihood ratio of 0.2 (1/5) would be symmetric. Examination of the likelihood ratios reveals that the troponin tests are asymmetric with respect to the positive and negative likelihood ratios. However, this relationship is not consistent. Troponin T and I are very useful at ruling out AMI when the value is negative at 10 or more hours from the onset of chest pain (negative likelihood ratio 0.1). However, a negative test value early in the course of the episode of chest pain does very little to reduce the likelihood of AMI. A positive troponin T value, however, is only moderately useful at ruling in AMI when blood was drawn 6 or more hours after the onset of pain (positive likelihood ratio=~5). Although a positive troponin I value from blood drawn 6 or more hours after the onset of pain appears to be very useful at ruling in AMI (positive likelihood ratio=~15), this is based on one relatively small study. While asymmetry is neither good nor bad, it is important to recognize when interpreting test results.
Limitations
An important limitation of any systematic review of this topic is the wide variety of cutoffs, manufacturers, processes, and reagents used in the studies. Ideally, each clinical site will identify for its physicians the optimal cutoffs for each test at each point in time. This is probably unrealistic, however, and we hope our results will guide physicians in the absence of such data. Although differences in the manufacturing of a particular test may affect the sensitivity and specificity, there was no clear pattern in these data, and other differences between study populations, settings, and inclusion criteria made it difficult to quantify the magnitude of this effect.
The diagnosis of AMI is only one use of troponin and other biochemical markers. Risk stratification is another important goal, and a future systematic review will evaluate the ability of troponin T and I to stratify patients into high-risk and low-risk groups for adverse cardiac events.
Recommendations for future research
Although an important goal of systematic reviews is to provide summary estimates of the accuracy of diagnostic tests, it is equally important to use these results to guide further research. Because the sensitivity of troponin T and I is so dependent on the number of hours from the onset of chest pain, future studies should always record this time when the blood is drawn. Using time from the admission to the ED is less useful, because pain could have begun any time before arrival. Also, the investigators of future studies should use the WHO criteria for AMI, ensure blinding of the diagnosing physicians to the results of the troponin test, and provide adequate data for future systematic reviews and meta-analyses. Finally, studies should measure troponin T and I, myoglobin, and CK so their accuracy can be compared for both diagnosis and prognosis.
Recommendations for clinical practice
Although troponin T and I are useful for the diagnosis of AMI, clinicians should interpret the results according to the number of hours from the onset of chest pain, whenever possible. Table 2 and the nomograms on the Journal’s Web site (www.jfampract.com) can assist in this task. A peak value of troponin T of less than 0.2 in the first 24 hours after arrival in the ED is strong evidence against the presence of AMI; a normal troponin T or I value from blood drawn 8 or more hours after the onset of chest pain is also strong evidence against its presence. However, a normal value of troponin T or I at the time of admission or within 4 or fewer hours of the onset of pain does not significantly reduce the likelihood of AMI. Abnormal values of troponin T or I from blood drawn 8 or more hours after the onset of chest pain are moderately strong evidence in favor of the presence of AMI, particularly for patients who are otherwise at high risk.
Acknowledgments
This work was supported by the Michigan Consortium for Family Practice Research, one of 3 research centers funded by the American Academy of Family Physicians and its members. The authors do not have any financial or professional connection to the manufacturer of any test kits. We wish to thank Ian Katz, MD; Alan Wu, MD; Johannes Mair, MD; Hugo Katus, MD; and Bernd Puschendorff, MD, for their willingness to share their original data for this systematic review. We also wish to thank Deb Richardson for her assistance with the preparation of this manuscript.
1. Nomenclature and criteria for diagnosis of ischemic heart disease. Report of the Joint International Society and Federation of Cardiology/World Health Organization Task Force on Standardization of Clinical Nomenclature. Circulation 1979;59:607-9.
2. Panteghini M, Apple FS, Christenson RH, Dati F, Mair J, Wu AH. for the IFCC Scientific Division. Committee on Standardization of Markers of Cardiac Damage. Use of biochemical markers in acute coronary syndromes. Clin Chem Lab Med 1999;37:687-93.
3. Sloane PD, Slatt LM, Curtis P, Ebell MH. eds. Essentials of family medicine. 3rd ed. Philadelphia, Pa: Lippincott, Williams, and Wilkins; 1998;213-5.
4. Ollatidoye AG, Wu AH, Feng YJ, Waters D. Prognostic role of troponin T versus troponin I in unstable angina pectoris for cardiac events with meta-analysis comparing published studies. Am J Cardiol 1998;81:1405-10.
5. Hasselblad V, McCrory DC. Meta-analytic tools for medical decision-making: a practical guide. Med Decis Mak 1997;15:81-96.
6. Antman E, Grudzien C, Sacks D. Evaluation of a rapid bedside assay for detection of serum cardiac troponin T. JAMA 1995;273:1279-82.
7. Bakker AJ, Koelemay MJW, Gorgeis JPMC, et al. Failure of new biochemical markers to exclude acute myocardial infarction at admission. Lancet 1993;342:1220-2.
8. Bakker A, Koelemay MJW, van Vlies B, et al. Exclusion of acute myocrdial infarction: the value of measuring creatine kinase slope. Eur J Clin Chem Clin Biochem 1995;33:351-63.
9. Ravildke J, Horder M, Gerhardt W, et al. Diagnostic performance and prognostic value of serum troponin T in suspected acute myocardial infarction. Scand J Clin Lab Invest 1993;53:677-85.
10. Adams JE, Schechtman KB, Landt Y, Ladenson JH, Jaffe AS. Comparable detection of acute myocardial infarction by creatine kinase MB isoenzyme and cardiac troponin I. Clin Chem 1994;40:1291-5.
11. D’Costa M, Fleming E, Patterson MC. Cardiac troponin I for the diagnosis of acute myocardial infarction in the emergency department. Am J Clin Pathol 1997;108:550-5.
12. Katus HA, Remppis A, Neumann FJ, et al. Diagnostic efficiency of troponin T measurement in acute myocardial infarction. Circulation 1991;83:902-12.
13. Wu AHB, Feng YJ, Contois JH, Pervaiz S. Comparison of myoglobin, creatine kinase-MB, and cardiac troponin I for diagnosis of acute myocardial infarction. Ann Clin Lab Sci 1996;26:291-300.
14. Katz IA, Irwig L, Vinen JD, et al. Biochemical markers of acute myocardial infarction: stratedgies for improving their clinical usefulness. Ann Clin Biochem 1998;35:393-9.
15. Heeschen C, Goldmann BU, Moeller RH, Hamm CW. Analytical performance and clinical application of a new rapid bedside assay for the detection of serum cardiac troponin I. Clin Chem 1998;44:1925-30.
16. Johnson PA, Goldman L, Sacks DB, et al. Cardiac troponin T as a marker for myocardial ischemia in patients seen at the emergency department for acute chest pain. Am Heart J 1999;137:1137-44.
17. Mair J, Smidt J, Lechleitner P, Dienstl F, Puschendorf B. A decision tree for the early diagnosis of acute myocardial infarction in nontraumatic chest pain patients at hospital admission. Chest 1995;108:1502-09.
18. Mach F, Lovis C, Chevrolet JC, et al. Rapid bedside whole cardiospecific toponin T immunoassay for the diagnosis of acute myocardial infaraction. Am J Cardiol 1995;75:842-5.
19. Mair J, Artner-Dworzak E, Lechleitner P, et al. Cardiac troponin T in diagnosis of acute myocardial infarction. Clin Chem 1996;37:845-52.
20. Sayre MR, Kaufmann KH, Chen I, et al. Measurement of cardiac troponin T is an effective method for predicting complications among emergency department patients with chest pain. Ann Emerg Med 1998;31:539-49.
21. Christenson RH, Apple FS, Morgan DL, et al. Cardiac troponin I measurement with the ACCESS immunoassay system: analytical and clinical performance characteristics. Clin Chem 1998;44:52-60.
22. Baxter MS, Brogan GX, Harchelroad FP, Jr. Evaluation of a bedside whole-blood rapid troponin T assay in the emergency department. Acad Emerg Med 1997;4:1018-24.
23. Lindahl B, Venge P, Walllentin. Early diagnosis and exclusion of acute myocardial infarction using biochemical monitoring. Coron Artery Dis 1995;6:321-8.
24. Mair J, Genser N, Morandell D, et al. Cardiac troponin I in the diagnosis of myocardial injury and infarction. Clin Chim Acta 1996;245:19-38.