User login
Price Display Systematic Review
Rising healthcare spending has garnered significant public attention, and is considered a threat to other national priorities. Up to one‐third of national health expenditures are wasteful, the largest fraction generated through unnecessary services that could be substituted for less‐costly alternatives or omitted altogether.[1] Physicians play a central role in health spending, as they purchase nearly all tests and therapies on behalf of patients.
One strategy to enhance cost‐conscious physician ordering is to increase transparency of cost data for providers.[2, 3, 4] Although physicians consider price an important factor in ordering decisions, they have difficulty estimating costs accurately or finding price information easily.[5, 6] Improving physicians' knowledge of order costs may prompt them to forego diagnostic tests or therapies of low utility, or shift ordering to lower‐cost alternatives. Real‐time price display during provider order entry is 1 approach for achieving this goal. Modern electronic health records (EHRs) with computerized physician order entry (CPOE) make price display not only practical but also scalable. Integrating price display into clinical workflow, however, can be challenging, and there remains lack of clarity about potential risks and benefits. The dissemination of real‐time CPOE price display, therefore, requires an understanding of its impact on clinical care.
Over the past 3 decades, several studies in the medical literature have evaluated the effect of price display on physician ordering behavior. To date, however, there has been only 1 narrative review of this literature, which did not include several recent studies on the topic or formally address study quality and physician acceptance of price display modules.[7] Therefore, to help inform healthcare leaders, technology innovators, and policy makers, we conducted a systematic review to address 4 key questions: (1) What are the characteristics of interventions that have displayed order prices to physicians in the context of actual practice? (2) To what degree does real‐time display of order prices impact order costs and order volume? (3) Does price display impact patient safety outcomes, and is it acceptable to providers? (4) What is the quality of the current literature on this topic?
METHODS
Data Sources
We searched 2 electronic databases, MEDLINE and Embase, using a combination of controlled vocabulary terms and keywords that covered both the targeted intervention (eg, fees and charges) and the outcome of interest (eg, physician's practice patterns), limited to English language articles with no restriction on country or year of publication (see Supporting Information, Appendix 1, in the online version of this article). The search was run through August 2014. Results from both database searches were combined and duplicates eliminated. We also ran a MEDLINE keyword search on titles and abstracts of articles from 2014 that were not yet indexed. A medical librarian was involved in all aspects of the search process.[8]
Study Selection
Studies were included if they evaluated the effect of displaying actual order prices to providers during the ordering process and reported the impact on provider ordering practices. Reports in any clinical context and with any study design were included. To assess most accurately the effect of price display on real‐life ordering and patient outcomes, studies were excluded if: (1) they were review articles, commentaries, or editorials; (2) they did not show order prices to providers; (3) the context was a simulation; (4) the prices displayed were relative (eg, $/$$/$$$) or were only cumulative; (5) prices were not presented real‐time during the ordering process; or (6) the primary outcome was neither order costs nor order volume. We decided a priori to exclude simulations because these may not accurately reflect provider behavior when treating real patients, and to exclude studies showing relative prices due to concerns that it is a less significant price transparency intervention and that providers may interpret relative prices differently from actual prices.
Two reviewers, both physicians and health service researchers (M.T.S. and T.R.B.), separately reviewed the full list of titles and abstracts. For studies that potentially met inclusion criteria, full articles were obtained and were independently read for inclusion in the final review. The references of all included studies were searched manually, and the Scopus database was used to search all studies that cited the included studies. We also searched the references of relevant literature reviews.[9, 10, 11] Articles of interest discovered through manual search were then subjected to the same process.
Data Extraction and Quality Assessment
Two reviewers (M.T.S. and T.R.B.) independently performed data extraction using a standardized spreadsheet. Discrepancies were resolved by reviewer consensus. Extracted study characteristics included study design and duration, clinical setting, study size, type of orders involved, characteristics of price display intervention and control, and type of outcome. Findings regarding patient safety and provider acceptability were also extracted when available.
Study quality was independently evaluated and scored by both reviewers using the Downs and Black checklist, designed to assess quality of both randomized and nonrandomized studies.[12] The checklist contains 5 items pertaining to allocation concealment, blinding, or follow‐up that are not applicable to an administrative intervention like price display, so these questions were excluded. Additionally, few studies calculated sample size or reported post hoc statistical power, so we also excluded this question, leaving a modified 21‐item checklist. We also assessed each study for sources of bias that were not already assessed by the Downs and Black checklist, including contamination between study groups, confounding of results, and incomplete intervention or data collection.
Data Synthesis
Data are reported in tabular form for all included studies. Due to heterogeneity of study designs and outcome measures, data from the studies were not pooled quantitatively. This review is reported according to the Preferred Reporting Items for Systematic Reviews and Meta‐Analysis guidelines.
RESULTS
Database searches yielded a total of 1400 articles, of which 18 were selected on the basis of title and abstract for detailed assessment. Reference searching led us to retrieve 94 further studies of possible interest, of which 23 were selected on the basis of abstract for detailed assessment. Thus, 41 publications underwent full manuscript review, 19 of which met all inclusion criteria (see Supporting Information, Appendix 2, in the online version of this article).[13, 14, 15, 16, 17, 18, 19, 20, 21, 22, 23, 24, 25, 26, 27, 28, 29, 30, 31] These studies were published between 1983 and 2014, and were conducted primarily in the United States.
Study Characteristics
There was considerable heterogeneity among the 19 studies with regard to design, setting, and scope (Table 1). There were 5 randomized trials, for which the units of randomization were patient (1), provider team (2), and test (2). There were 13 pre‐post intervention studies, 5 of which used a concomitant control group, and 2 of which included a washout period. There was 1 interrupted time series study. Studies were conducted within inpatient hospital floors (8), outpatient clinics (4), emergency departments (ED) or urgent care facilities (4), and hospital operating rooms (3).
| Study | Design | Clinical Setting | Providers | Intervention and Duration | Order(s) Studied | Type of Price Displayed | Concurrent Interventions |
|---|---|---|---|---|---|---|---|
| |||||||
| Fang et al.[14] 2014 | Pre‐post study with control group | Academic hospital (USA) | All inpatient ordering providers | CPOE system with prices displayed for reference lab tests; 8 months | All send‐out lab tests | Charge from send‐out laboratory, displayed as range (eg, $100300) | Display also contained expected lab turnaround time |
| Nougon et al.[13] 2014 | Pre‐post study with washout | Academic adult emergency department (Belgium) | 9 ED house staff | CPOE system with prices displayed on common orders form, and price list displayed above all workstations and in patient rooms; 2 months | Common lab and imaging tests | Reference costs from Belgian National Institute for Health Insurance and Invalidity | None |
| Durand et al.[17] 2013 | RCT (randomized by test) | Academic hospital, all inpatients (USA) | All inpatient ordering providers | CPOE system with prices displayed; 6 months | 10 common imaging tests | Medicare allowable fee | None |
| Feldman et al.[16] 2013 | RCT (randomized by test) | Academic hospital, all inpatients (USA) | All inpatient ordering providers | CPOE system with prices displayed; 6 months | 61 lab tests | Medicare allowable fee | None |
| Horn et al.[15] 2014 | Interrupted time series study with control group | Private outpatient group practice alliance (USA) | 215 primary care physicians | CPOE system with prices displayed; 6 months | 27 lab tests | Medicare allowable fee, displayed as narrow range (eg, $5$10) | None |
| Ellemdin et al.[18] 2011 | Pre‐post study with control group | Academic hospital, internal medicine units (South Africa) | Internal medicine physicians (number NR) | Sheet with lab test costs given to intervention group physicians who were required to write out cost for each order; 4 months | Common lab tests | Not reported | None |
| Schilling,[19] 2010 | Pre‐post study with control group | Academic adult emergency department (Sweden) | All internal medicine physicians in ED | Standard provider workstations with price lists posted on each; 2 months | 91 common lab tests, 39 common imaging tests | Not reported | None |
| Guterman et al.[21] 2002 | Pre‐post study | Academic‐affiliated urgent care clinic (USA) | 51 attendings and housestaff | Preformatted paper prescription form with medication prices displayed; 2 weeks | 2 H2‐blocker medications | Acquisition cost of medication plus fill fee | None |
| Seguin et al.[20] 2002 | Pre‐post study | Academic surgical intensive care unit (France) | All intensive care unit physicians | Paper quick‐order checklist with prices displayed; 2 months | 6 common lab tests, 1 imaging test | Not reported | None |
| Hampers et al.[23] 1999 | Pre‐post study with washout | Academic pediatric emergency department (USA) | Pediatric ED attendings and housestaff (number NR) | Paper common‐order checklist with prices displayed; 3 months | 22 common lab and imaging tests | Chargemaster price* | Physicians required to calculate total charges for diagnostic workup |
| Ornstein et al.[22] 1999 | Pre‐post study | Academic family medicine outpatient clinic (USA) | 46 attendings and housestaff | Microcomputer CPOE system with medication prices displayed; 6 months | All medications | AWP for total supply (acute medications) or 30‐day supply (chronic medications) | Additional keystroke produced list of less costly alternative medications |
| Lin et al.[25] 1998 | Pre‐post study | Academic hospital operating rooms (USA) | All anesthesia providers | Standard muscle relaxant drug vials with price stickers displayed; 12 months | All muscle relaxant medications | Not reported | None |
| McNitt et al.[24] 1998 | Pre‐post study | Academic hospital operating rooms (USA) | 90 anesthesia attendings, housestaff and anesthetists | List of drug costs displayed in operating rooms, anesthesia lounge, and anesthesia satellite pharmacy; 10 months | 22 common anesthesia medications | Hospital acquisition cost | Regular anesthesia department reviews of drug usage and cost |
| Bates et al.[27] 1997 | RCT (randomized by patient) | Academic hospital, medical and surgical inpatients (USA) | All inpatient ordering providers | CPOE system with display of test price and running total of prices for the ordering session; 4 months (lab) and 7 months (imaging) | All lab tests, 35 common imaging tests | Chargemaster price | None |
| Vedsted et al.[26] 1997 | Pre‐post study with control group | Outpatient general practices (Denmark) | 231 general practitioners | In practices already using APEX CPOE system, introduction of medication price display (control practices used non‐APEX computer system or paper‐based prescribing); 12 months | All medications | Chargemaster price | Medication price comparison module (stars indicated availability of cheaper option) |
| Horrow et al.[28] 1994 | Pre‐post study | Private tertiary care hospital operating rooms (USA) | 56 anesthesia attendings, housestaff and anesthetists | Standard anesthesia drug vials and syringes with supermarket price stickers displayed; 3 months | 13 neuromuscular relaxant and sedative‐hypnotic medications | Hospital acquisition cost | None |
| Tierney et al.[29] 1993 | Cluster RCT (randomized by provider team) | Public hospital, internal medicine services (USA) | 68 teams of internal medicine attendings and housestaff | Microcomputer CPOE system with prices displayed (control group used written order sheets); 17 months | All orders | Chargemaster price | CPOE system listed cost‐effective tests for common problems and displayed reasonable test intervals |
| Tierney et al.[30] 1990 | Cluster RCT (randomized by clinic session) | Academic, outpatient, general medicine practice (USA) | 121 internal medicine attendings and housestaff | Microcomputer CPOE system with pop‐up window displaying price for current test and running total of cumulative test prices for current visit; 6 months | All lab and imaging tests | Chargemaster price | None |
| Everett et al.[31] 1983 | Pre‐post study with control group | Academic hospital, general internal medicine wards (USA) | Internal medicine attendings and housestaff (number NR) | Written order sheet with adjacent sheet of lab test prices; 3 months | Common lab tests | Chargemaster price | None |
Prices were displayed for laboratory tests (12 studies), imaging tests (8 studies), and medications (7 studies). Study scope ranged from examining a single medication class to evaluating all inpatient orders. The type of price used for the display varied, with the most common being the facility charges or chargemaster prices (6 studies), and Medicare prices (3 studies). In several cases, price display was only 1 component of the study, and 6 studies introduced additional interventions concurrent with price display, such as cost‐effective ordering menus,[29] medication comparison modules,[26] or display of test turnaround times.[14] Seven of the 19 studies were conducted in the past decade, of which 5 displayed prices within an EHR.[13, 14, 15, 16, 17]
Order Costs and Volume
Thirteen studies reported the numeric impact of price display on aggregate order costs (Table 2). Nine of these demonstrated a statistically significant (P < 0.05) decrease in order costs, with effect sizes ranging from 10.7% to 62.8%.[13, 16, 18, 20, 23, 24, 28, 29, 30] Decreases were found for lab costs, imaging costs, and medication costs, and were observed in both the inpatient and outpatient settings. Three of these 9 studies were randomized. For example, in 1 study randomizing 61 lab tests to price display or no price display, costs for the intervention labs dropped 9.6% compared to the year prior, whereas costs for control labs increased 2.9% (P < 0.001).[16] Two studies randomized by provider group showed that providers seeing order prices accrued 12.7% fewer charges per inpatient admission (P = 0.02) and 12.9% fewer test charges per outpatient visit (P < 0.05).[29, 30] Three studies found no significant association between price display and order costs, with effect sizes ranging from a decrease of 18.8% to an increase of 4.3%.[19, 22, 27] These studies also evaluated lab, imaging, and medication costs, and included 1 randomized trial. One additional large study noted a 12.5% decrease in medication costs after initiation of price display, but did not statistically evaluate this difference.[25]
| Study | No. of Encounters | Primary Outcome Measure(s) | Impact on Order Costs | Impact on Order Volume | ||||
|---|---|---|---|---|---|---|---|---|
| Control Group Outcome | Intervention Group Outcome | Relative Change | Control Group Outcome | Intervention Group Outcome | Relative Change | |||
| ||||||||
| Fang et al.[14] 2014 | 378,890 patient‐days | Reference lab orders per 1000 patient‐days | NR | NR | NA | 51 orders/1000 patient‐days | 38 orders/1000 patient‐days | 25.5% orders/1000 patient‐days (P < 0.001) |
| Nougon et al.[13] 2015 | 2422 ED visits (excluding washout) | Lab and imaging test costs per ED visit | 7.1/visit (lab); 21.8/visit (imaging) | 6.4/visit (lab); 14.4/visit (imaging) | 10.7% lab costs/ visit (P = 0.02); 33.7% imaging costs/visit (P < 0.001) | NR | NR | NA |
| Durand et al.[17] 2013 | NR | Imaging orders compared to baseline 1 year prior | NR | NR | NA | 3.0% total orders | +2.8% total orders | +5.8% total orders (P = 0.10) |
| Feldman et al.[16] 2013 | 245,758 patient‐days | Lab orders and fees per patient‐day compared to baseline 1 year prior | +2.9% fees/ patient‐day | 9.6% fees/ patient‐day | 12.5% fees/patient‐day (P < 0.001) | +5.6% orders/patient‐day | 8.6% orders/ patient‐day | 14.2% orders/patient‐day (P < 0.001) |
| Horn et al.[15] 2014 | NR | Lab test volume per patient visit, by individual lab test | NR | NR | NA | Aggregate data not reported | Aggregate data not reported | 5 of 27 tests had significant reduction in ordering (2.1% to 15.2%/patient visit) |
| Ellemdin et al.[18] 2011 | 897 admissions | Lab cost per hospital day | R442.90/day | R284.14/day | 35.8% lab costs/patient‐day (P = 0.001) | NR | NR | NA |
| Schilling[19] 2010 | 3222 ED visits | Combined lab and imaging test costs per ED visit | 108/visit | 88/visit | 18.8% test costs/visit (P = 0.07) | NR | NR | NA |
| Guterman et al.[21] 2002 | 168 urgent care visits | Percent of acid reducer prescriptions for ranitidine (the higher‐cost option) | NR | NR | NA | 49% ranitidine | 21% ranitidine | 57.1% ranitidine (P = 0.007) |
| Seguin et al.[20] 2002 | 287 SICU admissions | Tests ordered per admission; test costs per admission | 341/admission | 266/admission | 22.0% test costs/admission (P < 0.05) | 13.6 tests/admission | 11.1 tests/ admission | 18.4% tests/admission (P = 0.12) |
| Hampers et al.[23] 1999 | 4881 ED visits (excluding washout) | Adjusted mean test charges per patient visit | $86.79/visit | $63.74/visit | 26.6% test charges/visit (P < 0.01) | NR | NR | NA |
| Ornstein et al.[22] 1999 | 30,461 outpatient visits | Prescriptions per visit; prescription cost per visit; cost per prescription | $12.49/visit; $21.83/ prescription | $13.03/visit; $22.03/prescription |
+4.3% prescription costs/visit (P = 0.12); +0.9% cost/prescription (P = 0.61) |
0.66 prescriptions/visit | 0.64 prescriptions/ visit | 3.0% prescriptions/visit (P value not reported) |
| Lin et al.[25] 1998 | 40,747 surgical cases | Annual spending on muscle relaxants medication |
$378,234/year (20,389 cases) |
$330,923/year (20,358 cases) |
12.5% | NR | NR | NA |
| McNitt et al.[24] 1998 | 15,130 surgical cases | Anesthesia drug cost per case | $51.02/case | $18.99/case | 62.8% drug costs/case (P < 0.05) | NR | NR | NA |
| Bates et al.[27] 1997 | 7090 admissions (lab); 17,381 admissions (imaging) | Tests ordered per admission; charges for tests ordered per admission |
$771/ admission (lab); $276/admission (imaging) |
$739/admission (lab); $275/admission (imaging) |
4.2% lab charges/admission (P = 0.97); 0.4% imaging charges/admission (P = 0.10) |
26.8 lab tests/admission; 1.76 imaging tests/admission |
25.6 lab tests/ admission; 1.76 imaging tests/ admission |
4.5% lab tests/admission (P = 0.74); 0% imaging tests/admission (P = 0.13) |
| Vedsted et al.[26] 1997 | NR | Prescribed daily doses per 1000 insured; total drug reimbursement per 1000 insured; reimbursement per daily dose | Reported graphically only | Reported graphically only | No difference | Reported graphically only | Reported graphically only | No difference |
| Horrow et al.[28] 1994 | NR | Anesthetic drugs used per week; anesthetic drug cost per week | $3837/week | $3179/week | 17.1% drug costs/week (P = 0.04) | 97 drugs/week | 94 drugs/week | 3.1% drugs/week (P = 0.56) |
| Tierney et al.[29] 1993 | 5219 admissions | Total charges per admission | $6964/admission | $6077/admission | 12.7% total charges/admission (P = 0.02) | NR | NR | NA |
| Tierney et al.[30] 1990 | 15,257 outpatient visits | Test orders per outpatient visit; test charges per outpatient visit | $51.81/visit | $45.13/visit | 12.9% test charges/visit (P < 0.05) | 1.82 tests/visit | 1.56 tests/visit | 14.3% tests/visit (P < 0.005) |
| Everett et al.[31] 1983 | NR | Lab tests per admission; charges per admission | NR | NR | NA | NR | NR | No statistically significant changes |
Eight studies reported the numeric impact of price display on aggregate order volume. Three of these demonstrated a statistically significant decrease in order volume, with effect sizes ranging from 14.2% to 25.5%.[14, 16, 30] Decreases were found for lab and imaging tests, and were observed in both inpatient and outpatient settings. For example, 1 pre‐post study displaying prices for inpatient send‐out lab tests demonstrated a 25.5% reduction in send‐out labs per 1000 patient‐days (P < 0.001), whereas there was no change for the control group in‐house lab tests, for which prices were not shown.[14] The other 5 studies reported no significant association between price display and order volume, with effect sizes ranging from a decrease of 18.4% to an increase of 5.8%.[17, 20, 22, 27, 28] These studies evaluated lab, imaging, and medication volume. One trial randomizing by individual inpatient showed a nonsignificant decrease of 4.5% in lab orders per admission in the intervention group (P = 0.74), although the authors noted that their study had insufficient power to detect differences less than 10%.[27] Of note, 2 of the 5 studies reporting nonsignificant impacts on order volume (3.1%, P = 0.56; and 18.4%, P = 0.12) did demonstrate significant decreases in order costs (17.1%, P = 0.04; and 22.0%, P < 0.05).[20, 28]
There were an additional 2 studies that reported the impact of price display on order volume for individual orders only. In 1 time‐series study showing lab test prices, there was a statistically significant decrease in order volume for 5 of 27 individual tests studied (using a Bonferroni‐adjusted threshold of significance), with no tests showing a significant increase.[15] In 1 pre‐post study showing prices for H2‐antagonist drugs, there was a statistically significant 57.1% decrease in order volume for the high‐cost medication, with a corresponding 58.7% increase in the low‐cost option.[21] These studies did not report impact on aggregate order costs. Two further studies in this review did not report outcomes numerically, but did state in their articles that significant impacts on order volume were not observed.[26, 31]
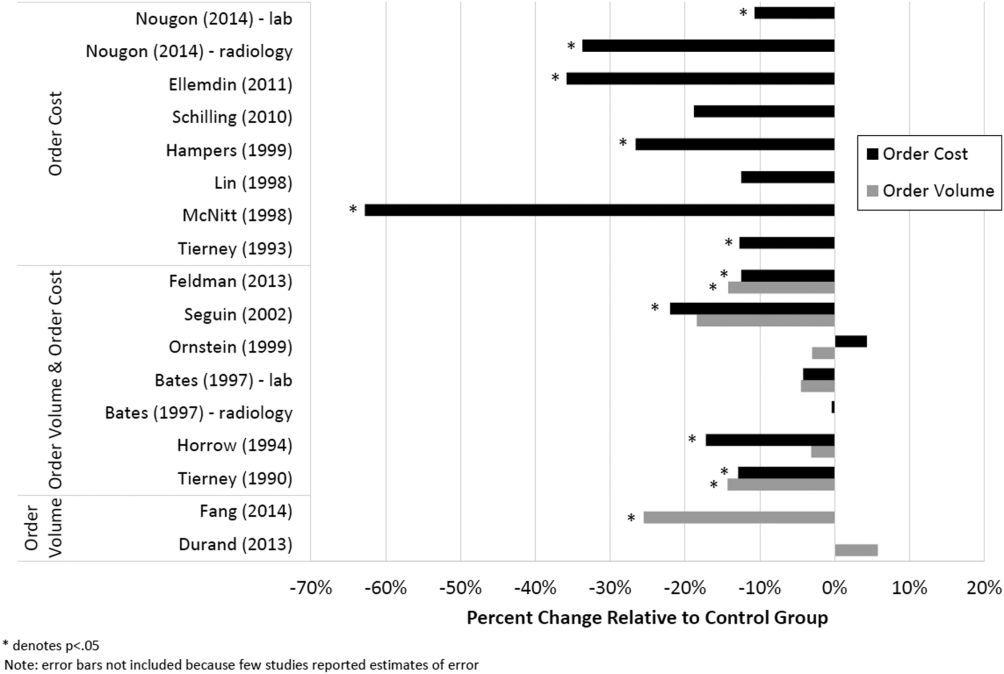
Therefore, of the 19 studies included in this review, 17 reported numeric results. Of these 17 studies, 12 showed that price display was associated with statistically significant decreases in either order costs or volume, either in aggregate (10 studies; Figure 1) or for individual orders (2 studies). Of the 7 studies conducted within the past decade, 5 noted significant decreases in order costs or volume. Prices were embedded into an EHR in 5 of these recent studies, and 4 of the 5 observed significant decreases in order costs or volume. Only 2 studies from the past decade1 from Belgium and 1 from the United Statesincorporated prices into an EHR and reported aggregate order costs. Both found statistically significant decreases in order costs with price display.[13, 16]
Patient Safety and Provider Acceptability
Five studies reported patient‐safety outcomes. One inpatient randomized trial showed similar rates of postdischarge utilization and charges between the intervention and control groups.[29] An outpatient randomized trial showed similar rates of hospital admissions, ED visits, and outpatient visits between the intervention and control groups.[30] Two pre‐post studies showing anesthesia prices in hospital operating rooms included a quality assurance review and showed no changes in adverse outcomes such as prolonged postoperative intubation, recovery room stay, or unplanned intensive care unit admissions.[24, 25] The only adverse safety finding was in a pre‐post study in a pediatric ED, which showed a higher rate of unscheduled follow‐up care during the intervention period compared to the control period (24.4% vs 17.8%, P < 0.01) but similar rates of patients feeling better (83.4% vs 86.7%, P = 0.05). These findings, however, were based on self‐report during telephone follow‐up with a 47% response rate.[23]
Five studies reported on provider acceptability of price display. Two conducted questionnaires as part of the study plan, whereas the other 3 offered general provider feedback. One questionnaire revealed that 83% of practices were satisfied or very satisfied with the price display.[26] The other questionnaire found that 81% of physicians felt the price display improved my knowledge of the relative costs of tests I order and similarly 81% would like additional cost information displayed for other orders.[15] Three studies reported subjectively that showing prices initially caused questions from most physicians,[13] but that ultimately, physicians like seeing this information[27] and gave feedback that was generally positive.[21] One study evaluated the impact of price display on provider cost knowledge. Providers in the intervention group did not improve in their cost‐awareness, with average errors in cost estimates exceeding 40% even after 6 months of price display.[30]
Study Quality
Using a modified Downs and Black checklist of 21 items, studies in this review ranged in scores from 5 to 20, with a median score of 15. Studies most frequently lost points for being nonrandomized, failing to describe or adjust for potential confounders, being prone to historical confounding, or not evaluating potential adverse events.
We supplemented this modified Downs and Black checklist by reviewing 3 categories of study limitations not well‐reflected in the checklist scoring (Table 3). The first was potential for contamination between study groups, which was a concern in 4 studies. For example, 1 pre‐post study assessing medication ordering included clinical pharmacists in patient encounters both before and after the price display intervention.[22] This may have enhanced cost‐awareness even before prices were shown. The second set of limitations, present in 12 studies, included confounders that were not addressed by study design or analysis. For example, the intervention in 1 study displayed not just test cost but also test turnaround time, which may have separately influenced providers against ordering a particular test.[14] The third set of limitations included unanticipated gaps in the display of prices or in the collection of ordering data, which occurred in 5 studies. If studies did not report on gaps in the intervention or data collection, we assumed there were none.
| Study | Modified Downs & Black Score (Max Score 21) | Other Price Display Quality Criteria (Not Included in Downs & Black Score) | ||
|---|---|---|---|---|
| Potential for Contamination Between Study Groups | Potential Confounders of Results Not Addressed by Study Design or Analysis | Incomplete Price Display Intervention or Data Collection | ||
| ||||
| Fang et al.[14] 2014 | 14 | None | Concurrent display of test turnaround time may have independently contributed to decreased test ordering | 21% of reference lab orders were excluded from analysis because no price or turnaround‐time data were available |
| Nougon et al.[13] 2015 | 16 | None | Historical confounding may have existed due to pre‐post study design without control group | None |
| Durand et al.[17] 2013 | 17 | Providers seeing test prices for intervention tests (including lab tests in concurrent Feldman study) may have remained cost‐conscious when placing orders for control tests | Interference between units likely occurred because intervention test ordering (eg, chest x‐ray) was not independent of control test ordering (eg, CT chest) | None |
| Feldman et al.[16] 2013 | 18 | Providers seeing test prices for intervention tests (including imaging tests in concurrent Durand study) may have remained cost‐conscious when placing orders for control tests | Interference between units likely occurred because intervention test ordering (eg, CMP) was not independent of control test ordering (eg, BMP) | None |
| Horn et al.[15] 2014 | 15 | None | None | None |
| Ellemdin et al.[18] 2011 | 15 | None | None | None |
| Schilling[19] 2010 | 12 | None | None | None |
| Guterman et al.[21] 2002 | 14 | None | Historical confounding may have existed due to pre‐post study design without control group | None |
| Seguin et al.[20] 2002 | 17 | None | Because primary outcome was not adjusted for length of stay, the 30% shorter average length of stay during intervention period may have contributed to decreased costs per admission; historical confounding may have existed due to pre‐post study design without control group | None |
| Hampers et al.[23] 1999 | 17 | None | Requirement that physicians calculate total charges for each visit may have independently contributed to decreased test ordering; historical confounding may have existed due to pre‐post study design without control group | 10% of eligible patient visits were excluded from analysis because prices were not displayed or ordering data were not collected |
| Ornstein et al.[22] 1999 | 15 | Clinical pharmacists and pharmacy students involved in half of all patient contacts may have enhanced cost‐awareness during control period | Emergence of new drugs during intervention period and an ongoing quality improvement activity to increase prescribing of lipid‐lowering medications may have contributed to increased medication costs; historical confounding may have existed due to pre‐post study design without control group | 25% of prescription orders had no price displayed, and average prices were imputed for purposes of analysis |
| Lin et al.[25] 1998 | 12 | None | Emergence of new drug during intervention period and changes in several drug prices may have contributed to decreased order costs; historical confounding may have existed due to pre‐post study design without control group | None |
| McNitt et al.[24] 1998 | 15 | None | Intensive drug‐utilization review and cost‐reduction efforts may have independently contributed to decreased drug costs; historical confounding may have existed due to pre‐post study design without control group | None |
| Bates et al.[27] 1997 | 18 | Providers seeing test prices on intervention patients may have remembered prices or remained cost‐conscious when placing orders for control patients | None | 47% of lab tests and 26% of imaging tests were ordered manually outside of the trial's CPOE display system* |
| Vedsted et al.[26] 1997 | 5 | None | Medication price comparison module may have independently influenced physician ordering | None |
| Horrow et al.[28] 1994 | 14 | None | Historical confounding may have existed due to pre‐post study design without control group | Ordering data for 2 medications during 2 of 24 weeks were excluded from analysis due to internal inconsistency in the data |
| Tierney et al.[29] 1993 | 20 | None | Introduction of computerized order entry and menus for cost‐effective ordering may have independently contributed to decreased test ordering | None |
| Tierney et al.[30] 1990 | 20 | None | None | None |
| Everett et al.[31] 1983 | 7 | None | None | None |
Even among the 5 randomized trials there were substantial limitations. For example, 2 trials used individual tests as the unit of randomization, although ordering patterns for these tests are not independent of each other (eg, ordering rates for comprehensive metabolic panels are not independent of ordering rates for basic metabolic panels).[16, 17] This creates interference between units that was not accounted for in the analysis.[32] A third trial was randomized at the level of the patient, so was subject to contamination as providers seeing the price display for intervention group patients may have remained cost‐conscious while placing orders for control group patients.[27] In a fourth trial, the measured impact of the price display may have been confounded by other aspects of the overall cost intervention, which included cost‐effective test menus and suggestions for reasonable testing intervals.[29]
The highest‐quality study was a cluster‐randomized trial published in 1990 specifically measuring the effect of price display on a wide range of orders.[30] Providers and patients were separated by clinic session so as to avoid contamination between groups, and the trial included more than 15,000 outpatient visits. The intervention group providers ordered 14.3% fewer tests than control group providers, which resulted in 12.9% lower charges.
DISCUSSION
We identified 19 published reports of interventions that displayed real‐time order prices to providers and evaluated the impact on provider ordering. There was substantial heterogeneity in study setting, design, and quality. Although there is insufficient evidence on which to base strong conclusions, these studies collectively suggest that provider price display likely reduces order costs to a modest degree. Data on patient safety were largely lacking, although in the few studies that examined patient outcomes, there was little evidence that patient safety was adversely affected by the intervention. Providers widely viewed display of prices positively.
Our findings align with those of a recent systematic review that concluded that real‐time price information changed provider ordering in the majority of studies.[7] Whereas that review evaluated 17 studies from both clinical settings and simulations, our review focused exclusively on studies conducted in actual ordering environments. Additionally, our literature search yielded 8 studies not previously reviewed. We believe that the alignment of our findings with the prior review, despite the differences in studies included, adds validity to the conclusion that price display likely has a modest impact on reducing order costs. Our review contains several additions important for those considering price display interventions. We provide detailed information on study settings and intervention characteristics. We present a formal assessment of study quality to evaluate the strength of individual study findings and to guide future research in this area. Finally, because both patient safety and provider acceptability may be a concern when prices are shown, we describe all safety outcomes and provider feedback that these studies reported.
The largest effect sizes were noted in 5 studies reporting decreases in order volume or costs greater than 25%.[13, 14, 18, 23, 24] These were all pre‐post intervention studies, so the effect sizes may have been exaggerated by historical confounding. However, the 2 studies with concurrent control groups found no decreases in order volume or cost in the control group.[14, 18] Among the 5 studies that did not find a significant association between price display and provider ordering, 3 were subject to contamination between study groups,[17, 22, 27] 1 was underpowered,[19] and 1 noted a substantial effect size but did not perform a statistical analysis.[25] We also found that order costs were more frequently reduced than order volume, likely because shifts in ordering to less expensive alternatives may cause costs to decrease while volume remains unchanged.[20, 28]
If price display reduces order costs, as the majority of studies in this review indicate, this finding carries broad implications. Policy makers could promote cost‐conscious care by creating incentives for widespread adoption of price display. Hospital and health system leaders could improve transparency and reduce expenses by prioritizing price display. The specific beneficiaries of any reduced spending would depend on payment structures. With shifts toward financial risk‐bearing arrangements like accountable care organizations, healthcare institutions may have a financial interest in adopting price display. Because price display is an administrative intervention that can be developed within EHRs, it is potentially 1 of the most rapidly scalable strategies for reducing healthcare spending. Even modest reductions in spending on laboratory tests, imaging studies, and medications would result in substantial savings on a system‐wide basis.
Implementing price display does not come without challenges. Prices need to be calculated or obtained, loaded into an EHR system, and updated periodically. Technology innovators could enhance EHR software by making these processes easier. Healthcare institutions may find displaying relative prices (eg, $/$$/$$$) logistically simpler in some contexts than showing actual prices (eg, purchase cost), such as when contracts require prices to be confidential. Although we decided to exclude studies displaying relative prices, our search identified no studies that met other inclusion criteria but displayed relative prices, suggesting a lack of evidence regarding the impact of relative price display as an alternative to actual price display.
There are 4 key limitations to our review. First, the heterogeneity of the study designs and reported outcomes precluded pooling of data. The variety of clinical settings and mechanisms through which prices were displayed enhances the generalizability of our findings, but makes it difficult to identify particular contexts (eg, type of price or type of order) in which the intervention may be most effective. Second, although the presence of negative studies on this subject reduces the concern for reporting bias, it remains possible that sites willing to implement and study price displays may be inherently more sensitive to prices, such that published results might be more pronounced than if the intervention were widely implemented across multiple sites. Third, the mixed study quality limits the strength of conclusions that can be drawn. Several studies with both positive and negative findings had issues of bias, contamination, or confounding that make it difficult to be confident of the direction or magnitude of the main findings. Studies evaluating price display are challenging to conduct without these limitations, and that was apparent in our review. Finally, because over half of the studies were conducted over 15 years ago, it may limit their generalizability to modern ordering environments.
We believe there remains a need for high‐quality evidence on this subject within a contemporary context to confirm these findings. The optimal methodology for evaluating this intervention is a cluster randomized trial by facility or provider group, similar to that reported by Tierney et al. in 1990, with a primary outcome of aggregate order costs.[30] Given the substantial investment this would require, a large time series study could also be informative. As most prior price display interventions have been under 6 months in duration, it would be useful to know if the impact on order costs is sustained over a longer time period. The concurrent introduction of any EHR alerts that could impact ordering (eg, duplicate test warnings) should be simultaneously measured and reported. Studies also need to determine the impact of price display alone compared to price comparison displays (displaying prices for the selected order along with reasonable alternatives). Although price comparison was a component of the intervention in some of the studies in this review, it was not evaluated relative to price display alone. Furthermore, it would be helpful to know if the type of price displayed affects its impact. For instance, if providers are most sensitive to the absolute magnitude of prices, then displaying chargemaster prices may impact ordering more than showing hospital costs. If, however, relative prices are all that providers need, then showing lower numbers, such as Medicare prices or hospital costs, may be sufficient. Finally, it would be reassuring to have additional evidence that price display does not adversely impact patient outcomes.
Although some details need elucidation, the studies synthesized in this review provide valuable data in the current climate of increased emphasis on price transparency. Although substantial attention has been devoted by the academic community, technology start‐ups, private insurers, and even state legislatures to improving price transparency to patients, less focus has been given to physicians, for whom healthcare prices are often just as opaque.[4] The findings from this review suggest that provider price display may be an effective, safe, and acceptable approach to empower physicians to control healthcare spending.
Disclosures: Dr. Silvestri, Dr. Bongiovanni, and Ms. Glover have nothing to disclose. Dr. Gross reports grants from Johnson & Johnson, Medtronic Inc., and 21st Century Oncology during the conduct of this study. In addition, he received payment from Fair Health Inc. and ASTRO outside the submitted work.
- Institute of Medicine. Best Care at Lower Cost: The Path to Continuously Learning Health Care in America: Washington, DC: National Academies Press; 2012.
- . Do physicians need a “shopping cart” for health care services? JAMA. 2012;307(8):791–792.
- . The disruptive innovation of price transparency in health care. JAMA. 2013;310(18):1927–1928.
- , . Providing price displays for physicians: which price is right? JAMA. 2014;312(16):1631–1632.
- , . Physician awareness of diagnostic and nondrug therapeutic costs: a systematic review. Int J Tech Assess Health Care. 2008;24(2):158–165.
- , , . Physician awareness of drug cost: a systematic review. PLoS Med. 2007;4(9):e283.
- , , , . The effect of charge display on cost of care and physician practice behaviors: a systematic review. J Gen Intern Med. 2015;30:835–842.
- , , . Engaging medical librarians to improve the quality of review articles. JAMA. 2014;312(10):999–1000.
- , , . Influencing behavior of physicians ordering laboratory tests: a literature study. Med Care. 1993;31(9):784–794.
- , . Trials of providing costing information to general practitioners: a systematic review. Med J Aust. 1997;167(2):89–92.
- . A review of physician cost‐containment strategies for laboratory testing. Med Care. 1983;21(8):783–802.
- , . The feasibility of creating a checklist for the assessment of the methodological quality both of randomised and non‐randomised studies of health care interventions. J Epidemiol Community Health. 1998;52(6):377–384.
- , , , et al. Does offering pricing information to resident physicians in the emergency department potentially reduce laboratory and radiology costs? Eur J Emerg Med. 2015;22:247–252.
- , , , et al. Cost and turn‐around time display decreases inpatient ordering of reference laboratory tests: a time series. BMJ Qual Saf. 2014;23:994–1000.
- , , , , . The impact of cost displays on primary care physician laboratory test ordering. J Gen Intern Med. 2014;29:708–714.
- , , , et al. Impact of providing fee data on laboratory test ordering: a controlled clinical trial. JAMA Intern Med. 2013;173(10):903–908.
- , , , . Provider cost transparency alone has no impact on inpatient imaging utilization. J Am Coll Radiol. 2013;10(2):108–113.
- , , . Providing clinicians with information on laboratory test costs leads to reduction in hospital expenditure. S Afr Med J. 2011;101(10):746–748.
- . Cutting costs: the impact of price lists on the cost development at the emergency department. Eur J Emerg Med. 2010;17(6):337–339.
- , , , , . Effects of price information on test ordering in an intensive care unit. Intens Care Med. 2002;28(3):332–335.
- , , , , , . Modifying provider behavior: a low‐tech approach to pharmaceutical ordering. J Gen Intern Med. 2002;17(10):792–796.
- , , , , . Medication cost information in a computer‐based patient record system. Impact on prescribing in a family medicine clinical practice. Arch Fam Med. 1999;8(2):118–121.
- , , , , . The effect of price information on test‐ordering behavior and patient outcomes in a pediatric emergency department. Pediatrics. 1999;103(4 pt 2):877–882.
- , , . Long‐term pharmaceutical cost reduction using a data management system. Anesth Analg. 1998;87(4):837–842.
- , . The impact of price labeling of muscle relaxants on cost consciousness among anesthesiologists. J Clin Anesth. 1998;10(5):401–403.
- , , . Does a computerized price comparison module reduce prescribing costs in general practice? Fam Pract. 1997;14(3):199–203.
- , , , et al. Does the computerized display of charges affect inpatient ancillary test utilization? Arch Intern Med. 1997;157(21):2501–2508.
- , . Price stickers do not alter drug usage. Can J Anaesth. 1994;41(11):1047–1052.
- , , , . Physician inpatient order writing on microcomputer workstations. Effects on resource utilization. JAMA. 1993;269(3):379–383.
- , , . The effect on test ordering of informing physicians of the charges for outpatient diagnostic tests. N Engl J Med. 1990;322(21):1499–1504.
- , , , . Effect of cost education, cost audits, and faculty chart review on the use of laboratory services. Arch Intern Med. 1983;143(5):942–944.
- . Interference between units in randomized experiments. J Am Stat Assoc. 2007;102(477):191–200.
Rising healthcare spending has garnered significant public attention, and is considered a threat to other national priorities. Up to one‐third of national health expenditures are wasteful, the largest fraction generated through unnecessary services that could be substituted for less‐costly alternatives or omitted altogether.[1] Physicians play a central role in health spending, as they purchase nearly all tests and therapies on behalf of patients.
One strategy to enhance cost‐conscious physician ordering is to increase transparency of cost data for providers.[2, 3, 4] Although physicians consider price an important factor in ordering decisions, they have difficulty estimating costs accurately or finding price information easily.[5, 6] Improving physicians' knowledge of order costs may prompt them to forego diagnostic tests or therapies of low utility, or shift ordering to lower‐cost alternatives. Real‐time price display during provider order entry is 1 approach for achieving this goal. Modern electronic health records (EHRs) with computerized physician order entry (CPOE) make price display not only practical but also scalable. Integrating price display into clinical workflow, however, can be challenging, and there remains lack of clarity about potential risks and benefits. The dissemination of real‐time CPOE price display, therefore, requires an understanding of its impact on clinical care.
Over the past 3 decades, several studies in the medical literature have evaluated the effect of price display on physician ordering behavior. To date, however, there has been only 1 narrative review of this literature, which did not include several recent studies on the topic or formally address study quality and physician acceptance of price display modules.[7] Therefore, to help inform healthcare leaders, technology innovators, and policy makers, we conducted a systematic review to address 4 key questions: (1) What are the characteristics of interventions that have displayed order prices to physicians in the context of actual practice? (2) To what degree does real‐time display of order prices impact order costs and order volume? (3) Does price display impact patient safety outcomes, and is it acceptable to providers? (4) What is the quality of the current literature on this topic?
METHODS
Data Sources
We searched 2 electronic databases, MEDLINE and Embase, using a combination of controlled vocabulary terms and keywords that covered both the targeted intervention (eg, fees and charges) and the outcome of interest (eg, physician's practice patterns), limited to English language articles with no restriction on country or year of publication (see Supporting Information, Appendix 1, in the online version of this article). The search was run through August 2014. Results from both database searches were combined and duplicates eliminated. We also ran a MEDLINE keyword search on titles and abstracts of articles from 2014 that were not yet indexed. A medical librarian was involved in all aspects of the search process.[8]
Study Selection
Studies were included if they evaluated the effect of displaying actual order prices to providers during the ordering process and reported the impact on provider ordering practices. Reports in any clinical context and with any study design were included. To assess most accurately the effect of price display on real‐life ordering and patient outcomes, studies were excluded if: (1) they were review articles, commentaries, or editorials; (2) they did not show order prices to providers; (3) the context was a simulation; (4) the prices displayed were relative (eg, $/$$/$$$) or were only cumulative; (5) prices were not presented real‐time during the ordering process; or (6) the primary outcome was neither order costs nor order volume. We decided a priori to exclude simulations because these may not accurately reflect provider behavior when treating real patients, and to exclude studies showing relative prices due to concerns that it is a less significant price transparency intervention and that providers may interpret relative prices differently from actual prices.
Two reviewers, both physicians and health service researchers (M.T.S. and T.R.B.), separately reviewed the full list of titles and abstracts. For studies that potentially met inclusion criteria, full articles were obtained and were independently read for inclusion in the final review. The references of all included studies were searched manually, and the Scopus database was used to search all studies that cited the included studies. We also searched the references of relevant literature reviews.[9, 10, 11] Articles of interest discovered through manual search were then subjected to the same process.
Data Extraction and Quality Assessment
Two reviewers (M.T.S. and T.R.B.) independently performed data extraction using a standardized spreadsheet. Discrepancies were resolved by reviewer consensus. Extracted study characteristics included study design and duration, clinical setting, study size, type of orders involved, characteristics of price display intervention and control, and type of outcome. Findings regarding patient safety and provider acceptability were also extracted when available.
Study quality was independently evaluated and scored by both reviewers using the Downs and Black checklist, designed to assess quality of both randomized and nonrandomized studies.[12] The checklist contains 5 items pertaining to allocation concealment, blinding, or follow‐up that are not applicable to an administrative intervention like price display, so these questions were excluded. Additionally, few studies calculated sample size or reported post hoc statistical power, so we also excluded this question, leaving a modified 21‐item checklist. We also assessed each study for sources of bias that were not already assessed by the Downs and Black checklist, including contamination between study groups, confounding of results, and incomplete intervention or data collection.
Data Synthesis
Data are reported in tabular form for all included studies. Due to heterogeneity of study designs and outcome measures, data from the studies were not pooled quantitatively. This review is reported according to the Preferred Reporting Items for Systematic Reviews and Meta‐Analysis guidelines.
RESULTS
Database searches yielded a total of 1400 articles, of which 18 were selected on the basis of title and abstract for detailed assessment. Reference searching led us to retrieve 94 further studies of possible interest, of which 23 were selected on the basis of abstract for detailed assessment. Thus, 41 publications underwent full manuscript review, 19 of which met all inclusion criteria (see Supporting Information, Appendix 2, in the online version of this article).[13, 14, 15, 16, 17, 18, 19, 20, 21, 22, 23, 24, 25, 26, 27, 28, 29, 30, 31] These studies were published between 1983 and 2014, and were conducted primarily in the United States.
Study Characteristics
There was considerable heterogeneity among the 19 studies with regard to design, setting, and scope (Table 1). There were 5 randomized trials, for which the units of randomization were patient (1), provider team (2), and test (2). There were 13 pre‐post intervention studies, 5 of which used a concomitant control group, and 2 of which included a washout period. There was 1 interrupted time series study. Studies were conducted within inpatient hospital floors (8), outpatient clinics (4), emergency departments (ED) or urgent care facilities (4), and hospital operating rooms (3).
| Study | Design | Clinical Setting | Providers | Intervention and Duration | Order(s) Studied | Type of Price Displayed | Concurrent Interventions |
|---|---|---|---|---|---|---|---|
| |||||||
| Fang et al.[14] 2014 | Pre‐post study with control group | Academic hospital (USA) | All inpatient ordering providers | CPOE system with prices displayed for reference lab tests; 8 months | All send‐out lab tests | Charge from send‐out laboratory, displayed as range (eg, $100300) | Display also contained expected lab turnaround time |
| Nougon et al.[13] 2014 | Pre‐post study with washout | Academic adult emergency department (Belgium) | 9 ED house staff | CPOE system with prices displayed on common orders form, and price list displayed above all workstations and in patient rooms; 2 months | Common lab and imaging tests | Reference costs from Belgian National Institute for Health Insurance and Invalidity | None |
| Durand et al.[17] 2013 | RCT (randomized by test) | Academic hospital, all inpatients (USA) | All inpatient ordering providers | CPOE system with prices displayed; 6 months | 10 common imaging tests | Medicare allowable fee | None |
| Feldman et al.[16] 2013 | RCT (randomized by test) | Academic hospital, all inpatients (USA) | All inpatient ordering providers | CPOE system with prices displayed; 6 months | 61 lab tests | Medicare allowable fee | None |
| Horn et al.[15] 2014 | Interrupted time series study with control group | Private outpatient group practice alliance (USA) | 215 primary care physicians | CPOE system with prices displayed; 6 months | 27 lab tests | Medicare allowable fee, displayed as narrow range (eg, $5$10) | None |
| Ellemdin et al.[18] 2011 | Pre‐post study with control group | Academic hospital, internal medicine units (South Africa) | Internal medicine physicians (number NR) | Sheet with lab test costs given to intervention group physicians who were required to write out cost for each order; 4 months | Common lab tests | Not reported | None |
| Schilling,[19] 2010 | Pre‐post study with control group | Academic adult emergency department (Sweden) | All internal medicine physicians in ED | Standard provider workstations with price lists posted on each; 2 months | 91 common lab tests, 39 common imaging tests | Not reported | None |
| Guterman et al.[21] 2002 | Pre‐post study | Academic‐affiliated urgent care clinic (USA) | 51 attendings and housestaff | Preformatted paper prescription form with medication prices displayed; 2 weeks | 2 H2‐blocker medications | Acquisition cost of medication plus fill fee | None |
| Seguin et al.[20] 2002 | Pre‐post study | Academic surgical intensive care unit (France) | All intensive care unit physicians | Paper quick‐order checklist with prices displayed; 2 months | 6 common lab tests, 1 imaging test | Not reported | None |
| Hampers et al.[23] 1999 | Pre‐post study with washout | Academic pediatric emergency department (USA) | Pediatric ED attendings and housestaff (number NR) | Paper common‐order checklist with prices displayed; 3 months | 22 common lab and imaging tests | Chargemaster price* | Physicians required to calculate total charges for diagnostic workup |
| Ornstein et al.[22] 1999 | Pre‐post study | Academic family medicine outpatient clinic (USA) | 46 attendings and housestaff | Microcomputer CPOE system with medication prices displayed; 6 months | All medications | AWP for total supply (acute medications) or 30‐day supply (chronic medications) | Additional keystroke produced list of less costly alternative medications |
| Lin et al.[25] 1998 | Pre‐post study | Academic hospital operating rooms (USA) | All anesthesia providers | Standard muscle relaxant drug vials with price stickers displayed; 12 months | All muscle relaxant medications | Not reported | None |
| McNitt et al.[24] 1998 | Pre‐post study | Academic hospital operating rooms (USA) | 90 anesthesia attendings, housestaff and anesthetists | List of drug costs displayed in operating rooms, anesthesia lounge, and anesthesia satellite pharmacy; 10 months | 22 common anesthesia medications | Hospital acquisition cost | Regular anesthesia department reviews of drug usage and cost |
| Bates et al.[27] 1997 | RCT (randomized by patient) | Academic hospital, medical and surgical inpatients (USA) | All inpatient ordering providers | CPOE system with display of test price and running total of prices for the ordering session; 4 months (lab) and 7 months (imaging) | All lab tests, 35 common imaging tests | Chargemaster price | None |
| Vedsted et al.[26] 1997 | Pre‐post study with control group | Outpatient general practices (Denmark) | 231 general practitioners | In practices already using APEX CPOE system, introduction of medication price display (control practices used non‐APEX computer system or paper‐based prescribing); 12 months | All medications | Chargemaster price | Medication price comparison module (stars indicated availability of cheaper option) |
| Horrow et al.[28] 1994 | Pre‐post study | Private tertiary care hospital operating rooms (USA) | 56 anesthesia attendings, housestaff and anesthetists | Standard anesthesia drug vials and syringes with supermarket price stickers displayed; 3 months | 13 neuromuscular relaxant and sedative‐hypnotic medications | Hospital acquisition cost | None |
| Tierney et al.[29] 1993 | Cluster RCT (randomized by provider team) | Public hospital, internal medicine services (USA) | 68 teams of internal medicine attendings and housestaff | Microcomputer CPOE system with prices displayed (control group used written order sheets); 17 months | All orders | Chargemaster price | CPOE system listed cost‐effective tests for common problems and displayed reasonable test intervals |
| Tierney et al.[30] 1990 | Cluster RCT (randomized by clinic session) | Academic, outpatient, general medicine practice (USA) | 121 internal medicine attendings and housestaff | Microcomputer CPOE system with pop‐up window displaying price for current test and running total of cumulative test prices for current visit; 6 months | All lab and imaging tests | Chargemaster price | None |
| Everett et al.[31] 1983 | Pre‐post study with control group | Academic hospital, general internal medicine wards (USA) | Internal medicine attendings and housestaff (number NR) | Written order sheet with adjacent sheet of lab test prices; 3 months | Common lab tests | Chargemaster price | None |
Prices were displayed for laboratory tests (12 studies), imaging tests (8 studies), and medications (7 studies). Study scope ranged from examining a single medication class to evaluating all inpatient orders. The type of price used for the display varied, with the most common being the facility charges or chargemaster prices (6 studies), and Medicare prices (3 studies). In several cases, price display was only 1 component of the study, and 6 studies introduced additional interventions concurrent with price display, such as cost‐effective ordering menus,[29] medication comparison modules,[26] or display of test turnaround times.[14] Seven of the 19 studies were conducted in the past decade, of which 5 displayed prices within an EHR.[13, 14, 15, 16, 17]
Order Costs and Volume
Thirteen studies reported the numeric impact of price display on aggregate order costs (Table 2). Nine of these demonstrated a statistically significant (P < 0.05) decrease in order costs, with effect sizes ranging from 10.7% to 62.8%.[13, 16, 18, 20, 23, 24, 28, 29, 30] Decreases were found for lab costs, imaging costs, and medication costs, and were observed in both the inpatient and outpatient settings. Three of these 9 studies were randomized. For example, in 1 study randomizing 61 lab tests to price display or no price display, costs for the intervention labs dropped 9.6% compared to the year prior, whereas costs for control labs increased 2.9% (P < 0.001).[16] Two studies randomized by provider group showed that providers seeing order prices accrued 12.7% fewer charges per inpatient admission (P = 0.02) and 12.9% fewer test charges per outpatient visit (P < 0.05).[29, 30] Three studies found no significant association between price display and order costs, with effect sizes ranging from a decrease of 18.8% to an increase of 4.3%.[19, 22, 27] These studies also evaluated lab, imaging, and medication costs, and included 1 randomized trial. One additional large study noted a 12.5% decrease in medication costs after initiation of price display, but did not statistically evaluate this difference.[25]
| Study | No. of Encounters | Primary Outcome Measure(s) | Impact on Order Costs | Impact on Order Volume | ||||
|---|---|---|---|---|---|---|---|---|
| Control Group Outcome | Intervention Group Outcome | Relative Change | Control Group Outcome | Intervention Group Outcome | Relative Change | |||
| ||||||||
| Fang et al.[14] 2014 | 378,890 patient‐days | Reference lab orders per 1000 patient‐days | NR | NR | NA | 51 orders/1000 patient‐days | 38 orders/1000 patient‐days | 25.5% orders/1000 patient‐days (P < 0.001) |
| Nougon et al.[13] 2015 | 2422 ED visits (excluding washout) | Lab and imaging test costs per ED visit | 7.1/visit (lab); 21.8/visit (imaging) | 6.4/visit (lab); 14.4/visit (imaging) | 10.7% lab costs/ visit (P = 0.02); 33.7% imaging costs/visit (P < 0.001) | NR | NR | NA |
| Durand et al.[17] 2013 | NR | Imaging orders compared to baseline 1 year prior | NR | NR | NA | 3.0% total orders | +2.8% total orders | +5.8% total orders (P = 0.10) |
| Feldman et al.[16] 2013 | 245,758 patient‐days | Lab orders and fees per patient‐day compared to baseline 1 year prior | +2.9% fees/ patient‐day | 9.6% fees/ patient‐day | 12.5% fees/patient‐day (P < 0.001) | +5.6% orders/patient‐day | 8.6% orders/ patient‐day | 14.2% orders/patient‐day (P < 0.001) |
| Horn et al.[15] 2014 | NR | Lab test volume per patient visit, by individual lab test | NR | NR | NA | Aggregate data not reported | Aggregate data not reported | 5 of 27 tests had significant reduction in ordering (2.1% to 15.2%/patient visit) |
| Ellemdin et al.[18] 2011 | 897 admissions | Lab cost per hospital day | R442.90/day | R284.14/day | 35.8% lab costs/patient‐day (P = 0.001) | NR | NR | NA |
| Schilling[19] 2010 | 3222 ED visits | Combined lab and imaging test costs per ED visit | 108/visit | 88/visit | 18.8% test costs/visit (P = 0.07) | NR | NR | NA |
| Guterman et al.[21] 2002 | 168 urgent care visits | Percent of acid reducer prescriptions for ranitidine (the higher‐cost option) | NR | NR | NA | 49% ranitidine | 21% ranitidine | 57.1% ranitidine (P = 0.007) |
| Seguin et al.[20] 2002 | 287 SICU admissions | Tests ordered per admission; test costs per admission | 341/admission | 266/admission | 22.0% test costs/admission (P < 0.05) | 13.6 tests/admission | 11.1 tests/ admission | 18.4% tests/admission (P = 0.12) |
| Hampers et al.[23] 1999 | 4881 ED visits (excluding washout) | Adjusted mean test charges per patient visit | $86.79/visit | $63.74/visit | 26.6% test charges/visit (P < 0.01) | NR | NR | NA |
| Ornstein et al.[22] 1999 | 30,461 outpatient visits | Prescriptions per visit; prescription cost per visit; cost per prescription | $12.49/visit; $21.83/ prescription | $13.03/visit; $22.03/prescription |
+4.3% prescription costs/visit (P = 0.12); +0.9% cost/prescription (P = 0.61) |
0.66 prescriptions/visit | 0.64 prescriptions/ visit | 3.0% prescriptions/visit (P value not reported) |
| Lin et al.[25] 1998 | 40,747 surgical cases | Annual spending on muscle relaxants medication |
$378,234/year (20,389 cases) |
$330,923/year (20,358 cases) |
12.5% | NR | NR | NA |
| McNitt et al.[24] 1998 | 15,130 surgical cases | Anesthesia drug cost per case | $51.02/case | $18.99/case | 62.8% drug costs/case (P < 0.05) | NR | NR | NA |
| Bates et al.[27] 1997 | 7090 admissions (lab); 17,381 admissions (imaging) | Tests ordered per admission; charges for tests ordered per admission |
$771/ admission (lab); $276/admission (imaging) |
$739/admission (lab); $275/admission (imaging) |
4.2% lab charges/admission (P = 0.97); 0.4% imaging charges/admission (P = 0.10) |
26.8 lab tests/admission; 1.76 imaging tests/admission |
25.6 lab tests/ admission; 1.76 imaging tests/ admission |
4.5% lab tests/admission (P = 0.74); 0% imaging tests/admission (P = 0.13) |
| Vedsted et al.[26] 1997 | NR | Prescribed daily doses per 1000 insured; total drug reimbursement per 1000 insured; reimbursement per daily dose | Reported graphically only | Reported graphically only | No difference | Reported graphically only | Reported graphically only | No difference |
| Horrow et al.[28] 1994 | NR | Anesthetic drugs used per week; anesthetic drug cost per week | $3837/week | $3179/week | 17.1% drug costs/week (P = 0.04) | 97 drugs/week | 94 drugs/week | 3.1% drugs/week (P = 0.56) |
| Tierney et al.[29] 1993 | 5219 admissions | Total charges per admission | $6964/admission | $6077/admission | 12.7% total charges/admission (P = 0.02) | NR | NR | NA |
| Tierney et al.[30] 1990 | 15,257 outpatient visits | Test orders per outpatient visit; test charges per outpatient visit | $51.81/visit | $45.13/visit | 12.9% test charges/visit (P < 0.05) | 1.82 tests/visit | 1.56 tests/visit | 14.3% tests/visit (P < 0.005) |
| Everett et al.[31] 1983 | NR | Lab tests per admission; charges per admission | NR | NR | NA | NR | NR | No statistically significant changes |
Eight studies reported the numeric impact of price display on aggregate order volume. Three of these demonstrated a statistically significant decrease in order volume, with effect sizes ranging from 14.2% to 25.5%.[14, 16, 30] Decreases were found for lab and imaging tests, and were observed in both inpatient and outpatient settings. For example, 1 pre‐post study displaying prices for inpatient send‐out lab tests demonstrated a 25.5% reduction in send‐out labs per 1000 patient‐days (P < 0.001), whereas there was no change for the control group in‐house lab tests, for which prices were not shown.[14] The other 5 studies reported no significant association between price display and order volume, with effect sizes ranging from a decrease of 18.4% to an increase of 5.8%.[17, 20, 22, 27, 28] These studies evaluated lab, imaging, and medication volume. One trial randomizing by individual inpatient showed a nonsignificant decrease of 4.5% in lab orders per admission in the intervention group (P = 0.74), although the authors noted that their study had insufficient power to detect differences less than 10%.[27] Of note, 2 of the 5 studies reporting nonsignificant impacts on order volume (3.1%, P = 0.56; and 18.4%, P = 0.12) did demonstrate significant decreases in order costs (17.1%, P = 0.04; and 22.0%, P < 0.05).[20, 28]
There were an additional 2 studies that reported the impact of price display on order volume for individual orders only. In 1 time‐series study showing lab test prices, there was a statistically significant decrease in order volume for 5 of 27 individual tests studied (using a Bonferroni‐adjusted threshold of significance), with no tests showing a significant increase.[15] In 1 pre‐post study showing prices for H2‐antagonist drugs, there was a statistically significant 57.1% decrease in order volume for the high‐cost medication, with a corresponding 58.7% increase in the low‐cost option.[21] These studies did not report impact on aggregate order costs. Two further studies in this review did not report outcomes numerically, but did state in their articles that significant impacts on order volume were not observed.[26, 31]
Therefore, of the 19 studies included in this review, 17 reported numeric results. Of these 17 studies, 12 showed that price display was associated with statistically significant decreases in either order costs or volume, either in aggregate (10 studies; Figure 1) or for individual orders (2 studies). Of the 7 studies conducted within the past decade, 5 noted significant decreases in order costs or volume. Prices were embedded into an EHR in 5 of these recent studies, and 4 of the 5 observed significant decreases in order costs or volume. Only 2 studies from the past decade1 from Belgium and 1 from the United Statesincorporated prices into an EHR and reported aggregate order costs. Both found statistically significant decreases in order costs with price display.[13, 16]
Patient Safety and Provider Acceptability
Five studies reported patient‐safety outcomes. One inpatient randomized trial showed similar rates of postdischarge utilization and charges between the intervention and control groups.[29] An outpatient randomized trial showed similar rates of hospital admissions, ED visits, and outpatient visits between the intervention and control groups.[30] Two pre‐post studies showing anesthesia prices in hospital operating rooms included a quality assurance review and showed no changes in adverse outcomes such as prolonged postoperative intubation, recovery room stay, or unplanned intensive care unit admissions.[24, 25] The only adverse safety finding was in a pre‐post study in a pediatric ED, which showed a higher rate of unscheduled follow‐up care during the intervention period compared to the control period (24.4% vs 17.8%, P < 0.01) but similar rates of patients feeling better (83.4% vs 86.7%, P = 0.05). These findings, however, were based on self‐report during telephone follow‐up with a 47% response rate.[23]
Five studies reported on provider acceptability of price display. Two conducted questionnaires as part of the study plan, whereas the other 3 offered general provider feedback. One questionnaire revealed that 83% of practices were satisfied or very satisfied with the price display.[26] The other questionnaire found that 81% of physicians felt the price display improved my knowledge of the relative costs of tests I order and similarly 81% would like additional cost information displayed for other orders.[15] Three studies reported subjectively that showing prices initially caused questions from most physicians,[13] but that ultimately, physicians like seeing this information[27] and gave feedback that was generally positive.[21] One study evaluated the impact of price display on provider cost knowledge. Providers in the intervention group did not improve in their cost‐awareness, with average errors in cost estimates exceeding 40% even after 6 months of price display.[30]
Study Quality
Using a modified Downs and Black checklist of 21 items, studies in this review ranged in scores from 5 to 20, with a median score of 15. Studies most frequently lost points for being nonrandomized, failing to describe or adjust for potential confounders, being prone to historical confounding, or not evaluating potential adverse events.
We supplemented this modified Downs and Black checklist by reviewing 3 categories of study limitations not well‐reflected in the checklist scoring (Table 3). The first was potential for contamination between study groups, which was a concern in 4 studies. For example, 1 pre‐post study assessing medication ordering included clinical pharmacists in patient encounters both before and after the price display intervention.[22] This may have enhanced cost‐awareness even before prices were shown. The second set of limitations, present in 12 studies, included confounders that were not addressed by study design or analysis. For example, the intervention in 1 study displayed not just test cost but also test turnaround time, which may have separately influenced providers against ordering a particular test.[14] The third set of limitations included unanticipated gaps in the display of prices or in the collection of ordering data, which occurred in 5 studies. If studies did not report on gaps in the intervention or data collection, we assumed there were none.
| Study | Modified Downs & Black Score (Max Score 21) | Other Price Display Quality Criteria (Not Included in Downs & Black Score) | ||
|---|---|---|---|---|
| Potential for Contamination Between Study Groups | Potential Confounders of Results Not Addressed by Study Design or Analysis | Incomplete Price Display Intervention or Data Collection | ||
| ||||
| Fang et al.[14] 2014 | 14 | None | Concurrent display of test turnaround time may have independently contributed to decreased test ordering | 21% of reference lab orders were excluded from analysis because no price or turnaround‐time data were available |
| Nougon et al.[13] 2015 | 16 | None | Historical confounding may have existed due to pre‐post study design without control group | None |
| Durand et al.[17] 2013 | 17 | Providers seeing test prices for intervention tests (including lab tests in concurrent Feldman study) may have remained cost‐conscious when placing orders for control tests | Interference between units likely occurred because intervention test ordering (eg, chest x‐ray) was not independent of control test ordering (eg, CT chest) | None |
| Feldman et al.[16] 2013 | 18 | Providers seeing test prices for intervention tests (including imaging tests in concurrent Durand study) may have remained cost‐conscious when placing orders for control tests | Interference between units likely occurred because intervention test ordering (eg, CMP) was not independent of control test ordering (eg, BMP) | None |
| Horn et al.[15] 2014 | 15 | None | None | None |
| Ellemdin et al.[18] 2011 | 15 | None | None | None |
| Schilling[19] 2010 | 12 | None | None | None |
| Guterman et al.[21] 2002 | 14 | None | Historical confounding may have existed due to pre‐post study design without control group | None |
| Seguin et al.[20] 2002 | 17 | None | Because primary outcome was not adjusted for length of stay, the 30% shorter average length of stay during intervention period may have contributed to decreased costs per admission; historical confounding may have existed due to pre‐post study design without control group | None |
| Hampers et al.[23] 1999 | 17 | None | Requirement that physicians calculate total charges for each visit may have independently contributed to decreased test ordering; historical confounding may have existed due to pre‐post study design without control group | 10% of eligible patient visits were excluded from analysis because prices were not displayed or ordering data were not collected |
| Ornstein et al.[22] 1999 | 15 | Clinical pharmacists and pharmacy students involved in half of all patient contacts may have enhanced cost‐awareness during control period | Emergence of new drugs during intervention period and an ongoing quality improvement activity to increase prescribing of lipid‐lowering medications may have contributed to increased medication costs; historical confounding may have existed due to pre‐post study design without control group | 25% of prescription orders had no price displayed, and average prices were imputed for purposes of analysis |
| Lin et al.[25] 1998 | 12 | None | Emergence of new drug during intervention period and changes in several drug prices may have contributed to decreased order costs; historical confounding may have existed due to pre‐post study design without control group | None |
| McNitt et al.[24] 1998 | 15 | None | Intensive drug‐utilization review and cost‐reduction efforts may have independently contributed to decreased drug costs; historical confounding may have existed due to pre‐post study design without control group | None |
| Bates et al.[27] 1997 | 18 | Providers seeing test prices on intervention patients may have remembered prices or remained cost‐conscious when placing orders for control patients | None | 47% of lab tests and 26% of imaging tests were ordered manually outside of the trial's CPOE display system* |
| Vedsted et al.[26] 1997 | 5 | None | Medication price comparison module may have independently influenced physician ordering | None |
| Horrow et al.[28] 1994 | 14 | None | Historical confounding may have existed due to pre‐post study design without control group | Ordering data for 2 medications during 2 of 24 weeks were excluded from analysis due to internal inconsistency in the data |
| Tierney et al.[29] 1993 | 20 | None | Introduction of computerized order entry and menus for cost‐effective ordering may have independently contributed to decreased test ordering | None |
| Tierney et al.[30] 1990 | 20 | None | None | None |
| Everett et al.[31] 1983 | 7 | None | None | None |
Even among the 5 randomized trials there were substantial limitations. For example, 2 trials used individual tests as the unit of randomization, although ordering patterns for these tests are not independent of each other (eg, ordering rates for comprehensive metabolic panels are not independent of ordering rates for basic metabolic panels).[16, 17] This creates interference between units that was not accounted for in the analysis.[32] A third trial was randomized at the level of the patient, so was subject to contamination as providers seeing the price display for intervention group patients may have remained cost‐conscious while placing orders for control group patients.[27] In a fourth trial, the measured impact of the price display may have been confounded by other aspects of the overall cost intervention, which included cost‐effective test menus and suggestions for reasonable testing intervals.[29]
The highest‐quality study was a cluster‐randomized trial published in 1990 specifically measuring the effect of price display on a wide range of orders.[30] Providers and patients were separated by clinic session so as to avoid contamination between groups, and the trial included more than 15,000 outpatient visits. The intervention group providers ordered 14.3% fewer tests than control group providers, which resulted in 12.9% lower charges.
DISCUSSION
We identified 19 published reports of interventions that displayed real‐time order prices to providers and evaluated the impact on provider ordering. There was substantial heterogeneity in study setting, design, and quality. Although there is insufficient evidence on which to base strong conclusions, these studies collectively suggest that provider price display likely reduces order costs to a modest degree. Data on patient safety were largely lacking, although in the few studies that examined patient outcomes, there was little evidence that patient safety was adversely affected by the intervention. Providers widely viewed display of prices positively.
Our findings align with those of a recent systematic review that concluded that real‐time price information changed provider ordering in the majority of studies.[7] Whereas that review evaluated 17 studies from both clinical settings and simulations, our review focused exclusively on studies conducted in actual ordering environments. Additionally, our literature search yielded 8 studies not previously reviewed. We believe that the alignment of our findings with the prior review, despite the differences in studies included, adds validity to the conclusion that price display likely has a modest impact on reducing order costs. Our review contains several additions important for those considering price display interventions. We provide detailed information on study settings and intervention characteristics. We present a formal assessment of study quality to evaluate the strength of individual study findings and to guide future research in this area. Finally, because both patient safety and provider acceptability may be a concern when prices are shown, we describe all safety outcomes and provider feedback that these studies reported.
The largest effect sizes were noted in 5 studies reporting decreases in order volume or costs greater than 25%.[13, 14, 18, 23, 24] These were all pre‐post intervention studies, so the effect sizes may have been exaggerated by historical confounding. However, the 2 studies with concurrent control groups found no decreases in order volume or cost in the control group.[14, 18] Among the 5 studies that did not find a significant association between price display and provider ordering, 3 were subject to contamination between study groups,[17, 22, 27] 1 was underpowered,[19] and 1 noted a substantial effect size but did not perform a statistical analysis.[25] We also found that order costs were more frequently reduced than order volume, likely because shifts in ordering to less expensive alternatives may cause costs to decrease while volume remains unchanged.[20, 28]
If price display reduces order costs, as the majority of studies in this review indicate, this finding carries broad implications. Policy makers could promote cost‐conscious care by creating incentives for widespread adoption of price display. Hospital and health system leaders could improve transparency and reduce expenses by prioritizing price display. The specific beneficiaries of any reduced spending would depend on payment structures. With shifts toward financial risk‐bearing arrangements like accountable care organizations, healthcare institutions may have a financial interest in adopting price display. Because price display is an administrative intervention that can be developed within EHRs, it is potentially 1 of the most rapidly scalable strategies for reducing healthcare spending. Even modest reductions in spending on laboratory tests, imaging studies, and medications would result in substantial savings on a system‐wide basis.
Implementing price display does not come without challenges. Prices need to be calculated or obtained, loaded into an EHR system, and updated periodically. Technology innovators could enhance EHR software by making these processes easier. Healthcare institutions may find displaying relative prices (eg, $/$$/$$$) logistically simpler in some contexts than showing actual prices (eg, purchase cost), such as when contracts require prices to be confidential. Although we decided to exclude studies displaying relative prices, our search identified no studies that met other inclusion criteria but displayed relative prices, suggesting a lack of evidence regarding the impact of relative price display as an alternative to actual price display.
There are 4 key limitations to our review. First, the heterogeneity of the study designs and reported outcomes precluded pooling of data. The variety of clinical settings and mechanisms through which prices were displayed enhances the generalizability of our findings, but makes it difficult to identify particular contexts (eg, type of price or type of order) in which the intervention may be most effective. Second, although the presence of negative studies on this subject reduces the concern for reporting bias, it remains possible that sites willing to implement and study price displays may be inherently more sensitive to prices, such that published results might be more pronounced than if the intervention were widely implemented across multiple sites. Third, the mixed study quality limits the strength of conclusions that can be drawn. Several studies with both positive and negative findings had issues of bias, contamination, or confounding that make it difficult to be confident of the direction or magnitude of the main findings. Studies evaluating price display are challenging to conduct without these limitations, and that was apparent in our review. Finally, because over half of the studies were conducted over 15 years ago, it may limit their generalizability to modern ordering environments.
We believe there remains a need for high‐quality evidence on this subject within a contemporary context to confirm these findings. The optimal methodology for evaluating this intervention is a cluster randomized trial by facility or provider group, similar to that reported by Tierney et al. in 1990, with a primary outcome of aggregate order costs.[30] Given the substantial investment this would require, a large time series study could also be informative. As most prior price display interventions have been under 6 months in duration, it would be useful to know if the impact on order costs is sustained over a longer time period. The concurrent introduction of any EHR alerts that could impact ordering (eg, duplicate test warnings) should be simultaneously measured and reported. Studies also need to determine the impact of price display alone compared to price comparison displays (displaying prices for the selected order along with reasonable alternatives). Although price comparison was a component of the intervention in some of the studies in this review, it was not evaluated relative to price display alone. Furthermore, it would be helpful to know if the type of price displayed affects its impact. For instance, if providers are most sensitive to the absolute magnitude of prices, then displaying chargemaster prices may impact ordering more than showing hospital costs. If, however, relative prices are all that providers need, then showing lower numbers, such as Medicare prices or hospital costs, may be sufficient. Finally, it would be reassuring to have additional evidence that price display does not adversely impact patient outcomes.
Although some details need elucidation, the studies synthesized in this review provide valuable data in the current climate of increased emphasis on price transparency. Although substantial attention has been devoted by the academic community, technology start‐ups, private insurers, and even state legislatures to improving price transparency to patients, less focus has been given to physicians, for whom healthcare prices are often just as opaque.[4] The findings from this review suggest that provider price display may be an effective, safe, and acceptable approach to empower physicians to control healthcare spending.
Disclosures: Dr. Silvestri, Dr. Bongiovanni, and Ms. Glover have nothing to disclose. Dr. Gross reports grants from Johnson & Johnson, Medtronic Inc., and 21st Century Oncology during the conduct of this study. In addition, he received payment from Fair Health Inc. and ASTRO outside the submitted work.
- Institute of Medicine. Best Care at Lower Cost: The Path to Continuously Learning Health Care in America: Washington, DC: National Academies Press; 2012.
- . Do physicians need a “shopping cart” for health care services? JAMA. 2012;307(8):791–792.
- . The disruptive innovation of price transparency in health care. JAMA. 2013;310(18):1927–1928.
- , . Providing price displays for physicians: which price is right? JAMA. 2014;312(16):1631–1632.
- , . Physician awareness of diagnostic and nondrug therapeutic costs: a systematic review. Int J Tech Assess Health Care. 2008;24(2):158–165.
- , , . Physician awareness of drug cost: a systematic review. PLoS Med. 2007;4(9):e283.
- , , , . The effect of charge display on cost of care and physician practice behaviors: a systematic review. J Gen Intern Med. 2015;30:835–842.
- , , . Engaging medical librarians to improve the quality of review articles. JAMA. 2014;312(10):999–1000.
- , , . Influencing behavior of physicians ordering laboratory tests: a literature study. Med Care. 1993;31(9):784–794.
- , . Trials of providing costing information to general practitioners: a systematic review. Med J Aust. 1997;167(2):89–92.
- . A review of physician cost‐containment strategies for laboratory testing. Med Care. 1983;21(8):783–802.
- , . The feasibility of creating a checklist for the assessment of the methodological quality both of randomised and non‐randomised studies of health care interventions. J Epidemiol Community Health. 1998;52(6):377–384.
- , , , et al. Does offering pricing information to resident physicians in the emergency department potentially reduce laboratory and radiology costs? Eur J Emerg Med. 2015;22:247–252.
- , , , et al. Cost and turn‐around time display decreases inpatient ordering of reference laboratory tests: a time series. BMJ Qual Saf. 2014;23:994–1000.
- , , , , . The impact of cost displays on primary care physician laboratory test ordering. J Gen Intern Med. 2014;29:708–714.
- , , , et al. Impact of providing fee data on laboratory test ordering: a controlled clinical trial. JAMA Intern Med. 2013;173(10):903–908.
- , , , . Provider cost transparency alone has no impact on inpatient imaging utilization. J Am Coll Radiol. 2013;10(2):108–113.
- , , . Providing clinicians with information on laboratory test costs leads to reduction in hospital expenditure. S Afr Med J. 2011;101(10):746–748.
- . Cutting costs: the impact of price lists on the cost development at the emergency department. Eur J Emerg Med. 2010;17(6):337–339.
- , , , , . Effects of price information on test ordering in an intensive care unit. Intens Care Med. 2002;28(3):332–335.
- , , , , , . Modifying provider behavior: a low‐tech approach to pharmaceutical ordering. J Gen Intern Med. 2002;17(10):792–796.
- , , , , . Medication cost information in a computer‐based patient record system. Impact on prescribing in a family medicine clinical practice. Arch Fam Med. 1999;8(2):118–121.
- , , , , . The effect of price information on test‐ordering behavior and patient outcomes in a pediatric emergency department. Pediatrics. 1999;103(4 pt 2):877–882.
- , , . Long‐term pharmaceutical cost reduction using a data management system. Anesth Analg. 1998;87(4):837–842.
- , . The impact of price labeling of muscle relaxants on cost consciousness among anesthesiologists. J Clin Anesth. 1998;10(5):401–403.
- , , . Does a computerized price comparison module reduce prescribing costs in general practice? Fam Pract. 1997;14(3):199–203.
- , , , et al. Does the computerized display of charges affect inpatient ancillary test utilization? Arch Intern Med. 1997;157(21):2501–2508.
- , . Price stickers do not alter drug usage. Can J Anaesth. 1994;41(11):1047–1052.
- , , , . Physician inpatient order writing on microcomputer workstations. Effects on resource utilization. JAMA. 1993;269(3):379–383.
- , , . The effect on test ordering of informing physicians of the charges for outpatient diagnostic tests. N Engl J Med. 1990;322(21):1499–1504.
- , , , . Effect of cost education, cost audits, and faculty chart review on the use of laboratory services. Arch Intern Med. 1983;143(5):942–944.
- . Interference between units in randomized experiments. J Am Stat Assoc. 2007;102(477):191–200.
