User login
EHR Use as a Measure of Care Intensity
Hospitals provide acute inpatient care all day and every day. Nonetheless, a number of studies have shown that weekend care may have lower quality than care delivered on weekdays. [1, 2, 3, 4, 5, 6, 7] Weekend care has been associated with increased mortality among patients suffering from a number of conditions [4, 5, 6, 7, 8, 9, 10] and in a number of clinical settings. [11, 12, 13, 14] Findings of poor outcomes on weekends are not universal, though exceptions occur typically in settings where services and clinical staffing are fairly constant throughout the week, such as intensive care units with on‐site intensivists. [15, 16, 17]
These differences in quality and outcomes suggest that there is a difference in intensity of care over the course of the week. Initiatives to address this important safety issue would be strengthened if a shared metric existed to describe the intensity of care provided at a given time of day or day of the week. However, few measures of global hospital intensity of care exist. The metrics that have been developed are limited by measuring only 1 aspect of care delivery, such as weekend nurse staffing, [18] by requiring extensive chart abstraction, [19] or through reliance on hospital expenses in an older payment model. [20] These measures notably predate contemporary hospital care delivery, which is increasingly dependent on the electronic health record (EHR). To our knowledge, no prior measure of hospital care intensity has been described using the EHR.
Recently, our medical center began an initiative to increase weekend services and staffing to create more uniform availability of care throughout the week. The purpose of this study was to develop a global measure of intensity of care using data derived from the EHR as part of the evaluation of this initiative. [21]
METHODS
We conducted a retrospective analysis of EHR activity for hospital inpatients between January 1, 2011 and December 31, 2011 at New York University Langone Medical Center (NYULMC). During that time period, nearly all inpatient clinical activities at NYULMC were performed and documented through the EHR, Sunrise Clinical Manager (Allscripts, Chicago, IL). These activities include clinical documentation, orders, medication administration, and results of diagnostic tests. Access to the EHR is through Citrix Xenapp Servers (Citrix Systems, Santa Clara, CA), which securely deliver applications from central servers to providers' local terminals.
The primary measure of EHR activity, which we refer to as EHR interactions, was defined as the accessing of a patient's electronic record by a clinician. A provider initiates an interaction by opening a patient's electronic record and concludes it by either opening the record of a different patient or logging out of the EHR. An EHR interaction thus captures a unit of direct patient care, such as documenting a clinical encounter, recording medication administration, or reviewing patient data. Most EHR systems routinely log such interactions to enable compliance departments to audit which users have accessed a patient chart.
The secondary measure of EHR activity was percent central processing unit (CPU), which represents the percent of total available server processing power being used by the Citrix servers at a given time. CPU utilization was averaged over an hour to determine the mean percentage of use for any given hour. As CPU data are not retained for more than 30 days at our institution, we examined CPU usage for the period July 1, 2012 to August 31, 2012.
We evaluated subgroups of EHR interactions by provider type: nurses, resident physicians, attending physicians, pharmacy staff, and all others. We also examined EHR interactions for 2 subgroups of patients: those admitted to the medicine service from the emergency room (ER) and those electively admitted to the surgical service. An elective hospitalization was defined as 1 in which the patient was neither admitted from the ER nor transferred from another hospital. These 2 subgroups were further refined to evaluate EHR interactions among groups of patients admitted during the day, night, weekday, and weeknight. Finally, we examined specific EHR orders that we considered reflective of advancing or altering care, including orders to increase the level of mobilization, to insert or remove a urinary catheter, or to initiate or discontinue antibiotics. As antibiotics are frequently initiated on the day of admission and stopped on the day of discharge, we excluded antibiotic orders that occurred on days of admission or discharge.
Statistical Analysis
EHR interactions were presented as hourly rates by dividing the number of patient chart accessions by the inpatient census for each hour. Hourly census was determined by summing the number of patients who were admitted prior to and discharged after the hour of interest. We calculated the arithmetic means of EHR interactions for each hour and day of the week in 2011. Analysis of variance was used to test differences in EHR interactions among days of the week, and t tests were used to test differences in EHR interactions between Saturday and Sunday, Tuesday and Wednesday, and weekend and weekdays. As a result of multiple comparisons in these analyses, we applied a Bonferroni correction.
EHR interaction rates were assigned to 1 of 3 periods based on a priori suspected peak and trough intensity: day (9:00 am to 4:59 pm ), morning/evening (7:00 am to 8:59 am and 5:00 pm to 7:59 pm ), and night (8:00 pm to 6:59 am ). Negative binomial regression models were used to determine the relative rate of weekday to weekend EHR interactions per patient for the 3 daily time periods. Similar models were developed for EHR interactions by provider types and for specific orders.
We calculated the correlation coefficient between total EHR interactions and occurrence of specific orders, EHR interactions by provider type, EHR interactions by patient subgroups, and CPU. A sensitivity analysis was performed in which EHR interactions were calculated as the number of patient chart accessions per number of daily discharges; this analysis considered the fact that discharges were likely to have high associated intensity but may be less common on weekends as compared to weekdays.
All analyses were performed using Stata 12 (StataCorp, College Station, TX). This study was approved by the institutional review board at NYU School of Medicine.
RESULTS
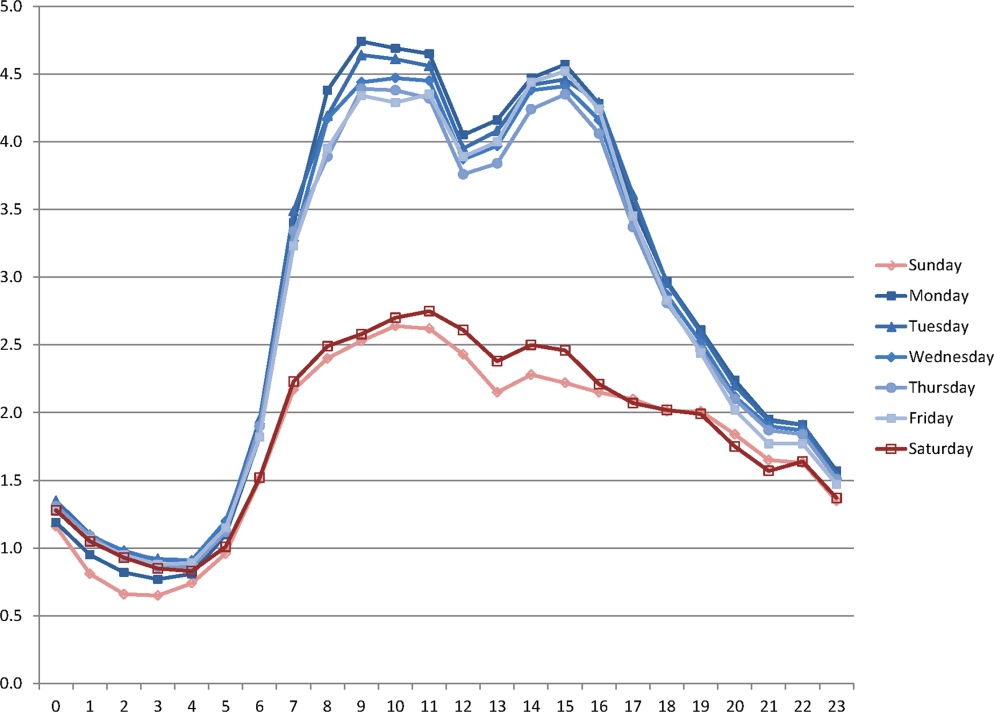
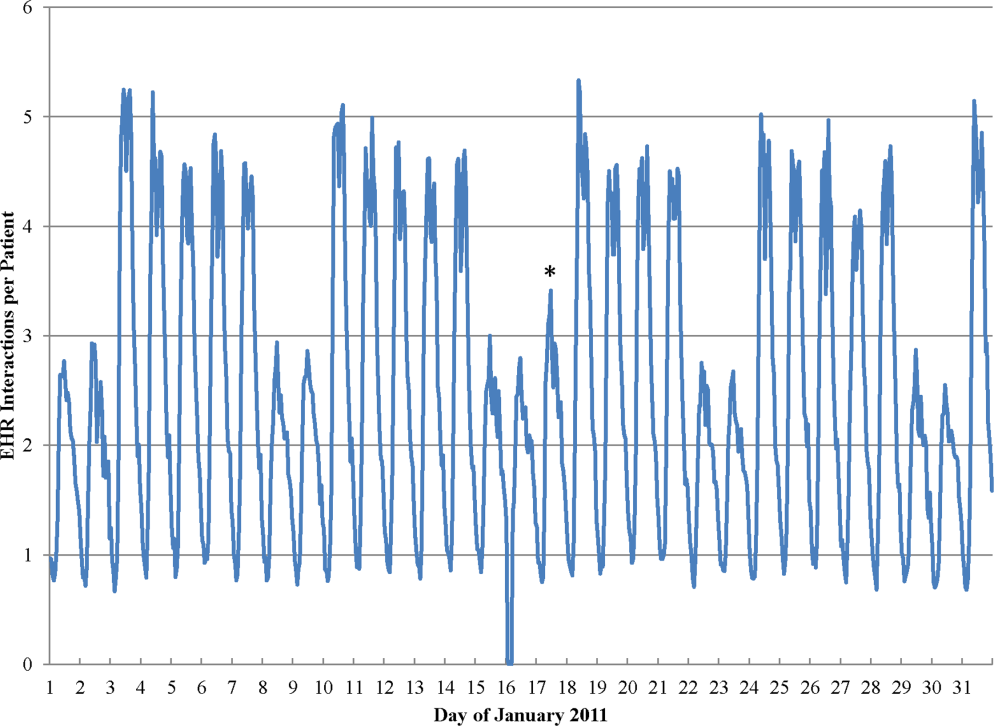
During the study period, the mean (standard deviation) number of EHR interactions per patient per hour was 2.49 (1.30). EHR interactions differed by hour and day of the week; the lowest number occurred in early morning on weekends, and the highest occurred around 11:00 am on weekdays (Figure 1 ). EHR interactions differed among days of the week at all times ( P <0.001), whereas EHR interactions were similar on most hours of Saturday and Sunday as well as Tuesday and Wednesday. At every hour, weekends had a lower number of EHR interactions in comparison to weekdays ( P <0.001). Weekdays showed a substantial increase in the number of EHR interactions between 8:00 am and 12:00 pm , followed by a slight decrease in activity between 12:00 pm and 2:00 pm , and another increase in activity from 2:00 pm to 5:00 pm (Figure 1 ). Weekend days demonstrated marked blunting of this midday peak in intensity. The tracking of an entire month of hospital EHR interactions produced a detailed graphic picture of hospital activity, clearly demarcating rounding hours, lunch hours, weekend days, hospital holidays, and other landmarks (Figure 2 ). The relative rates of census‐adjusted EHR interactions on weekdays versus weekends were 1.76 (95% confidence interval [CI]: 1.74‐1.77) for day, 1.52 (95% CI: 1.50‐1.55) for morning/evening, and 1.14 (95% CI: 1.12‐1.17) for night hours.
Nurses performed the largest number of EHR interactions (39.7%), followed by resident physicians (15.2%), attending physicians (10.2%), and pharmacists (7.6%). The remainder of EHR interactions were performed by other providers (27.4%), whose role in the majority of cases was undefined in the EHR (see Supporting Table 1 in the online version of this article). Daily variation in EHR interactions differed by provider type (Table 1 ). Nurses and resident physicians showed smaller differences in their EHR interactions between weekend and weekdays and among times of day when compared to attending physicians, pharmacy staff, and other staff. EHR interactions showed similar variations to the overall cohort for both medicine patients admitted from the ER and elective surgery patients (Table 1 ). Specific clinical orders designed to sample particularly meaningful interactions, including urinary catheter insertion and removal, patient mobilization orders, and new antibiotic orders, were moderately correlated with total EHR interactions (Table 2 ). In a sensitivity analysis, the comparison of weekday to weekend EHR interactions per daily discharge was similar to the primary analysis, with relative rates of 1.75 (95% CI: 1.73‐1.77), 1.54 (95% CI: 1.50‐1.57), and 1.15 (95% CI: 1.11‐1.18) for day, morning/evening, and night hours, respectively.
| Hour Group a | |||||||
|---|---|---|---|---|---|---|---|
| Daytime Hours | Morning/Evening Hours | Nighttime Hours | Correlation Coefficient to | ||||
| Rate Ratio | 95% CI | Rate Ratio | 95% CI | Rate Ratio | 95% CI | EHR Interactions | |
| |||||||
| All EHR interactions | 1.76 | 1.74‐1.77 | 1.52 | 1.50‐1.55 | 1.14 | 1.12‐1.17 | 1.00 |
| By provider subgroup | |||||||
| Nurses | 1.35 | 1.34‐1.37 | 1.21 | 1.20‐1.22 | 1.10 | 1.08‐1.12 | 0.92 |
| Residents | 1.38 | 1.36‐1.40 | 1.46 | 1.43‐1.49 | 1.14 | 1.11‐1.18 | 0.90 |
| Attending physicians | 1.70 | 1.67‐1.73 | 2.04 | 1.97‐2.10 | 1.32 | 1.26‐1.39 | 0.96 |
| Pharmacy staff | 1.64 | 1.61‐1.67 | 1.68 | 1.61‐1.75 | 1.19 | 1.15‐1.23 | 0.90 |
| All others | 2.75 | 2.70‐2.79 | 2.08 | 2.002.17 | 1.20 | 1.15‐1.25 | 0.97 |
| By admission subgroup | |||||||
| Medicine ER admissions | |||||||
| All | 1.64 | 1.62‐1.67 | 1.41 | 1.38‐1.44 | 1.07 | 1.04‐1.09 | 0.92 |
| Day admissions | 1.64 | 1.62‐1.67 | 1.41 | 1.38‐1.44 | 1.08 | 1.05‐1.11 | 0.92 |
| Night admissions | 1.65 | 1.62‐1.68 | 1.41 | 1.37‐1.45 | 1.03 | 1.001.05 | 0.88 |
| Weekday admissions | 1.76 | 1.73‐1.79 | 1.56 | 1.52‐1.59 | 1.28 | 1.23‐1.30 | 0.93 |
| Weekend admissions | 1.40 | 1.38‐1.42 | 1.14 | 1.11‐1.17 | 0.70 | 0.68‐0.72 | 0.88 |
| Surgery elective admissions | |||||||
| All | 1.63 | 1.61‐1.65 | 1.53 | 1.50‐1.56 | 1.25 | 1.21‐1.28 | 0.97 |
| Day admissions | 1.62 | 1.60‐1.64 | 1.54 | 1.51‐1.57 | 1.26 | 1.23‐1.30 | 0.96 |
| Night admissions | 1.65 | 1.62‐1.67 | 1.50 | 1.46‐1.54 | 1.22 | 1.18‐1.25 | 0.94 |
| Weekday admissions | 1.64 | 1.62‐1.66 | 1.55 | 1.52‐1.59 | 1.27 | 1.24‐1.31 | 0.96 |
| Weekend admissions | 1.60 | 1.56‐1.65 | 1.26 | 1.21‐1.31 | 0.89 | 0.85‐0.93 | 0.73 |
| Hour Group a | |||||||
|---|---|---|---|---|---|---|---|
| Daytime Hours | Morning/Evening Hours | Nighttime Hours | Correlation Coefficient to | ||||
| Rate Ratio | 95% CI | Rate Ratio | 95% CI | Rate Ratio | 95% CI | EHR Interactions | |
| |||||||
| Urinary catheter | 2.81 | 2.61‐3.02 | 3.17 | 2.85‐3.54 | 1.42 | 1.27‐1.58 | 0.66 |
| Mobilization | 2.51 | 2.39‐2.63 | 2.91 | 2.71‐3.12 | 1.42 | 1.34‐1.52 | 0.70 |
| Antibiotic initiation b | 1.33 | 1.24‐1.42 | 1.65 | 1.47‐1.85 | 1.13 | 1.01‐1.25 | 0.41 |
| Antibiotic discontinue c | 1.74 | 1.63‐1.85 | 1.68 | 1.50‐1.87 | 1.28 | 1.13‐1.45 | 0.61 |
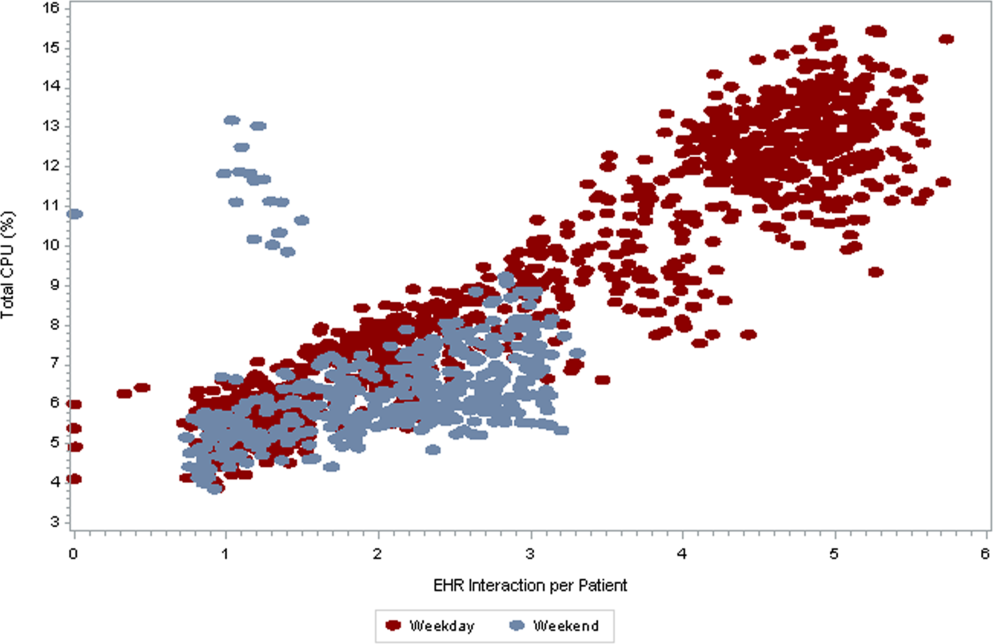
As seen in Figure 3 , CPU usage was well correlated with EHR interactions ( r =0.90) and both metrics were lower on weekends as compared to weekdays. A few outliers of increased CPU usage on weekends were observed; these outliers all occurred on Sundays from 12:00 am to 2:00 am . The information technology (IT) department at our institution confirmed that these outliers coincided with a weekly virus scan performed at that time.
am
and 1:00
am
, which were determined to be outliers related to a weekly virus scan. The correlation coefficient is 0.90.
DISCUSSION
EHR interactions represents a new and accessible measure of hospital care intensity that may be used to track temporal variations in care that are likely to exist in all hospital systems. As the number of hospitals that process and document all clinical activities through the EHR continues to increase, [22, 23] such a measure has the potential to serve as a useful metric in efforts to raise nighttime and weekend care to the same quality as that during weekdays.
We found that EHR interactions differed markedly between days and nights and between weekdays and weekends. A number of prior studies have found temporal variations in clinical outcomes and care. [1, 2, 3, 4, 5, 6, 7, 8, 9, 10, 11, 12, 13, 14] Our study adds to this literature by defining a new measure of the overall intensity of the process of inpatient care. Using this measure, we demonstrate that the increase in midday clinical activity seen during the week is substantially blunted on weekends. This finding adds validity to the designation of both nights and weekends as off hours when examining temporal variations in clinical care. [2, 7]
Other subtle patterns of care delivery emerged throughout the day. For instance, we found a decrease in EHR interactions between 12:00 pm and 2:00 pm , likely representing a small lull in clinical activity during the lunchtime hour, whereas EHR interactions were higher in the night and evening hours than in the early morning. The clinical significance of such fluctuations remains undetermined.
Variation throughout the week differed by provider type. Nurses and resident physicians, who are scheduled around the clock, demonstrated the least fluctuation in EHR interaction intensity over time. Attending physicians and other staff showed the greatest variation in weekday versus weekend care.
We defined a second measure of care intensity based on EHR utilization, which we named CPU usage. The advantage of using CPU as a metric is that it easy to measure and track as it is routinely monitored by hospital IT departments as part of regular maintenance. CPU usage can therefore be easily implemented in any institution with an EHR, whereas measuring EHR interactions requires EHR data abstraction and manipulation. The disadvantage of CPU usage as a measure is that it includes nonclinical reporting and other functions and therefore represents a less specific measure of clinical activity. Nonetheless, at our institution, nearly all clinical activities are processed or documented through the EHR, which is maintained on central servers, and CPU usage was well correlated with EHR interactions. We therefore believe that CPU usage represents a useful indicator of hospital clinical activity at a given time.
Several limitations deserve mention. First, EHR interactions may not always reflect actual patient care or clinical documentation. Nonetheless, we also examined specific patient orders and found that variations in these process measures were similar to those in the EHR interaction measure. Second, our methods were developed and evaluated at a single institution and may not be generalizable. Third, increased intensity of care does not necessarily increase quality of care. For instance, laboratory tests are commonly obtained on a daily basis in the hospital, a practice that is costly and often unnecessary. [24] Weekends have been associated with fewer laboratory tests, which may be appropriate as compared to the more frequent testing observed on weekdays. [25] Finally, we do not ascertain whether variations in EHR interactions correlate with clinical outcomes, and believe this to be an area for further research.
In conclusion, EHR interactions represent a new global process measure of care intensity, which was demonstrated to vary over the course of a week. We intend to use this measure at our institution to track progress of an initiative to ensure a high standard of care throughout the course of the week. The extent to which temporal variations in EHR interactions or reductions in these variations are correlated with clinical outcomes deserves further study. We believe this measure, which can be adapted to other institutions, may have a valuable role to play in hospitals' efforts to eliminate excess morbidity and mortality associated with care delivered during nights and weekends.
- , , , et al. Impact of weekend admissions on quality of care and outcomes in patients with acute myeloid leukemia . Cancer. 2010 ; 116 : 3614 – 3620 .
- , , , et al. Impact of time of presentation on the care and outcomes of acute myocardial infarction . Circulation. 2008 ; 117 : 2502 – 2509 .
- , , , et al. Weekend hospital admission and discharge for heart failure: association with quality of care and clinical outcomes . Am Heart J. 2009 ; 158 : 451 – 458 .
- , , , . Hospital care for patients experiencing weekend vs weekday stroke: a comparison of quality and aggressiveness of care . Arch Neurol. 2010 ; 67 : 39 – 44 .
- , , , , , . Weekend versus weekday admission and mortality from myocardial infarction . N Engl J Med. 2007 ; 356 : 1099 – 1109 .
- . Do hospitals provide lower quality care on weekends? Health Serv Res. 2007 ; 42 : 1589 – 1612 .
- , , , et al. Relationship between time of day, day of week, timeliness of reperfusion, and in‐hospital mortality for patients with acute ST‐segment elevation myocardial infarction . JAMA. 2005 ; 294 : 803 – 812 .
- , , , , , . Weekend versus weekday admission and mortality after acute pulmonary embolism . Circulation. 2009 ; 119 : 962 – 968 .
- , , , , , . Influence of weekend hospital admission on short‐term mortality after intracerebral hemorrhage . Stroke. 2009 ; 40 : 2387 – 2392 .
- , , , et al. Weekend hospital admission, acute kidney injury, and mortality . J Am Soc Nephrol. 2010 ; 21 : 845 – 851 .
- , . Mortality among patients admitted to hospitals on weekends as compared with weekdays . N Engl J Med. 2001 ; 345 : 663 – 668 .
- , , , et al. Mortality after noncardiac surgery: prediction from administrative versus clinical data . Med Care. 2005 ; 43 : 159 – 167 .
- , . Weekend birth and higher neonatal mortality: a problem of patient acuity or quality of care? J Obstet Gynecol Neonatal Nurs. 2003 ; 32 : 724 – 733 .
- , , , , , . Analysis of the mortality of patients admitted to internal medicine wards over the weekend . Am J Med Qual. 2010 ; 25 : 312 – 318 .
- , , , . Do weekends or evenings matter in a pediatric intensive care unit? Pediatr Crit Care Med. 2005 ; 6 : 523 – 530 .
- , , , , . Hospital mortality associated with day and time of admission to intensive care units . Intensive Care Medicine. 2004 ; 30 : 895 – 901 .
- , , . Weekend and weeknight admissions have the same outcome of weekday admissions to an intensive care unit with onsite intensivist coverage . Crit Care Med. 2006 ; 34 : 605 – 611 .
- , , , , . Measuring the intensity of nursing care: making use of the Belgian Nursing Minimum Data Set . Int J Nurs Stud. 2008 ; 45 : 1011 – 1021 .
- , , , , . The relationship between intensity and duration of medical services and outcomes for hospitalized patients . Med Care. 1979 ; 17 : 1088 – 1102 .
- . Differences in length of hospital stay for Medicaid and Blue Cross patients and the effect of intensity of services . Public Health Rep. 1979 ; 94 : 438 – 445 .
- . Health care's lost weekend. New York Times . October 3, 2010 . Section A, p. 27 .
- , , , . A progress report on electronic health records in U.S. hospitals . Health Aff (Millwood). 2010 ; 29 : 1951 – 1957 .
- US Department of Health 146 : 524 – 527 .
- , , . Temporal approach to hematological test usage in a major teaching hospital . Lab Hematol. 2003 ; 9 : 207 – 213 .
Hospitals provide acute inpatient care all day and every day. Nonetheless, a number of studies have shown that weekend care may have lower quality than care delivered on weekdays. [1, 2, 3, 4, 5, 6, 7] Weekend care has been associated with increased mortality among patients suffering from a number of conditions [4, 5, 6, 7, 8, 9, 10] and in a number of clinical settings. [11, 12, 13, 14] Findings of poor outcomes on weekends are not universal, though exceptions occur typically in settings where services and clinical staffing are fairly constant throughout the week, such as intensive care units with on‐site intensivists. [15, 16, 17]
These differences in quality and outcomes suggest that there is a difference in intensity of care over the course of the week. Initiatives to address this important safety issue would be strengthened if a shared metric existed to describe the intensity of care provided at a given time of day or day of the week. However, few measures of global hospital intensity of care exist. The metrics that have been developed are limited by measuring only 1 aspect of care delivery, such as weekend nurse staffing, [18] by requiring extensive chart abstraction, [19] or through reliance on hospital expenses in an older payment model. [20] These measures notably predate contemporary hospital care delivery, which is increasingly dependent on the electronic health record (EHR). To our knowledge, no prior measure of hospital care intensity has been described using the EHR.
Recently, our medical center began an initiative to increase weekend services and staffing to create more uniform availability of care throughout the week. The purpose of this study was to develop a global measure of intensity of care using data derived from the EHR as part of the evaluation of this initiative. [21]
METHODS
We conducted a retrospective analysis of EHR activity for hospital inpatients between January 1, 2011 and December 31, 2011 at New York University Langone Medical Center (NYULMC). During that time period, nearly all inpatient clinical activities at NYULMC were performed and documented through the EHR, Sunrise Clinical Manager (Allscripts, Chicago, IL). These activities include clinical documentation, orders, medication administration, and results of diagnostic tests. Access to the EHR is through Citrix Xenapp Servers (Citrix Systems, Santa Clara, CA), which securely deliver applications from central servers to providers' local terminals.
The primary measure of EHR activity, which we refer to as EHR interactions, was defined as the accessing of a patient's electronic record by a clinician. A provider initiates an interaction by opening a patient's electronic record and concludes it by either opening the record of a different patient or logging out of the EHR. An EHR interaction thus captures a unit of direct patient care, such as documenting a clinical encounter, recording medication administration, or reviewing patient data. Most EHR systems routinely log such interactions to enable compliance departments to audit which users have accessed a patient chart.
The secondary measure of EHR activity was percent central processing unit (CPU), which represents the percent of total available server processing power being used by the Citrix servers at a given time. CPU utilization was averaged over an hour to determine the mean percentage of use for any given hour. As CPU data are not retained for more than 30 days at our institution, we examined CPU usage for the period July 1, 2012 to August 31, 2012.
We evaluated subgroups of EHR interactions by provider type: nurses, resident physicians, attending physicians, pharmacy staff, and all others. We also examined EHR interactions for 2 subgroups of patients: those admitted to the medicine service from the emergency room (ER) and those electively admitted to the surgical service. An elective hospitalization was defined as 1 in which the patient was neither admitted from the ER nor transferred from another hospital. These 2 subgroups were further refined to evaluate EHR interactions among groups of patients admitted during the day, night, weekday, and weeknight. Finally, we examined specific EHR orders that we considered reflective of advancing or altering care, including orders to increase the level of mobilization, to insert or remove a urinary catheter, or to initiate or discontinue antibiotics. As antibiotics are frequently initiated on the day of admission and stopped on the day of discharge, we excluded antibiotic orders that occurred on days of admission or discharge.
Statistical Analysis
EHR interactions were presented as hourly rates by dividing the number of patient chart accessions by the inpatient census for each hour. Hourly census was determined by summing the number of patients who were admitted prior to and discharged after the hour of interest. We calculated the arithmetic means of EHR interactions for each hour and day of the week in 2011. Analysis of variance was used to test differences in EHR interactions among days of the week, and t tests were used to test differences in EHR interactions between Saturday and Sunday, Tuesday and Wednesday, and weekend and weekdays. As a result of multiple comparisons in these analyses, we applied a Bonferroni correction.
EHR interaction rates were assigned to 1 of 3 periods based on a priori suspected peak and trough intensity: day (9:00 am to 4:59 pm ), morning/evening (7:00 am to 8:59 am and 5:00 pm to 7:59 pm ), and night (8:00 pm to 6:59 am ). Negative binomial regression models were used to determine the relative rate of weekday to weekend EHR interactions per patient for the 3 daily time periods. Similar models were developed for EHR interactions by provider types and for specific orders.
We calculated the correlation coefficient between total EHR interactions and occurrence of specific orders, EHR interactions by provider type, EHR interactions by patient subgroups, and CPU. A sensitivity analysis was performed in which EHR interactions were calculated as the number of patient chart accessions per number of daily discharges; this analysis considered the fact that discharges were likely to have high associated intensity but may be less common on weekends as compared to weekdays.
All analyses were performed using Stata 12 (StataCorp, College Station, TX). This study was approved by the institutional review board at NYU School of Medicine.
RESULTS
During the study period, the mean (standard deviation) number of EHR interactions per patient per hour was 2.49 (1.30). EHR interactions differed by hour and day of the week; the lowest number occurred in early morning on weekends, and the highest occurred around 11:00 am on weekdays (Figure 1 ). EHR interactions differed among days of the week at all times ( P <0.001), whereas EHR interactions were similar on most hours of Saturday and Sunday as well as Tuesday and Wednesday. At every hour, weekends had a lower number of EHR interactions in comparison to weekdays ( P <0.001). Weekdays showed a substantial increase in the number of EHR interactions between 8:00 am and 12:00 pm , followed by a slight decrease in activity between 12:00 pm and 2:00 pm , and another increase in activity from 2:00 pm to 5:00 pm (Figure 1 ). Weekend days demonstrated marked blunting of this midday peak in intensity. The tracking of an entire month of hospital EHR interactions produced a detailed graphic picture of hospital activity, clearly demarcating rounding hours, lunch hours, weekend days, hospital holidays, and other landmarks (Figure 2 ). The relative rates of census‐adjusted EHR interactions on weekdays versus weekends were 1.76 (95% confidence interval [CI]: 1.74‐1.77) for day, 1.52 (95% CI: 1.50‐1.55) for morning/evening, and 1.14 (95% CI: 1.12‐1.17) for night hours.
Nurses performed the largest number of EHR interactions (39.7%), followed by resident physicians (15.2%), attending physicians (10.2%), and pharmacists (7.6%). The remainder of EHR interactions were performed by other providers (27.4%), whose role in the majority of cases was undefined in the EHR (see Supporting Table 1 in the online version of this article). Daily variation in EHR interactions differed by provider type (Table 1 ). Nurses and resident physicians showed smaller differences in their EHR interactions between weekend and weekdays and among times of day when compared to attending physicians, pharmacy staff, and other staff. EHR interactions showed similar variations to the overall cohort for both medicine patients admitted from the ER and elective surgery patients (Table 1 ). Specific clinical orders designed to sample particularly meaningful interactions, including urinary catheter insertion and removal, patient mobilization orders, and new antibiotic orders, were moderately correlated with total EHR interactions (Table 2 ). In a sensitivity analysis, the comparison of weekday to weekend EHR interactions per daily discharge was similar to the primary analysis, with relative rates of 1.75 (95% CI: 1.73‐1.77), 1.54 (95% CI: 1.50‐1.57), and 1.15 (95% CI: 1.11‐1.18) for day, morning/evening, and night hours, respectively.
| Hour Group a | |||||||
|---|---|---|---|---|---|---|---|
| Daytime Hours | Morning/Evening Hours | Nighttime Hours | Correlation Coefficient to | ||||
| Rate Ratio | 95% CI | Rate Ratio | 95% CI | Rate Ratio | 95% CI | EHR Interactions | |
| |||||||
| All EHR interactions | 1.76 | 1.74‐1.77 | 1.52 | 1.50‐1.55 | 1.14 | 1.12‐1.17 | 1.00 |
| By provider subgroup | |||||||
| Nurses | 1.35 | 1.34‐1.37 | 1.21 | 1.20‐1.22 | 1.10 | 1.08‐1.12 | 0.92 |
| Residents | 1.38 | 1.36‐1.40 | 1.46 | 1.43‐1.49 | 1.14 | 1.11‐1.18 | 0.90 |
| Attending physicians | 1.70 | 1.67‐1.73 | 2.04 | 1.97‐2.10 | 1.32 | 1.26‐1.39 | 0.96 |
| Pharmacy staff | 1.64 | 1.61‐1.67 | 1.68 | 1.61‐1.75 | 1.19 | 1.15‐1.23 | 0.90 |
| All others | 2.75 | 2.70‐2.79 | 2.08 | 2.002.17 | 1.20 | 1.15‐1.25 | 0.97 |
| By admission subgroup | |||||||
| Medicine ER admissions | |||||||
| All | 1.64 | 1.62‐1.67 | 1.41 | 1.38‐1.44 | 1.07 | 1.04‐1.09 | 0.92 |
| Day admissions | 1.64 | 1.62‐1.67 | 1.41 | 1.38‐1.44 | 1.08 | 1.05‐1.11 | 0.92 |
| Night admissions | 1.65 | 1.62‐1.68 | 1.41 | 1.37‐1.45 | 1.03 | 1.001.05 | 0.88 |
| Weekday admissions | 1.76 | 1.73‐1.79 | 1.56 | 1.52‐1.59 | 1.28 | 1.23‐1.30 | 0.93 |
| Weekend admissions | 1.40 | 1.38‐1.42 | 1.14 | 1.11‐1.17 | 0.70 | 0.68‐0.72 | 0.88 |
| Surgery elective admissions | |||||||
| All | 1.63 | 1.61‐1.65 | 1.53 | 1.50‐1.56 | 1.25 | 1.21‐1.28 | 0.97 |
| Day admissions | 1.62 | 1.60‐1.64 | 1.54 | 1.51‐1.57 | 1.26 | 1.23‐1.30 | 0.96 |
| Night admissions | 1.65 | 1.62‐1.67 | 1.50 | 1.46‐1.54 | 1.22 | 1.18‐1.25 | 0.94 |
| Weekday admissions | 1.64 | 1.62‐1.66 | 1.55 | 1.52‐1.59 | 1.27 | 1.24‐1.31 | 0.96 |
| Weekend admissions | 1.60 | 1.56‐1.65 | 1.26 | 1.21‐1.31 | 0.89 | 0.85‐0.93 | 0.73 |
| Hour Group a | |||||||
|---|---|---|---|---|---|---|---|
| Daytime Hours | Morning/Evening Hours | Nighttime Hours | Correlation Coefficient to | ||||
| Rate Ratio | 95% CI | Rate Ratio | 95% CI | Rate Ratio | 95% CI | EHR Interactions | |
| |||||||
| Urinary catheter | 2.81 | 2.61‐3.02 | 3.17 | 2.85‐3.54 | 1.42 | 1.27‐1.58 | 0.66 |
| Mobilization | 2.51 | 2.39‐2.63 | 2.91 | 2.71‐3.12 | 1.42 | 1.34‐1.52 | 0.70 |
| Antibiotic initiation b | 1.33 | 1.24‐1.42 | 1.65 | 1.47‐1.85 | 1.13 | 1.01‐1.25 | 0.41 |
| Antibiotic discontinue c | 1.74 | 1.63‐1.85 | 1.68 | 1.50‐1.87 | 1.28 | 1.13‐1.45 | 0.61 |
As seen in Figure 3 , CPU usage was well correlated with EHR interactions ( r =0.90) and both metrics were lower on weekends as compared to weekdays. A few outliers of increased CPU usage on weekends were observed; these outliers all occurred on Sundays from 12:00 am to 2:00 am . The information technology (IT) department at our institution confirmed that these outliers coincided with a weekly virus scan performed at that time.
am
and 1:00
am
, which were determined to be outliers related to a weekly virus scan. The correlation coefficient is 0.90.
DISCUSSION
EHR interactions represents a new and accessible measure of hospital care intensity that may be used to track temporal variations in care that are likely to exist in all hospital systems. As the number of hospitals that process and document all clinical activities through the EHR continues to increase, [22, 23] such a measure has the potential to serve as a useful metric in efforts to raise nighttime and weekend care to the same quality as that during weekdays.
We found that EHR interactions differed markedly between days and nights and between weekdays and weekends. A number of prior studies have found temporal variations in clinical outcomes and care. [1, 2, 3, 4, 5, 6, 7, 8, 9, 10, 11, 12, 13, 14] Our study adds to this literature by defining a new measure of the overall intensity of the process of inpatient care. Using this measure, we demonstrate that the increase in midday clinical activity seen during the week is substantially blunted on weekends. This finding adds validity to the designation of both nights and weekends as off hours when examining temporal variations in clinical care. [2, 7]
Other subtle patterns of care delivery emerged throughout the day. For instance, we found a decrease in EHR interactions between 12:00 pm and 2:00 pm , likely representing a small lull in clinical activity during the lunchtime hour, whereas EHR interactions were higher in the night and evening hours than in the early morning. The clinical significance of such fluctuations remains undetermined.
Variation throughout the week differed by provider type. Nurses and resident physicians, who are scheduled around the clock, demonstrated the least fluctuation in EHR interaction intensity over time. Attending physicians and other staff showed the greatest variation in weekday versus weekend care.
We defined a second measure of care intensity based on EHR utilization, which we named CPU usage. The advantage of using CPU as a metric is that it easy to measure and track as it is routinely monitored by hospital IT departments as part of regular maintenance. CPU usage can therefore be easily implemented in any institution with an EHR, whereas measuring EHR interactions requires EHR data abstraction and manipulation. The disadvantage of CPU usage as a measure is that it includes nonclinical reporting and other functions and therefore represents a less specific measure of clinical activity. Nonetheless, at our institution, nearly all clinical activities are processed or documented through the EHR, which is maintained on central servers, and CPU usage was well correlated with EHR interactions. We therefore believe that CPU usage represents a useful indicator of hospital clinical activity at a given time.
Several limitations deserve mention. First, EHR interactions may not always reflect actual patient care or clinical documentation. Nonetheless, we also examined specific patient orders and found that variations in these process measures were similar to those in the EHR interaction measure. Second, our methods were developed and evaluated at a single institution and may not be generalizable. Third, increased intensity of care does not necessarily increase quality of care. For instance, laboratory tests are commonly obtained on a daily basis in the hospital, a practice that is costly and often unnecessary. [24] Weekends have been associated with fewer laboratory tests, which may be appropriate as compared to the more frequent testing observed on weekdays. [25] Finally, we do not ascertain whether variations in EHR interactions correlate with clinical outcomes, and believe this to be an area for further research.
In conclusion, EHR interactions represent a new global process measure of care intensity, which was demonstrated to vary over the course of a week. We intend to use this measure at our institution to track progress of an initiative to ensure a high standard of care throughout the course of the week. The extent to which temporal variations in EHR interactions or reductions in these variations are correlated with clinical outcomes deserves further study. We believe this measure, which can be adapted to other institutions, may have a valuable role to play in hospitals' efforts to eliminate excess morbidity and mortality associated with care delivered during nights and weekends.
- , , , et al. Impact of weekend admissions on quality of care and outcomes in patients with acute myeloid leukemia . Cancer. 2010 ; 116 : 3614 – 3620 .
- , , , et al. Impact of time of presentation on the care and outcomes of acute myocardial infarction . Circulation. 2008 ; 117 : 2502 – 2509 .
- , , , et al. Weekend hospital admission and discharge for heart failure: association with quality of care and clinical outcomes . Am Heart J. 2009 ; 158 : 451 – 458 .
- , , , . Hospital care for patients experiencing weekend vs weekday stroke: a comparison of quality and aggressiveness of care . Arch Neurol. 2010 ; 67 : 39 – 44 .
- , , , , , . Weekend versus weekday admission and mortality from myocardial infarction . N Engl J Med. 2007 ; 356 : 1099 – 1109 .
- . Do hospitals provide lower quality care on weekends? Health Serv Res. 2007 ; 42 : 1589 – 1612 .
- , , , et al. Relationship between time of day, day of week, timeliness of reperfusion, and in‐hospital mortality for patients with acute ST‐segment elevation myocardial infarction . JAMA. 2005 ; 294 : 803 – 812 .
- , , , , , . Weekend versus weekday admission and mortality after acute pulmonary embolism . Circulation. 2009 ; 119 : 962 – 968 .
- , , , , , . Influence of weekend hospital admission on short‐term mortality after intracerebral hemorrhage . Stroke. 2009 ; 40 : 2387 – 2392 .
- , , , et al. Weekend hospital admission, acute kidney injury, and mortality . J Am Soc Nephrol. 2010 ; 21 : 845 – 851 .
- , . Mortality among patients admitted to hospitals on weekends as compared with weekdays . N Engl J Med. 2001 ; 345 : 663 – 668 .
- , , , et al. Mortality after noncardiac surgery: prediction from administrative versus clinical data . Med Care. 2005 ; 43 : 159 – 167 .
- , . Weekend birth and higher neonatal mortality: a problem of patient acuity or quality of care? J Obstet Gynecol Neonatal Nurs. 2003 ; 32 : 724 – 733 .
- , , , , , . Analysis of the mortality of patients admitted to internal medicine wards over the weekend . Am J Med Qual. 2010 ; 25 : 312 – 318 .
- , , , . Do weekends or evenings matter in a pediatric intensive care unit? Pediatr Crit Care Med. 2005 ; 6 : 523 – 530 .
- , , , , . Hospital mortality associated with day and time of admission to intensive care units . Intensive Care Medicine. 2004 ; 30 : 895 – 901 .
- , , . Weekend and weeknight admissions have the same outcome of weekday admissions to an intensive care unit with onsite intensivist coverage . Crit Care Med. 2006 ; 34 : 605 – 611 .
- , , , , . Measuring the intensity of nursing care: making use of the Belgian Nursing Minimum Data Set . Int J Nurs Stud. 2008 ; 45 : 1011 – 1021 .
- , , , , . The relationship between intensity and duration of medical services and outcomes for hospitalized patients . Med Care. 1979 ; 17 : 1088 – 1102 .
- . Differences in length of hospital stay for Medicaid and Blue Cross patients and the effect of intensity of services . Public Health Rep. 1979 ; 94 : 438 – 445 .
- . Health care's lost weekend. New York Times . October 3, 2010 . Section A, p. 27 .
- , , , . A progress report on electronic health records in U.S. hospitals . Health Aff (Millwood). 2010 ; 29 : 1951 – 1957 .
- US Department of Health 146 : 524 – 527 .
- , , . Temporal approach to hematological test usage in a major teaching hospital . Lab Hematol. 2003 ; 9 : 207 – 213 .
Copyright © 2013 Society of Hospital Medicine
saul.blecker@nyumc.org
