User login
Studying Documentation
In 1968, Weed highlighted the importance of medical documentation when he proposed a single format for notes.[1, 2] Since then, sweeping changes in the technology, the purposes, and the requirements of clinical record keeping have encouraged steady growth of a literature devoted to the chart. Specifically, over the past half century, computers, lawsuits, regulations, and the use of documentation as a tool of billing have all contributed to the transformation of hospital records. In addition, mounting pressure to shorten inpatient stays, the vastly increased complexity of care, and a growing number of diagnostic possibilities have combined to make medical documentation far more prolific and far less leisurely. All these changes have stimulated a boom in documentation research coinciding, productively, with an era of rapid advances in the conduct of clinical trials and statistical rigor. However, in important respects research into medical documentation today is not asking the right questions, either in the formulation of hypotheses or in the choice of methodology. Forms of clinical communication that do not involve order sets or notes are widespread, growing in sophistication, and increasingly relevant to new concepts of healthcare as a team enterprise; but documentation research has not embraced this development. At the same time, methodologically, the field suffers from a persistent professional bias in the choice of research outcomes, a bias that limits the interpretation of results by neglecting what happens to the patient.
In assessing the chart as a communication device and the effect of changes in documentation, it is increasingly necessary to study direct interpersonal communication as an alternative and partner to writing notes. In particular, 3 recent developments in healthcare emphasize the importance of broadening our concepts of clinical communication. First, the need for discussion in the medical record has become less pressing because of technical improvements in person‐to‐person communication. Second, the electronic health record, by creating discipline‐defined chart views, has helped equalize the stature of different healthcare disciplines but also Balkanized the chart, making direct interdisciplinary communication more necessary. Third, changes in reimbursement are redefining medical goals in such a way that only teams of healthcare providers in close and constant personal communication can achieve them.
Rapid adoption of electronic health records has encouraged researchers studying documentation or information technology to focus on computer formats as defining the range of all possible communication strategies. And certainly there is a broad range of formats: electronic progress notes may be free text or multiple choice, typed or dictated, copy forwarded or composed daily, institutionally templated or self‐templated, furnished with or free from prompts and pop‐ups. However, it is not only, and perhaps not even principally, the electronic record that has changed how clinicians communicate with each other. The technology of discussion over the last 2 decades has become instant, utterly mobile, device independent, and capable of connecting all the patient's caregivers at once to each other and to the medical record in text, picture, and sound. That the same communications upheaval has visited practically every other aspect of our lives diminishes perhaps the visibility of this new virtual team in healthcare but not its importance.
The electronic record certainly plays a role in facilitating communication, through simultaneous chart access and in many other ways, but even more significant is the effect that computerization has had on equalizing the roles of different disciplines and by doing so in fragmenting the medical record. A computerized record expands and reorganizes the chart, changing it from a single authoritative book read by all to an almost limitless array of chart views, each read by some. All viewers (patient, clinician or researcher, administrator, reviewer or coder) can, with equal claim to consulting the chart, categorize, compare, combine, and format data elements from 1 or many encounters, whether inpatient or ambulatory. Typically, an electronic item of patient information may have several authors and uses but has no owner. Data are entered by protocol and in different guises into many aspects of patient care as components of notes, flow sheets, summaries, pop‐ups, and order sets unique to each of a number of disciplines. As the electronic record equalizes but also separates members of the healthcare team, interdisciplinary personal communication becomes more, not less, important.
Recent and impending reimbursement reform proves also to be a means of democratizing medical care and enforcing better interdisciplinary communication. The basis for hospital reimbursement has evolved over decades from day rates to payments for specific diseases, a system under which profit margins are in theory determined by the interdisciplinary efficiency with which diseases are managed by all care givers and the accuracy with which that management is documented. The next, seemingly inexorable, step in the evolution of reimbursement will result in further democratization of care givers: a single combined disease episode payment will be divided among all those involved in a course of treatment that may span many months and require many disciplines and many types of intervention. Payment reform makes the success of a visiting nurse as important to the net reimbursement of a disease episode as the success of an orthopedic surgeon; for if the visiting nurse does not do well the patient will be readmitted or require more office services. In this sense, payment reform, like the electronic record, tends both to equalize the importance of different healthcare roles and to require their enhanced communication.
As these changes in technology and reimbursement evolve, the study of medical documentation must increasingly address medical communication more generally. It is entirely possible, for example, that an individual daily progress note, whose preparation consumes so many hours and removes caretakers from patients, will no longer serve any demonstrable purpose.[3, 4] It may be that consensus summaries will prove more useful in clarifying one's own thinking and incorporating that of others than will a daily, solo chart soliloquy in free or imported text. It is conceivable that contrasting views will be best presented not as a debate in the progress notes but as a plan mutually agreed upon earlier in the decision‐making process. These are the kind of broader questions that investigators in medical documentation should be pursuing.
Another problem in studies of documentation is a pervasive professional bias in the choice of end points. Studies tend to evaluate documentary practices not by their effect on patients but by their impact on physicians or nurses. Success is measured by clinician satisfaction, percent adoption, and note length or timing; note quality is judged using a checklist derived from professional surveys.[5, 6, 7, 8, 9, 10, 11, 12, 13, 14, 15] End points like these will often make 1 document look better than another in a results section, but it is the relation between communication strategies and healthcare outcomes that determines whether 1 approach or another is of benefit to the patient.
For example, an important current debate is whether free text adds essential nuance to a note or is simply nostalgia, a relic of the 3‐ring binder.[16, 17, 18] This debate can be resolved convincingly only if improvement with the use or abolition of free text is measured in terms of patient outcomes or resource consumption. Again, if it is important to know whether progress notes of a particular length or structure create less handover confusion, then changes in medical error rates is a more persuasive way to evaluate this issue than a change in physician opinion. It may be a good question whether briefer notes will free nurses and doctors to spend more time at the bedside, but along with recording bedside time that study should also measure improvement in reacting to important changes of clinical status. With today's technology, group phone discussions could perhaps successfully replace examining each other's notes, but the measure of success should be improved hospital efficiency or a decline in errors and readmissions.
The questions we ask in our research today create the treatments and policies of tomorrow. Our studies must address communications in a larger sense, must encompass all the settings in which an episode of care occurs, and must focus on patient outcomes and use of resources. The measured end points of an intervention should of course be sensitive to the particular setting where the intervention takes place, or else small and location‐specific gains will be missed. However, real health effects and robust measures of efficiency must take the place of word counts, inclusion checklists, and clinician adoption or satisfaction in the design of documentation studies.
A great national experiment is underway involving the deployment of information technology, the expansion and empowerment of healthcare teams, and the retargeting of economic incentives. The experimental hypothesis is that technology will increase medical efficiency and will benefit patient well‐being only if these are in fact the purposes, and if teamwork is the principal means, of providing medical care. We should seize this time of change as an opportunity to measure and demonstrably improve the contribution of medical documentation and communication to the efficient and long‐term remission of disease.
- . Medical records that guide and teach. N Engl J Med. 1968;278(12):593–600.
- . Medical records that guide and teach. N Engl J Med. 1968;278(12):652–257.
- , , , . Use of electronic clinical documentation: time spent and team interactions. J Am Med Inform Assoc. 2011;18(2):112–117.
- , , , , , . The influence of integrated electronic medical records and computerized nursing notes on nurses' time spent in documentation. Comput Inform Nurs. 2012;30(6):287–292.
- , , , , . The hybrid progress note: semiautomating daily progress notes to achieve high‐quality documentation and improve provider efficiency. Am J Med Qual. 2013;28(1):25–32.
- , , , . Preliminary development of the physician documentation quality instrument. J Am Med Inform Assoc. 2008;15(4):534–541.
- , , , , . Evaluation of residents' delivery notes after a simulated shoulder dystocia. Obstet Gynecol. 2004;104(4):667–670.
- , , , , , . Validity evidence for a patient note scoring rubric based on the new patient note format of the United States Medical Licensing Examination. Acad Med. 2013;88(10):1552–1557.
- , , , . Quality of outpatient clinical notes: a stakeholder definition derived through qualitative research. BMC Health Serv Res. 2012;12:407.
- , , . Definition, structure, content, use and impacts of electronic health records: a review of the research literature. Int J Med Inform. 2008;77(5):291–304.
- , , , et al. Randomised trial comparing the recording ability of a novel, electronic emergency documentation system with the AHA paper cardiac arrest record [published online ahead of print July 29, 2013]. Emerg Med J. doi: 10.1136/emermed‐2013‐202512.
- , , , et al. Generating clinical notes for electronic health record systems. Appl Clin Inform. 2010;1(3):232–243.
- , , . The effects of EMR deployment on doctors' work practices: a qualitative study in the emergency department of a teaching hospital. Int J Med Inform. 2012;81(3):204–217.
- , , , , . Comparison of handheld computer‐assisted and conventional paper chart documentation of medical records. A randomized, controlled trial. J Bone Joint Surg Am. 2004;86A(3):553–560.
- , , , , . Assessing quality and efficiency of discharge summaries. Am J Med Qual. 2005;20(6):337–343.
- , , , , , . Physicians' attitudes towards copy and pasting in electronic note writing. J Gen Intern Med. 2009;24(1):63–68.
- , , , . Association of medical directors of information systems consensus on inpatient electronic health record documentation. Appl Clin Inform. 2013;4(2):293–303.
- , , . Method of electronic health record documentation and quality of primary care. Am Med Inform Assoc. 2012;19(6):1019–1024.
In 1968, Weed highlighted the importance of medical documentation when he proposed a single format for notes.[1, 2] Since then, sweeping changes in the technology, the purposes, and the requirements of clinical record keeping have encouraged steady growth of a literature devoted to the chart. Specifically, over the past half century, computers, lawsuits, regulations, and the use of documentation as a tool of billing have all contributed to the transformation of hospital records. In addition, mounting pressure to shorten inpatient stays, the vastly increased complexity of care, and a growing number of diagnostic possibilities have combined to make medical documentation far more prolific and far less leisurely. All these changes have stimulated a boom in documentation research coinciding, productively, with an era of rapid advances in the conduct of clinical trials and statistical rigor. However, in important respects research into medical documentation today is not asking the right questions, either in the formulation of hypotheses or in the choice of methodology. Forms of clinical communication that do not involve order sets or notes are widespread, growing in sophistication, and increasingly relevant to new concepts of healthcare as a team enterprise; but documentation research has not embraced this development. At the same time, methodologically, the field suffers from a persistent professional bias in the choice of research outcomes, a bias that limits the interpretation of results by neglecting what happens to the patient.
In assessing the chart as a communication device and the effect of changes in documentation, it is increasingly necessary to study direct interpersonal communication as an alternative and partner to writing notes. In particular, 3 recent developments in healthcare emphasize the importance of broadening our concepts of clinical communication. First, the need for discussion in the medical record has become less pressing because of technical improvements in person‐to‐person communication. Second, the electronic health record, by creating discipline‐defined chart views, has helped equalize the stature of different healthcare disciplines but also Balkanized the chart, making direct interdisciplinary communication more necessary. Third, changes in reimbursement are redefining medical goals in such a way that only teams of healthcare providers in close and constant personal communication can achieve them.
Rapid adoption of electronic health records has encouraged researchers studying documentation or information technology to focus on computer formats as defining the range of all possible communication strategies. And certainly there is a broad range of formats: electronic progress notes may be free text or multiple choice, typed or dictated, copy forwarded or composed daily, institutionally templated or self‐templated, furnished with or free from prompts and pop‐ups. However, it is not only, and perhaps not even principally, the electronic record that has changed how clinicians communicate with each other. The technology of discussion over the last 2 decades has become instant, utterly mobile, device independent, and capable of connecting all the patient's caregivers at once to each other and to the medical record in text, picture, and sound. That the same communications upheaval has visited practically every other aspect of our lives diminishes perhaps the visibility of this new virtual team in healthcare but not its importance.
The electronic record certainly plays a role in facilitating communication, through simultaneous chart access and in many other ways, but even more significant is the effect that computerization has had on equalizing the roles of different disciplines and by doing so in fragmenting the medical record. A computerized record expands and reorganizes the chart, changing it from a single authoritative book read by all to an almost limitless array of chart views, each read by some. All viewers (patient, clinician or researcher, administrator, reviewer or coder) can, with equal claim to consulting the chart, categorize, compare, combine, and format data elements from 1 or many encounters, whether inpatient or ambulatory. Typically, an electronic item of patient information may have several authors and uses but has no owner. Data are entered by protocol and in different guises into many aspects of patient care as components of notes, flow sheets, summaries, pop‐ups, and order sets unique to each of a number of disciplines. As the electronic record equalizes but also separates members of the healthcare team, interdisciplinary personal communication becomes more, not less, important.
Recent and impending reimbursement reform proves also to be a means of democratizing medical care and enforcing better interdisciplinary communication. The basis for hospital reimbursement has evolved over decades from day rates to payments for specific diseases, a system under which profit margins are in theory determined by the interdisciplinary efficiency with which diseases are managed by all care givers and the accuracy with which that management is documented. The next, seemingly inexorable, step in the evolution of reimbursement will result in further democratization of care givers: a single combined disease episode payment will be divided among all those involved in a course of treatment that may span many months and require many disciplines and many types of intervention. Payment reform makes the success of a visiting nurse as important to the net reimbursement of a disease episode as the success of an orthopedic surgeon; for if the visiting nurse does not do well the patient will be readmitted or require more office services. In this sense, payment reform, like the electronic record, tends both to equalize the importance of different healthcare roles and to require their enhanced communication.
As these changes in technology and reimbursement evolve, the study of medical documentation must increasingly address medical communication more generally. It is entirely possible, for example, that an individual daily progress note, whose preparation consumes so many hours and removes caretakers from patients, will no longer serve any demonstrable purpose.[3, 4] It may be that consensus summaries will prove more useful in clarifying one's own thinking and incorporating that of others than will a daily, solo chart soliloquy in free or imported text. It is conceivable that contrasting views will be best presented not as a debate in the progress notes but as a plan mutually agreed upon earlier in the decision‐making process. These are the kind of broader questions that investigators in medical documentation should be pursuing.
Another problem in studies of documentation is a pervasive professional bias in the choice of end points. Studies tend to evaluate documentary practices not by their effect on patients but by their impact on physicians or nurses. Success is measured by clinician satisfaction, percent adoption, and note length or timing; note quality is judged using a checklist derived from professional surveys.[5, 6, 7, 8, 9, 10, 11, 12, 13, 14, 15] End points like these will often make 1 document look better than another in a results section, but it is the relation between communication strategies and healthcare outcomes that determines whether 1 approach or another is of benefit to the patient.
For example, an important current debate is whether free text adds essential nuance to a note or is simply nostalgia, a relic of the 3‐ring binder.[16, 17, 18] This debate can be resolved convincingly only if improvement with the use or abolition of free text is measured in terms of patient outcomes or resource consumption. Again, if it is important to know whether progress notes of a particular length or structure create less handover confusion, then changes in medical error rates is a more persuasive way to evaluate this issue than a change in physician opinion. It may be a good question whether briefer notes will free nurses and doctors to spend more time at the bedside, but along with recording bedside time that study should also measure improvement in reacting to important changes of clinical status. With today's technology, group phone discussions could perhaps successfully replace examining each other's notes, but the measure of success should be improved hospital efficiency or a decline in errors and readmissions.
The questions we ask in our research today create the treatments and policies of tomorrow. Our studies must address communications in a larger sense, must encompass all the settings in which an episode of care occurs, and must focus on patient outcomes and use of resources. The measured end points of an intervention should of course be sensitive to the particular setting where the intervention takes place, or else small and location‐specific gains will be missed. However, real health effects and robust measures of efficiency must take the place of word counts, inclusion checklists, and clinician adoption or satisfaction in the design of documentation studies.
A great national experiment is underway involving the deployment of information technology, the expansion and empowerment of healthcare teams, and the retargeting of economic incentives. The experimental hypothesis is that technology will increase medical efficiency and will benefit patient well‐being only if these are in fact the purposes, and if teamwork is the principal means, of providing medical care. We should seize this time of change as an opportunity to measure and demonstrably improve the contribution of medical documentation and communication to the efficient and long‐term remission of disease.
- . Medical records that guide and teach. N Engl J Med. 1968;278(12):593–600.
- . Medical records that guide and teach. N Engl J Med. 1968;278(12):652–257.
- , , , . Use of electronic clinical documentation: time spent and team interactions. J Am Med Inform Assoc. 2011;18(2):112–117.
- , , , , , . The influence of integrated electronic medical records and computerized nursing notes on nurses' time spent in documentation. Comput Inform Nurs. 2012;30(6):287–292.
- , , , , . The hybrid progress note: semiautomating daily progress notes to achieve high‐quality documentation and improve provider efficiency. Am J Med Qual. 2013;28(1):25–32.
- , , , . Preliminary development of the physician documentation quality instrument. J Am Med Inform Assoc. 2008;15(4):534–541.
- , , , , . Evaluation of residents' delivery notes after a simulated shoulder dystocia. Obstet Gynecol. 2004;104(4):667–670.
- , , , , , . Validity evidence for a patient note scoring rubric based on the new patient note format of the United States Medical Licensing Examination. Acad Med. 2013;88(10):1552–1557.
- , , , . Quality of outpatient clinical notes: a stakeholder definition derived through qualitative research. BMC Health Serv Res. 2012;12:407.
- , , . Definition, structure, content, use and impacts of electronic health records: a review of the research literature. Int J Med Inform. 2008;77(5):291–304.
- , , , et al. Randomised trial comparing the recording ability of a novel, electronic emergency documentation system with the AHA paper cardiac arrest record [published online ahead of print July 29, 2013]. Emerg Med J. doi: 10.1136/emermed‐2013‐202512.
- , , , et al. Generating clinical notes for electronic health record systems. Appl Clin Inform. 2010;1(3):232–243.
- , , . The effects of EMR deployment on doctors' work practices: a qualitative study in the emergency department of a teaching hospital. Int J Med Inform. 2012;81(3):204–217.
- , , , , . Comparison of handheld computer‐assisted and conventional paper chart documentation of medical records. A randomized, controlled trial. J Bone Joint Surg Am. 2004;86A(3):553–560.
- , , , , . Assessing quality and efficiency of discharge summaries. Am J Med Qual. 2005;20(6):337–343.
- , , , , , . Physicians' attitudes towards copy and pasting in electronic note writing. J Gen Intern Med. 2009;24(1):63–68.
- , , , . Association of medical directors of information systems consensus on inpatient electronic health record documentation. Appl Clin Inform. 2013;4(2):293–303.
- , , . Method of electronic health record documentation and quality of primary care. Am Med Inform Assoc. 2012;19(6):1019–1024.
EHR Use as a Measure of Care Intensity
Hospitals provide acute inpatient care all day and every day. Nonetheless, a number of studies have shown that weekend care may have lower quality than care delivered on weekdays. [1, 2, 3, 4, 5, 6, 7] Weekend care has been associated with increased mortality among patients suffering from a number of conditions [4, 5, 6, 7, 8, 9, 10] and in a number of clinical settings. [11, 12, 13, 14] Findings of poor outcomes on weekends are not universal, though exceptions occur typically in settings where services and clinical staffing are fairly constant throughout the week, such as intensive care units with on‐site intensivists. [15, 16, 17]
These differences in quality and outcomes suggest that there is a difference in intensity of care over the course of the week. Initiatives to address this important safety issue would be strengthened if a shared metric existed to describe the intensity of care provided at a given time of day or day of the week. However, few measures of global hospital intensity of care exist. The metrics that have been developed are limited by measuring only 1 aspect of care delivery, such as weekend nurse staffing, [18] by requiring extensive chart abstraction, [19] or through reliance on hospital expenses in an older payment model. [20] These measures notably predate contemporary hospital care delivery, which is increasingly dependent on the electronic health record (EHR). To our knowledge, no prior measure of hospital care intensity has been described using the EHR.
Recently, our medical center began an initiative to increase weekend services and staffing to create more uniform availability of care throughout the week. The purpose of this study was to develop a global measure of intensity of care using data derived from the EHR as part of the evaluation of this initiative. [21]
METHODS
We conducted a retrospective analysis of EHR activity for hospital inpatients between January 1, 2011 and December 31, 2011 at New York University Langone Medical Center (NYULMC). During that time period, nearly all inpatient clinical activities at NYULMC were performed and documented through the EHR, Sunrise Clinical Manager (Allscripts, Chicago, IL). These activities include clinical documentation, orders, medication administration, and results of diagnostic tests. Access to the EHR is through Citrix Xenapp Servers (Citrix Systems, Santa Clara, CA), which securely deliver applications from central servers to providers' local terminals.
The primary measure of EHR activity, which we refer to as EHR interactions, was defined as the accessing of a patient's electronic record by a clinician. A provider initiates an interaction by opening a patient's electronic record and concludes it by either opening the record of a different patient or logging out of the EHR. An EHR interaction thus captures a unit of direct patient care, such as documenting a clinical encounter, recording medication administration, or reviewing patient data. Most EHR systems routinely log such interactions to enable compliance departments to audit which users have accessed a patient chart.
The secondary measure of EHR activity was percent central processing unit (CPU), which represents the percent of total available server processing power being used by the Citrix servers at a given time. CPU utilization was averaged over an hour to determine the mean percentage of use for any given hour. As CPU data are not retained for more than 30 days at our institution, we examined CPU usage for the period July 1, 2012 to August 31, 2012.
We evaluated subgroups of EHR interactions by provider type: nurses, resident physicians, attending physicians, pharmacy staff, and all others. We also examined EHR interactions for 2 subgroups of patients: those admitted to the medicine service from the emergency room (ER) and those electively admitted to the surgical service. An elective hospitalization was defined as 1 in which the patient was neither admitted from the ER nor transferred from another hospital. These 2 subgroups were further refined to evaluate EHR interactions among groups of patients admitted during the day, night, weekday, and weeknight. Finally, we examined specific EHR orders that we considered reflective of advancing or altering care, including orders to increase the level of mobilization, to insert or remove a urinary catheter, or to initiate or discontinue antibiotics. As antibiotics are frequently initiated on the day of admission and stopped on the day of discharge, we excluded antibiotic orders that occurred on days of admission or discharge.
Statistical Analysis
EHR interactions were presented as hourly rates by dividing the number of patient chart accessions by the inpatient census for each hour. Hourly census was determined by summing the number of patients who were admitted prior to and discharged after the hour of interest. We calculated the arithmetic means of EHR interactions for each hour and day of the week in 2011. Analysis of variance was used to test differences in EHR interactions among days of the week, and t tests were used to test differences in EHR interactions between Saturday and Sunday, Tuesday and Wednesday, and weekend and weekdays. As a result of multiple comparisons in these analyses, we applied a Bonferroni correction.
EHR interaction rates were assigned to 1 of 3 periods based on a priori suspected peak and trough intensity: day (9:00 am to 4:59 pm ), morning/evening (7:00 am to 8:59 am and 5:00 pm to 7:59 pm ), and night (8:00 pm to 6:59 am ). Negative binomial regression models were used to determine the relative rate of weekday to weekend EHR interactions per patient for the 3 daily time periods. Similar models were developed for EHR interactions by provider types and for specific orders.
We calculated the correlation coefficient between total EHR interactions and occurrence of specific orders, EHR interactions by provider type, EHR interactions by patient subgroups, and CPU. A sensitivity analysis was performed in which EHR interactions were calculated as the number of patient chart accessions per number of daily discharges; this analysis considered the fact that discharges were likely to have high associated intensity but may be less common on weekends as compared to weekdays.
All analyses were performed using Stata 12 (StataCorp, College Station, TX). This study was approved by the institutional review board at NYU School of Medicine.
RESULTS
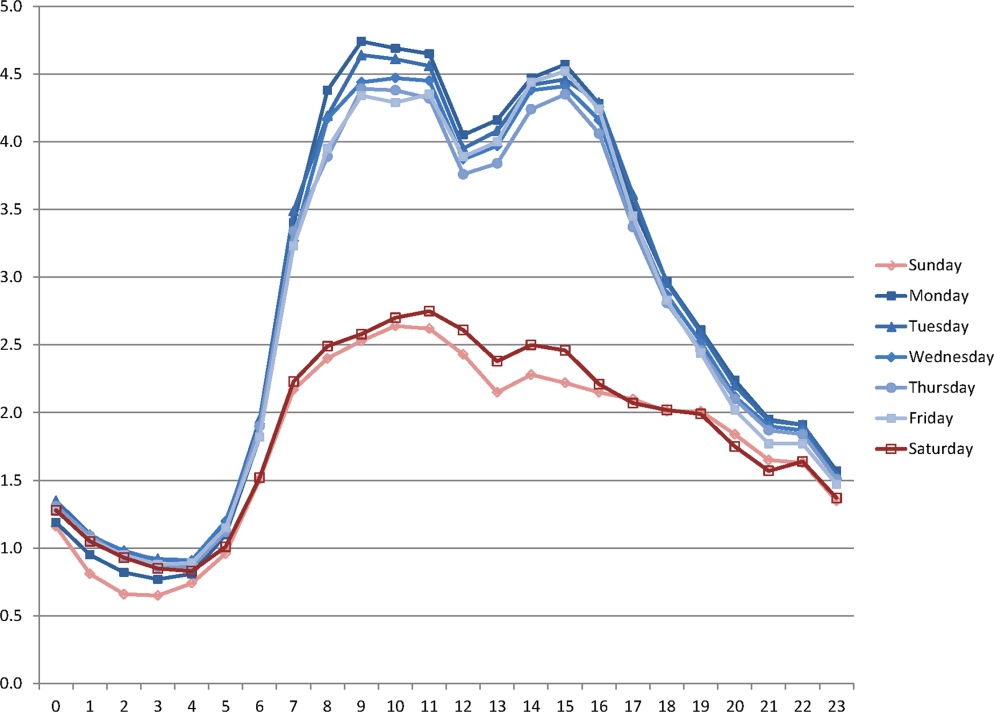
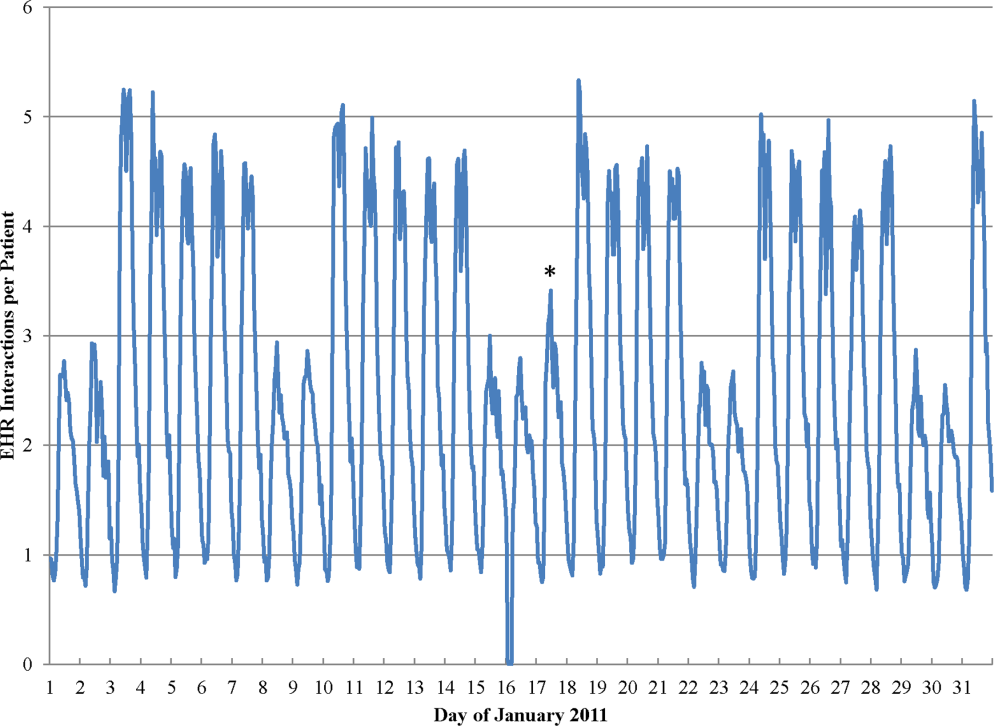
During the study period, the mean (standard deviation) number of EHR interactions per patient per hour was 2.49 (1.30). EHR interactions differed by hour and day of the week; the lowest number occurred in early morning on weekends, and the highest occurred around 11:00 am on weekdays (Figure 1 ). EHR interactions differed among days of the week at all times ( P <0.001), whereas EHR interactions were similar on most hours of Saturday and Sunday as well as Tuesday and Wednesday. At every hour, weekends had a lower number of EHR interactions in comparison to weekdays ( P <0.001). Weekdays showed a substantial increase in the number of EHR interactions between 8:00 am and 12:00 pm , followed by a slight decrease in activity between 12:00 pm and 2:00 pm , and another increase in activity from 2:00 pm to 5:00 pm (Figure 1 ). Weekend days demonstrated marked blunting of this midday peak in intensity. The tracking of an entire month of hospital EHR interactions produced a detailed graphic picture of hospital activity, clearly demarcating rounding hours, lunch hours, weekend days, hospital holidays, and other landmarks (Figure 2 ). The relative rates of census‐adjusted EHR interactions on weekdays versus weekends were 1.76 (95% confidence interval [CI]: 1.74‐1.77) for day, 1.52 (95% CI: 1.50‐1.55) for morning/evening, and 1.14 (95% CI: 1.12‐1.17) for night hours.
Nurses performed the largest number of EHR interactions (39.7%), followed by resident physicians (15.2%), attending physicians (10.2%), and pharmacists (7.6%). The remainder of EHR interactions were performed by other providers (27.4%), whose role in the majority of cases was undefined in the EHR (see Supporting Table 1 in the online version of this article). Daily variation in EHR interactions differed by provider type (Table 1 ). Nurses and resident physicians showed smaller differences in their EHR interactions between weekend and weekdays and among times of day when compared to attending physicians, pharmacy staff, and other staff. EHR interactions showed similar variations to the overall cohort for both medicine patients admitted from the ER and elective surgery patients (Table 1 ). Specific clinical orders designed to sample particularly meaningful interactions, including urinary catheter insertion and removal, patient mobilization orders, and new antibiotic orders, were moderately correlated with total EHR interactions (Table 2 ). In a sensitivity analysis, the comparison of weekday to weekend EHR interactions per daily discharge was similar to the primary analysis, with relative rates of 1.75 (95% CI: 1.73‐1.77), 1.54 (95% CI: 1.50‐1.57), and 1.15 (95% CI: 1.11‐1.18) for day, morning/evening, and night hours, respectively.
| Hour Group a | |||||||
|---|---|---|---|---|---|---|---|
| Daytime Hours | Morning/Evening Hours | Nighttime Hours | Correlation Coefficient to | ||||
| Rate Ratio | 95% CI | Rate Ratio | 95% CI | Rate Ratio | 95% CI | EHR Interactions | |
| |||||||
| All EHR interactions | 1.76 | 1.74‐1.77 | 1.52 | 1.50‐1.55 | 1.14 | 1.12‐1.17 | 1.00 |
| By provider subgroup | |||||||
| Nurses | 1.35 | 1.34‐1.37 | 1.21 | 1.20‐1.22 | 1.10 | 1.08‐1.12 | 0.92 |
| Residents | 1.38 | 1.36‐1.40 | 1.46 | 1.43‐1.49 | 1.14 | 1.11‐1.18 | 0.90 |
| Attending physicians | 1.70 | 1.67‐1.73 | 2.04 | 1.97‐2.10 | 1.32 | 1.26‐1.39 | 0.96 |
| Pharmacy staff | 1.64 | 1.61‐1.67 | 1.68 | 1.61‐1.75 | 1.19 | 1.15‐1.23 | 0.90 |
| All others | 2.75 | 2.70‐2.79 | 2.08 | 2.002.17 | 1.20 | 1.15‐1.25 | 0.97 |
| By admission subgroup | |||||||
| Medicine ER admissions | |||||||
| All | 1.64 | 1.62‐1.67 | 1.41 | 1.38‐1.44 | 1.07 | 1.04‐1.09 | 0.92 |
| Day admissions | 1.64 | 1.62‐1.67 | 1.41 | 1.38‐1.44 | 1.08 | 1.05‐1.11 | 0.92 |
| Night admissions | 1.65 | 1.62‐1.68 | 1.41 | 1.37‐1.45 | 1.03 | 1.001.05 | 0.88 |
| Weekday admissions | 1.76 | 1.73‐1.79 | 1.56 | 1.52‐1.59 | 1.28 | 1.23‐1.30 | 0.93 |
| Weekend admissions | 1.40 | 1.38‐1.42 | 1.14 | 1.11‐1.17 | 0.70 | 0.68‐0.72 | 0.88 |
| Surgery elective admissions | |||||||
| All | 1.63 | 1.61‐1.65 | 1.53 | 1.50‐1.56 | 1.25 | 1.21‐1.28 | 0.97 |
| Day admissions | 1.62 | 1.60‐1.64 | 1.54 | 1.51‐1.57 | 1.26 | 1.23‐1.30 | 0.96 |
| Night admissions | 1.65 | 1.62‐1.67 | 1.50 | 1.46‐1.54 | 1.22 | 1.18‐1.25 | 0.94 |
| Weekday admissions | 1.64 | 1.62‐1.66 | 1.55 | 1.52‐1.59 | 1.27 | 1.24‐1.31 | 0.96 |
| Weekend admissions | 1.60 | 1.56‐1.65 | 1.26 | 1.21‐1.31 | 0.89 | 0.85‐0.93 | 0.73 |
| Hour Group a | |||||||
|---|---|---|---|---|---|---|---|
| Daytime Hours | Morning/Evening Hours | Nighttime Hours | Correlation Coefficient to | ||||
| Rate Ratio | 95% CI | Rate Ratio | 95% CI | Rate Ratio | 95% CI | EHR Interactions | |
| |||||||
| Urinary catheter | 2.81 | 2.61‐3.02 | 3.17 | 2.85‐3.54 | 1.42 | 1.27‐1.58 | 0.66 |
| Mobilization | 2.51 | 2.39‐2.63 | 2.91 | 2.71‐3.12 | 1.42 | 1.34‐1.52 | 0.70 |
| Antibiotic initiation b | 1.33 | 1.24‐1.42 | 1.65 | 1.47‐1.85 | 1.13 | 1.01‐1.25 | 0.41 |
| Antibiotic discontinue c | 1.74 | 1.63‐1.85 | 1.68 | 1.50‐1.87 | 1.28 | 1.13‐1.45 | 0.61 |
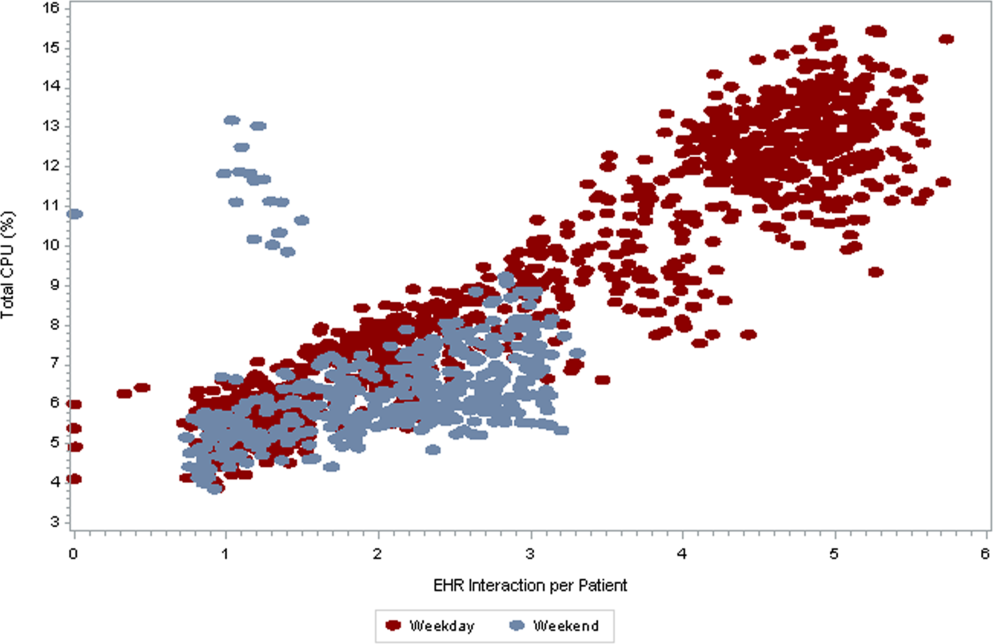
As seen in Figure 3 , CPU usage was well correlated with EHR interactions ( r =0.90) and both metrics were lower on weekends as compared to weekdays. A few outliers of increased CPU usage on weekends were observed; these outliers all occurred on Sundays from 12:00 am to 2:00 am . The information technology (IT) department at our institution confirmed that these outliers coincided with a weekly virus scan performed at that time.
am
and 1:00
am
, which were determined to be outliers related to a weekly virus scan. The correlation coefficient is 0.90.
DISCUSSION
EHR interactions represents a new and accessible measure of hospital care intensity that may be used to track temporal variations in care that are likely to exist in all hospital systems. As the number of hospitals that process and document all clinical activities through the EHR continues to increase, [22, 23] such a measure has the potential to serve as a useful metric in efforts to raise nighttime and weekend care to the same quality as that during weekdays.
We found that EHR interactions differed markedly between days and nights and between weekdays and weekends. A number of prior studies have found temporal variations in clinical outcomes and care. [1, 2, 3, 4, 5, 6, 7, 8, 9, 10, 11, 12, 13, 14] Our study adds to this literature by defining a new measure of the overall intensity of the process of inpatient care. Using this measure, we demonstrate that the increase in midday clinical activity seen during the week is substantially blunted on weekends. This finding adds validity to the designation of both nights and weekends as off hours when examining temporal variations in clinical care. [2, 7]
Other subtle patterns of care delivery emerged throughout the day. For instance, we found a decrease in EHR interactions between 12:00 pm and 2:00 pm , likely representing a small lull in clinical activity during the lunchtime hour, whereas EHR interactions were higher in the night and evening hours than in the early morning. The clinical significance of such fluctuations remains undetermined.
Variation throughout the week differed by provider type. Nurses and resident physicians, who are scheduled around the clock, demonstrated the least fluctuation in EHR interaction intensity over time. Attending physicians and other staff showed the greatest variation in weekday versus weekend care.
We defined a second measure of care intensity based on EHR utilization, which we named CPU usage. The advantage of using CPU as a metric is that it easy to measure and track as it is routinely monitored by hospital IT departments as part of regular maintenance. CPU usage can therefore be easily implemented in any institution with an EHR, whereas measuring EHR interactions requires EHR data abstraction and manipulation. The disadvantage of CPU usage as a measure is that it includes nonclinical reporting and other functions and therefore represents a less specific measure of clinical activity. Nonetheless, at our institution, nearly all clinical activities are processed or documented through the EHR, which is maintained on central servers, and CPU usage was well correlated with EHR interactions. We therefore believe that CPU usage represents a useful indicator of hospital clinical activity at a given time.
Several limitations deserve mention. First, EHR interactions may not always reflect actual patient care or clinical documentation. Nonetheless, we also examined specific patient orders and found that variations in these process measures were similar to those in the EHR interaction measure. Second, our methods were developed and evaluated at a single institution and may not be generalizable. Third, increased intensity of care does not necessarily increase quality of care. For instance, laboratory tests are commonly obtained on a daily basis in the hospital, a practice that is costly and often unnecessary. [24] Weekends have been associated with fewer laboratory tests, which may be appropriate as compared to the more frequent testing observed on weekdays. [25] Finally, we do not ascertain whether variations in EHR interactions correlate with clinical outcomes, and believe this to be an area for further research.
In conclusion, EHR interactions represent a new global process measure of care intensity, which was demonstrated to vary over the course of a week. We intend to use this measure at our institution to track progress of an initiative to ensure a high standard of care throughout the course of the week. The extent to which temporal variations in EHR interactions or reductions in these variations are correlated with clinical outcomes deserves further study. We believe this measure, which can be adapted to other institutions, may have a valuable role to play in hospitals' efforts to eliminate excess morbidity and mortality associated with care delivered during nights and weekends.
- , , , et al. Impact of weekend admissions on quality of care and outcomes in patients with acute myeloid leukemia . Cancer. 2010 ; 116 : 3614 – 3620 .
- , , , et al. Impact of time of presentation on the care and outcomes of acute myocardial infarction . Circulation. 2008 ; 117 : 2502 – 2509 .
- , , , et al. Weekend hospital admission and discharge for heart failure: association with quality of care and clinical outcomes . Am Heart J. 2009 ; 158 : 451 – 458 .
- , , , . Hospital care for patients experiencing weekend vs weekday stroke: a comparison of quality and aggressiveness of care . Arch Neurol. 2010 ; 67 : 39 – 44 .
- , , , , , . Weekend versus weekday admission and mortality from myocardial infarction . N Engl J Med. 2007 ; 356 : 1099 – 1109 .
- . Do hospitals provide lower quality care on weekends? Health Serv Res. 2007 ; 42 : 1589 – 1612 .
- , , , et al. Relationship between time of day, day of week, timeliness of reperfusion, and in‐hospital mortality for patients with acute ST‐segment elevation myocardial infarction . JAMA. 2005 ; 294 : 803 – 812 .
- , , , , , . Weekend versus weekday admission and mortality after acute pulmonary embolism . Circulation. 2009 ; 119 : 962 – 968 .
- , , , , , . Influence of weekend hospital admission on short‐term mortality after intracerebral hemorrhage . Stroke. 2009 ; 40 : 2387 – 2392 .
- , , , et al. Weekend hospital admission, acute kidney injury, and mortality . J Am Soc Nephrol. 2010 ; 21 : 845 – 851 .
- , . Mortality among patients admitted to hospitals on weekends as compared with weekdays . N Engl J Med. 2001 ; 345 : 663 – 668 .
- , , , et al. Mortality after noncardiac surgery: prediction from administrative versus clinical data . Med Care. 2005 ; 43 : 159 – 167 .
- , . Weekend birth and higher neonatal mortality: a problem of patient acuity or quality of care? J Obstet Gynecol Neonatal Nurs. 2003 ; 32 : 724 – 733 .
- , , , , , . Analysis of the mortality of patients admitted to internal medicine wards over the weekend . Am J Med Qual. 2010 ; 25 : 312 – 318 .
- , , , . Do weekends or evenings matter in a pediatric intensive care unit? Pediatr Crit Care Med. 2005 ; 6 : 523 – 530 .
- , , , , . Hospital mortality associated with day and time of admission to intensive care units . Intensive Care Medicine. 2004 ; 30 : 895 – 901 .
- , , . Weekend and weeknight admissions have the same outcome of weekday admissions to an intensive care unit with onsite intensivist coverage . Crit Care Med. 2006 ; 34 : 605 – 611 .
- , , , , . Measuring the intensity of nursing care: making use of the Belgian Nursing Minimum Data Set . Int J Nurs Stud. 2008 ; 45 : 1011 – 1021 .
- , , , , . The relationship between intensity and duration of medical services and outcomes for hospitalized patients . Med Care. 1979 ; 17 : 1088 – 1102 .
- . Differences in length of hospital stay for Medicaid and Blue Cross patients and the effect of intensity of services . Public Health Rep. 1979 ; 94 : 438 – 445 .
- . Health care's lost weekend. New York Times . October 3, 2010 . Section A, p. 27 .
- , , , . A progress report on electronic health records in U.S. hospitals . Health Aff (Millwood). 2010 ; 29 : 1951 – 1957 .
- US Department of Health 146 : 524 – 527 .
- , , . Temporal approach to hematological test usage in a major teaching hospital . Lab Hematol. 2003 ; 9 : 207 – 213 .
Hospitals provide acute inpatient care all day and every day. Nonetheless, a number of studies have shown that weekend care may have lower quality than care delivered on weekdays. [1, 2, 3, 4, 5, 6, 7] Weekend care has been associated with increased mortality among patients suffering from a number of conditions [4, 5, 6, 7, 8, 9, 10] and in a number of clinical settings. [11, 12, 13, 14] Findings of poor outcomes on weekends are not universal, though exceptions occur typically in settings where services and clinical staffing are fairly constant throughout the week, such as intensive care units with on‐site intensivists. [15, 16, 17]
These differences in quality and outcomes suggest that there is a difference in intensity of care over the course of the week. Initiatives to address this important safety issue would be strengthened if a shared metric existed to describe the intensity of care provided at a given time of day or day of the week. However, few measures of global hospital intensity of care exist. The metrics that have been developed are limited by measuring only 1 aspect of care delivery, such as weekend nurse staffing, [18] by requiring extensive chart abstraction, [19] or through reliance on hospital expenses in an older payment model. [20] These measures notably predate contemporary hospital care delivery, which is increasingly dependent on the electronic health record (EHR). To our knowledge, no prior measure of hospital care intensity has been described using the EHR.
Recently, our medical center began an initiative to increase weekend services and staffing to create more uniform availability of care throughout the week. The purpose of this study was to develop a global measure of intensity of care using data derived from the EHR as part of the evaluation of this initiative. [21]
METHODS
We conducted a retrospective analysis of EHR activity for hospital inpatients between January 1, 2011 and December 31, 2011 at New York University Langone Medical Center (NYULMC). During that time period, nearly all inpatient clinical activities at NYULMC were performed and documented through the EHR, Sunrise Clinical Manager (Allscripts, Chicago, IL). These activities include clinical documentation, orders, medication administration, and results of diagnostic tests. Access to the EHR is through Citrix Xenapp Servers (Citrix Systems, Santa Clara, CA), which securely deliver applications from central servers to providers' local terminals.
The primary measure of EHR activity, which we refer to as EHR interactions, was defined as the accessing of a patient's electronic record by a clinician. A provider initiates an interaction by opening a patient's electronic record and concludes it by either opening the record of a different patient or logging out of the EHR. An EHR interaction thus captures a unit of direct patient care, such as documenting a clinical encounter, recording medication administration, or reviewing patient data. Most EHR systems routinely log such interactions to enable compliance departments to audit which users have accessed a patient chart.
The secondary measure of EHR activity was percent central processing unit (CPU), which represents the percent of total available server processing power being used by the Citrix servers at a given time. CPU utilization was averaged over an hour to determine the mean percentage of use for any given hour. As CPU data are not retained for more than 30 days at our institution, we examined CPU usage for the period July 1, 2012 to August 31, 2012.
We evaluated subgroups of EHR interactions by provider type: nurses, resident physicians, attending physicians, pharmacy staff, and all others. We also examined EHR interactions for 2 subgroups of patients: those admitted to the medicine service from the emergency room (ER) and those electively admitted to the surgical service. An elective hospitalization was defined as 1 in which the patient was neither admitted from the ER nor transferred from another hospital. These 2 subgroups were further refined to evaluate EHR interactions among groups of patients admitted during the day, night, weekday, and weeknight. Finally, we examined specific EHR orders that we considered reflective of advancing or altering care, including orders to increase the level of mobilization, to insert or remove a urinary catheter, or to initiate or discontinue antibiotics. As antibiotics are frequently initiated on the day of admission and stopped on the day of discharge, we excluded antibiotic orders that occurred on days of admission or discharge.
Statistical Analysis
EHR interactions were presented as hourly rates by dividing the number of patient chart accessions by the inpatient census for each hour. Hourly census was determined by summing the number of patients who were admitted prior to and discharged after the hour of interest. We calculated the arithmetic means of EHR interactions for each hour and day of the week in 2011. Analysis of variance was used to test differences in EHR interactions among days of the week, and t tests were used to test differences in EHR interactions between Saturday and Sunday, Tuesday and Wednesday, and weekend and weekdays. As a result of multiple comparisons in these analyses, we applied a Bonferroni correction.
EHR interaction rates were assigned to 1 of 3 periods based on a priori suspected peak and trough intensity: day (9:00 am to 4:59 pm ), morning/evening (7:00 am to 8:59 am and 5:00 pm to 7:59 pm ), and night (8:00 pm to 6:59 am ). Negative binomial regression models were used to determine the relative rate of weekday to weekend EHR interactions per patient for the 3 daily time periods. Similar models were developed for EHR interactions by provider types and for specific orders.
We calculated the correlation coefficient between total EHR interactions and occurrence of specific orders, EHR interactions by provider type, EHR interactions by patient subgroups, and CPU. A sensitivity analysis was performed in which EHR interactions were calculated as the number of patient chart accessions per number of daily discharges; this analysis considered the fact that discharges were likely to have high associated intensity but may be less common on weekends as compared to weekdays.
All analyses were performed using Stata 12 (StataCorp, College Station, TX). This study was approved by the institutional review board at NYU School of Medicine.
RESULTS
During the study period, the mean (standard deviation) number of EHR interactions per patient per hour was 2.49 (1.30). EHR interactions differed by hour and day of the week; the lowest number occurred in early morning on weekends, and the highest occurred around 11:00 am on weekdays (Figure 1 ). EHR interactions differed among days of the week at all times ( P <0.001), whereas EHR interactions were similar on most hours of Saturday and Sunday as well as Tuesday and Wednesday. At every hour, weekends had a lower number of EHR interactions in comparison to weekdays ( P <0.001). Weekdays showed a substantial increase in the number of EHR interactions between 8:00 am and 12:00 pm , followed by a slight decrease in activity between 12:00 pm and 2:00 pm , and another increase in activity from 2:00 pm to 5:00 pm (Figure 1 ). Weekend days demonstrated marked blunting of this midday peak in intensity. The tracking of an entire month of hospital EHR interactions produced a detailed graphic picture of hospital activity, clearly demarcating rounding hours, lunch hours, weekend days, hospital holidays, and other landmarks (Figure 2 ). The relative rates of census‐adjusted EHR interactions on weekdays versus weekends were 1.76 (95% confidence interval [CI]: 1.74‐1.77) for day, 1.52 (95% CI: 1.50‐1.55) for morning/evening, and 1.14 (95% CI: 1.12‐1.17) for night hours.
Nurses performed the largest number of EHR interactions (39.7%), followed by resident physicians (15.2%), attending physicians (10.2%), and pharmacists (7.6%). The remainder of EHR interactions were performed by other providers (27.4%), whose role in the majority of cases was undefined in the EHR (see Supporting Table 1 in the online version of this article). Daily variation in EHR interactions differed by provider type (Table 1 ). Nurses and resident physicians showed smaller differences in their EHR interactions between weekend and weekdays and among times of day when compared to attending physicians, pharmacy staff, and other staff. EHR interactions showed similar variations to the overall cohort for both medicine patients admitted from the ER and elective surgery patients (Table 1 ). Specific clinical orders designed to sample particularly meaningful interactions, including urinary catheter insertion and removal, patient mobilization orders, and new antibiotic orders, were moderately correlated with total EHR interactions (Table 2 ). In a sensitivity analysis, the comparison of weekday to weekend EHR interactions per daily discharge was similar to the primary analysis, with relative rates of 1.75 (95% CI: 1.73‐1.77), 1.54 (95% CI: 1.50‐1.57), and 1.15 (95% CI: 1.11‐1.18) for day, morning/evening, and night hours, respectively.
| Hour Group a | |||||||
|---|---|---|---|---|---|---|---|
| Daytime Hours | Morning/Evening Hours | Nighttime Hours | Correlation Coefficient to | ||||
| Rate Ratio | 95% CI | Rate Ratio | 95% CI | Rate Ratio | 95% CI | EHR Interactions | |
| |||||||
| All EHR interactions | 1.76 | 1.74‐1.77 | 1.52 | 1.50‐1.55 | 1.14 | 1.12‐1.17 | 1.00 |
| By provider subgroup | |||||||
| Nurses | 1.35 | 1.34‐1.37 | 1.21 | 1.20‐1.22 | 1.10 | 1.08‐1.12 | 0.92 |
| Residents | 1.38 | 1.36‐1.40 | 1.46 | 1.43‐1.49 | 1.14 | 1.11‐1.18 | 0.90 |
| Attending physicians | 1.70 | 1.67‐1.73 | 2.04 | 1.97‐2.10 | 1.32 | 1.26‐1.39 | 0.96 |
| Pharmacy staff | 1.64 | 1.61‐1.67 | 1.68 | 1.61‐1.75 | 1.19 | 1.15‐1.23 | 0.90 |
| All others | 2.75 | 2.70‐2.79 | 2.08 | 2.002.17 | 1.20 | 1.15‐1.25 | 0.97 |
| By admission subgroup | |||||||
| Medicine ER admissions | |||||||
| All | 1.64 | 1.62‐1.67 | 1.41 | 1.38‐1.44 | 1.07 | 1.04‐1.09 | 0.92 |
| Day admissions | 1.64 | 1.62‐1.67 | 1.41 | 1.38‐1.44 | 1.08 | 1.05‐1.11 | 0.92 |
| Night admissions | 1.65 | 1.62‐1.68 | 1.41 | 1.37‐1.45 | 1.03 | 1.001.05 | 0.88 |
| Weekday admissions | 1.76 | 1.73‐1.79 | 1.56 | 1.52‐1.59 | 1.28 | 1.23‐1.30 | 0.93 |
| Weekend admissions | 1.40 | 1.38‐1.42 | 1.14 | 1.11‐1.17 | 0.70 | 0.68‐0.72 | 0.88 |
| Surgery elective admissions | |||||||
| All | 1.63 | 1.61‐1.65 | 1.53 | 1.50‐1.56 | 1.25 | 1.21‐1.28 | 0.97 |
| Day admissions | 1.62 | 1.60‐1.64 | 1.54 | 1.51‐1.57 | 1.26 | 1.23‐1.30 | 0.96 |
| Night admissions | 1.65 | 1.62‐1.67 | 1.50 | 1.46‐1.54 | 1.22 | 1.18‐1.25 | 0.94 |
| Weekday admissions | 1.64 | 1.62‐1.66 | 1.55 | 1.52‐1.59 | 1.27 | 1.24‐1.31 | 0.96 |
| Weekend admissions | 1.60 | 1.56‐1.65 | 1.26 | 1.21‐1.31 | 0.89 | 0.85‐0.93 | 0.73 |
| Hour Group a | |||||||
|---|---|---|---|---|---|---|---|
| Daytime Hours | Morning/Evening Hours | Nighttime Hours | Correlation Coefficient to | ||||
| Rate Ratio | 95% CI | Rate Ratio | 95% CI | Rate Ratio | 95% CI | EHR Interactions | |
| |||||||
| Urinary catheter | 2.81 | 2.61‐3.02 | 3.17 | 2.85‐3.54 | 1.42 | 1.27‐1.58 | 0.66 |
| Mobilization | 2.51 | 2.39‐2.63 | 2.91 | 2.71‐3.12 | 1.42 | 1.34‐1.52 | 0.70 |
| Antibiotic initiation b | 1.33 | 1.24‐1.42 | 1.65 | 1.47‐1.85 | 1.13 | 1.01‐1.25 | 0.41 |
| Antibiotic discontinue c | 1.74 | 1.63‐1.85 | 1.68 | 1.50‐1.87 | 1.28 | 1.13‐1.45 | 0.61 |
As seen in Figure 3 , CPU usage was well correlated with EHR interactions ( r =0.90) and both metrics were lower on weekends as compared to weekdays. A few outliers of increased CPU usage on weekends were observed; these outliers all occurred on Sundays from 12:00 am to 2:00 am . The information technology (IT) department at our institution confirmed that these outliers coincided with a weekly virus scan performed at that time.
am
and 1:00
am
, which were determined to be outliers related to a weekly virus scan. The correlation coefficient is 0.90.
DISCUSSION
EHR interactions represents a new and accessible measure of hospital care intensity that may be used to track temporal variations in care that are likely to exist in all hospital systems. As the number of hospitals that process and document all clinical activities through the EHR continues to increase, [22, 23] such a measure has the potential to serve as a useful metric in efforts to raise nighttime and weekend care to the same quality as that during weekdays.
We found that EHR interactions differed markedly between days and nights and between weekdays and weekends. A number of prior studies have found temporal variations in clinical outcomes and care. [1, 2, 3, 4, 5, 6, 7, 8, 9, 10, 11, 12, 13, 14] Our study adds to this literature by defining a new measure of the overall intensity of the process of inpatient care. Using this measure, we demonstrate that the increase in midday clinical activity seen during the week is substantially blunted on weekends. This finding adds validity to the designation of both nights and weekends as off hours when examining temporal variations in clinical care. [2, 7]
Other subtle patterns of care delivery emerged throughout the day. For instance, we found a decrease in EHR interactions between 12:00 pm and 2:00 pm , likely representing a small lull in clinical activity during the lunchtime hour, whereas EHR interactions were higher in the night and evening hours than in the early morning. The clinical significance of such fluctuations remains undetermined.
Variation throughout the week differed by provider type. Nurses and resident physicians, who are scheduled around the clock, demonstrated the least fluctuation in EHR interaction intensity over time. Attending physicians and other staff showed the greatest variation in weekday versus weekend care.
We defined a second measure of care intensity based on EHR utilization, which we named CPU usage. The advantage of using CPU as a metric is that it easy to measure and track as it is routinely monitored by hospital IT departments as part of regular maintenance. CPU usage can therefore be easily implemented in any institution with an EHR, whereas measuring EHR interactions requires EHR data abstraction and manipulation. The disadvantage of CPU usage as a measure is that it includes nonclinical reporting and other functions and therefore represents a less specific measure of clinical activity. Nonetheless, at our institution, nearly all clinical activities are processed or documented through the EHR, which is maintained on central servers, and CPU usage was well correlated with EHR interactions. We therefore believe that CPU usage represents a useful indicator of hospital clinical activity at a given time.
Several limitations deserve mention. First, EHR interactions may not always reflect actual patient care or clinical documentation. Nonetheless, we also examined specific patient orders and found that variations in these process measures were similar to those in the EHR interaction measure. Second, our methods were developed and evaluated at a single institution and may not be generalizable. Third, increased intensity of care does not necessarily increase quality of care. For instance, laboratory tests are commonly obtained on a daily basis in the hospital, a practice that is costly and often unnecessary. [24] Weekends have been associated with fewer laboratory tests, which may be appropriate as compared to the more frequent testing observed on weekdays. [25] Finally, we do not ascertain whether variations in EHR interactions correlate with clinical outcomes, and believe this to be an area for further research.
In conclusion, EHR interactions represent a new global process measure of care intensity, which was demonstrated to vary over the course of a week. We intend to use this measure at our institution to track progress of an initiative to ensure a high standard of care throughout the course of the week. The extent to which temporal variations in EHR interactions or reductions in these variations are correlated with clinical outcomes deserves further study. We believe this measure, which can be adapted to other institutions, may have a valuable role to play in hospitals' efforts to eliminate excess morbidity and mortality associated with care delivered during nights and weekends.
- , , , et al. Impact of weekend admissions on quality of care and outcomes in patients with acute myeloid leukemia . Cancer. 2010 ; 116 : 3614 – 3620 .
- , , , et al. Impact of time of presentation on the care and outcomes of acute myocardial infarction . Circulation. 2008 ; 117 : 2502 – 2509 .
- , , , et al. Weekend hospital admission and discharge for heart failure: association with quality of care and clinical outcomes . Am Heart J. 2009 ; 158 : 451 – 458 .
- , , , . Hospital care for patients experiencing weekend vs weekday stroke: a comparison of quality and aggressiveness of care . Arch Neurol. 2010 ; 67 : 39 – 44 .
- , , , , , . Weekend versus weekday admission and mortality from myocardial infarction . N Engl J Med. 2007 ; 356 : 1099 – 1109 .
- . Do hospitals provide lower quality care on weekends? Health Serv Res. 2007 ; 42 : 1589 – 1612 .
- , , , et al. Relationship between time of day, day of week, timeliness of reperfusion, and in‐hospital mortality for patients with acute ST‐segment elevation myocardial infarction . JAMA. 2005 ; 294 : 803 – 812 .
- , , , , , . Weekend versus weekday admission and mortality after acute pulmonary embolism . Circulation. 2009 ; 119 : 962 – 968 .
- , , , , , . Influence of weekend hospital admission on short‐term mortality after intracerebral hemorrhage . Stroke. 2009 ; 40 : 2387 – 2392 .
- , , , et al. Weekend hospital admission, acute kidney injury, and mortality . J Am Soc Nephrol. 2010 ; 21 : 845 – 851 .
- , . Mortality among patients admitted to hospitals on weekends as compared with weekdays . N Engl J Med. 2001 ; 345 : 663 – 668 .
- , , , et al. Mortality after noncardiac surgery: prediction from administrative versus clinical data . Med Care. 2005 ; 43 : 159 – 167 .
- , . Weekend birth and higher neonatal mortality: a problem of patient acuity or quality of care? J Obstet Gynecol Neonatal Nurs. 2003 ; 32 : 724 – 733 .
- , , , , , . Analysis of the mortality of patients admitted to internal medicine wards over the weekend . Am J Med Qual. 2010 ; 25 : 312 – 318 .
- , , , . Do weekends or evenings matter in a pediatric intensive care unit? Pediatr Crit Care Med. 2005 ; 6 : 523 – 530 .
- , , , , . Hospital mortality associated with day and time of admission to intensive care units . Intensive Care Medicine. 2004 ; 30 : 895 – 901 .
- , , . Weekend and weeknight admissions have the same outcome of weekday admissions to an intensive care unit with onsite intensivist coverage . Crit Care Med. 2006 ; 34 : 605 – 611 .
- , , , , . Measuring the intensity of nursing care: making use of the Belgian Nursing Minimum Data Set . Int J Nurs Stud. 2008 ; 45 : 1011 – 1021 .
- , , , , . The relationship between intensity and duration of medical services and outcomes for hospitalized patients . Med Care. 1979 ; 17 : 1088 – 1102 .
- . Differences in length of hospital stay for Medicaid and Blue Cross patients and the effect of intensity of services . Public Health Rep. 1979 ; 94 : 438 – 445 .
- . Health care's lost weekend. New York Times . October 3, 2010 . Section A, p. 27 .
- , , , . A progress report on electronic health records in U.S. hospitals . Health Aff (Millwood). 2010 ; 29 : 1951 – 1957 .
- US Department of Health 146 : 524 – 527 .
- , , . Temporal approach to hematological test usage in a major teaching hospital . Lab Hematol. 2003 ; 9 : 207 – 213 .
Copyright © 2013 Society of Hospital Medicine
saul.blecker@nyumc.org

The Doctor Is In
Hospital work in psychiatry has a long, proud tradition. The severely mentally ill were housed in asylums in the historical past. In fact the origin of the word “bedlam” is derived from the pronunciation of Bethlehem and came to be synonymous with chaos. Bethlehem was the name of an insane asylum in London. Some aspects of current psychiatric hospital care still feel like bedlam.
A typical day for an inpatient psychiatrist involves rounding individually after a team meeting with social workers, nurses, and other members of the treatment team to determine events and observations during the previous 24 hours. The primary reasons for admission to inpatient services are imminent risk to self or others (suicide or homicide), psychotic disorders with inability to function, or severe anxiety or depression with inability to function. Geriatric units often deal with behavioral dyscontrol secondary to dementing illnesses or other neurologic disorders.
PSYCH ADMISSIONS
Practically speaking, the vast majority of admissions result from concerns related to the safety of the patient or others. For inpatient psychiatry the focus is acute stabilization and safety. This focus on stabilization often involves collaborating with outpatient members of the patient’s treatment team, including case managers and outside psychiatrists and therapists. Involving family in obtaining the patient’s collateral history is vital. The goal is to develop a treatment plan to address support, reasons for suicide, access to means for suicide, and treat underlying psychiatric syndromes.
Nonadherence to medication is another primary reason for admission. Patients with bipolar disorder, depression, and schizophrenia often stop taking their medications. Some of this is related to the underlying illness, while some is related to difficulties associated with medication side-effect profiles. Often, psychotic patients may have a fairly dramatic change in control of their symptoms after restarting their previous medications.
PSYCHIATRISTS IN HOSPITALS
Primary hospital work is not uncommon in the United States. A common arrangement is for a single psychiatrist or small group of psychiatrists to primarily manage an inpatient practice and see outpatients in the afternoon, depending on the size of the hospital.
Many psychiatrists lack interest in inpatient work, however. This lack of interest is related to the severity of symptoms, legal interface, call, and challenges with coordinating inpatient care with an outpatient practice.
The advantages of a dedicated psychiatric hospital practice are the same as for other hospitalists: The hospitalist develops both efficiencies and best practices based on seeing severe and complex problems repeatedly. They may also have knowledge of the community resources for the severely ill, which private outpatient psychiatrists may not be familiar with.
Psychiatric hospital work is always interesting and a great opportunity to work with severely ill patients who can be helped dramatically. The treatment is team-focused and offers the chance to work closely with social work, nursing, occupational therapy, psychology, and the community. It also allows for experience working with lawyers and the court system on a regular basis. Additionally, there’s often an opportunity to develop expert witness skills in some settings.
Academically, inpatient work is critical to resident and medical student education. It provides a chance for developing physicians to see and understand the realities and suffering associated with mental illness and their medical basis.
Psychiatric hospital medicine is emotionally intense work. Burnout is a major concern.
Many patients are not in the hospital voluntarily and don’t have insight into their illness. Nonadherence to treatment is common and the factor behind many admissions. Behaviorally, patients may be out of control from psychosis or severe personality disorders. Many have traumatic psychosocial histories and lack social supports. A number face legal charges. The intensity of practice is also due to the pressures of time, shortages of services for the mentally ill as outpatients, and pressures from both managed care and regulatory agencies.
EVOLUTION OF THE SPECIALTY
The state of hospital psychiatry has changed greatly in the past 40 or 50 years. The introduction of the antipsychotics solely for schizophrenia means we can now treat those previously thought untreatable. With the discovery and application of other treatments for mental illness, a movement developed to end the institutionalization of the mentally ill and integrate them back into the community. Other societal forces include the patient rights movement that has led to changes in the law and a needed focus on the rights of the mentally ill—both for minimums of treatment provided and protection against unnecessary hospitalization. State and federal budgetary and managed care pressures have also contributed to the remarkable changes in hospital psychiatry.
This combination of changes from medical, legal, societal, and fiscal forces has slashed the number of available inpatient beds and lengths of stays. In 1970 there were 413,066 state and county psychiatric inpatient beds in the United States.1 By 2000 that number had decreased to 59,403. There has been a moderate increase in private and community psychiatric beds in response. However, even considering this increase, the total number of beds in 1970 was
524,878 and the total in 2000 was 215,221. There have been continued reductions in beds since then nationally. Along with this decrease in psychiatric beds has come a dramatic shift in average length of stay as well. The general average length of stay in the United States is less than one week for psychiatric hospitalization.
The hope with decreasing the number of beds has been that a focus on community-based treatment and programs to support those with severe mental illness would be available to meet the needs of the severely mentally ill. Unfortunately, though the intent and goals were laudable, those programs have not developed as hoped. Current challenges for the seriously mentally ill include lack of parity for mental illness for insurance, continued pressure on private psychiatric beds to fill in the gaps of services not met by the community along with continued cuts in state and federal funding for inpatient psychiatric care.
This decrease in beds combined with decreased average length of stay and an increase in population has led to more and more pressure on the limited psychiatric beds available. It’s not uncommon now for patients to remain in the emergency department for 24 hours or longer waiting for a psychiatric bed. Along with these pressures has come decreased availability of inpatient substance abuse treatment, the ubiquitous comorbidity. Managed care review of inpatient stays on an almost daily basis, and the ever-increasing demands of documentation to meet regulatory requirements have also increased pressures on hospital psychiatry.
TYPES OF PSYCH HOSPITALIST PROGRAMS
As a result of the trends mentioned above, a variety of psychiatric hospitalist practice settings now exist. They include private and community psychiatric hospitals, academic center hospitals, state hospitals, Veterans Affairs and military hospitals, and—the most rapidly growing sector—correctional psychiatry in state and federal prison systems.
Correctional settings, such as jails and prisons, have been estimated by the Bureau of Justice Statistics to have a prevalence of inmates with mental illness between 7% and 16%.2 The rate of mental illness in inmates is approximately two to three times that of the general population for major mental illnesses such as schizophrenia, bipolar disorder, and major depressive disorder. The mentally ill in prison are more likely to be homeless, medically ill, and chemically dependent than the general population, as well.
Mentally ill inmates serve longer prison sentences on average than their mentally healthy peers. Mentally ill inmates are involved more commonly in disciplinary problems in prison also.
Overall, approximately 60% of mentally ill inmates receive some sort of mental health treatment while in custody. Two-thirds of inmates receiving treatment are in facilities that do not specialize in mental health treatment. Of state prisons, 155 specialize in mental health treatment—out of more than 1,500 facilities surveyed.3 Twelve facilities have mental health treatment as their primary function. Fewer than 2% of state inmates were housed in a mental health unit providing 24-hour care.
Psychiatric hospitalists in specialized treatment correctional settings have the opportunity to perform assessments and provide treatment to a patient population with a prevalence and severity of psychopathology that is not commonly seen in community psychiatric inpatient or outpatient practice today.
CRYSTAL BALL
Inpatient psychiatry will continue to be important in the future. There are great challenges ahead but the need for dedicated hospital psychiatrists won’t go away and will probably increase. The pressures on the shrinking number of inpatient beds will continue to grow. The lack of outpatient services in general and intensive outpatient services available to transition patients to on discharge is frustrating. The continued de-emphasis on availability of substance abuse treatment continues to perplex. TH
Dr. Lineberry is medical director, Psychiatric Acute Care Program, Mayo Psychiatry and Psychology Treatment Center, St. Mary’s Hospital, Rochester, Minn. Dr. Shine is senior associate consultant, Psychiatric Acute Care Program, Mayo Psychiatry and Psychology Treatment Center, St. Mary’s Hospital, Rochester, Minn.
REFERENCES
- Manderscheid RW, Atay JE, Hernandez-Cartagena MR, et al. Substance Abuse and Mental Health Services Administration, Center for Mental Health Services, U.S. Department of Health and Human Services. Mental Health, United States, 2002. Chapter 18. Highlights of organized mental health services in 2000 and major national and state trends. Available at www.mentalhealth.org/publications/allpubs/SMA04-3938/. Last accessed July 29, 2005.
- Bureau of Justice Statistics, Department of Justice. Mental health and treatment of inmates and probationers. Available at www.ojp.usdoj.gov/bjs/pub/pdf/mhtip.pdf. Last accessed July 29, 2005.
- Bureau of Justice Statistics, Department of Justice. Mental health treatment in state prisons. Available at www.ojp.usdoj.gov/bjs/pub/pdf/mhtsp00.pdf. Last accessed July 29, 2005.