User login
Patients' Sleep Quality and Duration
Approximately 70 million adults within the United States have sleep disorders,[1] and up to 30% of adults report sleeping less than 6 hours per night.[2] Poor sleep has been associated with undesirable health outcomes.[1] Suboptimal sleep duration and sleep quality has been associated with a higher prevalence of chronic health conditions including hypertension, type 2 diabetes, coronary artery disease, stroke, and obesity, as well as increased overall mortality.[3, 4, 5, 6, 7]
Sleep plays an important role in restoration of wellness. Poor sleep is associated with physiological disturbances that may result in poor healing.[8, 9, 10] In the literature, prevalence of insomnia among elderly hospitalized patients was 36.7%,[11] whereas in younger hospitalized patients it was 50%.[12] Hospitalized patients frequently cite their acute illness, hospital‐related environmental factors, and disruptions that are part of routine care as causes for poor sleep during hospitalization.[13, 14, 15] Although the pervasiveness of poor sleep among hospitalized patients is high, interventions that prioritize sleep optimization as routine care, are uncommon. Few studies have reviewed the effect of sleep‐promoting measures on both sleep quality and sleep duration among patients hospitalized on general medicine units.
In this study, we aimed to assess the feasibility of incorporating sleep‐promoting interventions on a general medicine unit. We sought to identify differences in sleep measures between intervention and control groups. The primary outcome that we hoped to influence and lengthen in the intervention group was sleep duration. This outcome was measured both by sleep diary and with actigraphy. Secondary outcomes that we hypothesized should improve in the intervention group included feeling more refreshed in the mornings, sleep efficiency, and fewer sleep disruptions. As a feasibility pilot, we also wanted to explore the ease or difficulty with which sleep‐promoting interventions could be incorporated to the team's workflow.
METHODS
Study Design
A quasi‐experimental prospective pilot study was conducted at a single academic center, the Johns Hopkins Bayview Medical Center. Participants included adult patients admitted to the general medicine ward from July 2013 through January 2014. Patients with dementia; inability to complete survey questionnaires due to delirium, disability, or a language barrier; active withdrawal from alcohol or controlled substances; or acute psychiatric illness were excluded in this study.
The medicine ward at our medical center is comprised of 2 structurally identical units that admit patients with similar diagnoses, disease severity, and case‐mix disease groups. Nursing and support staff are unit specific. Pertaining to the sleep environment, the units both have semiprivate and private rooms. Visitors are encouraged to leave by 10 pm. Patients admitted from the emergency room to the medicine ward are assigned haphazardly to either unit based on bed availability. For the purpose of this study, we selected 1 unit to be a control unit and identified the other as the sleep‐promoting intervention unit.
Study Procedure
Upon arrival to the medicine unit, the research team approached all patients who met study eligibility criteria for study participation. Patients were provided full disclosure of the study using institutional research guidelines, and those interested in participating were consented. Participants were not explicitly told about their group assignment. This study was approved by the Johns Hopkins Institutional Review Board for human subject research.
In this study, the control group participants received standard of care as it pertains to sleep promotion. No additional sleep‐promoting measures were implemented to routine medical care, medication administration, nursing care, and overnight monitoring. Patients who used sleep medications at home, prior to admission, had those medicines continued only if they requested them and they were not contraindicated given their acute illness. Participants on the intervention unit were exposed to a nurse‐delivered sleep‐promoting protocol aimed at transforming the culture of care such that helping patients to sleep soundly was made a top priority. Environmental changes included unit‐wide efforts to minimize light and noise disturbances by dimming hallway lights, turning off room lights, and encouraging care teams to be as quiet as possible. Other strategies focused largely on minimizing care‐related disruptions. These included, when appropriate, administering nighttime medications in the early evening, minimizing fluids overnight, and closing patient room doors where appropriate. Further, patients were offered the following sleep‐promoting items to choose from: ear plugs, eye masks, warm blankets, and relaxation music. The final component of our intervention was 30‐minute sleep hygiene education taught by a physician. It highlighted basic sleep physiology and healthy sleep behavior adapted from Buysse.[16] Patients learned the role of behaviors such as reducing time lying awake in bed, setting standard wake‐up time and sleep time, and going to bed only when sleepy. This behavioral education was supplemented by a handout with sleep‐promoting suggestions.
The care team on the intervention unit received comprehensive study‐focused training in which night nursing teams were familiarized with the sleep‐promoting protocol through in‐service sessions facilitated by 1 of the authors (E.W.G.). To further promote study implementation, sleep‐promoting procedures were supported and encouraged by supervising nurses who made daily reminders to the intervention unit night care team of the goals of the sleep‐promoting study during evening huddles performed at the beginning of each shift. To assess the adherence of the sleep protocol, the nursing staff completed a daily checklist of elements within the protocol that were employed .
Data Collection and Measures
Baseline Measures
At the time of enrollment, study patients' demographic information, including use of chronic sleep medication prior to admission, was collected. Participants were assessed for baseline sleep disturbance prior to admission using standardized, validated sleep assessment tools: Pittsburgh Sleep Quality Index (PSQI), the Insomnia Severity Index (ISI), and the Epworth Sleepiness Scale (ESS). PSQI, a 19‐item tool, assessed self‐rated sleep quality measured over the prior month; a score of 5 or greater indicated poor sleep.[17] ISI, a 7‐item tool, identified the presence, rated the severity, and described the impact of insomnia; a score of 10 or greater indicated insomnia.[18] ESS, an 8‐item self‐rated tool, evaluated the impact of perceived sleepiness on daily functioning in 8 different environments; a score of 9 or greater was linked to burden of sleepiness. Participants were also screened for both obstructive sleep apnea (using the Berlin Sleep Apnea Index) and clinical depression (using Center for Epidemiologic Studies‐Depression 10‐point scale), as these conditions affect sleep patterns. These data are shown in Table 1.
| Intervention, n = 48 | Control, n = 64 | P Value | |
|---|---|---|---|
| |||
| Age, y, mean (SD) | 58.2 (16) | 56.9 (17) | 0.69 |
| Female, n (%) | 26 (54.2) | 36 (56.3) | 0.83 |
| Race, n (%) | |||
| Caucasian | 33 (68.8) | 46 (71.9) | 0.92 |
| African American | 13 (27.1) | 16 (25.0) | |
| Other | 2 (4.2) | 2 (3.1) | |
| BMI, mean (SD) | 32.1 (9.2) | 31.8 (9.3) | 0.85 |
| Admitting service, n (%) | |||
| Teaching | 21 (43.8) | 18 (28.1) | 0.09 |
| Nonteaching | 27 (56.3) | 46 (71.9) | |
| Sleep medication prior to admission, n (%) | 7 (14.9) | 21 (32.8) | 0.03 |
| Length of stay, d, mean (SD) | 4.9 (3) | 5.8 (3.9) | 0.19 |
| Number of sleep diaries per participant, mean (SD) | 2.2 (0.8) | 2.6 (0.9) | 0.02 |
| Proportion of hospital days with sleep diaries per participant, (SD) | 0.6 (0.2) | 0.5 (0.2) | 0.71 |
| Number of nights with actigraphy per participant, mean (SD) | 1.2 (0.7) | 1.4 (0.8) | 0.16 |
| Proportion of hospital nights with actigraphy per participant (SD) | 0.3 (0.2) | 0.3 (0.1) | 0.91 |
| Baseline sleep measures | |||
| PSQI, mean (SD) | 9.9 (4.6) | 9.1 (4.5) | 0.39 |
| ESS, mean (SD) | 7.4 (4.2) | 7.7 (4.8) | 0.79 |
| ISI, mean (SD) | 11.9 (7.6) | 10.8 (7.4) | 0.44 |
| CESD‐10, mean (SD) | 12.2 (7.2) | 12.8 (7.6) | 0.69 |
| Berlin Sleep Apnea, mean (SD) | 0.63 (0.5) | 0.61 (0.5) | 0.87 |
Sleep Diary Measures
A sleep diary completed each morning assessed the outcome measures, perceived sleep quality, how refreshing sleep was, and sleep durations. The diary employed a 5‐point Likert rating scale ranging from poor (1) to excellent (5). Perceived sleep duration was calculated from patients' reported time in bed, time to fall asleep, wake time, and number and duration of awakenings after sleep onset on their sleep diary. These data were used to compute total sleep time (TST) and sleep efficiency (SE). The sleep diary also included other pertinent sleep‐related measures including use of sleep medication the night prior and specific sleep disruptions from the prior night. To measure the impact of disruptions due to disturbances the prior night, we created a summed scale score of 4 items that negatively interfered with sleep (light, temperature, noise, and interruptions; 5 point scales from 1 = not at all to 5 = significant). Analysis of principal axis factors with varimax rotation yielded 1 disruption factor accounting for 55% of the variance, and Cronbach's was 0.73.
Actigraphy Measures
Actigraphy outcomes of sleep were recorded using the actigraphy wrist watch (ActiSleep Plus (GT3X+); ActiGraph, Pensacola, FL). Participants wore the monitor from the day of enrollment throughout the hospital stay or until transfer out of the unit. Objective data were analyzed and scored using ActiLife 6 data analysis software (version 6.10.1; Actigraph). Time in bed, given the unique inpatient setting, was calculated using sleep diary responses as the interval between sleep time and reported wake up time. These were entered into the Actilife 6 software for the sleep scoring analysis using a validated algorithm, Cole‐Kripke, to calculate actigraphy TST and SE.
Statistical Analysis
Descriptive and inferential statistics were computed using Statistical Package for the Social Sciences version 22 (IBM, Armonk, NY). We computed means, proportions, and measures of dispersion for all study variables. To test differences in sleep diary and actigraphy outcomes between the intervention and control arms, we used linear mixed models with full maximum likelihood estimation to model each of the 7 continuous sleep outcomes. These statistical methods are appropriate to account for the nonindependence of continuous repeated observations within hospital patients.[19] For all outcomes, the unit of analysis was nightly observations nested within patient‐ level characteristics. The use of full maximum likelihood estimation is a robust and preferred method for handling values missing at random in longitudinal datasets.[20]
To model repeated observations, mixed models included a term representing time in days. For each outcome, we specified unconditional growth models to examine the variability between and within patients by computing intraclass correlations and inspecting variance components. We used model fit indices (‐2LL deviance, Akaike's information criterion, and Schwartz's Bayesian criterion) as appropriate to determine best fitting model specifications in terms of random effects and covariance structure.[21, 22]
We tested the main effect of the intervention on sleep outcomes and the interactive effect of group (intervention vs control) by hospital day, to test whether there were group differences in slopes representing average change in sleep outcomes over hospital days. All models adjusted for age, body mass index, depression, and baseline sleep quality (PSQI) as time‐invariant covariates, and whether participants had taken a sleep medication the day before, as a time‐varying covariate. Adjustment for prehospitalization sleep quality was a matter of particular importance. We used the PSQI to control for sleep quality because it is both a well‐validated, multidimensional measure, and it includes prehospital use of sleep medications. In a series of sensitivity analyses, we also explored whether the dichotomous self‐reported measure of whether or not participants regularly took sleep medications prior to hospitalization, rather than the PSQI, would change our substantive findings. All covariates were centered at the grand‐mean following guidelines for appropriate interpretation of regression coefficients.[23]
RESULTS
Of the 112 study patients, 48 were in the intervention unit and 64 in the control unit. Eighty‐five percent of study participants endorsed poor sleep prior to hospital admission on the PSQI sleep quality measure, which was similar in both groups (Table 1).
Participants completed 1 to 8 sleep diary entries (mean = 2.5, standard deviation = 1.1). Because only 6 participants completed 5 or more diaries, we constrained the number of diaries included in the inferential analysis to 4 to avoid influential outliers identified by scatterplots. Fifty‐seven percent of participants had 1 night of valid actigraphy data (n = 64); 29%, 2 nights (n = 32), 8% had 3 or 4 nights, and 9 participants did not have any usable actigraphy data. The extent to which the intervention was accepted by patients in the intervention group was highly variable. Unit‐wide patient adherence with the 10 pm lights off, telephone off, and TV off policy was 87%, 67%, and 64% of intervention patients, respectively. Uptake of sleep menu items was also highly variable, and not a single element was used by more than half of patients (acceptance rates ranged from 11% to 44%). Eye masks (44%) and ear plugs (32%) were the most commonly utilized items.
A greater proportion of patients in the control arm (33%) had been taking sleep medications prior to hospitalization compared to the intervention arm (15%; 2 = 4.6, P < 0.05). However, hypnotic medication use in the hospital was similar across the both groups (intervention unit patients: 25% and controls: 21%, P = 0.49).
Intraclass correlations for the 7 sleep outcomes ranged from 0.59 to 0.76 on sleep diary outcomes, and from 0.61 to 0.85 on actigraphy. Dependency of sleep measures within patients accounted for 59% to 85% of variance in sleep outcomes. The best‐fit mixed models included random intercepts only. The results of mixed models testing the main effect of intervention versus comparison arm on sleep outcome measures, adjusted for covariates, are presented in Table 2. Total sleep time was the only outcome that was significantly different between groups; the average total sleep time, calculated from sleep diary data, was longer in the intervention group by 49 minutes.
| Intervention, n = 48 | Control, n = 64 | P Value | |
|---|---|---|---|
| |||
| Sleep diary outcomes | |||
| Sleep quality, mean (SE) | 3.14 (0.16) | 3.08 (0.13) | 0.79 |
| Refreshed sleep, mean (SE) | 2.94 (0.17) | 2.74 (0.14) | 0.38 |
| Negative impact of sleep disruptions, mean (SE) | 4.39 (0.58) | 4.81 (0.48) | 0.58 |
| Total sleep time, min, mean (SE) | 422 (16.2) | 373 (13.2) | 0.02 |
| Sleep efficiency, %, mean (SE) | 83.5 (2.3) | 82.1 (1.9) | 0.65 |
| Actigraphy outcomes | |||
| Total sleep time, min, mean (SE) | 377 (16.8) | 356 (13.2) | 0.32 |
| Sleep efficiency, %, mean (SE) | 72.7 (2.2) | 74.8 (1.8) | 0.45 |
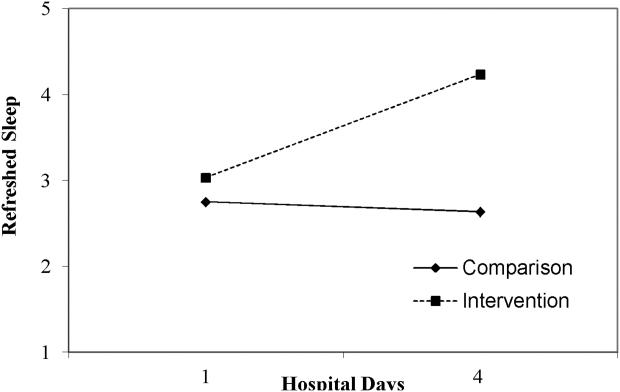
Table 3 lists slopes representing average change in sleep measures over hospital days in both groups. The P values represent z tests of interaction terms in mixed models, after adjustment for covariates, testing whether slopes significantly differed between groups. Of the 7 outcomes, 3 sleep diary measures had significant interaction terms. For ratings of sleep quality, refreshing sleep, and sleep disruptions, slopes in the control group were flat, whereas slopes in the intervention group demonstrated improvements in ratings of sleep quality and refreshed sleep, and a decrease in the impact of sleep disruptions over the course of subsequent nights in the hospital. Figure 1 illustrates a plot of the adjusted average slopes for the refreshed sleep score across hospital days in intervention and control groups.
| Intervention, Slope (SE), n = 48 | Control, Slope (SE), n = 64 | P Value | |
|---|---|---|---|
| |||
| Refreshed sleep rating | 0.55 (0.18) | 0.03 (0.13) | 0.006 |
| Sleep quality rating | 0.52 (0.16) | 0.02 (0.11) | 0.012 |
| Negative impact of sleep interruptions | 1.65 (0.48) | 0.05 (0.32) | 0.006 |
| Total sleep time, diary | 11.2 (18.1) | 6.3 (13.0) | 0.44 |
| Total sleep time, actigraphy | 7.3 (25.5) | 1.0 (15.3) | 0.83 |
| Sleep efficiency, diary | 1.1 (2.3) | 1.5 (1.6) | 0.89 |
| Sleep efficiency, actigraphy | 0.9 (4.0) | 0.7 (2.4) | 0.74 |
DISCUSSION
Poor sleep is common among hospitalized adults, both at home prior to the admission and especially when in the hospital. This pilot study demonstrated the feasibility of rolling out a sleep‐promoting intervention on a hospital's general medicine unit. Although participants on the intervention unit reported improved sleep quality and feeling more refreshed, this was not supported by actigraphy data (such as sleep time or sleep efficiency). Although care team engagement and implementation of unit‐wide interventions were high, patient use of individual components was imperfect. Of particular interest, however, the intervention group actually began to have improved sleep quality and fewer disruptions with subsequent nights sleeping in the hospital.
Our findings of the high prevalence of poor sleep among hospitalized patients is congruent with prior studies and supports the great need to screen for and address poor sleep within the hospital setting.[24, 25, 26] Attempts to promote sleep among hospitalized patients may be effective. Prior literature on sleep‐promoting intervention studies demonstrated relaxation techniques improved sleep quality by almost 38%,[27] and ear plugs and eye masks showed some benefit in promoting sleep within the hospital.[28] Our study's multicomponent intervention that attempted to minimize disruptions led to improvement in sleep quality, more restorative sleep, and decreased report of sleep disruptions, especially among patients who had a longer length of stay. As suggested by Thomas et al.[29] and seen in our data, this temporal relationship with improvement across subsequent nights suggests there may be an adaptation to the new environment and that it may take time for the sleep intervention to work.
Hospitalized patients often fail to reclaim the much‐needed restorative sleep at the time when they are most vulnerable. Patients cite routine care as the primary cause of sleep disruption, and often recognize the way that the hospital environment interferes with their ability to sleep.[30, 31, 32] The sleep‐promoting interventions used in our study would be characterized by most as low effort[33] and a potential for high yield, even though our patients only appreciated modest improvements in sleep outcomes.
Several limitations of this study should be considered. First, although we had hoped to collect substantial amounts of objective data, the average time of actigraphy observation was less than 48 hours. This may have constrained the group by time interaction analysis with actigraphy data, as studies have shown increased accuracy in actigraphy measures with longer wear.[34] By contrast, the sleep diary survey collected throughout hospitalization yielded significant improvements in consecutive daily measurements. Second, the proximity of the study units raised concern for study contamination, which could have reduced the differences in the outcome measures that may have been observed. Although the physicians work on both units, the nursing and support care teams are distinct and unit dependent. Finally, this was not a randomized trial. Patient assignment to the treatment arms was haphazard and occurred within the hospital's admitting strategy. Allocation of patients to either the intervention or the control group was based on bed availability at the time of admission. Although both groups were similar in most characteristics, more of the control participants reported taking more sleep medications prior to admission as compared to the intervention participants. Fortunately, hypnotic use was not different between groups during the admission, the time when sleep data were being captured.
Overall, this pilot study suggests that patients admitted to general medical ward fail to realize sufficient restorative sleep when they are in the hospital. Sleep disruption is rather frequent. This study demonstrates the opportunity for and feasibility of sleep‐promoting interventions where facilitating sleep is considered to be a top priority and vital component of the healthcare delivery. When trying to improve patients' sleep in the hospital, it may take several consecutive nights to realize a return on investment.
Acknowledgements
The authors acknowledge the Department of Nursing, Johns Hopkins Bayview Medical Center, and care teams of the Zieve Medicine Units, and the Center for Child and Community Health Research Biostatistics, Epidemiology and Data Management (BEAD) Core group.
Disclosures: Dr. Wright is a Miller‐Coulson Family Scholar and is supported through the Johns Hopkins Center for Innovative Medicine. Dr. Howell is the chief of the Division of Hospital Medicine at Johns Hopkins Bayview Medical Center and associate professor at Johns Hopkins School of Medicine. He served as the president of the Society of Hospital Medicine (SHM) in 2013 and currently serves as a board member. He is also a senior physician advisor for SHM. He is a coinvestigator grant recipient on an Agency for Healthcare Research and Quality grant on medication reconciliation funded through Baylor University. He was previously a coinvestigator grant recipient of Center for Medicare and Medicaid Innovations grant that ended in June 2015.
- Institute of Medicine (US) Committee on Sleep Medicine and Research. Sleep disorders and sleep deprivation: an unmet public health problem. Washington, DC: National Academies Press; 2006. Available at: http://www.ncbi.nlm.nih.gov/books/NBK19960. Accessed September 16, 2014.
- , . Health behaviors of adults: United States, 2005–2007. Vital Health Stat 10. 2010;245:1–132.
- , , . High incidence of diabetes in men with sleep complaints or short sleep duration: a 12‐year follow‐up study of a middle‐aged population. Diabetes Care. 2005;28:2762–2767.
- , , , et al. Linking sleep duration and obesity among black and white US adults. Clin Pract (Lond). 2013;10(5):661–667.
- , , , et al. Gender‐specific associations of short sleep duration with prevalent and incident hypertension: the Whitehall II Study. Hypertension. 2007;50:693–700.
- , , , , , . The joint effect of sleep duration and disturbed sleep on cause‐specific mortality: results from the Whitehall II cohort study. PLoS One. 2014;9(4):e91965.
- , , , , , . Poor self‐reported sleep quality predicts mortality within one year of inpatient post‐acute rehabilitation among older adults. Sleep. 2011;34(12):1715–1721.
- , , , , . The effects of sleep deprivation on symptoms of psychopathology in healthy adults. Sleep Med. 2007;8(3):215–221.
- , , , , . Sleep deprivation and activation of morning levels of cellular and genomic markers of inflammation. Arch Intern Med. 2006;166:1756–1762.
- , , , . The metabolic consequences of sleep deprivation. Sleep Med Rev. 2007;11(3):163–178.
- , , , et al. Insomnia among hospitalized elderly patients: prevalence, clinical characteristics and risk factors. Arch Gerontol Geriatr. 2011;52:133–137.
- , , , et al. Is insomnia a marker for psychiatric disorders in general hospitals? Sleep Med. 2005;6:549–553.
- , , , , , . Perceived control and sleep in hospitalized older adults: a sound hypothesis? J Hosp Med. 2013;8:184–190.
- , , , et al. Sleep disruption due to hospital noises: a prospective evaluation. Ann Intern Med. 2012;157:170–179.
- . Sleep in acute care settings: an integrative review. J Nurs Scholarsh. 2000;32(1):31–38.
- . Physical health as it relates to insomnia. Talk presented at: Center for Behavior and Health, Lecture Series in Johns Hopkins Bayview Medical Center; July 17, 2012; Baltimore, MD.
- , , , , . The Pittsburgh Sleep Quality Index: a new instrument for psychiatric practice and research. Psychiatry Res. 1989;28:193–213.
- , . Measures of sleep: The Insomnia Severity Index, Medical Outcomes Study (MOS) Sleep Scale, Pittsburgh Sleep Diary (PSD), and Pittsburgh Sleep Quality Index (PSQI). Arthritis Rheumatol. 2003;49:S184–S196.
- , . Applied Mixed Models in Medicine. 3rd ed. Somerset, NJ: Wiley; 2014:539.
- , , , Applying mixed regression models to the analysis of repeated‐measures data in psychosomatic medicine. Psychosom Med. 2006;68(6):870–878.
- , . Using the SPSS mixed procedure to fit cross‐sectional and longitudinal multilevel models. Educ Psychol Meas. 2005;65(5):717–741.
- , . Introduction to estimation issues in multilevel modeling. New Dir Inst Res. 2012;2012(154):23–39.
- , . Centering predictor variables in cross‐sectional multilevel models: a new look at an old issue. Psychol Methods. 2007;12(2):121–138.
- , . Sleep quality in adult hospitalized patients with infection: an observational study. Am J Med Sci. 2015;349(1):56–60.
- , , , et al. Risk of sleep apnea in hospitalized older patients. J Clin Sleep Med. 2014;10:1061–1066.
- , , . Hospital ward policy and patients' sleep patterns: a multiple baseline study. Rehabil Psychol. 1989;34(1):43–50.
- , , . Non‐pharmacologic interventions to improve the sleep of hospitalized patients: a systematic review. J Gen Intern Med. 2014;29:788–795.
- , , , , , Earplugs and eye masks vs routine care prevent sleep impairment in post‐anaesthesia care unit: a randomized study. Br J Anaesth. 2014;112(1):89–95.
- , , , et al. Sleep rounds: a multidisciplinary approach to optimize sleep quality and satisfaction in hospitalized patients. J Hosp Med. 2012;7:508–512.
- , , , , . Factors affecting sleep quality of patients in intensive care unit. J Clin Sleep Med. 2012;8(3):301–307.
- . Insomnia among hospitalized older persons. Clin Geriatr Med. 2008;24(1):51–67.
- , , , . A nonpharmacological sleep protocol for hospitalized older patients. J Am Geriatr Soc. 1998;46(6):700–705.
- The Action Priority Matrix: making the most of your opportunities. TimeAnalyzer website. Available at: http://www.timeanalyzer.com/lib/priority.htm. Published 2006. Accessed July 10, 2015.
- , , , et al. Measuring sleep: accuracy, sensitivity, and specificity of wrist actigraphy compared to polysomnography. Sleep. 2013;36(11):1747–1755.
Approximately 70 million adults within the United States have sleep disorders,[1] and up to 30% of adults report sleeping less than 6 hours per night.[2] Poor sleep has been associated with undesirable health outcomes.[1] Suboptimal sleep duration and sleep quality has been associated with a higher prevalence of chronic health conditions including hypertension, type 2 diabetes, coronary artery disease, stroke, and obesity, as well as increased overall mortality.[3, 4, 5, 6, 7]
Sleep plays an important role in restoration of wellness. Poor sleep is associated with physiological disturbances that may result in poor healing.[8, 9, 10] In the literature, prevalence of insomnia among elderly hospitalized patients was 36.7%,[11] whereas in younger hospitalized patients it was 50%.[12] Hospitalized patients frequently cite their acute illness, hospital‐related environmental factors, and disruptions that are part of routine care as causes for poor sleep during hospitalization.[13, 14, 15] Although the pervasiveness of poor sleep among hospitalized patients is high, interventions that prioritize sleep optimization as routine care, are uncommon. Few studies have reviewed the effect of sleep‐promoting measures on both sleep quality and sleep duration among patients hospitalized on general medicine units.
In this study, we aimed to assess the feasibility of incorporating sleep‐promoting interventions on a general medicine unit. We sought to identify differences in sleep measures between intervention and control groups. The primary outcome that we hoped to influence and lengthen in the intervention group was sleep duration. This outcome was measured both by sleep diary and with actigraphy. Secondary outcomes that we hypothesized should improve in the intervention group included feeling more refreshed in the mornings, sleep efficiency, and fewer sleep disruptions. As a feasibility pilot, we also wanted to explore the ease or difficulty with which sleep‐promoting interventions could be incorporated to the team's workflow.
METHODS
Study Design
A quasi‐experimental prospective pilot study was conducted at a single academic center, the Johns Hopkins Bayview Medical Center. Participants included adult patients admitted to the general medicine ward from July 2013 through January 2014. Patients with dementia; inability to complete survey questionnaires due to delirium, disability, or a language barrier; active withdrawal from alcohol or controlled substances; or acute psychiatric illness were excluded in this study.
The medicine ward at our medical center is comprised of 2 structurally identical units that admit patients with similar diagnoses, disease severity, and case‐mix disease groups. Nursing and support staff are unit specific. Pertaining to the sleep environment, the units both have semiprivate and private rooms. Visitors are encouraged to leave by 10 pm. Patients admitted from the emergency room to the medicine ward are assigned haphazardly to either unit based on bed availability. For the purpose of this study, we selected 1 unit to be a control unit and identified the other as the sleep‐promoting intervention unit.
Study Procedure
Upon arrival to the medicine unit, the research team approached all patients who met study eligibility criteria for study participation. Patients were provided full disclosure of the study using institutional research guidelines, and those interested in participating were consented. Participants were not explicitly told about their group assignment. This study was approved by the Johns Hopkins Institutional Review Board for human subject research.
In this study, the control group participants received standard of care as it pertains to sleep promotion. No additional sleep‐promoting measures were implemented to routine medical care, medication administration, nursing care, and overnight monitoring. Patients who used sleep medications at home, prior to admission, had those medicines continued only if they requested them and they were not contraindicated given their acute illness. Participants on the intervention unit were exposed to a nurse‐delivered sleep‐promoting protocol aimed at transforming the culture of care such that helping patients to sleep soundly was made a top priority. Environmental changes included unit‐wide efforts to minimize light and noise disturbances by dimming hallway lights, turning off room lights, and encouraging care teams to be as quiet as possible. Other strategies focused largely on minimizing care‐related disruptions. These included, when appropriate, administering nighttime medications in the early evening, minimizing fluids overnight, and closing patient room doors where appropriate. Further, patients were offered the following sleep‐promoting items to choose from: ear plugs, eye masks, warm blankets, and relaxation music. The final component of our intervention was 30‐minute sleep hygiene education taught by a physician. It highlighted basic sleep physiology and healthy sleep behavior adapted from Buysse.[16] Patients learned the role of behaviors such as reducing time lying awake in bed, setting standard wake‐up time and sleep time, and going to bed only when sleepy. This behavioral education was supplemented by a handout with sleep‐promoting suggestions.
The care team on the intervention unit received comprehensive study‐focused training in which night nursing teams were familiarized with the sleep‐promoting protocol through in‐service sessions facilitated by 1 of the authors (E.W.G.). To further promote study implementation, sleep‐promoting procedures were supported and encouraged by supervising nurses who made daily reminders to the intervention unit night care team of the goals of the sleep‐promoting study during evening huddles performed at the beginning of each shift. To assess the adherence of the sleep protocol, the nursing staff completed a daily checklist of elements within the protocol that were employed .
Data Collection and Measures
Baseline Measures
At the time of enrollment, study patients' demographic information, including use of chronic sleep medication prior to admission, was collected. Participants were assessed for baseline sleep disturbance prior to admission using standardized, validated sleep assessment tools: Pittsburgh Sleep Quality Index (PSQI), the Insomnia Severity Index (ISI), and the Epworth Sleepiness Scale (ESS). PSQI, a 19‐item tool, assessed self‐rated sleep quality measured over the prior month; a score of 5 or greater indicated poor sleep.[17] ISI, a 7‐item tool, identified the presence, rated the severity, and described the impact of insomnia; a score of 10 or greater indicated insomnia.[18] ESS, an 8‐item self‐rated tool, evaluated the impact of perceived sleepiness on daily functioning in 8 different environments; a score of 9 or greater was linked to burden of sleepiness. Participants were also screened for both obstructive sleep apnea (using the Berlin Sleep Apnea Index) and clinical depression (using Center for Epidemiologic Studies‐Depression 10‐point scale), as these conditions affect sleep patterns. These data are shown in Table 1.
| Intervention, n = 48 | Control, n = 64 | P Value | |
|---|---|---|---|
| |||
| Age, y, mean (SD) | 58.2 (16) | 56.9 (17) | 0.69 |
| Female, n (%) | 26 (54.2) | 36 (56.3) | 0.83 |
| Race, n (%) | |||
| Caucasian | 33 (68.8) | 46 (71.9) | 0.92 |
| African American | 13 (27.1) | 16 (25.0) | |
| Other | 2 (4.2) | 2 (3.1) | |
| BMI, mean (SD) | 32.1 (9.2) | 31.8 (9.3) | 0.85 |
| Admitting service, n (%) | |||
| Teaching | 21 (43.8) | 18 (28.1) | 0.09 |
| Nonteaching | 27 (56.3) | 46 (71.9) | |
| Sleep medication prior to admission, n (%) | 7 (14.9) | 21 (32.8) | 0.03 |
| Length of stay, d, mean (SD) | 4.9 (3) | 5.8 (3.9) | 0.19 |
| Number of sleep diaries per participant, mean (SD) | 2.2 (0.8) | 2.6 (0.9) | 0.02 |
| Proportion of hospital days with sleep diaries per participant, (SD) | 0.6 (0.2) | 0.5 (0.2) | 0.71 |
| Number of nights with actigraphy per participant, mean (SD) | 1.2 (0.7) | 1.4 (0.8) | 0.16 |
| Proportion of hospital nights with actigraphy per participant (SD) | 0.3 (0.2) | 0.3 (0.1) | 0.91 |
| Baseline sleep measures | |||
| PSQI, mean (SD) | 9.9 (4.6) | 9.1 (4.5) | 0.39 |
| ESS, mean (SD) | 7.4 (4.2) | 7.7 (4.8) | 0.79 |
| ISI, mean (SD) | 11.9 (7.6) | 10.8 (7.4) | 0.44 |
| CESD‐10, mean (SD) | 12.2 (7.2) | 12.8 (7.6) | 0.69 |
| Berlin Sleep Apnea, mean (SD) | 0.63 (0.5) | 0.61 (0.5) | 0.87 |
Sleep Diary Measures
A sleep diary completed each morning assessed the outcome measures, perceived sleep quality, how refreshing sleep was, and sleep durations. The diary employed a 5‐point Likert rating scale ranging from poor (1) to excellent (5). Perceived sleep duration was calculated from patients' reported time in bed, time to fall asleep, wake time, and number and duration of awakenings after sleep onset on their sleep diary. These data were used to compute total sleep time (TST) and sleep efficiency (SE). The sleep diary also included other pertinent sleep‐related measures including use of sleep medication the night prior and specific sleep disruptions from the prior night. To measure the impact of disruptions due to disturbances the prior night, we created a summed scale score of 4 items that negatively interfered with sleep (light, temperature, noise, and interruptions; 5 point scales from 1 = not at all to 5 = significant). Analysis of principal axis factors with varimax rotation yielded 1 disruption factor accounting for 55% of the variance, and Cronbach's was 0.73.
Actigraphy Measures
Actigraphy outcomes of sleep were recorded using the actigraphy wrist watch (ActiSleep Plus (GT3X+); ActiGraph, Pensacola, FL). Participants wore the monitor from the day of enrollment throughout the hospital stay or until transfer out of the unit. Objective data were analyzed and scored using ActiLife 6 data analysis software (version 6.10.1; Actigraph). Time in bed, given the unique inpatient setting, was calculated using sleep diary responses as the interval between sleep time and reported wake up time. These were entered into the Actilife 6 software for the sleep scoring analysis using a validated algorithm, Cole‐Kripke, to calculate actigraphy TST and SE.
Statistical Analysis
Descriptive and inferential statistics were computed using Statistical Package for the Social Sciences version 22 (IBM, Armonk, NY). We computed means, proportions, and measures of dispersion for all study variables. To test differences in sleep diary and actigraphy outcomes between the intervention and control arms, we used linear mixed models with full maximum likelihood estimation to model each of the 7 continuous sleep outcomes. These statistical methods are appropriate to account for the nonindependence of continuous repeated observations within hospital patients.[19] For all outcomes, the unit of analysis was nightly observations nested within patient‐ level characteristics. The use of full maximum likelihood estimation is a robust and preferred method for handling values missing at random in longitudinal datasets.[20]
To model repeated observations, mixed models included a term representing time in days. For each outcome, we specified unconditional growth models to examine the variability between and within patients by computing intraclass correlations and inspecting variance components. We used model fit indices (‐2LL deviance, Akaike's information criterion, and Schwartz's Bayesian criterion) as appropriate to determine best fitting model specifications in terms of random effects and covariance structure.[21, 22]
We tested the main effect of the intervention on sleep outcomes and the interactive effect of group (intervention vs control) by hospital day, to test whether there were group differences in slopes representing average change in sleep outcomes over hospital days. All models adjusted for age, body mass index, depression, and baseline sleep quality (PSQI) as time‐invariant covariates, and whether participants had taken a sleep medication the day before, as a time‐varying covariate. Adjustment for prehospitalization sleep quality was a matter of particular importance. We used the PSQI to control for sleep quality because it is both a well‐validated, multidimensional measure, and it includes prehospital use of sleep medications. In a series of sensitivity analyses, we also explored whether the dichotomous self‐reported measure of whether or not participants regularly took sleep medications prior to hospitalization, rather than the PSQI, would change our substantive findings. All covariates were centered at the grand‐mean following guidelines for appropriate interpretation of regression coefficients.[23]
RESULTS
Of the 112 study patients, 48 were in the intervention unit and 64 in the control unit. Eighty‐five percent of study participants endorsed poor sleep prior to hospital admission on the PSQI sleep quality measure, which was similar in both groups (Table 1).
Participants completed 1 to 8 sleep diary entries (mean = 2.5, standard deviation = 1.1). Because only 6 participants completed 5 or more diaries, we constrained the number of diaries included in the inferential analysis to 4 to avoid influential outliers identified by scatterplots. Fifty‐seven percent of participants had 1 night of valid actigraphy data (n = 64); 29%, 2 nights (n = 32), 8% had 3 or 4 nights, and 9 participants did not have any usable actigraphy data. The extent to which the intervention was accepted by patients in the intervention group was highly variable. Unit‐wide patient adherence with the 10 pm lights off, telephone off, and TV off policy was 87%, 67%, and 64% of intervention patients, respectively. Uptake of sleep menu items was also highly variable, and not a single element was used by more than half of patients (acceptance rates ranged from 11% to 44%). Eye masks (44%) and ear plugs (32%) were the most commonly utilized items.
A greater proportion of patients in the control arm (33%) had been taking sleep medications prior to hospitalization compared to the intervention arm (15%; 2 = 4.6, P < 0.05). However, hypnotic medication use in the hospital was similar across the both groups (intervention unit patients: 25% and controls: 21%, P = 0.49).
Intraclass correlations for the 7 sleep outcomes ranged from 0.59 to 0.76 on sleep diary outcomes, and from 0.61 to 0.85 on actigraphy. Dependency of sleep measures within patients accounted for 59% to 85% of variance in sleep outcomes. The best‐fit mixed models included random intercepts only. The results of mixed models testing the main effect of intervention versus comparison arm on sleep outcome measures, adjusted for covariates, are presented in Table 2. Total sleep time was the only outcome that was significantly different between groups; the average total sleep time, calculated from sleep diary data, was longer in the intervention group by 49 minutes.
| Intervention, n = 48 | Control, n = 64 | P Value | |
|---|---|---|---|
| |||
| Sleep diary outcomes | |||
| Sleep quality, mean (SE) | 3.14 (0.16) | 3.08 (0.13) | 0.79 |
| Refreshed sleep, mean (SE) | 2.94 (0.17) | 2.74 (0.14) | 0.38 |
| Negative impact of sleep disruptions, mean (SE) | 4.39 (0.58) | 4.81 (0.48) | 0.58 |
| Total sleep time, min, mean (SE) | 422 (16.2) | 373 (13.2) | 0.02 |
| Sleep efficiency, %, mean (SE) | 83.5 (2.3) | 82.1 (1.9) | 0.65 |
| Actigraphy outcomes | |||
| Total sleep time, min, mean (SE) | 377 (16.8) | 356 (13.2) | 0.32 |
| Sleep efficiency, %, mean (SE) | 72.7 (2.2) | 74.8 (1.8) | 0.45 |
Table 3 lists slopes representing average change in sleep measures over hospital days in both groups. The P values represent z tests of interaction terms in mixed models, after adjustment for covariates, testing whether slopes significantly differed between groups. Of the 7 outcomes, 3 sleep diary measures had significant interaction terms. For ratings of sleep quality, refreshing sleep, and sleep disruptions, slopes in the control group were flat, whereas slopes in the intervention group demonstrated improvements in ratings of sleep quality and refreshed sleep, and a decrease in the impact of sleep disruptions over the course of subsequent nights in the hospital. Figure 1 illustrates a plot of the adjusted average slopes for the refreshed sleep score across hospital days in intervention and control groups.
| Intervention, Slope (SE), n = 48 | Control, Slope (SE), n = 64 | P Value | |
|---|---|---|---|
| |||
| Refreshed sleep rating | 0.55 (0.18) | 0.03 (0.13) | 0.006 |
| Sleep quality rating | 0.52 (0.16) | 0.02 (0.11) | 0.012 |
| Negative impact of sleep interruptions | 1.65 (0.48) | 0.05 (0.32) | 0.006 |
| Total sleep time, diary | 11.2 (18.1) | 6.3 (13.0) | 0.44 |
| Total sleep time, actigraphy | 7.3 (25.5) | 1.0 (15.3) | 0.83 |
| Sleep efficiency, diary | 1.1 (2.3) | 1.5 (1.6) | 0.89 |
| Sleep efficiency, actigraphy | 0.9 (4.0) | 0.7 (2.4) | 0.74 |
DISCUSSION
Poor sleep is common among hospitalized adults, both at home prior to the admission and especially when in the hospital. This pilot study demonstrated the feasibility of rolling out a sleep‐promoting intervention on a hospital's general medicine unit. Although participants on the intervention unit reported improved sleep quality and feeling more refreshed, this was not supported by actigraphy data (such as sleep time or sleep efficiency). Although care team engagement and implementation of unit‐wide interventions were high, patient use of individual components was imperfect. Of particular interest, however, the intervention group actually began to have improved sleep quality and fewer disruptions with subsequent nights sleeping in the hospital.
Our findings of the high prevalence of poor sleep among hospitalized patients is congruent with prior studies and supports the great need to screen for and address poor sleep within the hospital setting.[24, 25, 26] Attempts to promote sleep among hospitalized patients may be effective. Prior literature on sleep‐promoting intervention studies demonstrated relaxation techniques improved sleep quality by almost 38%,[27] and ear plugs and eye masks showed some benefit in promoting sleep within the hospital.[28] Our study's multicomponent intervention that attempted to minimize disruptions led to improvement in sleep quality, more restorative sleep, and decreased report of sleep disruptions, especially among patients who had a longer length of stay. As suggested by Thomas et al.[29] and seen in our data, this temporal relationship with improvement across subsequent nights suggests there may be an adaptation to the new environment and that it may take time for the sleep intervention to work.
Hospitalized patients often fail to reclaim the much‐needed restorative sleep at the time when they are most vulnerable. Patients cite routine care as the primary cause of sleep disruption, and often recognize the way that the hospital environment interferes with their ability to sleep.[30, 31, 32] The sleep‐promoting interventions used in our study would be characterized by most as low effort[33] and a potential for high yield, even though our patients only appreciated modest improvements in sleep outcomes.
Several limitations of this study should be considered. First, although we had hoped to collect substantial amounts of objective data, the average time of actigraphy observation was less than 48 hours. This may have constrained the group by time interaction analysis with actigraphy data, as studies have shown increased accuracy in actigraphy measures with longer wear.[34] By contrast, the sleep diary survey collected throughout hospitalization yielded significant improvements in consecutive daily measurements. Second, the proximity of the study units raised concern for study contamination, which could have reduced the differences in the outcome measures that may have been observed. Although the physicians work on both units, the nursing and support care teams are distinct and unit dependent. Finally, this was not a randomized trial. Patient assignment to the treatment arms was haphazard and occurred within the hospital's admitting strategy. Allocation of patients to either the intervention or the control group was based on bed availability at the time of admission. Although both groups were similar in most characteristics, more of the control participants reported taking more sleep medications prior to admission as compared to the intervention participants. Fortunately, hypnotic use was not different between groups during the admission, the time when sleep data were being captured.
Overall, this pilot study suggests that patients admitted to general medical ward fail to realize sufficient restorative sleep when they are in the hospital. Sleep disruption is rather frequent. This study demonstrates the opportunity for and feasibility of sleep‐promoting interventions where facilitating sleep is considered to be a top priority and vital component of the healthcare delivery. When trying to improve patients' sleep in the hospital, it may take several consecutive nights to realize a return on investment.
Acknowledgements
The authors acknowledge the Department of Nursing, Johns Hopkins Bayview Medical Center, and care teams of the Zieve Medicine Units, and the Center for Child and Community Health Research Biostatistics, Epidemiology and Data Management (BEAD) Core group.
Disclosures: Dr. Wright is a Miller‐Coulson Family Scholar and is supported through the Johns Hopkins Center for Innovative Medicine. Dr. Howell is the chief of the Division of Hospital Medicine at Johns Hopkins Bayview Medical Center and associate professor at Johns Hopkins School of Medicine. He served as the president of the Society of Hospital Medicine (SHM) in 2013 and currently serves as a board member. He is also a senior physician advisor for SHM. He is a coinvestigator grant recipient on an Agency for Healthcare Research and Quality grant on medication reconciliation funded through Baylor University. He was previously a coinvestigator grant recipient of Center for Medicare and Medicaid Innovations grant that ended in June 2015.
- Institute of Medicine (US) Committee on Sleep Medicine and Research. Sleep disorders and sleep deprivation: an unmet public health problem. Washington, DC: National Academies Press; 2006. Available at: http://www.ncbi.nlm.nih.gov/books/NBK19960. Accessed September 16, 2014.
- , . Health behaviors of adults: United States, 2005–2007. Vital Health Stat 10. 2010;245:1–132.
- , , . High incidence of diabetes in men with sleep complaints or short sleep duration: a 12‐year follow‐up study of a middle‐aged population. Diabetes Care. 2005;28:2762–2767.
- , , , et al. Linking sleep duration and obesity among black and white US adults. Clin Pract (Lond). 2013;10(5):661–667.
- , , , et al. Gender‐specific associations of short sleep duration with prevalent and incident hypertension: the Whitehall II Study. Hypertension. 2007;50:693–700.
- , , , , , . The joint effect of sleep duration and disturbed sleep on cause‐specific mortality: results from the Whitehall II cohort study. PLoS One. 2014;9(4):e91965.
- , , , , , . Poor self‐reported sleep quality predicts mortality within one year of inpatient post‐acute rehabilitation among older adults. Sleep. 2011;34(12):1715–1721.
- , , , , . The effects of sleep deprivation on symptoms of psychopathology in healthy adults. Sleep Med. 2007;8(3):215–221.
- , , , , . Sleep deprivation and activation of morning levels of cellular and genomic markers of inflammation. Arch Intern Med. 2006;166:1756–1762.
- , , , . The metabolic consequences of sleep deprivation. Sleep Med Rev. 2007;11(3):163–178.
- , , , et al. Insomnia among hospitalized elderly patients: prevalence, clinical characteristics and risk factors. Arch Gerontol Geriatr. 2011;52:133–137.
- , , , et al. Is insomnia a marker for psychiatric disorders in general hospitals? Sleep Med. 2005;6:549–553.
- , , , , , . Perceived control and sleep in hospitalized older adults: a sound hypothesis? J Hosp Med. 2013;8:184–190.
- , , , et al. Sleep disruption due to hospital noises: a prospective evaluation. Ann Intern Med. 2012;157:170–179.
- . Sleep in acute care settings: an integrative review. J Nurs Scholarsh. 2000;32(1):31–38.
- . Physical health as it relates to insomnia. Talk presented at: Center for Behavior and Health, Lecture Series in Johns Hopkins Bayview Medical Center; July 17, 2012; Baltimore, MD.
- , , , , . The Pittsburgh Sleep Quality Index: a new instrument for psychiatric practice and research. Psychiatry Res. 1989;28:193–213.
- , . Measures of sleep: The Insomnia Severity Index, Medical Outcomes Study (MOS) Sleep Scale, Pittsburgh Sleep Diary (PSD), and Pittsburgh Sleep Quality Index (PSQI). Arthritis Rheumatol. 2003;49:S184–S196.
- , . Applied Mixed Models in Medicine. 3rd ed. Somerset, NJ: Wiley; 2014:539.
- , , , Applying mixed regression models to the analysis of repeated‐measures data in psychosomatic medicine. Psychosom Med. 2006;68(6):870–878.
- , . Using the SPSS mixed procedure to fit cross‐sectional and longitudinal multilevel models. Educ Psychol Meas. 2005;65(5):717–741.
- , . Introduction to estimation issues in multilevel modeling. New Dir Inst Res. 2012;2012(154):23–39.
- , . Centering predictor variables in cross‐sectional multilevel models: a new look at an old issue. Psychol Methods. 2007;12(2):121–138.
- , . Sleep quality in adult hospitalized patients with infection: an observational study. Am J Med Sci. 2015;349(1):56–60.
- , , , et al. Risk of sleep apnea in hospitalized older patients. J Clin Sleep Med. 2014;10:1061–1066.
- , , . Hospital ward policy and patients' sleep patterns: a multiple baseline study. Rehabil Psychol. 1989;34(1):43–50.
- , , . Non‐pharmacologic interventions to improve the sleep of hospitalized patients: a systematic review. J Gen Intern Med. 2014;29:788–795.
- , , , , , Earplugs and eye masks vs routine care prevent sleep impairment in post‐anaesthesia care unit: a randomized study. Br J Anaesth. 2014;112(1):89–95.
- , , , et al. Sleep rounds: a multidisciplinary approach to optimize sleep quality and satisfaction in hospitalized patients. J Hosp Med. 2012;7:508–512.
- , , , , . Factors affecting sleep quality of patients in intensive care unit. J Clin Sleep Med. 2012;8(3):301–307.
- . Insomnia among hospitalized older persons. Clin Geriatr Med. 2008;24(1):51–67.
- , , , . A nonpharmacological sleep protocol for hospitalized older patients. J Am Geriatr Soc. 1998;46(6):700–705.
- The Action Priority Matrix: making the most of your opportunities. TimeAnalyzer website. Available at: http://www.timeanalyzer.com/lib/priority.htm. Published 2006. Accessed July 10, 2015.
- , , , et al. Measuring sleep: accuracy, sensitivity, and specificity of wrist actigraphy compared to polysomnography. Sleep. 2013;36(11):1747–1755.
