User login
Caring for Patients at a COVID-19 Field Hospital
During the initial peak of coronavirus disease 2019 (COVID-19) cases, US models suggested hospital bed shortages, hinting at the dire possibility of an overwhelmed healthcare system.1,2 Such projections invoked widespread uncertainty and fear of massive loss of life secondary to an undersupply of treatment resources. This led many state governments to rush into a series of historically unprecedented interventions, including the rapid deployment of field hospitals. US state governments, in partnership with the Army Corps of Engineers, invested more than $660 million to transform convention halls, university campus buildings, and even abandoned industrial warehouses, into overflow hospitals for the care of COVID-19 patients.1 Such a national scale of field hospital construction is truly historic, never before having occurred at this speed and on this scale. The only other time field hospitals were deployed nearly as widely in the United States was during the Civil War.3
FIELD HOSPITALS DURING THE COVID-19 PANDEMIC
The use of COVID-19 field hospital resources has been variable, with patient volumes ranging from 0 at many to more than 1,000 at the Javits Center field hospital in New York City.1 In fact, most field hospitals did not treat any patients because early public health measures, such as stay-at-home orders, helped contain the virus in most states.1 As of this writing, the United States has seen a dramatic surge in COVID-19 transmission and hospitalizations. This has led many states to re-introduce field hospitals into their COVID emergency response.
Our site, the Baltimore Convention Center Field Hospital (BCCFH), is one of few sites that is still operational and, to our knowledge, is the longest-running US COVID-19 field hospital. We have cared for 543 patients since opening and have had no cardiac arrests or on-site deaths. To safely offload lower-acuity COVID-19 patients from Maryland hospitals, we designed admission criteria and care processes to provide medical care on site until patients are ready for discharge. However, we anticipated that some patients would decompensate and need to return to a higher level of care. Here, we share our experience with identifying, assessing, resuscitating, and transporting unstable patients. We believe that this process has allowed us to treat about 80% of our patients in place with successful discharge to outpatient care. We have safely transferred about 20% to a higher level of care, having learned from our early cases to refine and improve our rapid response process.
CASES
Case 1
A 39-year-old man was transferred to the BCCFH on his 9th day of symptoms following a 3-day hospital admission for COVID-19. On BCCFH day 1, he developed an oxygen requirement of 2 L/min and a fever of 39.9 oC. Testing revealed worsening hyponatremia and new proteinuria, and a chest radiograph showed increased bilateral interstitial infiltrates. Cefdinir and fluid restriction were initiated. On BCCFH day 2, the patient developed hypotension (88/55 mm Hg), tachycardia (180 bpm), an oxygen requirement of 3 L/min, and a brief syncopal episode while sitting in bed. The charge physician and nurse were directed to the bedside. They instructed staff to bring a stretcher and intravenous (IV) supplies. Unable to locate these supplies in the triage bay, the staff found them in various locations. An IV line was inserted, and fluids administered, after which vital signs improved. Emergency medical services (EMS), which were on standby outside the field hospital, were alerted via radio; they donned personal protective equipment (PPE) and arrived at the triage bay. They were redirected to patient bedside, whence they transported the patient to the hospital.
Case 2
A 64-year-old man with a history of homelessness, myocardial infarctions, cerebrovascular accident, and paroxysmal atrial fibrillation was transferred to the BCCFH on his 6th day of symptoms after a 2-day hospitalization with COVID-19 respiratory illness. On BCCFH day 1, he had a temperature of 39.3 oC and atypical chest pain. A laboratory workup was unrevealing. On BCCFH day 2, he had asymptomatic hypotension and a heart rate of 60-85 bpm while receiving his usual metoprolol dose. On BCCFH day 3, he reported dizziness and was found to be hypotensive (83/41 mm Hg) and febrile (38.6 oC). The rapid response team (RRT) was called over radio, and they quickly assessed the patient and transported him to the triage bay. EMS, signaled through the RRT radio announcement, arrived at the triage bay and transported the patient to a traditional hospital.
ABOUT THE BCCFH
The BCCFH, which opened in April 2020, is a 252-bed facility that’s spread over a single exhibit hall floor and cares for stable adult COVID-19 patients from any hospital or emergency department in Maryland (Appendix A). The site offers basic laboratory tests, radiography, a limited on-site pharmacy, and spot vital sign monitoring without telemetry. Both EMS and a certified registered nurse anesthetist are on standby in the nonclinical area and must don PPE before entering the patient care area when called. The appendices show the patient beds (Appendix B) and triage area (Appendix C) used for patient evaluation and resuscitation. Unlike conventional hospitals, the BCCFH has limited consultant access, and there are frequent changes in clinical teams. In addition to clinicians, our site has physical therapists, occupational therapists, and social work teams to assist in patient care and discharge planning. As of this writing, we have cared for 543 patients, sent to us from one-third of Maryland’s hospitals. Use during the first wave of COVID was variable, with some hospitals sending us just a few patients. One Baltimore hospital sent us 8% of its COVID-19 patients. Because the patients have an average 5-day stay, the BCCFH has offloaded 2,600 bed-days of care from acute hospitals.
ROLE OF THE RRT IN A FIELD HOSPITAL
COVID-19 field hospitals must be prepared to respond effectively to decompensating patients. In our experience, effective RRTs provide a standard and reproducible approach to patient emergencies. In the conventional hospital setting, these teams consist of clinicians who can be called on by any healthcare worker to quickly assess deteriorating patients and intervene with treatment. The purpose of an RRT is to provide immediate care to a patient before progression to respiratory or cardiac arrest. RRTs proliferated in US hospitals after 2004 when the Institute for Healthcare Improvement in Boston, Massachusetts, recommended such teams for improved quality of care. Though studies report conflicting findings on the impact of RRTs on mortality rates, these studies were performed in traditional hospitals with ample resources, consultants, and clinicians familiar with their patients rather than in resource-limited field hospitals.4-13 Our field hospital has found RRTs, and the principles behind them, useful in the identification and management of decompensating COVID-19 patients.
A FOUR-STEP RAPID RESPONSE FRAMEWORK: CASE CORRELATION
An approach to managing decompensating patients in a COVID-19 field hospital can be considered in four phases: identification, assessment, resuscitation, and transport. Referring to these phases, the first case shows opportunities for improvement in resuscitation and transport. Although decompensation was identified, the patient was not transported to the triage bay for resuscitation, and there was confusion when trying to obtain the proper equipment. Additionally, EMS awaited the patient in the triage bay, while he remained in his cubicle, which delayed transport to an acute care hospital. The second case shows opportunities for improvement in identification and assessment. The patient had signs of impending decompensation that were not immediately recognized and treated. However, once decompensation occurred, the RRT was called and the patient was transported quickly to the triage bay, and then to the hospital via EMS.
In our experience at the BCCFH, identification is a key phase in COVID-19 care at a field hospital. Identification involves recognizing impending deterioration, as well as understanding risk factors for decompensation. For COVID-19 specifically, this requires heightened awareness of patients who are in the 2nd to 3rd week of symptoms. Data from Wuhan, China, suggest that decompensation occurs predictably around symptom day 9.14,15 At the BCCFH, the median symptom duration for patients who decompensated and returned to a hospital was 13 days. In both introductory cases, patients were in the high-risk 2nd week of symptoms when decompensation occurred. Clinicians at the BCCFH now discuss patient symptom day during their handoffs, when rounding, and when making decisions regarding acute care transfer. Our team has also integrated clinical information from our electronic health record to create a dashboard describing those patients requiring acute care transfer to assist in identifying other trends or predictive factors (Appendix D).
LESSONS FROM THE FIELD HOSPITAL: IMPROVING CLINICAL PERFORMANCE
Although RRTs are designed to activate when an individual patient decompensates, they should fit within a larger operational framework for patient safety. Our experience with emergencies at the BCCFH has yielded four opportunities for learning relevant to COVID-19 care in nontraditional settings (Table). These lessons include how to update staff on clinical process changes, unify communication systems, create a clinical drilling culture, and review cases to improve performance. They illustrate the importance of standardizing emergency processes, conducting frequent updates and drills, and ensuring continuous improvement. We found that, while caring for patients with an unpredictable, novel disease in a nontraditional setting and while wearing PPE and working with new colleagues during every shift, the best approach to support patients and staff is to anticipate emergencies rather than relying on individual staff to develop on-the-spot solutions.

CONCLUSION
The COVID-19 era has seen the unprecedented construction and utilization of emergency field hospital facilities. Such facilities can serve to offload some COVID-19 patients from strained healthcare infrastructure and provide essential care to these patients. We share many of the unique physical and logistical considerations specific to a nontraditional site. We optimized our space, our equipment, and our communication system. We learned how to identify, assess, resuscitate, and transport decompensating COVID-19 patients. Ultimately, our field hospital has been well utilized and successful at caring for patients because of its adaptability, accessibility, and safety record. Of the 15% of patients we transferred to a hospital for care, 81% were successfully stabilized and were willing to return to the BCCFH to complete their care. Our design included supportive care such as social work, physical and occupational therapy, and treatment of comorbidities, such as diabetes and substance use disorder. Our model demonstrates an effective nonhospital option for the care of lower-acuity, medically complex COVID-19 patients. If such facilities are used in subsequent COVID-19 outbreaks, we advise structured planning for the care of decompensating patients that takes into account the need for effective communication, drilling, and ongoing process improvement.
1. Rose J. U.S. Field Hospitals Stand Down, Most Without Treating Any COVID-19 Patients. All Things Considered. NPR; May 7, 2020. Accessed July 21, 2020. https://www.npr.org/2020/05/07/851712311/u-s-field-hospitals-stand-down-most-without-treating-any-covid-19-patients
2. Chen S, Zhang Z, Yang J, et al. Fangcang shelter hospitals: a novel concept for responding to public health emergencies. Lancet. 2020;395(10232):1305-1314. https://doi.org/10.1016/s0140-6736(20)30744-3
3. Reilly RF. Medical and surgical care during the American Civil War, 1861-1865. Proc (Bayl Univ Med Cent). 2016;29(2):138-142. https://doi.org/10.1080/08998280.2016.11929390
4. Bellomo R, Goldsmith D, Uchino S, et al. Prospective controlled trial of effect of medical emergency team on postoperative morbidity and mortality rates. Crit Care Med. 2004;32(4):916-21. https://doi.org/10.1097/01.ccm.0000119428.02968.9e
5. Bellomo R, Goldsmith D, Uchino S, et al. A prospective before-and-after trial of a medical emergency team. Med J Aust. 2003;179(6):283-287.
6. Bristow PJ, Hillman KM, Chey T, et al. Rates of in-hospital arrests, deaths and intensive care admissions: the effect of a medical emergency team. Med J Aust. 2000;173(5):236-240.
7. Buist MD, Moore GE, Bernard SA, Waxman BP, Anderson JN, Nguyen TV. Effects of a medical emergency team on reduction of incidence of and mortality from unexpected cardiac arrests in hospital: preliminary study. BMJ. 2002;324(7334):387-390. https://doi.org/10.1136/bmj.324.7334.387
8. DeVita MA, Braithwaite RS, Mahidhara R, Stuart S, Foraida M, Simmons RL; Medical Emergency Response Improvement Team (MERIT). Use of medical emergency team responses to reduce hospital cardiopulmonary arrests. Qual Saf Health Care. 2004;13(4):251-254. https://doi.org/10.1136/qhc.13.4.251
9. Goldhill DR, Worthington L, Mulcahy A, Tarling M, Sumner A. The patient-at-risk team: identifying and managing seriously ill ward patients. Anaesthesia. 1999;54(9):853-860. https://doi.org/10.1046/j.1365-2044.1999.00996.x
10. Hillman K, Chen J, Cretikos M, et al; MERIT study investigators. Introduction of the medical emergency team (MET) system: a cluster-randomised controlled trial. Lancet. 2005;365(9477):2091-2097. https://doi.org/10.1016/s0140-6736(05)66733-5
11. Kenward G, Castle N, Hodgetts T, Shaikh L. Evaluation of a medical emergency team one year after implementation. Resuscitation. 2004;61(3):257-263. https://doi.org/10.1016/j.resuscitation.2004.01.021
12. Pittard AJ. Out of our reach? assessing the impact of introducing a critical care outreach service. Anaesthesia. 2003;58(9):882-885. https://doi.org/10.1046/j.1365-2044.2003.03331.x
13. Priestley G, Watson W, Rashidian A, et al. Introducing critical care outreach: a ward-randomised trial of phased introduction in a general hospital. Intensive Care Med. 2004;30(7):1398-1404. https://doi.org/10.1007/s00134-004-2268-7
14. Zhou F, Yu T, Du R, et al. Clinical course and risk factors for mortality of adult inpatients with COVID-19 in Wuhan, China: a retrospective cohort study. Lancet. 2020;395(10229):1054-1062. https://doi.org/10.1016/s0140-6736(20)30566-3
15. Zhou Y, Li W, Wang D, et al. Clinical time course of COVID-19, its neurological manifestation and some thoughts on its management. Stroke Vasc Neurol. 2020;5(2):177-179. https://doi.org/10.1136/svn-2020-000398
During the initial peak of coronavirus disease 2019 (COVID-19) cases, US models suggested hospital bed shortages, hinting at the dire possibility of an overwhelmed healthcare system.1,2 Such projections invoked widespread uncertainty and fear of massive loss of life secondary to an undersupply of treatment resources. This led many state governments to rush into a series of historically unprecedented interventions, including the rapid deployment of field hospitals. US state governments, in partnership with the Army Corps of Engineers, invested more than $660 million to transform convention halls, university campus buildings, and even abandoned industrial warehouses, into overflow hospitals for the care of COVID-19 patients.1 Such a national scale of field hospital construction is truly historic, never before having occurred at this speed and on this scale. The only other time field hospitals were deployed nearly as widely in the United States was during the Civil War.3
FIELD HOSPITALS DURING THE COVID-19 PANDEMIC
The use of COVID-19 field hospital resources has been variable, with patient volumes ranging from 0 at many to more than 1,000 at the Javits Center field hospital in New York City.1 In fact, most field hospitals did not treat any patients because early public health measures, such as stay-at-home orders, helped contain the virus in most states.1 As of this writing, the United States has seen a dramatic surge in COVID-19 transmission and hospitalizations. This has led many states to re-introduce field hospitals into their COVID emergency response.
Our site, the Baltimore Convention Center Field Hospital (BCCFH), is one of few sites that is still operational and, to our knowledge, is the longest-running US COVID-19 field hospital. We have cared for 543 patients since opening and have had no cardiac arrests or on-site deaths. To safely offload lower-acuity COVID-19 patients from Maryland hospitals, we designed admission criteria and care processes to provide medical care on site until patients are ready for discharge. However, we anticipated that some patients would decompensate and need to return to a higher level of care. Here, we share our experience with identifying, assessing, resuscitating, and transporting unstable patients. We believe that this process has allowed us to treat about 80% of our patients in place with successful discharge to outpatient care. We have safely transferred about 20% to a higher level of care, having learned from our early cases to refine and improve our rapid response process.
CASES
Case 1
A 39-year-old man was transferred to the BCCFH on his 9th day of symptoms following a 3-day hospital admission for COVID-19. On BCCFH day 1, he developed an oxygen requirement of 2 L/min and a fever of 39.9 oC. Testing revealed worsening hyponatremia and new proteinuria, and a chest radiograph showed increased bilateral interstitial infiltrates. Cefdinir and fluid restriction were initiated. On BCCFH day 2, the patient developed hypotension (88/55 mm Hg), tachycardia (180 bpm), an oxygen requirement of 3 L/min, and a brief syncopal episode while sitting in bed. The charge physician and nurse were directed to the bedside. They instructed staff to bring a stretcher and intravenous (IV) supplies. Unable to locate these supplies in the triage bay, the staff found them in various locations. An IV line was inserted, and fluids administered, after which vital signs improved. Emergency medical services (EMS), which were on standby outside the field hospital, were alerted via radio; they donned personal protective equipment (PPE) and arrived at the triage bay. They were redirected to patient bedside, whence they transported the patient to the hospital.
Case 2
A 64-year-old man with a history of homelessness, myocardial infarctions, cerebrovascular accident, and paroxysmal atrial fibrillation was transferred to the BCCFH on his 6th day of symptoms after a 2-day hospitalization with COVID-19 respiratory illness. On BCCFH day 1, he had a temperature of 39.3 oC and atypical chest pain. A laboratory workup was unrevealing. On BCCFH day 2, he had asymptomatic hypotension and a heart rate of 60-85 bpm while receiving his usual metoprolol dose. On BCCFH day 3, he reported dizziness and was found to be hypotensive (83/41 mm Hg) and febrile (38.6 oC). The rapid response team (RRT) was called over radio, and they quickly assessed the patient and transported him to the triage bay. EMS, signaled through the RRT radio announcement, arrived at the triage bay and transported the patient to a traditional hospital.
ABOUT THE BCCFH
The BCCFH, which opened in April 2020, is a 252-bed facility that’s spread over a single exhibit hall floor and cares for stable adult COVID-19 patients from any hospital or emergency department in Maryland (Appendix A). The site offers basic laboratory tests, radiography, a limited on-site pharmacy, and spot vital sign monitoring without telemetry. Both EMS and a certified registered nurse anesthetist are on standby in the nonclinical area and must don PPE before entering the patient care area when called. The appendices show the patient beds (Appendix B) and triage area (Appendix C) used for patient evaluation and resuscitation. Unlike conventional hospitals, the BCCFH has limited consultant access, and there are frequent changes in clinical teams. In addition to clinicians, our site has physical therapists, occupational therapists, and social work teams to assist in patient care and discharge planning. As of this writing, we have cared for 543 patients, sent to us from one-third of Maryland’s hospitals. Use during the first wave of COVID was variable, with some hospitals sending us just a few patients. One Baltimore hospital sent us 8% of its COVID-19 patients. Because the patients have an average 5-day stay, the BCCFH has offloaded 2,600 bed-days of care from acute hospitals.
ROLE OF THE RRT IN A FIELD HOSPITAL
COVID-19 field hospitals must be prepared to respond effectively to decompensating patients. In our experience, effective RRTs provide a standard and reproducible approach to patient emergencies. In the conventional hospital setting, these teams consist of clinicians who can be called on by any healthcare worker to quickly assess deteriorating patients and intervene with treatment. The purpose of an RRT is to provide immediate care to a patient before progression to respiratory or cardiac arrest. RRTs proliferated in US hospitals after 2004 when the Institute for Healthcare Improvement in Boston, Massachusetts, recommended such teams for improved quality of care. Though studies report conflicting findings on the impact of RRTs on mortality rates, these studies were performed in traditional hospitals with ample resources, consultants, and clinicians familiar with their patients rather than in resource-limited field hospitals.4-13 Our field hospital has found RRTs, and the principles behind them, useful in the identification and management of decompensating COVID-19 patients.
A FOUR-STEP RAPID RESPONSE FRAMEWORK: CASE CORRELATION
An approach to managing decompensating patients in a COVID-19 field hospital can be considered in four phases: identification, assessment, resuscitation, and transport. Referring to these phases, the first case shows opportunities for improvement in resuscitation and transport. Although decompensation was identified, the patient was not transported to the triage bay for resuscitation, and there was confusion when trying to obtain the proper equipment. Additionally, EMS awaited the patient in the triage bay, while he remained in his cubicle, which delayed transport to an acute care hospital. The second case shows opportunities for improvement in identification and assessment. The patient had signs of impending decompensation that were not immediately recognized and treated. However, once decompensation occurred, the RRT was called and the patient was transported quickly to the triage bay, and then to the hospital via EMS.
In our experience at the BCCFH, identification is a key phase in COVID-19 care at a field hospital. Identification involves recognizing impending deterioration, as well as understanding risk factors for decompensation. For COVID-19 specifically, this requires heightened awareness of patients who are in the 2nd to 3rd week of symptoms. Data from Wuhan, China, suggest that decompensation occurs predictably around symptom day 9.14,15 At the BCCFH, the median symptom duration for patients who decompensated and returned to a hospital was 13 days. In both introductory cases, patients were in the high-risk 2nd week of symptoms when decompensation occurred. Clinicians at the BCCFH now discuss patient symptom day during their handoffs, when rounding, and when making decisions regarding acute care transfer. Our team has also integrated clinical information from our electronic health record to create a dashboard describing those patients requiring acute care transfer to assist in identifying other trends or predictive factors (Appendix D).
LESSONS FROM THE FIELD HOSPITAL: IMPROVING CLINICAL PERFORMANCE
Although RRTs are designed to activate when an individual patient decompensates, they should fit within a larger operational framework for patient safety. Our experience with emergencies at the BCCFH has yielded four opportunities for learning relevant to COVID-19 care in nontraditional settings (Table). These lessons include how to update staff on clinical process changes, unify communication systems, create a clinical drilling culture, and review cases to improve performance. They illustrate the importance of standardizing emergency processes, conducting frequent updates and drills, and ensuring continuous improvement. We found that, while caring for patients with an unpredictable, novel disease in a nontraditional setting and while wearing PPE and working with new colleagues during every shift, the best approach to support patients and staff is to anticipate emergencies rather than relying on individual staff to develop on-the-spot solutions.
CONCLUSION
The COVID-19 era has seen the unprecedented construction and utilization of emergency field hospital facilities. Such facilities can serve to offload some COVID-19 patients from strained healthcare infrastructure and provide essential care to these patients. We share many of the unique physical and logistical considerations specific to a nontraditional site. We optimized our space, our equipment, and our communication system. We learned how to identify, assess, resuscitate, and transport decompensating COVID-19 patients. Ultimately, our field hospital has been well utilized and successful at caring for patients because of its adaptability, accessibility, and safety record. Of the 15% of patients we transferred to a hospital for care, 81% were successfully stabilized and were willing to return to the BCCFH to complete their care. Our design included supportive care such as social work, physical and occupational therapy, and treatment of comorbidities, such as diabetes and substance use disorder. Our model demonstrates an effective nonhospital option for the care of lower-acuity, medically complex COVID-19 patients. If such facilities are used in subsequent COVID-19 outbreaks, we advise structured planning for the care of decompensating patients that takes into account the need for effective communication, drilling, and ongoing process improvement.
1. Rose J. U.S. Field Hospitals Stand Down, Most Without Treating Any COVID-19 Patients. All Things Considered. NPR; May 7, 2020. Accessed July 21, 2020. https://www.npr.org/2020/05/07/851712311/u-s-field-hospitals-stand-down-most-without-treating-any-covid-19-patients
2. Chen S, Zhang Z, Yang J, et al. Fangcang shelter hospitals: a novel concept for responding to public health emergencies. Lancet. 2020;395(10232):1305-1314. https://doi.org/10.1016/s0140-6736(20)30744-3
3. Reilly RF. Medical and surgical care during the American Civil War, 1861-1865. Proc (Bayl Univ Med Cent). 2016;29(2):138-142. https://doi.org/10.1080/08998280.2016.11929390
4. Bellomo R, Goldsmith D, Uchino S, et al. Prospective controlled trial of effect of medical emergency team on postoperative morbidity and mortality rates. Crit Care Med. 2004;32(4):916-21. https://doi.org/10.1097/01.ccm.0000119428.02968.9e
5. Bellomo R, Goldsmith D, Uchino S, et al. A prospective before-and-after trial of a medical emergency team. Med J Aust. 2003;179(6):283-287.
6. Bristow PJ, Hillman KM, Chey T, et al. Rates of in-hospital arrests, deaths and intensive care admissions: the effect of a medical emergency team. Med J Aust. 2000;173(5):236-240.
7. Buist MD, Moore GE, Bernard SA, Waxman BP, Anderson JN, Nguyen TV. Effects of a medical emergency team on reduction of incidence of and mortality from unexpected cardiac arrests in hospital: preliminary study. BMJ. 2002;324(7334):387-390. https://doi.org/10.1136/bmj.324.7334.387
8. DeVita MA, Braithwaite RS, Mahidhara R, Stuart S, Foraida M, Simmons RL; Medical Emergency Response Improvement Team (MERIT). Use of medical emergency team responses to reduce hospital cardiopulmonary arrests. Qual Saf Health Care. 2004;13(4):251-254. https://doi.org/10.1136/qhc.13.4.251
9. Goldhill DR, Worthington L, Mulcahy A, Tarling M, Sumner A. The patient-at-risk team: identifying and managing seriously ill ward patients. Anaesthesia. 1999;54(9):853-860. https://doi.org/10.1046/j.1365-2044.1999.00996.x
10. Hillman K, Chen J, Cretikos M, et al; MERIT study investigators. Introduction of the medical emergency team (MET) system: a cluster-randomised controlled trial. Lancet. 2005;365(9477):2091-2097. https://doi.org/10.1016/s0140-6736(05)66733-5
11. Kenward G, Castle N, Hodgetts T, Shaikh L. Evaluation of a medical emergency team one year after implementation. Resuscitation. 2004;61(3):257-263. https://doi.org/10.1016/j.resuscitation.2004.01.021
12. Pittard AJ. Out of our reach? assessing the impact of introducing a critical care outreach service. Anaesthesia. 2003;58(9):882-885. https://doi.org/10.1046/j.1365-2044.2003.03331.x
13. Priestley G, Watson W, Rashidian A, et al. Introducing critical care outreach: a ward-randomised trial of phased introduction in a general hospital. Intensive Care Med. 2004;30(7):1398-1404. https://doi.org/10.1007/s00134-004-2268-7
14. Zhou F, Yu T, Du R, et al. Clinical course and risk factors for mortality of adult inpatients with COVID-19 in Wuhan, China: a retrospective cohort study. Lancet. 2020;395(10229):1054-1062. https://doi.org/10.1016/s0140-6736(20)30566-3
15. Zhou Y, Li W, Wang D, et al. Clinical time course of COVID-19, its neurological manifestation and some thoughts on its management. Stroke Vasc Neurol. 2020;5(2):177-179. https://doi.org/10.1136/svn-2020-000398
© 2021 Society of Hospital Medicine
SHM Leadership Academy: Learning Awaits in Mastering Teamwork Course
As the SHM Leadership Academy’s course director, I always find time to visit the Mastering Teamwork course because each year, even though it’s slightly different, it’s still exciting. In past meetings, I’ve learned from talented faculty how lessons in college football relate to practice, been provided guidance on how to recognize what makes me tick, and heard firsthand perspective on large-scale medical events like 9/11, Hurricane Katrina, and even the Boston Marathon tragedy. I always learn a few new things. As they say, repetition is the mother of learning, and the Mastering Teamwork course never fails to make that learning a lot of fun.
As a professor of medicine, I’ve always liked learning. But I truly enjoy learning when it’s fun and exciting. To me, this mixture of academia and excitement is the epitome of Mastering Teamwork. When two of the faculty, Mark Williams, MD, MHM, and Amit Prachand, MEng, needed to teach about teamwork, they decided to develop an interactive session. While in Hawaii, they constructed a “river” out of cardboard and props for Mastering Teamwork participants to navigate. It was a hands-on lesson in group dynamics. It was educational and, most of all, a hoot.
Kay Cannon, MBA, taught me that the skills I used in previous job levels may not be the drivers of my success in today’s job (or tomorrow’s), and Jeffrey Wiese, MD, MHM, and Lenny Marcus, PhD, are two of the best storytellers I know and have me on the edge of my seat every time I hear them speak. Their life experiences make excellent fodder for hospitalist leadership pearls and are more riveting than Downton Abbey (or whatever drama is your favorite).
I look forward to seeing everyone at Disney’s BoardWalk Inn in Lake Buena Vista, Florida, from October 24 to 27 to experience what I know will be a memorable, enjoyable learning experience for all.
To register, visit www.shmleadershipacademy.org. TH
Dr. Howell is SHM’s senior physician advisor and course director for SHM’s Leadership Academy.
Patients' Sleep Quality and Duration
Approximately 70 million adults within the United States have sleep disorders,[1] and up to 30% of adults report sleeping less than 6 hours per night.[2] Poor sleep has been associated with undesirable health outcomes.[1] Suboptimal sleep duration and sleep quality has been associated with a higher prevalence of chronic health conditions including hypertension, type 2 diabetes, coronary artery disease, stroke, and obesity, as well as increased overall mortality.[3, 4, 5, 6, 7]
Sleep plays an important role in restoration of wellness. Poor sleep is associated with physiological disturbances that may result in poor healing.[8, 9, 10] In the literature, prevalence of insomnia among elderly hospitalized patients was 36.7%,[11] whereas in younger hospitalized patients it was 50%.[12] Hospitalized patients frequently cite their acute illness, hospital‐related environmental factors, and disruptions that are part of routine care as causes for poor sleep during hospitalization.[13, 14, 15] Although the pervasiveness of poor sleep among hospitalized patients is high, interventions that prioritize sleep optimization as routine care, are uncommon. Few studies have reviewed the effect of sleep‐promoting measures on both sleep quality and sleep duration among patients hospitalized on general medicine units.
In this study, we aimed to assess the feasibility of incorporating sleep‐promoting interventions on a general medicine unit. We sought to identify differences in sleep measures between intervention and control groups. The primary outcome that we hoped to influence and lengthen in the intervention group was sleep duration. This outcome was measured both by sleep diary and with actigraphy. Secondary outcomes that we hypothesized should improve in the intervention group included feeling more refreshed in the mornings, sleep efficiency, and fewer sleep disruptions. As a feasibility pilot, we also wanted to explore the ease or difficulty with which sleep‐promoting interventions could be incorporated to the team's workflow.
METHODS
Study Design
A quasi‐experimental prospective pilot study was conducted at a single academic center, the Johns Hopkins Bayview Medical Center. Participants included adult patients admitted to the general medicine ward from July 2013 through January 2014. Patients with dementia; inability to complete survey questionnaires due to delirium, disability, or a language barrier; active withdrawal from alcohol or controlled substances; or acute psychiatric illness were excluded in this study.
The medicine ward at our medical center is comprised of 2 structurally identical units that admit patients with similar diagnoses, disease severity, and case‐mix disease groups. Nursing and support staff are unit specific. Pertaining to the sleep environment, the units both have semiprivate and private rooms. Visitors are encouraged to leave by 10 pm. Patients admitted from the emergency room to the medicine ward are assigned haphazardly to either unit based on bed availability. For the purpose of this study, we selected 1 unit to be a control unit and identified the other as the sleep‐promoting intervention unit.
Study Procedure
Upon arrival to the medicine unit, the research team approached all patients who met study eligibility criteria for study participation. Patients were provided full disclosure of the study using institutional research guidelines, and those interested in participating were consented. Participants were not explicitly told about their group assignment. This study was approved by the Johns Hopkins Institutional Review Board for human subject research.
In this study, the control group participants received standard of care as it pertains to sleep promotion. No additional sleep‐promoting measures were implemented to routine medical care, medication administration, nursing care, and overnight monitoring. Patients who used sleep medications at home, prior to admission, had those medicines continued only if they requested them and they were not contraindicated given their acute illness. Participants on the intervention unit were exposed to a nurse‐delivered sleep‐promoting protocol aimed at transforming the culture of care such that helping patients to sleep soundly was made a top priority. Environmental changes included unit‐wide efforts to minimize light and noise disturbances by dimming hallway lights, turning off room lights, and encouraging care teams to be as quiet as possible. Other strategies focused largely on minimizing care‐related disruptions. These included, when appropriate, administering nighttime medications in the early evening, minimizing fluids overnight, and closing patient room doors where appropriate. Further, patients were offered the following sleep‐promoting items to choose from: ear plugs, eye masks, warm blankets, and relaxation music. The final component of our intervention was 30‐minute sleep hygiene education taught by a physician. It highlighted basic sleep physiology and healthy sleep behavior adapted from Buysse.[16] Patients learned the role of behaviors such as reducing time lying awake in bed, setting standard wake‐up time and sleep time, and going to bed only when sleepy. This behavioral education was supplemented by a handout with sleep‐promoting suggestions.
The care team on the intervention unit received comprehensive study‐focused training in which night nursing teams were familiarized with the sleep‐promoting protocol through in‐service sessions facilitated by 1 of the authors (E.W.G.). To further promote study implementation, sleep‐promoting procedures were supported and encouraged by supervising nurses who made daily reminders to the intervention unit night care team of the goals of the sleep‐promoting study during evening huddles performed at the beginning of each shift. To assess the adherence of the sleep protocol, the nursing staff completed a daily checklist of elements within the protocol that were employed .
Data Collection and Measures
Baseline Measures
At the time of enrollment, study patients' demographic information, including use of chronic sleep medication prior to admission, was collected. Participants were assessed for baseline sleep disturbance prior to admission using standardized, validated sleep assessment tools: Pittsburgh Sleep Quality Index (PSQI), the Insomnia Severity Index (ISI), and the Epworth Sleepiness Scale (ESS). PSQI, a 19‐item tool, assessed self‐rated sleep quality measured over the prior month; a score of 5 or greater indicated poor sleep.[17] ISI, a 7‐item tool, identified the presence, rated the severity, and described the impact of insomnia; a score of 10 or greater indicated insomnia.[18] ESS, an 8‐item self‐rated tool, evaluated the impact of perceived sleepiness on daily functioning in 8 different environments; a score of 9 or greater was linked to burden of sleepiness. Participants were also screened for both obstructive sleep apnea (using the Berlin Sleep Apnea Index) and clinical depression (using Center for Epidemiologic Studies‐Depression 10‐point scale), as these conditions affect sleep patterns. These data are shown in Table 1.
| Intervention, n = 48 | Control, n = 64 | P Value | |
|---|---|---|---|
| |||
| Age, y, mean (SD) | 58.2 (16) | 56.9 (17) | 0.69 |
| Female, n (%) | 26 (54.2) | 36 (56.3) | 0.83 |
| Race, n (%) | |||
| Caucasian | 33 (68.8) | 46 (71.9) | 0.92 |
| African American | 13 (27.1) | 16 (25.0) | |
| Other | 2 (4.2) | 2 (3.1) | |
| BMI, mean (SD) | 32.1 (9.2) | 31.8 (9.3) | 0.85 |
| Admitting service, n (%) | |||
| Teaching | 21 (43.8) | 18 (28.1) | 0.09 |
| Nonteaching | 27 (56.3) | 46 (71.9) | |
| Sleep medication prior to admission, n (%) | 7 (14.9) | 21 (32.8) | 0.03 |
| Length of stay, d, mean (SD) | 4.9 (3) | 5.8 (3.9) | 0.19 |
| Number of sleep diaries per participant, mean (SD) | 2.2 (0.8) | 2.6 (0.9) | 0.02 |
| Proportion of hospital days with sleep diaries per participant, (SD) | 0.6 (0.2) | 0.5 (0.2) | 0.71 |
| Number of nights with actigraphy per participant, mean (SD) | 1.2 (0.7) | 1.4 (0.8) | 0.16 |
| Proportion of hospital nights with actigraphy per participant (SD) | 0.3 (0.2) | 0.3 (0.1) | 0.91 |
| Baseline sleep measures | |||
| PSQI, mean (SD) | 9.9 (4.6) | 9.1 (4.5) | 0.39 |
| ESS, mean (SD) | 7.4 (4.2) | 7.7 (4.8) | 0.79 |
| ISI, mean (SD) | 11.9 (7.6) | 10.8 (7.4) | 0.44 |
| CESD‐10, mean (SD) | 12.2 (7.2) | 12.8 (7.6) | 0.69 |
| Berlin Sleep Apnea, mean (SD) | 0.63 (0.5) | 0.61 (0.5) | 0.87 |
Sleep Diary Measures
A sleep diary completed each morning assessed the outcome measures, perceived sleep quality, how refreshing sleep was, and sleep durations. The diary employed a 5‐point Likert rating scale ranging from poor (1) to excellent (5). Perceived sleep duration was calculated from patients' reported time in bed, time to fall asleep, wake time, and number and duration of awakenings after sleep onset on their sleep diary. These data were used to compute total sleep time (TST) and sleep efficiency (SE). The sleep diary also included other pertinent sleep‐related measures including use of sleep medication the night prior and specific sleep disruptions from the prior night. To measure the impact of disruptions due to disturbances the prior night, we created a summed scale score of 4 items that negatively interfered with sleep (light, temperature, noise, and interruptions; 5 point scales from 1 = not at all to 5 = significant). Analysis of principal axis factors with varimax rotation yielded 1 disruption factor accounting for 55% of the variance, and Cronbach's was 0.73.
Actigraphy Measures
Actigraphy outcomes of sleep were recorded using the actigraphy wrist watch (ActiSleep Plus (GT3X+); ActiGraph, Pensacola, FL). Participants wore the monitor from the day of enrollment throughout the hospital stay or until transfer out of the unit. Objective data were analyzed and scored using ActiLife 6 data analysis software (version 6.10.1; Actigraph). Time in bed, given the unique inpatient setting, was calculated using sleep diary responses as the interval between sleep time and reported wake up time. These were entered into the Actilife 6 software for the sleep scoring analysis using a validated algorithm, Cole‐Kripke, to calculate actigraphy TST and SE.
Statistical Analysis
Descriptive and inferential statistics were computed using Statistical Package for the Social Sciences version 22 (IBM, Armonk, NY). We computed means, proportions, and measures of dispersion for all study variables. To test differences in sleep diary and actigraphy outcomes between the intervention and control arms, we used linear mixed models with full maximum likelihood estimation to model each of the 7 continuous sleep outcomes. These statistical methods are appropriate to account for the nonindependence of continuous repeated observations within hospital patients.[19] For all outcomes, the unit of analysis was nightly observations nested within patient‐ level characteristics. The use of full maximum likelihood estimation is a robust and preferred method for handling values missing at random in longitudinal datasets.[20]
To model repeated observations, mixed models included a term representing time in days. For each outcome, we specified unconditional growth models to examine the variability between and within patients by computing intraclass correlations and inspecting variance components. We used model fit indices (‐2LL deviance, Akaike's information criterion, and Schwartz's Bayesian criterion) as appropriate to determine best fitting model specifications in terms of random effects and covariance structure.[21, 22]
We tested the main effect of the intervention on sleep outcomes and the interactive effect of group (intervention vs control) by hospital day, to test whether there were group differences in slopes representing average change in sleep outcomes over hospital days. All models adjusted for age, body mass index, depression, and baseline sleep quality (PSQI) as time‐invariant covariates, and whether participants had taken a sleep medication the day before, as a time‐varying covariate. Adjustment for prehospitalization sleep quality was a matter of particular importance. We used the PSQI to control for sleep quality because it is both a well‐validated, multidimensional measure, and it includes prehospital use of sleep medications. In a series of sensitivity analyses, we also explored whether the dichotomous self‐reported measure of whether or not participants regularly took sleep medications prior to hospitalization, rather than the PSQI, would change our substantive findings. All covariates were centered at the grand‐mean following guidelines for appropriate interpretation of regression coefficients.[23]
RESULTS
Of the 112 study patients, 48 were in the intervention unit and 64 in the control unit. Eighty‐five percent of study participants endorsed poor sleep prior to hospital admission on the PSQI sleep quality measure, which was similar in both groups (Table 1).
Participants completed 1 to 8 sleep diary entries (mean = 2.5, standard deviation = 1.1). Because only 6 participants completed 5 or more diaries, we constrained the number of diaries included in the inferential analysis to 4 to avoid influential outliers identified by scatterplots. Fifty‐seven percent of participants had 1 night of valid actigraphy data (n = 64); 29%, 2 nights (n = 32), 8% had 3 or 4 nights, and 9 participants did not have any usable actigraphy data. The extent to which the intervention was accepted by patients in the intervention group was highly variable. Unit‐wide patient adherence with the 10 pm lights off, telephone off, and TV off policy was 87%, 67%, and 64% of intervention patients, respectively. Uptake of sleep menu items was also highly variable, and not a single element was used by more than half of patients (acceptance rates ranged from 11% to 44%). Eye masks (44%) and ear plugs (32%) were the most commonly utilized items.
A greater proportion of patients in the control arm (33%) had been taking sleep medications prior to hospitalization compared to the intervention arm (15%; 2 = 4.6, P < 0.05). However, hypnotic medication use in the hospital was similar across the both groups (intervention unit patients: 25% and controls: 21%, P = 0.49).
Intraclass correlations for the 7 sleep outcomes ranged from 0.59 to 0.76 on sleep diary outcomes, and from 0.61 to 0.85 on actigraphy. Dependency of sleep measures within patients accounted for 59% to 85% of variance in sleep outcomes. The best‐fit mixed models included random intercepts only. The results of mixed models testing the main effect of intervention versus comparison arm on sleep outcome measures, adjusted for covariates, are presented in Table 2. Total sleep time was the only outcome that was significantly different between groups; the average total sleep time, calculated from sleep diary data, was longer in the intervention group by 49 minutes.
| Intervention, n = 48 | Control, n = 64 | P Value | |
|---|---|---|---|
| |||
| Sleep diary outcomes | |||
| Sleep quality, mean (SE) | 3.14 (0.16) | 3.08 (0.13) | 0.79 |
| Refreshed sleep, mean (SE) | 2.94 (0.17) | 2.74 (0.14) | 0.38 |
| Negative impact of sleep disruptions, mean (SE) | 4.39 (0.58) | 4.81 (0.48) | 0.58 |
| Total sleep time, min, mean (SE) | 422 (16.2) | 373 (13.2) | 0.02 |
| Sleep efficiency, %, mean (SE) | 83.5 (2.3) | 82.1 (1.9) | 0.65 |
| Actigraphy outcomes | |||
| Total sleep time, min, mean (SE) | 377 (16.8) | 356 (13.2) | 0.32 |
| Sleep efficiency, %, mean (SE) | 72.7 (2.2) | 74.8 (1.8) | 0.45 |
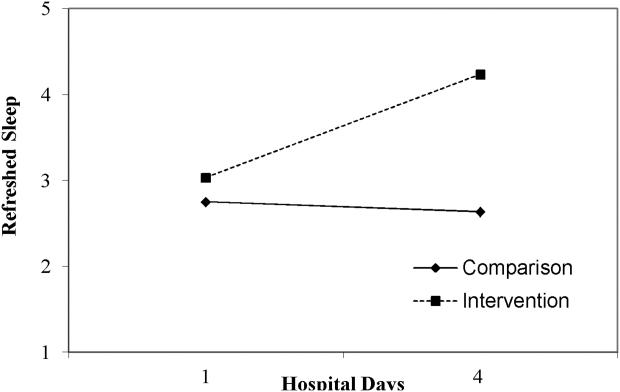
Table 3 lists slopes representing average change in sleep measures over hospital days in both groups. The P values represent z tests of interaction terms in mixed models, after adjustment for covariates, testing whether slopes significantly differed between groups. Of the 7 outcomes, 3 sleep diary measures had significant interaction terms. For ratings of sleep quality, refreshing sleep, and sleep disruptions, slopes in the control group were flat, whereas slopes in the intervention group demonstrated improvements in ratings of sleep quality and refreshed sleep, and a decrease in the impact of sleep disruptions over the course of subsequent nights in the hospital. Figure 1 illustrates a plot of the adjusted average slopes for the refreshed sleep score across hospital days in intervention and control groups.
| Intervention, Slope (SE), n = 48 | Control, Slope (SE), n = 64 | P Value | |
|---|---|---|---|
| |||
| Refreshed sleep rating | 0.55 (0.18) | 0.03 (0.13) | 0.006 |
| Sleep quality rating | 0.52 (0.16) | 0.02 (0.11) | 0.012 |
| Negative impact of sleep interruptions | 1.65 (0.48) | 0.05 (0.32) | 0.006 |
| Total sleep time, diary | 11.2 (18.1) | 6.3 (13.0) | 0.44 |
| Total sleep time, actigraphy | 7.3 (25.5) | 1.0 (15.3) | 0.83 |
| Sleep efficiency, diary | 1.1 (2.3) | 1.5 (1.6) | 0.89 |
| Sleep efficiency, actigraphy | 0.9 (4.0) | 0.7 (2.4) | 0.74 |
DISCUSSION
Poor sleep is common among hospitalized adults, both at home prior to the admission and especially when in the hospital. This pilot study demonstrated the feasibility of rolling out a sleep‐promoting intervention on a hospital's general medicine unit. Although participants on the intervention unit reported improved sleep quality and feeling more refreshed, this was not supported by actigraphy data (such as sleep time or sleep efficiency). Although care team engagement and implementation of unit‐wide interventions were high, patient use of individual components was imperfect. Of particular interest, however, the intervention group actually began to have improved sleep quality and fewer disruptions with subsequent nights sleeping in the hospital.
Our findings of the high prevalence of poor sleep among hospitalized patients is congruent with prior studies and supports the great need to screen for and address poor sleep within the hospital setting.[24, 25, 26] Attempts to promote sleep among hospitalized patients may be effective. Prior literature on sleep‐promoting intervention studies demonstrated relaxation techniques improved sleep quality by almost 38%,[27] and ear plugs and eye masks showed some benefit in promoting sleep within the hospital.[28] Our study's multicomponent intervention that attempted to minimize disruptions led to improvement in sleep quality, more restorative sleep, and decreased report of sleep disruptions, especially among patients who had a longer length of stay. As suggested by Thomas et al.[29] and seen in our data, this temporal relationship with improvement across subsequent nights suggests there may be an adaptation to the new environment and that it may take time for the sleep intervention to work.
Hospitalized patients often fail to reclaim the much‐needed restorative sleep at the time when they are most vulnerable. Patients cite routine care as the primary cause of sleep disruption, and often recognize the way that the hospital environment interferes with their ability to sleep.[30, 31, 32] The sleep‐promoting interventions used in our study would be characterized by most as low effort[33] and a potential for high yield, even though our patients only appreciated modest improvements in sleep outcomes.
Several limitations of this study should be considered. First, although we had hoped to collect substantial amounts of objective data, the average time of actigraphy observation was less than 48 hours. This may have constrained the group by time interaction analysis with actigraphy data, as studies have shown increased accuracy in actigraphy measures with longer wear.[34] By contrast, the sleep diary survey collected throughout hospitalization yielded significant improvements in consecutive daily measurements. Second, the proximity of the study units raised concern for study contamination, which could have reduced the differences in the outcome measures that may have been observed. Although the physicians work on both units, the nursing and support care teams are distinct and unit dependent. Finally, this was not a randomized trial. Patient assignment to the treatment arms was haphazard and occurred within the hospital's admitting strategy. Allocation of patients to either the intervention or the control group was based on bed availability at the time of admission. Although both groups were similar in most characteristics, more of the control participants reported taking more sleep medications prior to admission as compared to the intervention participants. Fortunately, hypnotic use was not different between groups during the admission, the time when sleep data were being captured.
Overall, this pilot study suggests that patients admitted to general medical ward fail to realize sufficient restorative sleep when they are in the hospital. Sleep disruption is rather frequent. This study demonstrates the opportunity for and feasibility of sleep‐promoting interventions where facilitating sleep is considered to be a top priority and vital component of the healthcare delivery. When trying to improve patients' sleep in the hospital, it may take several consecutive nights to realize a return on investment.
Acknowledgements
The authors acknowledge the Department of Nursing, Johns Hopkins Bayview Medical Center, and care teams of the Zieve Medicine Units, and the Center for Child and Community Health Research Biostatistics, Epidemiology and Data Management (BEAD) Core group.
Disclosures: Dr. Wright is a Miller‐Coulson Family Scholar and is supported through the Johns Hopkins Center for Innovative Medicine. Dr. Howell is the chief of the Division of Hospital Medicine at Johns Hopkins Bayview Medical Center and associate professor at Johns Hopkins School of Medicine. He served as the president of the Society of Hospital Medicine (SHM) in 2013 and currently serves as a board member. He is also a senior physician advisor for SHM. He is a coinvestigator grant recipient on an Agency for Healthcare Research and Quality grant on medication reconciliation funded through Baylor University. He was previously a coinvestigator grant recipient of Center for Medicare and Medicaid Innovations grant that ended in June 2015.
- Institute of Medicine (US) Committee on Sleep Medicine and Research. Sleep disorders and sleep deprivation: an unmet public health problem. Washington, DC: National Academies Press; 2006. Available at: http://www.ncbi.nlm.nih.gov/books/NBK19960. Accessed September 16, 2014.
- , . Health behaviors of adults: United States, 2005–2007. Vital Health Stat 10. 2010;245:1–132.
- , , . High incidence of diabetes in men with sleep complaints or short sleep duration: a 12‐year follow‐up study of a middle‐aged population. Diabetes Care. 2005;28:2762–2767.
- , , , et al. Linking sleep duration and obesity among black and white US adults. Clin Pract (Lond). 2013;10(5):661–667.
- , , , et al. Gender‐specific associations of short sleep duration with prevalent and incident hypertension: the Whitehall II Study. Hypertension. 2007;50:693–700.
- , , , , , . The joint effect of sleep duration and disturbed sleep on cause‐specific mortality: results from the Whitehall II cohort study. PLoS One. 2014;9(4):e91965.
- , , , , , . Poor self‐reported sleep quality predicts mortality within one year of inpatient post‐acute rehabilitation among older adults. Sleep. 2011;34(12):1715–1721.
- , , , , . The effects of sleep deprivation on symptoms of psychopathology in healthy adults. Sleep Med. 2007;8(3):215–221.
- , , , , . Sleep deprivation and activation of morning levels of cellular and genomic markers of inflammation. Arch Intern Med. 2006;166:1756–1762.
- , , , . The metabolic consequences of sleep deprivation. Sleep Med Rev. 2007;11(3):163–178.
- , , , et al. Insomnia among hospitalized elderly patients: prevalence, clinical characteristics and risk factors. Arch Gerontol Geriatr. 2011;52:133–137.
- , , , et al. Is insomnia a marker for psychiatric disorders in general hospitals? Sleep Med. 2005;6:549–553.
- , , , , , . Perceived control and sleep in hospitalized older adults: a sound hypothesis? J Hosp Med. 2013;8:184–190.
- , , , et al. Sleep disruption due to hospital noises: a prospective evaluation. Ann Intern Med. 2012;157:170–179.
- . Sleep in acute care settings: an integrative review. J Nurs Scholarsh. 2000;32(1):31–38.
- . Physical health as it relates to insomnia. Talk presented at: Center for Behavior and Health, Lecture Series in Johns Hopkins Bayview Medical Center; July 17, 2012; Baltimore, MD.
- , , , , . The Pittsburgh Sleep Quality Index: a new instrument for psychiatric practice and research. Psychiatry Res. 1989;28:193–213.
- , . Measures of sleep: The Insomnia Severity Index, Medical Outcomes Study (MOS) Sleep Scale, Pittsburgh Sleep Diary (PSD), and Pittsburgh Sleep Quality Index (PSQI). Arthritis Rheumatol. 2003;49:S184–S196.
- , . Applied Mixed Models in Medicine. 3rd ed. Somerset, NJ: Wiley; 2014:539.
- , , , Applying mixed regression models to the analysis of repeated‐measures data in psychosomatic medicine. Psychosom Med. 2006;68(6):870–878.
- , . Using the SPSS mixed procedure to fit cross‐sectional and longitudinal multilevel models. Educ Psychol Meas. 2005;65(5):717–741.
- , . Introduction to estimation issues in multilevel modeling. New Dir Inst Res. 2012;2012(154):23–39.
- , . Centering predictor variables in cross‐sectional multilevel models: a new look at an old issue. Psychol Methods. 2007;12(2):121–138.
- , . Sleep quality in adult hospitalized patients with infection: an observational study. Am J Med Sci. 2015;349(1):56–60.
- , , , et al. Risk of sleep apnea in hospitalized older patients. J Clin Sleep Med. 2014;10:1061–1066.
- , , . Hospital ward policy and patients' sleep patterns: a multiple baseline study. Rehabil Psychol. 1989;34(1):43–50.
- , , . Non‐pharmacologic interventions to improve the sleep of hospitalized patients: a systematic review. J Gen Intern Med. 2014;29:788–795.
- , , , , , Earplugs and eye masks vs routine care prevent sleep impairment in post‐anaesthesia care unit: a randomized study. Br J Anaesth. 2014;112(1):89–95.
- , , , et al. Sleep rounds: a multidisciplinary approach to optimize sleep quality and satisfaction in hospitalized patients. J Hosp Med. 2012;7:508–512.
- , , , , . Factors affecting sleep quality of patients in intensive care unit. J Clin Sleep Med. 2012;8(3):301–307.
- . Insomnia among hospitalized older persons. Clin Geriatr Med. 2008;24(1):51–67.
- , , , . A nonpharmacological sleep protocol for hospitalized older patients. J Am Geriatr Soc. 1998;46(6):700–705.
- The Action Priority Matrix: making the most of your opportunities. TimeAnalyzer website. Available at: http://www.timeanalyzer.com/lib/priority.htm. Published 2006. Accessed July 10, 2015.
- , , , et al. Measuring sleep: accuracy, sensitivity, and specificity of wrist actigraphy compared to polysomnography. Sleep. 2013;36(11):1747–1755.
Approximately 70 million adults within the United States have sleep disorders,[1] and up to 30% of adults report sleeping less than 6 hours per night.[2] Poor sleep has been associated with undesirable health outcomes.[1] Suboptimal sleep duration and sleep quality has been associated with a higher prevalence of chronic health conditions including hypertension, type 2 diabetes, coronary artery disease, stroke, and obesity, as well as increased overall mortality.[3, 4, 5, 6, 7]
Sleep plays an important role in restoration of wellness. Poor sleep is associated with physiological disturbances that may result in poor healing.[8, 9, 10] In the literature, prevalence of insomnia among elderly hospitalized patients was 36.7%,[11] whereas in younger hospitalized patients it was 50%.[12] Hospitalized patients frequently cite their acute illness, hospital‐related environmental factors, and disruptions that are part of routine care as causes for poor sleep during hospitalization.[13, 14, 15] Although the pervasiveness of poor sleep among hospitalized patients is high, interventions that prioritize sleep optimization as routine care, are uncommon. Few studies have reviewed the effect of sleep‐promoting measures on both sleep quality and sleep duration among patients hospitalized on general medicine units.
In this study, we aimed to assess the feasibility of incorporating sleep‐promoting interventions on a general medicine unit. We sought to identify differences in sleep measures between intervention and control groups. The primary outcome that we hoped to influence and lengthen in the intervention group was sleep duration. This outcome was measured both by sleep diary and with actigraphy. Secondary outcomes that we hypothesized should improve in the intervention group included feeling more refreshed in the mornings, sleep efficiency, and fewer sleep disruptions. As a feasibility pilot, we also wanted to explore the ease or difficulty with which sleep‐promoting interventions could be incorporated to the team's workflow.
METHODS
Study Design
A quasi‐experimental prospective pilot study was conducted at a single academic center, the Johns Hopkins Bayview Medical Center. Participants included adult patients admitted to the general medicine ward from July 2013 through January 2014. Patients with dementia; inability to complete survey questionnaires due to delirium, disability, or a language barrier; active withdrawal from alcohol or controlled substances; or acute psychiatric illness were excluded in this study.
The medicine ward at our medical center is comprised of 2 structurally identical units that admit patients with similar diagnoses, disease severity, and case‐mix disease groups. Nursing and support staff are unit specific. Pertaining to the sleep environment, the units both have semiprivate and private rooms. Visitors are encouraged to leave by 10 pm. Patients admitted from the emergency room to the medicine ward are assigned haphazardly to either unit based on bed availability. For the purpose of this study, we selected 1 unit to be a control unit and identified the other as the sleep‐promoting intervention unit.
Study Procedure
Upon arrival to the medicine unit, the research team approached all patients who met study eligibility criteria for study participation. Patients were provided full disclosure of the study using institutional research guidelines, and those interested in participating were consented. Participants were not explicitly told about their group assignment. This study was approved by the Johns Hopkins Institutional Review Board for human subject research.
In this study, the control group participants received standard of care as it pertains to sleep promotion. No additional sleep‐promoting measures were implemented to routine medical care, medication administration, nursing care, and overnight monitoring. Patients who used sleep medications at home, prior to admission, had those medicines continued only if they requested them and they were not contraindicated given their acute illness. Participants on the intervention unit were exposed to a nurse‐delivered sleep‐promoting protocol aimed at transforming the culture of care such that helping patients to sleep soundly was made a top priority. Environmental changes included unit‐wide efforts to minimize light and noise disturbances by dimming hallway lights, turning off room lights, and encouraging care teams to be as quiet as possible. Other strategies focused largely on minimizing care‐related disruptions. These included, when appropriate, administering nighttime medications in the early evening, minimizing fluids overnight, and closing patient room doors where appropriate. Further, patients were offered the following sleep‐promoting items to choose from: ear plugs, eye masks, warm blankets, and relaxation music. The final component of our intervention was 30‐minute sleep hygiene education taught by a physician. It highlighted basic sleep physiology and healthy sleep behavior adapted from Buysse.[16] Patients learned the role of behaviors such as reducing time lying awake in bed, setting standard wake‐up time and sleep time, and going to bed only when sleepy. This behavioral education was supplemented by a handout with sleep‐promoting suggestions.
The care team on the intervention unit received comprehensive study‐focused training in which night nursing teams were familiarized with the sleep‐promoting protocol through in‐service sessions facilitated by 1 of the authors (E.W.G.). To further promote study implementation, sleep‐promoting procedures were supported and encouraged by supervising nurses who made daily reminders to the intervention unit night care team of the goals of the sleep‐promoting study during evening huddles performed at the beginning of each shift. To assess the adherence of the sleep protocol, the nursing staff completed a daily checklist of elements within the protocol that were employed .
Data Collection and Measures
Baseline Measures
At the time of enrollment, study patients' demographic information, including use of chronic sleep medication prior to admission, was collected. Participants were assessed for baseline sleep disturbance prior to admission using standardized, validated sleep assessment tools: Pittsburgh Sleep Quality Index (PSQI), the Insomnia Severity Index (ISI), and the Epworth Sleepiness Scale (ESS). PSQI, a 19‐item tool, assessed self‐rated sleep quality measured over the prior month; a score of 5 or greater indicated poor sleep.[17] ISI, a 7‐item tool, identified the presence, rated the severity, and described the impact of insomnia; a score of 10 or greater indicated insomnia.[18] ESS, an 8‐item self‐rated tool, evaluated the impact of perceived sleepiness on daily functioning in 8 different environments; a score of 9 or greater was linked to burden of sleepiness. Participants were also screened for both obstructive sleep apnea (using the Berlin Sleep Apnea Index) and clinical depression (using Center for Epidemiologic Studies‐Depression 10‐point scale), as these conditions affect sleep patterns. These data are shown in Table 1.
| Intervention, n = 48 | Control, n = 64 | P Value | |
|---|---|---|---|
| |||
| Age, y, mean (SD) | 58.2 (16) | 56.9 (17) | 0.69 |
| Female, n (%) | 26 (54.2) | 36 (56.3) | 0.83 |
| Race, n (%) | |||
| Caucasian | 33 (68.8) | 46 (71.9) | 0.92 |
| African American | 13 (27.1) | 16 (25.0) | |
| Other | 2 (4.2) | 2 (3.1) | |
| BMI, mean (SD) | 32.1 (9.2) | 31.8 (9.3) | 0.85 |
| Admitting service, n (%) | |||
| Teaching | 21 (43.8) | 18 (28.1) | 0.09 |
| Nonteaching | 27 (56.3) | 46 (71.9) | |
| Sleep medication prior to admission, n (%) | 7 (14.9) | 21 (32.8) | 0.03 |
| Length of stay, d, mean (SD) | 4.9 (3) | 5.8 (3.9) | 0.19 |
| Number of sleep diaries per participant, mean (SD) | 2.2 (0.8) | 2.6 (0.9) | 0.02 |
| Proportion of hospital days with sleep diaries per participant, (SD) | 0.6 (0.2) | 0.5 (0.2) | 0.71 |
| Number of nights with actigraphy per participant, mean (SD) | 1.2 (0.7) | 1.4 (0.8) | 0.16 |
| Proportion of hospital nights with actigraphy per participant (SD) | 0.3 (0.2) | 0.3 (0.1) | 0.91 |
| Baseline sleep measures | |||
| PSQI, mean (SD) | 9.9 (4.6) | 9.1 (4.5) | 0.39 |
| ESS, mean (SD) | 7.4 (4.2) | 7.7 (4.8) | 0.79 |
| ISI, mean (SD) | 11.9 (7.6) | 10.8 (7.4) | 0.44 |
| CESD‐10, mean (SD) | 12.2 (7.2) | 12.8 (7.6) | 0.69 |
| Berlin Sleep Apnea, mean (SD) | 0.63 (0.5) | 0.61 (0.5) | 0.87 |
Sleep Diary Measures
A sleep diary completed each morning assessed the outcome measures, perceived sleep quality, how refreshing sleep was, and sleep durations. The diary employed a 5‐point Likert rating scale ranging from poor (1) to excellent (5). Perceived sleep duration was calculated from patients' reported time in bed, time to fall asleep, wake time, and number and duration of awakenings after sleep onset on their sleep diary. These data were used to compute total sleep time (TST) and sleep efficiency (SE). The sleep diary also included other pertinent sleep‐related measures including use of sleep medication the night prior and specific sleep disruptions from the prior night. To measure the impact of disruptions due to disturbances the prior night, we created a summed scale score of 4 items that negatively interfered with sleep (light, temperature, noise, and interruptions; 5 point scales from 1 = not at all to 5 = significant). Analysis of principal axis factors with varimax rotation yielded 1 disruption factor accounting for 55% of the variance, and Cronbach's was 0.73.
Actigraphy Measures
Actigraphy outcomes of sleep were recorded using the actigraphy wrist watch (ActiSleep Plus (GT3X+); ActiGraph, Pensacola, FL). Participants wore the monitor from the day of enrollment throughout the hospital stay or until transfer out of the unit. Objective data were analyzed and scored using ActiLife 6 data analysis software (version 6.10.1; Actigraph). Time in bed, given the unique inpatient setting, was calculated using sleep diary responses as the interval between sleep time and reported wake up time. These were entered into the Actilife 6 software for the sleep scoring analysis using a validated algorithm, Cole‐Kripke, to calculate actigraphy TST and SE.
Statistical Analysis
Descriptive and inferential statistics were computed using Statistical Package for the Social Sciences version 22 (IBM, Armonk, NY). We computed means, proportions, and measures of dispersion for all study variables. To test differences in sleep diary and actigraphy outcomes between the intervention and control arms, we used linear mixed models with full maximum likelihood estimation to model each of the 7 continuous sleep outcomes. These statistical methods are appropriate to account for the nonindependence of continuous repeated observations within hospital patients.[19] For all outcomes, the unit of analysis was nightly observations nested within patient‐ level characteristics. The use of full maximum likelihood estimation is a robust and preferred method for handling values missing at random in longitudinal datasets.[20]
To model repeated observations, mixed models included a term representing time in days. For each outcome, we specified unconditional growth models to examine the variability between and within patients by computing intraclass correlations and inspecting variance components. We used model fit indices (‐2LL deviance, Akaike's information criterion, and Schwartz's Bayesian criterion) as appropriate to determine best fitting model specifications in terms of random effects and covariance structure.[21, 22]
We tested the main effect of the intervention on sleep outcomes and the interactive effect of group (intervention vs control) by hospital day, to test whether there were group differences in slopes representing average change in sleep outcomes over hospital days. All models adjusted for age, body mass index, depression, and baseline sleep quality (PSQI) as time‐invariant covariates, and whether participants had taken a sleep medication the day before, as a time‐varying covariate. Adjustment for prehospitalization sleep quality was a matter of particular importance. We used the PSQI to control for sleep quality because it is both a well‐validated, multidimensional measure, and it includes prehospital use of sleep medications. In a series of sensitivity analyses, we also explored whether the dichotomous self‐reported measure of whether or not participants regularly took sleep medications prior to hospitalization, rather than the PSQI, would change our substantive findings. All covariates were centered at the grand‐mean following guidelines for appropriate interpretation of regression coefficients.[23]
RESULTS
Of the 112 study patients, 48 were in the intervention unit and 64 in the control unit. Eighty‐five percent of study participants endorsed poor sleep prior to hospital admission on the PSQI sleep quality measure, which was similar in both groups (Table 1).
Participants completed 1 to 8 sleep diary entries (mean = 2.5, standard deviation = 1.1). Because only 6 participants completed 5 or more diaries, we constrained the number of diaries included in the inferential analysis to 4 to avoid influential outliers identified by scatterplots. Fifty‐seven percent of participants had 1 night of valid actigraphy data (n = 64); 29%, 2 nights (n = 32), 8% had 3 or 4 nights, and 9 participants did not have any usable actigraphy data. The extent to which the intervention was accepted by patients in the intervention group was highly variable. Unit‐wide patient adherence with the 10 pm lights off, telephone off, and TV off policy was 87%, 67%, and 64% of intervention patients, respectively. Uptake of sleep menu items was also highly variable, and not a single element was used by more than half of patients (acceptance rates ranged from 11% to 44%). Eye masks (44%) and ear plugs (32%) were the most commonly utilized items.
A greater proportion of patients in the control arm (33%) had been taking sleep medications prior to hospitalization compared to the intervention arm (15%; 2 = 4.6, P < 0.05). However, hypnotic medication use in the hospital was similar across the both groups (intervention unit patients: 25% and controls: 21%, P = 0.49).
Intraclass correlations for the 7 sleep outcomes ranged from 0.59 to 0.76 on sleep diary outcomes, and from 0.61 to 0.85 on actigraphy. Dependency of sleep measures within patients accounted for 59% to 85% of variance in sleep outcomes. The best‐fit mixed models included random intercepts only. The results of mixed models testing the main effect of intervention versus comparison arm on sleep outcome measures, adjusted for covariates, are presented in Table 2. Total sleep time was the only outcome that was significantly different between groups; the average total sleep time, calculated from sleep diary data, was longer in the intervention group by 49 minutes.
| Intervention, n = 48 | Control, n = 64 | P Value | |
|---|---|---|---|
| |||
| Sleep diary outcomes | |||
| Sleep quality, mean (SE) | 3.14 (0.16) | 3.08 (0.13) | 0.79 |
| Refreshed sleep, mean (SE) | 2.94 (0.17) | 2.74 (0.14) | 0.38 |
| Negative impact of sleep disruptions, mean (SE) | 4.39 (0.58) | 4.81 (0.48) | 0.58 |
| Total sleep time, min, mean (SE) | 422 (16.2) | 373 (13.2) | 0.02 |
| Sleep efficiency, %, mean (SE) | 83.5 (2.3) | 82.1 (1.9) | 0.65 |
| Actigraphy outcomes | |||
| Total sleep time, min, mean (SE) | 377 (16.8) | 356 (13.2) | 0.32 |
| Sleep efficiency, %, mean (SE) | 72.7 (2.2) | 74.8 (1.8) | 0.45 |
Table 3 lists slopes representing average change in sleep measures over hospital days in both groups. The P values represent z tests of interaction terms in mixed models, after adjustment for covariates, testing whether slopes significantly differed between groups. Of the 7 outcomes, 3 sleep diary measures had significant interaction terms. For ratings of sleep quality, refreshing sleep, and sleep disruptions, slopes in the control group were flat, whereas slopes in the intervention group demonstrated improvements in ratings of sleep quality and refreshed sleep, and a decrease in the impact of sleep disruptions over the course of subsequent nights in the hospital. Figure 1 illustrates a plot of the adjusted average slopes for the refreshed sleep score across hospital days in intervention and control groups.
| Intervention, Slope (SE), n = 48 | Control, Slope (SE), n = 64 | P Value | |
|---|---|---|---|
| |||
| Refreshed sleep rating | 0.55 (0.18) | 0.03 (0.13) | 0.006 |
| Sleep quality rating | 0.52 (0.16) | 0.02 (0.11) | 0.012 |
| Negative impact of sleep interruptions | 1.65 (0.48) | 0.05 (0.32) | 0.006 |
| Total sleep time, diary | 11.2 (18.1) | 6.3 (13.0) | 0.44 |
| Total sleep time, actigraphy | 7.3 (25.5) | 1.0 (15.3) | 0.83 |
| Sleep efficiency, diary | 1.1 (2.3) | 1.5 (1.6) | 0.89 |
| Sleep efficiency, actigraphy | 0.9 (4.0) | 0.7 (2.4) | 0.74 |
DISCUSSION
Poor sleep is common among hospitalized adults, both at home prior to the admission and especially when in the hospital. This pilot study demonstrated the feasibility of rolling out a sleep‐promoting intervention on a hospital's general medicine unit. Although participants on the intervention unit reported improved sleep quality and feeling more refreshed, this was not supported by actigraphy data (such as sleep time or sleep efficiency). Although care team engagement and implementation of unit‐wide interventions were high, patient use of individual components was imperfect. Of particular interest, however, the intervention group actually began to have improved sleep quality and fewer disruptions with subsequent nights sleeping in the hospital.
Our findings of the high prevalence of poor sleep among hospitalized patients is congruent with prior studies and supports the great need to screen for and address poor sleep within the hospital setting.[24, 25, 26] Attempts to promote sleep among hospitalized patients may be effective. Prior literature on sleep‐promoting intervention studies demonstrated relaxation techniques improved sleep quality by almost 38%,[27] and ear plugs and eye masks showed some benefit in promoting sleep within the hospital.[28] Our study's multicomponent intervention that attempted to minimize disruptions led to improvement in sleep quality, more restorative sleep, and decreased report of sleep disruptions, especially among patients who had a longer length of stay. As suggested by Thomas et al.[29] and seen in our data, this temporal relationship with improvement across subsequent nights suggests there may be an adaptation to the new environment and that it may take time for the sleep intervention to work.
Hospitalized patients often fail to reclaim the much‐needed restorative sleep at the time when they are most vulnerable. Patients cite routine care as the primary cause of sleep disruption, and often recognize the way that the hospital environment interferes with their ability to sleep.[30, 31, 32] The sleep‐promoting interventions used in our study would be characterized by most as low effort[33] and a potential for high yield, even though our patients only appreciated modest improvements in sleep outcomes.
Several limitations of this study should be considered. First, although we had hoped to collect substantial amounts of objective data, the average time of actigraphy observation was less than 48 hours. This may have constrained the group by time interaction analysis with actigraphy data, as studies have shown increased accuracy in actigraphy measures with longer wear.[34] By contrast, the sleep diary survey collected throughout hospitalization yielded significant improvements in consecutive daily measurements. Second, the proximity of the study units raised concern for study contamination, which could have reduced the differences in the outcome measures that may have been observed. Although the physicians work on both units, the nursing and support care teams are distinct and unit dependent. Finally, this was not a randomized trial. Patient assignment to the treatment arms was haphazard and occurred within the hospital's admitting strategy. Allocation of patients to either the intervention or the control group was based on bed availability at the time of admission. Although both groups were similar in most characteristics, more of the control participants reported taking more sleep medications prior to admission as compared to the intervention participants. Fortunately, hypnotic use was not different between groups during the admission, the time when sleep data were being captured.
Overall, this pilot study suggests that patients admitted to general medical ward fail to realize sufficient restorative sleep when they are in the hospital. Sleep disruption is rather frequent. This study demonstrates the opportunity for and feasibility of sleep‐promoting interventions where facilitating sleep is considered to be a top priority and vital component of the healthcare delivery. When trying to improve patients' sleep in the hospital, it may take several consecutive nights to realize a return on investment.
Acknowledgements
The authors acknowledge the Department of Nursing, Johns Hopkins Bayview Medical Center, and care teams of the Zieve Medicine Units, and the Center for Child and Community Health Research Biostatistics, Epidemiology and Data Management (BEAD) Core group.
Disclosures: Dr. Wright is a Miller‐Coulson Family Scholar and is supported through the Johns Hopkins Center for Innovative Medicine. Dr. Howell is the chief of the Division of Hospital Medicine at Johns Hopkins Bayview Medical Center and associate professor at Johns Hopkins School of Medicine. He served as the president of the Society of Hospital Medicine (SHM) in 2013 and currently serves as a board member. He is also a senior physician advisor for SHM. He is a coinvestigator grant recipient on an Agency for Healthcare Research and Quality grant on medication reconciliation funded through Baylor University. He was previously a coinvestigator grant recipient of Center for Medicare and Medicaid Innovations grant that ended in June 2015.
- Institute of Medicine (US) Committee on Sleep Medicine and Research. Sleep disorders and sleep deprivation: an unmet public health problem. Washington, DC: National Academies Press; 2006. Available at: http://www.ncbi.nlm.nih.gov/books/NBK19960. Accessed September 16, 2014.
- , . Health behaviors of adults: United States, 2005–2007. Vital Health Stat 10. 2010;245:1–132.
- , , . High incidence of diabetes in men with sleep complaints or short sleep duration: a 12‐year follow‐up study of a middle‐aged population. Diabetes Care. 2005;28:2762–2767.
- , , , et al. Linking sleep duration and obesity among black and white US adults. Clin Pract (Lond). 2013;10(5):661–667.
- , , , et al. Gender‐specific associations of short sleep duration with prevalent and incident hypertension: the Whitehall II Study. Hypertension. 2007;50:693–700.
- , , , , , . The joint effect of sleep duration and disturbed sleep on cause‐specific mortality: results from the Whitehall II cohort study. PLoS One. 2014;9(4):e91965.
- , , , , , . Poor self‐reported sleep quality predicts mortality within one year of inpatient post‐acute rehabilitation among older adults. Sleep. 2011;34(12):1715–1721.
- , , , , . The effects of sleep deprivation on symptoms of psychopathology in healthy adults. Sleep Med. 2007;8(3):215–221.
- , , , , . Sleep deprivation and activation of morning levels of cellular and genomic markers of inflammation. Arch Intern Med. 2006;166:1756–1762.
- , , , . The metabolic consequences of sleep deprivation. Sleep Med Rev. 2007;11(3):163–178.
- , , , et al. Insomnia among hospitalized elderly patients: prevalence, clinical characteristics and risk factors. Arch Gerontol Geriatr. 2011;52:133–137.
- , , , et al. Is insomnia a marker for psychiatric disorders in general hospitals? Sleep Med. 2005;6:549–553.
- , , , , , . Perceived control and sleep in hospitalized older adults: a sound hypothesis? J Hosp Med. 2013;8:184–190.
- , , , et al. Sleep disruption due to hospital noises: a prospective evaluation. Ann Intern Med. 2012;157:170–179.
- . Sleep in acute care settings: an integrative review. J Nurs Scholarsh. 2000;32(1):31–38.
- . Physical health as it relates to insomnia. Talk presented at: Center for Behavior and Health, Lecture Series in Johns Hopkins Bayview Medical Center; July 17, 2012; Baltimore, MD.
- , , , , . The Pittsburgh Sleep Quality Index: a new instrument for psychiatric practice and research. Psychiatry Res. 1989;28:193–213.
- , . Measures of sleep: The Insomnia Severity Index, Medical Outcomes Study (MOS) Sleep Scale, Pittsburgh Sleep Diary (PSD), and Pittsburgh Sleep Quality Index (PSQI). Arthritis Rheumatol. 2003;49:S184–S196.
- , . Applied Mixed Models in Medicine. 3rd ed. Somerset, NJ: Wiley; 2014:539.
- , , , Applying mixed regression models to the analysis of repeated‐measures data in psychosomatic medicine. Psychosom Med. 2006;68(6):870–878.
- , . Using the SPSS mixed procedure to fit cross‐sectional and longitudinal multilevel models. Educ Psychol Meas. 2005;65(5):717–741.
- , . Introduction to estimation issues in multilevel modeling. New Dir Inst Res. 2012;2012(154):23–39.
- , . Centering predictor variables in cross‐sectional multilevel models: a new look at an old issue. Psychol Methods. 2007;12(2):121–138.
- , . Sleep quality in adult hospitalized patients with infection: an observational study. Am J Med Sci. 2015;349(1):56–60.
- , , , et al. Risk of sleep apnea in hospitalized older patients. J Clin Sleep Med. 2014;10:1061–1066.
- , , . Hospital ward policy and patients' sleep patterns: a multiple baseline study. Rehabil Psychol. 1989;34(1):43–50.
- , , . Non‐pharmacologic interventions to improve the sleep of hospitalized patients: a systematic review. J Gen Intern Med. 2014;29:788–795.
- , , , , , Earplugs and eye masks vs routine care prevent sleep impairment in post‐anaesthesia care unit: a randomized study. Br J Anaesth. 2014;112(1):89–95.
- , , , et al. Sleep rounds: a multidisciplinary approach to optimize sleep quality and satisfaction in hospitalized patients. J Hosp Med. 2012;7:508–512.
- , , , , . Factors affecting sleep quality of patients in intensive care unit. J Clin Sleep Med. 2012;8(3):301–307.
- . Insomnia among hospitalized older persons. Clin Geriatr Med. 2008;24(1):51–67.
- , , , . A nonpharmacological sleep protocol for hospitalized older patients. J Am Geriatr Soc. 1998;46(6):700–705.
- The Action Priority Matrix: making the most of your opportunities. TimeAnalyzer website. Available at: http://www.timeanalyzer.com/lib/priority.htm. Published 2006. Accessed July 10, 2015.
- , , , et al. Measuring sleep: accuracy, sensitivity, and specificity of wrist actigraphy compared to polysomnography. Sleep. 2013;36(11):1747–1755.

Development and Validation of TAISCH
Patient satisfaction scores are being reported publicly and will affect hospital reimbursement rates under Hospital Value Based Purchasing.[1] Patient satisfaction scores are currently obtained through metrics such as Hospital Consumer Assessment of Healthcare Providers and Systems (HCAHPS)[2] and Press Ganey (PG)[3] surveys. Such surveys are mailed to a variable proportion of patients following their discharge from the hospital, and ask patients about the quality of care they received during their admission. Domains assessed regarding the patients' inpatient experiences range from room cleanliness to the amount of time the physician spent with them.
The Society of Hospital Medicine (SHM), the largest professional medical society representing hospitalists, encourages the use of patient satisfaction surveys to measure hospitalist providers' quality of patient care.[4] Ideally, accurate information would be delivered as feedback to individual providers in a timely manner in hopes of improving performance; however, the current methodology has shortcomings that limit its usefulness. First, several hospitalists and consultants may be involved in the care of 1 patient during the hospital stay, but the score can only be tied to a single physician. Current survey methods attribute all responses to that particular doctor, usually the attending of record, although patients may very well be thinking of other physicians when responding to questions. Second, only a few questions on the surveys ask about doctors' performance. Aforementioned surveys have 3 to 8 questions about doctors' care, which limits the ability to assess physician performance comprehensively. Finally, the surveys are mailed approximately 1 week after the patient's discharge, usually without a name or photograph of the physician to facilitate patient/caregiver recall. This time lag and lack of information to prompt patient recall likely lead to impreciseness in assessment. In addition, the response rates to these surveys are typically low, around 25% (personal oral communication with our division's service excellence stakeholder Dr. L.P. in September 2013). These deficiencies limit the usefulness of such data in coaching individual providers about their performance because they cannot be delivered in a timely fashion, and the reliability of the attribution is suspect.
With these considerations in mind, we developed and validated a new survey metric, the Tool to Assess Inpatient Satisfaction with Care from Hospitalists (TAISCH). We hypothesized that the results would be different from those collected using conventional methodologies.
PATIENTS AND METHODS
Study Design and Subjects
Our cross‐sectional study surveyed inpatients under the care of hospitalist physicians working without the support of trainees or allied health professionals (such as nurse practitioners or physician assistants). The subjects were hospitalized at a 560‐bed academic medical center on a general medical floor between September 2012 and December 2012. All participating hospitalist physicians were members of a division of hospital medicine.
TAISCH Development
Several steps were taken to establish content validity evidence.[5] We developed TAISCH by building upon the theoretical underpinnings of the quality of care measures that are endorsed by the SHM Membership Committee Guidelines for Hospitalists Patient Satisfaction.[4] This directive recommends that patient satisfaction with hospitalist care should be assessed across 6 domains: physician availability, physician concern for patients, physician communication skills, physician courteousness, physician clinical skills, and physician involvement of patients' families. Other existing validated measures tied to the quality of patient care were reviewed, and items related to the physician's care were considered for inclusion to further substantiate content validity.[6, 7, 8, 9, 10, 11, 12] Input from colleagues with expertise in clinical excellence and service excellence was also solicited. This included the director of Hopkins' Miller Coulson Academy of Clinical Excellence and the grant review committee members of the Johns Hopkins Osler Center for Clinical Excellence (who funded this study).[13, 14]
The preliminary instrument contained 17 items, including 2 conditional questions, and was first pilot tested on 5 hospitalized patients. We assessed the time it took to administer the surveys as well as patients' comments and questions about each survey item. This resulted in minor wording changes for clarification and changes in the order of the questions. We then pursued a second phase of piloting using the revised survey, which was administered to >20 patients. There were no further adjustments as patients reported that TAISCH was clear and concise.
From interviews with patients after pilot testing, it became clear that respondents were carefully reflecting on the quality of care and performance of their treating physician, thereby generating response process validity evidence.[5]
Data Collection
To ensure that patients had perspective upon which to base their assessment, they were only asked to appraise physicians after being cared for by the same hospitalist provider for at least 2 consecutive days. Patients who were on isolation, those who were non‐English speaking, and those with impaired decision‐making capacity (such as mental status change or dementia) were excluded. Patients were enrolled only if they could correctly name their doctor or at least identify a photograph of their hospitalist provider on a page that included pictures of all division members. Those patients who were able to name the provider or correctly select the provider from the page of photographs were considered to have correctly identified their provider. In order to ensure the confidentiality of the patients and their responses, all data collections were performed by a trained research assistant who had no patient‐care responsibilities. The survey was confidential, did not include any patient identifiers, and patients were assured that providers would never see their individual responses. The patients were given options to complete TAISCH either by verbally responding to the research assistant's questions, filling out the paper survey, or completing the survey online using an iPad at the bedside. TAISCH specifically asked the patients to rate their hospitalist provider's performance along several domains: communication skills, clinical skills, availability, empathy, courteousness, and discharge planning; 5‐point Likert scales were used exclusively.
In addition to the TAISCH questions, we asked patients (1) an overall satisfaction question, I would recommend Dr. X to my loved ones should he or she need hospitalization in the future (response options: strongly disagree, disagree, neutral, agree, strongly agree), (2) their pain level using the Wong‐Baker pain scale,[15] and (3) the Jefferson Scale of Patient's Perceptions of Physician Empathy (JSPPPE).[16, 17] Associations between TAISCH and these variables (as well as PG data) would be examined to ascertain relations to other variables validity evidence.[5] Specifically, we sought to ascertain discriminant and convergent validity where the TAISCH is associated positively with constructs where we expect positive associations (convergent) and negatively with those we expect negative associations (discriminant).[18] The Wong‐Baker pain scale is a recommended pain‐assessment tool by the Joint Commission on Accreditation of Healthcare Organizations, and is widely used in hospitals and various healthcare settings.[19] The scale has a range from 0 to 10 (0 for no pain and 10 indicating the worst pain). The hypothesis was that the patients' pain levels would adversely affect their perception of the physician's performance (discriminant validity). JSPPPE is a 5‐item validated scale developed to measure patients' perceptions of their physicians' empathic engagement. It has significant correlations with the American Board of Internal Medicine's patient rating surveys, and it is used in standardized patient examinations for medical students.[20] The hypothesis was that patient perception about the quality of physician care would correlate positively with their assessment of the physician's empathy (convergent validity).
Although all of the hospitalist providers in the division consented to participate in this study, only hospitalist providers for whom at least 4 patient surveys were collected were included in the analysis. The study was approved by our institutional review board.
Data Analysis
All data were analyzed using Stata 11 (StataCorp, College Station, TX). Data were analyzed to determine the potential for a single comprehensive assessment of physician performance with confirmatory factor analysis (CFA) using maximum likelihood extraction. Additional factor analyses examined the potential for a multiple factor solution using exploratory factor analysis (EFA) with principle component factor analysis and varimax rotation. Examination of scree plots, factor loadings for individual items greater than 0.40, eigenvalues greater than 1.0, and substantive meaning of the factors were all taken into consideration when determining the number of factors to retain from factor analytic models.[21] Cronbach's s were calculated for each factor to assess reliability. These data provided internal structure validity evidence (demonstrated by acceptable reliability and factor structure) to TAISCH.[5]
After arriving at the final TAISCH scale, composite TAISCH scores were computed. Associations between composite TAISCH scores with the Wong‐Baker pain scale, the JSPPPE, and the overall satisfaction question were assessed using linear regression with the svy command in Stata to account for the nested design of having each patient report on a single hospitalist provider. Correlation between composite TAISCH score and PG physician care scores (comprised of 5 questions: time physician spent with you, physician concern with questions/worries, physician kept you informed, friendliness/courtesy of physician, and skill of physician) were assessed at the provider level when both data were available.
RESULTS
A total of 330 patients were considered to be eligible through medical record screening. Of those patients, 73 (22%) were already discharged by the time the research assistant attempted to enroll them after 2 days of care by a single physician. Of 257 inpatients approached, 30 patients (12%) refused to participate. Among the 227 consented patients, 24 (9%) were excluded as they were unable to correctly identify their hospitalist provider. A total of 203 patients were enrolled, and each patient rated a single hospitalist; a total of 29 unique hospitalists were assessed by these patients. The patients' mean age was 60 years, 114 (56%) were female, and 61 (30%) were of nonwhite race (Table 1). The hospitalist physicians' demographic information is also shown in Table 1. Two hospitalists with fewer than 4 surveys collected were excluded from the analysis. Thus, final analysis included 200 unique patients assessing 1 of the 27 hospitalists (mean=7.4 surveys per hospitalist).
| Characteristics | Value |
|---|---|
| |
| Patients, N=203 | |
| Age, y, mean (SD) | 60.0 (17.2) |
| Female, n (%) | 114 (56.1) |
| Nonwhite race, n (%) | 61 (30.5) |
| Observation stay, n (%) | 45 (22.1) |
| How are you feeling today? n (%) | |
| Very poor | 11 (5.5) |
| Poor | 14 (7.0) |
| Fair | 67 (33.5) |
| Good | 71 (35.5) |
| Very good | 33 (16.5) |
| Excellent | 4 (2.0) |
| Hospitalists, N=29 | |
| Age, n (%) | |
| 2630 years | 7 (24.1) |
| 3135 years | 8 (27.6) |
| 3640 years | 12 (41.4) |
| 4145 years | 2 (6.9) |
| Female, n (%) | 11 (37.9) |
| International medical graduate, n (%) | 18 (62.1) |
| Years in current practice, n (%) | |
| <1 | 9 (31.0) |
| 12 | 7 (24.1) |
| 34 | 6 (20.7) |
| 56 | 5 (17.2) |
| 7 or more | 2 (6.9) |
| Race, n (%) | |
| Caucasian | 4 (13.8) |
| Asian | 19 (65.5) |
| African/African American | 5 (17.2) |
| Other | 1 (3.4) |
| Academic rank, n (%) | |
| Assistant professor | 9 (31.0) |
| Clinical instructor | 10 (34.5) |
| Clinical associate/nonfaculty | 10 (34.5) |
| Percentage of clinical effort, n (%) | |
| >70% | 6 (20.7) |
| 50%70% | 19 (65.5) |
| <50% | 4 (13.8) |
Validation of TAISCH
On the 17‐item TAISCH administered, the 2 conditional questions (When I asked to see Dr. X, s/he came within a reasonable amount of time. and If Dr. X interacted with your family, how well did s/he deal with them?) were applicable to fewer than 40% of patients. As such, they were not included in the analysis.
Internal Structure Validity Evidence
Results from factor analyses are shown in Table 2. The CFA modeling of a single factor solution with 15 items explained 42% of the total variance. The 27 hospitalists' average 15‐item TAISCH score ranged from 3.25 to 4.28 (mean [standard deviation]=3.82 [0.24]; possible score range: 15). Reliability of the 15‐item TAISCH was appropriate (Cronbach's =0.88).
| TAISCH (Cronbach's =0.88) | Factor Loading |
|---|---|
| |
| Compared to all other physicians that you know, how do you rate Dr. X's compassion, empathy, and concern for you?* | 0.91 |
| Compared to all other physicians that you know, how do you rate Dr. X's ability to communicate with you?* | 0.88 |
| Compared to all other physicians that you know, how do you rate Dr. X's skill in diagnosing and treating your medical conditions?* | 0.88 |
| Compared to all other physicians that you know, how do you rate Dr. X's fund of knowledge?* | 0.80 |
| How much confidence do you have in Dr. X's plan for your care? | 0.71 |
| Dr. X kept me informed of the plans for my care. | 0.69 |
| Effectively preparing patients for discharge is an important part of what doctors in the hospital do. How well has Dr. X done in getting you ready to be discharged from the hospital? | 0.67 |
| Dr. X let me talk without interrupting. | 0.60 |
| Dr. X encouraged me to ask questions. | 0.59 |
| Dr. X checks to be sure I understood everything. | 0.55 |
| I sensed Dr. X was in a rush when s/he was with me. (reverse coded) | 0.55 |
| Dr. X showed interest in my views and opinions about my health. | 0.54 |
| Dr. X discusses options with me and involves me in decision making. | 0.47 |
| Dr. X asked permission to enter the room and waited for an answer. | 0.25 |
| Dr. X sat down when s/he visited my bedside. | 0.14 |
As shown in Table 2, 2 variables had factor loadings below the minimum threshold of 0.40 in the CFA for the 15‐item TAISCH when modeling a single factor solution. Both items were related to physician etiquette: Dr. X asked permission to enter the room and waited for an answer. and Dr. X sat down when he/she visited my bedside.
When CFA was executed again, as a single factor omitting the 2 items that demonstrated lower factor loadings, the 13‐item single factor solution explained 47% of the total variance, and the Cronbach's was 0.92.
EFA models were also explored for potential alternate solutions. These analyses resulted in lesser reliability (low Cronbach's ), weak construct operationalization, and poor face validity (as judged by the research team).
Both the 13‐ and 15‐item single factor solutions were examined further to determine whether associations with criterion variables (pain, empathy) differed substantively. Given that results were similar across both solutions, subsequent analyses were completed with the 15‐item single factor solution, which included the etiquette‐related variables.
Relationship to Other Variables Validity Evidence
The association between the 15‐item TAISCH and JSPPPE was significantly positive (=12.2, P<0.001). Additionally, there was a positive and significant association between TAISCH and the overall satisfaction question: I would recommend Dr. X to my loved ones should they need hospitalization in the future. (=11.2, P<0.001). This overall satisfaction question was also associated positively with JSPPPE (=13.2, P<0.001). There was a statistically significant negative association between TAISCH and Wong‐Baker pain scale (=2.42, P<0.05).
The PG data from the same period were available for 24 out of 27 hospitalists. The number of PG surveys collected per provider ranged from 5 to 30 (mean=14). At the provider level, there was not a statistically significant correlation between PG and the 15‐item TAISCH (P=0.51). Of note, PG was also not significantly correlated with the overall satisfaction question, JSPPPE, or the Wong‐Baker pain scale (all P>0.10).
DISCUSSION
Our new metric, TAISCH, was found to be a reliable and valid measurement tool to assess patient satisfaction with the hospitalist physician's care. Because we only surveyed patients who could correctly identify their hospitalist physicians after interacting for at least 2 consecutive days, the attribution of the data to the individual hospitalist is almost certainly correct. The high participation rate indicates that the patients were not hesitant about rating their hospitalist provider's quality of care, even when asked while they were still in the hospital.
The majority of the patients approached were able to correctly identify their hospitalist provider. This rate (91%) was much higher than the rate previously reported in the literature where a picture card was used to improve provider recognition.[22] It is also likely that 1 physician, rather than a team of physicians, taking care of patients make it easier for patients to recall the name and recognize the face of their inpatient provider.
The CFA of TAISCH showed good fit but suggests that 2 variables, both from Kahn's etiquette‐based medicine (EtBM) checklist,[9] may not load in the same way as the other items. Tackett and colleagues reported that hospitalists who performed more EtBM behaviors scored higher on PG evaluations.[23] Such results, along with the comparable explanation of variance and reliability, convinced us to retain these 2 items in the final 15‐item TAISCH as dictated by the CFA. Although the literature supports the fact that physician etiquette is related to perception of high‐quality care, it is possible that these 2 questions were answered differently (and thereby failed to load the same way), because environmental limitations may be preventing physicians' ability to perform them consistently. We prefer the 15‐item version of TAISCH and future studies may provide additional information about its performance as compared to the 13‐item adaptation.
The significantly negative association between the Wong‐Baker pain scale and TAISCH stresses the importance of adequately addressing and treating the patient's pain. Hanna et al. showed that the patients' perceptions of pain control was associated with their overall satisfaction score measured by HCAHPS.[24] The association seen in our study was not unexpected, because TAISCH is administered while the patients are acutely ill in the hospital, when pain is likely more prevalent and severe than it is during the postdischarge settings (when the HCAHPS or PG surveys are administered). Interestingly, Hanna et al. discovered that the team's attention to controlling pain was more strongly correlated with overall satisfaction than was the actual pain control.[24] These data, now confirmed by our study, should serve to remind us that a hospitalist's concern and effort to relieve pain may augment patient satisfaction with the quality of care, even when eliminating the pain may be difficult or impossible.
TAISCH was found not to be correlated with PG scores. Several explanations for this deserve consideration. First, the postdischarge PG survey that is used for our institution does not list the name of the specific hospitalist providers for the patients to evaluate. Because patients encounter multiple physicians during their hospital stay (eg, emergency department physicians, hospitalist providers, consultants), it is possible that patients are not reflecting on the named doctor when assessing the the attending of record on the PG mailed questionnaire. Second, the representation of patients who responded to TAISCH and PG were different; almost all patients completed TAISCH as opposed to a small minority who decide to respond to the PG survey. Third, TAISCH measures the physicians' performance more comprehensively with a larger number of variables. Last, it is possible that we were underpowered to detect significant correlation, because there were only 24 providers who had data from both TAISCH and PG. However, our results endorse using caution in interpreting PG scores for individual hospitalist's performance, particularly for high‐stakes consequences (including the provision of incentives to high performer and the insistence on remediation for low performers).
Several limitations of this study should be considered. First, only hospitalist providers from a single division were assessed. This may limit the generalizability of our findings. Second, although patients were assured about confidentiality of their responses, they might have provided more favorable answers, because they may have felt uncomfortable rating their physician poorly. One review article of the measurement of healthcare satisfaction indicated that impersonal (mailed) methods result in more criticism and lower satisfaction than assessments made in person using interviews. As the trade‐off, the mailed surveys yield lower response rates that may introduce other forms of bias.[25] Even on the HCHAPS survey report for the same period from our institution, 78% of patients gave top box ratings for our doctors' communication skills, which is at the state average.[26] Similarly, a study that used postdischarge telephone interviews to collect patients' satisfaction with hospitalists' care quality reported an average score of 4.20 out of 5.[27] These findings confirm that highly skewed ratings are common for these types of surveys, irrespective of how or when the data are collected.
Despite the aforementioned limitations, TAISCH use need not be limited to hospitalist physicians. It may also be used to assess allied health professionals or trainees performance, which cannot be assessed by HCHAPS or PG. Applying TAISCH in different hospital settings (eg, emergency department or critical care units), assessing hospitalists' reactions to TAISCH, learning whether TAISCH leads to hospitalists' behavior changes or appraising whether performance can improve in response to coaching interventions for those performing poorly are all research questions that merit additional consideration.
CONCLUSION
TAISCH allows for obtaining patient satisfaction data that are highly attributable to specific hospitalist providers. The data collection method also permits high response rates so that input comes from almost all patients. The timeliness of the TAISCH assessments also makes it possible for real‐time service recovery, which is impossible with other commonly used metrics assessing patient satisfaction. Our next step will include testing the most effective way to provide feedback to providers and to coach these individuals so as to improve performance.
Acknowledgements
The authors would like to thank Po‐Han Chen at the BEAD Core for his statistical analysis support.
Disclosures: This study was supported by the Johns Hopkins Osler Center for Clinical Excellence. Dr. Wright is a Miller‐Coulson Family Scholar and is supported through the Johns Hopkins Center for Innovative Medicine. The authors report no conflicts of interest.
- , . Hospital value‐based purchasing. J Hosp Med. 2013;8:271–277.
- HCAHPS survey. Hospital Consumer Assessment of Healthcare Providers and Systems website. Available at: http://www.hcahpsonline.org/home.aspx. Accessed August 27, 2011.
- Press Ganey survey. Press Ganey website. Available at: http://www.pressganey.com/index.aspx. Accessed February 12, 2013.
- Society of Hospital Medicine. Membership Committee Guidelines for Hospitalists Patient Satisfaction Surveys. Available at: http://www.hospitalmedicine.org/AM/Template.cfm?Section=Practice_Resources119:166.e7–e16.
- , , . Measuring patient views of physician communication skills: development and testing of the Communication Assessment Tool. Patient Educ Couns. 2007;67:333–342.
- , , . The Picker Patient Experience Questionnaire: development and validation using data from in‐patient surveys in five countries. Int J Qual Health Care. 2002;14:353–358.
- The Patient Satisfaction Questionnaire from RAND Health. RAND Health website. Available at: http://www.rand.org/health/surveys_tools/psq.html. Accessed December 30, 2011.
- . Etiquette‐based medicine. N Engl J Med. 2008;358:1988–1989.
- , , , . Defining clinical excellence in academic medicine: a qualitative study of the master clinicians. Mayo Clin Proc. 2008;83:989–994.
- , , , , . Creating an academy of clinical excellence at Johns Hopkins Bayview Medical Center: a 3‐year experience. Acad Med. 2010;85:1833–1839.
- , , , , . Patients' perspectives on ideal physician behaviors. Mayo Clin Proc. 2006;81(3):338–344.
- The Miller‐Coulson Academy of Clinical Excellence at Johns Hopkins. Available at: http://www.hopkinsmedicine.org/innovative/signature_programs/academy_of_clinical_excellence/. Accessed April 25, 2014.
- Osler Center for Clinical Excellence at Johns Hopkins. Available at: http://www.hopkinsmedicine.org/johns_hopkins_bayview/education_training/continuing_education/osler_center_for_clinical_excellence. Accessed April 25, 2014.
- Wong‐Baker FACES Foundation. Available at: http://www.wongbakerfaces.org. Accessed July 8, 2013.
- , , , , . Jefferson Scale of Patient's Perceptions of Physician Empathy: preliminary psychometric data. Croat Med J. 2007;48:81–86.
- , , , , . Relationships between scores on the Jefferson Scale of Physician Empathy, patient perceptions of physician empathy, and humanistic approaches to patient care: a validity study. Med Sci Monit. 2007;13(7):CR291–CR294.
- , . Convergent and discriminant validation by the multitrait‐multimethod matrix. Psychol Bul. 1959;56(2):81–105.
- The Joint Commission. Facts about pain management. Available at: http://www.jointcommission.org/pain_management. Accessed April 25, 2014.
- , , , et al. Medical students' self‐reported empathy and simulated patients' assessments of student empathy: an analysis by gender and ethnicity. Acad Med. 2011;86(8):984–988.
- . Factor Analysis. Hillsdale, NJ: Lawrence Erlbaum Associates; 1983.
- , , , et al. Improving inpatients' identification of their doctors: use of FACE cards. Jt Comm J Qual Pateint Saf. 1009;35(12):613–619.
- , , et al. Appraising the practice of etiquette‐based medicine in the inpatient setting. J Gen Intern Med. 2013;28(7):908–913.
- , , , et al. Does patient perception of pain control affect patient satisfaction across surgical units in a tertiary teaching hospital? Am J Med Qual. 2012;27:411–416.
- , , , et al. The measurement of satisfaction with health care: implications for practice from a systematic review of the literature. Health Technol Assess. 2002;6(32):1–244.
- Centers for Medicare 7(2):131–136.
Patient satisfaction scores are being reported publicly and will affect hospital reimbursement rates under Hospital Value Based Purchasing.[1] Patient satisfaction scores are currently obtained through metrics such as Hospital Consumer Assessment of Healthcare Providers and Systems (HCAHPS)[2] and Press Ganey (PG)[3] surveys. Such surveys are mailed to a variable proportion of patients following their discharge from the hospital, and ask patients about the quality of care they received during their admission. Domains assessed regarding the patients' inpatient experiences range from room cleanliness to the amount of time the physician spent with them.
The Society of Hospital Medicine (SHM), the largest professional medical society representing hospitalists, encourages the use of patient satisfaction surveys to measure hospitalist providers' quality of patient care.[4] Ideally, accurate information would be delivered as feedback to individual providers in a timely manner in hopes of improving performance; however, the current methodology has shortcomings that limit its usefulness. First, several hospitalists and consultants may be involved in the care of 1 patient during the hospital stay, but the score can only be tied to a single physician. Current survey methods attribute all responses to that particular doctor, usually the attending of record, although patients may very well be thinking of other physicians when responding to questions. Second, only a few questions on the surveys ask about doctors' performance. Aforementioned surveys have 3 to 8 questions about doctors' care, which limits the ability to assess physician performance comprehensively. Finally, the surveys are mailed approximately 1 week after the patient's discharge, usually without a name or photograph of the physician to facilitate patient/caregiver recall. This time lag and lack of information to prompt patient recall likely lead to impreciseness in assessment. In addition, the response rates to these surveys are typically low, around 25% (personal oral communication with our division's service excellence stakeholder Dr. L.P. in September 2013). These deficiencies limit the usefulness of such data in coaching individual providers about their performance because they cannot be delivered in a timely fashion, and the reliability of the attribution is suspect.
With these considerations in mind, we developed and validated a new survey metric, the Tool to Assess Inpatient Satisfaction with Care from Hospitalists (TAISCH). We hypothesized that the results would be different from those collected using conventional methodologies.
PATIENTS AND METHODS
Study Design and Subjects
Our cross‐sectional study surveyed inpatients under the care of hospitalist physicians working without the support of trainees or allied health professionals (such as nurse practitioners or physician assistants). The subjects were hospitalized at a 560‐bed academic medical center on a general medical floor between September 2012 and December 2012. All participating hospitalist physicians were members of a division of hospital medicine.
TAISCH Development
Several steps were taken to establish content validity evidence.[5] We developed TAISCH by building upon the theoretical underpinnings of the quality of care measures that are endorsed by the SHM Membership Committee Guidelines for Hospitalists Patient Satisfaction.[4] This directive recommends that patient satisfaction with hospitalist care should be assessed across 6 domains: physician availability, physician concern for patients, physician communication skills, physician courteousness, physician clinical skills, and physician involvement of patients' families. Other existing validated measures tied to the quality of patient care were reviewed, and items related to the physician's care were considered for inclusion to further substantiate content validity.[6, 7, 8, 9, 10, 11, 12] Input from colleagues with expertise in clinical excellence and service excellence was also solicited. This included the director of Hopkins' Miller Coulson Academy of Clinical Excellence and the grant review committee members of the Johns Hopkins Osler Center for Clinical Excellence (who funded this study).[13, 14]
The preliminary instrument contained 17 items, including 2 conditional questions, and was first pilot tested on 5 hospitalized patients. We assessed the time it took to administer the surveys as well as patients' comments and questions about each survey item. This resulted in minor wording changes for clarification and changes in the order of the questions. We then pursued a second phase of piloting using the revised survey, which was administered to >20 patients. There were no further adjustments as patients reported that TAISCH was clear and concise.
From interviews with patients after pilot testing, it became clear that respondents were carefully reflecting on the quality of care and performance of their treating physician, thereby generating response process validity evidence.[5]
Data Collection
To ensure that patients had perspective upon which to base their assessment, they were only asked to appraise physicians after being cared for by the same hospitalist provider for at least 2 consecutive days. Patients who were on isolation, those who were non‐English speaking, and those with impaired decision‐making capacity (such as mental status change or dementia) were excluded. Patients were enrolled only if they could correctly name their doctor or at least identify a photograph of their hospitalist provider on a page that included pictures of all division members. Those patients who were able to name the provider or correctly select the provider from the page of photographs were considered to have correctly identified their provider. In order to ensure the confidentiality of the patients and their responses, all data collections were performed by a trained research assistant who had no patient‐care responsibilities. The survey was confidential, did not include any patient identifiers, and patients were assured that providers would never see their individual responses. The patients were given options to complete TAISCH either by verbally responding to the research assistant's questions, filling out the paper survey, or completing the survey online using an iPad at the bedside. TAISCH specifically asked the patients to rate their hospitalist provider's performance along several domains: communication skills, clinical skills, availability, empathy, courteousness, and discharge planning; 5‐point Likert scales were used exclusively.
In addition to the TAISCH questions, we asked patients (1) an overall satisfaction question, I would recommend Dr. X to my loved ones should he or she need hospitalization in the future (response options: strongly disagree, disagree, neutral, agree, strongly agree), (2) their pain level using the Wong‐Baker pain scale,[15] and (3) the Jefferson Scale of Patient's Perceptions of Physician Empathy (JSPPPE).[16, 17] Associations between TAISCH and these variables (as well as PG data) would be examined to ascertain relations to other variables validity evidence.[5] Specifically, we sought to ascertain discriminant and convergent validity where the TAISCH is associated positively with constructs where we expect positive associations (convergent) and negatively with those we expect negative associations (discriminant).[18] The Wong‐Baker pain scale is a recommended pain‐assessment tool by the Joint Commission on Accreditation of Healthcare Organizations, and is widely used in hospitals and various healthcare settings.[19] The scale has a range from 0 to 10 (0 for no pain and 10 indicating the worst pain). The hypothesis was that the patients' pain levels would adversely affect their perception of the physician's performance (discriminant validity). JSPPPE is a 5‐item validated scale developed to measure patients' perceptions of their physicians' empathic engagement. It has significant correlations with the American Board of Internal Medicine's patient rating surveys, and it is used in standardized patient examinations for medical students.[20] The hypothesis was that patient perception about the quality of physician care would correlate positively with their assessment of the physician's empathy (convergent validity).
Although all of the hospitalist providers in the division consented to participate in this study, only hospitalist providers for whom at least 4 patient surveys were collected were included in the analysis. The study was approved by our institutional review board.
Data Analysis
All data were analyzed using Stata 11 (StataCorp, College Station, TX). Data were analyzed to determine the potential for a single comprehensive assessment of physician performance with confirmatory factor analysis (CFA) using maximum likelihood extraction. Additional factor analyses examined the potential for a multiple factor solution using exploratory factor analysis (EFA) with principle component factor analysis and varimax rotation. Examination of scree plots, factor loadings for individual items greater than 0.40, eigenvalues greater than 1.0, and substantive meaning of the factors were all taken into consideration when determining the number of factors to retain from factor analytic models.[21] Cronbach's s were calculated for each factor to assess reliability. These data provided internal structure validity evidence (demonstrated by acceptable reliability and factor structure) to TAISCH.[5]
After arriving at the final TAISCH scale, composite TAISCH scores were computed. Associations between composite TAISCH scores with the Wong‐Baker pain scale, the JSPPPE, and the overall satisfaction question were assessed using linear regression with the svy command in Stata to account for the nested design of having each patient report on a single hospitalist provider. Correlation between composite TAISCH score and PG physician care scores (comprised of 5 questions: time physician spent with you, physician concern with questions/worries, physician kept you informed, friendliness/courtesy of physician, and skill of physician) were assessed at the provider level when both data were available.
RESULTS
A total of 330 patients were considered to be eligible through medical record screening. Of those patients, 73 (22%) were already discharged by the time the research assistant attempted to enroll them after 2 days of care by a single physician. Of 257 inpatients approached, 30 patients (12%) refused to participate. Among the 227 consented patients, 24 (9%) were excluded as they were unable to correctly identify their hospitalist provider. A total of 203 patients were enrolled, and each patient rated a single hospitalist; a total of 29 unique hospitalists were assessed by these patients. The patients' mean age was 60 years, 114 (56%) were female, and 61 (30%) were of nonwhite race (Table 1). The hospitalist physicians' demographic information is also shown in Table 1. Two hospitalists with fewer than 4 surveys collected were excluded from the analysis. Thus, final analysis included 200 unique patients assessing 1 of the 27 hospitalists (mean=7.4 surveys per hospitalist).
| Characteristics | Value |
|---|---|
| |
| Patients, N=203 | |
| Age, y, mean (SD) | 60.0 (17.2) |
| Female, n (%) | 114 (56.1) |
| Nonwhite race, n (%) | 61 (30.5) |
| Observation stay, n (%) | 45 (22.1) |
| How are you feeling today? n (%) | |
| Very poor | 11 (5.5) |
| Poor | 14 (7.0) |
| Fair | 67 (33.5) |
| Good | 71 (35.5) |
| Very good | 33 (16.5) |
| Excellent | 4 (2.0) |
| Hospitalists, N=29 | |
| Age, n (%) | |
| 2630 years | 7 (24.1) |
| 3135 years | 8 (27.6) |
| 3640 years | 12 (41.4) |
| 4145 years | 2 (6.9) |
| Female, n (%) | 11 (37.9) |
| International medical graduate, n (%) | 18 (62.1) |
| Years in current practice, n (%) | |
| <1 | 9 (31.0) |
| 12 | 7 (24.1) |
| 34 | 6 (20.7) |
| 56 | 5 (17.2) |
| 7 or more | 2 (6.9) |
| Race, n (%) | |
| Caucasian | 4 (13.8) |
| Asian | 19 (65.5) |
| African/African American | 5 (17.2) |
| Other | 1 (3.4) |
| Academic rank, n (%) | |
| Assistant professor | 9 (31.0) |
| Clinical instructor | 10 (34.5) |
| Clinical associate/nonfaculty | 10 (34.5) |
| Percentage of clinical effort, n (%) | |
| >70% | 6 (20.7) |
| 50%70% | 19 (65.5) |
| <50% | 4 (13.8) |
Validation of TAISCH
On the 17‐item TAISCH administered, the 2 conditional questions (When I asked to see Dr. X, s/he came within a reasonable amount of time. and If Dr. X interacted with your family, how well did s/he deal with them?) were applicable to fewer than 40% of patients. As such, they were not included in the analysis.
Internal Structure Validity Evidence
Results from factor analyses are shown in Table 2. The CFA modeling of a single factor solution with 15 items explained 42% of the total variance. The 27 hospitalists' average 15‐item TAISCH score ranged from 3.25 to 4.28 (mean [standard deviation]=3.82 [0.24]; possible score range: 15). Reliability of the 15‐item TAISCH was appropriate (Cronbach's =0.88).
| TAISCH (Cronbach's =0.88) | Factor Loading |
|---|---|
| |
| Compared to all other physicians that you know, how do you rate Dr. X's compassion, empathy, and concern for you?* | 0.91 |
| Compared to all other physicians that you know, how do you rate Dr. X's ability to communicate with you?* | 0.88 |
| Compared to all other physicians that you know, how do you rate Dr. X's skill in diagnosing and treating your medical conditions?* | 0.88 |
| Compared to all other physicians that you know, how do you rate Dr. X's fund of knowledge?* | 0.80 |
| How much confidence do you have in Dr. X's plan for your care? | 0.71 |
| Dr. X kept me informed of the plans for my care. | 0.69 |
| Effectively preparing patients for discharge is an important part of what doctors in the hospital do. How well has Dr. X done in getting you ready to be discharged from the hospital? | 0.67 |
| Dr. X let me talk without interrupting. | 0.60 |
| Dr. X encouraged me to ask questions. | 0.59 |
| Dr. X checks to be sure I understood everything. | 0.55 |
| I sensed Dr. X was in a rush when s/he was with me. (reverse coded) | 0.55 |
| Dr. X showed interest in my views and opinions about my health. | 0.54 |
| Dr. X discusses options with me and involves me in decision making. | 0.47 |
| Dr. X asked permission to enter the room and waited for an answer. | 0.25 |
| Dr. X sat down when s/he visited my bedside. | 0.14 |
As shown in Table 2, 2 variables had factor loadings below the minimum threshold of 0.40 in the CFA for the 15‐item TAISCH when modeling a single factor solution. Both items were related to physician etiquette: Dr. X asked permission to enter the room and waited for an answer. and Dr. X sat down when he/she visited my bedside.
When CFA was executed again, as a single factor omitting the 2 items that demonstrated lower factor loadings, the 13‐item single factor solution explained 47% of the total variance, and the Cronbach's was 0.92.
EFA models were also explored for potential alternate solutions. These analyses resulted in lesser reliability (low Cronbach's ), weak construct operationalization, and poor face validity (as judged by the research team).
Both the 13‐ and 15‐item single factor solutions were examined further to determine whether associations with criterion variables (pain, empathy) differed substantively. Given that results were similar across both solutions, subsequent analyses were completed with the 15‐item single factor solution, which included the etiquette‐related variables.
Relationship to Other Variables Validity Evidence
The association between the 15‐item TAISCH and JSPPPE was significantly positive (=12.2, P<0.001). Additionally, there was a positive and significant association between TAISCH and the overall satisfaction question: I would recommend Dr. X to my loved ones should they need hospitalization in the future. (=11.2, P<0.001). This overall satisfaction question was also associated positively with JSPPPE (=13.2, P<0.001). There was a statistically significant negative association between TAISCH and Wong‐Baker pain scale (=2.42, P<0.05).
The PG data from the same period were available for 24 out of 27 hospitalists. The number of PG surveys collected per provider ranged from 5 to 30 (mean=14). At the provider level, there was not a statistically significant correlation between PG and the 15‐item TAISCH (P=0.51). Of note, PG was also not significantly correlated with the overall satisfaction question, JSPPPE, or the Wong‐Baker pain scale (all P>0.10).
DISCUSSION
Our new metric, TAISCH, was found to be a reliable and valid measurement tool to assess patient satisfaction with the hospitalist physician's care. Because we only surveyed patients who could correctly identify their hospitalist physicians after interacting for at least 2 consecutive days, the attribution of the data to the individual hospitalist is almost certainly correct. The high participation rate indicates that the patients were not hesitant about rating their hospitalist provider's quality of care, even when asked while they were still in the hospital.
The majority of the patients approached were able to correctly identify their hospitalist provider. This rate (91%) was much higher than the rate previously reported in the literature where a picture card was used to improve provider recognition.[22] It is also likely that 1 physician, rather than a team of physicians, taking care of patients make it easier for patients to recall the name and recognize the face of their inpatient provider.
The CFA of TAISCH showed good fit but suggests that 2 variables, both from Kahn's etiquette‐based medicine (EtBM) checklist,[9] may not load in the same way as the other items. Tackett and colleagues reported that hospitalists who performed more EtBM behaviors scored higher on PG evaluations.[23] Such results, along with the comparable explanation of variance and reliability, convinced us to retain these 2 items in the final 15‐item TAISCH as dictated by the CFA. Although the literature supports the fact that physician etiquette is related to perception of high‐quality care, it is possible that these 2 questions were answered differently (and thereby failed to load the same way), because environmental limitations may be preventing physicians' ability to perform them consistently. We prefer the 15‐item version of TAISCH and future studies may provide additional information about its performance as compared to the 13‐item adaptation.
The significantly negative association between the Wong‐Baker pain scale and TAISCH stresses the importance of adequately addressing and treating the patient's pain. Hanna et al. showed that the patients' perceptions of pain control was associated with their overall satisfaction score measured by HCAHPS.[24] The association seen in our study was not unexpected, because TAISCH is administered while the patients are acutely ill in the hospital, when pain is likely more prevalent and severe than it is during the postdischarge settings (when the HCAHPS or PG surveys are administered). Interestingly, Hanna et al. discovered that the team's attention to controlling pain was more strongly correlated with overall satisfaction than was the actual pain control.[24] These data, now confirmed by our study, should serve to remind us that a hospitalist's concern and effort to relieve pain may augment patient satisfaction with the quality of care, even when eliminating the pain may be difficult or impossible.
TAISCH was found not to be correlated with PG scores. Several explanations for this deserve consideration. First, the postdischarge PG survey that is used for our institution does not list the name of the specific hospitalist providers for the patients to evaluate. Because patients encounter multiple physicians during their hospital stay (eg, emergency department physicians, hospitalist providers, consultants), it is possible that patients are not reflecting on the named doctor when assessing the the attending of record on the PG mailed questionnaire. Second, the representation of patients who responded to TAISCH and PG were different; almost all patients completed TAISCH as opposed to a small minority who decide to respond to the PG survey. Third, TAISCH measures the physicians' performance more comprehensively with a larger number of variables. Last, it is possible that we were underpowered to detect significant correlation, because there were only 24 providers who had data from both TAISCH and PG. However, our results endorse using caution in interpreting PG scores for individual hospitalist's performance, particularly for high‐stakes consequences (including the provision of incentives to high performer and the insistence on remediation for low performers).
Several limitations of this study should be considered. First, only hospitalist providers from a single division were assessed. This may limit the generalizability of our findings. Second, although patients were assured about confidentiality of their responses, they might have provided more favorable answers, because they may have felt uncomfortable rating their physician poorly. One review article of the measurement of healthcare satisfaction indicated that impersonal (mailed) methods result in more criticism and lower satisfaction than assessments made in person using interviews. As the trade‐off, the mailed surveys yield lower response rates that may introduce other forms of bias.[25] Even on the HCHAPS survey report for the same period from our institution, 78% of patients gave top box ratings for our doctors' communication skills, which is at the state average.[26] Similarly, a study that used postdischarge telephone interviews to collect patients' satisfaction with hospitalists' care quality reported an average score of 4.20 out of 5.[27] These findings confirm that highly skewed ratings are common for these types of surveys, irrespective of how or when the data are collected.
Despite the aforementioned limitations, TAISCH use need not be limited to hospitalist physicians. It may also be used to assess allied health professionals or trainees performance, which cannot be assessed by HCHAPS or PG. Applying TAISCH in different hospital settings (eg, emergency department or critical care units), assessing hospitalists' reactions to TAISCH, learning whether TAISCH leads to hospitalists' behavior changes or appraising whether performance can improve in response to coaching interventions for those performing poorly are all research questions that merit additional consideration.
CONCLUSION
TAISCH allows for obtaining patient satisfaction data that are highly attributable to specific hospitalist providers. The data collection method also permits high response rates so that input comes from almost all patients. The timeliness of the TAISCH assessments also makes it possible for real‐time service recovery, which is impossible with other commonly used metrics assessing patient satisfaction. Our next step will include testing the most effective way to provide feedback to providers and to coach these individuals so as to improve performance.
Acknowledgements
The authors would like to thank Po‐Han Chen at the BEAD Core for his statistical analysis support.
Disclosures: This study was supported by the Johns Hopkins Osler Center for Clinical Excellence. Dr. Wright is a Miller‐Coulson Family Scholar and is supported through the Johns Hopkins Center for Innovative Medicine. The authors report no conflicts of interest.
- , . Hospital value‐based purchasing. J Hosp Med. 2013;8:271–277.
- HCAHPS survey. Hospital Consumer Assessment of Healthcare Providers and Systems website. Available at: http://www.hcahpsonline.org/home.aspx. Accessed August 27, 2011.
- Press Ganey survey. Press Ganey website. Available at: http://www.pressganey.com/index.aspx. Accessed February 12, 2013.
- Society of Hospital Medicine. Membership Committee Guidelines for Hospitalists Patient Satisfaction Surveys. Available at: http://www.hospitalmedicine.org/AM/Template.cfm?Section=Practice_Resources119:166.e7–e16.
- , , . Measuring patient views of physician communication skills: development and testing of the Communication Assessment Tool. Patient Educ Couns. 2007;67:333–342.
- , , . The Picker Patient Experience Questionnaire: development and validation using data from in‐patient surveys in five countries. Int J Qual Health Care. 2002;14:353–358.
- The Patient Satisfaction Questionnaire from RAND Health. RAND Health website. Available at: http://www.rand.org/health/surveys_tools/psq.html. Accessed December 30, 2011.
- . Etiquette‐based medicine. N Engl J Med. 2008;358:1988–1989.
- , , , . Defining clinical excellence in academic medicine: a qualitative study of the master clinicians. Mayo Clin Proc. 2008;83:989–994.
- , , , , . Creating an academy of clinical excellence at Johns Hopkins Bayview Medical Center: a 3‐year experience. Acad Med. 2010;85:1833–1839.
- , , , , . Patients' perspectives on ideal physician behaviors. Mayo Clin Proc. 2006;81(3):338–344.
- The Miller‐Coulson Academy of Clinical Excellence at Johns Hopkins. Available at: http://www.hopkinsmedicine.org/innovative/signature_programs/academy_of_clinical_excellence/. Accessed April 25, 2014.
- Osler Center for Clinical Excellence at Johns Hopkins. Available at: http://www.hopkinsmedicine.org/johns_hopkins_bayview/education_training/continuing_education/osler_center_for_clinical_excellence. Accessed April 25, 2014.
- Wong‐Baker FACES Foundation. Available at: http://www.wongbakerfaces.org. Accessed July 8, 2013.
- , , , , . Jefferson Scale of Patient's Perceptions of Physician Empathy: preliminary psychometric data. Croat Med J. 2007;48:81–86.
- , , , , . Relationships between scores on the Jefferson Scale of Physician Empathy, patient perceptions of physician empathy, and humanistic approaches to patient care: a validity study. Med Sci Monit. 2007;13(7):CR291–CR294.
- , . Convergent and discriminant validation by the multitrait‐multimethod matrix. Psychol Bul. 1959;56(2):81–105.
- The Joint Commission. Facts about pain management. Available at: http://www.jointcommission.org/pain_management. Accessed April 25, 2014.
- , , , et al. Medical students' self‐reported empathy and simulated patients' assessments of student empathy: an analysis by gender and ethnicity. Acad Med. 2011;86(8):984–988.
- . Factor Analysis. Hillsdale, NJ: Lawrence Erlbaum Associates; 1983.
- , , , et al. Improving inpatients' identification of their doctors: use of FACE cards. Jt Comm J Qual Pateint Saf. 1009;35(12):613–619.
- , , et al. Appraising the practice of etiquette‐based medicine in the inpatient setting. J Gen Intern Med. 2013;28(7):908–913.
- , , , et al. Does patient perception of pain control affect patient satisfaction across surgical units in a tertiary teaching hospital? Am J Med Qual. 2012;27:411–416.
- , , , et al. The measurement of satisfaction with health care: implications for practice from a systematic review of the literature. Health Technol Assess. 2002;6(32):1–244.
- Centers for Medicare 7(2):131–136.
© 2014 Society of Hospital Medicine
Project BOOST
Enactment of federal legislation imposing hospital reimbursement penalties for excess rates of rehospitalizations among Medicare fee for service beneficiaries markedly increased interest in hospital quality improvement (QI) efforts to reduce the observed 30‐day rehospitalization of 19.6% in this elderly population.[1, 2] The Congressional Budget Office estimated that reimbursement penalties to hospitals for high readmission rates are expected to save the Medicare program approximately $7 billion between 2010 and 2019.[3] These penalties are complemented by resources from the Center for Medicare and Medicaid Innovation aiming to reduce hospital readmissions by 20% by the end of 2013 through the Partnership for Patients campaign.[4] Although potential financial penalties and provision of resources for QI intensified efforts to enhance the quality of the hospital discharge transition, patient safety risks associated with hospital discharge are well documented.[5, 6] Approximately 20% of patients discharged from the hospital may suffer adverse events,[7, 8] of which up to three‐quarters (72%) are medication related,[9] and over one‐third of required follow‐up testing after discharge is not completed.[10] Such findings indicate opportunities for improvement in the discharge process.[11]
Numerous publications describe studies aiming to improve the hospital discharge process and mitigate these hazards, though a systematic review of interventions to reduce 30‐day rehospitalization indicated that the existing evidence base for the effectiveness of transition interventions demonstrates irregular effectiveness and limitations to generalizability.[12] Most studies showing effectiveness are confined to single academic medical centers. Existing evidence supports multifaceted interventions implemented in both the pre‐ and postdischarge periods and focused on risk assessment and tailored, patient‐centered application of interventions to mitigate risk. For example Project RED (Re‐Engineered Discharge) applied a bundled intervention consisting of intensified patient education and discharge planning, improved medication reconciliation and discharge instructions, and longitudinal patient contact with follow‐up phone calls and a dedicated discharge advocate.[13] However, the mean age of patients participating in the study was 50 years, and it excluded patients admitted from or discharged to skilled nursing facilities, making generalizability to the geriatric population uncertain.
An integral aspect of QI projects is the contribution of local context to translation of best practices to disparate settings.[14, 15, 16] Most available reports of successful interventions to reduce rehospitalization have not fully described the specifics of either the intervention context or design. Moreover, the available evidence base for common interventions to reduce rehospitalization was developed in the academic setting. Validation of single academic center studies in a broader healthcare context is necessary.
Project BOOST (Better Outcomes for Older adults through Safe Transitions) recruited a diverse national cohort of both academic and nonacademic hospitals to participate in a QI effort to implement best practices for hospital discharge care transitions using a national collaborative approach facilitated by external expert mentorship. This study aimed to determine the effectiveness of BOOST in lowering hospital readmission rates and impact on length of stay.
METHODS
The study of Project BOOST was undertaken in accordance with the SQUIRE (Standards for Quality Improvement Reporting Excellence) Guidelines.[17]
Participants
The unit of observation for the prospective cohort study was the clinical acute‐care unit within hospitals. Sites were instructed to designate a pilot unit for the intervention that cared for medical or mixed medicalsurgical patient populations. Sites were also asked to provide outcome data for a clinically and organizationally similar non‐BOOST unit to provide a site‐matched control. Control units were matched by local site leadership based on comparable patient demographics, clinical mix, and extent of housestaff presence. An initial cohort of 6 hospitals in 2008 was followed by a second cohort of 24 hospitals initiated in 2009. All hospitals were invited to participate in the national effectiveness analysis, which required submission of readmission and length of stay data for both a BOOST intervention unit and a clinically matched control unit.
Description of the Intervention
The BOOST intervention consisted of 2 major sequential processes, planning and implementation, both facilitated by external site mentorsphysicians expert in QI and care transitionsfor a period of 12 months. Extensive background on the planning and implementation components is available at
| Enrollment Sites, n=30 | Sites Reporting Outcome Data, n=11 | Sites Not Reporting Outcome Data, n=19 | P Value for Comparison of Outcome Data Sites Compared to Othersa | |
|---|---|---|---|---|
| ||||
| Region, n (%) | 0.194 | |||
| Northeast | 8 (26.7) | 2 (18.2) | 6 (31.6) | |
| West | 7 (23.4) | 2 (18.2) | 5 (26.3) | |
| South | 7 (23.4) | 3 (27.3) | 4 (21.1) | |
| Midwest | 8 (26.7) | 4 (36.4) | 4 (21.1) | |
| Urban location, n (%) | 25 (83.3) | 11 (100) | 15 (78.9) | 0.035 |
| Teaching status, n (%) | 0.036 | |||
| Academic medical center | 10 (33.4) | 5 (45.5) | 5 (26.3) | |
| Community teaching | 8 (26.7) | 3 (27.3) | 5 (26.3) | |
| Community nonteaching | 12 (40) | 3 (27.3) | 9 (47.4) | |
| Beds number, mean (SD) | 426.6 (220.6) | 559.2 (187.8) | 349.79 (204.48) | 0.003 |
| Number of tools implemented, n (%) | 0.194 | |||
| 0 | 2 (6.7) | 0 | 2 (10.5) | |
| 1 | 2 (6.7) | 0 | 2 (10.5) | |
| 2 | 4 (13.3) | 2 (18.2) | 2 (10.5) | |
| 3 | 12 (40.0) | 3 (27.3) | 8 (42.1) | |
| 4 | 9 (30.0) | 5 (45.5) | 4 (21.1) | |
| 5 | 1 (3.3) | 1 (9.1) | 1 (5.3) | |
Mentor engagement with sites consisted of a 2‐day kickoff training on the BOOST tools, where site teams met their mentor and initiated development of structured action plans, followed by 5 to 6 scheduled phone calls in the subsequent 12 months. During these conference calls, mentors gauged progress and sought to help troubleshoot barriers to implementation. Some mentors also conducted a site visit with participant sites. Project BOOST provided sites with several collaborative activities including online webinars and an online listserv. Sites also received a quarterly newsletter.
Outcome Measures
The primary outcome was 30‐day rehospitalization defined as same hospital, all‐cause rehospitalization. Home discharges as well as discharges or transfers to other healthcare facilities were included in the discharge calculation. Elective or scheduled rehospitalizations as well as multiple rehospitalizations in the same 30‐day window were considered individual rehospitalization events. Rehospitalization was reported as a ratio of 30‐day rehospitalizations divided by live discharges in a calendar month. Length of stay was reported as the mean length of stay among live discharges in a calendar month. Outcomes were calculated at the participant site and then uploaded as overall monthly unit outcomes to a Web‐based research database.
To account for seasonal trends as well as marked variation in month‐to‐month rehospitalization rates identified in longitudinal data, we elected to compare 3‐month year‐over‐year averages to determine relative changes in readmission rates from the period prior to BOOST implementation to the period after BOOST implementation. We calculated averages for rehospitalization and length of stay in the 3‐month period preceding the sites' first reported month of front‐line implementation and in the corresponding 3‐month period in the subsequent calendar year. For example, if a site reported implementing its first tool in April 2010, the average readmission rate in the unit for January 2011 through March 2011 was subtracted from the average readmission rate for January 2010 through March 2010.
Sites were surveyed regarding tool implementation rates 6 months and 24 months after the 2009 kickoff training session. Surveys were electronically completed by site leaders in consultation with site team members. The survey identified new tool implementation as well as modification of existing care processes using the BOOST tools (admission risk assessment, discharge readiness checklist, teach back use, mandate regarding discharge summary completion, follow‐up phone calls to >80% of discharges). Use of a sixth tool, creation of individualized written discharge instructions, was not measured. We credited sites with tool implementation if they reported either de novo tool use or alteration of previous care processes influenced by BOOST tools.
Clinical outcome reporting was voluntary, and sites did not receive compensation and were not subject to penalty for the degree of implementation or outcome reporting. No patient‐level information was collected for the analysis, which was approved by the Northwestern University institutional review board.
Data Sources and Methods
Readmission and length of stay data, including the unit level readmission rate, as collected from administrative sources at each hospital, were collected using templated spreadsheet software between December 2008 and June 2010, after which data were loaded directly to a Web‐based data‐tracking platform. Sites were asked to load data as they became available. Sites were asked to report the number of study unit discharges as well as the number of those discharges readmitted within 30 days; however, reporting of the number of patient discharges was inconsistent across sites. Serial outreach consisting of monthly phone calls or email messaging to site leaders was conducted throughout 2011 to increase site participation in the project analysis.
Implementation date information was collected from 2 sources. The first was through online surveys distributed in November 2009 and April 2011. The second was through fields in the Web‐based data tracking platform to which sites uploaded data. In cases where disagreement was found between these 2 sources, the site leader was contacted for clarification.
Practice setting (community teaching, community nonteaching, academic medical center) was determined by site‐leader report within the Web‐based data tracking platform. Data for hospital characteristics (number of licensed beds and geographic region) were obtained from the American Hospital Association's Annual Survey of Hospitals.[18] Hospital region was characterized as West, South, Midwest, or Northeast.
Analysis
The null hypothesis was that no prepost difference existed in readmission rates within BOOST units, and no difference existed in the prepost change in readmission rates in BOOST units when compared to site‐matched control units. The Wilcoxon rank sum test was used to test whether observed changes described above were significantly different from 0, supporting rejection of the null hypotheses. We performed similar tests to determine the significance of observed changes in length of stay. We performed our analysis using SAS 9.3 (SAS Institute Inc., Cary, NC).
RESULTS
Eleven hospitals provided rehospitalization and length‐of‐stay outcome data for both a BOOST and control unit for the pre‐ and postimplementation periods. Compared to the 19 sites that did not participate in the analysis, these 11 sites were significantly larger (559188 beds vs 350205 beds, P=0.003), more likely to be located in an urban area (100.0% [n=11] vs 78.9% [n=15], P=0.035), and more likely to be academic medical centers (45.5% [n=5] vs 26.3% [n=5], P=0.036) (Table 1).
The mean number of tools implemented by sites participating in the analysis was 3.50.9. All sites implemented at least 2 tools. The duration between attendance at the BOOST kickoff event and first tool implementation ranged from 3 months (first tool implemented prior to attending the kickoff) and 9 months (mean duration, 3.34.3 months) (Table 2).
| Hospital | Region | Hospital Type | No. Licensed Beds | Kickoff Implementationa | Risk Assessment | Discharge Checklist | Teach Back | Discharge Summary Completion | Follow‐up Phone Call | Total |
|---|---|---|---|---|---|---|---|---|---|---|
| ||||||||||
| 1 | Midwest | Community teaching | <300 | 8 | 3 | |||||
| 2 | West | Community teaching | >600 | 0 | 4 | |||||
| 3 | Northeast | Academic medical center | >600 | 2 | 4 | |||||
| 4 | Northeast | Community nonteaching | <300 | 9 | 2 | |||||
| 5 | South | Community nonteaching | >600 | 6 | 3 | |||||
| 6 | South | Community nonteaching | >600 | 3 | 4 | |||||
| 7 | Midwest | Community teaching | 300600 | 1 | 5 | |||||
| 8 | West | Academic medical center | 300600 | 1 | 4 | |||||
| 9 | South | Academic medical center | >600 | 4 | 4 | |||||
| 10 | Midwest | Academic medical center | 300600 | 3 | 3 | |||||
| 11 | Midwest | Academic medical center | >600 | 9 | 2 | |||||
The average rate of 30‐day rehospitalization among BOOST units was 14.7% in the preimplementation period and 12.7% during the postimplementation period (P=0.010) (Figure 1). Rehospitalization rates for matched control units were 14.0% in the preintervention period and 14.1% in the postintervention period (P=0.831). The mean absolute reduction in readmission rates over the 1‐year study period in BOOST units compared to control units was 2.0%, or a relative reduction of 13.6% (P=0.054 for signed rank test comparing differences in readmission rate reduction in BOOST units compared to site‐matched control units). Length of stay in BOOST and control units decreased an average of 0.5 days and 0.3 days, respectively. There was no difference in length of stay change between BOOST units and control units (P=0.966).
DISCUSSION
As hospitals strive to reduce their readmission rates to avoid Centers for Medicare and Medicaid Services penalties, Project BOOST may be a viable QI approach to achieve their goals. This initial evaluation of participation in Project BOOST by 11 hospitals of varying sizes across the United States showed an associated reduction in rehospitalization rates (absolute=2.0% and relative=13.6%, P=0.054). We did not find any significant change in length of stay among these hospitals implementing BOOST tools.
The tools provided to participating hospitals were developed from evidence found in peer‐reviewed literature established through experimental methods in well‐controlled academic settings. Further tool development was informed by recommendations of an advisory board consisting of expert representatives and advocates involved in the hospital discharge process: patients, caregivers, physicians, nurses, case managers, social workers, insurers, and regulatory and research agencies.[19] The toolkit components address multiple aspects of hospital discharge and follow‐up with the goal of improving health by optimizing the safety of care transitions. Our observation that readmission rates appeared to improve in a diverse hospital sample including nonacademic and community hospitals engaged in Project BOOST is reassuring that the benefits seen in existing research literature, developed in distinctly academic settings, can be replicated in diverse acute‐care settings.
The effect size observed in our study was modest but consistent with several studies identified in a recent review of trials measuring interventions to reduce rehospitalization, where 7 of 16 studies showing a significant improvement registered change in the 0% to 5% absolute range.[12] Impact of this project may have been tempered by the need to translate external QI content to the local setting. Additionally, in contrast to experimental studies that are limited in scope and timing and often scaled to a research budget, BOOST sites were encouraged to implement Project BOOST in the clinical setting even if no new funds were available to support the effort.[12]
The recruitment of a national sample of both academic and nonacademic hospital participants imposed several limitations on our study and analysis. We recognize that intervention units selected by hospitals may have had unmeasured unit and patient characteristics that facilitated successful change and contributed to the observed improvements. However, because external pressure to reduce readmission is present across all hospitals independent of the BOOST intervention, we felt site‐matched controls were essential to understanding effects attributable to the BOOST tools. Differences between units would be expected to be stable over the course of the study period, and comparison of outcome differences between 2 different time periods would be reasonable. Additionally, we could not collect data on readmissions to other hospitals. Theoretically, patients discharged from BOOST units might be more likely to have been rehospitalized elsewhere, but the fraction of rehospitalizations occurring at alternate facilities would also be expected to be similar on the matched control unit.
We report findings from a voluntary cohort willing and capable of designating a comparison clinical unit and contributing the requested data outcomes. Pilot sites that did not report outcomes were not analyzed, but comparison of hospital characteristics shows that participating hospitals were more likely to be large, urban, academic medical centers. Although barriers to data submission were not formally analyzed, reports from nonparticipating sites describe data submission limited by local implementation design (no geographic rollout or simultaneous rollout on all appropriate clinical units), site specific inability to generate unit level outcome statistics, and competing organizational priorities for data analyst time (electronic medical record deployment, alternative QI initiatives). The external validity of our results may be limited to organizations capable of analytics at the level of the individual clinical unit as well as those with sufficient QI resources to support reporting to a national database in the absence of a payer mandate. It is possible that additional financial support for on‐site data collection would have bolstered participation, making the example of participation rates we present potentially informative to organizations hoping to widely disseminate a QI agenda.
Nonetheless, the effectiveness demonstrated in the 11 sites that did participate is encouraging, and ongoing collaboration with subsequent BOOST cohorts has been designed to further facilitate data collection. Among the insights gained from this pilot experience, and incorporated into ongoing BOOST cohorts, is the importance of intensive mentor engagement to foster accountability among participant sites, assist with implementation troubleshooting, and offer expertise that is often particularly effective in gaining local support. We now encourage sites to have 2 mentor site visits to further these roles and more frequent conference calls. Further research to understand the marginal benefit of the mentored implementation approach is ongoing.
The limitations in data submission we experienced with the pilot cohort likely reflect resource constraints not uncommon at many hospitals. Increasing pressure placed on hospitals as a result of the Readmission Reduction Program within the Affordable Care Act as well as increasing interest from private and Medicaid payors to incorporate similar readmission‐based penalties provide encouragement for hospitals to enhance their data and analytic skills. National incentives for implementation of electronic health records (EHR) should also foster such capabilities, though we often saw EHRs as a barrier to QI, especially rapid cycle trials. Fortunately, hospitals are increasingly being afforded access to comprehensive claims databases to assist in tracking readmission rates to other facilities, and these data are becoming available in a more timely fashion. This more robust data collection, facilitated by private payors, state QI organizations, and state hospital associations, will support additional analytic methods such as multivariate regression models and interrupted time series designs to appreciate the experience of current BOOST participants.
Additional research is needed to understand the role of organizational context in the effectiveness of Project BOOST. Differences in rates of tool implementation and changes in clinical outcomes are likely dependent on local implementation context at the level of the healthcare organization and individual clinical unit.[20] Progress reports from site mentors and previously described experiences of QI implementation indicate that successful implementation of a multidimensional bundle of interventions may have reflected a higher level of institutional support, more robust team engagement in the work of reducing readmissions, increased clinical staff support for change, the presence of an effective project champion, or a key facilitating role of external mentorship.[21, 22] Ongoing data collection will continue to measure the sustainability of tool use and observed outcome changes to inform strategies to maintain gains associated with implementation. The role of mentored implementation in facilitating gains also requires further study.
Increasing attention to the problem of avoidable rehospitalization is driving hospitals, insurers, and policy makers to pursue QI efforts that favorably impact readmission rates. Our analysis of the BOOST intervention suggests that modest gains can be achieved following evidence‐based hospital process change facilitated by a mentored implementation model. However, realization of the goal of a 20% reduction in rehospitalization proposed by the Center for Medicare and Medicaid Services' Partnership for Patients initiative may be difficult to achieve on a national scale,[23] especially if efforts focus on just the hospital.
Acknowledgments
The authors acknowledge the contributions of Amanda Creden, BA (data collection), Julia Lee (biostatistical support), and the support of Amy Berman, BS, RN, Senior Program Officer at The John A. Hartford Foundation.
Disclosures
Project BOOST was funded by a grant from The John A. Hartford Foundation. Project BOOST is administered by the Society of Hospital Medicine (SHM). The development of the Project BOOST toolkit, recruitment of sites for this study, mentorship of the pilot cohort, project evaluation planning, and collection of pilot data were funded by a grant from The John A. Harford Foundation. Additional funding for continued data collection and analysis was funded by the SHM through funds from hospitals to participate in Project BOOST, specifically with funding support for Dr. Hansen. Dr. Williams has received funding to serve as Principal Investigator for Project BOOST. Since the time of initial cohort participation, approximately 125 additional hospitals have participated in the mentored implementation of Project BOOST. This participation was funded through a combination of site‐based tuition, third‐party payor support from private insurers, foundations, and federal funding through the Center for Medicare and Medicaid Innovation Partnership for Patients program. Drs. Greenwald, Hansen, and Williams are Project BOOST mentors for current Project BOOST sites and receive financial support through the SHM for this work. Dr. Howell has previously received funding as a Project BOOST mentor. Ms. Budnitz is the BOOST Project Director and is Chief Strategy and Development Officer for the HM. Dr. Maynard is the Senior Vice President of the SHM's Center for Hospital Innovation and Improvement.
References
- , , . Rehospitalizations among patients in the Medicare fee‐for‐service program. N Engl J Med. 2009;360(14):1418–1428.
- United States Congress. House Committee on Education and Labor. Coe on Ways and Means, Committee on Energy and Commerce, Compilation of Patient Protection and Affordable Care Act: as amended through November 1, 2010 including Patient Protection and Affordable Care Act health‐related portions of the Health Care and Education Reconciliation Act of 2010. Washington, DC: US Government Printing Office; 2010.
- Cost estimate for the amendment in the nature of a substitute to H.R. 3590, as proposed in the Senate on November 18, 2009. Washington, DC: Congressional Budget Office; 2009.
- Partnership for Patients, Center for Medicare and Medicaid Innovation. Available at: http://www.innovations.cms.gov/initiatives/Partnership‐for‐Patients/index.html. Accessed December 12, 2012.
- , . Providers have failed to work for continuity. Hospitals. 1979;53(10):79.
- , . Executing high‐quality care transitions: a call to do it right. J Hosp Med. 2007;2(5):287–290.
- , , , , . The incidence and severity of adverse events affecting patients after discharge from the hospital. Ann Intern Med. 2003;138(3):161–167.
- , , , et al. Adverse events among medical patients after discharge from hospital. CMAJ. 2004;170(3):345–349.
- , , , et al. Making inpatient medication reconciliation patient centered, clinically relevant and implementable: a consensus statement on key principles and necessary first steps. J Hosp Med. 2010;5(8):477–485.
- , , . Tying up loose ends: discharging patients with unresolved medical issues. Arch Intern Med. 2007;167(12):1305.
- , , , , , . Deficits in communication and information transfer between hospital‐based and primary care physicians. JAMA. 2007;297(8):831–841.
- , , , , . Interventions to reduce 30‐day rehospitalization: a systematic review. Ann Intern Med. 2011;155(8):520–528.
- , , , et al. A reengineered hospital discharge program to decrease rehospitalization: a randomized trial. Ann Intern Med. 2009;150(3):178.
- , , , et al. Advancing the science of patient safety. Ann Intern Med. 2011;154(10):693–696.
- , . From best evidence to best practice: effective implementation of change in patients' care. Lancet. 2003;362(9391):1225–1230.
- , , , et al. Quality improvement projects targeting health care‐associated infections: comparing virtual collaborative and toolkit approaches. J Hosp Med. 2011;6(5):271–278.
- , , , , . Publication guidelines for improvement studies in health care: evolution of the SQUIRE project. Ann Intern Med. 2008;149(9):670–676.
- , , , . Risk stratification and therapeutic decision making in acute coronary syndromes. JAMA. 2000;284(7):876–878.
- , , . Are diagnosis specific outcome indicators based on administrative data useful in assessing quality of hospital care? BMJ. 2004;13(1):32.
- , , , et al. What distinguishes top‐performing hospitals in acute myocardial infarction mortality rates? Ann Intern Med. 2011;154(6):384–390.
- , , , . The Model for Understanding Success in Quality (MUSIQ): building a theory of context in healthcare quality improvement. BMJ Qual Saf. 2012;21(1):13–20.
- , . Evidence‐based quality improvement: the state of the science. Health Aff (Millwood). 2005;24(1):138–150.
- Center for Medicare and Medicaid Innovation. Partnership for patients. Available at: http://www.innovations.cms.gov/initiatives/Partnership‐for‐Patients/index.html. Accessed April 2, 2012.
Enactment of federal legislation imposing hospital reimbursement penalties for excess rates of rehospitalizations among Medicare fee for service beneficiaries markedly increased interest in hospital quality improvement (QI) efforts to reduce the observed 30‐day rehospitalization of 19.6% in this elderly population.[1, 2] The Congressional Budget Office estimated that reimbursement penalties to hospitals for high readmission rates are expected to save the Medicare program approximately $7 billion between 2010 and 2019.[3] These penalties are complemented by resources from the Center for Medicare and Medicaid Innovation aiming to reduce hospital readmissions by 20% by the end of 2013 through the Partnership for Patients campaign.[4] Although potential financial penalties and provision of resources for QI intensified efforts to enhance the quality of the hospital discharge transition, patient safety risks associated with hospital discharge are well documented.[5, 6] Approximately 20% of patients discharged from the hospital may suffer adverse events,[7, 8] of which up to three‐quarters (72%) are medication related,[9] and over one‐third of required follow‐up testing after discharge is not completed.[10] Such findings indicate opportunities for improvement in the discharge process.[11]
Numerous publications describe studies aiming to improve the hospital discharge process and mitigate these hazards, though a systematic review of interventions to reduce 30‐day rehospitalization indicated that the existing evidence base for the effectiveness of transition interventions demonstrates irregular effectiveness and limitations to generalizability.[12] Most studies showing effectiveness are confined to single academic medical centers. Existing evidence supports multifaceted interventions implemented in both the pre‐ and postdischarge periods and focused on risk assessment and tailored, patient‐centered application of interventions to mitigate risk. For example Project RED (Re‐Engineered Discharge) applied a bundled intervention consisting of intensified patient education and discharge planning, improved medication reconciliation and discharge instructions, and longitudinal patient contact with follow‐up phone calls and a dedicated discharge advocate.[13] However, the mean age of patients participating in the study was 50 years, and it excluded patients admitted from or discharged to skilled nursing facilities, making generalizability to the geriatric population uncertain.
An integral aspect of QI projects is the contribution of local context to translation of best practices to disparate settings.[14, 15, 16] Most available reports of successful interventions to reduce rehospitalization have not fully described the specifics of either the intervention context or design. Moreover, the available evidence base for common interventions to reduce rehospitalization was developed in the academic setting. Validation of single academic center studies in a broader healthcare context is necessary.
Project BOOST (Better Outcomes for Older adults through Safe Transitions) recruited a diverse national cohort of both academic and nonacademic hospitals to participate in a QI effort to implement best practices for hospital discharge care transitions using a national collaborative approach facilitated by external expert mentorship. This study aimed to determine the effectiveness of BOOST in lowering hospital readmission rates and impact on length of stay.
METHODS
The study of Project BOOST was undertaken in accordance with the SQUIRE (Standards for Quality Improvement Reporting Excellence) Guidelines.[17]
Participants
The unit of observation for the prospective cohort study was the clinical acute‐care unit within hospitals. Sites were instructed to designate a pilot unit for the intervention that cared for medical or mixed medicalsurgical patient populations. Sites were also asked to provide outcome data for a clinically and organizationally similar non‐BOOST unit to provide a site‐matched control. Control units were matched by local site leadership based on comparable patient demographics, clinical mix, and extent of housestaff presence. An initial cohort of 6 hospitals in 2008 was followed by a second cohort of 24 hospitals initiated in 2009. All hospitals were invited to participate in the national effectiveness analysis, which required submission of readmission and length of stay data for both a BOOST intervention unit and a clinically matched control unit.
Description of the Intervention
The BOOST intervention consisted of 2 major sequential processes, planning and implementation, both facilitated by external site mentorsphysicians expert in QI and care transitionsfor a period of 12 months. Extensive background on the planning and implementation components is available at
| Enrollment Sites, n=30 | Sites Reporting Outcome Data, n=11 | Sites Not Reporting Outcome Data, n=19 | P Value for Comparison of Outcome Data Sites Compared to Othersa | |
|---|---|---|---|---|
| ||||
| Region, n (%) | 0.194 | |||
| Northeast | 8 (26.7) | 2 (18.2) | 6 (31.6) | |
| West | 7 (23.4) | 2 (18.2) | 5 (26.3) | |
| South | 7 (23.4) | 3 (27.3) | 4 (21.1) | |
| Midwest | 8 (26.7) | 4 (36.4) | 4 (21.1) | |
| Urban location, n (%) | 25 (83.3) | 11 (100) | 15 (78.9) | 0.035 |
| Teaching status, n (%) | 0.036 | |||
| Academic medical center | 10 (33.4) | 5 (45.5) | 5 (26.3) | |
| Community teaching | 8 (26.7) | 3 (27.3) | 5 (26.3) | |
| Community nonteaching | 12 (40) | 3 (27.3) | 9 (47.4) | |
| Beds number, mean (SD) | 426.6 (220.6) | 559.2 (187.8) | 349.79 (204.48) | 0.003 |
| Number of tools implemented, n (%) | 0.194 | |||
| 0 | 2 (6.7) | 0 | 2 (10.5) | |
| 1 | 2 (6.7) | 0 | 2 (10.5) | |
| 2 | 4 (13.3) | 2 (18.2) | 2 (10.5) | |
| 3 | 12 (40.0) | 3 (27.3) | 8 (42.1) | |
| 4 | 9 (30.0) | 5 (45.5) | 4 (21.1) | |
| 5 | 1 (3.3) | 1 (9.1) | 1 (5.3) | |
Mentor engagement with sites consisted of a 2‐day kickoff training on the BOOST tools, where site teams met their mentor and initiated development of structured action plans, followed by 5 to 6 scheduled phone calls in the subsequent 12 months. During these conference calls, mentors gauged progress and sought to help troubleshoot barriers to implementation. Some mentors also conducted a site visit with participant sites. Project BOOST provided sites with several collaborative activities including online webinars and an online listserv. Sites also received a quarterly newsletter.
Outcome Measures
The primary outcome was 30‐day rehospitalization defined as same hospital, all‐cause rehospitalization. Home discharges as well as discharges or transfers to other healthcare facilities were included in the discharge calculation. Elective or scheduled rehospitalizations as well as multiple rehospitalizations in the same 30‐day window were considered individual rehospitalization events. Rehospitalization was reported as a ratio of 30‐day rehospitalizations divided by live discharges in a calendar month. Length of stay was reported as the mean length of stay among live discharges in a calendar month. Outcomes were calculated at the participant site and then uploaded as overall monthly unit outcomes to a Web‐based research database.
To account for seasonal trends as well as marked variation in month‐to‐month rehospitalization rates identified in longitudinal data, we elected to compare 3‐month year‐over‐year averages to determine relative changes in readmission rates from the period prior to BOOST implementation to the period after BOOST implementation. We calculated averages for rehospitalization and length of stay in the 3‐month period preceding the sites' first reported month of front‐line implementation and in the corresponding 3‐month period in the subsequent calendar year. For example, if a site reported implementing its first tool in April 2010, the average readmission rate in the unit for January 2011 through March 2011 was subtracted from the average readmission rate for January 2010 through March 2010.
Sites were surveyed regarding tool implementation rates 6 months and 24 months after the 2009 kickoff training session. Surveys were electronically completed by site leaders in consultation with site team members. The survey identified new tool implementation as well as modification of existing care processes using the BOOST tools (admission risk assessment, discharge readiness checklist, teach back use, mandate regarding discharge summary completion, follow‐up phone calls to >80% of discharges). Use of a sixth tool, creation of individualized written discharge instructions, was not measured. We credited sites with tool implementation if they reported either de novo tool use or alteration of previous care processes influenced by BOOST tools.
Clinical outcome reporting was voluntary, and sites did not receive compensation and were not subject to penalty for the degree of implementation or outcome reporting. No patient‐level information was collected for the analysis, which was approved by the Northwestern University institutional review board.
Data Sources and Methods
Readmission and length of stay data, including the unit level readmission rate, as collected from administrative sources at each hospital, were collected using templated spreadsheet software between December 2008 and June 2010, after which data were loaded directly to a Web‐based data‐tracking platform. Sites were asked to load data as they became available. Sites were asked to report the number of study unit discharges as well as the number of those discharges readmitted within 30 days; however, reporting of the number of patient discharges was inconsistent across sites. Serial outreach consisting of monthly phone calls or email messaging to site leaders was conducted throughout 2011 to increase site participation in the project analysis.
Implementation date information was collected from 2 sources. The first was through online surveys distributed in November 2009 and April 2011. The second was through fields in the Web‐based data tracking platform to which sites uploaded data. In cases where disagreement was found between these 2 sources, the site leader was contacted for clarification.
Practice setting (community teaching, community nonteaching, academic medical center) was determined by site‐leader report within the Web‐based data tracking platform. Data for hospital characteristics (number of licensed beds and geographic region) were obtained from the American Hospital Association's Annual Survey of Hospitals.[18] Hospital region was characterized as West, South, Midwest, or Northeast.
Analysis
The null hypothesis was that no prepost difference existed in readmission rates within BOOST units, and no difference existed in the prepost change in readmission rates in BOOST units when compared to site‐matched control units. The Wilcoxon rank sum test was used to test whether observed changes described above were significantly different from 0, supporting rejection of the null hypotheses. We performed similar tests to determine the significance of observed changes in length of stay. We performed our analysis using SAS 9.3 (SAS Institute Inc., Cary, NC).
RESULTS
Eleven hospitals provided rehospitalization and length‐of‐stay outcome data for both a BOOST and control unit for the pre‐ and postimplementation periods. Compared to the 19 sites that did not participate in the analysis, these 11 sites were significantly larger (559188 beds vs 350205 beds, P=0.003), more likely to be located in an urban area (100.0% [n=11] vs 78.9% [n=15], P=0.035), and more likely to be academic medical centers (45.5% [n=5] vs 26.3% [n=5], P=0.036) (Table 1).
The mean number of tools implemented by sites participating in the analysis was 3.50.9. All sites implemented at least 2 tools. The duration between attendance at the BOOST kickoff event and first tool implementation ranged from 3 months (first tool implemented prior to attending the kickoff) and 9 months (mean duration, 3.34.3 months) (Table 2).
| Hospital | Region | Hospital Type | No. Licensed Beds | Kickoff Implementationa | Risk Assessment | Discharge Checklist | Teach Back | Discharge Summary Completion | Follow‐up Phone Call | Total |
|---|---|---|---|---|---|---|---|---|---|---|
| ||||||||||
| 1 | Midwest | Community teaching | <300 | 8 | 3 | |||||
| 2 | West | Community teaching | >600 | 0 | 4 | |||||
| 3 | Northeast | Academic medical center | >600 | 2 | 4 | |||||
| 4 | Northeast | Community nonteaching | <300 | 9 | 2 | |||||
| 5 | South | Community nonteaching | >600 | 6 | 3 | |||||
| 6 | South | Community nonteaching | >600 | 3 | 4 | |||||
| 7 | Midwest | Community teaching | 300600 | 1 | 5 | |||||
| 8 | West | Academic medical center | 300600 | 1 | 4 | |||||
| 9 | South | Academic medical center | >600 | 4 | 4 | |||||
| 10 | Midwest | Academic medical center | 300600 | 3 | 3 | |||||
| 11 | Midwest | Academic medical center | >600 | 9 | 2 | |||||
The average rate of 30‐day rehospitalization among BOOST units was 14.7% in the preimplementation period and 12.7% during the postimplementation period (P=0.010) (Figure 1). Rehospitalization rates for matched control units were 14.0% in the preintervention period and 14.1% in the postintervention period (P=0.831). The mean absolute reduction in readmission rates over the 1‐year study period in BOOST units compared to control units was 2.0%, or a relative reduction of 13.6% (P=0.054 for signed rank test comparing differences in readmission rate reduction in BOOST units compared to site‐matched control units). Length of stay in BOOST and control units decreased an average of 0.5 days and 0.3 days, respectively. There was no difference in length of stay change between BOOST units and control units (P=0.966).
DISCUSSION
As hospitals strive to reduce their readmission rates to avoid Centers for Medicare and Medicaid Services penalties, Project BOOST may be a viable QI approach to achieve their goals. This initial evaluation of participation in Project BOOST by 11 hospitals of varying sizes across the United States showed an associated reduction in rehospitalization rates (absolute=2.0% and relative=13.6%, P=0.054). We did not find any significant change in length of stay among these hospitals implementing BOOST tools.
The tools provided to participating hospitals were developed from evidence found in peer‐reviewed literature established through experimental methods in well‐controlled academic settings. Further tool development was informed by recommendations of an advisory board consisting of expert representatives and advocates involved in the hospital discharge process: patients, caregivers, physicians, nurses, case managers, social workers, insurers, and regulatory and research agencies.[19] The toolkit components address multiple aspects of hospital discharge and follow‐up with the goal of improving health by optimizing the safety of care transitions. Our observation that readmission rates appeared to improve in a diverse hospital sample including nonacademic and community hospitals engaged in Project BOOST is reassuring that the benefits seen in existing research literature, developed in distinctly academic settings, can be replicated in diverse acute‐care settings.
The effect size observed in our study was modest but consistent with several studies identified in a recent review of trials measuring interventions to reduce rehospitalization, where 7 of 16 studies showing a significant improvement registered change in the 0% to 5% absolute range.[12] Impact of this project may have been tempered by the need to translate external QI content to the local setting. Additionally, in contrast to experimental studies that are limited in scope and timing and often scaled to a research budget, BOOST sites were encouraged to implement Project BOOST in the clinical setting even if no new funds were available to support the effort.[12]
The recruitment of a national sample of both academic and nonacademic hospital participants imposed several limitations on our study and analysis. We recognize that intervention units selected by hospitals may have had unmeasured unit and patient characteristics that facilitated successful change and contributed to the observed improvements. However, because external pressure to reduce readmission is present across all hospitals independent of the BOOST intervention, we felt site‐matched controls were essential to understanding effects attributable to the BOOST tools. Differences between units would be expected to be stable over the course of the study period, and comparison of outcome differences between 2 different time periods would be reasonable. Additionally, we could not collect data on readmissions to other hospitals. Theoretically, patients discharged from BOOST units might be more likely to have been rehospitalized elsewhere, but the fraction of rehospitalizations occurring at alternate facilities would also be expected to be similar on the matched control unit.
We report findings from a voluntary cohort willing and capable of designating a comparison clinical unit and contributing the requested data outcomes. Pilot sites that did not report outcomes were not analyzed, but comparison of hospital characteristics shows that participating hospitals were more likely to be large, urban, academic medical centers. Although barriers to data submission were not formally analyzed, reports from nonparticipating sites describe data submission limited by local implementation design (no geographic rollout or simultaneous rollout on all appropriate clinical units), site specific inability to generate unit level outcome statistics, and competing organizational priorities for data analyst time (electronic medical record deployment, alternative QI initiatives). The external validity of our results may be limited to organizations capable of analytics at the level of the individual clinical unit as well as those with sufficient QI resources to support reporting to a national database in the absence of a payer mandate. It is possible that additional financial support for on‐site data collection would have bolstered participation, making the example of participation rates we present potentially informative to organizations hoping to widely disseminate a QI agenda.
Nonetheless, the effectiveness demonstrated in the 11 sites that did participate is encouraging, and ongoing collaboration with subsequent BOOST cohorts has been designed to further facilitate data collection. Among the insights gained from this pilot experience, and incorporated into ongoing BOOST cohorts, is the importance of intensive mentor engagement to foster accountability among participant sites, assist with implementation troubleshooting, and offer expertise that is often particularly effective in gaining local support. We now encourage sites to have 2 mentor site visits to further these roles and more frequent conference calls. Further research to understand the marginal benefit of the mentored implementation approach is ongoing.
The limitations in data submission we experienced with the pilot cohort likely reflect resource constraints not uncommon at many hospitals. Increasing pressure placed on hospitals as a result of the Readmission Reduction Program within the Affordable Care Act as well as increasing interest from private and Medicaid payors to incorporate similar readmission‐based penalties provide encouragement for hospitals to enhance their data and analytic skills. National incentives for implementation of electronic health records (EHR) should also foster such capabilities, though we often saw EHRs as a barrier to QI, especially rapid cycle trials. Fortunately, hospitals are increasingly being afforded access to comprehensive claims databases to assist in tracking readmission rates to other facilities, and these data are becoming available in a more timely fashion. This more robust data collection, facilitated by private payors, state QI organizations, and state hospital associations, will support additional analytic methods such as multivariate regression models and interrupted time series designs to appreciate the experience of current BOOST participants.
Additional research is needed to understand the role of organizational context in the effectiveness of Project BOOST. Differences in rates of tool implementation and changes in clinical outcomes are likely dependent on local implementation context at the level of the healthcare organization and individual clinical unit.[20] Progress reports from site mentors and previously described experiences of QI implementation indicate that successful implementation of a multidimensional bundle of interventions may have reflected a higher level of institutional support, more robust team engagement in the work of reducing readmissions, increased clinical staff support for change, the presence of an effective project champion, or a key facilitating role of external mentorship.[21, 22] Ongoing data collection will continue to measure the sustainability of tool use and observed outcome changes to inform strategies to maintain gains associated with implementation. The role of mentored implementation in facilitating gains also requires further study.
Increasing attention to the problem of avoidable rehospitalization is driving hospitals, insurers, and policy makers to pursue QI efforts that favorably impact readmission rates. Our analysis of the BOOST intervention suggests that modest gains can be achieved following evidence‐based hospital process change facilitated by a mentored implementation model. However, realization of the goal of a 20% reduction in rehospitalization proposed by the Center for Medicare and Medicaid Services' Partnership for Patients initiative may be difficult to achieve on a national scale,[23] especially if efforts focus on just the hospital.
Acknowledgments
The authors acknowledge the contributions of Amanda Creden, BA (data collection), Julia Lee (biostatistical support), and the support of Amy Berman, BS, RN, Senior Program Officer at The John A. Hartford Foundation.
Disclosures
Project BOOST was funded by a grant from The John A. Hartford Foundation. Project BOOST is administered by the Society of Hospital Medicine (SHM). The development of the Project BOOST toolkit, recruitment of sites for this study, mentorship of the pilot cohort, project evaluation planning, and collection of pilot data were funded by a grant from The John A. Harford Foundation. Additional funding for continued data collection and analysis was funded by the SHM through funds from hospitals to participate in Project BOOST, specifically with funding support for Dr. Hansen. Dr. Williams has received funding to serve as Principal Investigator for Project BOOST. Since the time of initial cohort participation, approximately 125 additional hospitals have participated in the mentored implementation of Project BOOST. This participation was funded through a combination of site‐based tuition, third‐party payor support from private insurers, foundations, and federal funding through the Center for Medicare and Medicaid Innovation Partnership for Patients program. Drs. Greenwald, Hansen, and Williams are Project BOOST mentors for current Project BOOST sites and receive financial support through the SHM for this work. Dr. Howell has previously received funding as a Project BOOST mentor. Ms. Budnitz is the BOOST Project Director and is Chief Strategy and Development Officer for the HM. Dr. Maynard is the Senior Vice President of the SHM's Center for Hospital Innovation and Improvement.
References
- , , . Rehospitalizations among patients in the Medicare fee‐for‐service program. N Engl J Med. 2009;360(14):1418–1428.
- United States Congress. House Committee on Education and Labor. Coe on Ways and Means, Committee on Energy and Commerce, Compilation of Patient Protection and Affordable Care Act: as amended through November 1, 2010 including Patient Protection and Affordable Care Act health‐related portions of the Health Care and Education Reconciliation Act of 2010. Washington, DC: US Government Printing Office; 2010.
- Cost estimate for the amendment in the nature of a substitute to H.R. 3590, as proposed in the Senate on November 18, 2009. Washington, DC: Congressional Budget Office; 2009.
- Partnership for Patients, Center for Medicare and Medicaid Innovation. Available at: http://www.innovations.cms.gov/initiatives/Partnership‐for‐Patients/index.html. Accessed December 12, 2012.
- , . Providers have failed to work for continuity. Hospitals. 1979;53(10):79.
- , . Executing high‐quality care transitions: a call to do it right. J Hosp Med. 2007;2(5):287–290.
- , , , , . The incidence and severity of adverse events affecting patients after discharge from the hospital. Ann Intern Med. 2003;138(3):161–167.
- , , , et al. Adverse events among medical patients after discharge from hospital. CMAJ. 2004;170(3):345–349.
- , , , et al. Making inpatient medication reconciliation patient centered, clinically relevant and implementable: a consensus statement on key principles and necessary first steps. J Hosp Med. 2010;5(8):477–485.
- , , . Tying up loose ends: discharging patients with unresolved medical issues. Arch Intern Med. 2007;167(12):1305.
- , , , , , . Deficits in communication and information transfer between hospital‐based and primary care physicians. JAMA. 2007;297(8):831–841.
- , , , , . Interventions to reduce 30‐day rehospitalization: a systematic review. Ann Intern Med. 2011;155(8):520–528.
- , , , et al. A reengineered hospital discharge program to decrease rehospitalization: a randomized trial. Ann Intern Med. 2009;150(3):178.
- , , , et al. Advancing the science of patient safety. Ann Intern Med. 2011;154(10):693–696.
- , . From best evidence to best practice: effective implementation of change in patients' care. Lancet. 2003;362(9391):1225–1230.
- , , , et al. Quality improvement projects targeting health care‐associated infections: comparing virtual collaborative and toolkit approaches. J Hosp Med. 2011;6(5):271–278.
- , , , , . Publication guidelines for improvement studies in health care: evolution of the SQUIRE project. Ann Intern Med. 2008;149(9):670–676.
- , , , . Risk stratification and therapeutic decision making in acute coronary syndromes. JAMA. 2000;284(7):876–878.
- , , . Are diagnosis specific outcome indicators based on administrative data useful in assessing quality of hospital care? BMJ. 2004;13(1):32.
- , , , et al. What distinguishes top‐performing hospitals in acute myocardial infarction mortality rates? Ann Intern Med. 2011;154(6):384–390.
- , , , . The Model for Understanding Success in Quality (MUSIQ): building a theory of context in healthcare quality improvement. BMJ Qual Saf. 2012;21(1):13–20.
- , . Evidence‐based quality improvement: the state of the science. Health Aff (Millwood). 2005;24(1):138–150.
- Center for Medicare and Medicaid Innovation. Partnership for patients. Available at: http://www.innovations.cms.gov/initiatives/Partnership‐for‐Patients/index.html. Accessed April 2, 2012.
Copyright © 2013 Society of Hospital Medicine

Consultation Improvement Teaching Module
An important role of the internist is that of inpatient medical consultant.13 As consultants, internists make recommendations regarding the patient's medical care and help the primary team to care for the patient. This requires familiarity with the body of knowledge of consultative medicine, as well as process skills that relate to working with teams of providers.1, 4, 5 For some physicians, the knowledge and skills of medical consultation are acquired during residency; however, many internists feel inadequately prepared for their roles of consultants.68 Because no specific requirements for medical consultation curricula during graduate medical education have been set forth, internists and other physicians do not receive uniform or comprehensive training in this area.3, 57, 9 Although internal medicine residents may gain experience while performing consultations on subspecialty rotations (eg, cardiology), the teaching on these blocks tends to be focused on the specialty content and less so on consultative principles.1, 4
As inpatient care is increasingly being taken over by hospitalists, the role of the hospitalist has expanded to include medical consultation. It is estimated that 92% of hospitalists care for patients on medical consultation services.8 The Society of Hospital Medicine (SHM) has also included medical consultation as one of the core competencies of the hospitalist.2 Therefore, it is essential that hospitalists master the knowledge and skills that are required to serve as effective consultants.10, 11
An educational strategy that has been shown to be effective in improving medical practice is audit and feedback.1215 Providing physicians with feedback on their clinical practice has been shown to improve performance more so than other educational methods.12 Practice‐based learning and improvement (PBLI) utilizes this strategy and it has become one of the core competencies stressed by the Accreditation Council for Graduate Medical Education (ACGME). It involves analyzing one's patient care practices in order to identify areas for improvement. In this study, we tested the impact of a newly developed one‐on‐one medical consultation educational module that was combined with audit and feedback in an attempt to improve the quality of the consultations being performed by our hospitalists.
Materials and Methods
Study Design and Setting
This single group pre‐post educational intervention study took place at Johns Hopkins Bayview Medical Center (JHBMC), a 353‐bed university‐affiliated tertiary care medical center in Baltimore, MD, during the 2006‐2007 academic year.
Study Subjects
All 7 members of the hospitalist group at JHBMC who were serving on the medical consultation service during the study period participated. The internal medicine residents who elected to rotate on the consultation service during the study period were also exposed to the case‐based module component of the intervention.
Intervention
The educational intervention was delivered as a one‐on‐one session and lasted approximately 1 hour. The time was spent on the following activities:
A true‐false pretest to assess knowledge based on clinical scenarios (Appendix 1).
A case‐based module emphasizing the core principles of consultative medicine.16 The module was purposively designed to teach and stimulate thought around 3 complex general medical consultations. These cases are followed by questions about scenarios. The cases specifically address the role of medical consultant and the ways to be most effective in this role based on the recommendations of experts in the field.1, 10 Additional details about the content and format can be viewed at
http://www.jhcme.com/site .16 As the physician was working through the teaching cases, the teacher would facilitate discussion around wrong answers and issues that the learner wanted to discuss.The true‐false test to assess knowledge was once again administered (the posttest was identical to the pretest).
For the hospitalist faculty members only (and not the residents), audit and feedback was utilized. The physician was shown 2 of his/her most recent consults and was asked to reflect upon the strengths and weaknesses of the consult. The hospitalist was explicitly asked to critique them in light of the knowledge they gained from the consultation module. The teacher also gave specific feedback, both positive and negative, about the written consultations with attention directed specifically toward: the number of recommendations, the specificity of the guidance (eg, exact dosing of medications), clear documentation of their name and contact information, and documentation that the suggestions were verbally passed on to the primary team.
Evaluation Data
Learner knowledge, both at baseline and after the case‐based module, was assessed using a written test.
Consultations performed before and after the intervention were compared. Copies of up to 5 consults done by each hospitalist during the year before or after the educational intervention were collected. Identifiers and dates were removed from the consults so that scorers did not know whether the consults were preintervention or postintervention. Consults were scored out of a possible total of 4 to 6 pointsdepending on whether specific elements were applicable. One point was given for each of the following: (1) number of recommendations 5; (2) specific details for all drugs listed [if applicable]; (3) specific details for imaging studies suggested [if applicable]; (4) specific follow‐up documented; (5) consultant's name being clearly written; and (6) verbal contact with the referring team documented. These 6 elements were included based on expert recommendation.10 All consults were scored by 2 hospitalists independently. Disagreements in scores were infrequent (on <10% of the 48 consults scored) and these were only off by 1 point for the overall score. The disagreements were settled by discussion and consensus. All consult scores were converted to a score out of 5, to allow comparisons to be made.
Following the intervention, each participant completed an overall assessment of the educational experience.
Data Analysis
We examined the frequency of responses for each variable and reviewed the distributions. The knowledge scores on the written pretests were not normally distributed and therefore when making comparisons to the posttest, we used the Wilcoxon rank signed test. In comparing the performance scores on the consults across the 2 time periods, we compared the results with both Wilcoxon rank signed test and paired t tests. Because the results were equivalent with both tests, the means from the t tests are shown. Data were analyzed using STATA version 8 (Stata Corp., College Station, TX).
Results
Study Subjects
Among the 14 hospitalist faculty members who were on staff during the study period, 7 were performing medical consults and therefore participated in the study. The 7 faculty members had a mean age of 35 years; 5 (71%) were female, and 5 (71%) were board‐certified in Internal Medicine. The average elapsed time since completion of residency was 5.1 years and average number of years practicing as a hospitalist was 3.8 years (Table 1).
| Faculty (n = 7) | |
| Age in years, mean (SD) | 35.57 (5.1) |
| Female, n (%) | 5 (71%) |
| Board certified, n (%) | 5 (71%) |
| Years since completion of residency, mean (SD) | 5.1 (4.4) |
| Number of years in practice, mean (SD) | 3.8 (2.9) |
| Weeks spent in medical consult rotation, mean (SD) | 3.7 (0.8) |
| Have read consultation books, n (%) | 5 (71%) |
| Housestaff (n = 11) | |
| Age in years, mean (SD) | 29.1 (1.8) |
| Female, n (%) | 7 (64%) |
| Residency year, n (%) | |
| PGY1 | 0 (0%) |
| PGY2 | 2 (20%) |
| PGY3 | 7 (70%) |
| PGY4 | 1 (10%) |
| Weeks spent in medical consult rotation, mean (SD) | 1.5 (0.85) |
| Have read consultation books, n (%) | 5 (50%) |
There were 12 house‐staff members who were on their medical consultation rotation during the study period and were exposed to the intervention. Of the 12 house‐staff members, 11 provided demographic information. Characteristics of the 11 house‐staff participants are also shown in Table 1.
Premodule vs. Postmodule Knowledge Assessment
Both faculty and house‐staff performed very well on the true/false pretest. The small changes in the median scores from pretest to posttest did not change significantly for the faculty (pretest: 11/14, posttest: 12/14; P = 0.08), but did reach statistical significance for the house‐staff (pretest: 10/14, posttest: 12/14; P = 0.03).
Audit and Feedback
Of the 7 faculty who participated in the study, 6 performed consults both before and after the intervention. Using the consult scoring system, the scores for all 6 physicians' consults improved after the intervention compared to their earlier consults (Table 2). For 1 faculty member, the consult scores were statistically significantly higher after the intervention (P = 0.017). When all consults completed by the hospitalists were compared before and after the training, there was statistically significant improvement in consult scores (P < 0.001) (Table 2).
| Preintervention (n =27) | Postintervention (n = 21) | ||||
|---|---|---|---|---|---|
| Consultant | Scores* | Mean | Scores* | Mean | P value |
| |||||
| A | 2, 3, 3.75, 3, 2.5 | 2.8 | 3, 3, 3, 4, 4 | 3.4 | 0.093 |
| B | 3, 3, 3, 3, 1 | 2.6 | 4, 3, 3, 2.5 | 3.1 | 0.18 |
| C | 2, 1.67 | 1.8 | 4, 2, 3 | 3.0 | 0.11 |
| D | 4, 2.5, 3.75, 2.5, 3.75 | 3.3 | 3.75, 3 | 3.4 | 0.45 |
| E | 2, 3, 1, 2, 2 | 2.0 | 3, 3, 3.75 | 3.3 | 0.017 |
| F | 3, 3.75, 2.5, 4, 2 | 3.1 | 2, 3.75, 4, 4 | 3.3 | 0.27 |
| All | 2.7 | 3.3 | 0.0006 | ||
Satisfaction with Consultation Curricula
All faculty and house‐staff participants felt that the intervention had an impact on them (19/19, 100%). Eighteen out of 19 participants (95%) would recommend the educational session to colleagues. After participating, 82% of learners felt confident in performing medical consultations. With respect to the audit and feedback process of reviewing their previously performed consultations, all physicians claimed that their written consultation notes would change in the future.
Discussion
This curricular intervention using a case‐based module combined with audit and feedback appears to have resulted not only in improved knowledge, but also changed physician behavior in the form of higher‐quality written consultations. The teaching sessions were also well received and valued by busy hospitalists.
A review of randomized trials of audit and feedback12 revealed that this strategy is effective in improving professional practice in a variety of areas, including laboratory overutilization,13, 14 clinical practice guideline adherence,15, 17 and antibiotic utilization.13 In 1 study, internal medicine specialists audited their consultation letters and most believed that there had been lasting improvements to their notes.18 However, this study did not objectively compare the consultation letters from before audit and feedback to those written afterward but instead relied solely on the respondents' self‐assessment. It is known that many residents and recent graduates of internal medicine programs feel inadequately prepared in the role of consultant.6, 8 This work describes a curricular intervention that served to augment confidence, knowledge, and actual performance in consultation medicine of physicians. Goldman et al.'s10 Ten Commandments for Effective Consultations, which were later modified by Salerno et al.,11 were highlighted in our case‐based teachings: determine the question being asked or how you can help the requesting physician, establish the urgency of the consultation, gather primary data, be as brief as appropriate in your report, provide specific recommendations, provide contingency plans and discuss their execution, define your role in conjunction with the requesting physician, offer educational information, communicate recommendations directly to the requesting physician, and provide daily follow‐up. These tenets informed the development of the consultation scoring system that was used to assess the quality of the written consultations produced by our consultant hospitalists.
Audit and feedback is similar to PBLI, one of the ACGME core competencies for residency training. Both attempt to engage individuals by having them analyze their patient care practices, looking critically to: (1) identify areas needing improvement, and (2) consider strategies that can be implemented to enhance clinical performance. We now show that consultative medicine is an area that appears to be responsive to a mixed methodological educational intervention that includes audit and feedback.
Faculty and house‐staff knowledge of consultative medicine was assessed both before and after the case‐based educational module. Both groups scored very highly on the true/false pretest, suggesting either that their knowledge was excellent at baseline or the test was not sufficiently challenging. If their knowledge was truly very high, then the intervention need not have focused on improving knowledge. It is our interpretation that the true/false knowledge assessment was not challenging enough and therefore failed to comprehensively characterize their knowledge of consultative medicine.
Several limitations of this study should be considered. First, the sample size was small, including only 7 faculty and 12 house‐staff members. However, these numbers were sufficient to show statistically significant overall improvements in both knowledge and on the consultation scores. Second, few consultations were performed by each faculty member, ranging from 2 to 5, before and after the intervention. This may explain why only 1 out of 6 faculty members showed statistically significant improvement in the quality of consults after the intervention. Third, the true/false format of the knowledge tests allowed the subjects to score very high on the pretest, thereby making it difficult to detect knowledge gained after the intervention. Fourth, the scale used to evaluate consults has not been previously validated. The elements assessed by this scale were decided upon based on guidance from the literature10 and the authors' expertise, thereby affording it content validity evidence.19 The recommendations that guided the scale's development have been shown to improve compliance with the recommendations put forth by the consultant.1, 11 Internal structure validity evidence was conferred by the high level of agreement in scores between the independent raters. Relation to other variables validity evidence may be considered because doctors D and F scored highest on this scale and they are the 2 physicians most experienced in consult medicine. Finally, the educational intervention was time‐intensive for both learners and teacher. It consisted of a 1 hour‐long one‐on‐one session. This can be difficult to incorporate into a busy hospitalist program. The intervention can be made more efficient by having learners take the web‐based module online independently, and then meeting with the teacher for the audit and feedback component.
This consult medicine curricular intervention involving audit and feedback was beneficial to hospitalists and resulted in improved consultation notes. While resource intensive, the one‐on‐one teaching session appears to have worked and resulted in outcomes that are meaningful with respect to patient care.
- , .Kammerer and Gross' Medical Consultation: the Internist on Surgical, Obstetric, and Psychiatric Services.3rd ed.Baltimore:Williams and Wilkins;1998.
- Society of Hospital Medicine.Hospitalist as consultant.J Hosp Med.2006;1(S1):70.
- .The internist as consultant.Arch Intern Med.1980;140:137–138.
- , , .Development of an academic section of general internal medicine.Am J Med.1977;63(4):493–498.
- , , , , .Consultations in internal medicine: a training program resource.J Med Educ.1977;52(4):323–327.
- , , .Practice patterns and the adequacy of residency training in consultation medicine.J Gen Intern Med.1993;8(10):554–560.
- , , .General internal medicine consultation: the last bridge.Arch Intern Med.1983;143:875–876.
- ,, , .Hospitalists' perceptions of their residency training needs: results of a national survey.Am J Med.2001;111(3):247–254.
- .The service and educational contributions of a general medicine consultation service.J Gen Intern Med.1986;1:225–227.
- , , .Ten commandments for effective consultations.Arch Intern Med.1983;143:1753–1755.
- , , , .Principles of effective consultation, an update for the 21st‐century consultant.Arch Intern Med.2007;167:271–275.
- , , , , .Does telling people what they have been doing change what they do? A systematic review of the effects of audit and feedback.Qual Saf Health Care.2006;15:433–436.
- , , , .Factors contributing to inappropriate ordering of tests in an academic medical department and the effect of an educational feedback strategy.Postgrad Med J.2006;82:823–829.
- , , , et al.Effects of routine individual feedback over nine years on general practitioners' requests for tests.BMJ.1996;312:490.
- , , , .Improving antibiotic utilization among hospitalists: a pilot academic detailing project with a public health approach.J Hosp Med.2008;3(1):64–70.
- , . The role of the medical consultant. Johns Hopkins Consultative Medicine Essentials for Hospitalists. Available at:http://www.jhcme.com/site/article.cfm?ID=8. Accessed April2009.
- , , .Audit and feedback and clinical practice guideline adherence: making feedback actionable.Implement Sci.2006;1:9.
- , , , .Peer assessment of outpatient consultation letters—feasibility and satisfaction.BMC Med Educ.2007;7:13.
- , , .What is the validity evidence for assessment of clinical teaching?J Gen Intern Med.2005;20:1159–1164.
An important role of the internist is that of inpatient medical consultant.13 As consultants, internists make recommendations regarding the patient's medical care and help the primary team to care for the patient. This requires familiarity with the body of knowledge of consultative medicine, as well as process skills that relate to working with teams of providers.1, 4, 5 For some physicians, the knowledge and skills of medical consultation are acquired during residency; however, many internists feel inadequately prepared for their roles of consultants.68 Because no specific requirements for medical consultation curricula during graduate medical education have been set forth, internists and other physicians do not receive uniform or comprehensive training in this area.3, 57, 9 Although internal medicine residents may gain experience while performing consultations on subspecialty rotations (eg, cardiology), the teaching on these blocks tends to be focused on the specialty content and less so on consultative principles.1, 4
As inpatient care is increasingly being taken over by hospitalists, the role of the hospitalist has expanded to include medical consultation. It is estimated that 92% of hospitalists care for patients on medical consultation services.8 The Society of Hospital Medicine (SHM) has also included medical consultation as one of the core competencies of the hospitalist.2 Therefore, it is essential that hospitalists master the knowledge and skills that are required to serve as effective consultants.10, 11
An educational strategy that has been shown to be effective in improving medical practice is audit and feedback.1215 Providing physicians with feedback on their clinical practice has been shown to improve performance more so than other educational methods.12 Practice‐based learning and improvement (PBLI) utilizes this strategy and it has become one of the core competencies stressed by the Accreditation Council for Graduate Medical Education (ACGME). It involves analyzing one's patient care practices in order to identify areas for improvement. In this study, we tested the impact of a newly developed one‐on‐one medical consultation educational module that was combined with audit and feedback in an attempt to improve the quality of the consultations being performed by our hospitalists.
Materials and Methods
Study Design and Setting
This single group pre‐post educational intervention study took place at Johns Hopkins Bayview Medical Center (JHBMC), a 353‐bed university‐affiliated tertiary care medical center in Baltimore, MD, during the 2006‐2007 academic year.
Study Subjects
All 7 members of the hospitalist group at JHBMC who were serving on the medical consultation service during the study period participated. The internal medicine residents who elected to rotate on the consultation service during the study period were also exposed to the case‐based module component of the intervention.
Intervention
The educational intervention was delivered as a one‐on‐one session and lasted approximately 1 hour. The time was spent on the following activities:
A true‐false pretest to assess knowledge based on clinical scenarios (Appendix 1).
A case‐based module emphasizing the core principles of consultative medicine.16 The module was purposively designed to teach and stimulate thought around 3 complex general medical consultations. These cases are followed by questions about scenarios. The cases specifically address the role of medical consultant and the ways to be most effective in this role based on the recommendations of experts in the field.1, 10 Additional details about the content and format can be viewed at
http://www.jhcme.com/site .16 As the physician was working through the teaching cases, the teacher would facilitate discussion around wrong answers and issues that the learner wanted to discuss.The true‐false test to assess knowledge was once again administered (the posttest was identical to the pretest).
For the hospitalist faculty members only (and not the residents), audit and feedback was utilized. The physician was shown 2 of his/her most recent consults and was asked to reflect upon the strengths and weaknesses of the consult. The hospitalist was explicitly asked to critique them in light of the knowledge they gained from the consultation module. The teacher also gave specific feedback, both positive and negative, about the written consultations with attention directed specifically toward: the number of recommendations, the specificity of the guidance (eg, exact dosing of medications), clear documentation of their name and contact information, and documentation that the suggestions were verbally passed on to the primary team.
Evaluation Data
Learner knowledge, both at baseline and after the case‐based module, was assessed using a written test.
Consultations performed before and after the intervention were compared. Copies of up to 5 consults done by each hospitalist during the year before or after the educational intervention were collected. Identifiers and dates were removed from the consults so that scorers did not know whether the consults were preintervention or postintervention. Consults were scored out of a possible total of 4 to 6 pointsdepending on whether specific elements were applicable. One point was given for each of the following: (1) number of recommendations 5; (2) specific details for all drugs listed [if applicable]; (3) specific details for imaging studies suggested [if applicable]; (4) specific follow‐up documented; (5) consultant's name being clearly written; and (6) verbal contact with the referring team documented. These 6 elements were included based on expert recommendation.10 All consults were scored by 2 hospitalists independently. Disagreements in scores were infrequent (on <10% of the 48 consults scored) and these were only off by 1 point for the overall score. The disagreements were settled by discussion and consensus. All consult scores were converted to a score out of 5, to allow comparisons to be made.
Following the intervention, each participant completed an overall assessment of the educational experience.
Data Analysis
We examined the frequency of responses for each variable and reviewed the distributions. The knowledge scores on the written pretests were not normally distributed and therefore when making comparisons to the posttest, we used the Wilcoxon rank signed test. In comparing the performance scores on the consults across the 2 time periods, we compared the results with both Wilcoxon rank signed test and paired t tests. Because the results were equivalent with both tests, the means from the t tests are shown. Data were analyzed using STATA version 8 (Stata Corp., College Station, TX).
Results
Study Subjects
Among the 14 hospitalist faculty members who were on staff during the study period, 7 were performing medical consults and therefore participated in the study. The 7 faculty members had a mean age of 35 years; 5 (71%) were female, and 5 (71%) were board‐certified in Internal Medicine. The average elapsed time since completion of residency was 5.1 years and average number of years practicing as a hospitalist was 3.8 years (Table 1).
| Faculty (n = 7) | |
| Age in years, mean (SD) | 35.57 (5.1) |
| Female, n (%) | 5 (71%) |
| Board certified, n (%) | 5 (71%) |
| Years since completion of residency, mean (SD) | 5.1 (4.4) |
| Number of years in practice, mean (SD) | 3.8 (2.9) |
| Weeks spent in medical consult rotation, mean (SD) | 3.7 (0.8) |
| Have read consultation books, n (%) | 5 (71%) |
| Housestaff (n = 11) | |
| Age in years, mean (SD) | 29.1 (1.8) |
| Female, n (%) | 7 (64%) |
| Residency year, n (%) | |
| PGY1 | 0 (0%) |
| PGY2 | 2 (20%) |
| PGY3 | 7 (70%) |
| PGY4 | 1 (10%) |
| Weeks spent in medical consult rotation, mean (SD) | 1.5 (0.85) |
| Have read consultation books, n (%) | 5 (50%) |
There were 12 house‐staff members who were on their medical consultation rotation during the study period and were exposed to the intervention. Of the 12 house‐staff members, 11 provided demographic information. Characteristics of the 11 house‐staff participants are also shown in Table 1.
Premodule vs. Postmodule Knowledge Assessment
Both faculty and house‐staff performed very well on the true/false pretest. The small changes in the median scores from pretest to posttest did not change significantly for the faculty (pretest: 11/14, posttest: 12/14; P = 0.08), but did reach statistical significance for the house‐staff (pretest: 10/14, posttest: 12/14; P = 0.03).
Audit and Feedback
Of the 7 faculty who participated in the study, 6 performed consults both before and after the intervention. Using the consult scoring system, the scores for all 6 physicians' consults improved after the intervention compared to their earlier consults (Table 2). For 1 faculty member, the consult scores were statistically significantly higher after the intervention (P = 0.017). When all consults completed by the hospitalists were compared before and after the training, there was statistically significant improvement in consult scores (P < 0.001) (Table 2).
| Preintervention (n =27) | Postintervention (n = 21) | ||||
|---|---|---|---|---|---|
| Consultant | Scores* | Mean | Scores* | Mean | P value |
| |||||
| A | 2, 3, 3.75, 3, 2.5 | 2.8 | 3, 3, 3, 4, 4 | 3.4 | 0.093 |
| B | 3, 3, 3, 3, 1 | 2.6 | 4, 3, 3, 2.5 | 3.1 | 0.18 |
| C | 2, 1.67 | 1.8 | 4, 2, 3 | 3.0 | 0.11 |
| D | 4, 2.5, 3.75, 2.5, 3.75 | 3.3 | 3.75, 3 | 3.4 | 0.45 |
| E | 2, 3, 1, 2, 2 | 2.0 | 3, 3, 3.75 | 3.3 | 0.017 |
| F | 3, 3.75, 2.5, 4, 2 | 3.1 | 2, 3.75, 4, 4 | 3.3 | 0.27 |
| All | 2.7 | 3.3 | 0.0006 | ||
Satisfaction with Consultation Curricula
All faculty and house‐staff participants felt that the intervention had an impact on them (19/19, 100%). Eighteen out of 19 participants (95%) would recommend the educational session to colleagues. After participating, 82% of learners felt confident in performing medical consultations. With respect to the audit and feedback process of reviewing their previously performed consultations, all physicians claimed that their written consultation notes would change in the future.
Discussion
This curricular intervention using a case‐based module combined with audit and feedback appears to have resulted not only in improved knowledge, but also changed physician behavior in the form of higher‐quality written consultations. The teaching sessions were also well received and valued by busy hospitalists.
A review of randomized trials of audit and feedback12 revealed that this strategy is effective in improving professional practice in a variety of areas, including laboratory overutilization,13, 14 clinical practice guideline adherence,15, 17 and antibiotic utilization.13 In 1 study, internal medicine specialists audited their consultation letters and most believed that there had been lasting improvements to their notes.18 However, this study did not objectively compare the consultation letters from before audit and feedback to those written afterward but instead relied solely on the respondents' self‐assessment. It is known that many residents and recent graduates of internal medicine programs feel inadequately prepared in the role of consultant.6, 8 This work describes a curricular intervention that served to augment confidence, knowledge, and actual performance in consultation medicine of physicians. Goldman et al.'s10 Ten Commandments for Effective Consultations, which were later modified by Salerno et al.,11 were highlighted in our case‐based teachings: determine the question being asked or how you can help the requesting physician, establish the urgency of the consultation, gather primary data, be as brief as appropriate in your report, provide specific recommendations, provide contingency plans and discuss their execution, define your role in conjunction with the requesting physician, offer educational information, communicate recommendations directly to the requesting physician, and provide daily follow‐up. These tenets informed the development of the consultation scoring system that was used to assess the quality of the written consultations produced by our consultant hospitalists.
Audit and feedback is similar to PBLI, one of the ACGME core competencies for residency training. Both attempt to engage individuals by having them analyze their patient care practices, looking critically to: (1) identify areas needing improvement, and (2) consider strategies that can be implemented to enhance clinical performance. We now show that consultative medicine is an area that appears to be responsive to a mixed methodological educational intervention that includes audit and feedback.
Faculty and house‐staff knowledge of consultative medicine was assessed both before and after the case‐based educational module. Both groups scored very highly on the true/false pretest, suggesting either that their knowledge was excellent at baseline or the test was not sufficiently challenging. If their knowledge was truly very high, then the intervention need not have focused on improving knowledge. It is our interpretation that the true/false knowledge assessment was not challenging enough and therefore failed to comprehensively characterize their knowledge of consultative medicine.
Several limitations of this study should be considered. First, the sample size was small, including only 7 faculty and 12 house‐staff members. However, these numbers were sufficient to show statistically significant overall improvements in both knowledge and on the consultation scores. Second, few consultations were performed by each faculty member, ranging from 2 to 5, before and after the intervention. This may explain why only 1 out of 6 faculty members showed statistically significant improvement in the quality of consults after the intervention. Third, the true/false format of the knowledge tests allowed the subjects to score very high on the pretest, thereby making it difficult to detect knowledge gained after the intervention. Fourth, the scale used to evaluate consults has not been previously validated. The elements assessed by this scale were decided upon based on guidance from the literature10 and the authors' expertise, thereby affording it content validity evidence.19 The recommendations that guided the scale's development have been shown to improve compliance with the recommendations put forth by the consultant.1, 11 Internal structure validity evidence was conferred by the high level of agreement in scores between the independent raters. Relation to other variables validity evidence may be considered because doctors D and F scored highest on this scale and they are the 2 physicians most experienced in consult medicine. Finally, the educational intervention was time‐intensive for both learners and teacher. It consisted of a 1 hour‐long one‐on‐one session. This can be difficult to incorporate into a busy hospitalist program. The intervention can be made more efficient by having learners take the web‐based module online independently, and then meeting with the teacher for the audit and feedback component.
This consult medicine curricular intervention involving audit and feedback was beneficial to hospitalists and resulted in improved consultation notes. While resource intensive, the one‐on‐one teaching session appears to have worked and resulted in outcomes that are meaningful with respect to patient care.
- , .Kammerer and Gross' Medical Consultation: the Internist on Surgical, Obstetric, and Psychiatric Services.3rd ed.Baltimore:Williams and Wilkins;1998.
- Society of Hospital Medicine.Hospitalist as consultant.J Hosp Med.2006;1(S1):70.
- .The internist as consultant.Arch Intern Med.1980;140:137–138.
- , , .Development of an academic section of general internal medicine.Am J Med.1977;63(4):493–498.
- , , , , .Consultations in internal medicine: a training program resource.J Med Educ.1977;52(4):323–327.
- , , .Practice patterns and the adequacy of residency training in consultation medicine.J Gen Intern Med.1993;8(10):554–560.
- , , .General internal medicine consultation: the last bridge.Arch Intern Med.1983;143:875–876.
- ,, , .Hospitalists' perceptions of their residency training needs: results of a national survey.Am J Med.2001;111(3):247–254.
- .The service and educational contributions of a general medicine consultation service.J Gen Intern Med.1986;1:225–227.
- , , .Ten commandments for effective consultations.Arch Intern Med.1983;143:1753–1755.
- , , , .Principles of effective consultation, an update for the 21st‐century consultant.Arch Intern Med.2007;167:271–275.
- , , , , .Does telling people what they have been doing change what they do? A systematic review of the effects of audit and feedback.Qual Saf Health Care.2006;15:433–436.
- , , , .Factors contributing to inappropriate ordering of tests in an academic medical department and the effect of an educational feedback strategy.Postgrad Med J.2006;82:823–829.
- , , , et al.Effects of routine individual feedback over nine years on general practitioners' requests for tests.BMJ.1996;312:490.
- , , , .Improving antibiotic utilization among hospitalists: a pilot academic detailing project with a public health approach.J Hosp Med.2008;3(1):64–70.
- , . The role of the medical consultant. Johns Hopkins Consultative Medicine Essentials for Hospitalists. Available at:http://www.jhcme.com/site/article.cfm?ID=8. Accessed April2009.
- , , .Audit and feedback and clinical practice guideline adherence: making feedback actionable.Implement Sci.2006;1:9.
- , , , .Peer assessment of outpatient consultation letters—feasibility and satisfaction.BMC Med Educ.2007;7:13.
- , , .What is the validity evidence for assessment of clinical teaching?J Gen Intern Med.2005;20:1159–1164.
Copyright © 2009 Society of Hospital Medicine
Academic Suppport
Promotion through the ranks is the hallmark of success in academia. The support and infrastructure necessary to develop junior faculty members at academic medical centers may be inadequate.1, 2 Academic hospitalists are particularly vulnerable and at high risk for failure because of their heavy clinical commitment and limited time to pursue scholarly interests. Further, relatively few have pursued fellowship training, which means that many hospitalists must learn research‐related skills and the nuances of academia after joining the faculty.
Top‐notch mentors are believed to be integral to the success of the academic physician.36 Among other responsibilities, mentors (1) direct mentees toward promising opportunities, (2) serve as advocates for mentees, and (3) lend expertise to mentees' studies and scholarship. In general, there is concern that the cadre of talented, committed, and capable mentors is dwindling such that they are insufficient in number to satisfy and support the needs of the faculty.7, 8 In hospital medicine, experienced mentorship is particularly in short supply because the field is relatively new and there has been tremendous growth in the number of academic hospitalists, producing a large demand.
Like many hospitalist groups, our hospitalist division, the Collaborative Inpatient Medicine Service (CIMS), has experienced significant growth. It became apparent that the faculty needed and deserved a well‐designed academic support program to foster the development of skills necessary for academic success. The remainder of this article discusses our approach toward fulfilling these needs and the results to date.
DEVELOPING THE HOSPITALIST ACADEMIC SUPPORT PROGRAM
Problem Identification
Johns Hopkins Bayview Medical Center (JHBMC) is a 700‐bed urban university‐affiliated hospital. The CIMS hospital group is a distinct division separate from the hospitalist group at Johns Hopkins Hospital. All faculty are employed by the Johns Hopkins University School of Medicine (JHUSOM), and there is a single promotion track for the faculty. Specific requirements for promotion may be found in the Johns Hopkins University School of Medicine silver book at
CIMS had been growing in numbers from 4 full‐time equivalent (FTE) physicians in fiscal year (FY) 01 to 11.8 FTE physicians in FY06.
Most had limited training in research.
The physicians had little protected time for skill development and for working on scholarly projects.
Attempts to recruit a professor‐/associate professorlevel hospitalist from another institution to mentor our faculty members had been unsuccessful.
The hospitalists in our group had diverse interests such that we needed to find a flexible mentor who was willing and able to work across a breadth of content areas and methodologies.
Preliminary attempts to link up our hospitalists with clinician‐investigators at our institution were not fruitful.
Needs Assessment
In soliciting input from the hospitalists themselves and other stakeholders (including institutional leadership and leaders in hospital medicine), the following needs were identified:
Each CIMS faculty member must have a body of scholarship to support promotion and long‐term academic success.
Each CIMS faculty member needs appropriate mentorship.
Each CIMS faculty member needs protected time for scholarly work.
The CIMS faculty members need to support one another and be collaborative in their scholarly work.
The scholarly activities of the CIMS faculty need to support the mission of the division.
The mission of our division had been established to value and encourage the diverse interests and talents within the group:
The Collaborative Inpatient Medical Service (CIMS) is dedicated to serving the public trust by advancing the field of Hospital Medicine through the realization of excellence in patient care, education, research, leadership, and systems‐improvement.
Objectives
The objectives of the academic support program were organized into those for the CIMS Division as well as specific individual faculty goals and are outlined below:
Objectives for the division:
To increase the number and quality of peer‐reviewed publications produced by CIMS faculty.
To increase the amount of scholarly time available to CIMS faculty. In addition to external funding sources, we were committed to exploring nontraditional funding sources such as hospital administration and partnerships with other divisions or departments (including information technology) in need of clinically savvy physicians to help with projects.
To augment the leadership roles of the CIMS faculty with our institution and on a national level.
To support the CIMS faculty members such that they can be promoted at Johns Hopkins University School of Medicine (JHUSOM) and thereby retained.
Goals for individuals:
Each CIMS faculty member will advance his or her skill set to be moving toward producing scholarly work independently.
Each faculty member will lead at least 1 scholarly project at all times and will be involved as a team‐member in others.
Each faculty member will understand the criteria for promotion at our institution and will reflect on plans and strategies to realize success.
Strategies for Achieving the Objectives and Goals
Establish a Strong Mentoring System for the CIMS
The CIMS identified a primary mentor for the group, a faculty member within the Division of General Internal Medicine who was an experienced mentor with formidable management skills and an excellent track record in publishing scholarly work. Twenty‐percent of the mentor's time was set aside so he would have sufficient time to spend with CIMS faculty members in developing scholarly activities.
The mentor meets individually with each CIMS faculty member at the beginning of each academic year to identify career objectives; review current activities, interests, and skills; identify career development needs that require additional training or resources; set priorities for scholarly work; identify opportunities for collaboration internally and externally; and identify additional potential mentors to support specific projects. Regular follow‐up meetings are arranged, as needed to review progress and encourage advancing the work. The mentor uses resources to stay abreast of relevant funding opportunities and shares them with the group. The mentor reports regularly to the director of the CIMS regarding progress. The process as outlined remains ongoing.
Investing the Requisite Resources
A major decision was made that CIMS hospitalists would have 30% of their time protected for academic work, without the need for external funding. The expectation that the faculty had to use this time to effectively advance their career goals, which in turn would support the mission of CIMS, was clearly and explicitly expressed. The faculty would also be permitted to decrease their clinical time further on obtaining external funding. Additionally, in conjunction with a specific grant, the group hired a research assistant to permanently support the scholarly work of the faculty.
Leaders in both hospital administration and the Department of Medicine agreed that the only way to maintain a stable group of mature hospitalists who could serve as champions for change and help develop functional quality improvement projects was to support them in their academic efforts, including protected academic time irrespective of external funding.
The funding to protect the scholarly commitment (the mentor, the protected time of CIMS faculty, and the research assistant) has come primarily from divisional funds, although the CIMS budget is subsidized by the Department of Medicine and the medical center.
Recruit Faculty with Fellowship Training
It is our goal to reach a critical mass of hospitalists with experience and advanced training in scholarship. Fellowship‐trained faculty members are best positioned to realize academic success and can impart their knowledge and skills to others. Fellowship‐trained faculty members hired to date have come from either general internal medicine (n = 1) or geriatric (n = 2) fellowship programs, and none have been trained in a hospitalist fellowship program. It is hoped that these fellowship‐trained faculty and some of the other more experienced members of the group will be able to share in the mentoring responsibilities so that mentoring outsourcing can ultimately be replaced by CIMS faculty members.
EVALUATION DATA
In the 2 years since implementation of the scholarly support program, individual faculty in the CIMS have been meeting the above‐mentioned goals. Specifically, with respect to acquiring knowledge and skills, 2 faculty members have completed their master's degrees, and 6 others have made use of select courses to augment their knowledge and skills. All faculty members (100%) have a scholarly project they are leading, and most have reached out to a colleague in the CIMS to assist them, such that nearly all are team members on at least 1 other scholarly project. Through informal mentoring sessions and a once‐yearly formal meeting related to academic promotion, all members (100%) of the faculty are aware of the expectations and requirements for promotion.
Table 1 shows the accomplishment of the 5 faculty members in the academic track who have been division members for 3 years or more. Among the 5 faculty in the academic track, publications and extramural funding are improving. In the 5 years before the initiative, CIMS faculty averaged approximately 0.5 publications per person per year; in the first 2 years of this initiative, that number has increased to 1.3 publications per person per year. The 1 physician who has not yet been published has completed projects and has several article in process. External funding (largely in the form of 3 extramural grants from private foundations) has increased dramatically from an average of 4% per FTE before the intervention to approximately 15% per FTE afterward. In addition, all faculty members have secured a source of additional funding to reduce their clinical efforts since the implementation of this program. One foundation funded project that involved all division members, whose goal was to develop mechanisms to improve the discharge process of elderly patients to their homes, won the award at the SGIM 2007 National Meeting for the best clinical innovation. As illustrated in Table 1, 1 of the founding CIMS members transferred out of the academic track in 2003 in alignment with this physician's personal and professional goals and preferences. Two faculty members have moved up an academic rank, and several others are poised to do so.
| Dr. A* | Dr. B | Dr. C | Dr. D | Dr. E | Dr. F | |
|---|---|---|---|---|---|---|
| ||||||
| Years on faculty | 7 | 7 | 7 | 5 | 3 | 3 |
| Clinical % FTE before ASP | 70% | 60% | 60% | 70% | 70% | 70% |
| Clinical % FTE after ASP | Not applicable | 30% | 60% | 60% | 50% | 45% |
| Number of publications per year before ASP | Not applicable | 0.75 | 0.75 | 0 | 0 | 0 |
| Number of publications per year after ASP | Not applicable | 2.5 | 2 | 1 | 1 | 0 |
| Leadership role and title before ASP: | Not applicable | |||||
| a. within institution | Yes | No | No | No | No | |
| b. national level | No | No | No | No | No | |
| Leadership role and title after ASP: | Not applicable | |||||
| a. within institution | Yes | Yes | Yes | Yes | No | |
| b. national level | Yes | No | No | No | Yes | |
Thus, the divisional objectives (increasing number of publications, securing funding to increase the time devoted to scholarship, new leadership roles, and progression toward promotion) are being met as well.
CONCLUSIONS
Our rapidly growing hospitalist division recognized that several factors threatened the ability of the division and individuals to succeed academically. Divisional, departmental, and medical center leadership was committed to creating a supportive structure that would be available to all hospitalists as opposed to expecting each individual to unearth the necessary resources on their own. The innovative approach to foster individual, and therefore divisional, academic and scholarly success was designed around the following strategies: retention of an expert mentor (who is a not a hospitalist) and securing 20% of his time, investing in scholarship by protecting 30% nonclinical time for academic pursuits, and attempting to seek out fellowship‐trained hospitalists when hiring.
Although quality mentorship, protected time, and recruiting the best‐available talent to fill needs may not seem all that innovative, we believe the systematic approach to the problem and our steadfast application of the strategic plan is unique, innovative, and may present a model to be emulated by other divisions. Some may contend that it is impossible to protect 30% FTE of academic hospitalists indefinitely. Our group has made substantial investment in supporting the academic pursuits of our physicians, and we believe this is essential to maintaining their satisfaction and commitment to scholarship. This amount of protected time is offered to the entire physician faculty and continues even as our division has almost tripled in size. This initiative represents a carefully calculated investment that has influenced our ability to recruit and retain excellent people. Ongoing prospective study of this intervention over time will provide additional perspective on its value and shortcomings. Nonetheless, early data suggest that the plan is indeed working and that our group is satisfied with the return on investment to date.
- ,,,.2001.Status of clinical research in academic health centers: views from the research leadership.JAMA.286:800–806.
- ,,,.Contemporary (post‐Wills) survey of the views of Australian medical researchers: importance of funding, infrastructure and motivators for a research career.Med J Aust.2005;183:604–605.
- ,.Mentors, Advisors, and Role Models in Graduate and Professional Education.Washington DC:Association of Academic Health Centers;1996.
- ,.Characteristics of the successful researcher and implications for faculty development.J Med Educ.1986;61:22–31.
- .On mentoring.J R Soc Med.1997;90:347–349.
- ,,, et al.Junior faculty members' mentoring relationships and their professional development in U.S. medical schools.Acad Med.1998;73:318–323.
- AAMC (Association of American Medical Colleges).For the Health of the Public: Ensuring the Future of Clinical Research.Washington, DC:AAMC;1999.
- .2002.Clinical research career development: the individual perspective.Acad Med.77:1084–1088.
Promotion through the ranks is the hallmark of success in academia. The support and infrastructure necessary to develop junior faculty members at academic medical centers may be inadequate.1, 2 Academic hospitalists are particularly vulnerable and at high risk for failure because of their heavy clinical commitment and limited time to pursue scholarly interests. Further, relatively few have pursued fellowship training, which means that many hospitalists must learn research‐related skills and the nuances of academia after joining the faculty.
Top‐notch mentors are believed to be integral to the success of the academic physician.36 Among other responsibilities, mentors (1) direct mentees toward promising opportunities, (2) serve as advocates for mentees, and (3) lend expertise to mentees' studies and scholarship. In general, there is concern that the cadre of talented, committed, and capable mentors is dwindling such that they are insufficient in number to satisfy and support the needs of the faculty.7, 8 In hospital medicine, experienced mentorship is particularly in short supply because the field is relatively new and there has been tremendous growth in the number of academic hospitalists, producing a large demand.
Like many hospitalist groups, our hospitalist division, the Collaborative Inpatient Medicine Service (CIMS), has experienced significant growth. It became apparent that the faculty needed and deserved a well‐designed academic support program to foster the development of skills necessary for academic success. The remainder of this article discusses our approach toward fulfilling these needs and the results to date.
DEVELOPING THE HOSPITALIST ACADEMIC SUPPORT PROGRAM
Problem Identification
Johns Hopkins Bayview Medical Center (JHBMC) is a 700‐bed urban university‐affiliated hospital. The CIMS hospital group is a distinct division separate from the hospitalist group at Johns Hopkins Hospital. All faculty are employed by the Johns Hopkins University School of Medicine (JHUSOM), and there is a single promotion track for the faculty. Specific requirements for promotion may be found in the Johns Hopkins University School of Medicine silver book at
CIMS had been growing in numbers from 4 full‐time equivalent (FTE) physicians in fiscal year (FY) 01 to 11.8 FTE physicians in FY06.
Most had limited training in research.
The physicians had little protected time for skill development and for working on scholarly projects.
Attempts to recruit a professor‐/associate professorlevel hospitalist from another institution to mentor our faculty members had been unsuccessful.
The hospitalists in our group had diverse interests such that we needed to find a flexible mentor who was willing and able to work across a breadth of content areas and methodologies.
Preliminary attempts to link up our hospitalists with clinician‐investigators at our institution were not fruitful.
Needs Assessment
In soliciting input from the hospitalists themselves and other stakeholders (including institutional leadership and leaders in hospital medicine), the following needs were identified:
Each CIMS faculty member must have a body of scholarship to support promotion and long‐term academic success.
Each CIMS faculty member needs appropriate mentorship.
Each CIMS faculty member needs protected time for scholarly work.
The CIMS faculty members need to support one another and be collaborative in their scholarly work.
The scholarly activities of the CIMS faculty need to support the mission of the division.
The mission of our division had been established to value and encourage the diverse interests and talents within the group:
The Collaborative Inpatient Medical Service (CIMS) is dedicated to serving the public trust by advancing the field of Hospital Medicine through the realization of excellence in patient care, education, research, leadership, and systems‐improvement.
Objectives
The objectives of the academic support program were organized into those for the CIMS Division as well as specific individual faculty goals and are outlined below:
Objectives for the division:
To increase the number and quality of peer‐reviewed publications produced by CIMS faculty.
To increase the amount of scholarly time available to CIMS faculty. In addition to external funding sources, we were committed to exploring nontraditional funding sources such as hospital administration and partnerships with other divisions or departments (including information technology) in need of clinically savvy physicians to help with projects.
To augment the leadership roles of the CIMS faculty with our institution and on a national level.
To support the CIMS faculty members such that they can be promoted at Johns Hopkins University School of Medicine (JHUSOM) and thereby retained.
Goals for individuals:
Each CIMS faculty member will advance his or her skill set to be moving toward producing scholarly work independently.
Each faculty member will lead at least 1 scholarly project at all times and will be involved as a team‐member in others.
Each faculty member will understand the criteria for promotion at our institution and will reflect on plans and strategies to realize success.
Strategies for Achieving the Objectives and Goals
Establish a Strong Mentoring System for the CIMS
The CIMS identified a primary mentor for the group, a faculty member within the Division of General Internal Medicine who was an experienced mentor with formidable management skills and an excellent track record in publishing scholarly work. Twenty‐percent of the mentor's time was set aside so he would have sufficient time to spend with CIMS faculty members in developing scholarly activities.
The mentor meets individually with each CIMS faculty member at the beginning of each academic year to identify career objectives; review current activities, interests, and skills; identify career development needs that require additional training or resources; set priorities for scholarly work; identify opportunities for collaboration internally and externally; and identify additional potential mentors to support specific projects. Regular follow‐up meetings are arranged, as needed to review progress and encourage advancing the work. The mentor uses resources to stay abreast of relevant funding opportunities and shares them with the group. The mentor reports regularly to the director of the CIMS regarding progress. The process as outlined remains ongoing.
Investing the Requisite Resources
A major decision was made that CIMS hospitalists would have 30% of their time protected for academic work, without the need for external funding. The expectation that the faculty had to use this time to effectively advance their career goals, which in turn would support the mission of CIMS, was clearly and explicitly expressed. The faculty would also be permitted to decrease their clinical time further on obtaining external funding. Additionally, in conjunction with a specific grant, the group hired a research assistant to permanently support the scholarly work of the faculty.
Leaders in both hospital administration and the Department of Medicine agreed that the only way to maintain a stable group of mature hospitalists who could serve as champions for change and help develop functional quality improvement projects was to support them in their academic efforts, including protected academic time irrespective of external funding.
The funding to protect the scholarly commitment (the mentor, the protected time of CIMS faculty, and the research assistant) has come primarily from divisional funds, although the CIMS budget is subsidized by the Department of Medicine and the medical center.
Recruit Faculty with Fellowship Training
It is our goal to reach a critical mass of hospitalists with experience and advanced training in scholarship. Fellowship‐trained faculty members are best positioned to realize academic success and can impart their knowledge and skills to others. Fellowship‐trained faculty members hired to date have come from either general internal medicine (n = 1) or geriatric (n = 2) fellowship programs, and none have been trained in a hospitalist fellowship program. It is hoped that these fellowship‐trained faculty and some of the other more experienced members of the group will be able to share in the mentoring responsibilities so that mentoring outsourcing can ultimately be replaced by CIMS faculty members.
EVALUATION DATA
In the 2 years since implementation of the scholarly support program, individual faculty in the CIMS have been meeting the above‐mentioned goals. Specifically, with respect to acquiring knowledge and skills, 2 faculty members have completed their master's degrees, and 6 others have made use of select courses to augment their knowledge and skills. All faculty members (100%) have a scholarly project they are leading, and most have reached out to a colleague in the CIMS to assist them, such that nearly all are team members on at least 1 other scholarly project. Through informal mentoring sessions and a once‐yearly formal meeting related to academic promotion, all members (100%) of the faculty are aware of the expectations and requirements for promotion.
Table 1 shows the accomplishment of the 5 faculty members in the academic track who have been division members for 3 years or more. Among the 5 faculty in the academic track, publications and extramural funding are improving. In the 5 years before the initiative, CIMS faculty averaged approximately 0.5 publications per person per year; in the first 2 years of this initiative, that number has increased to 1.3 publications per person per year. The 1 physician who has not yet been published has completed projects and has several article in process. External funding (largely in the form of 3 extramural grants from private foundations) has increased dramatically from an average of 4% per FTE before the intervention to approximately 15% per FTE afterward. In addition, all faculty members have secured a source of additional funding to reduce their clinical efforts since the implementation of this program. One foundation funded project that involved all division members, whose goal was to develop mechanisms to improve the discharge process of elderly patients to their homes, won the award at the SGIM 2007 National Meeting for the best clinical innovation. As illustrated in Table 1, 1 of the founding CIMS members transferred out of the academic track in 2003 in alignment with this physician's personal and professional goals and preferences. Two faculty members have moved up an academic rank, and several others are poised to do so.
| Dr. A* | Dr. B | Dr. C | Dr. D | Dr. E | Dr. F | |
|---|---|---|---|---|---|---|
| ||||||
| Years on faculty | 7 | 7 | 7 | 5 | 3 | 3 |
| Clinical % FTE before ASP | 70% | 60% | 60% | 70% | 70% | 70% |
| Clinical % FTE after ASP | Not applicable | 30% | 60% | 60% | 50% | 45% |
| Number of publications per year before ASP | Not applicable | 0.75 | 0.75 | 0 | 0 | 0 |
| Number of publications per year after ASP | Not applicable | 2.5 | 2 | 1 | 1 | 0 |
| Leadership role and title before ASP: | Not applicable | |||||
| a. within institution | Yes | No | No | No | No | |
| b. national level | No | No | No | No | No | |
| Leadership role and title after ASP: | Not applicable | |||||
| a. within institution | Yes | Yes | Yes | Yes | No | |
| b. national level | Yes | No | No | No | Yes | |
Thus, the divisional objectives (increasing number of publications, securing funding to increase the time devoted to scholarship, new leadership roles, and progression toward promotion) are being met as well.
CONCLUSIONS
Our rapidly growing hospitalist division recognized that several factors threatened the ability of the division and individuals to succeed academically. Divisional, departmental, and medical center leadership was committed to creating a supportive structure that would be available to all hospitalists as opposed to expecting each individual to unearth the necessary resources on their own. The innovative approach to foster individual, and therefore divisional, academic and scholarly success was designed around the following strategies: retention of an expert mentor (who is a not a hospitalist) and securing 20% of his time, investing in scholarship by protecting 30% nonclinical time for academic pursuits, and attempting to seek out fellowship‐trained hospitalists when hiring.
Although quality mentorship, protected time, and recruiting the best‐available talent to fill needs may not seem all that innovative, we believe the systematic approach to the problem and our steadfast application of the strategic plan is unique, innovative, and may present a model to be emulated by other divisions. Some may contend that it is impossible to protect 30% FTE of academic hospitalists indefinitely. Our group has made substantial investment in supporting the academic pursuits of our physicians, and we believe this is essential to maintaining their satisfaction and commitment to scholarship. This amount of protected time is offered to the entire physician faculty and continues even as our division has almost tripled in size. This initiative represents a carefully calculated investment that has influenced our ability to recruit and retain excellent people. Ongoing prospective study of this intervention over time will provide additional perspective on its value and shortcomings. Nonetheless, early data suggest that the plan is indeed working and that our group is satisfied with the return on investment to date.
- ,,,.2001.Status of clinical research in academic health centers: views from the research leadership.JAMA.286:800–806.
- ,,,.Contemporary (post‐Wills) survey of the views of Australian medical researchers: importance of funding, infrastructure and motivators for a research career.Med J Aust.2005;183:604–605.
- ,.Mentors, Advisors, and Role Models in Graduate and Professional Education.Washington DC:Association of Academic Health Centers;1996.
- ,.Characteristics of the successful researcher and implications for faculty development.J Med Educ.1986;61:22–31.
- .On mentoring.J R Soc Med.1997;90:347–349.
- ,,, et al.Junior faculty members' mentoring relationships and their professional development in U.S. medical schools.Acad Med.1998;73:318–323.
- AAMC (Association of American Medical Colleges).For the Health of the Public: Ensuring the Future of Clinical Research.Washington, DC:AAMC;1999.
- .2002.Clinical research career development: the individual perspective.Acad Med.77:1084–1088.
Copyright © 2008 Society of Hospital Medicine
Editorial
In 10 short years, the explosive growth in the number of hospitalists has made hospital medicine programs the cornerstone of many innovations that support the institutions they serve: expanded inpatient care, developing consultative and comanagement services, hospital capacity management, improved patient quality and safety practices, and more. Hospitalist teams have demonstrated a genuine commitment to improving the hospital system, with literature supporting that hospitalists can positively affect cost, length of stay, quality of care, and, at academic institutions, education.1 To the casual observer, these hospitalist groups and the solutions they bring may seem fairly uniform; however, to the discerning eye, nothing could be farther from the truth. Hospital medicine programs, and their innovations, are as varied as the hospitals they serve.
Although the challenges encountered in hospital systems have clear, institution‐specific elements, common themes are often encountered by clinicians that parallel those seen at other facilities. Unfortunately, widely disseminated articles from peer‐reviewed journals on hospital‐based innovations have not been available for other hospitalists to use and glean ideas from for use at their home institutionsuntil now. The Journal of Hospital Medicine is pleased to announce the creation of that opportunity.
This year, the Journal of Hospital Medicine will publish articles on and later a supplement dedicated to innovations in hospital medicine. We invite authors to submit manuscripts related to any successful innovation they initiated in their hospital. We will consider any original work that pertains to hospital medicine, including but not limited to clinical innovations, educational programs, quality and safety initiatives, and administrative or academic issues. When available and appropriate, we encourage outcomes to be reported.
To be able to publish articles on a significant number of innovations, we request manuscripts be a maximum of 1500 words with no more than 2 tables or figures and fewer than 15 references. The deadline for submissions is August 1, 2007. All submitted manuscripts will undergo both editorial review by JHM staff and peer review. Authors should consult JHM's instructions for authors2 for guidelines on manuscript submission and preparation.
- How hospitalists add value: a special supplement to the Hospitalist.The Hospitalist.2005;9 (suppl 1).
- Journal of Hospital Medicine information for authors available at: www3.interscience.wiley.com/cgi‐bin/jabout/111081937/ForAuthors.html.
In 10 short years, the explosive growth in the number of hospitalists has made hospital medicine programs the cornerstone of many innovations that support the institutions they serve: expanded inpatient care, developing consultative and comanagement services, hospital capacity management, improved patient quality and safety practices, and more. Hospitalist teams have demonstrated a genuine commitment to improving the hospital system, with literature supporting that hospitalists can positively affect cost, length of stay, quality of care, and, at academic institutions, education.1 To the casual observer, these hospitalist groups and the solutions they bring may seem fairly uniform; however, to the discerning eye, nothing could be farther from the truth. Hospital medicine programs, and their innovations, are as varied as the hospitals they serve.
Although the challenges encountered in hospital systems have clear, institution‐specific elements, common themes are often encountered by clinicians that parallel those seen at other facilities. Unfortunately, widely disseminated articles from peer‐reviewed journals on hospital‐based innovations have not been available for other hospitalists to use and glean ideas from for use at their home institutionsuntil now. The Journal of Hospital Medicine is pleased to announce the creation of that opportunity.
This year, the Journal of Hospital Medicine will publish articles on and later a supplement dedicated to innovations in hospital medicine. We invite authors to submit manuscripts related to any successful innovation they initiated in their hospital. We will consider any original work that pertains to hospital medicine, including but not limited to clinical innovations, educational programs, quality and safety initiatives, and administrative or academic issues. When available and appropriate, we encourage outcomes to be reported.
To be able to publish articles on a significant number of innovations, we request manuscripts be a maximum of 1500 words with no more than 2 tables or figures and fewer than 15 references. The deadline for submissions is August 1, 2007. All submitted manuscripts will undergo both editorial review by JHM staff and peer review. Authors should consult JHM's instructions for authors2 for guidelines on manuscript submission and preparation.
- How hospitalists add value: a special supplement to the Hospitalist.The Hospitalist.2005;9 (suppl 1).
- Journal of Hospital Medicine information for authors available at: www3.interscience.wiley.com/cgi‐bin/jabout/111081937/ForAuthors.html.
- How hospitalists add value: a special supplement to the Hospitalist.The Hospitalist.2005;9 (suppl 1).
- Journal of Hospital Medicine information for authors available at: www3.interscience.wiley.com/cgi‐bin/jabout/111081937/ForAuthors.html.