User login
Documentation of Clinical Reasoning in Admission Notes of Hospitalists: Validation of the CRANAPL Assessment Rubric
Approximately 60,000 hospitalists were working in the United States in 2018.1 Hospitalist groups work collaboratively because of the shiftwork required for 24/7 patient coverage, and first-rate clinical documentation is essential for quality care.2 Thoughtful clinical documentation not only transmits one provider’s clinical reasoning to other providers but is a professional responsibility.3 Hospitalists spend two-thirds of their time in indirect patient-care activities and approximately one quarter of their time on documentation in electronic health records (EHRs).4 Despite documentation occupying a substantial portion of the clinician’s time, published literature on the best practices for the documentation of clinical reasoning in hospital medicine or its assessment remains scant.5-7
Clinical reasoning involves establishing a diagnosis and developing a therapeutic plan that fits the unique circumstances and needs of the patient.8 Inpatient providers who admit patients to the hospital end the admission note with their assessment and plan (A&P) after reflecting about a patient’s presenting illness. The A&P generally represents the interpretations, deductions, and clinical reasoning of the inpatient providers; this is the section of the note that fellow physicians concentrate on over others.9 The documentation of clinical reasoning in the A&P allows for many to consider how the recorded interpretations relate to their own elucidations resulting in distributed cognition.10
Disorganized documentation can contribute to cognitive overload and impede thoughtful consideration about the clinical presentation.3 The assessment of clinical documentation may translate into reduced medical errors and improved note quality.11,12 Studies that have formally evaluated the documentation of clinical reasoning have focused exclusively on medical students.13-15 The nonexistence of a detailed rubric for evaluating clinical reasoning in the A&Ps of hospitalists represents a missed opportunity for evaluating
METHODS
Study Design, Setting, and Subjects
This was a retrospective study that reviewed the admission notes of hospitalists for patients admitted over the period of January 2014 and October 2017 at three hospitals in Maryland. One is a community hospital (Hospital A) and two are academic medical centers (Hospital B and Hospital C). Even though these three hospitals are part of one health system, they have distinct cultures and leadership, serve different populations, and are staffed by different provider teams.
The notes of physicians working for the hospitalist groups at each of the three hospitals were the focus of the analysis in this study.
Development of the Documentation Assessment Rubric
A team was assembled to develop the Clinical Reasoning in Admission Note Assessment & PLan (CRANAPL) tool. The CRANAPL was designed to assess the comprehensiveness and thoughtfulness of the clinical reasoning documented in the A&P sections of the notes of patients who were admitted to the hospital with an acute illness. Validity evidence for CRANAPL was summarized on the basis of Messick’s unified validity framework by using four of the five sources of validity: content, response process, internal structure, and relations to other variables.17
Content Validity
The development team consisted of members who have an average of 10 years of clinical experience in hospital medicine; have studied clinical excellence and clinical reasoning; and have expertise in feedback, assessment, and professional development.18-22 The development of the CRANAPL tool by the team was informed by a review of the clinical reasoning literature, with particular attention paid to the standards and competencies outlined by the Liaison Committee on Medical Education, the Association of American Medical Colleges, the Accreditation Council on Graduate Medical Education, the Internal Medicine Milestone Project, and the Society of Hospital Medicine.23-26 For each of these parties, diagnostic reasoning and its impact on clinical decision-making are considered to be a core competency. Several works that heavily influenced the CRANAPL tool’s development were Baker’s Interpretive Summary, Differential Diagnosis, Explanation of Reasoning, And Alternatives (IDEA) assessment tool;14 King’s Pediatric History and Physical Exam Evaluation (P-HAPEE) rubric;15 and three other studies related to diagnostic reasoning.16,27,28 These manuscripts and other works substantively informed the preliminary behavioral-based anchors that formed the initial foundation for the tool under development. The CRANAPL tool was shown to colleagues at other institutions who are leaders on clinical reasoning and was presented at academic conferences in the Division of General Internal Medicine and the Division of Hospital Medicine of our institution. Feedback resulted in iterative revisions. The aforementioned methods established content validity evidence for the CRANAPL tool.
Response Process Validity
Several of the authors pilot-tested earlier iterations on admission notes that were excluded from the sample when refining the CRANAPL tool. The weaknesses and sources of confusion with specific items were addressed by scoring 10 A&Ps individually and then comparing data captured on the tool. This cycle was repeated three times for the iterative enhancement and finalization of the CRANAPL tool. On several occasions when two authors were piloting the near-final CRANAPL tool, a third author interviewed each of the two authors about reactivity while assessing individual items and exploring with probes how their own clinical documentation practices were being considered when scoring the notes. The reasonable and thoughtful answers provided by the two authors as they explained and justified the scores they were selecting during the pilot testing served to confer response process validity evidence.
Finalizing the CRANAPL Tool
The nine-item CRANAPL tool includes elements for problem representation, leading diagnosis, uncertainty, differential diagnosis, plans for diagnosis and treatment, estimated length of stay (LOS), potential for upgrade in status to a higher level of care, and consideration of disposition. Although the final three items are not core clinical reasoning domains in the medical education literature, they represent clinical judgments that are especially relevant for the delivery of the high-quality and cost-effective care of hospitalized patients. Given that the probabilities and estimations of these three elements evolve over the course of any hospitalization on the basis of test results and response to therapy, the documentation of initial expectations on these fronts can facilitate distributed cognition with all individuals becoming wiser from shared insights.10 The tool uses two- and three-point rating scales, with each number score being clearly defined by specific written criteria (total score range: 0-14; Appendix).
Data Collection
Hospitalists’ admission notes from the three hospitals were used to validate the CRANAPL tool. Admission notes from patients hospitalized to the general medical floors with an admission diagnosis of either fever, syncope/dizziness, or abdominal pain were used. These diagnoses were purposefully examined because they (1) have a wide differential diagnosis, (2) are common presenting symptoms, and (3) are prone to diagnostic errors.29-32
The centralized EHR system across the three hospitals identified admission notes with one of these primary diagnoses of patients admitted over the period of January 2014 to October 2017. We submitted a request for 650 admission notes to be randomly selected from the centralized institutional records system. The notes were stratified by hospital and diagnosis. The sample size of our study was comparable with that of prior psychometric validation studies.33,34 Upon reviewing the A&Ps associated with these admissions, 365 notes were excluded for one of three reasons: (1) the note was written by a nurse practitioner, physician assistant, resident, or medical student; (2) the admission diagnosis had been definitively confirmed in the emergency department (eg, abdominal pain due to diverticulitis seen on CT); and (3) the note represented the fourth or more note by any single provider (to sample notes of many providers, no more than three notes written by any single provider were analyzed). A total of 285 admission notes were ultimately included in the sample.
Data were deidentified, and the A&P sections of the admission notes were each copied from the EHR into a unique Word document. Patient and hospital demographic data (including age, gender, race, number of comorbid conditions, LOS, hospital charges, and readmission to the same health system within 30 days) were collected separately from the EHR. Select physician characteristics were also collected from the hospitalist groups at each of the three hospitals, as was the length (word count) of each A&P.
The study was approved by our institutional review board.
Data Analysis
Two authors scored all deidentified A&Ps by using the finalized version of the CRANAPL tool. Prior to using the CRANAPL tool on each of the notes, these raters read each A&P and scored them by using two single-item rating scales: a global clinical reasoning and a global readability/clarity measure. Both of these global scales used three-item Likert scales (below average, average, and above average). These global rating scales collected the reviewers’ gestalt about the quality and clarity of the A&P. The use of gestalt ratings as comparators is supported by other research.35
Descriptive statistics were computed for all variables. Each rater rescored a sample of 48 records (one month after the initial scoring) and intraclass correlations (ICCs) were computed for intrarater reliability. ICCs were calculated for each item and for the CRANAPL total to determine interrater reliability.
The averaged ratings from the two raters were used for all other analyses. For CRANAPL’s internal structure validity evidence, Cronbach’s alpha was calculated as a measure of internal consistency. For relations to other variables validity evidence, CRANAPL total scores were compared with the two global assessment variables with linear regressions.
Bivariate analyses were performed by applying parametric and nonparametric tests as appropriate. A series of multivariate linear regressions, controlling for diagnosis and clustered variance by hospital site, were performed using CRANAPL total as the dependent variable and patient variables as predictors.
All data were analyzed using Stata (StataCorp. 2013. Stata Statistical Software: Release 13. College Station, Texas: StataCorp LP.)
RESULTS
The admission notes of 120 hospitalists were evaluated (Table 1). A total of 39 (33%) physicians were moonlighters with primary appointments outside of the hospitalist division, and 81 (68%) were full-time hospitalists. Among the 120 hospitalists, 48 (40%) were female, 60 (50%) were international medical graduates, and 90 (75%) were of nonwhite race. Most hospitalist physicians (n = 47, 58%) had worked in our health system for less than five years, and 64 hospitalists (53%) devoted greater than 50% of their time to patient care.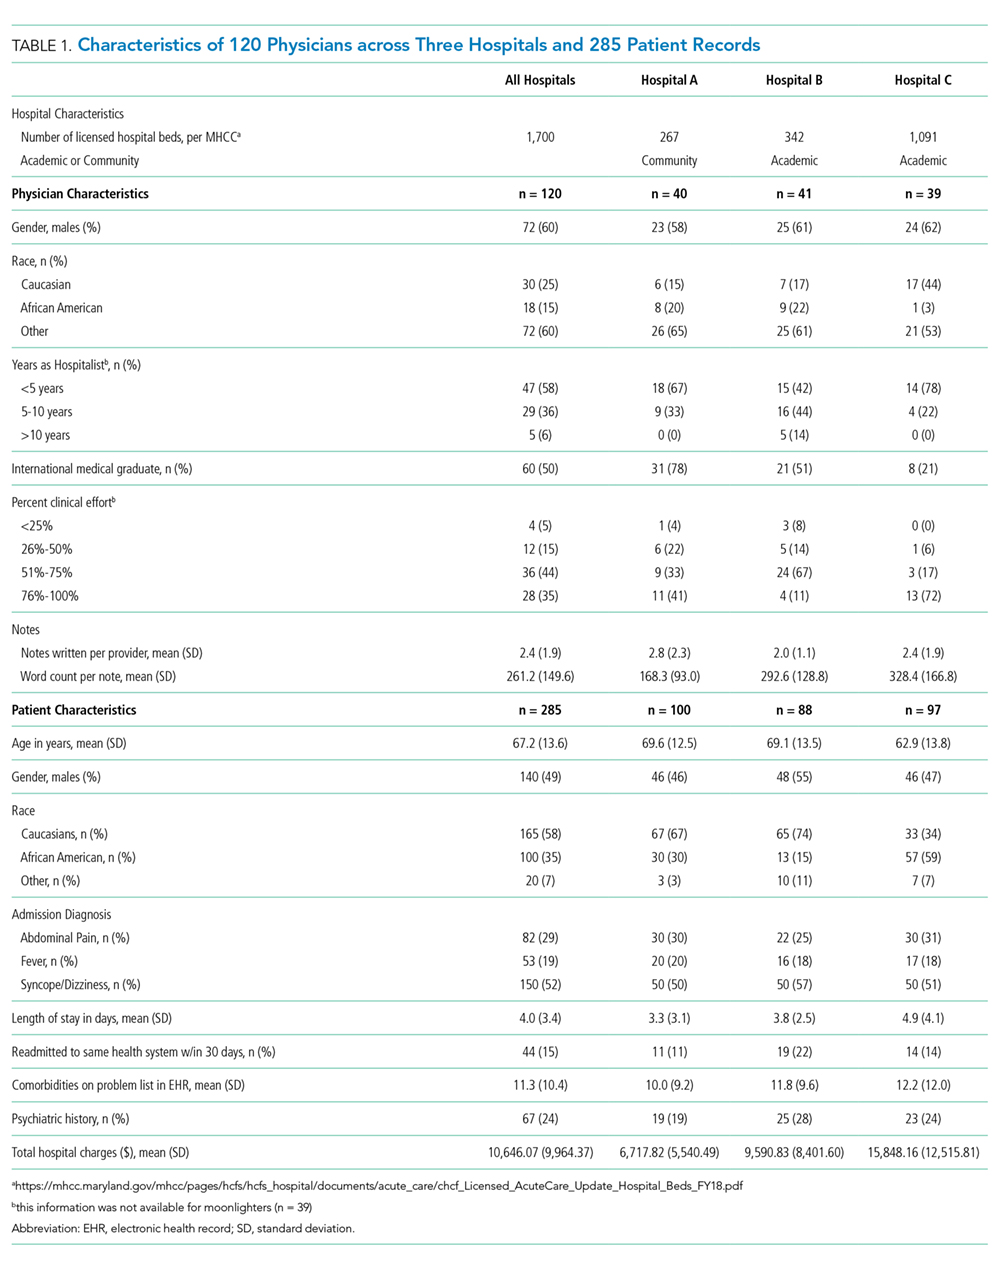
Approximately equal numbers of patient admission notes were pulled from each of the three hospitals. The average age of patients was 67.2 (SD 13.6) years, 145 (51%) were female, and 120 (42%) were of nonwhite race. The mean LOS for all patients was 4.0 (SD 3.4) days. A total of 44 (15%) patients were readmitted to the same health system within 30 days of discharge. None of the patients died during the incident hospitalization. The average charge for each of the hospitalizations was $10,646 (SD $9,964).
CRANAPL Data
Figure 1 shows the distribution of the scores given by each rater for each of the nine items. The mean of the total CRANAPL score given by both raters was 6.4 (SD 2.2). Scoring for some items were high (eg, summary statement: 1.5/2), whereas performance on others were low (eg, estimating LOS: 0.1/1 and describing the potential need for upgrade in care: 0.0/1).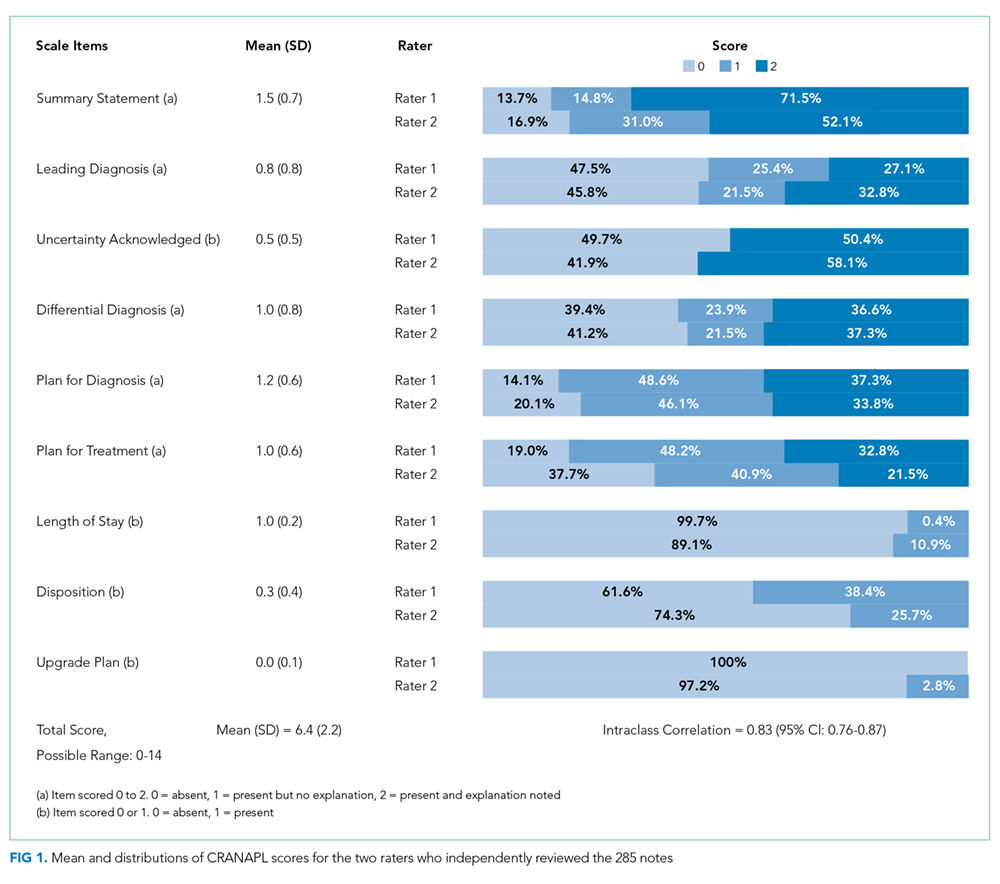
Validity of the CRANAPL Tool’s Internal Structure
Cronbach’s alpha, which was used to measure internal consistency within the CRANAPL tool, was 0.43. The ICC, which was applied to measure the interrater reliability for both raters for the total CRANAPL score, was 0.83 (95% CI: 0.76-0.87). The ICC values for intrarater reliability for raters 1 and 2 were 0.73 (95% CI: 0.60-0.83) and 0.73 (95% CI: 0.45-0.86), respectively.
Relations to Other Variables Validity
Associations between CRANAPL total scores, global clinical reasoning, and global scores for note readability/clarity were statistically significant (P < .001), Figure 2.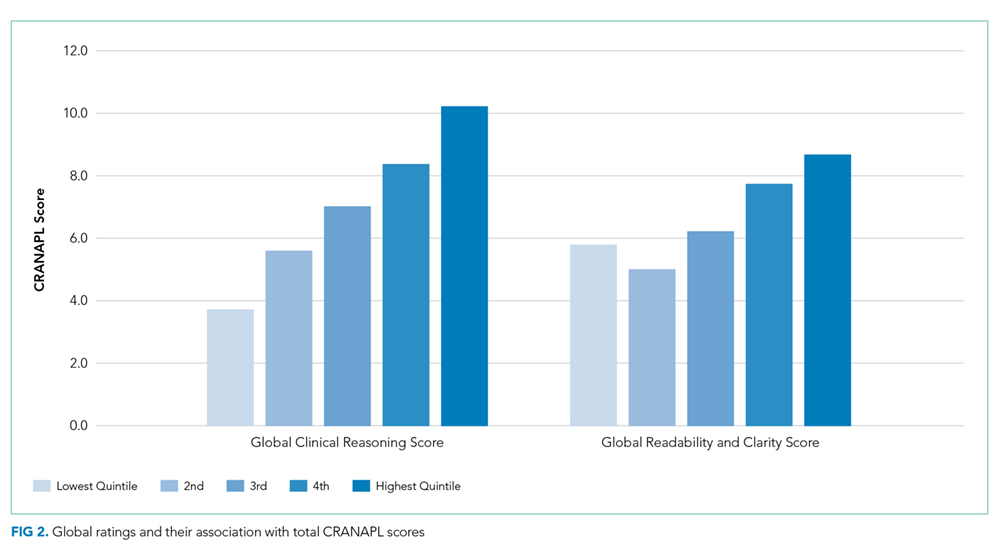
Eight out of nine CRANAPL variables were statistically significantly different across the three hospitals (P <. 01) when data were analyzed by hospital site. Hospital C had the highest mean score of 7.4 (SD 2.0), followed by Hospital B with a score of 6.6 (SD 2.1), and Hospital A had the lowest total CRANAPL score of 5.2 (SD 1.9). This difference was statistically significant (P < .001). Five variables with respect to admission diagnoses (uncertainty acknowledged, differential diagnosis, plan for diagnosis, plan for treatment, and upgrade plan) were statistically significantly different across notes. Notes for syncope/dizziness generally yielded higher scores than those for abdominal pain and fever.
Factors Associated with High CRANAPL Scores
Table 2 shows the associations between CRANAPL scores and several covariates. Before adjustment, high CRANAPL scores were associated with high word counts of A&Ps (P < .001) and high hospital charges (P < .05). These associations were no longer significant after adjusting for hospital site and admitting diagnoses.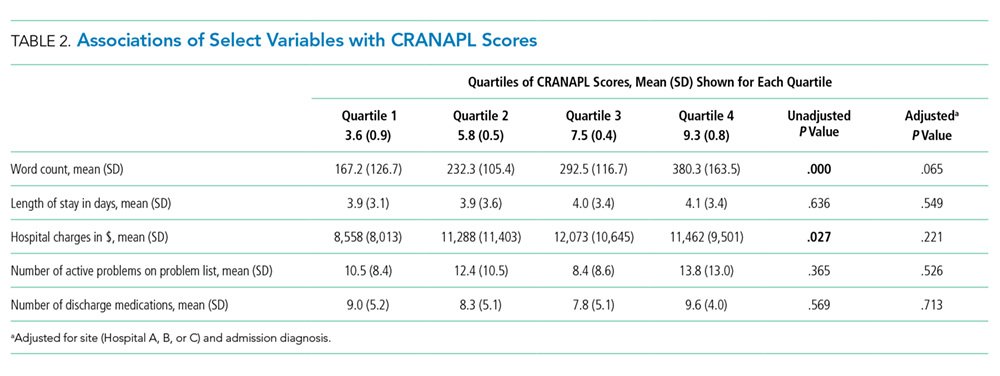
DISCUSSION
We reviewed the documentation of clinical reasoning in 285 admission notes at three different hospitals written by hospitalist physicians during routine clinical care. To our knowledge, this is the first study that assessed the documentation of hospitalists’ clinical reasoning with real patient notes. Wide variability exists in the documentation of clinical reasoning within the A&Ps of hospitalists’ admission notes. We have provided validity evidence to support the use of the user-friendly CRANAPL tool.
Prior studies have described rubrics for evaluating the clinical reasoning skills of medical students.14,15 The ICCs for the IDEA rubric used to assess medical students’ documentation of clinical reasoning were fair to moderate (0.29-0.67), whereas the ICC for the CRANAPL tool was high at 0.83. This measure of reliability is similar to that for the P-HAPEE rubric used to assess medical students’ documentation of pediatric history and physical notes.15 These data are markedly different from the data in previous studies that have found low interrater reliability for psychometric evaluations related to judgment and decision-making.36-39 CRANAPL was also found to have high intrarater reliability, which shows the reproducibility of an individual’s assessment over time. The strong association between the total CRANAPL score and global clinical reasoning assessment found in the present study is similar to that found in previous studies that have also embedded global rating scales as comparators when assessing clinical reasoning.13,,15,40,41 Global rating scales represent an overarching structure for comparison given the absence of an accepted method or gold standard for assessing clinical reasoning documentation. High-quality provider notes are defined by clarity, thoroughness, and accuracy;35 and effective documentation promotes communication and the coordination of care among the members of the care team.3
The total CRANAPL scores varied by hospital site with academic hospitals (B and C) scoring higher than the community hospital (A) in our study. Similarly, lengthy A&Ps were associated with high CRANAPL scores (P < .001) prior to adjustment for hospital site. Healthcare providers consider that the thoroughness of documentation denotes quality and attention to detail.35,42 Comprehensive documentation takes time; the longer notes by academic hospitalists than those by community hospitalists may be attributed to the fewer number of patients generally carried by hospitalists at academic centers than that by hospitalists at community hospitals.43
The documentation of the estimations of LOS, possibility of potential upgrade, and thoughts about disposition were consistently poorly described across all hospital sites and diagnoses. In contrast to CRANAPL, other clinical reasoning rubrics have excluded these items or discussed uncertainty.14,15,44 These elements represent the forward thinking that may be essential for high-quality progressive care by hospitalists. Physicians’s difficulty in acknowledging uncertainty has been associated with resource overuse, including the excessive ordering of tests, iatrogenic injury, and heavy financial burden on the healthcare system.45,46 The lack of thoughtful clinical and management reasoning at the time of admission is believed to be associated with medical errors.47 If used as a guide, the CRANAPL tool may promote reflection on the part of the admitting physician. The estimations of LOS, potential for upgrade to a higher level of care, and disposition are markers of optimal inpatient care, especially for hospitalists who work in shifts with embedded handoffs. When shared with colleagues (through documentation), there is the potential for distributed cognition10 to extend throughout the social network of the hospitalist group. The fact that so few providers are currently including these items in their A&P’s show that the providers are either not performing or documenting the ‘reasoning’. Either way, this is an opportunity that has been highlighted by the CRANAPL tool.
Several limitations of this study should be considered. First, the CRANAPL tool may not have captured elements of optimal clinical reasoning documentation. The reliance on multiple methods and an iterative process in the refinement of the CRANAPL tool should have minimized this. Second, this study was conducted across a single healthcare system that uses the same EHR; this EHR or institutional culture may influence documentation practices and behaviors. Given that using the CRANAPL tool to score an A&P is quick and easy, the benefit of giving providers feedback on their notes remains to be seen—here and at other hospitals. Third, our sample size could limit the generalizability of the results and the significance of the associations. However, the sample assessed in our study was significantly larger than that assessed in other studies that have validated clinical reasoning rubrics.14,15 Fourth, clinical reasoning is a broad and multidimensional construct. The CRANAPL tool focuses exclusively on hospitalists’ documentation of clinical reasoning and therefore does not assess aspects of clinical reasoning occurring in the physicians’ minds. Finally, given our goal to optimally validate the CRANAPL tool, we chose to test the tool on specific presentations that are known to be associated with diagnostic practice variation and errors. We may have observed different results had we chosen a different set of diagnoses from each hospital. Further validity evidence will be established when applying the CRANPL tool to different diagnoses and to notes from other clinical settings.
In conclusion, this study focuses on the development and validation of the CRANAPL tool that assesses how hospitalists document their clinical reasoning in the A&P section of admission notes. Our results show that wide variability exists in the documentation of clinical reasoning by hospitalists within and across hospitals. Given the CRANAPL tool’s ease-of-use and its versatility, hospitalist divisions in academic and nonacademic settings may use the CRANAPL tool to assess and provide feedback on the documentation of hospitalists’ clinical reasoning. Beyond studying whether physicians can be taught to improve their notes with feedback based on the CRANAPL tool, future studies may explore whether enhancing clinical reasoning documentation may be associated with improvements in patient care and clinical outcomes.
Acknowledgments
Dr. Wright is the Anne Gaines and G. Thomas Miller Professor of Medicine which is supported through Hopkins’ Center for Innovative Medicine.
The authors thank Christine Caufield-Noll, MLIS, AHIP (Johns Hopkins Bayview Medical Center, Baltimore, Maryland) for her assistance with this project.
Disclosures
The authors have nothing to disclose.
1. State of Hospital Medicine. Society of Hospital Medicine. https://www.hospitalmedicine.org/practice-management/shms-state-of-hospital-medicine/. Accessed August 19, 2018.
2. Mehta R, Radhakrishnan NS, Warring CD, et al. The use of evidence-based, problem-oriented templates as a clinical decision support in an inpatient electronic health record system. Appl Clin Inform. 2016;7(3):790-802. https://doi.org/10.4338/ACI-2015-11-RA-0164
3. Improving Diagnosis in Healthcare: Health and Medicine Division. http://www.nationalacademies.org/hmd/Reports/2015/Improving-Diagnosis-in-Healthcare.aspx. Accessed August 7, 2018.
4. Tipping MD, Forth VE, O’Leary KJ, et al. Where did the day go? A time-motion study of hospitalists. J Hosp Med. 2010;5(6):323-328. https://doi.org/10.1002/jhm.790
5. Varpio L, Rashotte J, Day K, King J, Kuziemsky C, Parush A. The EHR and building the patient’s story: a qualitative investigation of how EHR use obstructs a vital clinical activity. Int J Med Inform. 2015;84(12):1019-1028. https://doi.org/10.1016/j.ijmedinf.2015.09.004
6. Clynch N, Kellett J. Medical documentation: part of the solution, or part of the problem? A narrative review of the literature on the time spent on and value of medical documentation. Int J Med Inform. 2015;84(4):221-228. https://doi.org/10.1016/j.ijmedinf.2014.12.001
7. Varpio L, Day K, Elliot-Miller P, et al. The impact of adopting EHRs: how losing connectivity affects clinical reasoning. Med Educ. 2015;49(5):476-486. https://doi.org/10.1111/medu.12665
8. McBee E, Ratcliffe T, Schuwirth L, et al. Context and clinical reasoning: understanding the medical student perspective. Perspect Med Educ. 2018;7(4):256-263. https://doi.org/10.1007/s40037-018-0417-x
9. Brown PJ, Marquard JL, Amster B, et al. What do physicians read (and ignore) in electronic progress notes? Appl Clin Inform. 2014;5(2):430-444. https://doi.org/10.4338/ACI-2014-01-RA-0003
10. Katherine D, Shalin VL. Creating a common trajectory: Shared decision making and distributed cognition in medical consultations. https://pxjournal.org/cgi/viewcontent.cgi?article=1116&context=journal Accessed April 4, 2019.
11. Harchelroad FP, Martin ML, Kremen RM, Murray KW. Emergency department daily record review: a quality assurance system in a teaching hospital. QRB Qual Rev Bull. 1988;14(2):45-49. https://doi.org/10.1016/S0097-5990(16)30187-7.
12. Opila DA. The impact of feedback to medical housestaff on chart documentation and quality of care in the outpatient setting. J Gen Intern Med. 1997;12(6):352-356. https://doi.org/10.1007/s11606-006-5083-8.
13. Smith S, Kogan JR, Berman NB, Dell MS, Brock DM, Robins LS. The development and preliminary validation of a rubric to assess medical students’ written summary statements in virtual patient cases. Acad Med. 2016;91(1):94-100. https://doi.org/10.1097/ACM.0000000000000800
14. Baker EA, Ledford CH, Fogg L, Way DP, Park YS. The IDEA assessment tool: assessing the reporting, diagnostic reasoning, and decision-making skills demonstrated in medical students’ hospital admission notes. Teach Learn Med. 2015;27(2):163-173. https://doi.org/10.1080/10401334.2015.1011654
15. King MA, Phillipi CA, Buchanan PM, Lewin LO. Developing validity evidence for the written pediatric history and physical exam evaluation rubric. Acad Pediatr. 2017;17(1):68-73. https://doi.org/10.1016/j.acap.2016.08.001
16. Miller GE. The assessment of clinical skills/competence/performance. Acad Med. 1990;65(9):S63-S67.
17. Messick S. Standards of validity and the validity of standards in performance asessment. Educ Meas Issues Pract. 2005;14(4):5-8. https://doi.org/10.1111/j.1745-3992.1995.tb00881.x
18. Menachery EP, Knight AM, Kolodner K, Wright SM. Physician characteristics associated with proficiency in feedback skills. J Gen Intern Med. 2006;21(5):440-446. https://doi.org/10.1111/j.1525-1497.2006.00424.x
19. Tackett S, Eisele D, McGuire M, Rotello L, Wright S. Fostering clinical excellence across an academic health system. South Med J. 2016;109(8):471-476. https://doi.org/10.14423/SMJ.0000000000000498
20. Christmas C, Kravet SJ, Durso SC, Wright SM. Clinical excellence in academia: perspectives from masterful academic clinicians. Mayo Clin Proc. 2008;83(9):989-994. https://doi.org/10.4065/83.9.989
21. Wright SM, Kravet S, Christmas C, Burkhart K, Durso SC. Creating an academy of clinical excellence at Johns Hopkins Bayview Medical Center: a 3-year experience. Acad Med. 2010;85(12):1833-1839. https://doi.org/10.1097/ACM.0b013e3181fa416c
22. Kotwal S, Peña I, Howell E, Wright S. Defining clinical excellence in hospital medicine: a qualitative study. J Contin Educ Health Prof. 2017;37(1):3-8. https://doi.org/10.1097/CEH.0000000000000145
23. Common Program Requirements. https://www.acgme.org/What-We-Do/Accreditation/Common-Program-Requirements. Accessed August 21, 2018.
24. Warren J, Lupi C, Schwartz ML, et al. Chief Medical Education Officer.; 2017. https://www.aamc.org/download/482204/data/epa9toolkit.pdf. Accessed August 21, 2018.
25. Th He Inte. https://www.abim.org/~/media/ABIM Public/Files/pdf/milestones/internal-medicine-milestones-project.pdf. Accessed August 21, 2018.
26. Core Competencies. Society of Hospital Medicine. https://www.hospitalmedicine.org/professional-development/core-competencies/. Accessed August 21, 2018.
27. Bowen JL. Educational strategies to promote clinical diagnostic reasoning. Cox M,
28. Pangaro L. A new vocabulary and other innovations for improving descriptive in-training evaluations. Acad Med. 1999;74(11):1203-1207. https://doi.org/10.1097/00001888-199911000-00012.
29. Rao G, Epner P, Bauer V, Solomonides A, Newman-Toker DE. Identifying and analyzing diagnostic paths: a new approach for studying diagnostic practices. Diagnosis Berlin, Ger. 2017;4(2):67-72. https://doi.org/10.1515/dx-2016-0049
30. Ely JW, Kaldjian LC, D’Alessandro DM. Diagnostic errors in primary care: lessons learned. J Am Board Fam Med. 2012;25(1):87-97. https://doi.org/10.3122/jabfm.2012.01.110174
31. Kerber KA, Newman-Toker DE. Misdiagnosing dizzy patients: common pitfalls in clinical practice. Neurol Clin. 2015;33(3):565-75, viii. https://doi.org/10.1016/j.ncl.2015.04.009
32. Singh H, Giardina TD, Meyer AND, Forjuoh SN, Reis MD, Thomas EJ. Types and origins of diagnostic errors in primary care settings. JAMA Intern Med. 2013;173(6):418. https://doi.org/10.1001/jamainternmed.2013.2777.
33. Kahn D, Stewart E, Duncan M, et al. A prescription for note bloat: an effective progress note template. J Hosp Med. 2018;13(6):378-382. https://doi.org/10.12788/jhm.2898
34. Anthoine E, Moret L, Regnault A, Sébille V, Hardouin J-B. Sample size used to validate a scale: a review of publications on newly-developed patient reported outcomes measures. Health Qual Life Outcomes. 2014;12(1):176. https://doi.org/10.1186/s12955-014-0176-2
35. Stetson PD, Bakken S, Wrenn JO, Siegler EL. Assessing electronic note quality using the physician documentation quality instrument (PDQI-9). Appl Clin Inform. 2012;3(2):164-174. https://doi.org/10.4338/ACI-2011-11-RA-0070
36. Govaerts MJB, Schuwirth LWT, Van der Vleuten CPM, Muijtjens AMM. Workplace-based assessment: effects of rater expertise. Adv Health Sci Educ Theory Pract. 2011;16(2):151-165. https://doi.org/10.1007/s10459-010-9250-7
37. Kreiter CD, Ferguson KJ. Examining the generalizability of ratings across clerkships using a clinical evaluation form. Eval Health Prof. 2001;24(1):36-46. https://doi.org/10.1177/01632780122034768
38. Middleman AB, Sunder PK, Yen AG. Reliability of the history and physical assessment (HAPA) form. Clin Teach. 2011;8(3):192-195. https://doi.org/10.1111/j.1743-498X.2011.00459.x
39. Kogan JR, Shea JA. Psychometric characteristics of a write-up assessment form in a medicine core clerkship. Teach Learn Med. 2005;17(2):101-106. https://doi.org/10.1207/s15328015tlm1702_2
40. Lewin LO, Beraho L, Dolan S, Millstein L, Bowman D. Interrater reliability of an oral case presentation rating tool in a pediatric clerkship. Teach Learn Med. 2013;25(1):31-38. https://doi.org/10.1080/10401334.2012.741537
41. Gray JD. Global rating scales in residency education. Acad Med. 1996;71(1):S55-S63.
42. Rosenbloom ST, Crow AN, Blackford JU, Johnson KB. Cognitive factors influencing perceptions of clinical documentation tools. J Biomed Inform. 2007;40(2):106-113. https://doi.org/10.1016/j.jbi.2006.06.006
43. Michtalik HJ, Pronovost PJ, Marsteller JA, Spetz J, Brotman DJ. Identifying potential predictors of a safe attending physician workload: a survey of hospitalists. J Hosp Med. 2013;8(11):644-646. https://doi.org/10.1002/jhm.2088
44. Seo J-H, Kong H-H, Im S-J, et al. A pilot study on the evaluation of medical student documentation: assessment of SOAP notes. Korean J Med Educ. 2016;28(2):237-241. https://doi.org/10.3946/kjme.2016.26
45. Kassirer JP. Our stubborn quest for diagnostic certainty. A cause of excessive testing. N Engl J Med. 1989;320(22):1489-1491. https://doi.org/10.1056/NEJM198906013202211
46. Hatch S. Uncertainty in medicine. BMJ. 2017;357:j2180. https://doi.org/10.1136/bmj.j2180
47. Cook DA, Sherbino J, Durning SJ. Management reasoning. JAMA. 2018;319(22):2267. https://doi.org/10.1001/jama.2018.4385
Approximately 60,000 hospitalists were working in the United States in 2018.1 Hospitalist groups work collaboratively because of the shiftwork required for 24/7 patient coverage, and first-rate clinical documentation is essential for quality care.2 Thoughtful clinical documentation not only transmits one provider’s clinical reasoning to other providers but is a professional responsibility.3 Hospitalists spend two-thirds of their time in indirect patient-care activities and approximately one quarter of their time on documentation in electronic health records (EHRs).4 Despite documentation occupying a substantial portion of the clinician’s time, published literature on the best practices for the documentation of clinical reasoning in hospital medicine or its assessment remains scant.5-7
Clinical reasoning involves establishing a diagnosis and developing a therapeutic plan that fits the unique circumstances and needs of the patient.8 Inpatient providers who admit patients to the hospital end the admission note with their assessment and plan (A&P) after reflecting about a patient’s presenting illness. The A&P generally represents the interpretations, deductions, and clinical reasoning of the inpatient providers; this is the section of the note that fellow physicians concentrate on over others.9 The documentation of clinical reasoning in the A&P allows for many to consider how the recorded interpretations relate to their own elucidations resulting in distributed cognition.10
Disorganized documentation can contribute to cognitive overload and impede thoughtful consideration about the clinical presentation.3 The assessment of clinical documentation may translate into reduced medical errors and improved note quality.11,12 Studies that have formally evaluated the documentation of clinical reasoning have focused exclusively on medical students.13-15 The nonexistence of a detailed rubric for evaluating clinical reasoning in the A&Ps of hospitalists represents a missed opportunity for evaluating
METHODS
Study Design, Setting, and Subjects
This was a retrospective study that reviewed the admission notes of hospitalists for patients admitted over the period of January 2014 and October 2017 at three hospitals in Maryland. One is a community hospital (Hospital A) and two are academic medical centers (Hospital B and Hospital C). Even though these three hospitals are part of one health system, they have distinct cultures and leadership, serve different populations, and are staffed by different provider teams.
The notes of physicians working for the hospitalist groups at each of the three hospitals were the focus of the analysis in this study.
Development of the Documentation Assessment Rubric
A team was assembled to develop the Clinical Reasoning in Admission Note Assessment & PLan (CRANAPL) tool. The CRANAPL was designed to assess the comprehensiveness and thoughtfulness of the clinical reasoning documented in the A&P sections of the notes of patients who were admitted to the hospital with an acute illness. Validity evidence for CRANAPL was summarized on the basis of Messick’s unified validity framework by using four of the five sources of validity: content, response process, internal structure, and relations to other variables.17
Content Validity
The development team consisted of members who have an average of 10 years of clinical experience in hospital medicine; have studied clinical excellence and clinical reasoning; and have expertise in feedback, assessment, and professional development.18-22 The development of the CRANAPL tool by the team was informed by a review of the clinical reasoning literature, with particular attention paid to the standards and competencies outlined by the Liaison Committee on Medical Education, the Association of American Medical Colleges, the Accreditation Council on Graduate Medical Education, the Internal Medicine Milestone Project, and the Society of Hospital Medicine.23-26 For each of these parties, diagnostic reasoning and its impact on clinical decision-making are considered to be a core competency. Several works that heavily influenced the CRANAPL tool’s development were Baker’s Interpretive Summary, Differential Diagnosis, Explanation of Reasoning, And Alternatives (IDEA) assessment tool;14 King’s Pediatric History and Physical Exam Evaluation (P-HAPEE) rubric;15 and three other studies related to diagnostic reasoning.16,27,28 These manuscripts and other works substantively informed the preliminary behavioral-based anchors that formed the initial foundation for the tool under development. The CRANAPL tool was shown to colleagues at other institutions who are leaders on clinical reasoning and was presented at academic conferences in the Division of General Internal Medicine and the Division of Hospital Medicine of our institution. Feedback resulted in iterative revisions. The aforementioned methods established content validity evidence for the CRANAPL tool.
Response Process Validity
Several of the authors pilot-tested earlier iterations on admission notes that were excluded from the sample when refining the CRANAPL tool. The weaknesses and sources of confusion with specific items were addressed by scoring 10 A&Ps individually and then comparing data captured on the tool. This cycle was repeated three times for the iterative enhancement and finalization of the CRANAPL tool. On several occasions when two authors were piloting the near-final CRANAPL tool, a third author interviewed each of the two authors about reactivity while assessing individual items and exploring with probes how their own clinical documentation practices were being considered when scoring the notes. The reasonable and thoughtful answers provided by the two authors as they explained and justified the scores they were selecting during the pilot testing served to confer response process validity evidence.
Finalizing the CRANAPL Tool
The nine-item CRANAPL tool includes elements for problem representation, leading diagnosis, uncertainty, differential diagnosis, plans for diagnosis and treatment, estimated length of stay (LOS), potential for upgrade in status to a higher level of care, and consideration of disposition. Although the final three items are not core clinical reasoning domains in the medical education literature, they represent clinical judgments that are especially relevant for the delivery of the high-quality and cost-effective care of hospitalized patients. Given that the probabilities and estimations of these three elements evolve over the course of any hospitalization on the basis of test results and response to therapy, the documentation of initial expectations on these fronts can facilitate distributed cognition with all individuals becoming wiser from shared insights.10 The tool uses two- and three-point rating scales, with each number score being clearly defined by specific written criteria (total score range: 0-14; Appendix).
Data Collection
Hospitalists’ admission notes from the three hospitals were used to validate the CRANAPL tool. Admission notes from patients hospitalized to the general medical floors with an admission diagnosis of either fever, syncope/dizziness, or abdominal pain were used. These diagnoses were purposefully examined because they (1) have a wide differential diagnosis, (2) are common presenting symptoms, and (3) are prone to diagnostic errors.29-32
The centralized EHR system across the three hospitals identified admission notes with one of these primary diagnoses of patients admitted over the period of January 2014 to October 2017. We submitted a request for 650 admission notes to be randomly selected from the centralized institutional records system. The notes were stratified by hospital and diagnosis. The sample size of our study was comparable with that of prior psychometric validation studies.33,34 Upon reviewing the A&Ps associated with these admissions, 365 notes were excluded for one of three reasons: (1) the note was written by a nurse practitioner, physician assistant, resident, or medical student; (2) the admission diagnosis had been definitively confirmed in the emergency department (eg, abdominal pain due to diverticulitis seen on CT); and (3) the note represented the fourth or more note by any single provider (to sample notes of many providers, no more than three notes written by any single provider were analyzed). A total of 285 admission notes were ultimately included in the sample.
Data were deidentified, and the A&P sections of the admission notes were each copied from the EHR into a unique Word document. Patient and hospital demographic data (including age, gender, race, number of comorbid conditions, LOS, hospital charges, and readmission to the same health system within 30 days) were collected separately from the EHR. Select physician characteristics were also collected from the hospitalist groups at each of the three hospitals, as was the length (word count) of each A&P.
The study was approved by our institutional review board.
Data Analysis
Two authors scored all deidentified A&Ps by using the finalized version of the CRANAPL tool. Prior to using the CRANAPL tool on each of the notes, these raters read each A&P and scored them by using two single-item rating scales: a global clinical reasoning and a global readability/clarity measure. Both of these global scales used three-item Likert scales (below average, average, and above average). These global rating scales collected the reviewers’ gestalt about the quality and clarity of the A&P. The use of gestalt ratings as comparators is supported by other research.35
Descriptive statistics were computed for all variables. Each rater rescored a sample of 48 records (one month after the initial scoring) and intraclass correlations (ICCs) were computed for intrarater reliability. ICCs were calculated for each item and for the CRANAPL total to determine interrater reliability.
The averaged ratings from the two raters were used for all other analyses. For CRANAPL’s internal structure validity evidence, Cronbach’s alpha was calculated as a measure of internal consistency. For relations to other variables validity evidence, CRANAPL total scores were compared with the two global assessment variables with linear regressions.
Bivariate analyses were performed by applying parametric and nonparametric tests as appropriate. A series of multivariate linear regressions, controlling for diagnosis and clustered variance by hospital site, were performed using CRANAPL total as the dependent variable and patient variables as predictors.
All data were analyzed using Stata (StataCorp. 2013. Stata Statistical Software: Release 13. College Station, Texas: StataCorp LP.)
RESULTS
The admission notes of 120 hospitalists were evaluated (Table 1). A total of 39 (33%) physicians were moonlighters with primary appointments outside of the hospitalist division, and 81 (68%) were full-time hospitalists. Among the 120 hospitalists, 48 (40%) were female, 60 (50%) were international medical graduates, and 90 (75%) were of nonwhite race. Most hospitalist physicians (n = 47, 58%) had worked in our health system for less than five years, and 64 hospitalists (53%) devoted greater than 50% of their time to patient care.
Approximately equal numbers of patient admission notes were pulled from each of the three hospitals. The average age of patients was 67.2 (SD 13.6) years, 145 (51%) were female, and 120 (42%) were of nonwhite race. The mean LOS for all patients was 4.0 (SD 3.4) days. A total of 44 (15%) patients were readmitted to the same health system within 30 days of discharge. None of the patients died during the incident hospitalization. The average charge for each of the hospitalizations was $10,646 (SD $9,964).
CRANAPL Data
Figure 1 shows the distribution of the scores given by each rater for each of the nine items. The mean of the total CRANAPL score given by both raters was 6.4 (SD 2.2). Scoring for some items were high (eg, summary statement: 1.5/2), whereas performance on others were low (eg, estimating LOS: 0.1/1 and describing the potential need for upgrade in care: 0.0/1).
Validity of the CRANAPL Tool’s Internal Structure
Cronbach’s alpha, which was used to measure internal consistency within the CRANAPL tool, was 0.43. The ICC, which was applied to measure the interrater reliability for both raters for the total CRANAPL score, was 0.83 (95% CI: 0.76-0.87). The ICC values for intrarater reliability for raters 1 and 2 were 0.73 (95% CI: 0.60-0.83) and 0.73 (95% CI: 0.45-0.86), respectively.
Relations to Other Variables Validity
Associations between CRANAPL total scores, global clinical reasoning, and global scores for note readability/clarity were statistically significant (P < .001), Figure 2.
Eight out of nine CRANAPL variables were statistically significantly different across the three hospitals (P <. 01) when data were analyzed by hospital site. Hospital C had the highest mean score of 7.4 (SD 2.0), followed by Hospital B with a score of 6.6 (SD 2.1), and Hospital A had the lowest total CRANAPL score of 5.2 (SD 1.9). This difference was statistically significant (P < .001). Five variables with respect to admission diagnoses (uncertainty acknowledged, differential diagnosis, plan for diagnosis, plan for treatment, and upgrade plan) were statistically significantly different across notes. Notes for syncope/dizziness generally yielded higher scores than those for abdominal pain and fever.
Factors Associated with High CRANAPL Scores
Table 2 shows the associations between CRANAPL scores and several covariates. Before adjustment, high CRANAPL scores were associated with high word counts of A&Ps (P < .001) and high hospital charges (P < .05). These associations were no longer significant after adjusting for hospital site and admitting diagnoses.
DISCUSSION
We reviewed the documentation of clinical reasoning in 285 admission notes at three different hospitals written by hospitalist physicians during routine clinical care. To our knowledge, this is the first study that assessed the documentation of hospitalists’ clinical reasoning with real patient notes. Wide variability exists in the documentation of clinical reasoning within the A&Ps of hospitalists’ admission notes. We have provided validity evidence to support the use of the user-friendly CRANAPL tool.
Prior studies have described rubrics for evaluating the clinical reasoning skills of medical students.14,15 The ICCs for the IDEA rubric used to assess medical students’ documentation of clinical reasoning were fair to moderate (0.29-0.67), whereas the ICC for the CRANAPL tool was high at 0.83. This measure of reliability is similar to that for the P-HAPEE rubric used to assess medical students’ documentation of pediatric history and physical notes.15 These data are markedly different from the data in previous studies that have found low interrater reliability for psychometric evaluations related to judgment and decision-making.36-39 CRANAPL was also found to have high intrarater reliability, which shows the reproducibility of an individual’s assessment over time. The strong association between the total CRANAPL score and global clinical reasoning assessment found in the present study is similar to that found in previous studies that have also embedded global rating scales as comparators when assessing clinical reasoning.13,,15,40,41 Global rating scales represent an overarching structure for comparison given the absence of an accepted method or gold standard for assessing clinical reasoning documentation. High-quality provider notes are defined by clarity, thoroughness, and accuracy;35 and effective documentation promotes communication and the coordination of care among the members of the care team.3
The total CRANAPL scores varied by hospital site with academic hospitals (B and C) scoring higher than the community hospital (A) in our study. Similarly, lengthy A&Ps were associated with high CRANAPL scores (P < .001) prior to adjustment for hospital site. Healthcare providers consider that the thoroughness of documentation denotes quality and attention to detail.35,42 Comprehensive documentation takes time; the longer notes by academic hospitalists than those by community hospitalists may be attributed to the fewer number of patients generally carried by hospitalists at academic centers than that by hospitalists at community hospitals.43
The documentation of the estimations of LOS, possibility of potential upgrade, and thoughts about disposition were consistently poorly described across all hospital sites and diagnoses. In contrast to CRANAPL, other clinical reasoning rubrics have excluded these items or discussed uncertainty.14,15,44 These elements represent the forward thinking that may be essential for high-quality progressive care by hospitalists. Physicians’s difficulty in acknowledging uncertainty has been associated with resource overuse, including the excessive ordering of tests, iatrogenic injury, and heavy financial burden on the healthcare system.45,46 The lack of thoughtful clinical and management reasoning at the time of admission is believed to be associated with medical errors.47 If used as a guide, the CRANAPL tool may promote reflection on the part of the admitting physician. The estimations of LOS, potential for upgrade to a higher level of care, and disposition are markers of optimal inpatient care, especially for hospitalists who work in shifts with embedded handoffs. When shared with colleagues (through documentation), there is the potential for distributed cognition10 to extend throughout the social network of the hospitalist group. The fact that so few providers are currently including these items in their A&P’s show that the providers are either not performing or documenting the ‘reasoning’. Either way, this is an opportunity that has been highlighted by the CRANAPL tool.
Several limitations of this study should be considered. First, the CRANAPL tool may not have captured elements of optimal clinical reasoning documentation. The reliance on multiple methods and an iterative process in the refinement of the CRANAPL tool should have minimized this. Second, this study was conducted across a single healthcare system that uses the same EHR; this EHR or institutional culture may influence documentation practices and behaviors. Given that using the CRANAPL tool to score an A&P is quick and easy, the benefit of giving providers feedback on their notes remains to be seen—here and at other hospitals. Third, our sample size could limit the generalizability of the results and the significance of the associations. However, the sample assessed in our study was significantly larger than that assessed in other studies that have validated clinical reasoning rubrics.14,15 Fourth, clinical reasoning is a broad and multidimensional construct. The CRANAPL tool focuses exclusively on hospitalists’ documentation of clinical reasoning and therefore does not assess aspects of clinical reasoning occurring in the physicians’ minds. Finally, given our goal to optimally validate the CRANAPL tool, we chose to test the tool on specific presentations that are known to be associated with diagnostic practice variation and errors. We may have observed different results had we chosen a different set of diagnoses from each hospital. Further validity evidence will be established when applying the CRANPL tool to different diagnoses and to notes from other clinical settings.
In conclusion, this study focuses on the development and validation of the CRANAPL tool that assesses how hospitalists document their clinical reasoning in the A&P section of admission notes. Our results show that wide variability exists in the documentation of clinical reasoning by hospitalists within and across hospitals. Given the CRANAPL tool’s ease-of-use and its versatility, hospitalist divisions in academic and nonacademic settings may use the CRANAPL tool to assess and provide feedback on the documentation of hospitalists’ clinical reasoning. Beyond studying whether physicians can be taught to improve their notes with feedback based on the CRANAPL tool, future studies may explore whether enhancing clinical reasoning documentation may be associated with improvements in patient care and clinical outcomes.
Acknowledgments
Dr. Wright is the Anne Gaines and G. Thomas Miller Professor of Medicine which is supported through Hopkins’ Center for Innovative Medicine.
The authors thank Christine Caufield-Noll, MLIS, AHIP (Johns Hopkins Bayview Medical Center, Baltimore, Maryland) for her assistance with this project.
Disclosures
The authors have nothing to disclose.
1. State of Hospital Medicine. Society of Hospital Medicine. https://www.hospitalmedicine.org/practice-management/shms-state-of-hospital-medicine/. Accessed August 19, 2018.
2. Mehta R, Radhakrishnan NS, Warring CD, et al. The use of evidence-based, problem-oriented templates as a clinical decision support in an inpatient electronic health record system. Appl Clin Inform. 2016;7(3):790-802. https://doi.org/10.4338/ACI-2015-11-RA-0164
3. Improving Diagnosis in Healthcare: Health and Medicine Division. http://www.nationalacademies.org/hmd/Reports/2015/Improving-Diagnosis-in-Healthcare.aspx. Accessed August 7, 2018.
4. Tipping MD, Forth VE, O’Leary KJ, et al. Where did the day go? A time-motion study of hospitalists. J Hosp Med. 2010;5(6):323-328. https://doi.org/10.1002/jhm.790
5. Varpio L, Rashotte J, Day K, King J, Kuziemsky C, Parush A. The EHR and building the patient’s story: a qualitative investigation of how EHR use obstructs a vital clinical activity. Int J Med Inform. 2015;84(12):1019-1028. https://doi.org/10.1016/j.ijmedinf.2015.09.004
6. Clynch N, Kellett J. Medical documentation: part of the solution, or part of the problem? A narrative review of the literature on the time spent on and value of medical documentation. Int J Med Inform. 2015;84(4):221-228. https://doi.org/10.1016/j.ijmedinf.2014.12.001
7. Varpio L, Day K, Elliot-Miller P, et al. The impact of adopting EHRs: how losing connectivity affects clinical reasoning. Med Educ. 2015;49(5):476-486. https://doi.org/10.1111/medu.12665
8. McBee E, Ratcliffe T, Schuwirth L, et al. Context and clinical reasoning: understanding the medical student perspective. Perspect Med Educ. 2018;7(4):256-263. https://doi.org/10.1007/s40037-018-0417-x
9. Brown PJ, Marquard JL, Amster B, et al. What do physicians read (and ignore) in electronic progress notes? Appl Clin Inform. 2014;5(2):430-444. https://doi.org/10.4338/ACI-2014-01-RA-0003
10. Katherine D, Shalin VL. Creating a common trajectory: Shared decision making and distributed cognition in medical consultations. https://pxjournal.org/cgi/viewcontent.cgi?article=1116&context=journal Accessed April 4, 2019.
11. Harchelroad FP, Martin ML, Kremen RM, Murray KW. Emergency department daily record review: a quality assurance system in a teaching hospital. QRB Qual Rev Bull. 1988;14(2):45-49. https://doi.org/10.1016/S0097-5990(16)30187-7.
12. Opila DA. The impact of feedback to medical housestaff on chart documentation and quality of care in the outpatient setting. J Gen Intern Med. 1997;12(6):352-356. https://doi.org/10.1007/s11606-006-5083-8.
13. Smith S, Kogan JR, Berman NB, Dell MS, Brock DM, Robins LS. The development and preliminary validation of a rubric to assess medical students’ written summary statements in virtual patient cases. Acad Med. 2016;91(1):94-100. https://doi.org/10.1097/ACM.0000000000000800
14. Baker EA, Ledford CH, Fogg L, Way DP, Park YS. The IDEA assessment tool: assessing the reporting, diagnostic reasoning, and decision-making skills demonstrated in medical students’ hospital admission notes. Teach Learn Med. 2015;27(2):163-173. https://doi.org/10.1080/10401334.2015.1011654
15. King MA, Phillipi CA, Buchanan PM, Lewin LO. Developing validity evidence for the written pediatric history and physical exam evaluation rubric. Acad Pediatr. 2017;17(1):68-73. https://doi.org/10.1016/j.acap.2016.08.001
16. Miller GE. The assessment of clinical skills/competence/performance. Acad Med. 1990;65(9):S63-S67.
17. Messick S. Standards of validity and the validity of standards in performance asessment. Educ Meas Issues Pract. 2005;14(4):5-8. https://doi.org/10.1111/j.1745-3992.1995.tb00881.x
18. Menachery EP, Knight AM, Kolodner K, Wright SM. Physician characteristics associated with proficiency in feedback skills. J Gen Intern Med. 2006;21(5):440-446. https://doi.org/10.1111/j.1525-1497.2006.00424.x
19. Tackett S, Eisele D, McGuire M, Rotello L, Wright S. Fostering clinical excellence across an academic health system. South Med J. 2016;109(8):471-476. https://doi.org/10.14423/SMJ.0000000000000498
20. Christmas C, Kravet SJ, Durso SC, Wright SM. Clinical excellence in academia: perspectives from masterful academic clinicians. Mayo Clin Proc. 2008;83(9):989-994. https://doi.org/10.4065/83.9.989
21. Wright SM, Kravet S, Christmas C, Burkhart K, Durso SC. Creating an academy of clinical excellence at Johns Hopkins Bayview Medical Center: a 3-year experience. Acad Med. 2010;85(12):1833-1839. https://doi.org/10.1097/ACM.0b013e3181fa416c
22. Kotwal S, Peña I, Howell E, Wright S. Defining clinical excellence in hospital medicine: a qualitative study. J Contin Educ Health Prof. 2017;37(1):3-8. https://doi.org/10.1097/CEH.0000000000000145
23. Common Program Requirements. https://www.acgme.org/What-We-Do/Accreditation/Common-Program-Requirements. Accessed August 21, 2018.
24. Warren J, Lupi C, Schwartz ML, et al. Chief Medical Education Officer.; 2017. https://www.aamc.org/download/482204/data/epa9toolkit.pdf. Accessed August 21, 2018.
25. Th He Inte. https://www.abim.org/~/media/ABIM Public/Files/pdf/milestones/internal-medicine-milestones-project.pdf. Accessed August 21, 2018.
26. Core Competencies. Society of Hospital Medicine. https://www.hospitalmedicine.org/professional-development/core-competencies/. Accessed August 21, 2018.
27. Bowen JL. Educational strategies to promote clinical diagnostic reasoning. Cox M,
28. Pangaro L. A new vocabulary and other innovations for improving descriptive in-training evaluations. Acad Med. 1999;74(11):1203-1207. https://doi.org/10.1097/00001888-199911000-00012.
29. Rao G, Epner P, Bauer V, Solomonides A, Newman-Toker DE. Identifying and analyzing diagnostic paths: a new approach for studying diagnostic practices. Diagnosis Berlin, Ger. 2017;4(2):67-72. https://doi.org/10.1515/dx-2016-0049
30. Ely JW, Kaldjian LC, D’Alessandro DM. Diagnostic errors in primary care: lessons learned. J Am Board Fam Med. 2012;25(1):87-97. https://doi.org/10.3122/jabfm.2012.01.110174
31. Kerber KA, Newman-Toker DE. Misdiagnosing dizzy patients: common pitfalls in clinical practice. Neurol Clin. 2015;33(3):565-75, viii. https://doi.org/10.1016/j.ncl.2015.04.009
32. Singh H, Giardina TD, Meyer AND, Forjuoh SN, Reis MD, Thomas EJ. Types and origins of diagnostic errors in primary care settings. JAMA Intern Med. 2013;173(6):418. https://doi.org/10.1001/jamainternmed.2013.2777.
33. Kahn D, Stewart E, Duncan M, et al. A prescription for note bloat: an effective progress note template. J Hosp Med. 2018;13(6):378-382. https://doi.org/10.12788/jhm.2898
34. Anthoine E, Moret L, Regnault A, Sébille V, Hardouin J-B. Sample size used to validate a scale: a review of publications on newly-developed patient reported outcomes measures. Health Qual Life Outcomes. 2014;12(1):176. https://doi.org/10.1186/s12955-014-0176-2
35. Stetson PD, Bakken S, Wrenn JO, Siegler EL. Assessing electronic note quality using the physician documentation quality instrument (PDQI-9). Appl Clin Inform. 2012;3(2):164-174. https://doi.org/10.4338/ACI-2011-11-RA-0070
36. Govaerts MJB, Schuwirth LWT, Van der Vleuten CPM, Muijtjens AMM. Workplace-based assessment: effects of rater expertise. Adv Health Sci Educ Theory Pract. 2011;16(2):151-165. https://doi.org/10.1007/s10459-010-9250-7
37. Kreiter CD, Ferguson KJ. Examining the generalizability of ratings across clerkships using a clinical evaluation form. Eval Health Prof. 2001;24(1):36-46. https://doi.org/10.1177/01632780122034768
38. Middleman AB, Sunder PK, Yen AG. Reliability of the history and physical assessment (HAPA) form. Clin Teach. 2011;8(3):192-195. https://doi.org/10.1111/j.1743-498X.2011.00459.x
39. Kogan JR, Shea JA. Psychometric characteristics of a write-up assessment form in a medicine core clerkship. Teach Learn Med. 2005;17(2):101-106. https://doi.org/10.1207/s15328015tlm1702_2
40. Lewin LO, Beraho L, Dolan S, Millstein L, Bowman D. Interrater reliability of an oral case presentation rating tool in a pediatric clerkship. Teach Learn Med. 2013;25(1):31-38. https://doi.org/10.1080/10401334.2012.741537
41. Gray JD. Global rating scales in residency education. Acad Med. 1996;71(1):S55-S63.
42. Rosenbloom ST, Crow AN, Blackford JU, Johnson KB. Cognitive factors influencing perceptions of clinical documentation tools. J Biomed Inform. 2007;40(2):106-113. https://doi.org/10.1016/j.jbi.2006.06.006
43. Michtalik HJ, Pronovost PJ, Marsteller JA, Spetz J, Brotman DJ. Identifying potential predictors of a safe attending physician workload: a survey of hospitalists. J Hosp Med. 2013;8(11):644-646. https://doi.org/10.1002/jhm.2088
44. Seo J-H, Kong H-H, Im S-J, et al. A pilot study on the evaluation of medical student documentation: assessment of SOAP notes. Korean J Med Educ. 2016;28(2):237-241. https://doi.org/10.3946/kjme.2016.26
45. Kassirer JP. Our stubborn quest for diagnostic certainty. A cause of excessive testing. N Engl J Med. 1989;320(22):1489-1491. https://doi.org/10.1056/NEJM198906013202211
46. Hatch S. Uncertainty in medicine. BMJ. 2017;357:j2180. https://doi.org/10.1136/bmj.j2180
47. Cook DA, Sherbino J, Durning SJ. Management reasoning. JAMA. 2018;319(22):2267. https://doi.org/10.1001/jama.2018.4385
© 2019 Society of Hospital Medicine
A tool to assess comportment and communication for hospitalists
With the rise of hospital medicine in the United States, the lion’s share of inpatient care is delivered by hospitalists. Both hospitals and hospitalist providers are committed to delivering excellent patient care, but to accomplish this goal, specific feedback is essential.
Patient satisfaction surveys that assess provider performance, such as Press Ganey (PG)1 and Hospital Consumer Assessment of Healthcare Providers and Systems (HCAHPS),2 do not truly provide feedback at the encounter level with valid attribution, and these data are not sent to providers in a timely manner.
In the analyses, the HMCCOT scores were moderately correlated with the hospitalists’ PG scores. Higher scores on the HMCCOT took an average of 13 minutes per patient encounter, giving further credence to the fact that excellent communication and comportment can be rapidly established at the bedside.
Patients’ complaints about doctors often relate to comportment and communication; the grievances are most commonly about feeling rushed, not being heard, and that information was not conveyed in a clear manner.4 Patient-centeredness has been shown to improve patient satisfaction as well as clinical outcomes, in part because they feel like partners in the mutually agreed upon treatment plans.5 Many of the components of the HMCCOT are at the heart of patient-centered care. While comportment may not be a frequently used term in patient care, respectful behaviors performed at the opening of any encounter [etiquette-based medicine which includes introducing oneself to patients and smiling] set the tone for the doctor-patient interaction.
Demonstrating genuine interest in the patient as a person is a core component of excellent patient care. Sir William Osler famously observed “It is much more important to know what sort of a patient has a disease than what sort of a disease a patient has.”6 A common method of “demonstrating interest in the patient as a person” recorded by the HMCCOT was physicians asking about patient’s personal history and of their interests. It is not difficult to fathom how knowing about patients’ personal interests and perspectives can help to most effectively engage them in establishing their goals of care and with therapeutic decisions.
Because hospitalists spend only a small proportion of their clinical time in direct patient care at the bedside, they need to make every moment count. HMCCOT allows for the identification of providers who are excellent in communication and comportment. Once identified, these exemplars can watch their peers and become the trainers to establish a culture of excellence.
Larger studies will be needed in the future to assess whether interventions that translate into improved comportment and communication among hospitalists will definitively augment patient satisfaction and ameliorate clinical outcomes.
1. Press Ganey. Accessed Dec. 15, 2015.
2. HCAHPS. Accessed Feb. 2, 2016.
3. Kotwal S, Khaliq W, Landis R, Wright S. Developing a comportment and communication tool for use in hospital medicine. J Hosp Med. 2016 Aug 13. doi: 10.1002/jhm.2647.
4. Hickson GB, Clayton EW, Entman SS, Miller CS, Githens PB, Whetten-Goldstein K, Sloan FA. Obstetricians’ prior malpractice experience and patients’ satisfaction with care. JAMA. 1994 Nov 23-30;272(20):1583-7.
5. Epstein RM, Street RL. Patient-centered communication in cancer care: promoting healing and reducing suffering. National Cancer Institute, NIH Publication No. 07-6225. Bethesda, MD, 2007.
6. Taylor RB. White Coat Tales: Medicine’s Heroes, Heritage, and Misadventure. New York: Springer; 2007:126.
Susrutha Kotwal, MD, and Scott Wright, MD, are based in the department of medicine, division of hospital medicine, Johns Hopkins Bayview Medical Center and Johns Hopkins University, Baltimore.
Comportment and Communication Score
In 2014, there were more than 40,000 hospitalists in the United States, and approximately 20% were employed by academic medical centers.[1] Hospitalist physicians groups are committed to delivering excellent patient care. However, the published literature is limited with respect to defining optimal care in hospital medicine.
Patient satisfaction surveys, such as Press Ganey (PG)[2] and Hospital Consumer Assessment of Healthcare Providers and Systems,[3] are being used to assess patients' contentment with the quality of care they receive while hospitalized. The Society of Hospital Medicine, the largest professional medical society representing hospitalists, encourages the use of patient satisfaction surveys to measure hospitalist providers' quality of patient care.[4] There are, however, several problems with the current methods. First, the attribution to specific providers is questionable. Second, recall about the provider by the patients may be poor because surveys are sent to patients days after they return home. Third, the patients' recovery and health outcomes are likely to influence their assessment of the doctor. Finally, feedback is known to be most valuable and transformative when it is specific and given in real time. Thus, a tool that is able to provide feedback at the encounter level should be more helpful than a tool that offers assessment at the level of the admission, particularly when it can be also delivered immediately after the data are collected.
Comportment has been used to describe both the way a person behaves and also the way she carries herself (ie, her general manner).[5] Excellent comportment and communication can serve as the foundation for delivering patient‐centered care.[6, 7, 8] Patient centeredness has been shown to improve the patient experience and clinical outcomes, including compliance with therapeutic plans.[9, 10, 11] Respectful behavior, etiquette‐based medicine, and effective communication also lay the foundation upon which the therapeutic alliance between a doctor and patient can be built.
The goal of this study was to establish a metric that could comprehensively assess a hospitalist provider's comportment and communication skills during an encounter with a hospitalized patient.
METHODS
Study Design and Setting
An observational study of hospitalist physicians was conducted between June 2013 and December 2013 at 5 hospitals in Maryland and Washington DC. Two are academic medical centers (Johns Hopkins Hospital and Johns Hopkins Bayview Medical Center [JHBMC]), and the others are community hospitals (Howard County General Hospital [HCGH], Sibley Memorial Hospital [SMC], and Suburban Hospital). These 5 hospitals, across 2 large cities, have distinct culture and leadership, each serving different populations.
Subjects
In developing a tool to measure communication and comportment, we needed to observe physicianpatient encounters wherein there would be a good deal of variability in performance. During pilot testing, when following a few of the most senior and respected hospitalists, we noted encounters during which they excelled and others where they performed less optimally. Further, in following some less‐experienced providers, their skills were less developed and they were uniformly missing most of the behaviors on the tool that were believed to be associated with optimal communication and comportment. Because of this, we decided to purposively sample the strongest clinicians at each of the 5 hospitals in hopes of seeing a range of scores on the tool.
The chiefs of hospital medicine at the 5 hospitals were contacted and asked to identify their most clinically excellent hospitalists, namely those who they thought were most clinically skilled within their groups. Because our goal was to observe the top tier (approximately 20%) of the hospitalists within each group, we asked each chief to name a specific number of physicians (eg, 3 names for 1 group with 15 hospitalists, and 8 from another group with 40 physicians). No precise definition of most clinically excellent hospitalists was provided to the chiefs. It was believed that they were well positioned to select their best clinicians because of both subjective feedback and objective data that flow to them. This postulate may have been corroborated by the fact that each of them efficiently sent a list of their top choices without any questions being asked.
The 29 hospitalists (named by their chiefs) were in turn emailed and invited to participate in the study. All but 3 hospitalists consented to participate in the study; this resulted in a cohort of 26 who would be observed.
Tool Development
A team was assembled to develop the hospital medicine comportment and communication observation tool (HMCCOT). All team members had extensive clinical experience, several had published articles on clinical excellence, had won clinical awards, and all had been teaching clinical skills for many years. The team's development of the HMCCOT was extensively informed by a review of the literature. Two articles that most heavily influenced the HMCCOT's development were Christmas et al.'s paper describing 7 core domains of excellence, 2 of which are intimately linked to communication and comportment,[12] and Kahn's text that delineates behaviors to be performed upon entering the patient's room, termed etiquette‐based medicine.[6] The team also considered the work from prior timemotion studies in hospital medicine,[7, 13] which led to the inclusion of temporal measurements during the observations. The tool was also presented at academic conferences in the Division of General Internal Medicine at Johns Hopkins and iteratively revised based on the feedback. Feedback was sought from people who have spent their entire career studying physicianpatient relationships and who are members of the American Academy on Communication in Healthcare. These methods established content validity evidence for the tool under development. The goal of the HMCCOT was to assess behaviors believed to be associated with optimal comportment and communication in hospital medicine.
The HMCCOT was pilot tested by observing different JHBMC hospitalists patient encounters and it was iteratively revised. On multiple occasions, 2 authors/emnvestigators spent time observing JHBMC hospitalists together and compared data capture and levels of agreement across all elements. Then, for formal assessment of inter‐rater reliability, 2 authors observed 5 different hospitalists across 25 patient encounters; the coefficient was 0.91 (standard error = 0.04). This step helped to establish internal structure validity evidence for the tool.
The initial version of the HMCCOT contained 36 elements, and it was organized sequentially to allow the observer to document behaviors in the order that they were likely to occur so as to facilitate the process and to minimize oversight. A few examples of the elements were as follows: open‐ended versus a close‐ended statement at the beginning of the encounter, hospitalist introduces himself/herself, and whether the provider smiles at any point during the patient encounter.
Data Collection
One author scheduled a time to observe each hospitalist physician during their routine clinical care of patients when they were not working with medical learners. Hospitalists were naturally aware that they were being observed but were not aware of the specific data elements or behaviors that were being recorded.
The study was approved by the institutional review board at the Johns Hopkins University School of Medicine, and by each of the research review committees at HCGH, SMC, and Suburban hospitals.
Data Analysis
After data collection, all data were deidentified so that the researchers were blinded to the identities of the physicians. Respondent characteristics are presented as proportions and means. Unpaired t test and 2 tests were used to compare demographic information, and stratified by mean HMCCOT score. The survey data were analyzed using Stata statistical software version 12.1 (StataCorp LP, College Station, TX).
Further Validation of the HMCCOT
Upon reviewing the distribution of data after observing the 26 physicians with their patients, we excluded 13 variables from the initial version of the tool that lacked discriminatory value (eg, 100% or 0% of physicians performed the observed behavior during the encounters); this left 23 variables that were judged to be most clinically relevant in the final version of the HMCCOT. Two examples of the variables that were excluded were: uses technology/literature to educate patients (not witnessed in any encounter), and obeys posted contact precautions (done uniformly by all). The HMCCOT score represents the proportion of observed behaviors (out of the 23 behaviors). It was computed for each hospitalist for every patient encounter. Finally, relation to other variables validity evidence would be established by comparing the mean HMCCOT scores of the physicians to their PG scores from the same time period to evaluate the correlation between the 2 scores. This association was assessed using Pearson correlations.
RESULTS
The average clinical experience of the 26 hospitalist physicians studied was 6 years (Table 1). Their mean age was 38 years, 13 (50%) were female, and 16 (62%) were of nonwhite race. Fourteen hospitalists (54%) worked at 1 of the nonacademic hospitals. In terms of clinical workload, most physicians (n = 17, 65%) devoted more than 70% of their time working in direct patient care. Mean time spent observing each physician was 280 minutes. During this time, the 26 physicians were observed for 181 separate clinical encounters; 54% of these patients were new encounters, patients who were not previously known to the physician. The average time each physician spent in a patient room was 10.8 minutes. Mean number of observed patient encounters per hospitalist was 7.
| Total Study Population, n = 26 | HMCCOT Score 60, n = 14 | HMCCOT Score >60, n = 12 | P Value* | |
|---|---|---|---|---|
| ||||
| Age, mean (SD) | 38 (5.6) | 37.9 (5.6) | 38.1 (5.7) | 0.95 |
| Female, n (%) | 13 (50) | 6 (43) | 7 (58) | 0.43 |
| Race, n (%) | ||||
| Caucasian | 10 (38) | 5 (36) | 5 (41) | 0.31 |
| Asian | 13 (50) | 8 (57) | 5 (41) | |
| African/African American | 2 (8) | 0 (0) | 2 (17) | |
| Other | 1 (4) | 1 (7) | 0 (0) | |
| Clinical experience >6 years, n (%) | 12 (46) | 6 (43) | 6 (50) | 0.72 |
| Clinical workload >70% | 17 (65) | 10 (71) | 7 (58) | 0.48 |
| Academic hospitalist, n (%) | 12 (46) | 5 (36) | 7 (58) | 0.25 |
| Hospital | 0.47 | |||
| JHBMC | 8 (31) | 3 (21.4) | 5 (41) | |
| JHH | 4 (15) | 2 (14.3) | 2 (17) | |
| HCGH | 5 (19) | 3 (21.4) | 2 (17) | |
| Suburban | 6 (23) | 3 (21.4) | 3 (25) | |
| SMC | 3 (12) | 3 (21.4) | 0 (0) | |
| Minutes spent observing hospitalist per shift, mean (SD) | 280 (104.5) | 280.4 (115.5) | 281.4 (95.3) | 0.98 |
| Average time spent per patient encounter in minutes, mean (SD) | 10.8 (8.9) | 8.7 (9.1) | 13 (8.1) | 0.001 |
| Proportion of observed patients who were new to provider, % | 97 (53.5) | 37 (39.7) | 60 (68.1) | 0.001 |
The distribution of HMCCOT scores was not statistically significantly different when analyzed by age, gender, race, amount of clinical experience, clinical workload of the hospitalist, hospital, time spent observing the hospitalist (all P > 0.05). The distribution of HMCCOT scores was statistically different in new patient encounters compared to follow‐ups (68.1% vs 39.7%, P 0.001). Encounters with patients that generated HMCCOT scores above versus below the mean were longer (13 minutes vs 8.7 minutes, P 0.001).
The mean HMCCOT score was 61 (standard deviation [SD] = 10.6), and it was normally distributed (Figure 1). Table 2 shows the data for the 23 behaviors that were objectively assessed as part of the HMCCOT for the 181 patient encounters. The most frequently observed behaviors were physicians washing hands after leaving the patient's room in 170 (94%) of the encounters and smiling (83%). The behaviors that were observed with the least regularity were using an empathic statement (26% of encounters), and employing teach‐back (13% of encounters). A common method of demonstrating interest in the patient as a person, seen in 41% of encounters, involved physicians asking about patients' personal histories and their interests.
| Variables | All Visits Combined, n = 181 | HMCCOT Score <60, n = 93 | HMCCOT Score >60, n = 88 | P Value* |
|---|---|---|---|---|
| ||||
| Objective observations, n (%) | ||||
| Washes hands after leaving room | 170 (94) | 83 (89) | 87 (99) | 0.007 |
| Discusses plan for the day | 163 (91) | 78 (84) | 85 (99) | <0.001 |
| Does not interrupt the patient | 159 (88) | 79 (85) | 80 (91) | 0.21 |
| Smiles | 149 (83) | 71 (77) | 78 (89) | 0.04 |
| Washes hands before entering | 139 (77) | 64 (69) | 75 (85) | 0.009 |
| Begins with open‐ended question | 134 (77) | 68 (76) | 66 (78) | 0.74 |
| Knocks before entering the room | 127 (76) | 57 (65) | 70 (89) | <0.001 |
| Introduces him/herself to the patient | 122 (67) | 45 (48) | 77 (88) | <0.001 |
| Explains his/her role | 120 (66) | 44 (47) | 76 (86) | <0.001 |
| Asks about pain | 110 (61) | 45 (49) | 65 (74) | 0.001 |
| Asks permission prior to examining | 106 (61) | 43 (50) | 63 (72) | 0.002 |
| Uncovers body area for the physical exam | 100 (57) | 34 (38) | 66 (77) | <0.001 |
| Discusses discharge plan | 99 (55) | 38 (41) | 61 (71) | <0.001 |
| Sits down in the patient room | 74 (41) | 24 (26) | 50 (57) | <0.001 |
| Asks about patient's feelings | 58 (33) | 17 (19) | 41 (47) | <0.001 |
| Shakes hands with the patient | 57 (32) | 17 (18) | 40 (46) | <0.001 |
| Uses teach‐back | 24 (13) | 4 (4.3) | 20 (24) | <0.001 |
| Subjective observations, n (%) | ||||
| Avoids medical jargon | 160 (89) | 85 (91) | 83 (95) | 0.28 |
| Demonstrates interest in patient as a person | 72 (41) | 16 (18) | 56 (66) | <0.001 |
| Touches appropriately | 62 (34) | 21 (23) | 41 (47) | 0.001 |
| Shows sensitivity to patient modesty | 57 (93) | 15 (79) | 42 (100) | 0.002 |
| Engages in nonmedical conversation | 54 (30) | 10 (11) | 44 (51) | <0.001 |
| Uses empathic statement | 47 (26) | 9 (10) | 38 (43) | <0.001 |

The average composite PG scores for the physician sample was 38.95 (SD=39.64). A moderate correlation was found between the HMCCOT score and PG score (adjusted Pearson correlation: 0.45, P = 0.047).
DISCUSSION
In this study, we followed 26 hospitalist physicians during routine clinical care, and we focused intently on their communication and their comportment with patients at the bedside. Even among clinically respected hospitalists, the results reveal that there is wide variability in comportment and communication practices and behaviors at the bedside. The physicians' HMCCOT scores were associated with their PG scores. These findings suggest that improved bedside communication and comportment with patients might translate into enhanced patient satisfaction.
This is the first study that honed in on hospitalist communication and comportment. With validity evidence established for the HMCCOT, some may elect to more explicitly perform these behaviors themselves, and others may wish to watch other hospitalists to give them feedback that is tied to specific behaviors. Beginning with the basics, the hospitalists we studied introduced themselves to their patients at the initial encounter 78% of the time, less frequently than is done by primary care clinicians (89%) but more consistently than do emergency department providers (64%).[7] Other variables that stood out in the HMCCOT was that teach‐back was employed in only 13% of the encounters. Previous studies have shown that teach‐back corroborates patient comprehension and can be used to engage patients (and caregivers) in realistic goal setting and optimal health service utilization.[14] Further, patients who clearly understand their postdischarge plan are 30% less likely to be readmitted or visit the emergency department.[14] The data for our group have helped us to see areas of strengths, such as hand washing, where we are above compliance rates across hospitals in the United States,[15] as well as those matters that represent opportunities for improvement such as connecting more deeply with our patients.
Tackett et al. have looked at encounter length and its association with performance of etiquette‐based medicine behaviors.[7] Similar to their study, we found a positive correlation between spending more time with patients and higher HMCCOT scores. We also found that HMCCOT scores were higher when providers were caring for new patients. Patients' complaints about doctors often relate to feeling rushed, that their physicians did not listen to them, or that information was not conveyed in a clear manner.[16] Such challenges in physicianpatient communication are ubiquitous across clinical settings.[16] When successfully achieved, patient‐centered communication has been associated with improved clinical outcomes, including adherence to recommended treatment and better self‐management of chronic disease.[17, 18, 19, 20, 21, 22, 23, 24, 25, 26] Many of the components of the HMCCOT described in this article are at the heart of patient‐centered care.
Several limitations of the study should be considered. First, physicians may have behaved differently while they were being observed, which is known as the Hawthorne effect. We observed them for many hours and across multiple patient encounters, and the physicians were not aware of the specific types of data that we were collecting. These factors may have limited the biases along such lines. Second, there may be elements of optimal comportment and communication that were not captured by the HMCCOT. Hopefully, there are not big gaps, as we used multiple methods and an iterative process in the refinement of the HMCCOT metric. Third, one investigator did all of the observing, and it is possible that he might have missed certain behaviors. Through extensive pilot testing and comparisons with other raters, the observer became very skilled and facile with such data collection and the tool. Fourth, we did not survey the same patients that were cared for to compare their perspectives to the HMCCOT scores following the clinical encounters. For patient perspectives, we relied only on PG scores. Fifth, quality of care is a broad and multidimensional construct. The HMCCOT focuses exclusively on hospitalists' comportment and communication at the bedside; therefore, it does not comprehensively assess care quality. Sixth, with our goal to optimally validate the HMCCOT, we tested it on the top tier of hospitalists within each group. We may have observed different results had we randomly selected hospitalists from each hospital or had we conducted the study at hospitals in other geographic regions. Finally, all of the doctors observed worked at hospitals in the Mid‐Atlantic region. However, these five distinct hospitals each have their own cultures, and they are led by different administrators. We purposively chose to sample both academic as well as community settings.
In conclusion, this study reports on the development of a comportment and communication tool that was established and validated by following clinically excellent hospitalists at the bedside. Future studies are necessary to determine whether hospitalists of all levels of experience and clinical skill can improve when given data and feedback using the HMCCOT. Larger studies will then be needed to assess whether enhancing comportment and communication can truly improve patient satisfaction and clinical outcomes in the hospital.
Disclosures: Dr. Wright is a Miller‐Coulson Family Scholar and is supported through the Johns Hopkins Center for Innovative Medicine. Susrutha Kotwal, MD, and Waseem Khaliq, MD, contributed equally to this work. The authors report no conflicts of interest.
- 2014 state of hospital medicine report. Society of Hospital Medicine website. Available at: http://www.hospitalmedicine.org/Web/Practice_Management/State_of_HM_Surveys/2014.aspx. Accessed January 10, 2015.
- Press Ganey website. Available at: http://www.pressganey.com/home. Accessed December 15, 2015.
- Hospital Consumer Assessment of Healthcare Providers and Systems website. Available at: http://www.hcahpsonline.org/home.aspx. Accessed February 2, 2016.
- Membership committee guidelines for hospitalists patient satisfaction surveys. Society of Hospital Medicine website. Available at: http://www.hospitalmedicine.org. Accessed February 2, 2016.
- Definition of comportment. Available at: http://www.vocabulary.com/dictionary/comportment. Accessed December 15, 2015.
- . Etiquette‐based medicine. N Engl J Med. 2008;358(19):1988–1989.
- , , , , . Appraising the practice of etiquette‐based medicine in the inpatient setting. J Gen Intern Med. 2013;28(7):908–913.
- , , . Developing physician communication skills for patient‐centered care. Health Aff (Millwood). 2010;29(7):1310–1318.
- . The impact on patient health outcomes of interventions targeting the patient–physician relationship. Patient. 2009;2(2):77–84.
- , , , , , . Effect on health‐related outcomes of interventions to alter the interaction between patients and practitioners: a systematic review of trials. Ann Fam Med. 2004;2(6):595–608.
- , , , . How does communication heal? Pathways linking clinician–patient communication to health outcomes. Patient Educ Couns. 2009;74(3):295–301.
- , , , . Clinical excellence in academia: perspectives from masterful academic clinicians. Mayo Clin Proc. 2008;83(9):989–994.
- , , , et al. Where did the day go?—a time‐motion study of hospitalists. J Hosp Med. 2010;5(6):323–328.
- , , , et al. Reducing readmissions using teach‐back: enhancing patient and family education. J Nurs Adm. 2015;45(1):35–42.
- , , . Hand hygiene compliance rates in the United States—a one‐year multicenter collaboration using product/volume usage measurement and feedback. Am J Med Qual. 2009;24(3):205–213.
- , , , et al. Obstetricians' prior malpractice experience and patients' satisfaction with care. JAMA. 1994;272(20):1583–1587.
- , . Patient‐Centered Communication in Cancer Care: Promoting Healing and Reducing Suffering. NIH publication no. 07–6225. Bethesda, MD: National Cancer Institute; 2007.
- . Interacting with cancer patients: the significance of physicians' communication behavior. Soc Sci Med. 2003;57(5):791–806.
- , , . Expanding patient involvement in care: effects on patient outcomes. Ann Intern Med. 1985;102(4):520–528.
- , . Measuring patient‐centeredness: a comparison of three observation‐based instruments. Patient Educ Couns. 2000;39(1):71–80.
- , , , . Doctor‐patient communication: a review of the literature. Soc Sci Med. 1995;40(7):903–918.
- , , , , , . Linking primary care performance to outcomes of care. J Fam Pract. 1998;47(3):213–220.
- , , , et al. The impact of patient‐centered care on outcomes. J Fam Pract. 2000;49(9):796–804.
- , , , et al. Measuring patient‐centered communication in patient‐physician consultations: theoretical and practical issues. Soc Sci Med. 2005;61(7):1516–1528.
- , . Patient‐centered consultations and outcomes in primary care: a review of the literature. Patient Educ Couns. 2002;48(1):51–61.
- , , . Doctor‐patient communication and satisfaction with care in oncology. Curr Opin Oncol. 2005;17(4):351–354.
In 2014, there were more than 40,000 hospitalists in the United States, and approximately 20% were employed by academic medical centers.[1] Hospitalist physicians groups are committed to delivering excellent patient care. However, the published literature is limited with respect to defining optimal care in hospital medicine.
Patient satisfaction surveys, such as Press Ganey (PG)[2] and Hospital Consumer Assessment of Healthcare Providers and Systems,[3] are being used to assess patients' contentment with the quality of care they receive while hospitalized. The Society of Hospital Medicine, the largest professional medical society representing hospitalists, encourages the use of patient satisfaction surveys to measure hospitalist providers' quality of patient care.[4] There are, however, several problems with the current methods. First, the attribution to specific providers is questionable. Second, recall about the provider by the patients may be poor because surveys are sent to patients days after they return home. Third, the patients' recovery and health outcomes are likely to influence their assessment of the doctor. Finally, feedback is known to be most valuable and transformative when it is specific and given in real time. Thus, a tool that is able to provide feedback at the encounter level should be more helpful than a tool that offers assessment at the level of the admission, particularly when it can be also delivered immediately after the data are collected.
Comportment has been used to describe both the way a person behaves and also the way she carries herself (ie, her general manner).[5] Excellent comportment and communication can serve as the foundation for delivering patient‐centered care.[6, 7, 8] Patient centeredness has been shown to improve the patient experience and clinical outcomes, including compliance with therapeutic plans.[9, 10, 11] Respectful behavior, etiquette‐based medicine, and effective communication also lay the foundation upon which the therapeutic alliance between a doctor and patient can be built.
The goal of this study was to establish a metric that could comprehensively assess a hospitalist provider's comportment and communication skills during an encounter with a hospitalized patient.
METHODS
Study Design and Setting
An observational study of hospitalist physicians was conducted between June 2013 and December 2013 at 5 hospitals in Maryland and Washington DC. Two are academic medical centers (Johns Hopkins Hospital and Johns Hopkins Bayview Medical Center [JHBMC]), and the others are community hospitals (Howard County General Hospital [HCGH], Sibley Memorial Hospital [SMC], and Suburban Hospital). These 5 hospitals, across 2 large cities, have distinct culture and leadership, each serving different populations.
Subjects
In developing a tool to measure communication and comportment, we needed to observe physicianpatient encounters wherein there would be a good deal of variability in performance. During pilot testing, when following a few of the most senior and respected hospitalists, we noted encounters during which they excelled and others where they performed less optimally. Further, in following some less‐experienced providers, their skills were less developed and they were uniformly missing most of the behaviors on the tool that were believed to be associated with optimal communication and comportment. Because of this, we decided to purposively sample the strongest clinicians at each of the 5 hospitals in hopes of seeing a range of scores on the tool.
The chiefs of hospital medicine at the 5 hospitals were contacted and asked to identify their most clinically excellent hospitalists, namely those who they thought were most clinically skilled within their groups. Because our goal was to observe the top tier (approximately 20%) of the hospitalists within each group, we asked each chief to name a specific number of physicians (eg, 3 names for 1 group with 15 hospitalists, and 8 from another group with 40 physicians). No precise definition of most clinically excellent hospitalists was provided to the chiefs. It was believed that they were well positioned to select their best clinicians because of both subjective feedback and objective data that flow to them. This postulate may have been corroborated by the fact that each of them efficiently sent a list of their top choices without any questions being asked.
The 29 hospitalists (named by their chiefs) were in turn emailed and invited to participate in the study. All but 3 hospitalists consented to participate in the study; this resulted in a cohort of 26 who would be observed.
Tool Development
A team was assembled to develop the hospital medicine comportment and communication observation tool (HMCCOT). All team members had extensive clinical experience, several had published articles on clinical excellence, had won clinical awards, and all had been teaching clinical skills for many years. The team's development of the HMCCOT was extensively informed by a review of the literature. Two articles that most heavily influenced the HMCCOT's development were Christmas et al.'s paper describing 7 core domains of excellence, 2 of which are intimately linked to communication and comportment,[12] and Kahn's text that delineates behaviors to be performed upon entering the patient's room, termed etiquette‐based medicine.[6] The team also considered the work from prior timemotion studies in hospital medicine,[7, 13] which led to the inclusion of temporal measurements during the observations. The tool was also presented at academic conferences in the Division of General Internal Medicine at Johns Hopkins and iteratively revised based on the feedback. Feedback was sought from people who have spent their entire career studying physicianpatient relationships and who are members of the American Academy on Communication in Healthcare. These methods established content validity evidence for the tool under development. The goal of the HMCCOT was to assess behaviors believed to be associated with optimal comportment and communication in hospital medicine.
The HMCCOT was pilot tested by observing different JHBMC hospitalists patient encounters and it was iteratively revised. On multiple occasions, 2 authors/emnvestigators spent time observing JHBMC hospitalists together and compared data capture and levels of agreement across all elements. Then, for formal assessment of inter‐rater reliability, 2 authors observed 5 different hospitalists across 25 patient encounters; the coefficient was 0.91 (standard error = 0.04). This step helped to establish internal structure validity evidence for the tool.
The initial version of the HMCCOT contained 36 elements, and it was organized sequentially to allow the observer to document behaviors in the order that they were likely to occur so as to facilitate the process and to minimize oversight. A few examples of the elements were as follows: open‐ended versus a close‐ended statement at the beginning of the encounter, hospitalist introduces himself/herself, and whether the provider smiles at any point during the patient encounter.
Data Collection
One author scheduled a time to observe each hospitalist physician during their routine clinical care of patients when they were not working with medical learners. Hospitalists were naturally aware that they were being observed but were not aware of the specific data elements or behaviors that were being recorded.
The study was approved by the institutional review board at the Johns Hopkins University School of Medicine, and by each of the research review committees at HCGH, SMC, and Suburban hospitals.
Data Analysis
After data collection, all data were deidentified so that the researchers were blinded to the identities of the physicians. Respondent characteristics are presented as proportions and means. Unpaired t test and 2 tests were used to compare demographic information, and stratified by mean HMCCOT score. The survey data were analyzed using Stata statistical software version 12.1 (StataCorp LP, College Station, TX).
Further Validation of the HMCCOT
Upon reviewing the distribution of data after observing the 26 physicians with their patients, we excluded 13 variables from the initial version of the tool that lacked discriminatory value (eg, 100% or 0% of physicians performed the observed behavior during the encounters); this left 23 variables that were judged to be most clinically relevant in the final version of the HMCCOT. Two examples of the variables that were excluded were: uses technology/literature to educate patients (not witnessed in any encounter), and obeys posted contact precautions (done uniformly by all). The HMCCOT score represents the proportion of observed behaviors (out of the 23 behaviors). It was computed for each hospitalist for every patient encounter. Finally, relation to other variables validity evidence would be established by comparing the mean HMCCOT scores of the physicians to their PG scores from the same time period to evaluate the correlation between the 2 scores. This association was assessed using Pearson correlations.
RESULTS
The average clinical experience of the 26 hospitalist physicians studied was 6 years (Table 1). Their mean age was 38 years, 13 (50%) were female, and 16 (62%) were of nonwhite race. Fourteen hospitalists (54%) worked at 1 of the nonacademic hospitals. In terms of clinical workload, most physicians (n = 17, 65%) devoted more than 70% of their time working in direct patient care. Mean time spent observing each physician was 280 minutes. During this time, the 26 physicians were observed for 181 separate clinical encounters; 54% of these patients were new encounters, patients who were not previously known to the physician. The average time each physician spent in a patient room was 10.8 minutes. Mean number of observed patient encounters per hospitalist was 7.
| Total Study Population, n = 26 | HMCCOT Score 60, n = 14 | HMCCOT Score >60, n = 12 | P Value* | |
|---|---|---|---|---|
| ||||
| Age, mean (SD) | 38 (5.6) | 37.9 (5.6) | 38.1 (5.7) | 0.95 |
| Female, n (%) | 13 (50) | 6 (43) | 7 (58) | 0.43 |
| Race, n (%) | ||||
| Caucasian | 10 (38) | 5 (36) | 5 (41) | 0.31 |
| Asian | 13 (50) | 8 (57) | 5 (41) | |
| African/African American | 2 (8) | 0 (0) | 2 (17) | |
| Other | 1 (4) | 1 (7) | 0 (0) | |
| Clinical experience >6 years, n (%) | 12 (46) | 6 (43) | 6 (50) | 0.72 |
| Clinical workload >70% | 17 (65) | 10 (71) | 7 (58) | 0.48 |
| Academic hospitalist, n (%) | 12 (46) | 5 (36) | 7 (58) | 0.25 |
| Hospital | 0.47 | |||
| JHBMC | 8 (31) | 3 (21.4) | 5 (41) | |
| JHH | 4 (15) | 2 (14.3) | 2 (17) | |
| HCGH | 5 (19) | 3 (21.4) | 2 (17) | |
| Suburban | 6 (23) | 3 (21.4) | 3 (25) | |
| SMC | 3 (12) | 3 (21.4) | 0 (0) | |
| Minutes spent observing hospitalist per shift, mean (SD) | 280 (104.5) | 280.4 (115.5) | 281.4 (95.3) | 0.98 |
| Average time spent per patient encounter in minutes, mean (SD) | 10.8 (8.9) | 8.7 (9.1) | 13 (8.1) | 0.001 |
| Proportion of observed patients who were new to provider, % | 97 (53.5) | 37 (39.7) | 60 (68.1) | 0.001 |
The distribution of HMCCOT scores was not statistically significantly different when analyzed by age, gender, race, amount of clinical experience, clinical workload of the hospitalist, hospital, time spent observing the hospitalist (all P > 0.05). The distribution of HMCCOT scores was statistically different in new patient encounters compared to follow‐ups (68.1% vs 39.7%, P 0.001). Encounters with patients that generated HMCCOT scores above versus below the mean were longer (13 minutes vs 8.7 minutes, P 0.001).
The mean HMCCOT score was 61 (standard deviation [SD] = 10.6), and it was normally distributed (Figure 1). Table 2 shows the data for the 23 behaviors that were objectively assessed as part of the HMCCOT for the 181 patient encounters. The most frequently observed behaviors were physicians washing hands after leaving the patient's room in 170 (94%) of the encounters and smiling (83%). The behaviors that were observed with the least regularity were using an empathic statement (26% of encounters), and employing teach‐back (13% of encounters). A common method of demonstrating interest in the patient as a person, seen in 41% of encounters, involved physicians asking about patients' personal histories and their interests.
| Variables | All Visits Combined, n = 181 | HMCCOT Score <60, n = 93 | HMCCOT Score >60, n = 88 | P Value* |
|---|---|---|---|---|
| ||||
| Objective observations, n (%) | ||||
| Washes hands after leaving room | 170 (94) | 83 (89) | 87 (99) | 0.007 |
| Discusses plan for the day | 163 (91) | 78 (84) | 85 (99) | <0.001 |
| Does not interrupt the patient | 159 (88) | 79 (85) | 80 (91) | 0.21 |
| Smiles | 149 (83) | 71 (77) | 78 (89) | 0.04 |
| Washes hands before entering | 139 (77) | 64 (69) | 75 (85) | 0.009 |
| Begins with open‐ended question | 134 (77) | 68 (76) | 66 (78) | 0.74 |
| Knocks before entering the room | 127 (76) | 57 (65) | 70 (89) | <0.001 |
| Introduces him/herself to the patient | 122 (67) | 45 (48) | 77 (88) | <0.001 |
| Explains his/her role | 120 (66) | 44 (47) | 76 (86) | <0.001 |
| Asks about pain | 110 (61) | 45 (49) | 65 (74) | 0.001 |
| Asks permission prior to examining | 106 (61) | 43 (50) | 63 (72) | 0.002 |
| Uncovers body area for the physical exam | 100 (57) | 34 (38) | 66 (77) | <0.001 |
| Discusses discharge plan | 99 (55) | 38 (41) | 61 (71) | <0.001 |
| Sits down in the patient room | 74 (41) | 24 (26) | 50 (57) | <0.001 |
| Asks about patient's feelings | 58 (33) | 17 (19) | 41 (47) | <0.001 |
| Shakes hands with the patient | 57 (32) | 17 (18) | 40 (46) | <0.001 |
| Uses teach‐back | 24 (13) | 4 (4.3) | 20 (24) | <0.001 |
| Subjective observations, n (%) | ||||
| Avoids medical jargon | 160 (89) | 85 (91) | 83 (95) | 0.28 |
| Demonstrates interest in patient as a person | 72 (41) | 16 (18) | 56 (66) | <0.001 |
| Touches appropriately | 62 (34) | 21 (23) | 41 (47) | 0.001 |
| Shows sensitivity to patient modesty | 57 (93) | 15 (79) | 42 (100) | 0.002 |
| Engages in nonmedical conversation | 54 (30) | 10 (11) | 44 (51) | <0.001 |
| Uses empathic statement | 47 (26) | 9 (10) | 38 (43) | <0.001 |
The average composite PG scores for the physician sample was 38.95 (SD=39.64). A moderate correlation was found between the HMCCOT score and PG score (adjusted Pearson correlation: 0.45, P = 0.047).
DISCUSSION
In this study, we followed 26 hospitalist physicians during routine clinical care, and we focused intently on their communication and their comportment with patients at the bedside. Even among clinically respected hospitalists, the results reveal that there is wide variability in comportment and communication practices and behaviors at the bedside. The physicians' HMCCOT scores were associated with their PG scores. These findings suggest that improved bedside communication and comportment with patients might translate into enhanced patient satisfaction.
This is the first study that honed in on hospitalist communication and comportment. With validity evidence established for the HMCCOT, some may elect to more explicitly perform these behaviors themselves, and others may wish to watch other hospitalists to give them feedback that is tied to specific behaviors. Beginning with the basics, the hospitalists we studied introduced themselves to their patients at the initial encounter 78% of the time, less frequently than is done by primary care clinicians (89%) but more consistently than do emergency department providers (64%).[7] Other variables that stood out in the HMCCOT was that teach‐back was employed in only 13% of the encounters. Previous studies have shown that teach‐back corroborates patient comprehension and can be used to engage patients (and caregivers) in realistic goal setting and optimal health service utilization.[14] Further, patients who clearly understand their postdischarge plan are 30% less likely to be readmitted or visit the emergency department.[14] The data for our group have helped us to see areas of strengths, such as hand washing, where we are above compliance rates across hospitals in the United States,[15] as well as those matters that represent opportunities for improvement such as connecting more deeply with our patients.
Tackett et al. have looked at encounter length and its association with performance of etiquette‐based medicine behaviors.[7] Similar to their study, we found a positive correlation between spending more time with patients and higher HMCCOT scores. We also found that HMCCOT scores were higher when providers were caring for new patients. Patients' complaints about doctors often relate to feeling rushed, that their physicians did not listen to them, or that information was not conveyed in a clear manner.[16] Such challenges in physicianpatient communication are ubiquitous across clinical settings.[16] When successfully achieved, patient‐centered communication has been associated with improved clinical outcomes, including adherence to recommended treatment and better self‐management of chronic disease.[17, 18, 19, 20, 21, 22, 23, 24, 25, 26] Many of the components of the HMCCOT described in this article are at the heart of patient‐centered care.
Several limitations of the study should be considered. First, physicians may have behaved differently while they were being observed, which is known as the Hawthorne effect. We observed them for many hours and across multiple patient encounters, and the physicians were not aware of the specific types of data that we were collecting. These factors may have limited the biases along such lines. Second, there may be elements of optimal comportment and communication that were not captured by the HMCCOT. Hopefully, there are not big gaps, as we used multiple methods and an iterative process in the refinement of the HMCCOT metric. Third, one investigator did all of the observing, and it is possible that he might have missed certain behaviors. Through extensive pilot testing and comparisons with other raters, the observer became very skilled and facile with such data collection and the tool. Fourth, we did not survey the same patients that were cared for to compare their perspectives to the HMCCOT scores following the clinical encounters. For patient perspectives, we relied only on PG scores. Fifth, quality of care is a broad and multidimensional construct. The HMCCOT focuses exclusively on hospitalists' comportment and communication at the bedside; therefore, it does not comprehensively assess care quality. Sixth, with our goal to optimally validate the HMCCOT, we tested it on the top tier of hospitalists within each group. We may have observed different results had we randomly selected hospitalists from each hospital or had we conducted the study at hospitals in other geographic regions. Finally, all of the doctors observed worked at hospitals in the Mid‐Atlantic region. However, these five distinct hospitals each have their own cultures, and they are led by different administrators. We purposively chose to sample both academic as well as community settings.
In conclusion, this study reports on the development of a comportment and communication tool that was established and validated by following clinically excellent hospitalists at the bedside. Future studies are necessary to determine whether hospitalists of all levels of experience and clinical skill can improve when given data and feedback using the HMCCOT. Larger studies will then be needed to assess whether enhancing comportment and communication can truly improve patient satisfaction and clinical outcomes in the hospital.
Disclosures: Dr. Wright is a Miller‐Coulson Family Scholar and is supported through the Johns Hopkins Center for Innovative Medicine. Susrutha Kotwal, MD, and Waseem Khaliq, MD, contributed equally to this work. The authors report no conflicts of interest.
- 2014 state of hospital medicine report. Society of Hospital Medicine website. Available at: http://www.hospitalmedicine.org/Web/Practice_Management/State_of_HM_Surveys/2014.aspx. Accessed January 10, 2015.
- Press Ganey website. Available at: http://www.pressganey.com/home. Accessed December 15, 2015.
- Hospital Consumer Assessment of Healthcare Providers and Systems website. Available at: http://www.hcahpsonline.org/home.aspx. Accessed February 2, 2016.
- Membership committee guidelines for hospitalists patient satisfaction surveys. Society of Hospital Medicine website. Available at: http://www.hospitalmedicine.org. Accessed February 2, 2016.
- Definition of comportment. Available at: http://www.vocabulary.com/dictionary/comportment. Accessed December 15, 2015.
- . Etiquette‐based medicine. N Engl J Med. 2008;358(19):1988–1989.
- , , , , . Appraising the practice of etiquette‐based medicine in the inpatient setting. J Gen Intern Med. 2013;28(7):908–913.
- , , . Developing physician communication skills for patient‐centered care. Health Aff (Millwood). 2010;29(7):1310–1318.
- . The impact on patient health outcomes of interventions targeting the patient–physician relationship. Patient. 2009;2(2):77–84.
- , , , , , . Effect on health‐related outcomes of interventions to alter the interaction between patients and practitioners: a systematic review of trials. Ann Fam Med. 2004;2(6):595–608.
- , , , . How does communication heal? Pathways linking clinician–patient communication to health outcomes. Patient Educ Couns. 2009;74(3):295–301.
- , , , . Clinical excellence in academia: perspectives from masterful academic clinicians. Mayo Clin Proc. 2008;83(9):989–994.
- , , , et al. Where did the day go?—a time‐motion study of hospitalists. J Hosp Med. 2010;5(6):323–328.
- , , , et al. Reducing readmissions using teach‐back: enhancing patient and family education. J Nurs Adm. 2015;45(1):35–42.
- , , . Hand hygiene compliance rates in the United States—a one‐year multicenter collaboration using product/volume usage measurement and feedback. Am J Med Qual. 2009;24(3):205–213.
- , , , et al. Obstetricians' prior malpractice experience and patients' satisfaction with care. JAMA. 1994;272(20):1583–1587.
- , . Patient‐Centered Communication in Cancer Care: Promoting Healing and Reducing Suffering. NIH publication no. 07–6225. Bethesda, MD: National Cancer Institute; 2007.
- . Interacting with cancer patients: the significance of physicians' communication behavior. Soc Sci Med. 2003;57(5):791–806.
- , , . Expanding patient involvement in care: effects on patient outcomes. Ann Intern Med. 1985;102(4):520–528.
- , . Measuring patient‐centeredness: a comparison of three observation‐based instruments. Patient Educ Couns. 2000;39(1):71–80.
- , , , . Doctor‐patient communication: a review of the literature. Soc Sci Med. 1995;40(7):903–918.
- , , , , , . Linking primary care performance to outcomes of care. J Fam Pract. 1998;47(3):213–220.
- , , , et al. The impact of patient‐centered care on outcomes. J Fam Pract. 2000;49(9):796–804.
- , , , et al. Measuring patient‐centered communication in patient‐physician consultations: theoretical and practical issues. Soc Sci Med. 2005;61(7):1516–1528.
- , . Patient‐centered consultations and outcomes in primary care: a review of the literature. Patient Educ Couns. 2002;48(1):51–61.
- , , . Doctor‐patient communication and satisfaction with care in oncology. Curr Opin Oncol. 2005;17(4):351–354.
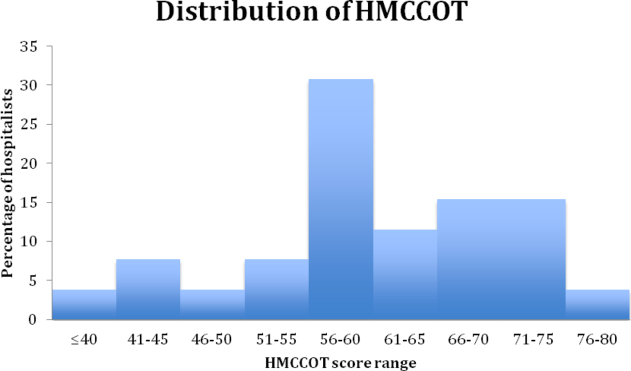
Development and Validation of TAISCH
Patient satisfaction scores are being reported publicly and will affect hospital reimbursement rates under Hospital Value Based Purchasing.[1] Patient satisfaction scores are currently obtained through metrics such as Hospital Consumer Assessment of Healthcare Providers and Systems (HCAHPS)[2] and Press Ganey (PG)[3] surveys. Such surveys are mailed to a variable proportion of patients following their discharge from the hospital, and ask patients about the quality of care they received during their admission. Domains assessed regarding the patients' inpatient experiences range from room cleanliness to the amount of time the physician spent with them.
The Society of Hospital Medicine (SHM), the largest professional medical society representing hospitalists, encourages the use of patient satisfaction surveys to measure hospitalist providers' quality of patient care.[4] Ideally, accurate information would be delivered as feedback to individual providers in a timely manner in hopes of improving performance; however, the current methodology has shortcomings that limit its usefulness. First, several hospitalists and consultants may be involved in the care of 1 patient during the hospital stay, but the score can only be tied to a single physician. Current survey methods attribute all responses to that particular doctor, usually the attending of record, although patients may very well be thinking of other physicians when responding to questions. Second, only a few questions on the surveys ask about doctors' performance. Aforementioned surveys have 3 to 8 questions about doctors' care, which limits the ability to assess physician performance comprehensively. Finally, the surveys are mailed approximately 1 week after the patient's discharge, usually without a name or photograph of the physician to facilitate patient/caregiver recall. This time lag and lack of information to prompt patient recall likely lead to impreciseness in assessment. In addition, the response rates to these surveys are typically low, around 25% (personal oral communication with our division's service excellence stakeholder Dr. L.P. in September 2013). These deficiencies limit the usefulness of such data in coaching individual providers about their performance because they cannot be delivered in a timely fashion, and the reliability of the attribution is suspect.
With these considerations in mind, we developed and validated a new survey metric, the Tool to Assess Inpatient Satisfaction with Care from Hospitalists (TAISCH). We hypothesized that the results would be different from those collected using conventional methodologies.
PATIENTS AND METHODS
Study Design and Subjects
Our cross‐sectional study surveyed inpatients under the care of hospitalist physicians working without the support of trainees or allied health professionals (such as nurse practitioners or physician assistants). The subjects were hospitalized at a 560‐bed academic medical center on a general medical floor between September 2012 and December 2012. All participating hospitalist physicians were members of a division of hospital medicine.
TAISCH Development
Several steps were taken to establish content validity evidence.[5] We developed TAISCH by building upon the theoretical underpinnings of the quality of care measures that are endorsed by the SHM Membership Committee Guidelines for Hospitalists Patient Satisfaction.[4] This directive recommends that patient satisfaction with hospitalist care should be assessed across 6 domains: physician availability, physician concern for patients, physician communication skills, physician courteousness, physician clinical skills, and physician involvement of patients' families. Other existing validated measures tied to the quality of patient care were reviewed, and items related to the physician's care were considered for inclusion to further substantiate content validity.[6, 7, 8, 9, 10, 11, 12] Input from colleagues with expertise in clinical excellence and service excellence was also solicited. This included the director of Hopkins' Miller Coulson Academy of Clinical Excellence and the grant review committee members of the Johns Hopkins Osler Center for Clinical Excellence (who funded this study).[13, 14]
The preliminary instrument contained 17 items, including 2 conditional questions, and was first pilot tested on 5 hospitalized patients. We assessed the time it took to administer the surveys as well as patients' comments and questions about each survey item. This resulted in minor wording changes for clarification and changes in the order of the questions. We then pursued a second phase of piloting using the revised survey, which was administered to >20 patients. There were no further adjustments as patients reported that TAISCH was clear and concise.
From interviews with patients after pilot testing, it became clear that respondents were carefully reflecting on the quality of care and performance of their treating physician, thereby generating response process validity evidence.[5]
Data Collection
To ensure that patients had perspective upon which to base their assessment, they were only asked to appraise physicians after being cared for by the same hospitalist provider for at least 2 consecutive days. Patients who were on isolation, those who were non‐English speaking, and those with impaired decision‐making capacity (such as mental status change or dementia) were excluded. Patients were enrolled only if they could correctly name their doctor or at least identify a photograph of their hospitalist provider on a page that included pictures of all division members. Those patients who were able to name the provider or correctly select the provider from the page of photographs were considered to have correctly identified their provider. In order to ensure the confidentiality of the patients and their responses, all data collections were performed by a trained research assistant who had no patient‐care responsibilities. The survey was confidential, did not include any patient identifiers, and patients were assured that providers would never see their individual responses. The patients were given options to complete TAISCH either by verbally responding to the research assistant's questions, filling out the paper survey, or completing the survey online using an iPad at the bedside. TAISCH specifically asked the patients to rate their hospitalist provider's performance along several domains: communication skills, clinical skills, availability, empathy, courteousness, and discharge planning; 5‐point Likert scales were used exclusively.
In addition to the TAISCH questions, we asked patients (1) an overall satisfaction question, I would recommend Dr. X to my loved ones should he or she need hospitalization in the future (response options: strongly disagree, disagree, neutral, agree, strongly agree), (2) their pain level using the Wong‐Baker pain scale,[15] and (3) the Jefferson Scale of Patient's Perceptions of Physician Empathy (JSPPPE).[16, 17] Associations between TAISCH and these variables (as well as PG data) would be examined to ascertain relations to other variables validity evidence.[5] Specifically, we sought to ascertain discriminant and convergent validity where the TAISCH is associated positively with constructs where we expect positive associations (convergent) and negatively with those we expect negative associations (discriminant).[18] The Wong‐Baker pain scale is a recommended pain‐assessment tool by the Joint Commission on Accreditation of Healthcare Organizations, and is widely used in hospitals and various healthcare settings.[19] The scale has a range from 0 to 10 (0 for no pain and 10 indicating the worst pain). The hypothesis was that the patients' pain levels would adversely affect their perception of the physician's performance (discriminant validity). JSPPPE is a 5‐item validated scale developed to measure patients' perceptions of their physicians' empathic engagement. It has significant correlations with the American Board of Internal Medicine's patient rating surveys, and it is used in standardized patient examinations for medical students.[20] The hypothesis was that patient perception about the quality of physician care would correlate positively with their assessment of the physician's empathy (convergent validity).
Although all of the hospitalist providers in the division consented to participate in this study, only hospitalist providers for whom at least 4 patient surveys were collected were included in the analysis. The study was approved by our institutional review board.
Data Analysis
All data were analyzed using Stata 11 (StataCorp, College Station, TX). Data were analyzed to determine the potential for a single comprehensive assessment of physician performance with confirmatory factor analysis (CFA) using maximum likelihood extraction. Additional factor analyses examined the potential for a multiple factor solution using exploratory factor analysis (EFA) with principle component factor analysis and varimax rotation. Examination of scree plots, factor loadings for individual items greater than 0.40, eigenvalues greater than 1.0, and substantive meaning of the factors were all taken into consideration when determining the number of factors to retain from factor analytic models.[21] Cronbach's s were calculated for each factor to assess reliability. These data provided internal structure validity evidence (demonstrated by acceptable reliability and factor structure) to TAISCH.[5]
After arriving at the final TAISCH scale, composite TAISCH scores were computed. Associations between composite TAISCH scores with the Wong‐Baker pain scale, the JSPPPE, and the overall satisfaction question were assessed using linear regression with the svy command in Stata to account for the nested design of having each patient report on a single hospitalist provider. Correlation between composite TAISCH score and PG physician care scores (comprised of 5 questions: time physician spent with you, physician concern with questions/worries, physician kept you informed, friendliness/courtesy of physician, and skill of physician) were assessed at the provider level when both data were available.
RESULTS
A total of 330 patients were considered to be eligible through medical record screening. Of those patients, 73 (22%) were already discharged by the time the research assistant attempted to enroll them after 2 days of care by a single physician. Of 257 inpatients approached, 30 patients (12%) refused to participate. Among the 227 consented patients, 24 (9%) were excluded as they were unable to correctly identify their hospitalist provider. A total of 203 patients were enrolled, and each patient rated a single hospitalist; a total of 29 unique hospitalists were assessed by these patients. The patients' mean age was 60 years, 114 (56%) were female, and 61 (30%) were of nonwhite race (Table 1). The hospitalist physicians' demographic information is also shown in Table 1. Two hospitalists with fewer than 4 surveys collected were excluded from the analysis. Thus, final analysis included 200 unique patients assessing 1 of the 27 hospitalists (mean=7.4 surveys per hospitalist).
| Characteristics | Value |
|---|---|
| |
| Patients, N=203 | |
| Age, y, mean (SD) | 60.0 (17.2) |
| Female, n (%) | 114 (56.1) |
| Nonwhite race, n (%) | 61 (30.5) |
| Observation stay, n (%) | 45 (22.1) |
| How are you feeling today? n (%) | |
| Very poor | 11 (5.5) |
| Poor | 14 (7.0) |
| Fair | 67 (33.5) |
| Good | 71 (35.5) |
| Very good | 33 (16.5) |
| Excellent | 4 (2.0) |
| Hospitalists, N=29 | |
| Age, n (%) | |
| 2630 years | 7 (24.1) |
| 3135 years | 8 (27.6) |
| 3640 years | 12 (41.4) |
| 4145 years | 2 (6.9) |
| Female, n (%) | 11 (37.9) |
| International medical graduate, n (%) | 18 (62.1) |
| Years in current practice, n (%) | |
| <1 | 9 (31.0) |
| 12 | 7 (24.1) |
| 34 | 6 (20.7) |
| 56 | 5 (17.2) |
| 7 or more | 2 (6.9) |
| Race, n (%) | |
| Caucasian | 4 (13.8) |
| Asian | 19 (65.5) |
| African/African American | 5 (17.2) |
| Other | 1 (3.4) |
| Academic rank, n (%) | |
| Assistant professor | 9 (31.0) |
| Clinical instructor | 10 (34.5) |
| Clinical associate/nonfaculty | 10 (34.5) |
| Percentage of clinical effort, n (%) | |
| >70% | 6 (20.7) |
| 50%70% | 19 (65.5) |
| <50% | 4 (13.8) |
Validation of TAISCH
On the 17‐item TAISCH administered, the 2 conditional questions (When I asked to see Dr. X, s/he came within a reasonable amount of time. and If Dr. X interacted with your family, how well did s/he deal with them?) were applicable to fewer than 40% of patients. As such, they were not included in the analysis.
Internal Structure Validity Evidence
Results from factor analyses are shown in Table 2. The CFA modeling of a single factor solution with 15 items explained 42% of the total variance. The 27 hospitalists' average 15‐item TAISCH score ranged from 3.25 to 4.28 (mean [standard deviation]=3.82 [0.24]; possible score range: 15). Reliability of the 15‐item TAISCH was appropriate (Cronbach's =0.88).
| TAISCH (Cronbach's =0.88) | Factor Loading |
|---|---|
| |
| Compared to all other physicians that you know, how do you rate Dr. X's compassion, empathy, and concern for you?* | 0.91 |
| Compared to all other physicians that you know, how do you rate Dr. X's ability to communicate with you?* | 0.88 |
| Compared to all other physicians that you know, how do you rate Dr. X's skill in diagnosing and treating your medical conditions?* | 0.88 |
| Compared to all other physicians that you know, how do you rate Dr. X's fund of knowledge?* | 0.80 |
| How much confidence do you have in Dr. X's plan for your care? | 0.71 |
| Dr. X kept me informed of the plans for my care. | 0.69 |
| Effectively preparing patients for discharge is an important part of what doctors in the hospital do. How well has Dr. X done in getting you ready to be discharged from the hospital? | 0.67 |
| Dr. X let me talk without interrupting. | 0.60 |
| Dr. X encouraged me to ask questions. | 0.59 |
| Dr. X checks to be sure I understood everything. | 0.55 |
| I sensed Dr. X was in a rush when s/he was with me. (reverse coded) | 0.55 |
| Dr. X showed interest in my views and opinions about my health. | 0.54 |
| Dr. X discusses options with me and involves me in decision making. | 0.47 |
| Dr. X asked permission to enter the room and waited for an answer. | 0.25 |
| Dr. X sat down when s/he visited my bedside. | 0.14 |
As shown in Table 2, 2 variables had factor loadings below the minimum threshold of 0.40 in the CFA for the 15‐item TAISCH when modeling a single factor solution. Both items were related to physician etiquette: Dr. X asked permission to enter the room and waited for an answer. and Dr. X sat down when he/she visited my bedside.
When CFA was executed again, as a single factor omitting the 2 items that demonstrated lower factor loadings, the 13‐item single factor solution explained 47% of the total variance, and the Cronbach's was 0.92.
EFA models were also explored for potential alternate solutions. These analyses resulted in lesser reliability (low Cronbach's ), weak construct operationalization, and poor face validity (as judged by the research team).
Both the 13‐ and 15‐item single factor solutions were examined further to determine whether associations with criterion variables (pain, empathy) differed substantively. Given that results were similar across both solutions, subsequent analyses were completed with the 15‐item single factor solution, which included the etiquette‐related variables.
Relationship to Other Variables Validity Evidence
The association between the 15‐item TAISCH and JSPPPE was significantly positive (=12.2, P<0.001). Additionally, there was a positive and significant association between TAISCH and the overall satisfaction question: I would recommend Dr. X to my loved ones should they need hospitalization in the future. (=11.2, P<0.001). This overall satisfaction question was also associated positively with JSPPPE (=13.2, P<0.001). There was a statistically significant negative association between TAISCH and Wong‐Baker pain scale (=2.42, P<0.05).
The PG data from the same period were available for 24 out of 27 hospitalists. The number of PG surveys collected per provider ranged from 5 to 30 (mean=14). At the provider level, there was not a statistically significant correlation between PG and the 15‐item TAISCH (P=0.51). Of note, PG was also not significantly correlated with the overall satisfaction question, JSPPPE, or the Wong‐Baker pain scale (all P>0.10).
DISCUSSION
Our new metric, TAISCH, was found to be a reliable and valid measurement tool to assess patient satisfaction with the hospitalist physician's care. Because we only surveyed patients who could correctly identify their hospitalist physicians after interacting for at least 2 consecutive days, the attribution of the data to the individual hospitalist is almost certainly correct. The high participation rate indicates that the patients were not hesitant about rating their hospitalist provider's quality of care, even when asked while they were still in the hospital.
The majority of the patients approached were able to correctly identify their hospitalist provider. This rate (91%) was much higher than the rate previously reported in the literature where a picture card was used to improve provider recognition.[22] It is also likely that 1 physician, rather than a team of physicians, taking care of patients make it easier for patients to recall the name and recognize the face of their inpatient provider.
The CFA of TAISCH showed good fit but suggests that 2 variables, both from Kahn's etiquette‐based medicine (EtBM) checklist,[9] may not load in the same way as the other items. Tackett and colleagues reported that hospitalists who performed more EtBM behaviors scored higher on PG evaluations.[23] Such results, along with the comparable explanation of variance and reliability, convinced us to retain these 2 items in the final 15‐item TAISCH as dictated by the CFA. Although the literature supports the fact that physician etiquette is related to perception of high‐quality care, it is possible that these 2 questions were answered differently (and thereby failed to load the same way), because environmental limitations may be preventing physicians' ability to perform them consistently. We prefer the 15‐item version of TAISCH and future studies may provide additional information about its performance as compared to the 13‐item adaptation.
The significantly negative association between the Wong‐Baker pain scale and TAISCH stresses the importance of adequately addressing and treating the patient's pain. Hanna et al. showed that the patients' perceptions of pain control was associated with their overall satisfaction score measured by HCAHPS.[24] The association seen in our study was not unexpected, because TAISCH is administered while the patients are acutely ill in the hospital, when pain is likely more prevalent and severe than it is during the postdischarge settings (when the HCAHPS or PG surveys are administered). Interestingly, Hanna et al. discovered that the team's attention to controlling pain was more strongly correlated with overall satisfaction than was the actual pain control.[24] These data, now confirmed by our study, should serve to remind us that a hospitalist's concern and effort to relieve pain may augment patient satisfaction with the quality of care, even when eliminating the pain may be difficult or impossible.
TAISCH was found not to be correlated with PG scores. Several explanations for this deserve consideration. First, the postdischarge PG survey that is used for our institution does not list the name of the specific hospitalist providers for the patients to evaluate. Because patients encounter multiple physicians during their hospital stay (eg, emergency department physicians, hospitalist providers, consultants), it is possible that patients are not reflecting on the named doctor when assessing the the attending of record on the PG mailed questionnaire. Second, the representation of patients who responded to TAISCH and PG were different; almost all patients completed TAISCH as opposed to a small minority who decide to respond to the PG survey. Third, TAISCH measures the physicians' performance more comprehensively with a larger number of variables. Last, it is possible that we were underpowered to detect significant correlation, because there were only 24 providers who had data from both TAISCH and PG. However, our results endorse using caution in interpreting PG scores for individual hospitalist's performance, particularly for high‐stakes consequences (including the provision of incentives to high performer and the insistence on remediation for low performers).
Several limitations of this study should be considered. First, only hospitalist providers from a single division were assessed. This may limit the generalizability of our findings. Second, although patients were assured about confidentiality of their responses, they might have provided more favorable answers, because they may have felt uncomfortable rating their physician poorly. One review article of the measurement of healthcare satisfaction indicated that impersonal (mailed) methods result in more criticism and lower satisfaction than assessments made in person using interviews. As the trade‐off, the mailed surveys yield lower response rates that may introduce other forms of bias.[25] Even on the HCHAPS survey report for the same period from our institution, 78% of patients gave top box ratings for our doctors' communication skills, which is at the state average.[26] Similarly, a study that used postdischarge telephone interviews to collect patients' satisfaction with hospitalists' care quality reported an average score of 4.20 out of 5.[27] These findings confirm that highly skewed ratings are common for these types of surveys, irrespective of how or when the data are collected.
Despite the aforementioned limitations, TAISCH use need not be limited to hospitalist physicians. It may also be used to assess allied health professionals or trainees performance, which cannot be assessed by HCHAPS or PG. Applying TAISCH in different hospital settings (eg, emergency department or critical care units), assessing hospitalists' reactions to TAISCH, learning whether TAISCH leads to hospitalists' behavior changes or appraising whether performance can improve in response to coaching interventions for those performing poorly are all research questions that merit additional consideration.
CONCLUSION
TAISCH allows for obtaining patient satisfaction data that are highly attributable to specific hospitalist providers. The data collection method also permits high response rates so that input comes from almost all patients. The timeliness of the TAISCH assessments also makes it possible for real‐time service recovery, which is impossible with other commonly used metrics assessing patient satisfaction. Our next step will include testing the most effective way to provide feedback to providers and to coach these individuals so as to improve performance.
Acknowledgements
The authors would like to thank Po‐Han Chen at the BEAD Core for his statistical analysis support.
Disclosures: This study was supported by the Johns Hopkins Osler Center for Clinical Excellence. Dr. Wright is a Miller‐Coulson Family Scholar and is supported through the Johns Hopkins Center for Innovative Medicine. The authors report no conflicts of interest.
- , . Hospital value‐based purchasing. J Hosp Med. 2013;8:271–277.
- HCAHPS survey. Hospital Consumer Assessment of Healthcare Providers and Systems website. Available at: http://www.hcahpsonline.org/home.aspx. Accessed August 27, 2011.
- Press Ganey survey. Press Ganey website. Available at: http://www.pressganey.com/index.aspx. Accessed February 12, 2013.
- Society of Hospital Medicine. Membership Committee Guidelines for Hospitalists Patient Satisfaction Surveys. Available at: http://www.hospitalmedicine.org/AM/Template.cfm?Section=Practice_Resources119:166.e7–e16.
- , , . Measuring patient views of physician communication skills: development and testing of the Communication Assessment Tool. Patient Educ Couns. 2007;67:333–342.
- , , . The Picker Patient Experience Questionnaire: development and validation using data from in‐patient surveys in five countries. Int J Qual Health Care. 2002;14:353–358.
- The Patient Satisfaction Questionnaire from RAND Health. RAND Health website. Available at: http://www.rand.org/health/surveys_tools/psq.html. Accessed December 30, 2011.
- . Etiquette‐based medicine. N Engl J Med. 2008;358:1988–1989.
- , , , . Defining clinical excellence in academic medicine: a qualitative study of the master clinicians. Mayo Clin Proc. 2008;83:989–994.
- , , , , . Creating an academy of clinical excellence at Johns Hopkins Bayview Medical Center: a 3‐year experience. Acad Med. 2010;85:1833–1839.
- , , , , . Patients' perspectives on ideal physician behaviors. Mayo Clin Proc. 2006;81(3):338–344.
- The Miller‐Coulson Academy of Clinical Excellence at Johns Hopkins. Available at: http://www.hopkinsmedicine.org/innovative/signature_programs/academy_of_clinical_excellence/. Accessed April 25, 2014.
- Osler Center for Clinical Excellence at Johns Hopkins. Available at: http://www.hopkinsmedicine.org/johns_hopkins_bayview/education_training/continuing_education/osler_center_for_clinical_excellence. Accessed April 25, 2014.
- Wong‐Baker FACES Foundation. Available at: http://www.wongbakerfaces.org. Accessed July 8, 2013.
- , , , , . Jefferson Scale of Patient's Perceptions of Physician Empathy: preliminary psychometric data. Croat Med J. 2007;48:81–86.
- , , , , . Relationships between scores on the Jefferson Scale of Physician Empathy, patient perceptions of physician empathy, and humanistic approaches to patient care: a validity study. Med Sci Monit. 2007;13(7):CR291–CR294.
- , . Convergent and discriminant validation by the multitrait‐multimethod matrix. Psychol Bul. 1959;56(2):81–105.
- The Joint Commission. Facts about pain management. Available at: http://www.jointcommission.org/pain_management. Accessed April 25, 2014.
- , , , et al. Medical students' self‐reported empathy and simulated patients' assessments of student empathy: an analysis by gender and ethnicity. Acad Med. 2011;86(8):984–988.
- . Factor Analysis. Hillsdale, NJ: Lawrence Erlbaum Associates; 1983.
- , , , et al. Improving inpatients' identification of their doctors: use of FACE cards. Jt Comm J Qual Pateint Saf. 1009;35(12):613–619.
- , , et al. Appraising the practice of etiquette‐based medicine in the inpatient setting. J Gen Intern Med. 2013;28(7):908–913.
- , , , et al. Does patient perception of pain control affect patient satisfaction across surgical units in a tertiary teaching hospital? Am J Med Qual. 2012;27:411–416.
- , , , et al. The measurement of satisfaction with health care: implications for practice from a systematic review of the literature. Health Technol Assess. 2002;6(32):1–244.
- Centers for Medicare 7(2):131–136.
Patient satisfaction scores are being reported publicly and will affect hospital reimbursement rates under Hospital Value Based Purchasing.[1] Patient satisfaction scores are currently obtained through metrics such as Hospital Consumer Assessment of Healthcare Providers and Systems (HCAHPS)[2] and Press Ganey (PG)[3] surveys. Such surveys are mailed to a variable proportion of patients following their discharge from the hospital, and ask patients about the quality of care they received during their admission. Domains assessed regarding the patients' inpatient experiences range from room cleanliness to the amount of time the physician spent with them.
The Society of Hospital Medicine (SHM), the largest professional medical society representing hospitalists, encourages the use of patient satisfaction surveys to measure hospitalist providers' quality of patient care.[4] Ideally, accurate information would be delivered as feedback to individual providers in a timely manner in hopes of improving performance; however, the current methodology has shortcomings that limit its usefulness. First, several hospitalists and consultants may be involved in the care of 1 patient during the hospital stay, but the score can only be tied to a single physician. Current survey methods attribute all responses to that particular doctor, usually the attending of record, although patients may very well be thinking of other physicians when responding to questions. Second, only a few questions on the surveys ask about doctors' performance. Aforementioned surveys have 3 to 8 questions about doctors' care, which limits the ability to assess physician performance comprehensively. Finally, the surveys are mailed approximately 1 week after the patient's discharge, usually without a name or photograph of the physician to facilitate patient/caregiver recall. This time lag and lack of information to prompt patient recall likely lead to impreciseness in assessment. In addition, the response rates to these surveys are typically low, around 25% (personal oral communication with our division's service excellence stakeholder Dr. L.P. in September 2013). These deficiencies limit the usefulness of such data in coaching individual providers about their performance because they cannot be delivered in a timely fashion, and the reliability of the attribution is suspect.
With these considerations in mind, we developed and validated a new survey metric, the Tool to Assess Inpatient Satisfaction with Care from Hospitalists (TAISCH). We hypothesized that the results would be different from those collected using conventional methodologies.
PATIENTS AND METHODS
Study Design and Subjects
Our cross‐sectional study surveyed inpatients under the care of hospitalist physicians working without the support of trainees or allied health professionals (such as nurse practitioners or physician assistants). The subjects were hospitalized at a 560‐bed academic medical center on a general medical floor between September 2012 and December 2012. All participating hospitalist physicians were members of a division of hospital medicine.
TAISCH Development
Several steps were taken to establish content validity evidence.[5] We developed TAISCH by building upon the theoretical underpinnings of the quality of care measures that are endorsed by the SHM Membership Committee Guidelines for Hospitalists Patient Satisfaction.[4] This directive recommends that patient satisfaction with hospitalist care should be assessed across 6 domains: physician availability, physician concern for patients, physician communication skills, physician courteousness, physician clinical skills, and physician involvement of patients' families. Other existing validated measures tied to the quality of patient care were reviewed, and items related to the physician's care were considered for inclusion to further substantiate content validity.[6, 7, 8, 9, 10, 11, 12] Input from colleagues with expertise in clinical excellence and service excellence was also solicited. This included the director of Hopkins' Miller Coulson Academy of Clinical Excellence and the grant review committee members of the Johns Hopkins Osler Center for Clinical Excellence (who funded this study).[13, 14]
The preliminary instrument contained 17 items, including 2 conditional questions, and was first pilot tested on 5 hospitalized patients. We assessed the time it took to administer the surveys as well as patients' comments and questions about each survey item. This resulted in minor wording changes for clarification and changes in the order of the questions. We then pursued a second phase of piloting using the revised survey, which was administered to >20 patients. There were no further adjustments as patients reported that TAISCH was clear and concise.
From interviews with patients after pilot testing, it became clear that respondents were carefully reflecting on the quality of care and performance of their treating physician, thereby generating response process validity evidence.[5]
Data Collection
To ensure that patients had perspective upon which to base their assessment, they were only asked to appraise physicians after being cared for by the same hospitalist provider for at least 2 consecutive days. Patients who were on isolation, those who were non‐English speaking, and those with impaired decision‐making capacity (such as mental status change or dementia) were excluded. Patients were enrolled only if they could correctly name their doctor or at least identify a photograph of their hospitalist provider on a page that included pictures of all division members. Those patients who were able to name the provider or correctly select the provider from the page of photographs were considered to have correctly identified their provider. In order to ensure the confidentiality of the patients and their responses, all data collections were performed by a trained research assistant who had no patient‐care responsibilities. The survey was confidential, did not include any patient identifiers, and patients were assured that providers would never see their individual responses. The patients were given options to complete TAISCH either by verbally responding to the research assistant's questions, filling out the paper survey, or completing the survey online using an iPad at the bedside. TAISCH specifically asked the patients to rate their hospitalist provider's performance along several domains: communication skills, clinical skills, availability, empathy, courteousness, and discharge planning; 5‐point Likert scales were used exclusively.
In addition to the TAISCH questions, we asked patients (1) an overall satisfaction question, I would recommend Dr. X to my loved ones should he or she need hospitalization in the future (response options: strongly disagree, disagree, neutral, agree, strongly agree), (2) their pain level using the Wong‐Baker pain scale,[15] and (3) the Jefferson Scale of Patient's Perceptions of Physician Empathy (JSPPPE).[16, 17] Associations between TAISCH and these variables (as well as PG data) would be examined to ascertain relations to other variables validity evidence.[5] Specifically, we sought to ascertain discriminant and convergent validity where the TAISCH is associated positively with constructs where we expect positive associations (convergent) and negatively with those we expect negative associations (discriminant).[18] The Wong‐Baker pain scale is a recommended pain‐assessment tool by the Joint Commission on Accreditation of Healthcare Organizations, and is widely used in hospitals and various healthcare settings.[19] The scale has a range from 0 to 10 (0 for no pain and 10 indicating the worst pain). The hypothesis was that the patients' pain levels would adversely affect their perception of the physician's performance (discriminant validity). JSPPPE is a 5‐item validated scale developed to measure patients' perceptions of their physicians' empathic engagement. It has significant correlations with the American Board of Internal Medicine's patient rating surveys, and it is used in standardized patient examinations for medical students.[20] The hypothesis was that patient perception about the quality of physician care would correlate positively with their assessment of the physician's empathy (convergent validity).
Although all of the hospitalist providers in the division consented to participate in this study, only hospitalist providers for whom at least 4 patient surveys were collected were included in the analysis. The study was approved by our institutional review board.
Data Analysis
All data were analyzed using Stata 11 (StataCorp, College Station, TX). Data were analyzed to determine the potential for a single comprehensive assessment of physician performance with confirmatory factor analysis (CFA) using maximum likelihood extraction. Additional factor analyses examined the potential for a multiple factor solution using exploratory factor analysis (EFA) with principle component factor analysis and varimax rotation. Examination of scree plots, factor loadings for individual items greater than 0.40, eigenvalues greater than 1.0, and substantive meaning of the factors were all taken into consideration when determining the number of factors to retain from factor analytic models.[21] Cronbach's s were calculated for each factor to assess reliability. These data provided internal structure validity evidence (demonstrated by acceptable reliability and factor structure) to TAISCH.[5]
After arriving at the final TAISCH scale, composite TAISCH scores were computed. Associations between composite TAISCH scores with the Wong‐Baker pain scale, the JSPPPE, and the overall satisfaction question were assessed using linear regression with the svy command in Stata to account for the nested design of having each patient report on a single hospitalist provider. Correlation between composite TAISCH score and PG physician care scores (comprised of 5 questions: time physician spent with you, physician concern with questions/worries, physician kept you informed, friendliness/courtesy of physician, and skill of physician) were assessed at the provider level when both data were available.
RESULTS
A total of 330 patients were considered to be eligible through medical record screening. Of those patients, 73 (22%) were already discharged by the time the research assistant attempted to enroll them after 2 days of care by a single physician. Of 257 inpatients approached, 30 patients (12%) refused to participate. Among the 227 consented patients, 24 (9%) were excluded as they were unable to correctly identify their hospitalist provider. A total of 203 patients were enrolled, and each patient rated a single hospitalist; a total of 29 unique hospitalists were assessed by these patients. The patients' mean age was 60 years, 114 (56%) were female, and 61 (30%) were of nonwhite race (Table 1). The hospitalist physicians' demographic information is also shown in Table 1. Two hospitalists with fewer than 4 surveys collected were excluded from the analysis. Thus, final analysis included 200 unique patients assessing 1 of the 27 hospitalists (mean=7.4 surveys per hospitalist).
| Characteristics | Value |
|---|---|
| |
| Patients, N=203 | |
| Age, y, mean (SD) | 60.0 (17.2) |
| Female, n (%) | 114 (56.1) |
| Nonwhite race, n (%) | 61 (30.5) |
| Observation stay, n (%) | 45 (22.1) |
| How are you feeling today? n (%) | |
| Very poor | 11 (5.5) |
| Poor | 14 (7.0) |
| Fair | 67 (33.5) |
| Good | 71 (35.5) |
| Very good | 33 (16.5) |
| Excellent | 4 (2.0) |
| Hospitalists, N=29 | |
| Age, n (%) | |
| 2630 years | 7 (24.1) |
| 3135 years | 8 (27.6) |
| 3640 years | 12 (41.4) |
| 4145 years | 2 (6.9) |
| Female, n (%) | 11 (37.9) |
| International medical graduate, n (%) | 18 (62.1) |
| Years in current practice, n (%) | |
| <1 | 9 (31.0) |
| 12 | 7 (24.1) |
| 34 | 6 (20.7) |
| 56 | 5 (17.2) |
| 7 or more | 2 (6.9) |
| Race, n (%) | |
| Caucasian | 4 (13.8) |
| Asian | 19 (65.5) |
| African/African American | 5 (17.2) |
| Other | 1 (3.4) |
| Academic rank, n (%) | |
| Assistant professor | 9 (31.0) |
| Clinical instructor | 10 (34.5) |
| Clinical associate/nonfaculty | 10 (34.5) |
| Percentage of clinical effort, n (%) | |
| >70% | 6 (20.7) |
| 50%70% | 19 (65.5) |
| <50% | 4 (13.8) |
Validation of TAISCH
On the 17‐item TAISCH administered, the 2 conditional questions (When I asked to see Dr. X, s/he came within a reasonable amount of time. and If Dr. X interacted with your family, how well did s/he deal with them?) were applicable to fewer than 40% of patients. As such, they were not included in the analysis.
Internal Structure Validity Evidence
Results from factor analyses are shown in Table 2. The CFA modeling of a single factor solution with 15 items explained 42% of the total variance. The 27 hospitalists' average 15‐item TAISCH score ranged from 3.25 to 4.28 (mean [standard deviation]=3.82 [0.24]; possible score range: 15). Reliability of the 15‐item TAISCH was appropriate (Cronbach's =0.88).
| TAISCH (Cronbach's =0.88) | Factor Loading |
|---|---|
| |
| Compared to all other physicians that you know, how do you rate Dr. X's compassion, empathy, and concern for you?* | 0.91 |
| Compared to all other physicians that you know, how do you rate Dr. X's ability to communicate with you?* | 0.88 |
| Compared to all other physicians that you know, how do you rate Dr. X's skill in diagnosing and treating your medical conditions?* | 0.88 |
| Compared to all other physicians that you know, how do you rate Dr. X's fund of knowledge?* | 0.80 |
| How much confidence do you have in Dr. X's plan for your care? | 0.71 |
| Dr. X kept me informed of the plans for my care. | 0.69 |
| Effectively preparing patients for discharge is an important part of what doctors in the hospital do. How well has Dr. X done in getting you ready to be discharged from the hospital? | 0.67 |
| Dr. X let me talk without interrupting. | 0.60 |
| Dr. X encouraged me to ask questions. | 0.59 |
| Dr. X checks to be sure I understood everything. | 0.55 |
| I sensed Dr. X was in a rush when s/he was with me. (reverse coded) | 0.55 |
| Dr. X showed interest in my views and opinions about my health. | 0.54 |
| Dr. X discusses options with me and involves me in decision making. | 0.47 |
| Dr. X asked permission to enter the room and waited for an answer. | 0.25 |
| Dr. X sat down when s/he visited my bedside. | 0.14 |
As shown in Table 2, 2 variables had factor loadings below the minimum threshold of 0.40 in the CFA for the 15‐item TAISCH when modeling a single factor solution. Both items were related to physician etiquette: Dr. X asked permission to enter the room and waited for an answer. and Dr. X sat down when he/she visited my bedside.
When CFA was executed again, as a single factor omitting the 2 items that demonstrated lower factor loadings, the 13‐item single factor solution explained 47% of the total variance, and the Cronbach's was 0.92.
EFA models were also explored for potential alternate solutions. These analyses resulted in lesser reliability (low Cronbach's ), weak construct operationalization, and poor face validity (as judged by the research team).
Both the 13‐ and 15‐item single factor solutions were examined further to determine whether associations with criterion variables (pain, empathy) differed substantively. Given that results were similar across both solutions, subsequent analyses were completed with the 15‐item single factor solution, which included the etiquette‐related variables.
Relationship to Other Variables Validity Evidence
The association between the 15‐item TAISCH and JSPPPE was significantly positive (=12.2, P<0.001). Additionally, there was a positive and significant association between TAISCH and the overall satisfaction question: I would recommend Dr. X to my loved ones should they need hospitalization in the future. (=11.2, P<0.001). This overall satisfaction question was also associated positively with JSPPPE (=13.2, P<0.001). There was a statistically significant negative association between TAISCH and Wong‐Baker pain scale (=2.42, P<0.05).
The PG data from the same period were available for 24 out of 27 hospitalists. The number of PG surveys collected per provider ranged from 5 to 30 (mean=14). At the provider level, there was not a statistically significant correlation between PG and the 15‐item TAISCH (P=0.51). Of note, PG was also not significantly correlated with the overall satisfaction question, JSPPPE, or the Wong‐Baker pain scale (all P>0.10).
DISCUSSION
Our new metric, TAISCH, was found to be a reliable and valid measurement tool to assess patient satisfaction with the hospitalist physician's care. Because we only surveyed patients who could correctly identify their hospitalist physicians after interacting for at least 2 consecutive days, the attribution of the data to the individual hospitalist is almost certainly correct. The high participation rate indicates that the patients were not hesitant about rating their hospitalist provider's quality of care, even when asked while they were still in the hospital.
The majority of the patients approached were able to correctly identify their hospitalist provider. This rate (91%) was much higher than the rate previously reported in the literature where a picture card was used to improve provider recognition.[22] It is also likely that 1 physician, rather than a team of physicians, taking care of patients make it easier for patients to recall the name and recognize the face of their inpatient provider.
The CFA of TAISCH showed good fit but suggests that 2 variables, both from Kahn's etiquette‐based medicine (EtBM) checklist,[9] may not load in the same way as the other items. Tackett and colleagues reported that hospitalists who performed more EtBM behaviors scored higher on PG evaluations.[23] Such results, along with the comparable explanation of variance and reliability, convinced us to retain these 2 items in the final 15‐item TAISCH as dictated by the CFA. Although the literature supports the fact that physician etiquette is related to perception of high‐quality care, it is possible that these 2 questions were answered differently (and thereby failed to load the same way), because environmental limitations may be preventing physicians' ability to perform them consistently. We prefer the 15‐item version of TAISCH and future studies may provide additional information about its performance as compared to the 13‐item adaptation.
The significantly negative association between the Wong‐Baker pain scale and TAISCH stresses the importance of adequately addressing and treating the patient's pain. Hanna et al. showed that the patients' perceptions of pain control was associated with their overall satisfaction score measured by HCAHPS.[24] The association seen in our study was not unexpected, because TAISCH is administered while the patients are acutely ill in the hospital, when pain is likely more prevalent and severe than it is during the postdischarge settings (when the HCAHPS or PG surveys are administered). Interestingly, Hanna et al. discovered that the team's attention to controlling pain was more strongly correlated with overall satisfaction than was the actual pain control.[24] These data, now confirmed by our study, should serve to remind us that a hospitalist's concern and effort to relieve pain may augment patient satisfaction with the quality of care, even when eliminating the pain may be difficult or impossible.
TAISCH was found not to be correlated with PG scores. Several explanations for this deserve consideration. First, the postdischarge PG survey that is used for our institution does not list the name of the specific hospitalist providers for the patients to evaluate. Because patients encounter multiple physicians during their hospital stay (eg, emergency department physicians, hospitalist providers, consultants), it is possible that patients are not reflecting on the named doctor when assessing the the attending of record on the PG mailed questionnaire. Second, the representation of patients who responded to TAISCH and PG were different; almost all patients completed TAISCH as opposed to a small minority who decide to respond to the PG survey. Third, TAISCH measures the physicians' performance more comprehensively with a larger number of variables. Last, it is possible that we were underpowered to detect significant correlation, because there were only 24 providers who had data from both TAISCH and PG. However, our results endorse using caution in interpreting PG scores for individual hospitalist's performance, particularly for high‐stakes consequences (including the provision of incentives to high performer and the insistence on remediation for low performers).
Several limitations of this study should be considered. First, only hospitalist providers from a single division were assessed. This may limit the generalizability of our findings. Second, although patients were assured about confidentiality of their responses, they might have provided more favorable answers, because they may have felt uncomfortable rating their physician poorly. One review article of the measurement of healthcare satisfaction indicated that impersonal (mailed) methods result in more criticism and lower satisfaction than assessments made in person using interviews. As the trade‐off, the mailed surveys yield lower response rates that may introduce other forms of bias.[25] Even on the HCHAPS survey report for the same period from our institution, 78% of patients gave top box ratings for our doctors' communication skills, which is at the state average.[26] Similarly, a study that used postdischarge telephone interviews to collect patients' satisfaction with hospitalists' care quality reported an average score of 4.20 out of 5.[27] These findings confirm that highly skewed ratings are common for these types of surveys, irrespective of how or when the data are collected.
Despite the aforementioned limitations, TAISCH use need not be limited to hospitalist physicians. It may also be used to assess allied health professionals or trainees performance, which cannot be assessed by HCHAPS or PG. Applying TAISCH in different hospital settings (eg, emergency department or critical care units), assessing hospitalists' reactions to TAISCH, learning whether TAISCH leads to hospitalists' behavior changes or appraising whether performance can improve in response to coaching interventions for those performing poorly are all research questions that merit additional consideration.
CONCLUSION
TAISCH allows for obtaining patient satisfaction data that are highly attributable to specific hospitalist providers. The data collection method also permits high response rates so that input comes from almost all patients. The timeliness of the TAISCH assessments also makes it possible for real‐time service recovery, which is impossible with other commonly used metrics assessing patient satisfaction. Our next step will include testing the most effective way to provide feedback to providers and to coach these individuals so as to improve performance.
Acknowledgements
The authors would like to thank Po‐Han Chen at the BEAD Core for his statistical analysis support.
Disclosures: This study was supported by the Johns Hopkins Osler Center for Clinical Excellence. Dr. Wright is a Miller‐Coulson Family Scholar and is supported through the Johns Hopkins Center for Innovative Medicine. The authors report no conflicts of interest.
- , . Hospital value‐based purchasing. J Hosp Med. 2013;8:271–277.
- HCAHPS survey. Hospital Consumer Assessment of Healthcare Providers and Systems website. Available at: http://www.hcahpsonline.org/home.aspx. Accessed August 27, 2011.
- Press Ganey survey. Press Ganey website. Available at: http://www.pressganey.com/index.aspx. Accessed February 12, 2013.
- Society of Hospital Medicine. Membership Committee Guidelines for Hospitalists Patient Satisfaction Surveys. Available at: http://www.hospitalmedicine.org/AM/Template.cfm?Section=Practice_Resources119:166.e7–e16.
- , , . Measuring patient views of physician communication skills: development and testing of the Communication Assessment Tool. Patient Educ Couns. 2007;67:333–342.
- , , . The Picker Patient Experience Questionnaire: development and validation using data from in‐patient surveys in five countries. Int J Qual Health Care. 2002;14:353–358.
- The Patient Satisfaction Questionnaire from RAND Health. RAND Health website. Available at: http://www.rand.org/health/surveys_tools/psq.html. Accessed December 30, 2011.
- . Etiquette‐based medicine. N Engl J Med. 2008;358:1988–1989.
- , , , . Defining clinical excellence in academic medicine: a qualitative study of the master clinicians. Mayo Clin Proc. 2008;83:989–994.
- , , , , . Creating an academy of clinical excellence at Johns Hopkins Bayview Medical Center: a 3‐year experience. Acad Med. 2010;85:1833–1839.
- , , , , . Patients' perspectives on ideal physician behaviors. Mayo Clin Proc. 2006;81(3):338–344.
- The Miller‐Coulson Academy of Clinical Excellence at Johns Hopkins. Available at: http://www.hopkinsmedicine.org/innovative/signature_programs/academy_of_clinical_excellence/. Accessed April 25, 2014.
- Osler Center for Clinical Excellence at Johns Hopkins. Available at: http://www.hopkinsmedicine.org/johns_hopkins_bayview/education_training/continuing_education/osler_center_for_clinical_excellence. Accessed April 25, 2014.
- Wong‐Baker FACES Foundation. Available at: http://www.wongbakerfaces.org. Accessed July 8, 2013.
- , , , , . Jefferson Scale of Patient's Perceptions of Physician Empathy: preliminary psychometric data. Croat Med J. 2007;48:81–86.
- , , , , . Relationships between scores on the Jefferson Scale of Physician Empathy, patient perceptions of physician empathy, and humanistic approaches to patient care: a validity study. Med Sci Monit. 2007;13(7):CR291–CR294.
- , . Convergent and discriminant validation by the multitrait‐multimethod matrix. Psychol Bul. 1959;56(2):81–105.
- The Joint Commission. Facts about pain management. Available at: http://www.jointcommission.org/pain_management. Accessed April 25, 2014.
- , , , et al. Medical students' self‐reported empathy and simulated patients' assessments of student empathy: an analysis by gender and ethnicity. Acad Med. 2011;86(8):984–988.
- . Factor Analysis. Hillsdale, NJ: Lawrence Erlbaum Associates; 1983.
- , , , et al. Improving inpatients' identification of their doctors: use of FACE cards. Jt Comm J Qual Pateint Saf. 1009;35(12):613–619.
- , , et al. Appraising the practice of etiquette‐based medicine in the inpatient setting. J Gen Intern Med. 2013;28(7):908–913.
- , , , et al. Does patient perception of pain control affect patient satisfaction across surgical units in a tertiary teaching hospital? Am J Med Qual. 2012;27:411–416.
- , , , et al. The measurement of satisfaction with health care: implications for practice from a systematic review of the literature. Health Technol Assess. 2002;6(32):1–244.
- Centers for Medicare 7(2):131–136.
© 2014 Society of Hospital Medicine