User login
Comportment and Communication Score
In 2014, there were more than 40,000 hospitalists in the United States, and approximately 20% were employed by academic medical centers.[1] Hospitalist physicians groups are committed to delivering excellent patient care. However, the published literature is limited with respect to defining optimal care in hospital medicine.
Patient satisfaction surveys, such as Press Ganey (PG)[2] and Hospital Consumer Assessment of Healthcare Providers and Systems,[3] are being used to assess patients' contentment with the quality of care they receive while hospitalized. The Society of Hospital Medicine, the largest professional medical society representing hospitalists, encourages the use of patient satisfaction surveys to measure hospitalist providers' quality of patient care.[4] There are, however, several problems with the current methods. First, the attribution to specific providers is questionable. Second, recall about the provider by the patients may be poor because surveys are sent to patients days after they return home. Third, the patients' recovery and health outcomes are likely to influence their assessment of the doctor. Finally, feedback is known to be most valuable and transformative when it is specific and given in real time. Thus, a tool that is able to provide feedback at the encounter level should be more helpful than a tool that offers assessment at the level of the admission, particularly when it can be also delivered immediately after the data are collected.
Comportment has been used to describe both the way a person behaves and also the way she carries herself (ie, her general manner).[5] Excellent comportment and communication can serve as the foundation for delivering patient‐centered care.[6, 7, 8] Patient centeredness has been shown to improve the patient experience and clinical outcomes, including compliance with therapeutic plans.[9, 10, 11] Respectful behavior, etiquette‐based medicine, and effective communication also lay the foundation upon which the therapeutic alliance between a doctor and patient can be built.
The goal of this study was to establish a metric that could comprehensively assess a hospitalist provider's comportment and communication skills during an encounter with a hospitalized patient.
METHODS
Study Design and Setting
An observational study of hospitalist physicians was conducted between June 2013 and December 2013 at 5 hospitals in Maryland and Washington DC. Two are academic medical centers (Johns Hopkins Hospital and Johns Hopkins Bayview Medical Center [JHBMC]), and the others are community hospitals (Howard County General Hospital [HCGH], Sibley Memorial Hospital [SMC], and Suburban Hospital). These 5 hospitals, across 2 large cities, have distinct culture and leadership, each serving different populations.
Subjects
In developing a tool to measure communication and comportment, we needed to observe physicianpatient encounters wherein there would be a good deal of variability in performance. During pilot testing, when following a few of the most senior and respected hospitalists, we noted encounters during which they excelled and others where they performed less optimally. Further, in following some less‐experienced providers, their skills were less developed and they were uniformly missing most of the behaviors on the tool that were believed to be associated with optimal communication and comportment. Because of this, we decided to purposively sample the strongest clinicians at each of the 5 hospitals in hopes of seeing a range of scores on the tool.
The chiefs of hospital medicine at the 5 hospitals were contacted and asked to identify their most clinically excellent hospitalists, namely those who they thought were most clinically skilled within their groups. Because our goal was to observe the top tier (approximately 20%) of the hospitalists within each group, we asked each chief to name a specific number of physicians (eg, 3 names for 1 group with 15 hospitalists, and 8 from another group with 40 physicians). No precise definition of most clinically excellent hospitalists was provided to the chiefs. It was believed that they were well positioned to select their best clinicians because of both subjective feedback and objective data that flow to them. This postulate may have been corroborated by the fact that each of them efficiently sent a list of their top choices without any questions being asked.
The 29 hospitalists (named by their chiefs) were in turn emailed and invited to participate in the study. All but 3 hospitalists consented to participate in the study; this resulted in a cohort of 26 who would be observed.
Tool Development
A team was assembled to develop the hospital medicine comportment and communication observation tool (HMCCOT). All team members had extensive clinical experience, several had published articles on clinical excellence, had won clinical awards, and all had been teaching clinical skills for many years. The team's development of the HMCCOT was extensively informed by a review of the literature. Two articles that most heavily influenced the HMCCOT's development were Christmas et al.'s paper describing 7 core domains of excellence, 2 of which are intimately linked to communication and comportment,[12] and Kahn's text that delineates behaviors to be performed upon entering the patient's room, termed etiquette‐based medicine.[6] The team also considered the work from prior timemotion studies in hospital medicine,[7, 13] which led to the inclusion of temporal measurements during the observations. The tool was also presented at academic conferences in the Division of General Internal Medicine at Johns Hopkins and iteratively revised based on the feedback. Feedback was sought from people who have spent their entire career studying physicianpatient relationships and who are members of the American Academy on Communication in Healthcare. These methods established content validity evidence for the tool under development. The goal of the HMCCOT was to assess behaviors believed to be associated with optimal comportment and communication in hospital medicine.
The HMCCOT was pilot tested by observing different JHBMC hospitalists patient encounters and it was iteratively revised. On multiple occasions, 2 authors/emnvestigators spent time observing JHBMC hospitalists together and compared data capture and levels of agreement across all elements. Then, for formal assessment of inter‐rater reliability, 2 authors observed 5 different hospitalists across 25 patient encounters; the coefficient was 0.91 (standard error = 0.04). This step helped to establish internal structure validity evidence for the tool.
The initial version of the HMCCOT contained 36 elements, and it was organized sequentially to allow the observer to document behaviors in the order that they were likely to occur so as to facilitate the process and to minimize oversight. A few examples of the elements were as follows: open‐ended versus a close‐ended statement at the beginning of the encounter, hospitalist introduces himself/herself, and whether the provider smiles at any point during the patient encounter.
Data Collection
One author scheduled a time to observe each hospitalist physician during their routine clinical care of patients when they were not working with medical learners. Hospitalists were naturally aware that they were being observed but were not aware of the specific data elements or behaviors that were being recorded.
The study was approved by the institutional review board at the Johns Hopkins University School of Medicine, and by each of the research review committees at HCGH, SMC, and Suburban hospitals.
Data Analysis
After data collection, all data were deidentified so that the researchers were blinded to the identities of the physicians. Respondent characteristics are presented as proportions and means. Unpaired t test and 2 tests were used to compare demographic information, and stratified by mean HMCCOT score. The survey data were analyzed using Stata statistical software version 12.1 (StataCorp LP, College Station, TX).
Further Validation of the HMCCOT
Upon reviewing the distribution of data after observing the 26 physicians with their patients, we excluded 13 variables from the initial version of the tool that lacked discriminatory value (eg, 100% or 0% of physicians performed the observed behavior during the encounters); this left 23 variables that were judged to be most clinically relevant in the final version of the HMCCOT. Two examples of the variables that were excluded were: uses technology/literature to educate patients (not witnessed in any encounter), and obeys posted contact precautions (done uniformly by all). The HMCCOT score represents the proportion of observed behaviors (out of the 23 behaviors). It was computed for each hospitalist for every patient encounter. Finally, relation to other variables validity evidence would be established by comparing the mean HMCCOT scores of the physicians to their PG scores from the same time period to evaluate the correlation between the 2 scores. This association was assessed using Pearson correlations.
RESULTS
The average clinical experience of the 26 hospitalist physicians studied was 6 years (Table 1). Their mean age was 38 years, 13 (50%) were female, and 16 (62%) were of nonwhite race. Fourteen hospitalists (54%) worked at 1 of the nonacademic hospitals. In terms of clinical workload, most physicians (n = 17, 65%) devoted more than 70% of their time working in direct patient care. Mean time spent observing each physician was 280 minutes. During this time, the 26 physicians were observed for 181 separate clinical encounters; 54% of these patients were new encounters, patients who were not previously known to the physician. The average time each physician spent in a patient room was 10.8 minutes. Mean number of observed patient encounters per hospitalist was 7.
| Total Study Population, n = 26 | HMCCOT Score 60, n = 14 | HMCCOT Score >60, n = 12 | P Value* | |
|---|---|---|---|---|
| ||||
| Age, mean (SD) | 38 (5.6) | 37.9 (5.6) | 38.1 (5.7) | 0.95 |
| Female, n (%) | 13 (50) | 6 (43) | 7 (58) | 0.43 |
| Race, n (%) | ||||
| Caucasian | 10 (38) | 5 (36) | 5 (41) | 0.31 |
| Asian | 13 (50) | 8 (57) | 5 (41) | |
| African/African American | 2 (8) | 0 (0) | 2 (17) | |
| Other | 1 (4) | 1 (7) | 0 (0) | |
| Clinical experience >6 years, n (%) | 12 (46) | 6 (43) | 6 (50) | 0.72 |
| Clinical workload >70% | 17 (65) | 10 (71) | 7 (58) | 0.48 |
| Academic hospitalist, n (%) | 12 (46) | 5 (36) | 7 (58) | 0.25 |
| Hospital | 0.47 | |||
| JHBMC | 8 (31) | 3 (21.4) | 5 (41) | |
| JHH | 4 (15) | 2 (14.3) | 2 (17) | |
| HCGH | 5 (19) | 3 (21.4) | 2 (17) | |
| Suburban | 6 (23) | 3 (21.4) | 3 (25) | |
| SMC | 3 (12) | 3 (21.4) | 0 (0) | |
| Minutes spent observing hospitalist per shift, mean (SD) | 280 (104.5) | 280.4 (115.5) | 281.4 (95.3) | 0.98 |
| Average time spent per patient encounter in minutes, mean (SD) | 10.8 (8.9) | 8.7 (9.1) | 13 (8.1) | 0.001 |
| Proportion of observed patients who were new to provider, % | 97 (53.5) | 37 (39.7) | 60 (68.1) | 0.001 |
The distribution of HMCCOT scores was not statistically significantly different when analyzed by age, gender, race, amount of clinical experience, clinical workload of the hospitalist, hospital, time spent observing the hospitalist (all P > 0.05). The distribution of HMCCOT scores was statistically different in new patient encounters compared to follow‐ups (68.1% vs 39.7%, P 0.001). Encounters with patients that generated HMCCOT scores above versus below the mean were longer (13 minutes vs 8.7 minutes, P 0.001).
The mean HMCCOT score was 61 (standard deviation [SD] = 10.6), and it was normally distributed (Figure 1). Table 2 shows the data for the 23 behaviors that were objectively assessed as part of the HMCCOT for the 181 patient encounters. The most frequently observed behaviors were physicians washing hands after leaving the patient's room in 170 (94%) of the encounters and smiling (83%). The behaviors that were observed with the least regularity were using an empathic statement (26% of encounters), and employing teach‐back (13% of encounters). A common method of demonstrating interest in the patient as a person, seen in 41% of encounters, involved physicians asking about patients' personal histories and their interests.
| Variables | All Visits Combined, n = 181 | HMCCOT Score <60, n = 93 | HMCCOT Score >60, n = 88 | P Value* |
|---|---|---|---|---|
| ||||
| Objective observations, n (%) | ||||
| Washes hands after leaving room | 170 (94) | 83 (89) | 87 (99) | 0.007 |
| Discusses plan for the day | 163 (91) | 78 (84) | 85 (99) | <0.001 |
| Does not interrupt the patient | 159 (88) | 79 (85) | 80 (91) | 0.21 |
| Smiles | 149 (83) | 71 (77) | 78 (89) | 0.04 |
| Washes hands before entering | 139 (77) | 64 (69) | 75 (85) | 0.009 |
| Begins with open‐ended question | 134 (77) | 68 (76) | 66 (78) | 0.74 |
| Knocks before entering the room | 127 (76) | 57 (65) | 70 (89) | <0.001 |
| Introduces him/herself to the patient | 122 (67) | 45 (48) | 77 (88) | <0.001 |
| Explains his/her role | 120 (66) | 44 (47) | 76 (86) | <0.001 |
| Asks about pain | 110 (61) | 45 (49) | 65 (74) | 0.001 |
| Asks permission prior to examining | 106 (61) | 43 (50) | 63 (72) | 0.002 |
| Uncovers body area for the physical exam | 100 (57) | 34 (38) | 66 (77) | <0.001 |
| Discusses discharge plan | 99 (55) | 38 (41) | 61 (71) | <0.001 |
| Sits down in the patient room | 74 (41) | 24 (26) | 50 (57) | <0.001 |
| Asks about patient's feelings | 58 (33) | 17 (19) | 41 (47) | <0.001 |
| Shakes hands with the patient | 57 (32) | 17 (18) | 40 (46) | <0.001 |
| Uses teach‐back | 24 (13) | 4 (4.3) | 20 (24) | <0.001 |
| Subjective observations, n (%) | ||||
| Avoids medical jargon | 160 (89) | 85 (91) | 83 (95) | 0.28 |
| Demonstrates interest in patient as a person | 72 (41) | 16 (18) | 56 (66) | <0.001 |
| Touches appropriately | 62 (34) | 21 (23) | 41 (47) | 0.001 |
| Shows sensitivity to patient modesty | 57 (93) | 15 (79) | 42 (100) | 0.002 |
| Engages in nonmedical conversation | 54 (30) | 10 (11) | 44 (51) | <0.001 |
| Uses empathic statement | 47 (26) | 9 (10) | 38 (43) | <0.001 |

The average composite PG scores for the physician sample was 38.95 (SD=39.64). A moderate correlation was found between the HMCCOT score and PG score (adjusted Pearson correlation: 0.45, P = 0.047).
DISCUSSION
In this study, we followed 26 hospitalist physicians during routine clinical care, and we focused intently on their communication and their comportment with patients at the bedside. Even among clinically respected hospitalists, the results reveal that there is wide variability in comportment and communication practices and behaviors at the bedside. The physicians' HMCCOT scores were associated with their PG scores. These findings suggest that improved bedside communication and comportment with patients might translate into enhanced patient satisfaction.
This is the first study that honed in on hospitalist communication and comportment. With validity evidence established for the HMCCOT, some may elect to more explicitly perform these behaviors themselves, and others may wish to watch other hospitalists to give them feedback that is tied to specific behaviors. Beginning with the basics, the hospitalists we studied introduced themselves to their patients at the initial encounter 78% of the time, less frequently than is done by primary care clinicians (89%) but more consistently than do emergency department providers (64%).[7] Other variables that stood out in the HMCCOT was that teach‐back was employed in only 13% of the encounters. Previous studies have shown that teach‐back corroborates patient comprehension and can be used to engage patients (and caregivers) in realistic goal setting and optimal health service utilization.[14] Further, patients who clearly understand their postdischarge plan are 30% less likely to be readmitted or visit the emergency department.[14] The data for our group have helped us to see areas of strengths, such as hand washing, where we are above compliance rates across hospitals in the United States,[15] as well as those matters that represent opportunities for improvement such as connecting more deeply with our patients.
Tackett et al. have looked at encounter length and its association with performance of etiquette‐based medicine behaviors.[7] Similar to their study, we found a positive correlation between spending more time with patients and higher HMCCOT scores. We also found that HMCCOT scores were higher when providers were caring for new patients. Patients' complaints about doctors often relate to feeling rushed, that their physicians did not listen to them, or that information was not conveyed in a clear manner.[16] Such challenges in physicianpatient communication are ubiquitous across clinical settings.[16] When successfully achieved, patient‐centered communication has been associated with improved clinical outcomes, including adherence to recommended treatment and better self‐management of chronic disease.[17, 18, 19, 20, 21, 22, 23, 24, 25, 26] Many of the components of the HMCCOT described in this article are at the heart of patient‐centered care.
Several limitations of the study should be considered. First, physicians may have behaved differently while they were being observed, which is known as the Hawthorne effect. We observed them for many hours and across multiple patient encounters, and the physicians were not aware of the specific types of data that we were collecting. These factors may have limited the biases along such lines. Second, there may be elements of optimal comportment and communication that were not captured by the HMCCOT. Hopefully, there are not big gaps, as we used multiple methods and an iterative process in the refinement of the HMCCOT metric. Third, one investigator did all of the observing, and it is possible that he might have missed certain behaviors. Through extensive pilot testing and comparisons with other raters, the observer became very skilled and facile with such data collection and the tool. Fourth, we did not survey the same patients that were cared for to compare their perspectives to the HMCCOT scores following the clinical encounters. For patient perspectives, we relied only on PG scores. Fifth, quality of care is a broad and multidimensional construct. The HMCCOT focuses exclusively on hospitalists' comportment and communication at the bedside; therefore, it does not comprehensively assess care quality. Sixth, with our goal to optimally validate the HMCCOT, we tested it on the top tier of hospitalists within each group. We may have observed different results had we randomly selected hospitalists from each hospital or had we conducted the study at hospitals in other geographic regions. Finally, all of the doctors observed worked at hospitals in the Mid‐Atlantic region. However, these five distinct hospitals each have their own cultures, and they are led by different administrators. We purposively chose to sample both academic as well as community settings.
In conclusion, this study reports on the development of a comportment and communication tool that was established and validated by following clinically excellent hospitalists at the bedside. Future studies are necessary to determine whether hospitalists of all levels of experience and clinical skill can improve when given data and feedback using the HMCCOT. Larger studies will then be needed to assess whether enhancing comportment and communication can truly improve patient satisfaction and clinical outcomes in the hospital.
Disclosures: Dr. Wright is a Miller‐Coulson Family Scholar and is supported through the Johns Hopkins Center for Innovative Medicine. Susrutha Kotwal, MD, and Waseem Khaliq, MD, contributed equally to this work. The authors report no conflicts of interest.
- 2014 state of hospital medicine report. Society of Hospital Medicine website. Available at: http://www.hospitalmedicine.org/Web/Practice_Management/State_of_HM_Surveys/2014.aspx. Accessed January 10, 2015.
- Press Ganey website. Available at: http://www.pressganey.com/home. Accessed December 15, 2015.
- Hospital Consumer Assessment of Healthcare Providers and Systems website. Available at: http://www.hcahpsonline.org/home.aspx. Accessed February 2, 2016.
- Membership committee guidelines for hospitalists patient satisfaction surveys. Society of Hospital Medicine website. Available at: http://www.hospitalmedicine.org. Accessed February 2, 2016.
- Definition of comportment. Available at: http://www.vocabulary.com/dictionary/comportment. Accessed December 15, 2015.
- . Etiquette‐based medicine. N Engl J Med. 2008;358(19):1988–1989.
- , , , , . Appraising the practice of etiquette‐based medicine in the inpatient setting. J Gen Intern Med. 2013;28(7):908–913.
- , , . Developing physician communication skills for patient‐centered care. Health Aff (Millwood). 2010;29(7):1310–1318.
- . The impact on patient health outcomes of interventions targeting the patient–physician relationship. Patient. 2009;2(2):77–84.
- , , , , , . Effect on health‐related outcomes of interventions to alter the interaction between patients and practitioners: a systematic review of trials. Ann Fam Med. 2004;2(6):595–608.
- , , , . How does communication heal? Pathways linking clinician–patient communication to health outcomes. Patient Educ Couns. 2009;74(3):295–301.
- , , , . Clinical excellence in academia: perspectives from masterful academic clinicians. Mayo Clin Proc. 2008;83(9):989–994.
- , , , et al. Where did the day go?—a time‐motion study of hospitalists. J Hosp Med. 2010;5(6):323–328.
- , , , et al. Reducing readmissions using teach‐back: enhancing patient and family education. J Nurs Adm. 2015;45(1):35–42.
- , , . Hand hygiene compliance rates in the United States—a one‐year multicenter collaboration using product/volume usage measurement and feedback. Am J Med Qual. 2009;24(3):205–213.
- , , , et al. Obstetricians' prior malpractice experience and patients' satisfaction with care. JAMA. 1994;272(20):1583–1587.
- , . Patient‐Centered Communication in Cancer Care: Promoting Healing and Reducing Suffering. NIH publication no. 07–6225. Bethesda, MD: National Cancer Institute; 2007.
- . Interacting with cancer patients: the significance of physicians' communication behavior. Soc Sci Med. 2003;57(5):791–806.
- , , . Expanding patient involvement in care: effects on patient outcomes. Ann Intern Med. 1985;102(4):520–528.
- , . Measuring patient‐centeredness: a comparison of three observation‐based instruments. Patient Educ Couns. 2000;39(1):71–80.
- , , , . Doctor‐patient communication: a review of the literature. Soc Sci Med. 1995;40(7):903–918.
- , , , , , . Linking primary care performance to outcomes of care. J Fam Pract. 1998;47(3):213–220.
- , , , et al. The impact of patient‐centered care on outcomes. J Fam Pract. 2000;49(9):796–804.
- , , , et al. Measuring patient‐centered communication in patient‐physician consultations: theoretical and practical issues. Soc Sci Med. 2005;61(7):1516–1528.
- , . Patient‐centered consultations and outcomes in primary care: a review of the literature. Patient Educ Couns. 2002;48(1):51–61.
- , , . Doctor‐patient communication and satisfaction with care in oncology. Curr Opin Oncol. 2005;17(4):351–354.
In 2014, there were more than 40,000 hospitalists in the United States, and approximately 20% were employed by academic medical centers.[1] Hospitalist physicians groups are committed to delivering excellent patient care. However, the published literature is limited with respect to defining optimal care in hospital medicine.
Patient satisfaction surveys, such as Press Ganey (PG)[2] and Hospital Consumer Assessment of Healthcare Providers and Systems,[3] are being used to assess patients' contentment with the quality of care they receive while hospitalized. The Society of Hospital Medicine, the largest professional medical society representing hospitalists, encourages the use of patient satisfaction surveys to measure hospitalist providers' quality of patient care.[4] There are, however, several problems with the current methods. First, the attribution to specific providers is questionable. Second, recall about the provider by the patients may be poor because surveys are sent to patients days after they return home. Third, the patients' recovery and health outcomes are likely to influence their assessment of the doctor. Finally, feedback is known to be most valuable and transformative when it is specific and given in real time. Thus, a tool that is able to provide feedback at the encounter level should be more helpful than a tool that offers assessment at the level of the admission, particularly when it can be also delivered immediately after the data are collected.
Comportment has been used to describe both the way a person behaves and also the way she carries herself (ie, her general manner).[5] Excellent comportment and communication can serve as the foundation for delivering patient‐centered care.[6, 7, 8] Patient centeredness has been shown to improve the patient experience and clinical outcomes, including compliance with therapeutic plans.[9, 10, 11] Respectful behavior, etiquette‐based medicine, and effective communication also lay the foundation upon which the therapeutic alliance between a doctor and patient can be built.
The goal of this study was to establish a metric that could comprehensively assess a hospitalist provider's comportment and communication skills during an encounter with a hospitalized patient.
METHODS
Study Design and Setting
An observational study of hospitalist physicians was conducted between June 2013 and December 2013 at 5 hospitals in Maryland and Washington DC. Two are academic medical centers (Johns Hopkins Hospital and Johns Hopkins Bayview Medical Center [JHBMC]), and the others are community hospitals (Howard County General Hospital [HCGH], Sibley Memorial Hospital [SMC], and Suburban Hospital). These 5 hospitals, across 2 large cities, have distinct culture and leadership, each serving different populations.
Subjects
In developing a tool to measure communication and comportment, we needed to observe physicianpatient encounters wherein there would be a good deal of variability in performance. During pilot testing, when following a few of the most senior and respected hospitalists, we noted encounters during which they excelled and others where they performed less optimally. Further, in following some less‐experienced providers, their skills were less developed and they were uniformly missing most of the behaviors on the tool that were believed to be associated with optimal communication and comportment. Because of this, we decided to purposively sample the strongest clinicians at each of the 5 hospitals in hopes of seeing a range of scores on the tool.
The chiefs of hospital medicine at the 5 hospitals were contacted and asked to identify their most clinically excellent hospitalists, namely those who they thought were most clinically skilled within their groups. Because our goal was to observe the top tier (approximately 20%) of the hospitalists within each group, we asked each chief to name a specific number of physicians (eg, 3 names for 1 group with 15 hospitalists, and 8 from another group with 40 physicians). No precise definition of most clinically excellent hospitalists was provided to the chiefs. It was believed that they were well positioned to select their best clinicians because of both subjective feedback and objective data that flow to them. This postulate may have been corroborated by the fact that each of them efficiently sent a list of their top choices without any questions being asked.
The 29 hospitalists (named by their chiefs) were in turn emailed and invited to participate in the study. All but 3 hospitalists consented to participate in the study; this resulted in a cohort of 26 who would be observed.
Tool Development
A team was assembled to develop the hospital medicine comportment and communication observation tool (HMCCOT). All team members had extensive clinical experience, several had published articles on clinical excellence, had won clinical awards, and all had been teaching clinical skills for many years. The team's development of the HMCCOT was extensively informed by a review of the literature. Two articles that most heavily influenced the HMCCOT's development were Christmas et al.'s paper describing 7 core domains of excellence, 2 of which are intimately linked to communication and comportment,[12] and Kahn's text that delineates behaviors to be performed upon entering the patient's room, termed etiquette‐based medicine.[6] The team also considered the work from prior timemotion studies in hospital medicine,[7, 13] which led to the inclusion of temporal measurements during the observations. The tool was also presented at academic conferences in the Division of General Internal Medicine at Johns Hopkins and iteratively revised based on the feedback. Feedback was sought from people who have spent their entire career studying physicianpatient relationships and who are members of the American Academy on Communication in Healthcare. These methods established content validity evidence for the tool under development. The goal of the HMCCOT was to assess behaviors believed to be associated with optimal comportment and communication in hospital medicine.
The HMCCOT was pilot tested by observing different JHBMC hospitalists patient encounters and it was iteratively revised. On multiple occasions, 2 authors/emnvestigators spent time observing JHBMC hospitalists together and compared data capture and levels of agreement across all elements. Then, for formal assessment of inter‐rater reliability, 2 authors observed 5 different hospitalists across 25 patient encounters; the coefficient was 0.91 (standard error = 0.04). This step helped to establish internal structure validity evidence for the tool.
The initial version of the HMCCOT contained 36 elements, and it was organized sequentially to allow the observer to document behaviors in the order that they were likely to occur so as to facilitate the process and to minimize oversight. A few examples of the elements were as follows: open‐ended versus a close‐ended statement at the beginning of the encounter, hospitalist introduces himself/herself, and whether the provider smiles at any point during the patient encounter.
Data Collection
One author scheduled a time to observe each hospitalist physician during their routine clinical care of patients when they were not working with medical learners. Hospitalists were naturally aware that they were being observed but were not aware of the specific data elements or behaviors that were being recorded.
The study was approved by the institutional review board at the Johns Hopkins University School of Medicine, and by each of the research review committees at HCGH, SMC, and Suburban hospitals.
Data Analysis
After data collection, all data were deidentified so that the researchers were blinded to the identities of the physicians. Respondent characteristics are presented as proportions and means. Unpaired t test and 2 tests were used to compare demographic information, and stratified by mean HMCCOT score. The survey data were analyzed using Stata statistical software version 12.1 (StataCorp LP, College Station, TX).
Further Validation of the HMCCOT
Upon reviewing the distribution of data after observing the 26 physicians with their patients, we excluded 13 variables from the initial version of the tool that lacked discriminatory value (eg, 100% or 0% of physicians performed the observed behavior during the encounters); this left 23 variables that were judged to be most clinically relevant in the final version of the HMCCOT. Two examples of the variables that were excluded were: uses technology/literature to educate patients (not witnessed in any encounter), and obeys posted contact precautions (done uniformly by all). The HMCCOT score represents the proportion of observed behaviors (out of the 23 behaviors). It was computed for each hospitalist for every patient encounter. Finally, relation to other variables validity evidence would be established by comparing the mean HMCCOT scores of the physicians to their PG scores from the same time period to evaluate the correlation between the 2 scores. This association was assessed using Pearson correlations.
RESULTS
The average clinical experience of the 26 hospitalist physicians studied was 6 years (Table 1). Their mean age was 38 years, 13 (50%) were female, and 16 (62%) were of nonwhite race. Fourteen hospitalists (54%) worked at 1 of the nonacademic hospitals. In terms of clinical workload, most physicians (n = 17, 65%) devoted more than 70% of their time working in direct patient care. Mean time spent observing each physician was 280 minutes. During this time, the 26 physicians were observed for 181 separate clinical encounters; 54% of these patients were new encounters, patients who were not previously known to the physician. The average time each physician spent in a patient room was 10.8 minutes. Mean number of observed patient encounters per hospitalist was 7.
| Total Study Population, n = 26 | HMCCOT Score 60, n = 14 | HMCCOT Score >60, n = 12 | P Value* | |
|---|---|---|---|---|
| ||||
| Age, mean (SD) | 38 (5.6) | 37.9 (5.6) | 38.1 (5.7) | 0.95 |
| Female, n (%) | 13 (50) | 6 (43) | 7 (58) | 0.43 |
| Race, n (%) | ||||
| Caucasian | 10 (38) | 5 (36) | 5 (41) | 0.31 |
| Asian | 13 (50) | 8 (57) | 5 (41) | |
| African/African American | 2 (8) | 0 (0) | 2 (17) | |
| Other | 1 (4) | 1 (7) | 0 (0) | |
| Clinical experience >6 years, n (%) | 12 (46) | 6 (43) | 6 (50) | 0.72 |
| Clinical workload >70% | 17 (65) | 10 (71) | 7 (58) | 0.48 |
| Academic hospitalist, n (%) | 12 (46) | 5 (36) | 7 (58) | 0.25 |
| Hospital | 0.47 | |||
| JHBMC | 8 (31) | 3 (21.4) | 5 (41) | |
| JHH | 4 (15) | 2 (14.3) | 2 (17) | |
| HCGH | 5 (19) | 3 (21.4) | 2 (17) | |
| Suburban | 6 (23) | 3 (21.4) | 3 (25) | |
| SMC | 3 (12) | 3 (21.4) | 0 (0) | |
| Minutes spent observing hospitalist per shift, mean (SD) | 280 (104.5) | 280.4 (115.5) | 281.4 (95.3) | 0.98 |
| Average time spent per patient encounter in minutes, mean (SD) | 10.8 (8.9) | 8.7 (9.1) | 13 (8.1) | 0.001 |
| Proportion of observed patients who were new to provider, % | 97 (53.5) | 37 (39.7) | 60 (68.1) | 0.001 |
The distribution of HMCCOT scores was not statistically significantly different when analyzed by age, gender, race, amount of clinical experience, clinical workload of the hospitalist, hospital, time spent observing the hospitalist (all P > 0.05). The distribution of HMCCOT scores was statistically different in new patient encounters compared to follow‐ups (68.1% vs 39.7%, P 0.001). Encounters with patients that generated HMCCOT scores above versus below the mean were longer (13 minutes vs 8.7 minutes, P 0.001).
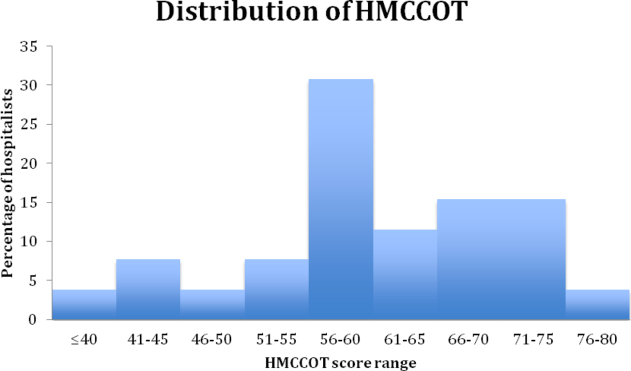
The mean HMCCOT score was 61 (standard deviation [SD] = 10.6), and it was normally distributed (Figure 1). Table 2 shows the data for the 23 behaviors that were objectively assessed as part of the HMCCOT for the 181 patient encounters. The most frequently observed behaviors were physicians washing hands after leaving the patient's room in 170 (94%) of the encounters and smiling (83%). The behaviors that were observed with the least regularity were using an empathic statement (26% of encounters), and employing teach‐back (13% of encounters). A common method of demonstrating interest in the patient as a person, seen in 41% of encounters, involved physicians asking about patients' personal histories and their interests.
| Variables | All Visits Combined, n = 181 | HMCCOT Score <60, n = 93 | HMCCOT Score >60, n = 88 | P Value* |
|---|---|---|---|---|
| ||||
| Objective observations, n (%) | ||||
| Washes hands after leaving room | 170 (94) | 83 (89) | 87 (99) | 0.007 |
| Discusses plan for the day | 163 (91) | 78 (84) | 85 (99) | <0.001 |
| Does not interrupt the patient | 159 (88) | 79 (85) | 80 (91) | 0.21 |
| Smiles | 149 (83) | 71 (77) | 78 (89) | 0.04 |
| Washes hands before entering | 139 (77) | 64 (69) | 75 (85) | 0.009 |
| Begins with open‐ended question | 134 (77) | 68 (76) | 66 (78) | 0.74 |
| Knocks before entering the room | 127 (76) | 57 (65) | 70 (89) | <0.001 |
| Introduces him/herself to the patient | 122 (67) | 45 (48) | 77 (88) | <0.001 |
| Explains his/her role | 120 (66) | 44 (47) | 76 (86) | <0.001 |
| Asks about pain | 110 (61) | 45 (49) | 65 (74) | 0.001 |
| Asks permission prior to examining | 106 (61) | 43 (50) | 63 (72) | 0.002 |
| Uncovers body area for the physical exam | 100 (57) | 34 (38) | 66 (77) | <0.001 |
| Discusses discharge plan | 99 (55) | 38 (41) | 61 (71) | <0.001 |
| Sits down in the patient room | 74 (41) | 24 (26) | 50 (57) | <0.001 |
| Asks about patient's feelings | 58 (33) | 17 (19) | 41 (47) | <0.001 |
| Shakes hands with the patient | 57 (32) | 17 (18) | 40 (46) | <0.001 |
| Uses teach‐back | 24 (13) | 4 (4.3) | 20 (24) | <0.001 |
| Subjective observations, n (%) | ||||
| Avoids medical jargon | 160 (89) | 85 (91) | 83 (95) | 0.28 |
| Demonstrates interest in patient as a person | 72 (41) | 16 (18) | 56 (66) | <0.001 |
| Touches appropriately | 62 (34) | 21 (23) | 41 (47) | 0.001 |
| Shows sensitivity to patient modesty | 57 (93) | 15 (79) | 42 (100) | 0.002 |
| Engages in nonmedical conversation | 54 (30) | 10 (11) | 44 (51) | <0.001 |
| Uses empathic statement | 47 (26) | 9 (10) | 38 (43) | <0.001 |
The average composite PG scores for the physician sample was 38.95 (SD=39.64). A moderate correlation was found between the HMCCOT score and PG score (adjusted Pearson correlation: 0.45, P = 0.047).
DISCUSSION
In this study, we followed 26 hospitalist physicians during routine clinical care, and we focused intently on their communication and their comportment with patients at the bedside. Even among clinically respected hospitalists, the results reveal that there is wide variability in comportment and communication practices and behaviors at the bedside. The physicians' HMCCOT scores were associated with their PG scores. These findings suggest that improved bedside communication and comportment with patients might translate into enhanced patient satisfaction.
This is the first study that honed in on hospitalist communication and comportment. With validity evidence established for the HMCCOT, some may elect to more explicitly perform these behaviors themselves, and others may wish to watch other hospitalists to give them feedback that is tied to specific behaviors. Beginning with the basics, the hospitalists we studied introduced themselves to their patients at the initial encounter 78% of the time, less frequently than is done by primary care clinicians (89%) but more consistently than do emergency department providers (64%).[7] Other variables that stood out in the HMCCOT was that teach‐back was employed in only 13% of the encounters. Previous studies have shown that teach‐back corroborates patient comprehension and can be used to engage patients (and caregivers) in realistic goal setting and optimal health service utilization.[14] Further, patients who clearly understand their postdischarge plan are 30% less likely to be readmitted or visit the emergency department.[14] The data for our group have helped us to see areas of strengths, such as hand washing, where we are above compliance rates across hospitals in the United States,[15] as well as those matters that represent opportunities for improvement such as connecting more deeply with our patients.
Tackett et al. have looked at encounter length and its association with performance of etiquette‐based medicine behaviors.[7] Similar to their study, we found a positive correlation between spending more time with patients and higher HMCCOT scores. We also found that HMCCOT scores were higher when providers were caring for new patients. Patients' complaints about doctors often relate to feeling rushed, that their physicians did not listen to them, or that information was not conveyed in a clear manner.[16] Such challenges in physicianpatient communication are ubiquitous across clinical settings.[16] When successfully achieved, patient‐centered communication has been associated with improved clinical outcomes, including adherence to recommended treatment and better self‐management of chronic disease.[17, 18, 19, 20, 21, 22, 23, 24, 25, 26] Many of the components of the HMCCOT described in this article are at the heart of patient‐centered care.
Several limitations of the study should be considered. First, physicians may have behaved differently while they were being observed, which is known as the Hawthorne effect. We observed them for many hours and across multiple patient encounters, and the physicians were not aware of the specific types of data that we were collecting. These factors may have limited the biases along such lines. Second, there may be elements of optimal comportment and communication that were not captured by the HMCCOT. Hopefully, there are not big gaps, as we used multiple methods and an iterative process in the refinement of the HMCCOT metric. Third, one investigator did all of the observing, and it is possible that he might have missed certain behaviors. Through extensive pilot testing and comparisons with other raters, the observer became very skilled and facile with such data collection and the tool. Fourth, we did not survey the same patients that were cared for to compare their perspectives to the HMCCOT scores following the clinical encounters. For patient perspectives, we relied only on PG scores. Fifth, quality of care is a broad and multidimensional construct. The HMCCOT focuses exclusively on hospitalists' comportment and communication at the bedside; therefore, it does not comprehensively assess care quality. Sixth, with our goal to optimally validate the HMCCOT, we tested it on the top tier of hospitalists within each group. We may have observed different results had we randomly selected hospitalists from each hospital or had we conducted the study at hospitals in other geographic regions. Finally, all of the doctors observed worked at hospitals in the Mid‐Atlantic region. However, these five distinct hospitals each have their own cultures, and they are led by different administrators. We purposively chose to sample both academic as well as community settings.
In conclusion, this study reports on the development of a comportment and communication tool that was established and validated by following clinically excellent hospitalists at the bedside. Future studies are necessary to determine whether hospitalists of all levels of experience and clinical skill can improve when given data and feedback using the HMCCOT. Larger studies will then be needed to assess whether enhancing comportment and communication can truly improve patient satisfaction and clinical outcomes in the hospital.
Disclosures: Dr. Wright is a Miller‐Coulson Family Scholar and is supported through the Johns Hopkins Center for Innovative Medicine. Susrutha Kotwal, MD, and Waseem Khaliq, MD, contributed equally to this work. The authors report no conflicts of interest.
In 2014, there were more than 40,000 hospitalists in the United States, and approximately 20% were employed by academic medical centers.[1] Hospitalist physicians groups are committed to delivering excellent patient care. However, the published literature is limited with respect to defining optimal care in hospital medicine.
Patient satisfaction surveys, such as Press Ganey (PG)[2] and Hospital Consumer Assessment of Healthcare Providers and Systems,[3] are being used to assess patients' contentment with the quality of care they receive while hospitalized. The Society of Hospital Medicine, the largest professional medical society representing hospitalists, encourages the use of patient satisfaction surveys to measure hospitalist providers' quality of patient care.[4] There are, however, several problems with the current methods. First, the attribution to specific providers is questionable. Second, recall about the provider by the patients may be poor because surveys are sent to patients days after they return home. Third, the patients' recovery and health outcomes are likely to influence their assessment of the doctor. Finally, feedback is known to be most valuable and transformative when it is specific and given in real time. Thus, a tool that is able to provide feedback at the encounter level should be more helpful than a tool that offers assessment at the level of the admission, particularly when it can be also delivered immediately after the data are collected.
Comportment has been used to describe both the way a person behaves and also the way she carries herself (ie, her general manner).[5] Excellent comportment and communication can serve as the foundation for delivering patient‐centered care.[6, 7, 8] Patient centeredness has been shown to improve the patient experience and clinical outcomes, including compliance with therapeutic plans.[9, 10, 11] Respectful behavior, etiquette‐based medicine, and effective communication also lay the foundation upon which the therapeutic alliance between a doctor and patient can be built.
The goal of this study was to establish a metric that could comprehensively assess a hospitalist provider's comportment and communication skills during an encounter with a hospitalized patient.
METHODS
Study Design and Setting
An observational study of hospitalist physicians was conducted between June 2013 and December 2013 at 5 hospitals in Maryland and Washington DC. Two are academic medical centers (Johns Hopkins Hospital and Johns Hopkins Bayview Medical Center [JHBMC]), and the others are community hospitals (Howard County General Hospital [HCGH], Sibley Memorial Hospital [SMC], and Suburban Hospital). These 5 hospitals, across 2 large cities, have distinct culture and leadership, each serving different populations.
Subjects
In developing a tool to measure communication and comportment, we needed to observe physicianpatient encounters wherein there would be a good deal of variability in performance. During pilot testing, when following a few of the most senior and respected hospitalists, we noted encounters during which they excelled and others where they performed less optimally. Further, in following some less‐experienced providers, their skills were less developed and they were uniformly missing most of the behaviors on the tool that were believed to be associated with optimal communication and comportment. Because of this, we decided to purposively sample the strongest clinicians at each of the 5 hospitals in hopes of seeing a range of scores on the tool.
The chiefs of hospital medicine at the 5 hospitals were contacted and asked to identify their most clinically excellent hospitalists, namely those who they thought were most clinically skilled within their groups. Because our goal was to observe the top tier (approximately 20%) of the hospitalists within each group, we asked each chief to name a specific number of physicians (eg, 3 names for 1 group with 15 hospitalists, and 8 from another group with 40 physicians). No precise definition of most clinically excellent hospitalists was provided to the chiefs. It was believed that they were well positioned to select their best clinicians because of both subjective feedback and objective data that flow to them. This postulate may have been corroborated by the fact that each of them efficiently sent a list of their top choices without any questions being asked.
The 29 hospitalists (named by their chiefs) were in turn emailed and invited to participate in the study. All but 3 hospitalists consented to participate in the study; this resulted in a cohort of 26 who would be observed.
Tool Development
A team was assembled to develop the hospital medicine comportment and communication observation tool (HMCCOT). All team members had extensive clinical experience, several had published articles on clinical excellence, had won clinical awards, and all had been teaching clinical skills for many years. The team's development of the HMCCOT was extensively informed by a review of the literature. Two articles that most heavily influenced the HMCCOT's development were Christmas et al.'s paper describing 7 core domains of excellence, 2 of which are intimately linked to communication and comportment,[12] and Kahn's text that delineates behaviors to be performed upon entering the patient's room, termed etiquette‐based medicine.[6] The team also considered the work from prior timemotion studies in hospital medicine,[7, 13] which led to the inclusion of temporal measurements during the observations. The tool was also presented at academic conferences in the Division of General Internal Medicine at Johns Hopkins and iteratively revised based on the feedback. Feedback was sought from people who have spent their entire career studying physicianpatient relationships and who are members of the American Academy on Communication in Healthcare. These methods established content validity evidence for the tool under development. The goal of the HMCCOT was to assess behaviors believed to be associated with optimal comportment and communication in hospital medicine.
The HMCCOT was pilot tested by observing different JHBMC hospitalists patient encounters and it was iteratively revised. On multiple occasions, 2 authors/emnvestigators spent time observing JHBMC hospitalists together and compared data capture and levels of agreement across all elements. Then, for formal assessment of inter‐rater reliability, 2 authors observed 5 different hospitalists across 25 patient encounters; the coefficient was 0.91 (standard error = 0.04). This step helped to establish internal structure validity evidence for the tool.
The initial version of the HMCCOT contained 36 elements, and it was organized sequentially to allow the observer to document behaviors in the order that they were likely to occur so as to facilitate the process and to minimize oversight. A few examples of the elements were as follows: open‐ended versus a close‐ended statement at the beginning of the encounter, hospitalist introduces himself/herself, and whether the provider smiles at any point during the patient encounter.
Data Collection
One author scheduled a time to observe each hospitalist physician during their routine clinical care of patients when they were not working with medical learners. Hospitalists were naturally aware that they were being observed but were not aware of the specific data elements or behaviors that were being recorded.
The study was approved by the institutional review board at the Johns Hopkins University School of Medicine, and by each of the research review committees at HCGH, SMC, and Suburban hospitals.
Data Analysis
After data collection, all data were deidentified so that the researchers were blinded to the identities of the physicians. Respondent characteristics are presented as proportions and means. Unpaired t test and 2 tests were used to compare demographic information, and stratified by mean HMCCOT score. The survey data were analyzed using Stata statistical software version 12.1 (StataCorp LP, College Station, TX).
Further Validation of the HMCCOT
Upon reviewing the distribution of data after observing the 26 physicians with their patients, we excluded 13 variables from the initial version of the tool that lacked discriminatory value (eg, 100% or 0% of physicians performed the observed behavior during the encounters); this left 23 variables that were judged to be most clinically relevant in the final version of the HMCCOT. Two examples of the variables that were excluded were: uses technology/literature to educate patients (not witnessed in any encounter), and obeys posted contact precautions (done uniformly by all). The HMCCOT score represents the proportion of observed behaviors (out of the 23 behaviors). It was computed for each hospitalist for every patient encounter. Finally, relation to other variables validity evidence would be established by comparing the mean HMCCOT scores of the physicians to their PG scores from the same time period to evaluate the correlation between the 2 scores. This association was assessed using Pearson correlations.
RESULTS
The average clinical experience of the 26 hospitalist physicians studied was 6 years (Table 1). Their mean age was 38 years, 13 (50%) were female, and 16 (62%) were of nonwhite race. Fourteen hospitalists (54%) worked at 1 of the nonacademic hospitals. In terms of clinical workload, most physicians (n = 17, 65%) devoted more than 70% of their time working in direct patient care. Mean time spent observing each physician was 280 minutes. During this time, the 26 physicians were observed for 181 separate clinical encounters; 54% of these patients were new encounters, patients who were not previously known to the physician. The average time each physician spent in a patient room was 10.8 minutes. Mean number of observed patient encounters per hospitalist was 7.
| Total Study Population, n = 26 | HMCCOT Score 60, n = 14 | HMCCOT Score >60, n = 12 | P Value* | |
|---|---|---|---|---|
| ||||
| Age, mean (SD) | 38 (5.6) | 37.9 (5.6) | 38.1 (5.7) | 0.95 |
| Female, n (%) | 13 (50) | 6 (43) | 7 (58) | 0.43 |
| Race, n (%) | ||||
| Caucasian | 10 (38) | 5 (36) | 5 (41) | 0.31 |
| Asian | 13 (50) | 8 (57) | 5 (41) | |
| African/African American | 2 (8) | 0 (0) | 2 (17) | |
| Other | 1 (4) | 1 (7) | 0 (0) | |
| Clinical experience >6 years, n (%) | 12 (46) | 6 (43) | 6 (50) | 0.72 |
| Clinical workload >70% | 17 (65) | 10 (71) | 7 (58) | 0.48 |
| Academic hospitalist, n (%) | 12 (46) | 5 (36) | 7 (58) | 0.25 |
| Hospital | 0.47 | |||
| JHBMC | 8 (31) | 3 (21.4) | 5 (41) | |
| JHH | 4 (15) | 2 (14.3) | 2 (17) | |
| HCGH | 5 (19) | 3 (21.4) | 2 (17) | |
| Suburban | 6 (23) | 3 (21.4) | 3 (25) | |
| SMC | 3 (12) | 3 (21.4) | 0 (0) | |
| Minutes spent observing hospitalist per shift, mean (SD) | 280 (104.5) | 280.4 (115.5) | 281.4 (95.3) | 0.98 |
| Average time spent per patient encounter in minutes, mean (SD) | 10.8 (8.9) | 8.7 (9.1) | 13 (8.1) | 0.001 |
| Proportion of observed patients who were new to provider, % | 97 (53.5) | 37 (39.7) | 60 (68.1) | 0.001 |
The distribution of HMCCOT scores was not statistically significantly different when analyzed by age, gender, race, amount of clinical experience, clinical workload of the hospitalist, hospital, time spent observing the hospitalist (all P > 0.05). The distribution of HMCCOT scores was statistically different in new patient encounters compared to follow‐ups (68.1% vs 39.7%, P 0.001). Encounters with patients that generated HMCCOT scores above versus below the mean were longer (13 minutes vs 8.7 minutes, P 0.001).
The mean HMCCOT score was 61 (standard deviation [SD] = 10.6), and it was normally distributed (Figure 1). Table 2 shows the data for the 23 behaviors that were objectively assessed as part of the HMCCOT for the 181 patient encounters. The most frequently observed behaviors were physicians washing hands after leaving the patient's room in 170 (94%) of the encounters and smiling (83%). The behaviors that were observed with the least regularity were using an empathic statement (26% of encounters), and employing teach‐back (13% of encounters). A common method of demonstrating interest in the patient as a person, seen in 41% of encounters, involved physicians asking about patients' personal histories and their interests.
| Variables | All Visits Combined, n = 181 | HMCCOT Score <60, n = 93 | HMCCOT Score >60, n = 88 | P Value* |
|---|---|---|---|---|
| ||||
| Objective observations, n (%) | ||||
| Washes hands after leaving room | 170 (94) | 83 (89) | 87 (99) | 0.007 |
| Discusses plan for the day | 163 (91) | 78 (84) | 85 (99) | <0.001 |
| Does not interrupt the patient | 159 (88) | 79 (85) | 80 (91) | 0.21 |
| Smiles | 149 (83) | 71 (77) | 78 (89) | 0.04 |
| Washes hands before entering | 139 (77) | 64 (69) | 75 (85) | 0.009 |
| Begins with open‐ended question | 134 (77) | 68 (76) | 66 (78) | 0.74 |
| Knocks before entering the room | 127 (76) | 57 (65) | 70 (89) | <0.001 |
| Introduces him/herself to the patient | 122 (67) | 45 (48) | 77 (88) | <0.001 |
| Explains his/her role | 120 (66) | 44 (47) | 76 (86) | <0.001 |
| Asks about pain | 110 (61) | 45 (49) | 65 (74) | 0.001 |
| Asks permission prior to examining | 106 (61) | 43 (50) | 63 (72) | 0.002 |
| Uncovers body area for the physical exam | 100 (57) | 34 (38) | 66 (77) | <0.001 |
| Discusses discharge plan | 99 (55) | 38 (41) | 61 (71) | <0.001 |
| Sits down in the patient room | 74 (41) | 24 (26) | 50 (57) | <0.001 |
| Asks about patient's feelings | 58 (33) | 17 (19) | 41 (47) | <0.001 |
| Shakes hands with the patient | 57 (32) | 17 (18) | 40 (46) | <0.001 |
| Uses teach‐back | 24 (13) | 4 (4.3) | 20 (24) | <0.001 |
| Subjective observations, n (%) | ||||
| Avoids medical jargon | 160 (89) | 85 (91) | 83 (95) | 0.28 |
| Demonstrates interest in patient as a person | 72 (41) | 16 (18) | 56 (66) | <0.001 |
| Touches appropriately | 62 (34) | 21 (23) | 41 (47) | 0.001 |
| Shows sensitivity to patient modesty | 57 (93) | 15 (79) | 42 (100) | 0.002 |
| Engages in nonmedical conversation | 54 (30) | 10 (11) | 44 (51) | <0.001 |
| Uses empathic statement | 47 (26) | 9 (10) | 38 (43) | <0.001 |
The average composite PG scores for the physician sample was 38.95 (SD=39.64). A moderate correlation was found between the HMCCOT score and PG score (adjusted Pearson correlation: 0.45, P = 0.047).
DISCUSSION
In this study, we followed 26 hospitalist physicians during routine clinical care, and we focused intently on their communication and their comportment with patients at the bedside. Even among clinically respected hospitalists, the results reveal that there is wide variability in comportment and communication practices and behaviors at the bedside. The physicians' HMCCOT scores were associated with their PG scores. These findings suggest that improved bedside communication and comportment with patients might translate into enhanced patient satisfaction.
This is the first study that honed in on hospitalist communication and comportment. With validity evidence established for the HMCCOT, some may elect to more explicitly perform these behaviors themselves, and others may wish to watch other hospitalists to give them feedback that is tied to specific behaviors. Beginning with the basics, the hospitalists we studied introduced themselves to their patients at the initial encounter 78% of the time, less frequently than is done by primary care clinicians (89%) but more consistently than do emergency department providers (64%).[7] Other variables that stood out in the HMCCOT was that teach‐back was employed in only 13% of the encounters. Previous studies have shown that teach‐back corroborates patient comprehension and can be used to engage patients (and caregivers) in realistic goal setting and optimal health service utilization.[14] Further, patients who clearly understand their postdischarge plan are 30% less likely to be readmitted or visit the emergency department.[14] The data for our group have helped us to see areas of strengths, such as hand washing, where we are above compliance rates across hospitals in the United States,[15] as well as those matters that represent opportunities for improvement such as connecting more deeply with our patients.
Tackett et al. have looked at encounter length and its association with performance of etiquette‐based medicine behaviors.[7] Similar to their study, we found a positive correlation between spending more time with patients and higher HMCCOT scores. We also found that HMCCOT scores were higher when providers were caring for new patients. Patients' complaints about doctors often relate to feeling rushed, that their physicians did not listen to them, or that information was not conveyed in a clear manner.[16] Such challenges in physicianpatient communication are ubiquitous across clinical settings.[16] When successfully achieved, patient‐centered communication has been associated with improved clinical outcomes, including adherence to recommended treatment and better self‐management of chronic disease.[17, 18, 19, 20, 21, 22, 23, 24, 25, 26] Many of the components of the HMCCOT described in this article are at the heart of patient‐centered care.
Several limitations of the study should be considered. First, physicians may have behaved differently while they were being observed, which is known as the Hawthorne effect. We observed them for many hours and across multiple patient encounters, and the physicians were not aware of the specific types of data that we were collecting. These factors may have limited the biases along such lines. Second, there may be elements of optimal comportment and communication that were not captured by the HMCCOT. Hopefully, there are not big gaps, as we used multiple methods and an iterative process in the refinement of the HMCCOT metric. Third, one investigator did all of the observing, and it is possible that he might have missed certain behaviors. Through extensive pilot testing and comparisons with other raters, the observer became very skilled and facile with such data collection and the tool. Fourth, we did not survey the same patients that were cared for to compare their perspectives to the HMCCOT scores following the clinical encounters. For patient perspectives, we relied only on PG scores. Fifth, quality of care is a broad and multidimensional construct. The HMCCOT focuses exclusively on hospitalists' comportment and communication at the bedside; therefore, it does not comprehensively assess care quality. Sixth, with our goal to optimally validate the HMCCOT, we tested it on the top tier of hospitalists within each group. We may have observed different results had we randomly selected hospitalists from each hospital or had we conducted the study at hospitals in other geographic regions. Finally, all of the doctors observed worked at hospitals in the Mid‐Atlantic region. However, these five distinct hospitals each have their own cultures, and they are led by different administrators. We purposively chose to sample both academic as well as community settings.
In conclusion, this study reports on the development of a comportment and communication tool that was established and validated by following clinically excellent hospitalists at the bedside. Future studies are necessary to determine whether hospitalists of all levels of experience and clinical skill can improve when given data and feedback using the HMCCOT. Larger studies will then be needed to assess whether enhancing comportment and communication can truly improve patient satisfaction and clinical outcomes in the hospital.
Disclosures: Dr. Wright is a Miller‐Coulson Family Scholar and is supported through the Johns Hopkins Center for Innovative Medicine. Susrutha Kotwal, MD, and Waseem Khaliq, MD, contributed equally to this work. The authors report no conflicts of interest.
- 2014 state of hospital medicine report. Society of Hospital Medicine website. Available at: http://www.hospitalmedicine.org/Web/Practice_Management/State_of_HM_Surveys/2014.aspx. Accessed January 10, 2015.
- Press Ganey website. Available at: http://www.pressganey.com/home. Accessed December 15, 2015.
- Hospital Consumer Assessment of Healthcare Providers and Systems website. Available at: http://www.hcahpsonline.org/home.aspx. Accessed February 2, 2016.
- Membership committee guidelines for hospitalists patient satisfaction surveys. Society of Hospital Medicine website. Available at: http://www.hospitalmedicine.org. Accessed February 2, 2016.
- Definition of comportment. Available at: http://www.vocabulary.com/dictionary/comportment. Accessed December 15, 2015.
- . Etiquette‐based medicine. N Engl J Med. 2008;358(19):1988–1989.
- , , , , . Appraising the practice of etiquette‐based medicine in the inpatient setting. J Gen Intern Med. 2013;28(7):908–913.
- , , . Developing physician communication skills for patient‐centered care. Health Aff (Millwood). 2010;29(7):1310–1318.
- . The impact on patient health outcomes of interventions targeting the patient–physician relationship. Patient. 2009;2(2):77–84.
- , , , , , . Effect on health‐related outcomes of interventions to alter the interaction between patients and practitioners: a systematic review of trials. Ann Fam Med. 2004;2(6):595–608.
- , , , . How does communication heal? Pathways linking clinician–patient communication to health outcomes. Patient Educ Couns. 2009;74(3):295–301.
- , , , . Clinical excellence in academia: perspectives from masterful academic clinicians. Mayo Clin Proc. 2008;83(9):989–994.
- , , , et al. Where did the day go?—a time‐motion study of hospitalists. J Hosp Med. 2010;5(6):323–328.
- , , , et al. Reducing readmissions using teach‐back: enhancing patient and family education. J Nurs Adm. 2015;45(1):35–42.
- , , . Hand hygiene compliance rates in the United States—a one‐year multicenter collaboration using product/volume usage measurement and feedback. Am J Med Qual. 2009;24(3):205–213.
- , , , et al. Obstetricians' prior malpractice experience and patients' satisfaction with care. JAMA. 1994;272(20):1583–1587.
- , . Patient‐Centered Communication in Cancer Care: Promoting Healing and Reducing Suffering. NIH publication no. 07–6225. Bethesda, MD: National Cancer Institute; 2007.
- . Interacting with cancer patients: the significance of physicians' communication behavior. Soc Sci Med. 2003;57(5):791–806.
- , , . Expanding patient involvement in care: effects on patient outcomes. Ann Intern Med. 1985;102(4):520–528.
- , . Measuring patient‐centeredness: a comparison of three observation‐based instruments. Patient Educ Couns. 2000;39(1):71–80.
- , , , . Doctor‐patient communication: a review of the literature. Soc Sci Med. 1995;40(7):903–918.
- , , , , , . Linking primary care performance to outcomes of care. J Fam Pract. 1998;47(3):213–220.
- , , , et al. The impact of patient‐centered care on outcomes. J Fam Pract. 2000;49(9):796–804.
- , , , et al. Measuring patient‐centered communication in patient‐physician consultations: theoretical and practical issues. Soc Sci Med. 2005;61(7):1516–1528.
- , . Patient‐centered consultations and outcomes in primary care: a review of the literature. Patient Educ Couns. 2002;48(1):51–61.
- , , . Doctor‐patient communication and satisfaction with care in oncology. Curr Opin Oncol. 2005;17(4):351–354.
Inpatient Mammography
Testing for breast cancer is traditionally offered in outpatient settings, and screening mammography rates have plateaued since 2000.[1] Current data suggest that the mammography utilization gap by race has narrowed; however, disparity remains among low‐income, uninsured, and underinsured populations.[2, 3] The lowest compliance with screening mammography recommendations have been reported among women with low income (63.2%), uninsured (50.4%), and those without a usual source of healthcare (43.6%).[4] Although socioeconomic status, access to the healthcare system, and awareness about screening benefits can all influence women's willingness to have screening, the most common reason that women report for not having mammograms were that no one recommended the test.[5, 6] These findings support previous reports that physicians' recommendations about the need for screening mammography is an influential factor in determining women's decisions related to compliance.[7] Hence, the role of healthcare providers in all clinical care settings is pivotal in reducing mammography utilization disparities.
A recent study evaluating the breast cancer screening adherence among the hospitalized women aged 50 to 75 years noted that many (60%) were low income (annual household income <$20,000), 39% were nonadherent, and 35% were at high risk of developing breast cancer.[8] Further, a majority of these hospitalized women were amenable to inpatient screening mammography if due and offered during the hospital stay.[8] As a follow‐up, the purpose of the current study was to explore how hospitalists feel about getting involved in breast cancer screening and ordering screening mammograms for hospitalized women. We hypothesized that a greater proportion of hospitalists would order mammography for hospitalized women who were both overdue for screening and at high risk for developing breast cancer if they fundamentally believe that they have a role in breast cancer screening. This study also explored anticipated barriers that may be of concern to hospitalists when ordering inpatient screening mammography.
METHODS
Study Design and Sample
All hospitalist providers within 4 groups affiliated with Johns Hopkins Medical Institution (Johns Hopkins Hospital, Johns Hopkins Bayview Medical Center, Howard County General Hospital, and Suburban Hospital) were approached for participation in this‐cross sectional study. The hospitalists included physicians, nurse practitioners, and physician assistants. All hospitalists were eligible to participate in the study, and there was no monetary incentive attached to the study participation. A total of 110 hospitalists were approached for study participation. Of these, 4 hospitalists (3.5%) declined to participate, leaving a study population of 106 hospitalists.
Data Collection and Measures
Participants were sent the survey via email using SurveyMonkey. The survey included questions regarding demographic information such as age, gender, race, and clinical experience in hospital medicine. To evaluate for potential personal sources of bias related to mammography, study participants were asked if they have had a family member diagnosed with breast cancer.
A central question asked whether respondents agreed with the following: I believe that hospitalists should be involved in breast cancer screening. The questionnaire also evaluated hospitalists' practical approaches to 2 clinical scenarios by soliciting decision about whether they would order an inpatient screening mammogram. These clinical scenarios were designed using the Gail risk prediction score for probability of developing breast cancer within the next 5 years according to the National Cancer Institute Breast Cancer Risk Tool.[9] Study participants were not provided with the Gail scores and had to infer the risk from the clinical information provided in scenarios. One case described a woman at high risk, and the other with a lower‐risk profile. The first question was: Would you order screening mammography for a 65‐year‐old African American female with obesity and family history for breast cancer admitted to the hospital for cellulitis? She has never had a mammogram and is willing to have it while in hospital. Based on the information provided in the scenario, the 5‐year risk prediction for developing breast cancer using the Gail risk model was high (2.1%). The second scenario asked: Would you order a screening mammography for a 62‐year‐old healthy Hispanic female admitted for presyncope? Patient is uninsured and requests a screening mammogram while in hospital [assume that personal and family histories for breast cancer are negative]. Based on the information provided in the scenario, the 5‐year risk prediction for developing breast cancer using the Gail risk model was low (0.6%).
Several questions regarding potential barriers to inpatient screening mammography were also asked. Some of these questions were based on barriers mentioned in our earlier study of patients,[8] whereas others emerged from a review of the literature and during focus group discussions with hospitalist providers. Pilot testing of the survey was conducted on hospitalists outside the study sample to enhance question clarity. This study was approved by our institutional review board.
Statistical Methods
Respondent characteristics are presented as proportions and means. Unpaired t tests and [2] tests were used to look for associations between demographic characteristics and responses to the question about whether they believe that they should be involved in breast cancer screening. The survey data were analyzed using the Stata statistical software package version 12.1 (StataCorp, College Station, TX).
RESULTS
Out of 106 study subjects willing to participate, 8 did not respond, yielding a response rate of 92%. The mean age of the study participants was 37.6 years, and 55% were female. Almost two‐thirds of study participants (59%) were faculty physicians at an academic hospital, and the average clinical experience as a hospitalist was 4.6 years. Study participants were diverse with respect to ethnicity, and only 30% reported having a family member with breast cancer (Table 1). Because breast cancer is a disease that affects primarily women, stratified analysis by gender showed that most of these characteristic were similar across genders, except fewer women were full time (76% vs 93%, P=0.04) and on the faculty (44% vs 77%, P=0.003).
| Characteristics* | All Participants (n=98) |
|---|---|
| |
| Age, y, mean (SD) | 37.6 (5.5) |
| Female, n (%) | 54 (55) |
| Race, n (%) | |
| Caucasian | 35 (36) |
| African American | 12 (12) |
| Asian | 32 (33) |
| Other | 13 (13) |
| Hospitalist experience, y, mean (SD) | 4.6 (3.5) |
| Full time, n (%) | 82 (84) |
| Family history of breast cancer, n (%) | 30 (30) |
| Faculty physician, n (%) | 58 (59) |
| Believe that hospitalists should be involved in breast cancer screening, n (%) | 35 (38) |
Only 38% believed that hospitalists should be involved with breast cancer screening. The most commonly cited concern related to ordering an inpatient screening mammography was follow‐up of the results of the mammography, followed by the test may not be covered by patient's insurance. As shown in Table 2, these concerns were not perceived differently among providers who believed that hospitalists should be involved in breast cancer screening as compared to those who do not. Demographic variables from Table 1 failed to discern any significant associations related to believing that hospitalists should be involved with breast cancer screening or with concerns about the barriers to screening presented in Table 2 (data not shown). As shown in Table 2, overall, 32% hospitalists were willing to order a screening mammography during a hospital stay for the scenario of the woman at high risk for developing breast cancer (5‐year risk prediction using Gail model 2.1%) and 33% for the low‐risk scenario (5‐year risk prediction using Gail model 0.6%).
| Concern About Screening* | Believe That Hospitalists Should Be Involved in Breast Cancer Screening (n=35) | Do Not Believe That Hospitalists Should Be Involved in Breast Cancer Screening (n=58) | P Value |
|---|---|---|---|
| |||
| Result follow‐up, agree/strongly agree, n (%) | 34 (97) | 51 (88) | 0.25 |
| Interference with patient care, agree/strongly agree, n (%) | 23 (67) | 27 (47) | 0.07 |
| Cost, agree/strongly agree, n (%) | 23 (66) | 28 (48) | 0.10 |
| Concern that the test will not be covered by patient's insurance, agree/strongly agree, n (%) | 23 (66) | 34 (59) | 0.50 |
| Not my responsibility to do cancer prevention, agree/strongly agree, n (%) | 7 (20) | 16 (28) | 0.57 |
| Response to clinical scenarios | |||
| Would order a screening mammogram in the hospital for a high‐risk woman [scenario 1: Gail risk model: 2.1%], n (%) | 23 (66) | 6 (10) | 0.0001 |
| Would order a screening mammography in the hospital for a low‐risk woman [scenario 2: Gail risk model: 0.6%], n (%) | 18 (51) | 13 (22) | 0.004 |
DISCUSSION
Our study suggests that most hospitalists do not believe that they should be involved in breast cancer screening for their hospitalized patients. This perspective was not influenced by either the physician gender, family history for breast cancer, or by the patient's level of risk for developing breast cancer. When patients are in the hospital, both the setting and the acute illness are known to promote reflection and consideration of self‐care.[10] With major healthcare system changes on the horizon and the passing of the Affordable Care Act, we are becoming teams of providers who are collectively responsible for optimal care delivery. It may be possible to increase breast cancer screening rates by educating our patients and offering inpatient screening mammography while they are in the hospital, particularly to those who are at high risk of developing breast cancer.
Physician recommendations for preventive health and screening have consistently been found to be among the strongest predictors of screening utilization.[11] This is the first study to our knowledge that has attempted to understand hospitalists' views and concerns about ordering screening tests to detect occult malignancy. Although addressing preventive care during a hospitalization may seem complex and difficult, helping these women understand their personal risk profile (eg, family history of breast cancer, use of estrogen, race, age, and genetic risk factors) may be what is needed for beginning to influence perspective that might ultimately translate into a willingness to undergo screening.[12, 13, 14] Such delivery of patient‐centered care is built on a foundation of shared decision‐making, which takes into account the patient's preferences, values, and wishes.[15]
Ordering screening mammography for hospitalized patients will require a deeper understanding of hospitalists' attitudes, because the way that these physicians feel about the tests utility will dramatically influence the way that this opportunity is presented to patients, and ultimately the patients' preference to have or forego testing. Our study results are consistent with another publication that highlighted incongruence between physicians' views and patients' preferences for screening practices.[8, 11] Concerns cited, such as interference with patient's acute care, deserve attention, because it may be possible to carry out the screening in ways and at times that do not interfere with treatment or prolong length of stay. Exploring this with a feasibility study will be necessary. Such an approach has been advocated by Trimble et al. for inpatient cervical cancer screening as an efficient strategy to target high‐risk, nonadherent women.[16]
The inpatient setting allows for the elimination of major barriers to screening (like transportation and remembering to get to screening appointments),[8] thereby actively facilitating this needed service. Costs associated with inpatient screening mammography may deter both hospitalists and patients from screening; however, some insurers and Medicare pay for the full cost of screening tests, irrespective of the clinical setting.[17] Further, as hospitals or accountable care organizations become responsible for total cost per beneficiary, screening costs will be preferable when compared with the expenses associated with later detection of pathology and caring for advanced disease states.
One might question whether the mortality benefit of screening mammography is comparable among hospitalized women (who are theoretically sicker and with shorter life expectancy) and those cared for in outpatient practices. Unfortunately, we do not yet know the answer to this question, because data for inpatient screening mammography are nonexistent, and currently this is not considered as a standard of care. However, one can expect the benefits to be similar, if not greater, when performed in the outpatient setting, if preliminary efforts are directed at those who are both nonadherent and at high risk for breast cancer. According to 1 study, increasing mammography utilization by 5% in our country would prevent 560 deaths from breast cancer each year.[18]
Several limitations of this study should be considered. First, this cross‐sectional study was conducted at hospitals associated with a single institution and the results may not be generalizable. Second, although physicians' concerns were explored in this study, we did not solicit input about the potential impact of prevention and screening on the nursing staff. Third, there may be concerns about the hypothetical nature of anchoring and possible framing effects with the 2 clinical scenarios. Finally, it is possible that the hospitalists' response may have been subject to social desirability bias. That said, the response to the key question Do you think hospitalists should be involved in breast cancer screening? do not support a socially desirable bias.
Given the current policy emphasis on reducing disparities in cancer screening, it may be reasonable to expand the role of all healthcare providers and healthcare facilities in screening high‐risk populations. Screening tests that may seem difficult to coordinate in hospitals currently may become easier as our hospitals evolve to become more patient centered. Future studies are needed to evaluate the feasibility and potential barriers to inpatient screening mammography.
Disclosure
Disclosures: Dr. Wright is a Miller‐Coulson Family Scholar, and this support comes from Hopkins Center for Innovative Medicine. This work was made possible in part by the Maryland Cigarette Restitution Fund Research Grant at Johns Hopkins. The authors report no conflicts of interest.
- Centers for Disease Control and Prevention (CDC). Vital signs: breast cancer screening among women aged 50–74 years—United States, 2008. MMWR Morb Mortal Wkly Rep. 2010;59(26):813–816.
- American Cancer Society. Breast Cancer Facts 2013.
- , , , et al. Impact of socioeconomic status on cancer incidence and stage at diagnosis: selected findings from the surveillance, epidemiology, and end results: National Longitudinal Mortality Study. Cancer Causes Control. 2009;20:417–435.
- , , , ; Centers for Disease Control and Prevention. Breast cancer screening among adult women—behavioral risk factor surveillance system, United States, 2010. MMWR Morb Mortal Wkly Rep. 2012;61(suppl):46–50.
- , . Disparities in breast cancer. Curr Probl Cancer. 2007;31(3):134–156.
- , , . Factors associated with mammography utilization: a systematic quantitative review of the literature. J Womens Health (Larchmt). 2008;17:1477–1498.
- , , , et al. Processes of care in cervical and breast cancer screening and follow‐up: the importance of communication. Prev Med. 2004;39:81–90.
- , , , . Breast cancer screening preferences among hospitalized women. J Womens Health (Larchmt). 2013;22(7):637–642.
- , , , et al. Projecting individualized probabilities of developing breast cancer for white females who are being examined annually. J Natl Cancer Inst. 1989;8:1879–1886.
- , , , . Expanding the roles of hospitalist physicians to include public health. J Hosp Med. 2007;2:93–101.
- , , , et al. Colorectal cancer screening: conjoint analysis of consumer preferences and physicians' perceived consumer preferences in the US and Canada. Paper presented at: 27th Annual Meeting of the Society for Medical Decision Making; October 21–24, 2005; San Francisco, CA.
- , , . Family history of breast cancer: impact on the disease experience. Cancer Pract. 2000;8:135–142.
- , , , . Breast cancer knowledge and attitudes toward mammography as predictors of breast cancer preventive behavior in Kazakh, Korean, and Russian women in Kazakhstan. Int J Public Health. 2008;53:123–130.
- , , , , . The relation between projected breast cancer risk, perceived cancer risk, and mammography use. Results from the National Health Interview Survey. J Gen Intern Med. 2006;21:158–164.
- , . Patient‐centered communication in cancer care: promoting healing and reducing suffering. NIH publication no. 07‐6225. Bethesda, MD: National Cancer Institute, 2007.
- , , , , , . Effectiveness of screening for cervical cancer in an inpatient hospital setting. Obstet Gynecol. 2004;103(2):310–316.
- Centers for Medicare 38:600–609.
Testing for breast cancer is traditionally offered in outpatient settings, and screening mammography rates have plateaued since 2000.[1] Current data suggest that the mammography utilization gap by race has narrowed; however, disparity remains among low‐income, uninsured, and underinsured populations.[2, 3] The lowest compliance with screening mammography recommendations have been reported among women with low income (63.2%), uninsured (50.4%), and those without a usual source of healthcare (43.6%).[4] Although socioeconomic status, access to the healthcare system, and awareness about screening benefits can all influence women's willingness to have screening, the most common reason that women report for not having mammograms were that no one recommended the test.[5, 6] These findings support previous reports that physicians' recommendations about the need for screening mammography is an influential factor in determining women's decisions related to compliance.[7] Hence, the role of healthcare providers in all clinical care settings is pivotal in reducing mammography utilization disparities.
A recent study evaluating the breast cancer screening adherence among the hospitalized women aged 50 to 75 years noted that many (60%) were low income (annual household income <$20,000), 39% were nonadherent, and 35% were at high risk of developing breast cancer.[8] Further, a majority of these hospitalized women were amenable to inpatient screening mammography if due and offered during the hospital stay.[8] As a follow‐up, the purpose of the current study was to explore how hospitalists feel about getting involved in breast cancer screening and ordering screening mammograms for hospitalized women. We hypothesized that a greater proportion of hospitalists would order mammography for hospitalized women who were both overdue for screening and at high risk for developing breast cancer if they fundamentally believe that they have a role in breast cancer screening. This study also explored anticipated barriers that may be of concern to hospitalists when ordering inpatient screening mammography.
METHODS
Study Design and Sample
All hospitalist providers within 4 groups affiliated with Johns Hopkins Medical Institution (Johns Hopkins Hospital, Johns Hopkins Bayview Medical Center, Howard County General Hospital, and Suburban Hospital) were approached for participation in this‐cross sectional study. The hospitalists included physicians, nurse practitioners, and physician assistants. All hospitalists were eligible to participate in the study, and there was no monetary incentive attached to the study participation. A total of 110 hospitalists were approached for study participation. Of these, 4 hospitalists (3.5%) declined to participate, leaving a study population of 106 hospitalists.
Data Collection and Measures
Participants were sent the survey via email using SurveyMonkey. The survey included questions regarding demographic information such as age, gender, race, and clinical experience in hospital medicine. To evaluate for potential personal sources of bias related to mammography, study participants were asked if they have had a family member diagnosed with breast cancer.
A central question asked whether respondents agreed with the following: I believe that hospitalists should be involved in breast cancer screening. The questionnaire also evaluated hospitalists' practical approaches to 2 clinical scenarios by soliciting decision about whether they would order an inpatient screening mammogram. These clinical scenarios were designed using the Gail risk prediction score for probability of developing breast cancer within the next 5 years according to the National Cancer Institute Breast Cancer Risk Tool.[9] Study participants were not provided with the Gail scores and had to infer the risk from the clinical information provided in scenarios. One case described a woman at high risk, and the other with a lower‐risk profile. The first question was: Would you order screening mammography for a 65‐year‐old African American female with obesity and family history for breast cancer admitted to the hospital for cellulitis? She has never had a mammogram and is willing to have it while in hospital. Based on the information provided in the scenario, the 5‐year risk prediction for developing breast cancer using the Gail risk model was high (2.1%). The second scenario asked: Would you order a screening mammography for a 62‐year‐old healthy Hispanic female admitted for presyncope? Patient is uninsured and requests a screening mammogram while in hospital [assume that personal and family histories for breast cancer are negative]. Based on the information provided in the scenario, the 5‐year risk prediction for developing breast cancer using the Gail risk model was low (0.6%).
Several questions regarding potential barriers to inpatient screening mammography were also asked. Some of these questions were based on barriers mentioned in our earlier study of patients,[8] whereas others emerged from a review of the literature and during focus group discussions with hospitalist providers. Pilot testing of the survey was conducted on hospitalists outside the study sample to enhance question clarity. This study was approved by our institutional review board.
Statistical Methods
Respondent characteristics are presented as proportions and means. Unpaired t tests and [2] tests were used to look for associations between demographic characteristics and responses to the question about whether they believe that they should be involved in breast cancer screening. The survey data were analyzed using the Stata statistical software package version 12.1 (StataCorp, College Station, TX).
RESULTS
Out of 106 study subjects willing to participate, 8 did not respond, yielding a response rate of 92%. The mean age of the study participants was 37.6 years, and 55% were female. Almost two‐thirds of study participants (59%) were faculty physicians at an academic hospital, and the average clinical experience as a hospitalist was 4.6 years. Study participants were diverse with respect to ethnicity, and only 30% reported having a family member with breast cancer (Table 1). Because breast cancer is a disease that affects primarily women, stratified analysis by gender showed that most of these characteristic were similar across genders, except fewer women were full time (76% vs 93%, P=0.04) and on the faculty (44% vs 77%, P=0.003).
| Characteristics* | All Participants (n=98) |
|---|---|
| |
| Age, y, mean (SD) | 37.6 (5.5) |
| Female, n (%) | 54 (55) |
| Race, n (%) | |
| Caucasian | 35 (36) |
| African American | 12 (12) |
| Asian | 32 (33) |
| Other | 13 (13) |
| Hospitalist experience, y, mean (SD) | 4.6 (3.5) |
| Full time, n (%) | 82 (84) |
| Family history of breast cancer, n (%) | 30 (30) |
| Faculty physician, n (%) | 58 (59) |
| Believe that hospitalists should be involved in breast cancer screening, n (%) | 35 (38) |
Only 38% believed that hospitalists should be involved with breast cancer screening. The most commonly cited concern related to ordering an inpatient screening mammography was follow‐up of the results of the mammography, followed by the test may not be covered by patient's insurance. As shown in Table 2, these concerns were not perceived differently among providers who believed that hospitalists should be involved in breast cancer screening as compared to those who do not. Demographic variables from Table 1 failed to discern any significant associations related to believing that hospitalists should be involved with breast cancer screening or with concerns about the barriers to screening presented in Table 2 (data not shown). As shown in Table 2, overall, 32% hospitalists were willing to order a screening mammography during a hospital stay for the scenario of the woman at high risk for developing breast cancer (5‐year risk prediction using Gail model 2.1%) and 33% for the low‐risk scenario (5‐year risk prediction using Gail model 0.6%).
| Concern About Screening* | Believe That Hospitalists Should Be Involved in Breast Cancer Screening (n=35) | Do Not Believe That Hospitalists Should Be Involved in Breast Cancer Screening (n=58) | P Value |
|---|---|---|---|
| |||
| Result follow‐up, agree/strongly agree, n (%) | 34 (97) | 51 (88) | 0.25 |
| Interference with patient care, agree/strongly agree, n (%) | 23 (67) | 27 (47) | 0.07 |
| Cost, agree/strongly agree, n (%) | 23 (66) | 28 (48) | 0.10 |
| Concern that the test will not be covered by patient's insurance, agree/strongly agree, n (%) | 23 (66) | 34 (59) | 0.50 |
| Not my responsibility to do cancer prevention, agree/strongly agree, n (%) | 7 (20) | 16 (28) | 0.57 |
| Response to clinical scenarios | |||
| Would order a screening mammogram in the hospital for a high‐risk woman [scenario 1: Gail risk model: 2.1%], n (%) | 23 (66) | 6 (10) | 0.0001 |
| Would order a screening mammography in the hospital for a low‐risk woman [scenario 2: Gail risk model: 0.6%], n (%) | 18 (51) | 13 (22) | 0.004 |
DISCUSSION
Our study suggests that most hospitalists do not believe that they should be involved in breast cancer screening for their hospitalized patients. This perspective was not influenced by either the physician gender, family history for breast cancer, or by the patient's level of risk for developing breast cancer. When patients are in the hospital, both the setting and the acute illness are known to promote reflection and consideration of self‐care.[10] With major healthcare system changes on the horizon and the passing of the Affordable Care Act, we are becoming teams of providers who are collectively responsible for optimal care delivery. It may be possible to increase breast cancer screening rates by educating our patients and offering inpatient screening mammography while they are in the hospital, particularly to those who are at high risk of developing breast cancer.
Physician recommendations for preventive health and screening have consistently been found to be among the strongest predictors of screening utilization.[11] This is the first study to our knowledge that has attempted to understand hospitalists' views and concerns about ordering screening tests to detect occult malignancy. Although addressing preventive care during a hospitalization may seem complex and difficult, helping these women understand their personal risk profile (eg, family history of breast cancer, use of estrogen, race, age, and genetic risk factors) may be what is needed for beginning to influence perspective that might ultimately translate into a willingness to undergo screening.[12, 13, 14] Such delivery of patient‐centered care is built on a foundation of shared decision‐making, which takes into account the patient's preferences, values, and wishes.[15]
Ordering screening mammography for hospitalized patients will require a deeper understanding of hospitalists' attitudes, because the way that these physicians feel about the tests utility will dramatically influence the way that this opportunity is presented to patients, and ultimately the patients' preference to have or forego testing. Our study results are consistent with another publication that highlighted incongruence between physicians' views and patients' preferences for screening practices.[8, 11] Concerns cited, such as interference with patient's acute care, deserve attention, because it may be possible to carry out the screening in ways and at times that do not interfere with treatment or prolong length of stay. Exploring this with a feasibility study will be necessary. Such an approach has been advocated by Trimble et al. for inpatient cervical cancer screening as an efficient strategy to target high‐risk, nonadherent women.[16]
The inpatient setting allows for the elimination of major barriers to screening (like transportation and remembering to get to screening appointments),[8] thereby actively facilitating this needed service. Costs associated with inpatient screening mammography may deter both hospitalists and patients from screening; however, some insurers and Medicare pay for the full cost of screening tests, irrespective of the clinical setting.[17] Further, as hospitals or accountable care organizations become responsible for total cost per beneficiary, screening costs will be preferable when compared with the expenses associated with later detection of pathology and caring for advanced disease states.
One might question whether the mortality benefit of screening mammography is comparable among hospitalized women (who are theoretically sicker and with shorter life expectancy) and those cared for in outpatient practices. Unfortunately, we do not yet know the answer to this question, because data for inpatient screening mammography are nonexistent, and currently this is not considered as a standard of care. However, one can expect the benefits to be similar, if not greater, when performed in the outpatient setting, if preliminary efforts are directed at those who are both nonadherent and at high risk for breast cancer. According to 1 study, increasing mammography utilization by 5% in our country would prevent 560 deaths from breast cancer each year.[18]
Several limitations of this study should be considered. First, this cross‐sectional study was conducted at hospitals associated with a single institution and the results may not be generalizable. Second, although physicians' concerns were explored in this study, we did not solicit input about the potential impact of prevention and screening on the nursing staff. Third, there may be concerns about the hypothetical nature of anchoring and possible framing effects with the 2 clinical scenarios. Finally, it is possible that the hospitalists' response may have been subject to social desirability bias. That said, the response to the key question Do you think hospitalists should be involved in breast cancer screening? do not support a socially desirable bias.
Given the current policy emphasis on reducing disparities in cancer screening, it may be reasonable to expand the role of all healthcare providers and healthcare facilities in screening high‐risk populations. Screening tests that may seem difficult to coordinate in hospitals currently may become easier as our hospitals evolve to become more patient centered. Future studies are needed to evaluate the feasibility and potential barriers to inpatient screening mammography.
Disclosure
Disclosures: Dr. Wright is a Miller‐Coulson Family Scholar, and this support comes from Hopkins Center for Innovative Medicine. This work was made possible in part by the Maryland Cigarette Restitution Fund Research Grant at Johns Hopkins. The authors report no conflicts of interest.
- Centers for Disease Control and Prevention (CDC). Vital signs: breast cancer screening among women aged 50–74 years—United States, 2008. MMWR Morb Mortal Wkly Rep. 2010;59(26):813–816.
- American Cancer Society. Breast Cancer Facts 2013.
- , , , et al. Impact of socioeconomic status on cancer incidence and stage at diagnosis: selected findings from the surveillance, epidemiology, and end results: National Longitudinal Mortality Study. Cancer Causes Control. 2009;20:417–435.
- , , , ; Centers for Disease Control and Prevention. Breast cancer screening among adult women—behavioral risk factor surveillance system, United States, 2010. MMWR Morb Mortal Wkly Rep. 2012;61(suppl):46–50.
- , . Disparities in breast cancer. Curr Probl Cancer. 2007;31(3):134–156.
- , , . Factors associated with mammography utilization: a systematic quantitative review of the literature. J Womens Health (Larchmt). 2008;17:1477–1498.
- , , , et al. Processes of care in cervical and breast cancer screening and follow‐up: the importance of communication. Prev Med. 2004;39:81–90.
- , , , . Breast cancer screening preferences among hospitalized women. J Womens Health (Larchmt). 2013;22(7):637–642.
- , , , et al. Projecting individualized probabilities of developing breast cancer for white females who are being examined annually. J Natl Cancer Inst. 1989;8:1879–1886.
- , , , . Expanding the roles of hospitalist physicians to include public health. J Hosp Med. 2007;2:93–101.
- , , , et al. Colorectal cancer screening: conjoint analysis of consumer preferences and physicians' perceived consumer preferences in the US and Canada. Paper presented at: 27th Annual Meeting of the Society for Medical Decision Making; October 21–24, 2005; San Francisco, CA.
- , , . Family history of breast cancer: impact on the disease experience. Cancer Pract. 2000;8:135–142.
- , , , . Breast cancer knowledge and attitudes toward mammography as predictors of breast cancer preventive behavior in Kazakh, Korean, and Russian women in Kazakhstan. Int J Public Health. 2008;53:123–130.
- , , , , . The relation between projected breast cancer risk, perceived cancer risk, and mammography use. Results from the National Health Interview Survey. J Gen Intern Med. 2006;21:158–164.
- , . Patient‐centered communication in cancer care: promoting healing and reducing suffering. NIH publication no. 07‐6225. Bethesda, MD: National Cancer Institute, 2007.
- , , , , , . Effectiveness of screening for cervical cancer in an inpatient hospital setting. Obstet Gynecol. 2004;103(2):310–316.
- Centers for Medicare 38:600–609.
© 2015 Society of Hospital Medicine