User login
Project BOOST
Enactment of federal legislation imposing hospital reimbursement penalties for excess rates of rehospitalizations among Medicare fee for service beneficiaries markedly increased interest in hospital quality improvement (QI) efforts to reduce the observed 30‐day rehospitalization of 19.6% in this elderly population.[1, 2] The Congressional Budget Office estimated that reimbursement penalties to hospitals for high readmission rates are expected to save the Medicare program approximately $7 billion between 2010 and 2019.[3] These penalties are complemented by resources from the Center for Medicare and Medicaid Innovation aiming to reduce hospital readmissions by 20% by the end of 2013 through the Partnership for Patients campaign.[4] Although potential financial penalties and provision of resources for QI intensified efforts to enhance the quality of the hospital discharge transition, patient safety risks associated with hospital discharge are well documented.[5, 6] Approximately 20% of patients discharged from the hospital may suffer adverse events,[7, 8] of which up to three‐quarters (72%) are medication related,[9] and over one‐third of required follow‐up testing after discharge is not completed.[10] Such findings indicate opportunities for improvement in the discharge process.[11]
Numerous publications describe studies aiming to improve the hospital discharge process and mitigate these hazards, though a systematic review of interventions to reduce 30‐day rehospitalization indicated that the existing evidence base for the effectiveness of transition interventions demonstrates irregular effectiveness and limitations to generalizability.[12] Most studies showing effectiveness are confined to single academic medical centers. Existing evidence supports multifaceted interventions implemented in both the pre‐ and postdischarge periods and focused on risk assessment and tailored, patient‐centered application of interventions to mitigate risk. For example Project RED (Re‐Engineered Discharge) applied a bundled intervention consisting of intensified patient education and discharge planning, improved medication reconciliation and discharge instructions, and longitudinal patient contact with follow‐up phone calls and a dedicated discharge advocate.[13] However, the mean age of patients participating in the study was 50 years, and it excluded patients admitted from or discharged to skilled nursing facilities, making generalizability to the geriatric population uncertain.
An integral aspect of QI projects is the contribution of local context to translation of best practices to disparate settings.[14, 15, 16] Most available reports of successful interventions to reduce rehospitalization have not fully described the specifics of either the intervention context or design. Moreover, the available evidence base for common interventions to reduce rehospitalization was developed in the academic setting. Validation of single academic center studies in a broader healthcare context is necessary.
Project BOOST (Better Outcomes for Older adults through Safe Transitions) recruited a diverse national cohort of both academic and nonacademic hospitals to participate in a QI effort to implement best practices for hospital discharge care transitions using a national collaborative approach facilitated by external expert mentorship. This study aimed to determine the effectiveness of BOOST in lowering hospital readmission rates and impact on length of stay.
METHODS
The study of Project BOOST was undertaken in accordance with the SQUIRE (Standards for Quality Improvement Reporting Excellence) Guidelines.[17]
Participants
The unit of observation for the prospective cohort study was the clinical acute‐care unit within hospitals. Sites were instructed to designate a pilot unit for the intervention that cared for medical or mixed medicalsurgical patient populations. Sites were also asked to provide outcome data for a clinically and organizationally similar non‐BOOST unit to provide a site‐matched control. Control units were matched by local site leadership based on comparable patient demographics, clinical mix, and extent of housestaff presence. An initial cohort of 6 hospitals in 2008 was followed by a second cohort of 24 hospitals initiated in 2009. All hospitals were invited to participate in the national effectiveness analysis, which required submission of readmission and length of stay data for both a BOOST intervention unit and a clinically matched control unit.
Description of the Intervention
The BOOST intervention consisted of 2 major sequential processes, planning and implementation, both facilitated by external site mentorsphysicians expert in QI and care transitionsfor a period of 12 months. Extensive background on the planning and implementation components is available at
| Enrollment Sites, n=30 | Sites Reporting Outcome Data, n=11 | Sites Not Reporting Outcome Data, n=19 | P Value for Comparison of Outcome Data Sites Compared to Othersa | |
|---|---|---|---|---|
| ||||
| Region, n (%) | 0.194 | |||
| Northeast | 8 (26.7) | 2 (18.2) | 6 (31.6) | |
| West | 7 (23.4) | 2 (18.2) | 5 (26.3) | |
| South | 7 (23.4) | 3 (27.3) | 4 (21.1) | |
| Midwest | 8 (26.7) | 4 (36.4) | 4 (21.1) | |
| Urban location, n (%) | 25 (83.3) | 11 (100) | 15 (78.9) | 0.035 |
| Teaching status, n (%) | 0.036 | |||
| Academic medical center | 10 (33.4) | 5 (45.5) | 5 (26.3) | |
| Community teaching | 8 (26.7) | 3 (27.3) | 5 (26.3) | |
| Community nonteaching | 12 (40) | 3 (27.3) | 9 (47.4) | |
| Beds number, mean (SD) | 426.6 (220.6) | 559.2 (187.8) | 349.79 (204.48) | 0.003 |
| Number of tools implemented, n (%) | 0.194 | |||
| 0 | 2 (6.7) | 0 | 2 (10.5) | |
| 1 | 2 (6.7) | 0 | 2 (10.5) | |
| 2 | 4 (13.3) | 2 (18.2) | 2 (10.5) | |
| 3 | 12 (40.0) | 3 (27.3) | 8 (42.1) | |
| 4 | 9 (30.0) | 5 (45.5) | 4 (21.1) | |
| 5 | 1 (3.3) | 1 (9.1) | 1 (5.3) | |
Mentor engagement with sites consisted of a 2‐day kickoff training on the BOOST tools, where site teams met their mentor and initiated development of structured action plans, followed by 5 to 6 scheduled phone calls in the subsequent 12 months. During these conference calls, mentors gauged progress and sought to help troubleshoot barriers to implementation. Some mentors also conducted a site visit with participant sites. Project BOOST provided sites with several collaborative activities including online webinars and an online listserv. Sites also received a quarterly newsletter.
Outcome Measures
The primary outcome was 30‐day rehospitalization defined as same hospital, all‐cause rehospitalization. Home discharges as well as discharges or transfers to other healthcare facilities were included in the discharge calculation. Elective or scheduled rehospitalizations as well as multiple rehospitalizations in the same 30‐day window were considered individual rehospitalization events. Rehospitalization was reported as a ratio of 30‐day rehospitalizations divided by live discharges in a calendar month. Length of stay was reported as the mean length of stay among live discharges in a calendar month. Outcomes were calculated at the participant site and then uploaded as overall monthly unit outcomes to a Web‐based research database.
To account for seasonal trends as well as marked variation in month‐to‐month rehospitalization rates identified in longitudinal data, we elected to compare 3‐month year‐over‐year averages to determine relative changes in readmission rates from the period prior to BOOST implementation to the period after BOOST implementation. We calculated averages for rehospitalization and length of stay in the 3‐month period preceding the sites' first reported month of front‐line implementation and in the corresponding 3‐month period in the subsequent calendar year. For example, if a site reported implementing its first tool in April 2010, the average readmission rate in the unit for January 2011 through March 2011 was subtracted from the average readmission rate for January 2010 through March 2010.
Sites were surveyed regarding tool implementation rates 6 months and 24 months after the 2009 kickoff training session. Surveys were electronically completed by site leaders in consultation with site team members. The survey identified new tool implementation as well as modification of existing care processes using the BOOST tools (admission risk assessment, discharge readiness checklist, teach back use, mandate regarding discharge summary completion, follow‐up phone calls to >80% of discharges). Use of a sixth tool, creation of individualized written discharge instructions, was not measured. We credited sites with tool implementation if they reported either de novo tool use or alteration of previous care processes influenced by BOOST tools.
Clinical outcome reporting was voluntary, and sites did not receive compensation and were not subject to penalty for the degree of implementation or outcome reporting. No patient‐level information was collected for the analysis, which was approved by the Northwestern University institutional review board.
Data Sources and Methods
Readmission and length of stay data, including the unit level readmission rate, as collected from administrative sources at each hospital, were collected using templated spreadsheet software between December 2008 and June 2010, after which data were loaded directly to a Web‐based data‐tracking platform. Sites were asked to load data as they became available. Sites were asked to report the number of study unit discharges as well as the number of those discharges readmitted within 30 days; however, reporting of the number of patient discharges was inconsistent across sites. Serial outreach consisting of monthly phone calls or email messaging to site leaders was conducted throughout 2011 to increase site participation in the project analysis.
Implementation date information was collected from 2 sources. The first was through online surveys distributed in November 2009 and April 2011. The second was through fields in the Web‐based data tracking platform to which sites uploaded data. In cases where disagreement was found between these 2 sources, the site leader was contacted for clarification.
Practice setting (community teaching, community nonteaching, academic medical center) was determined by site‐leader report within the Web‐based data tracking platform. Data for hospital characteristics (number of licensed beds and geographic region) were obtained from the American Hospital Association's Annual Survey of Hospitals.[18] Hospital region was characterized as West, South, Midwest, or Northeast.
Analysis
The null hypothesis was that no prepost difference existed in readmission rates within BOOST units, and no difference existed in the prepost change in readmission rates in BOOST units when compared to site‐matched control units. The Wilcoxon rank sum test was used to test whether observed changes described above were significantly different from 0, supporting rejection of the null hypotheses. We performed similar tests to determine the significance of observed changes in length of stay. We performed our analysis using SAS 9.3 (SAS Institute Inc., Cary, NC).
RESULTS
Eleven hospitals provided rehospitalization and length‐of‐stay outcome data for both a BOOST and control unit for the pre‐ and postimplementation periods. Compared to the 19 sites that did not participate in the analysis, these 11 sites were significantly larger (559188 beds vs 350205 beds, P=0.003), more likely to be located in an urban area (100.0% [n=11] vs 78.9% [n=15], P=0.035), and more likely to be academic medical centers (45.5% [n=5] vs 26.3% [n=5], P=0.036) (Table 1).
The mean number of tools implemented by sites participating in the analysis was 3.50.9. All sites implemented at least 2 tools. The duration between attendance at the BOOST kickoff event and first tool implementation ranged from 3 months (first tool implemented prior to attending the kickoff) and 9 months (mean duration, 3.34.3 months) (Table 2).
| Hospital | Region | Hospital Type | No. Licensed Beds | Kickoff Implementationa | Risk Assessment | Discharge Checklist | Teach Back | Discharge Summary Completion | Follow‐up Phone Call | Total |
|---|---|---|---|---|---|---|---|---|---|---|
| ||||||||||
| 1 | Midwest | Community teaching | <300 | 8 | 3 | |||||
| 2 | West | Community teaching | >600 | 0 | 4 | |||||
| 3 | Northeast | Academic medical center | >600 | 2 | 4 | |||||
| 4 | Northeast | Community nonteaching | <300 | 9 | 2 | |||||
| 5 | South | Community nonteaching | >600 | 6 | 3 | |||||
| 6 | South | Community nonteaching | >600 | 3 | 4 | |||||
| 7 | Midwest | Community teaching | 300600 | 1 | 5 | |||||
| 8 | West | Academic medical center | 300600 | 1 | 4 | |||||
| 9 | South | Academic medical center | >600 | 4 | 4 | |||||
| 10 | Midwest | Academic medical center | 300600 | 3 | 3 | |||||
| 11 | Midwest | Academic medical center | >600 | 9 | 2 | |||||
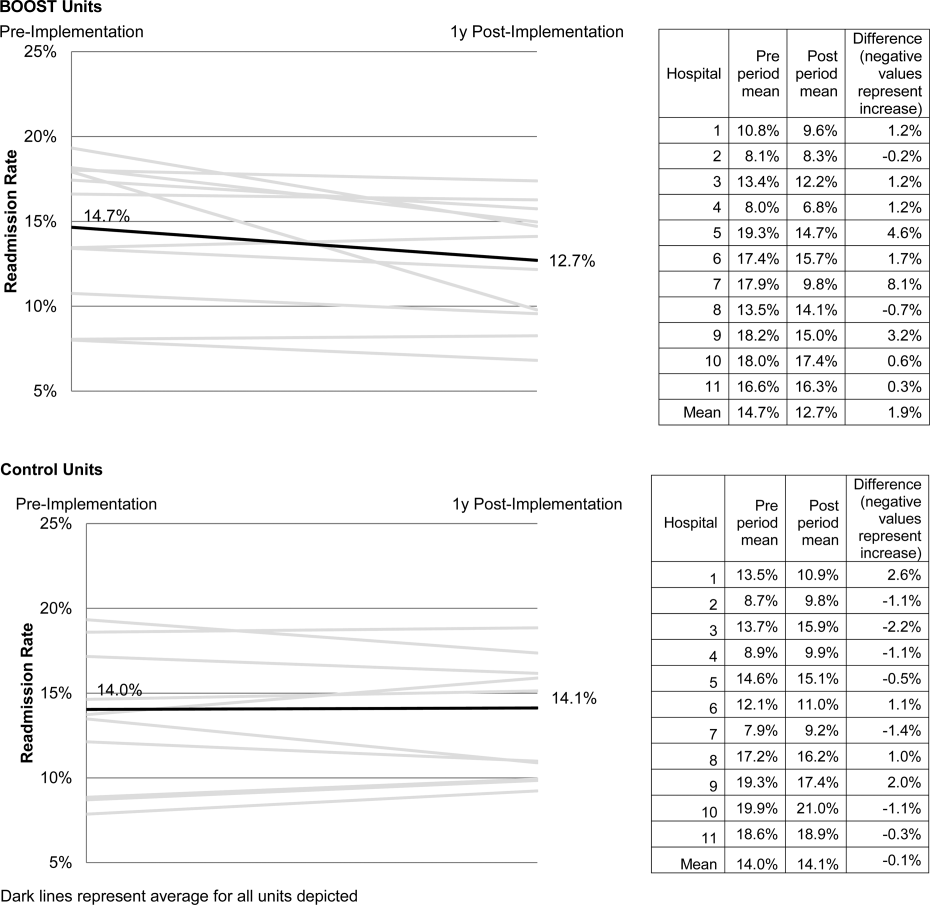
The average rate of 30‐day rehospitalization among BOOST units was 14.7% in the preimplementation period and 12.7% during the postimplementation period (P=0.010) (Figure 1). Rehospitalization rates for matched control units were 14.0% in the preintervention period and 14.1% in the postintervention period (P=0.831). The mean absolute reduction in readmission rates over the 1‐year study period in BOOST units compared to control units was 2.0%, or a relative reduction of 13.6% (P=0.054 for signed rank test comparing differences in readmission rate reduction in BOOST units compared to site‐matched control units). Length of stay in BOOST and control units decreased an average of 0.5 days and 0.3 days, respectively. There was no difference in length of stay change between BOOST units and control units (P=0.966).
DISCUSSION
As hospitals strive to reduce their readmission rates to avoid Centers for Medicare and Medicaid Services penalties, Project BOOST may be a viable QI approach to achieve their goals. This initial evaluation of participation in Project BOOST by 11 hospitals of varying sizes across the United States showed an associated reduction in rehospitalization rates (absolute=2.0% and relative=13.6%, P=0.054). We did not find any significant change in length of stay among these hospitals implementing BOOST tools.
The tools provided to participating hospitals were developed from evidence found in peer‐reviewed literature established through experimental methods in well‐controlled academic settings. Further tool development was informed by recommendations of an advisory board consisting of expert representatives and advocates involved in the hospital discharge process: patients, caregivers, physicians, nurses, case managers, social workers, insurers, and regulatory and research agencies.[19] The toolkit components address multiple aspects of hospital discharge and follow‐up with the goal of improving health by optimizing the safety of care transitions. Our observation that readmission rates appeared to improve in a diverse hospital sample including nonacademic and community hospitals engaged in Project BOOST is reassuring that the benefits seen in existing research literature, developed in distinctly academic settings, can be replicated in diverse acute‐care settings.
The effect size observed in our study was modest but consistent with several studies identified in a recent review of trials measuring interventions to reduce rehospitalization, where 7 of 16 studies showing a significant improvement registered change in the 0% to 5% absolute range.[12] Impact of this project may have been tempered by the need to translate external QI content to the local setting. Additionally, in contrast to experimental studies that are limited in scope and timing and often scaled to a research budget, BOOST sites were encouraged to implement Project BOOST in the clinical setting even if no new funds were available to support the effort.[12]
The recruitment of a national sample of both academic and nonacademic hospital participants imposed several limitations on our study and analysis. We recognize that intervention units selected by hospitals may have had unmeasured unit and patient characteristics that facilitated successful change and contributed to the observed improvements. However, because external pressure to reduce readmission is present across all hospitals independent of the BOOST intervention, we felt site‐matched controls were essential to understanding effects attributable to the BOOST tools. Differences between units would be expected to be stable over the course of the study period, and comparison of outcome differences between 2 different time periods would be reasonable. Additionally, we could not collect data on readmissions to other hospitals. Theoretically, patients discharged from BOOST units might be more likely to have been rehospitalized elsewhere, but the fraction of rehospitalizations occurring at alternate facilities would also be expected to be similar on the matched control unit.
We report findings from a voluntary cohort willing and capable of designating a comparison clinical unit and contributing the requested data outcomes. Pilot sites that did not report outcomes were not analyzed, but comparison of hospital characteristics shows that participating hospitals were more likely to be large, urban, academic medical centers. Although barriers to data submission were not formally analyzed, reports from nonparticipating sites describe data submission limited by local implementation design (no geographic rollout or simultaneous rollout on all appropriate clinical units), site specific inability to generate unit level outcome statistics, and competing organizational priorities for data analyst time (electronic medical record deployment, alternative QI initiatives). The external validity of our results may be limited to organizations capable of analytics at the level of the individual clinical unit as well as those with sufficient QI resources to support reporting to a national database in the absence of a payer mandate. It is possible that additional financial support for on‐site data collection would have bolstered participation, making the example of participation rates we present potentially informative to organizations hoping to widely disseminate a QI agenda.
Nonetheless, the effectiveness demonstrated in the 11 sites that did participate is encouraging, and ongoing collaboration with subsequent BOOST cohorts has been designed to further facilitate data collection. Among the insights gained from this pilot experience, and incorporated into ongoing BOOST cohorts, is the importance of intensive mentor engagement to foster accountability among participant sites, assist with implementation troubleshooting, and offer expertise that is often particularly effective in gaining local support. We now encourage sites to have 2 mentor site visits to further these roles and more frequent conference calls. Further research to understand the marginal benefit of the mentored implementation approach is ongoing.
The limitations in data submission we experienced with the pilot cohort likely reflect resource constraints not uncommon at many hospitals. Increasing pressure placed on hospitals as a result of the Readmission Reduction Program within the Affordable Care Act as well as increasing interest from private and Medicaid payors to incorporate similar readmission‐based penalties provide encouragement for hospitals to enhance their data and analytic skills. National incentives for implementation of electronic health records (EHR) should also foster such capabilities, though we often saw EHRs as a barrier to QI, especially rapid cycle trials. Fortunately, hospitals are increasingly being afforded access to comprehensive claims databases to assist in tracking readmission rates to other facilities, and these data are becoming available in a more timely fashion. This more robust data collection, facilitated by private payors, state QI organizations, and state hospital associations, will support additional analytic methods such as multivariate regression models and interrupted time series designs to appreciate the experience of current BOOST participants.
Additional research is needed to understand the role of organizational context in the effectiveness of Project BOOST. Differences in rates of tool implementation and changes in clinical outcomes are likely dependent on local implementation context at the level of the healthcare organization and individual clinical unit.[20] Progress reports from site mentors and previously described experiences of QI implementation indicate that successful implementation of a multidimensional bundle of interventions may have reflected a higher level of institutional support, more robust team engagement in the work of reducing readmissions, increased clinical staff support for change, the presence of an effective project champion, or a key facilitating role of external mentorship.[21, 22] Ongoing data collection will continue to measure the sustainability of tool use and observed outcome changes to inform strategies to maintain gains associated with implementation. The role of mentored implementation in facilitating gains also requires further study.
Increasing attention to the problem of avoidable rehospitalization is driving hospitals, insurers, and policy makers to pursue QI efforts that favorably impact readmission rates. Our analysis of the BOOST intervention suggests that modest gains can be achieved following evidence‐based hospital process change facilitated by a mentored implementation model. However, realization of the goal of a 20% reduction in rehospitalization proposed by the Center for Medicare and Medicaid Services' Partnership for Patients initiative may be difficult to achieve on a national scale,[23] especially if efforts focus on just the hospital.
Acknowledgments
The authors acknowledge the contributions of Amanda Creden, BA (data collection), Julia Lee (biostatistical support), and the support of Amy Berman, BS, RN, Senior Program Officer at The John A. Hartford Foundation.
Disclosures
Project BOOST was funded by a grant from The John A. Hartford Foundation. Project BOOST is administered by the Society of Hospital Medicine (SHM). The development of the Project BOOST toolkit, recruitment of sites for this study, mentorship of the pilot cohort, project evaluation planning, and collection of pilot data were funded by a grant from The John A. Harford Foundation. Additional funding for continued data collection and analysis was funded by the SHM through funds from hospitals to participate in Project BOOST, specifically with funding support for Dr. Hansen. Dr. Williams has received funding to serve as Principal Investigator for Project BOOST. Since the time of initial cohort participation, approximately 125 additional hospitals have participated in the mentored implementation of Project BOOST. This participation was funded through a combination of site‐based tuition, third‐party payor support from private insurers, foundations, and federal funding through the Center for Medicare and Medicaid Innovation Partnership for Patients program. Drs. Greenwald, Hansen, and Williams are Project BOOST mentors for current Project BOOST sites and receive financial support through the SHM for this work. Dr. Howell has previously received funding as a Project BOOST mentor. Ms. Budnitz is the BOOST Project Director and is Chief Strategy and Development Officer for the HM. Dr. Maynard is the Senior Vice President of the SHM's Center for Hospital Innovation and Improvement.
References
- , , . Rehospitalizations among patients in the Medicare fee‐for‐service program. N Engl J Med. 2009;360(14):1418–1428.
- United States Congress. House Committee on Education and Labor. Coe on Ways and Means, Committee on Energy and Commerce, Compilation of Patient Protection and Affordable Care Act: as amended through November 1, 2010 including Patient Protection and Affordable Care Act health‐related portions of the Health Care and Education Reconciliation Act of 2010. Washington, DC: US Government Printing Office; 2010.
- Cost estimate for the amendment in the nature of a substitute to H.R. 3590, as proposed in the Senate on November 18, 2009. Washington, DC: Congressional Budget Office; 2009.
- Partnership for Patients, Center for Medicare and Medicaid Innovation. Available at: http://www.innovations.cms.gov/initiatives/Partnership‐for‐Patients/index.html. Accessed December 12, 2012.
- , . Providers have failed to work for continuity. Hospitals. 1979;53(10):79.
- , . Executing high‐quality care transitions: a call to do it right. J Hosp Med. 2007;2(5):287–290.
- , , , , . The incidence and severity of adverse events affecting patients after discharge from the hospital. Ann Intern Med. 2003;138(3):161–167.
- , , , et al. Adverse events among medical patients after discharge from hospital. CMAJ. 2004;170(3):345–349.
- , , , et al. Making inpatient medication reconciliation patient centered, clinically relevant and implementable: a consensus statement on key principles and necessary first steps. J Hosp Med. 2010;5(8):477–485.
- , , . Tying up loose ends: discharging patients with unresolved medical issues. Arch Intern Med. 2007;167(12):1305.
- , , , , , . Deficits in communication and information transfer between hospital‐based and primary care physicians. JAMA. 2007;297(8):831–841.
- , , , , . Interventions to reduce 30‐day rehospitalization: a systematic review. Ann Intern Med. 2011;155(8):520–528.
- , , , et al. A reengineered hospital discharge program to decrease rehospitalization: a randomized trial. Ann Intern Med. 2009;150(3):178.
- , , , et al. Advancing the science of patient safety. Ann Intern Med. 2011;154(10):693–696.
- , . From best evidence to best practice: effective implementation of change in patients' care. Lancet. 2003;362(9391):1225–1230.
- , , , et al. Quality improvement projects targeting health care‐associated infections: comparing virtual collaborative and toolkit approaches. J Hosp Med. 2011;6(5):271–278.
- , , , , . Publication guidelines for improvement studies in health care: evolution of the SQUIRE project. Ann Intern Med. 2008;149(9):670–676.
- , , , . Risk stratification and therapeutic decision making in acute coronary syndromes. JAMA. 2000;284(7):876–878.
- , , . Are diagnosis specific outcome indicators based on administrative data useful in assessing quality of hospital care? BMJ. 2004;13(1):32.
- , , , et al. What distinguishes top‐performing hospitals in acute myocardial infarction mortality rates? Ann Intern Med. 2011;154(6):384–390.
- , , , . The Model for Understanding Success in Quality (MUSIQ): building a theory of context in healthcare quality improvement. BMJ Qual Saf. 2012;21(1):13–20.
- , . Evidence‐based quality improvement: the state of the science. Health Aff (Millwood). 2005;24(1):138–150.
- Center for Medicare and Medicaid Innovation. Partnership for patients. Available at: http://www.innovations.cms.gov/initiatives/Partnership‐for‐Patients/index.html. Accessed April 2, 2012.
Enactment of federal legislation imposing hospital reimbursement penalties for excess rates of rehospitalizations among Medicare fee for service beneficiaries markedly increased interest in hospital quality improvement (QI) efforts to reduce the observed 30‐day rehospitalization of 19.6% in this elderly population.[1, 2] The Congressional Budget Office estimated that reimbursement penalties to hospitals for high readmission rates are expected to save the Medicare program approximately $7 billion between 2010 and 2019.[3] These penalties are complemented by resources from the Center for Medicare and Medicaid Innovation aiming to reduce hospital readmissions by 20% by the end of 2013 through the Partnership for Patients campaign.[4] Although potential financial penalties and provision of resources for QI intensified efforts to enhance the quality of the hospital discharge transition, patient safety risks associated with hospital discharge are well documented.[5, 6] Approximately 20% of patients discharged from the hospital may suffer adverse events,[7, 8] of which up to three‐quarters (72%) are medication related,[9] and over one‐third of required follow‐up testing after discharge is not completed.[10] Such findings indicate opportunities for improvement in the discharge process.[11]
Numerous publications describe studies aiming to improve the hospital discharge process and mitigate these hazards, though a systematic review of interventions to reduce 30‐day rehospitalization indicated that the existing evidence base for the effectiveness of transition interventions demonstrates irregular effectiveness and limitations to generalizability.[12] Most studies showing effectiveness are confined to single academic medical centers. Existing evidence supports multifaceted interventions implemented in both the pre‐ and postdischarge periods and focused on risk assessment and tailored, patient‐centered application of interventions to mitigate risk. For example Project RED (Re‐Engineered Discharge) applied a bundled intervention consisting of intensified patient education and discharge planning, improved medication reconciliation and discharge instructions, and longitudinal patient contact with follow‐up phone calls and a dedicated discharge advocate.[13] However, the mean age of patients participating in the study was 50 years, and it excluded patients admitted from or discharged to skilled nursing facilities, making generalizability to the geriatric population uncertain.
An integral aspect of QI projects is the contribution of local context to translation of best practices to disparate settings.[14, 15, 16] Most available reports of successful interventions to reduce rehospitalization have not fully described the specifics of either the intervention context or design. Moreover, the available evidence base for common interventions to reduce rehospitalization was developed in the academic setting. Validation of single academic center studies in a broader healthcare context is necessary.
Project BOOST (Better Outcomes for Older adults through Safe Transitions) recruited a diverse national cohort of both academic and nonacademic hospitals to participate in a QI effort to implement best practices for hospital discharge care transitions using a national collaborative approach facilitated by external expert mentorship. This study aimed to determine the effectiveness of BOOST in lowering hospital readmission rates and impact on length of stay.
METHODS
The study of Project BOOST was undertaken in accordance with the SQUIRE (Standards for Quality Improvement Reporting Excellence) Guidelines.[17]
Participants
The unit of observation for the prospective cohort study was the clinical acute‐care unit within hospitals. Sites were instructed to designate a pilot unit for the intervention that cared for medical or mixed medicalsurgical patient populations. Sites were also asked to provide outcome data for a clinically and organizationally similar non‐BOOST unit to provide a site‐matched control. Control units were matched by local site leadership based on comparable patient demographics, clinical mix, and extent of housestaff presence. An initial cohort of 6 hospitals in 2008 was followed by a second cohort of 24 hospitals initiated in 2009. All hospitals were invited to participate in the national effectiveness analysis, which required submission of readmission and length of stay data for both a BOOST intervention unit and a clinically matched control unit.
Description of the Intervention
The BOOST intervention consisted of 2 major sequential processes, planning and implementation, both facilitated by external site mentorsphysicians expert in QI and care transitionsfor a period of 12 months. Extensive background on the planning and implementation components is available at
| Enrollment Sites, n=30 | Sites Reporting Outcome Data, n=11 | Sites Not Reporting Outcome Data, n=19 | P Value for Comparison of Outcome Data Sites Compared to Othersa | |
|---|---|---|---|---|
| ||||
| Region, n (%) | 0.194 | |||
| Northeast | 8 (26.7) | 2 (18.2) | 6 (31.6) | |
| West | 7 (23.4) | 2 (18.2) | 5 (26.3) | |
| South | 7 (23.4) | 3 (27.3) | 4 (21.1) | |
| Midwest | 8 (26.7) | 4 (36.4) | 4 (21.1) | |
| Urban location, n (%) | 25 (83.3) | 11 (100) | 15 (78.9) | 0.035 |
| Teaching status, n (%) | 0.036 | |||
| Academic medical center | 10 (33.4) | 5 (45.5) | 5 (26.3) | |
| Community teaching | 8 (26.7) | 3 (27.3) | 5 (26.3) | |
| Community nonteaching | 12 (40) | 3 (27.3) | 9 (47.4) | |
| Beds number, mean (SD) | 426.6 (220.6) | 559.2 (187.8) | 349.79 (204.48) | 0.003 |
| Number of tools implemented, n (%) | 0.194 | |||
| 0 | 2 (6.7) | 0 | 2 (10.5) | |
| 1 | 2 (6.7) | 0 | 2 (10.5) | |
| 2 | 4 (13.3) | 2 (18.2) | 2 (10.5) | |
| 3 | 12 (40.0) | 3 (27.3) | 8 (42.1) | |
| 4 | 9 (30.0) | 5 (45.5) | 4 (21.1) | |
| 5 | 1 (3.3) | 1 (9.1) | 1 (5.3) | |
Mentor engagement with sites consisted of a 2‐day kickoff training on the BOOST tools, where site teams met their mentor and initiated development of structured action plans, followed by 5 to 6 scheduled phone calls in the subsequent 12 months. During these conference calls, mentors gauged progress and sought to help troubleshoot barriers to implementation. Some mentors also conducted a site visit with participant sites. Project BOOST provided sites with several collaborative activities including online webinars and an online listserv. Sites also received a quarterly newsletter.
Outcome Measures
The primary outcome was 30‐day rehospitalization defined as same hospital, all‐cause rehospitalization. Home discharges as well as discharges or transfers to other healthcare facilities were included in the discharge calculation. Elective or scheduled rehospitalizations as well as multiple rehospitalizations in the same 30‐day window were considered individual rehospitalization events. Rehospitalization was reported as a ratio of 30‐day rehospitalizations divided by live discharges in a calendar month. Length of stay was reported as the mean length of stay among live discharges in a calendar month. Outcomes were calculated at the participant site and then uploaded as overall monthly unit outcomes to a Web‐based research database.
To account for seasonal trends as well as marked variation in month‐to‐month rehospitalization rates identified in longitudinal data, we elected to compare 3‐month year‐over‐year averages to determine relative changes in readmission rates from the period prior to BOOST implementation to the period after BOOST implementation. We calculated averages for rehospitalization and length of stay in the 3‐month period preceding the sites' first reported month of front‐line implementation and in the corresponding 3‐month period in the subsequent calendar year. For example, if a site reported implementing its first tool in April 2010, the average readmission rate in the unit for January 2011 through March 2011 was subtracted from the average readmission rate for January 2010 through March 2010.
Sites were surveyed regarding tool implementation rates 6 months and 24 months after the 2009 kickoff training session. Surveys were electronically completed by site leaders in consultation with site team members. The survey identified new tool implementation as well as modification of existing care processes using the BOOST tools (admission risk assessment, discharge readiness checklist, teach back use, mandate regarding discharge summary completion, follow‐up phone calls to >80% of discharges). Use of a sixth tool, creation of individualized written discharge instructions, was not measured. We credited sites with tool implementation if they reported either de novo tool use or alteration of previous care processes influenced by BOOST tools.
Clinical outcome reporting was voluntary, and sites did not receive compensation and were not subject to penalty for the degree of implementation or outcome reporting. No patient‐level information was collected for the analysis, which was approved by the Northwestern University institutional review board.
Data Sources and Methods
Readmission and length of stay data, including the unit level readmission rate, as collected from administrative sources at each hospital, were collected using templated spreadsheet software between December 2008 and June 2010, after which data were loaded directly to a Web‐based data‐tracking platform. Sites were asked to load data as they became available. Sites were asked to report the number of study unit discharges as well as the number of those discharges readmitted within 30 days; however, reporting of the number of patient discharges was inconsistent across sites. Serial outreach consisting of monthly phone calls or email messaging to site leaders was conducted throughout 2011 to increase site participation in the project analysis.
Implementation date information was collected from 2 sources. The first was through online surveys distributed in November 2009 and April 2011. The second was through fields in the Web‐based data tracking platform to which sites uploaded data. In cases where disagreement was found between these 2 sources, the site leader was contacted for clarification.
Practice setting (community teaching, community nonteaching, academic medical center) was determined by site‐leader report within the Web‐based data tracking platform. Data for hospital characteristics (number of licensed beds and geographic region) were obtained from the American Hospital Association's Annual Survey of Hospitals.[18] Hospital region was characterized as West, South, Midwest, or Northeast.
Analysis
The null hypothesis was that no prepost difference existed in readmission rates within BOOST units, and no difference existed in the prepost change in readmission rates in BOOST units when compared to site‐matched control units. The Wilcoxon rank sum test was used to test whether observed changes described above were significantly different from 0, supporting rejection of the null hypotheses. We performed similar tests to determine the significance of observed changes in length of stay. We performed our analysis using SAS 9.3 (SAS Institute Inc., Cary, NC).
RESULTS
Eleven hospitals provided rehospitalization and length‐of‐stay outcome data for both a BOOST and control unit for the pre‐ and postimplementation periods. Compared to the 19 sites that did not participate in the analysis, these 11 sites were significantly larger (559188 beds vs 350205 beds, P=0.003), more likely to be located in an urban area (100.0% [n=11] vs 78.9% [n=15], P=0.035), and more likely to be academic medical centers (45.5% [n=5] vs 26.3% [n=5], P=0.036) (Table 1).
The mean number of tools implemented by sites participating in the analysis was 3.50.9. All sites implemented at least 2 tools. The duration between attendance at the BOOST kickoff event and first tool implementation ranged from 3 months (first tool implemented prior to attending the kickoff) and 9 months (mean duration, 3.34.3 months) (Table 2).
| Hospital | Region | Hospital Type | No. Licensed Beds | Kickoff Implementationa | Risk Assessment | Discharge Checklist | Teach Back | Discharge Summary Completion | Follow‐up Phone Call | Total |
|---|---|---|---|---|---|---|---|---|---|---|
| ||||||||||
| 1 | Midwest | Community teaching | <300 | 8 | 3 | |||||
| 2 | West | Community teaching | >600 | 0 | 4 | |||||
| 3 | Northeast | Academic medical center | >600 | 2 | 4 | |||||
| 4 | Northeast | Community nonteaching | <300 | 9 | 2 | |||||
| 5 | South | Community nonteaching | >600 | 6 | 3 | |||||
| 6 | South | Community nonteaching | >600 | 3 | 4 | |||||
| 7 | Midwest | Community teaching | 300600 | 1 | 5 | |||||
| 8 | West | Academic medical center | 300600 | 1 | 4 | |||||
| 9 | South | Academic medical center | >600 | 4 | 4 | |||||
| 10 | Midwest | Academic medical center | 300600 | 3 | 3 | |||||
| 11 | Midwest | Academic medical center | >600 | 9 | 2 | |||||
The average rate of 30‐day rehospitalization among BOOST units was 14.7% in the preimplementation period and 12.7% during the postimplementation period (P=0.010) (Figure 1). Rehospitalization rates for matched control units were 14.0% in the preintervention period and 14.1% in the postintervention period (P=0.831). The mean absolute reduction in readmission rates over the 1‐year study period in BOOST units compared to control units was 2.0%, or a relative reduction of 13.6% (P=0.054 for signed rank test comparing differences in readmission rate reduction in BOOST units compared to site‐matched control units). Length of stay in BOOST and control units decreased an average of 0.5 days and 0.3 days, respectively. There was no difference in length of stay change between BOOST units and control units (P=0.966).
DISCUSSION
As hospitals strive to reduce their readmission rates to avoid Centers for Medicare and Medicaid Services penalties, Project BOOST may be a viable QI approach to achieve their goals. This initial evaluation of participation in Project BOOST by 11 hospitals of varying sizes across the United States showed an associated reduction in rehospitalization rates (absolute=2.0% and relative=13.6%, P=0.054). We did not find any significant change in length of stay among these hospitals implementing BOOST tools.
The tools provided to participating hospitals were developed from evidence found in peer‐reviewed literature established through experimental methods in well‐controlled academic settings. Further tool development was informed by recommendations of an advisory board consisting of expert representatives and advocates involved in the hospital discharge process: patients, caregivers, physicians, nurses, case managers, social workers, insurers, and regulatory and research agencies.[19] The toolkit components address multiple aspects of hospital discharge and follow‐up with the goal of improving health by optimizing the safety of care transitions. Our observation that readmission rates appeared to improve in a diverse hospital sample including nonacademic and community hospitals engaged in Project BOOST is reassuring that the benefits seen in existing research literature, developed in distinctly academic settings, can be replicated in diverse acute‐care settings.
The effect size observed in our study was modest but consistent with several studies identified in a recent review of trials measuring interventions to reduce rehospitalization, where 7 of 16 studies showing a significant improvement registered change in the 0% to 5% absolute range.[12] Impact of this project may have been tempered by the need to translate external QI content to the local setting. Additionally, in contrast to experimental studies that are limited in scope and timing and often scaled to a research budget, BOOST sites were encouraged to implement Project BOOST in the clinical setting even if no new funds were available to support the effort.[12]
The recruitment of a national sample of both academic and nonacademic hospital participants imposed several limitations on our study and analysis. We recognize that intervention units selected by hospitals may have had unmeasured unit and patient characteristics that facilitated successful change and contributed to the observed improvements. However, because external pressure to reduce readmission is present across all hospitals independent of the BOOST intervention, we felt site‐matched controls were essential to understanding effects attributable to the BOOST tools. Differences between units would be expected to be stable over the course of the study period, and comparison of outcome differences between 2 different time periods would be reasonable. Additionally, we could not collect data on readmissions to other hospitals. Theoretically, patients discharged from BOOST units might be more likely to have been rehospitalized elsewhere, but the fraction of rehospitalizations occurring at alternate facilities would also be expected to be similar on the matched control unit.
We report findings from a voluntary cohort willing and capable of designating a comparison clinical unit and contributing the requested data outcomes. Pilot sites that did not report outcomes were not analyzed, but comparison of hospital characteristics shows that participating hospitals were more likely to be large, urban, academic medical centers. Although barriers to data submission were not formally analyzed, reports from nonparticipating sites describe data submission limited by local implementation design (no geographic rollout or simultaneous rollout on all appropriate clinical units), site specific inability to generate unit level outcome statistics, and competing organizational priorities for data analyst time (electronic medical record deployment, alternative QI initiatives). The external validity of our results may be limited to organizations capable of analytics at the level of the individual clinical unit as well as those with sufficient QI resources to support reporting to a national database in the absence of a payer mandate. It is possible that additional financial support for on‐site data collection would have bolstered participation, making the example of participation rates we present potentially informative to organizations hoping to widely disseminate a QI agenda.
Nonetheless, the effectiveness demonstrated in the 11 sites that did participate is encouraging, and ongoing collaboration with subsequent BOOST cohorts has been designed to further facilitate data collection. Among the insights gained from this pilot experience, and incorporated into ongoing BOOST cohorts, is the importance of intensive mentor engagement to foster accountability among participant sites, assist with implementation troubleshooting, and offer expertise that is often particularly effective in gaining local support. We now encourage sites to have 2 mentor site visits to further these roles and more frequent conference calls. Further research to understand the marginal benefit of the mentored implementation approach is ongoing.
The limitations in data submission we experienced with the pilot cohort likely reflect resource constraints not uncommon at many hospitals. Increasing pressure placed on hospitals as a result of the Readmission Reduction Program within the Affordable Care Act as well as increasing interest from private and Medicaid payors to incorporate similar readmission‐based penalties provide encouragement for hospitals to enhance their data and analytic skills. National incentives for implementation of electronic health records (EHR) should also foster such capabilities, though we often saw EHRs as a barrier to QI, especially rapid cycle trials. Fortunately, hospitals are increasingly being afforded access to comprehensive claims databases to assist in tracking readmission rates to other facilities, and these data are becoming available in a more timely fashion. This more robust data collection, facilitated by private payors, state QI organizations, and state hospital associations, will support additional analytic methods such as multivariate regression models and interrupted time series designs to appreciate the experience of current BOOST participants.
Additional research is needed to understand the role of organizational context in the effectiveness of Project BOOST. Differences in rates of tool implementation and changes in clinical outcomes are likely dependent on local implementation context at the level of the healthcare organization and individual clinical unit.[20] Progress reports from site mentors and previously described experiences of QI implementation indicate that successful implementation of a multidimensional bundle of interventions may have reflected a higher level of institutional support, more robust team engagement in the work of reducing readmissions, increased clinical staff support for change, the presence of an effective project champion, or a key facilitating role of external mentorship.[21, 22] Ongoing data collection will continue to measure the sustainability of tool use and observed outcome changes to inform strategies to maintain gains associated with implementation. The role of mentored implementation in facilitating gains also requires further study.
Increasing attention to the problem of avoidable rehospitalization is driving hospitals, insurers, and policy makers to pursue QI efforts that favorably impact readmission rates. Our analysis of the BOOST intervention suggests that modest gains can be achieved following evidence‐based hospital process change facilitated by a mentored implementation model. However, realization of the goal of a 20% reduction in rehospitalization proposed by the Center for Medicare and Medicaid Services' Partnership for Patients initiative may be difficult to achieve on a national scale,[23] especially if efforts focus on just the hospital.
Acknowledgments
The authors acknowledge the contributions of Amanda Creden, BA (data collection), Julia Lee (biostatistical support), and the support of Amy Berman, BS, RN, Senior Program Officer at The John A. Hartford Foundation.
Disclosures
Project BOOST was funded by a grant from The John A. Hartford Foundation. Project BOOST is administered by the Society of Hospital Medicine (SHM). The development of the Project BOOST toolkit, recruitment of sites for this study, mentorship of the pilot cohort, project evaluation planning, and collection of pilot data were funded by a grant from The John A. Harford Foundation. Additional funding for continued data collection and analysis was funded by the SHM through funds from hospitals to participate in Project BOOST, specifically with funding support for Dr. Hansen. Dr. Williams has received funding to serve as Principal Investigator for Project BOOST. Since the time of initial cohort participation, approximately 125 additional hospitals have participated in the mentored implementation of Project BOOST. This participation was funded through a combination of site‐based tuition, third‐party payor support from private insurers, foundations, and federal funding through the Center for Medicare and Medicaid Innovation Partnership for Patients program. Drs. Greenwald, Hansen, and Williams are Project BOOST mentors for current Project BOOST sites and receive financial support through the SHM for this work. Dr. Howell has previously received funding as a Project BOOST mentor. Ms. Budnitz is the BOOST Project Director and is Chief Strategy and Development Officer for the HM. Dr. Maynard is the Senior Vice President of the SHM's Center for Hospital Innovation and Improvement.
References
- , , . Rehospitalizations among patients in the Medicare fee‐for‐service program. N Engl J Med. 2009;360(14):1418–1428.
- United States Congress. House Committee on Education and Labor. Coe on Ways and Means, Committee on Energy and Commerce, Compilation of Patient Protection and Affordable Care Act: as amended through November 1, 2010 including Patient Protection and Affordable Care Act health‐related portions of the Health Care and Education Reconciliation Act of 2010. Washington, DC: US Government Printing Office; 2010.
- Cost estimate for the amendment in the nature of a substitute to H.R. 3590, as proposed in the Senate on November 18, 2009. Washington, DC: Congressional Budget Office; 2009.
- Partnership for Patients, Center for Medicare and Medicaid Innovation. Available at: http://www.innovations.cms.gov/initiatives/Partnership‐for‐Patients/index.html. Accessed December 12, 2012.
- , . Providers have failed to work for continuity. Hospitals. 1979;53(10):79.
- , . Executing high‐quality care transitions: a call to do it right. J Hosp Med. 2007;2(5):287–290.
- , , , , . The incidence and severity of adverse events affecting patients after discharge from the hospital. Ann Intern Med. 2003;138(3):161–167.
- , , , et al. Adverse events among medical patients after discharge from hospital. CMAJ. 2004;170(3):345–349.
- , , , et al. Making inpatient medication reconciliation patient centered, clinically relevant and implementable: a consensus statement on key principles and necessary first steps. J Hosp Med. 2010;5(8):477–485.
- , , . Tying up loose ends: discharging patients with unresolved medical issues. Arch Intern Med. 2007;167(12):1305.
- , , , , , . Deficits in communication and information transfer between hospital‐based and primary care physicians. JAMA. 2007;297(8):831–841.
- , , , , . Interventions to reduce 30‐day rehospitalization: a systematic review. Ann Intern Med. 2011;155(8):520–528.
- , , , et al. A reengineered hospital discharge program to decrease rehospitalization: a randomized trial. Ann Intern Med. 2009;150(3):178.
- , , , et al. Advancing the science of patient safety. Ann Intern Med. 2011;154(10):693–696.
- , . From best evidence to best practice: effective implementation of change in patients' care. Lancet. 2003;362(9391):1225–1230.
- , , , et al. Quality improvement projects targeting health care‐associated infections: comparing virtual collaborative and toolkit approaches. J Hosp Med. 2011;6(5):271–278.
- , , , , . Publication guidelines for improvement studies in health care: evolution of the SQUIRE project. Ann Intern Med. 2008;149(9):670–676.
- , , , . Risk stratification and therapeutic decision making in acute coronary syndromes. JAMA. 2000;284(7):876–878.
- , , . Are diagnosis specific outcome indicators based on administrative data useful in assessing quality of hospital care? BMJ. 2004;13(1):32.
- , , , et al. What distinguishes top‐performing hospitals in acute myocardial infarction mortality rates? Ann Intern Med. 2011;154(6):384–390.
- , , , . The Model for Understanding Success in Quality (MUSIQ): building a theory of context in healthcare quality improvement. BMJ Qual Saf. 2012;21(1):13–20.
- , . Evidence‐based quality improvement: the state of the science. Health Aff (Millwood). 2005;24(1):138–150.
- Center for Medicare and Medicaid Innovation. Partnership for patients. Available at: http://www.innovations.cms.gov/initiatives/Partnership‐for‐Patients/index.html. Accessed April 2, 2012.
Copyright © 2013 Society of Hospital Medicine

Metrics for Inpatient Glycemic Control
Data collection, analysis, and presentation are key to the success of any hospital glycemic control initiative. Such efforts enable the management team to track improvements in processes and outcomes, make necessary changes to their quality improvement efforts, justify the provision of necessary time and resources, and share their results with others. Reliable metrics for assessing glycemic control and frequency of hypoglycemia are essential to accomplish these tasks and to assess whether interventions result in more benefit than harm. Hypoglycemia metrics must be especially convincing because fear of hypoglycemia remains a major source of clinical inertia, impeding efforts to improve glucose control.
Currently, there are no official standards or guidelines for formulating metrics on the quality of inpatient glycemic control. This creates several problems. First, different metrics vary in their biases and in their responsiveness to change. Thus, use of a poor metric could lead to either a falsely positive or falsely negative impression that a quality improvement intervention is in fact improving glycemic control. Second, the proliferation of different measures and analytical plans in the research and quality improvement literature make it very difficult for hospitals to compare baseline performance, determine need for improvement, and understand which interventions may be most effective.
A related article in this supplement provides the rationale for improved inpatient glycemic control. That article argues that the current state of inpatient glycemic control, with the frequent occurrence of severe hyperglycemia and irrational insulin ordering, cannot be considered acceptable, especially given the large body of data (albeit largely observational) linking hyperglycemia to negative patient outcomes. However, regardless of whether one is an advocate or skeptic of tighter glucose control in the intensive care unit (ICU) and especially the non‐ICU setting, there is no question that standardized, valid, and reliable metrics are needed to compare efforts to improve glycemic control, better understand whether such control actually improves patient care, and closely monitor patient safety.
This article provides a summary of practical suggestions to assess glycemic control, insulin use patterns, and safety (hypoglycemia and severe hyperglycemia). In particular, we discuss the pros and cons of various measurement choices. We conclude with a tiered summary of recommendations for practical metrics that we hope will be useful to individual improvement teams. This article is not a consensus statement but rather a starting place that we hope will begin to standardize measurement across institutions and advance the dialogue on this subject. To more definitely address this problem, we call on the American Association of Clinical Endocrinologists (AACE), American Diabetes Association (ADA), Society of Hospital Medicine (SHM), and others to agree on consensus standards regarding metrics for the quality of inpatient glycemic control.
MEASURING GLYCEMIC CONTROL: GLUCOMETRICS
Glucometrics may be defined as the systematic analysis of blood glucose (BG) dataa phrase initially coined specifically for the inpatient setting. There are numerous ways to do these analyses, depending on which patients and glucose values are considered, the definitions used for hypoglycemia and hyperglycemia, the unit of measurement (eg, patient, patient‐day, individual glucose value), and the measure of control (eg, mean, median, percent of glucose readings within a certain range). We consider each of these dimensions in turn.
Defining the Target Patient Population
The first decision to be made is which patients to include in your analysis. Choices include the following:
-
Patients with a discharge diagnosis of diabetes: this group has face validity and intuitive appeal, is easy to identify retrospectively, and may capture some untested/untreated diabetics, but will miss patients with otherwise undiagnosed diabetes and stress hyperglycemia. It is also subject to the variable accuracy of billing codes.
-
Patients with a certain number of point‐of‐care (POC) glucose measurements: this group is also easy to identify, easy to measure, and will include patients with hyperglycemia without a previous diagnosis of diabetes, but will miss patients with untested/untreated hyperglycemia. Also, if glucose levels are checked on normoglycemic, nondiabetic patients, these values may dilute the overall assessment of glycemic control.
-
Patients treated with insulin in the hospital: this is a good choice if the purpose is mainly drug safety and avoidance of hypoglycemia, but by definition excludes most untreated patients.
-
Patients with 2 or more BG values (laboratory and/or POC) over a certain threshold (eg, >180 mg/dL). This will likely capture more patients with inpatient hyperglycemia, whether or not detected by the medical team, but is subject to wide variations in the frequency and timing of laboratory glucose testing, including whether or not the values are pre‐prandial (note that even preprandial POC glucose measurements are not always in fact fasting values).
Other considerations include the following:
-
Are there natural patient subgroups that should be measured and analyzed separately because of different guidelines? For example, there probably should be separate/emndependent inclusion criteria and analyses for critical care and noncritical care units because their glycemic targets and management considerations differ.
-
Which patients should be excluded? For example, if targeting subcutaneous insulin use in general hospitalized patients, one might eliminate those patients who are admitted specifically as the result of a diabetes emergency (eg, diabetic ketoacidosis [DKA] and hyperglycemic hyperosmolar state [HHS]), as their marked and prolonged hyperglycemia will skew BG data. Pregnant women should generally be excluded from broad‐based analyses or considered as a discrete category because they have very different targets for BG therapy. Patients with short lengths of stay may be less likely to benefit from tight glucose control and may also be considered for post hoc exclusion. One might also exclude patients with very few evaluable glucose readings (eg, fewer than 5) to ensure that measurement is meaningful for a given patient, keeping in mind that this may also exclude patients with undetected hyperglycemia, as mentioned above. Finally, patients receiving palliative care should also be considered for exclusion if feasible.
Recommendation: Do not limit analyses to only those patients with a diagnosis of diabetes or only those on insulin, which will lead to biased results.
-
For noncritical care patients, we recommend a combined approach: adult patients with a diagnosis of diabetes (e. g. using diagnosis‐related group [DRG] codes 294 or 295 or International Classification of Diseases 9th edition [ICD9] codes 250.xx) or with hyperglycemia (eg, 2 or more random laboratory and/or point of care (POC) BG values >180 mg/dL or 2 or more fasting BG values >130 mg/dL), excluding patients with DKA or HHS or who are pregnant.
-
For critical care units, we recommend either all patients, or patients with at least mild hyperglycemia (eg, 2 random glucose levels >140 mg/dL). Critical care patients with DKA, HHS, and pregnancy should be evaluated separately if possible.
Which Glucose Values to Include and Exclude
To answer this question, we first need to decide which method to use for BG measurement. There are several ways to measure BG, including the type of sample collected (capillary [fingerstick], arterial, and venous) and the technique used (central laboratory analyzing plasma, central laboratory analyzing whole blood [eg, from an arterial blood gas sample], glucose meter [usually calibrated to plasma], etc.). The POC (eg, capillary, glucose meter) glucose measurements alone are often preferred in the non‐ICU setting because laboratory plasma values generally provide little additional information and typically lower the mean glucose by including redundant fasting values.1 In critical care units, several different methods are often used together, and each merits inclusion. The inherent differences in calibration between the methods do not generally require separate analyses, especially given the frequency of testing in the ICU setting.
The next question is which values to include in analyses. In some situations, it may be most useful to focus on a certain period of hospitalization, such as the day of a procedure and the next 2 days in assessing the impact of the quality of perioperative care, or the first 14 days of a noncritical care stay to keep outliers for length of stay (LOS) from skewing the data. In the non‐ICU setting, it may be reasonable to exclude the first day of hospitalization, as early BG control is impacted by multiple variables beyond direct control of the clinician (eg, glucose control prior to admission, severity of presenting illness) and may not realistically reflect your interventions. (Keep in mind, however, that it may be useful to adjust for the admission glucose value in multivariable models given its importance to clinical outcomes and its strong relationship to subsequent inpatient glucose control.) However, in critical care units, it is reasonable to include the first day's readings in analyses given the high frequency of glucose measurements in this setting and the expectation that glucose control should be achieved within a few hours of starting an intravenous insulin infusion.
If feasible to do so with your institution's data capture methods, you may wish to select only the regularly scheduled (before each meal [qAC] and at bedtime [qHS], or every 6 hours [q6h]) glucose readings for inclusion in the summary data of glycemic control in the non‐ICU setting, thereby reducing bias caused by repeated measurements around extremes of glycemic excursions. An alternative in the non‐ICU setting is to censor glucose readings within 60 minutes of a previous reading.
Recommendation:
-
In the non‐ICU setting, we recommend first looking at all POC glucose values and if possible repeating the analyses excluding hospital day 1 and hospital day 15 and beyond, and also excluding glucose values measured within 60 minutes of a previous value.
-
In critical care units, we recommend evaluating all glucose readings used to guide care.
Units of Analysis
There are several different units of analysis, each with its own advantages and disadvantages:
-
Glucose value: this is the simplest measure and the one with the most statistical power. All glucose values for all patients of interest comprise the denominator. A report might say, for example, that 1% of the 1000 glucose values were <70 mg/dL during a certain period or that the mean of all glucose values collected for the month from patients in noncritical care areas was 160 mg/dL. The potential disadvantages of this approach are that these analyses are less clinically relevant than patient‐level analyses and that patients with many glucose readings and long hospitalizations may skew the data.
-
Patient (or the Patient Stay, [ie, the entire hospitalization]): all patients who are monitored make up the denominator. The numerator may be the percentage of patients with any hypoglycemia during their hospital stay or the percentage of patients achieving a certain mean glucose during their hospitalization, for example. This is inherently more clinically meaningful than using glucose value as a unit of analysis. A major disadvantage is not controlling for LOS effects. For example, a hospitalized patient with a long LOS is much more likely to be characterized as having at least 1 hypoglycemic value than is a patient with a shorter LOS. Another shortcoming is that this approach does not correct for uneven distribution of testing. A patient's mean glucose might be calculated on the basis of 8 glucose values on the first day of hospitalization, 4 on the second day, and 1 on the third day. Despite all these shortcomings, reporting by patient remains a popular and valid method of presenting glycemic control results, particularly when complemented by other views and refined to control for the number of readings per day.
-
Monitored Patient‐Day: The denominator in this setting is the total number of days a patient glucose level is monitored. The benefits of this method have been described and advocated in the literature.1 As with patient‐level analyses, this measure will be more rigorous and meaningful if the BG measures to be evaluated have been standardized. Typical reports might include percentage of monitored days with any hypoglycemia, or percentage of monitored days with all glucose values in the desired range. This unit of analysis may be considered more difficult to generate and to interpret. On the other hand, it is clinically relevant, less biased by LOS effects, and may be considered the most actionable metric by clinicians. This method provides a good balance when presented with data organized by patient.
The following example uses all 3 units of measurement, in this case to determine the rate of hypoglycemia, demonstrating the different but complementary information that each method provides:
-
In 1 month, 3900 POC glucose measurements were obtained from 286 patients representing 986 monitored patient‐days. With hypoglycemia defined as POC BG 60 mg/dL, the results showed the following:
-
50 of 3900 measurements (1.4%) were hypoglycemic 22 of 286 patients (7.7%) had 1 hypoglycemic episodes
-
40 of 986 monitored days (4.4%) had 1 hypoglycemic episodes.
The metric based on the number of glucose readings could be considered the least clinically relevant because it is unclear how many patients were affected; moreover, it may be based on variable testing patterns among patients, and could be influenced disproportionately by 1 patient with frequent hypoglycemia, many glucose readings, and/or a long LOS. One could argue that the patient‐stay metric is artificially elevated because a single hypoglycemic episode characterizes the entire stay as hypoglycemic. On the other hand, at least it acknowledges the number of patients affected by hypoglycemia. The patient‐day unit of analysis likely provides the most balanced view, one that is clinically relevant and measured over a standard period of time, and less biased by LOS and frequency of testing.
One way to express patient‐day glycemic control that deserves special mention is the patient‐day weighted mean. A mean glucose is calculated for each patient‐day, and then the mean is calculated across all patient‐days. The advantage of this approach is that it corrects for variation in the number of glucose readings each day; all hospital days are weighted equally.
Recommendation:
-
In noncritical care units, we recommend a combination of patient‐day and patient‐stay measures.
-
In critical care units, it is acceptable to also use glucose reading as the unit of measurement given more frequent and uniform data collection, but it should be complemented by more meaningful patient‐day and patient‐stay measures.
Measures of Control
In addition to deciding the unit(s) of analysis, another issue concerns which measures of control to use. These could include rates of hypoglycemia and hyperglycemia, percentage of glucose readings within various ranges (eg, <70, 70180, >180 mg/dL), mean glucose value, percentage of patient‐days during which the mean glucose is within various ranges, or the in control rate (ie, when all glucose values are within a certain range).
As with the various units of analysis, each of these measures of control has various advantages and disadvantages. For example, mean glucose is easy to report and understand, but masks extreme values. Percentage of glucose values within a certain range (eg, per patient, averaged across patients) presents a more complete picture but is a little harder to understand and will vary depending on the frequency of glucose monitoring. As mentioned above, this latter problem can be corrected in part by including only certain glucose values. Percent of glucose values within range may also be less sensitive to change than mean glucose (eg, a glucose that is lowered from 300 mg/dL to 200 mg/dL is still out of range). We recommend choosing a few, but not all, measures of control in order to get a complete picture of glycemic control. Over time one can then refine the measures being used to meet the needs of the glycemic control team and provide data that will drive the performance improvement process.
In critical care and perioperative settings, interest in glycemic control is often more intense around the time of a particular event such as major surgery or after admission to the ICU. Some measures commonly used in performing such analyses are:
-
All values outside a target range within a designated crucial period. For example, the University Healthcare Consortium and other organizations use a simple metric to gauge perioperative glycemic control. They collect the fasting glucose on postoperative days 1 and 2 and then calculate the percentage of postoperative days with any fasting glucose >200 mg/dL. Of course, this is a very liberal target, but it can always be lowered in a stepwise fashion once it is regularly being reached.
-
Three‐day blood glucose average. The Portland group uses the mean glucose of each patient for the period that includes the day of coronary artery bypass graft (CABG) surgery and the following 2 days. The 3‐day BG average (3‐BG) correlates very well with patient outcomes and can serve as a well‐defined target.2 It is likely that use of the 3‐BG would work well in other perioperative/trauma settings and could work in the medical ICU as well, with admission to the ICU as the starting point for calculation of the 3‐BG.
Hyperglycemic Index
Measuring the hyperglycemic index (HGI) is a validated method of summarizing glycemic control of ICU patients.3 It is designed to take into account the sometimes uneven distribution of patient testing. Time is plotted on the x‐axis and glucose values on the y‐axis. The HGI is calculated the area under the curve of glycemic values but above the upper limit of normal (ie, 110 mg/dL). Glucose values in the normal or hypoglycemic range are not included in the AUC. Mortality correlated well with this glycemic index. However, a recent observational study of glucometrics in patients hospitalized with acute myocardial infarction found that the simple mean of each patient's glucose values over the entire hospitalization was as predictive of in‐hospital mortality as the HGI or the time‐averaged glucose (AUC for all glucose values).4 In this study, metrics derived from glucose readings for the entire hospitalization were more predictive than those based on the first 24 or 48 hours or on the admission glucose.
Analyses Describing Change in Glycemic Control Over Time in the Hospital
In the critical care setting, this unit of analysis may be as simple as the mean time to reach the glycemic target on your insulin infusion protocol. On noncritical care wards, it is a bit more challenging to characterize the improvement (or clinical inertia) implied by failure of hyperglycemia to lessen as an inpatient stay progresses. One method is to calculate the mean glucose (or percentage of glucose values in a given range) for each patient on hospital day (HD) 1, and repeat for each HD (up to some reasonable limit, such as 5 or 7 days).
Recommendations:
-
In noncritical units, we recommend a limited set of complementary measures, such as the patient‐day weighted mean glucose, mean percent of glucose readings per patient that are within a certain range, and percentage of patients whose mean glucose is within a certain range on each hospital day.
-
In critical care units, it is often useful to focus measures around a certain critical event such as the 3‐day blood glucose average and to use measures such as the HGI that take advantage of more frequent blood glucose testing.
Definitions of Hyperglycemia and Hypoglycemia
Glucometrics outcomes will obviously depend on the thresholds established for hyperglycemia and hypoglycemia. Many centers define hypoglycemia as 60 mg/dL, whereas the ADA definition, based on physiologic changes that may take place, defines hypoglycemia (at least in the outpatient setting) as 70 mg/dL. Hypoglycemia may be further stratified by severity, with any glucose 40 mg/dL, for instance, defined as severe hypoglycemia.
Similarly, the definition of hyperglycemia (and therefore good control) must also be defined. Based on definitions developed by the ADA and AACE, the state of the medical literature, and current understanding of the pathophysiology of hyperglycemia, thresholds for critical care units include 110 mg/dL, 130 mg/dL, and 140 mg/dL, and options in noncritical care units include 130 mg/dL, 140 mg/dL, and 180 mg/dL. Because these thresholds implicitly assume adverse effects when glucose levels are above them, these levels are subject to revision as data become available confirming the benefits and safety of targeted glycemic control in various settings and patient populations.
Introducing optimal BG targets in a stepped fashion over time should also be considered. Furnary et al.2 have done this in the Portland Project, which tracks glycemic control in cardiac surgery patients receiving intravenous insulin therapy. The initial BG target for this project was <200 mg/dL; it was subsequently lowered stepwise over several years to 150 mg/dL, then to 120 mg/dL, and most recently to 110 mg/dL. This approach allows the safe introduction of targeted glycemic control and promotes acceptance of the concept by physicians and the allied nursing and medical staff.
Recommendations:
-
In noncritical care units, it is reasonable to use 40 mg/dL for severe hypoglycemia, 70 mg/dL for hypoglycemia, 130 mg/dL for fasting hyperglycemia, 180 mg/dL for random or postprandial hyperglycemia, and 300 mg/dL for severe hyperglycemia, keeping in mind that these thresholds are arbitrary. In critical care units, values from 110 mg/dL to 140 mg/dL might be better thresholds for hyperglycemia, but it may take time to safely and effectively move an organization toward these lower targets.
Other Considerations Relative to Glucometrics
Yale Glucometrics Website
The Yale Informatics group has put together a Web‐based resource (
Other Analytic Resources
Commercially available software, such as the RALS system (Medical Automation Systems, Inc., Charlottesville, VA) can gather POC glucose measurements directly from devices and provide real‐time reports of glycemic control, stratified by inpatient unit, using user‐defined targets for hypoglycemia and hyperglycemia. While they are no substitute for a dedicated, on‐site data analyst, such systems can be very useful for smaller hospitals with minimal data or information technology support staff.
APPROACHES TO ANALYSIS: RUN CHARTS
Most conventional clinical trials hold interventions fixed for a period of time and compare results with and without the intervention. For quality improvement studies, this is still a valid way to proceed, especially if studied as a randomized controlled trial. Such methods may be preferred when the clinical question is Does this type of intervention work in general? and the desired output is publication in peer‐reviewed journals so that others can learn about and adopt the intervention to their own institution. A before and after study with a similar analytic approach may also be valid, although concerns about temporal trends and cointerventions potentially compromise the validity of such studies. This approach again assumes that an intervention is held fixed over time such that it is clear what patients received during each time period.
If the desired result is improvement at a given institution (the question is Did we improve care?) then it may be preferable to present results over time using run‐charts. In a run chart, the x‐axis is time and the y‐axis the desired metric, such as patient‐day weighted mean glucose. Points in time when interventions were introduced or modified can be highlighted. Run charts have several advantages over before‐and‐after summaries: they do not require interventions remaining fixed and are more compatible with continuous quality improvement methods, it is easier to see the effect of different aspects of the interventions as they occur, one can get a quicker picture of whether something is working, and it is easier to separate out the impact of the intervention from secular trends. Finally, the use of run charts does not imply the absence of statistical rigor. Run charts with statistical process control (SPC) limits5 can easily convey when the observed time trend is unlikely to be due to chance using prespecified P values. (A full discussion of SPC and other methods to study quality improvement interventions is beyond the scope of this article.)
ASSESSING PATTERNS OF INSULIN USE AND ORDER SET UTILIZATION
Besides measuring the impact of quality improvement interventions on glucose control, it is important to measure processes such as proper insulin use. As mentioned in other articles in this supplement, processes are much more sensitive to change than outcomes. Failure to change processes should lead one to make changes to the intervention.
ICU and Perioperative Settings
For ICU and perioperative settings, the major process measure will likely be use of the insulin infusion order set. Designation of BG levels that trigger insulin infusion in these settings should be agreed upon in advance. The number of patients who meet the predefined glycemic criteria would make up the denominator, and the number of patients on the insulin infusion order set would make up the numerator.
NonCritical Care Units
On noncritical care units, measuring the percentage of subcutaneous insulin regimens that contain a basal insulin is a useful way to monitor the impact of an intervention. A more detailed analysis could examine the percentage of patients on simultaneous basal and nutritional insulin (if applicable). An important measure of clinical inertia is to track the percentage of patients who had changes in their insulin regimens on days after hypoglycemic or hyperglycemic excursions. Another important measure is the frequency with which the standardized order set is being used, analogous to the measure of insulin infusion use in the ICU. A final process measure, indirectly related to insulin use, is the frequency of use of oral diabetes agents, especially by patients for whom their use is contraindicated (eg, patients with congestive heart failure who are on thiazolidinediones and patients with renal insufficiency or receiving intravenous contrast continued on metformin).
OTHER CONSIDERATIONS AND METRICS
Examples of other metrics that can be used to track the success of quality improvement efforts include:
-
Glucose measurement within 8 hours of hospital admission.
-
Glycated hemoglobin (A1C) measurement obtained or available within 30 days of admission to help guide inpatient and especially discharge management.
-
Appropriate glucose testing in patients with diabetes or hyperglycemia (eg, 4 times per day in patients not on insulin infusion protocols, at least until 24 hours of euglycemia is documented).
-
The percentage of patients on insulin with on‐time tray delivery.
-
The timing of subcutaneous insulin administration in relation to glucose testing and nutrition delivery.
-
Documentation of carbohydrate intake among patients who are eating.
-
Satisfaction of physicians and nurses with order sets or protocols, using standard surveys.
-
Physician and nurse knowledge, attitudes, and beliefs about insulin administration, fear of hypoglycemia, treatment of hypoglycemia, and glycemic control in the hospital.
-
Patient satisfaction with their diabetes care in the hospital, including the education they received.
-
Nursing and physician education/certification in insulin prescribing, insulin administration, and other diabetes care issues.
-
Patient outcomes strongly associated with glycemic control, (eg, surgical wound infections, ICU LOS, catheter‐related bloodstream infections).
-
Appropriate treatment and documentation of hypoglycemia (eg, in accordance with hospital policy).
-
Documentation of severe hypoglycemic events through the hospital's adverse events reporting system (these may actually increase as change comes to the organization and as clinical personnel are more attuned to glycemic control).
-
Root causes of hypoglycemic events, which can be used to understand and prevent future events.
-
Appropriate transitions from IV to SC insulin regimens, (eg, starting basal insulin prior to discontinuing infusion in patients who have been on an insulin infusion of at least 2 units/hour or who have a known diagnosis of diabetes or A1C >7).
(Survey instruments and other measurement tools are available from the authors upon request.)
SHM GLYCEMIC CONTROL TASK FORCE SUMMARY RECOMMENDATIONS
The SHM Glycemic Control Task Force is working to develop standardized measures of inpatient glucose control and related indicators to track progress of hospital glycemic control initiatives (see the introduction to this supplement for a description of the charge and membership of this task force). The goals of the Task Force's metrics recommendations (Table 1) are several‐fold: (1) create a set of measurements that are complete but not overly burdensome; (2) create realistic measures that can be applied to institutions with different data management capabilities; and (3) allow for comparison across institutions for benchmarking purposes, evaluation of quality improvement projects, and reporting of results for formal research studies in this field.
| Measurement Issue | NonCritical Care Units | Critical Care Units | ||
|---|---|---|---|---|
| Tier 1 Recommendations | Tier 2 Recommendations | Tier 1 Recommendations | Tier 2 Recommendations | |
| ||||
| Patient inclusion and exclusion criteria | All adult patients with POC glucose testing (sampling acceptable). Exclude patients with DKA or HHS or who are pregnant. | All adult patients with diagnosis of diabetes by ICD‐9 code* or by glucose testing: random glucose (POC or laboratory) >180 mg/dL 2 or fasting glucose >130 mg/dL 2, excluding patients with DKA or HHS or who are pregnant. Additional analysis: exclude patients with <5 evaluable glucose readings, patients with LOS <2 days, or receiving palliative care. | All patients in every critical care unit (sampling acceptable). | Patients with DKA, HHS, or pregnancy in separate analyses. All patients in every critical care unit with random glucose (POC or laboratory) >140 mg/dL 2. |
| Glucose reading inclusion and exclusion criteria | All POC glucose values. | Additional analysis: exclude glucose values on hospital day 1 and on hospital day 15 and after. Additional analysis: exclude glucose values measured within 60 minutes of a previous value. | All POC and other glucose values used to guide care. | |
| Measures of safety | Analysis by patient‐day: Percentage of patient‐days with 1 or more values <40, <70, and >300 mg/dL. | Analysis by patient‐day: Percentage of patient‐days with 1 or more values <40, <70, and >300 mg/dL. | ||
| Measures of glucose control | Analysis by patient‐day: Percentage of patient‐days with mean <140, <180 mg/dL and/or Percentage of patient‐days with all values <180 mg/dL. | Analysis by patient‐day: Patient day‐weighted mean glucose. | Analysis by glucose reading: Percentage of readings <110, <140 mg/dL. | 3‐BG as above for all patients in critical care units.∥ Hyperglycemic index for all patients in critical care units (AUC of glucose values above target). |
| Analysis by patient stay: Percentage of patient stays with mean <140, <180 mg/dL. | Analysis by patient stay: Mean percentage of glucose readings of each patient <180 mg/dL. | Analysis by patient‐day: Percentage of patient‐days with mean <110, <140 mg/dL, and/or Percentage of patient‐days with all values <110, <140 mg/dL. | ||
| Analysis by hospital day: Percentage of patients with mean glucose readings <140, <180 mg/dL by hospital day (days 17). | Analysis by patient stay: 3‐day blood glucose average (3‐BG) for selected perioperative patients: Percentage of patients with 3‐BG <110, <140 mg/dL. Mean time (hours) to reach glycemic target (BG <110 or <140 mg/dL) on insulin infusion. | |||
| Measures of insulin use | Percentage of patients on any subcutaneous insulin that has a scheduled basal insulin component (glargine, NPH, or detemir). | Percentage of patients with at least 2 POC and/or laboratory glucose readings >180 mg/dL who have a scheduled basal insulin component. Percentage of eating patients with hyperglycemia as defined above with scheduled basal insulin and nutritional insulin. Percentage of patients and patient‐days with any changes in insulin orders the day after 2 or more episodes of hypoglycemia or hyperglycemia (ie, <70 or >180 mg/dL). | Percentage of patients with 2 POC or laboratory glucose readings >140 mg/dL placed on insulin infusion protocol. | |
| Other process measures | Glucose measured within 8 hours of hospital admission. | POC glucose testing at least 4 times a day for all patients with diabetes or hyperglycemia as defined above. | Glucose measured within 8 hours of hospital admission. | Appropriateness of hypoglycemia treatment and documentation. |
| A1C measurement obtained or available within 30 days of admission. | Measures of adherence to specific components of management protocol. | Frequency of BG testing (eg, per protocol if on insulin infusion; every 68 hours if not). | Clinical events of severe hypoglycemia reported through the organization's critical events reporting tool. | |
| Appropriateness of hypoglycemia treatment and documentation. | Root causes of hypoglycemia. | |||
| Clinical events of severe hypoglycemia reported through the organization's critical events reporting tool. | Appropriate use of IV‐to‐SC insulin transition protocol. | |||
| Root causes of hypoglycemia. | ||||
For each domain of glycemic management (glycemic control, safety, and insulin use), the task force chose a set of best measures. They are presented as two tiers of measurement standards, depending on the capabilities of the institution and the planned uses of the data. Tier 1 includes measures that, although they do take time and resources to collect, are feasible for most institutions. Tier 2 measures are recommended for hospitals with easy manipulation of electronic sources of data and for reporting quality‐of‐care measures for widespread publication, that is, in the context of a research study. It should be emphasized that these recommendations are only meant as a guide: the actual measures chosen should meet the needs and capabilities of each institution.
We recognize that few data support the recommendations made by this task force, that such data are needed, and that the field of data collection and analysis for hospital glycemic management is rapidly evolving. The hope is to begin the standardization process, promote dialogue in this field, and eventually reach a consensus in collaboration with the ADA, AACE, and other pertinent stakeholders.
CONCLUSIONS
Like the field of inpatient glycemic management itself, the field of devising metrics to measure the quality of inpatient glycemic control is also in its infancy and quickly evolving. One should not be paralyzed by the lack of consensus regarding measurementthe important point is to pick a few complementary metrics and begin the process. The table of recommendations can hopefully serve as a starting point for many institutions, with a focus on efficacy (glycemic control), safety (hypoglycemia), and process (insulin use patterns). As your institution gains experience with measurement and the field evolves, your metrics will likely change. We recommend keeping all process and outcome data in its raw form so that it can be summarized in different ways over time. It is also important not to wait for the perfect data collection tool before beginning to analyze data: sampling and paper processes are acceptable if automated data collection is not yet possible. Eventually, blood glucose meter readings should be downloaded into a central database that interfaces with hospital data repositories so data can be analyzed in conjunction with patient, service, and unit‐level information. Only with a rigorous measurement process can institutions hope to know whether their changes are resulting in improved care for patients.
- ,,, et al.“Glucometrics”—assessing the quality of inpatient glucose management.Diabetes Technol Ther.2006;8:560–569.
- ,,.Effect of hyperglycemia and continuous intravenous insulin infusions on outcomes of cardiac surgical procedures: the Portland Diabetic Project.Endocr Pract.2004;10(suppl 2):21–33.
- ,,.Hyperglycaemic index as a tool to assess glucose control: a retrospective study.Crit Care.2004;8:R122–R127.
- ,,, et al.Glucometrics in patients hospitalized with acute myocardial infarction: defining the optimal outcomes‐based measure of risk.Circulation.2008;117:1018–1027.
- ,,.Statistical process control as a tool for research and healthcare improvement.Qual Saf Health Care.2003;12:458–464.
Data collection, analysis, and presentation are key to the success of any hospital glycemic control initiative. Such efforts enable the management team to track improvements in processes and outcomes, make necessary changes to their quality improvement efforts, justify the provision of necessary time and resources, and share their results with others. Reliable metrics for assessing glycemic control and frequency of hypoglycemia are essential to accomplish these tasks and to assess whether interventions result in more benefit than harm. Hypoglycemia metrics must be especially convincing because fear of hypoglycemia remains a major source of clinical inertia, impeding efforts to improve glucose control.
Currently, there are no official standards or guidelines for formulating metrics on the quality of inpatient glycemic control. This creates several problems. First, different metrics vary in their biases and in their responsiveness to change. Thus, use of a poor metric could lead to either a falsely positive or falsely negative impression that a quality improvement intervention is in fact improving glycemic control. Second, the proliferation of different measures and analytical plans in the research and quality improvement literature make it very difficult for hospitals to compare baseline performance, determine need for improvement, and understand which interventions may be most effective.
A related article in this supplement provides the rationale for improved inpatient glycemic control. That article argues that the current state of inpatient glycemic control, with the frequent occurrence of severe hyperglycemia and irrational insulin ordering, cannot be considered acceptable, especially given the large body of data (albeit largely observational) linking hyperglycemia to negative patient outcomes. However, regardless of whether one is an advocate or skeptic of tighter glucose control in the intensive care unit (ICU) and especially the non‐ICU setting, there is no question that standardized, valid, and reliable metrics are needed to compare efforts to improve glycemic control, better understand whether such control actually improves patient care, and closely monitor patient safety.
This article provides a summary of practical suggestions to assess glycemic control, insulin use patterns, and safety (hypoglycemia and severe hyperglycemia). In particular, we discuss the pros and cons of various measurement choices. We conclude with a tiered summary of recommendations for practical metrics that we hope will be useful to individual improvement teams. This article is not a consensus statement but rather a starting place that we hope will begin to standardize measurement across institutions and advance the dialogue on this subject. To more definitely address this problem, we call on the American Association of Clinical Endocrinologists (AACE), American Diabetes Association (ADA), Society of Hospital Medicine (SHM), and others to agree on consensus standards regarding metrics for the quality of inpatient glycemic control.
MEASURING GLYCEMIC CONTROL: GLUCOMETRICS
Glucometrics may be defined as the systematic analysis of blood glucose (BG) dataa phrase initially coined specifically for the inpatient setting. There are numerous ways to do these analyses, depending on which patients and glucose values are considered, the definitions used for hypoglycemia and hyperglycemia, the unit of measurement (eg, patient, patient‐day, individual glucose value), and the measure of control (eg, mean, median, percent of glucose readings within a certain range). We consider each of these dimensions in turn.
Defining the Target Patient Population
The first decision to be made is which patients to include in your analysis. Choices include the following:
-
Patients with a discharge diagnosis of diabetes: this group has face validity and intuitive appeal, is easy to identify retrospectively, and may capture some untested/untreated diabetics, but will miss patients with otherwise undiagnosed diabetes and stress hyperglycemia. It is also subject to the variable accuracy of billing codes.
-
Patients with a certain number of point‐of‐care (POC) glucose measurements: this group is also easy to identify, easy to measure, and will include patients with hyperglycemia without a previous diagnosis of diabetes, but will miss patients with untested/untreated hyperglycemia. Also, if glucose levels are checked on normoglycemic, nondiabetic patients, these values may dilute the overall assessment of glycemic control.
-
Patients treated with insulin in the hospital: this is a good choice if the purpose is mainly drug safety and avoidance of hypoglycemia, but by definition excludes most untreated patients.
-
Patients with 2 or more BG values (laboratory and/or POC) over a certain threshold (eg, >180 mg/dL). This will likely capture more patients with inpatient hyperglycemia, whether or not detected by the medical team, but is subject to wide variations in the frequency and timing of laboratory glucose testing, including whether or not the values are pre‐prandial (note that even preprandial POC glucose measurements are not always in fact fasting values).
Other considerations include the following:
-
Are there natural patient subgroups that should be measured and analyzed separately because of different guidelines? For example, there probably should be separate/emndependent inclusion criteria and analyses for critical care and noncritical care units because their glycemic targets and management considerations differ.
-
Which patients should be excluded? For example, if targeting subcutaneous insulin use in general hospitalized patients, one might eliminate those patients who are admitted specifically as the result of a diabetes emergency (eg, diabetic ketoacidosis [DKA] and hyperglycemic hyperosmolar state [HHS]), as their marked and prolonged hyperglycemia will skew BG data. Pregnant women should generally be excluded from broad‐based analyses or considered as a discrete category because they have very different targets for BG therapy. Patients with short lengths of stay may be less likely to benefit from tight glucose control and may also be considered for post hoc exclusion. One might also exclude patients with very few evaluable glucose readings (eg, fewer than 5) to ensure that measurement is meaningful for a given patient, keeping in mind that this may also exclude patients with undetected hyperglycemia, as mentioned above. Finally, patients receiving palliative care should also be considered for exclusion if feasible.
Recommendation: Do not limit analyses to only those patients with a diagnosis of diabetes or only those on insulin, which will lead to biased results.
-
For noncritical care patients, we recommend a combined approach: adult patients with a diagnosis of diabetes (e. g. using diagnosis‐related group [DRG] codes 294 or 295 or International Classification of Diseases 9th edition [ICD9] codes 250.xx) or with hyperglycemia (eg, 2 or more random laboratory and/or point of care (POC) BG values >180 mg/dL or 2 or more fasting BG values >130 mg/dL), excluding patients with DKA or HHS or who are pregnant.
-
For critical care units, we recommend either all patients, or patients with at least mild hyperglycemia (eg, 2 random glucose levels >140 mg/dL). Critical care patients with DKA, HHS, and pregnancy should be evaluated separately if possible.
Which Glucose Values to Include and Exclude
To answer this question, we first need to decide which method to use for BG measurement. There are several ways to measure BG, including the type of sample collected (capillary [fingerstick], arterial, and venous) and the technique used (central laboratory analyzing plasma, central laboratory analyzing whole blood [eg, from an arterial blood gas sample], glucose meter [usually calibrated to plasma], etc.). The POC (eg, capillary, glucose meter) glucose measurements alone are often preferred in the non‐ICU setting because laboratory plasma values generally provide little additional information and typically lower the mean glucose by including redundant fasting values.1 In critical care units, several different methods are often used together, and each merits inclusion. The inherent differences in calibration between the methods do not generally require separate analyses, especially given the frequency of testing in the ICU setting.
The next question is which values to include in analyses. In some situations, it may be most useful to focus on a certain period of hospitalization, such as the day of a procedure and the next 2 days in assessing the impact of the quality of perioperative care, or the first 14 days of a noncritical care stay to keep outliers for length of stay (LOS) from skewing the data. In the non‐ICU setting, it may be reasonable to exclude the first day of hospitalization, as early BG control is impacted by multiple variables beyond direct control of the clinician (eg, glucose control prior to admission, severity of presenting illness) and may not realistically reflect your interventions. (Keep in mind, however, that it may be useful to adjust for the admission glucose value in multivariable models given its importance to clinical outcomes and its strong relationship to subsequent inpatient glucose control.) However, in critical care units, it is reasonable to include the first day's readings in analyses given the high frequency of glucose measurements in this setting and the expectation that glucose control should be achieved within a few hours of starting an intravenous insulin infusion.
If feasible to do so with your institution's data capture methods, you may wish to select only the regularly scheduled (before each meal [qAC] and at bedtime [qHS], or every 6 hours [q6h]) glucose readings for inclusion in the summary data of glycemic control in the non‐ICU setting, thereby reducing bias caused by repeated measurements around extremes of glycemic excursions. An alternative in the non‐ICU setting is to censor glucose readings within 60 minutes of a previous reading.
Recommendation:
-
In the non‐ICU setting, we recommend first looking at all POC glucose values and if possible repeating the analyses excluding hospital day 1 and hospital day 15 and beyond, and also excluding glucose values measured within 60 minutes of a previous value.
-
In critical care units, we recommend evaluating all glucose readings used to guide care.
Units of Analysis
There are several different units of analysis, each with its own advantages and disadvantages:
-
Glucose value: this is the simplest measure and the one with the most statistical power. All glucose values for all patients of interest comprise the denominator. A report might say, for example, that 1% of the 1000 glucose values were <70 mg/dL during a certain period or that the mean of all glucose values collected for the month from patients in noncritical care areas was 160 mg/dL. The potential disadvantages of this approach are that these analyses are less clinically relevant than patient‐level analyses and that patients with many glucose readings and long hospitalizations may skew the data.
-
Patient (or the Patient Stay, [ie, the entire hospitalization]): all patients who are monitored make up the denominator. The numerator may be the percentage of patients with any hypoglycemia during their hospital stay or the percentage of patients achieving a certain mean glucose during their hospitalization, for example. This is inherently more clinically meaningful than using glucose value as a unit of analysis. A major disadvantage is not controlling for LOS effects. For example, a hospitalized patient with a long LOS is much more likely to be characterized as having at least 1 hypoglycemic value than is a patient with a shorter LOS. Another shortcoming is that this approach does not correct for uneven distribution of testing. A patient's mean glucose might be calculated on the basis of 8 glucose values on the first day of hospitalization, 4 on the second day, and 1 on the third day. Despite all these shortcomings, reporting by patient remains a popular and valid method of presenting glycemic control results, particularly when complemented by other views and refined to control for the number of readings per day.
-
Monitored Patient‐Day: The denominator in this setting is the total number of days a patient glucose level is monitored. The benefits of this method have been described and advocated in the literature.1 As with patient‐level analyses, this measure will be more rigorous and meaningful if the BG measures to be evaluated have been standardized. Typical reports might include percentage of monitored days with any hypoglycemia, or percentage of monitored days with all glucose values in the desired range. This unit of analysis may be considered more difficult to generate and to interpret. On the other hand, it is clinically relevant, less biased by LOS effects, and may be considered the most actionable metric by clinicians. This method provides a good balance when presented with data organized by patient.
The following example uses all 3 units of measurement, in this case to determine the rate of hypoglycemia, demonstrating the different but complementary information that each method provides:
-
In 1 month, 3900 POC glucose measurements were obtained from 286 patients representing 986 monitored patient‐days. With hypoglycemia defined as POC BG 60 mg/dL, the results showed the following:
-
50 of 3900 measurements (1.4%) were hypoglycemic 22 of 286 patients (7.7%) had 1 hypoglycemic episodes
-
40 of 986 monitored days (4.4%) had 1 hypoglycemic episodes.
The metric based on the number of glucose readings could be considered the least clinically relevant because it is unclear how many patients were affected; moreover, it may be based on variable testing patterns among patients, and could be influenced disproportionately by 1 patient with frequent hypoglycemia, many glucose readings, and/or a long LOS. One could argue that the patient‐stay metric is artificially elevated because a single hypoglycemic episode characterizes the entire stay as hypoglycemic. On the other hand, at least it acknowledges the number of patients affected by hypoglycemia. The patient‐day unit of analysis likely provides the most balanced view, one that is clinically relevant and measured over a standard period of time, and less biased by LOS and frequency of testing.
One way to express patient‐day glycemic control that deserves special mention is the patient‐day weighted mean. A mean glucose is calculated for each patient‐day, and then the mean is calculated across all patient‐days. The advantage of this approach is that it corrects for variation in the number of glucose readings each day; all hospital days are weighted equally.
Recommendation:
-
In noncritical care units, we recommend a combination of patient‐day and patient‐stay measures.
-
In critical care units, it is acceptable to also use glucose reading as the unit of measurement given more frequent and uniform data collection, but it should be complemented by more meaningful patient‐day and patient‐stay measures.
Measures of Control
In addition to deciding the unit(s) of analysis, another issue concerns which measures of control to use. These could include rates of hypoglycemia and hyperglycemia, percentage of glucose readings within various ranges (eg, <70, 70180, >180 mg/dL), mean glucose value, percentage of patient‐days during which the mean glucose is within various ranges, or the in control rate (ie, when all glucose values are within a certain range).
As with the various units of analysis, each of these measures of control has various advantages and disadvantages. For example, mean glucose is easy to report and understand, but masks extreme values. Percentage of glucose values within a certain range (eg, per patient, averaged across patients) presents a more complete picture but is a little harder to understand and will vary depending on the frequency of glucose monitoring. As mentioned above, this latter problem can be corrected in part by including only certain glucose values. Percent of glucose values within range may also be less sensitive to change than mean glucose (eg, a glucose that is lowered from 300 mg/dL to 200 mg/dL is still out of range). We recommend choosing a few, but not all, measures of control in order to get a complete picture of glycemic control. Over time one can then refine the measures being used to meet the needs of the glycemic control team and provide data that will drive the performance improvement process.
In critical care and perioperative settings, interest in glycemic control is often more intense around the time of a particular event such as major surgery or after admission to the ICU. Some measures commonly used in performing such analyses are:
-
All values outside a target range within a designated crucial period. For example, the University Healthcare Consortium and other organizations use a simple metric to gauge perioperative glycemic control. They collect the fasting glucose on postoperative days 1 and 2 and then calculate the percentage of postoperative days with any fasting glucose >200 mg/dL. Of course, this is a very liberal target, but it can always be lowered in a stepwise fashion once it is regularly being reached.
-
Three‐day blood glucose average. The Portland group uses the mean glucose of each patient for the period that includes the day of coronary artery bypass graft (CABG) surgery and the following 2 days. The 3‐day BG average (3‐BG) correlates very well with patient outcomes and can serve as a well‐defined target.2 It is likely that use of the 3‐BG would work well in other perioperative/trauma settings and could work in the medical ICU as well, with admission to the ICU as the starting point for calculation of the 3‐BG.
Hyperglycemic Index
Measuring the hyperglycemic index (HGI) is a validated method of summarizing glycemic control of ICU patients.3 It is designed to take into account the sometimes uneven distribution of patient testing. Time is plotted on the x‐axis and glucose values on the y‐axis. The HGI is calculated the area under the curve of glycemic values but above the upper limit of normal (ie, 110 mg/dL). Glucose values in the normal or hypoglycemic range are not included in the AUC. Mortality correlated well with this glycemic index. However, a recent observational study of glucometrics in patients hospitalized with acute myocardial infarction found that the simple mean of each patient's glucose values over the entire hospitalization was as predictive of in‐hospital mortality as the HGI or the time‐averaged glucose (AUC for all glucose values).4 In this study, metrics derived from glucose readings for the entire hospitalization were more predictive than those based on the first 24 or 48 hours or on the admission glucose.
Analyses Describing Change in Glycemic Control Over Time in the Hospital
In the critical care setting, this unit of analysis may be as simple as the mean time to reach the glycemic target on your insulin infusion protocol. On noncritical care wards, it is a bit more challenging to characterize the improvement (or clinical inertia) implied by failure of hyperglycemia to lessen as an inpatient stay progresses. One method is to calculate the mean glucose (or percentage of glucose values in a given range) for each patient on hospital day (HD) 1, and repeat for each HD (up to some reasonable limit, such as 5 or 7 days).
Recommendations:
-
In noncritical units, we recommend a limited set of complementary measures, such as the patient‐day weighted mean glucose, mean percent of glucose readings per patient that are within a certain range, and percentage of patients whose mean glucose is within a certain range on each hospital day.
-
In critical care units, it is often useful to focus measures around a certain critical event such as the 3‐day blood glucose average and to use measures such as the HGI that take advantage of more frequent blood glucose testing.
Definitions of Hyperglycemia and Hypoglycemia
Glucometrics outcomes will obviously depend on the thresholds established for hyperglycemia and hypoglycemia. Many centers define hypoglycemia as 60 mg/dL, whereas the ADA definition, based on physiologic changes that may take place, defines hypoglycemia (at least in the outpatient setting) as 70 mg/dL. Hypoglycemia may be further stratified by severity, with any glucose 40 mg/dL, for instance, defined as severe hypoglycemia.
Similarly, the definition of hyperglycemia (and therefore good control) must also be defined. Based on definitions developed by the ADA and AACE, the state of the medical literature, and current understanding of the pathophysiology of hyperglycemia, thresholds for critical care units include 110 mg/dL, 130 mg/dL, and 140 mg/dL, and options in noncritical care units include 130 mg/dL, 140 mg/dL, and 180 mg/dL. Because these thresholds implicitly assume adverse effects when glucose levels are above them, these levels are subject to revision as data become available confirming the benefits and safety of targeted glycemic control in various settings and patient populations.
Introducing optimal BG targets in a stepped fashion over time should also be considered. Furnary et al.2 have done this in the Portland Project, which tracks glycemic control in cardiac surgery patients receiving intravenous insulin therapy. The initial BG target for this project was <200 mg/dL; it was subsequently lowered stepwise over several years to 150 mg/dL, then to 120 mg/dL, and most recently to 110 mg/dL. This approach allows the safe introduction of targeted glycemic control and promotes acceptance of the concept by physicians and the allied nursing and medical staff.
Recommendations:
-
In noncritical care units, it is reasonable to use 40 mg/dL for severe hypoglycemia, 70 mg/dL for hypoglycemia, 130 mg/dL for fasting hyperglycemia, 180 mg/dL for random or postprandial hyperglycemia, and 300 mg/dL for severe hyperglycemia, keeping in mind that these thresholds are arbitrary. In critical care units, values from 110 mg/dL to 140 mg/dL might be better thresholds for hyperglycemia, but it may take time to safely and effectively move an organization toward these lower targets.
Other Considerations Relative to Glucometrics
Yale Glucometrics Website
The Yale Informatics group has put together a Web‐based resource (
Other Analytic Resources
Commercially available software, such as the RALS system (Medical Automation Systems, Inc., Charlottesville, VA) can gather POC glucose measurements directly from devices and provide real‐time reports of glycemic control, stratified by inpatient unit, using user‐defined targets for hypoglycemia and hyperglycemia. While they are no substitute for a dedicated, on‐site data analyst, such systems can be very useful for smaller hospitals with minimal data or information technology support staff.
APPROACHES TO ANALYSIS: RUN CHARTS
Most conventional clinical trials hold interventions fixed for a period of time and compare results with and without the intervention. For quality improvement studies, this is still a valid way to proceed, especially if studied as a randomized controlled trial. Such methods may be preferred when the clinical question is Does this type of intervention work in general? and the desired output is publication in peer‐reviewed journals so that others can learn about and adopt the intervention to their own institution. A before and after study with a similar analytic approach may also be valid, although concerns about temporal trends and cointerventions potentially compromise the validity of such studies. This approach again assumes that an intervention is held fixed over time such that it is clear what patients received during each time period.
If the desired result is improvement at a given institution (the question is Did we improve care?) then it may be preferable to present results over time using run‐charts. In a run chart, the x‐axis is time and the y‐axis the desired metric, such as patient‐day weighted mean glucose. Points in time when interventions were introduced or modified can be highlighted. Run charts have several advantages over before‐and‐after summaries: they do not require interventions remaining fixed and are more compatible with continuous quality improvement methods, it is easier to see the effect of different aspects of the interventions as they occur, one can get a quicker picture of whether something is working, and it is easier to separate out the impact of the intervention from secular trends. Finally, the use of run charts does not imply the absence of statistical rigor. Run charts with statistical process control (SPC) limits5 can easily convey when the observed time trend is unlikely to be due to chance using prespecified P values. (A full discussion of SPC and other methods to study quality improvement interventions is beyond the scope of this article.)
ASSESSING PATTERNS OF INSULIN USE AND ORDER SET UTILIZATION
Besides measuring the impact of quality improvement interventions on glucose control, it is important to measure processes such as proper insulin use. As mentioned in other articles in this supplement, processes are much more sensitive to change than outcomes. Failure to change processes should lead one to make changes to the intervention.
ICU and Perioperative Settings
For ICU and perioperative settings, the major process measure will likely be use of the insulin infusion order set. Designation of BG levels that trigger insulin infusion in these settings should be agreed upon in advance. The number of patients who meet the predefined glycemic criteria would make up the denominator, and the number of patients on the insulin infusion order set would make up the numerator.
NonCritical Care Units
On noncritical care units, measuring the percentage of subcutaneous insulin regimens that contain a basal insulin is a useful way to monitor the impact of an intervention. A more detailed analysis could examine the percentage of patients on simultaneous basal and nutritional insulin (if applicable). An important measure of clinical inertia is to track the percentage of patients who had changes in their insulin regimens on days after hypoglycemic or hyperglycemic excursions. Another important measure is the frequency with which the standardized order set is being used, analogous to the measure of insulin infusion use in the ICU. A final process measure, indirectly related to insulin use, is the frequency of use of oral diabetes agents, especially by patients for whom their use is contraindicated (eg, patients with congestive heart failure who are on thiazolidinediones and patients with renal insufficiency or receiving intravenous contrast continued on metformin).
OTHER CONSIDERATIONS AND METRICS
Examples of other metrics that can be used to track the success of quality improvement efforts include:
-
Glucose measurement within 8 hours of hospital admission.
-
Glycated hemoglobin (A1C) measurement obtained or available within 30 days of admission to help guide inpatient and especially discharge management.
-
Appropriate glucose testing in patients with diabetes or hyperglycemia (eg, 4 times per day in patients not on insulin infusion protocols, at least until 24 hours of euglycemia is documented).
-
The percentage of patients on insulin with on‐time tray delivery.
-
The timing of subcutaneous insulin administration in relation to glucose testing and nutrition delivery.
-
Documentation of carbohydrate intake among patients who are eating.
-
Satisfaction of physicians and nurses with order sets or protocols, using standard surveys.
-
Physician and nurse knowledge, attitudes, and beliefs about insulin administration, fear of hypoglycemia, treatment of hypoglycemia, and glycemic control in the hospital.
-
Patient satisfaction with their diabetes care in the hospital, including the education they received.
-
Nursing and physician education/certification in insulin prescribing, insulin administration, and other diabetes care issues.
-
Patient outcomes strongly associated with glycemic control, (eg, surgical wound infections, ICU LOS, catheter‐related bloodstream infections).
-
Appropriate treatment and documentation of hypoglycemia (eg, in accordance with hospital policy).
-
Documentation of severe hypoglycemic events through the hospital's adverse events reporting system (these may actually increase as change comes to the organization and as clinical personnel are more attuned to glycemic control).
-
Root causes of hypoglycemic events, which can be used to understand and prevent future events.
-
Appropriate transitions from IV to SC insulin regimens, (eg, starting basal insulin prior to discontinuing infusion in patients who have been on an insulin infusion of at least 2 units/hour or who have a known diagnosis of diabetes or A1C >7).
(Survey instruments and other measurement tools are available from the authors upon request.)
SHM GLYCEMIC CONTROL TASK FORCE SUMMARY RECOMMENDATIONS
The SHM Glycemic Control Task Force is working to develop standardized measures of inpatient glucose control and related indicators to track progress of hospital glycemic control initiatives (see the introduction to this supplement for a description of the charge and membership of this task force). The goals of the Task Force's metrics recommendations (Table 1) are several‐fold: (1) create a set of measurements that are complete but not overly burdensome; (2) create realistic measures that can be applied to institutions with different data management capabilities; and (3) allow for comparison across institutions for benchmarking purposes, evaluation of quality improvement projects, and reporting of results for formal research studies in this field.
| Measurement Issue | NonCritical Care Units | Critical Care Units | ||
|---|---|---|---|---|
| Tier 1 Recommendations | Tier 2 Recommendations | Tier 1 Recommendations | Tier 2 Recommendations | |
| ||||
| Patient inclusion and exclusion criteria | All adult patients with POC glucose testing (sampling acceptable). Exclude patients with DKA or HHS or who are pregnant. | All adult patients with diagnosis of diabetes by ICD‐9 code* or by glucose testing: random glucose (POC or laboratory) >180 mg/dL 2 or fasting glucose >130 mg/dL 2, excluding patients with DKA or HHS or who are pregnant. Additional analysis: exclude patients with <5 evaluable glucose readings, patients with LOS <2 days, or receiving palliative care. | All patients in every critical care unit (sampling acceptable). | Patients with DKA, HHS, or pregnancy in separate analyses. All patients in every critical care unit with random glucose (POC or laboratory) >140 mg/dL 2. |
| Glucose reading inclusion and exclusion criteria | All POC glucose values. | Additional analysis: exclude glucose values on hospital day 1 and on hospital day 15 and after. Additional analysis: exclude glucose values measured within 60 minutes of a previous value. | All POC and other glucose values used to guide care. | |
| Measures of safety | Analysis by patient‐day: Percentage of patient‐days with 1 or more values <40, <70, and >300 mg/dL. | Analysis by patient‐day: Percentage of patient‐days with 1 or more values <40, <70, and >300 mg/dL. | ||
| Measures of glucose control | Analysis by patient‐day: Percentage of patient‐days with mean <140, <180 mg/dL and/or Percentage of patient‐days with all values <180 mg/dL. | Analysis by patient‐day: Patient day‐weighted mean glucose. | Analysis by glucose reading: Percentage of readings <110, <140 mg/dL. | 3‐BG as above for all patients in critical care units.∥ Hyperglycemic index for all patients in critical care units (AUC of glucose values above target). |
| Analysis by patient stay: Percentage of patient stays with mean <140, <180 mg/dL. | Analysis by patient stay: Mean percentage of glucose readings of each patient <180 mg/dL. | Analysis by patient‐day: Percentage of patient‐days with mean <110, <140 mg/dL, and/or Percentage of patient‐days with all values <110, <140 mg/dL. | ||
| Analysis by hospital day: Percentage of patients with mean glucose readings <140, <180 mg/dL by hospital day (days 17). | Analysis by patient stay: 3‐day blood glucose average (3‐BG) for selected perioperative patients: Percentage of patients with 3‐BG <110, <140 mg/dL. Mean time (hours) to reach glycemic target (BG <110 or <140 mg/dL) on insulin infusion. | |||
| Measures of insulin use | Percentage of patients on any subcutaneous insulin that has a scheduled basal insulin component (glargine, NPH, or detemir). | Percentage of patients with at least 2 POC and/or laboratory glucose readings >180 mg/dL who have a scheduled basal insulin component. Percentage of eating patients with hyperglycemia as defined above with scheduled basal insulin and nutritional insulin. Percentage of patients and patient‐days with any changes in insulin orders the day after 2 or more episodes of hypoglycemia or hyperglycemia (ie, <70 or >180 mg/dL). | Percentage of patients with 2 POC or laboratory glucose readings >140 mg/dL placed on insulin infusion protocol. | |
| Other process measures | Glucose measured within 8 hours of hospital admission. | POC glucose testing at least 4 times a day for all patients with diabetes or hyperglycemia as defined above. | Glucose measured within 8 hours of hospital admission. | Appropriateness of hypoglycemia treatment and documentation. |
| A1C measurement obtained or available within 30 days of admission. | Measures of adherence to specific components of management protocol. | Frequency of BG testing (eg, per protocol if on insulin infusion; every 68 hours if not). | Clinical events of severe hypoglycemia reported through the organization's critical events reporting tool. | |
| Appropriateness of hypoglycemia treatment and documentation. | Root causes of hypoglycemia. | |||
| Clinical events of severe hypoglycemia reported through the organization's critical events reporting tool. | Appropriate use of IV‐to‐SC insulin transition protocol. | |||
| Root causes of hypoglycemia. | ||||
For each domain of glycemic management (glycemic control, safety, and insulin use), the task force chose a set of best measures. They are presented as two tiers of measurement standards, depending on the capabilities of the institution and the planned uses of the data. Tier 1 includes measures that, although they do take time and resources to collect, are feasible for most institutions. Tier 2 measures are recommended for hospitals with easy manipulation of electronic sources of data and for reporting quality‐of‐care measures for widespread publication, that is, in the context of a research study. It should be emphasized that these recommendations are only meant as a guide: the actual measures chosen should meet the needs and capabilities of each institution.
We recognize that few data support the recommendations made by this task force, that such data are needed, and that the field of data collection and analysis for hospital glycemic management is rapidly evolving. The hope is to begin the standardization process, promote dialogue in this field, and eventually reach a consensus in collaboration with the ADA, AACE, and other pertinent stakeholders.
CONCLUSIONS
Like the field of inpatient glycemic management itself, the field of devising metrics to measure the quality of inpatient glycemic control is also in its infancy and quickly evolving. One should not be paralyzed by the lack of consensus regarding measurementthe important point is to pick a few complementary metrics and begin the process. The table of recommendations can hopefully serve as a starting point for many institutions, with a focus on efficacy (glycemic control), safety (hypoglycemia), and process (insulin use patterns). As your institution gains experience with measurement and the field evolves, your metrics will likely change. We recommend keeping all process and outcome data in its raw form so that it can be summarized in different ways over time. It is also important not to wait for the perfect data collection tool before beginning to analyze data: sampling and paper processes are acceptable if automated data collection is not yet possible. Eventually, blood glucose meter readings should be downloaded into a central database that interfaces with hospital data repositories so data can be analyzed in conjunction with patient, service, and unit‐level information. Only with a rigorous measurement process can institutions hope to know whether their changes are resulting in improved care for patients.
- ,,, et al.“Glucometrics”—assessing the quality of inpatient glucose management.Diabetes Technol Ther.2006;8:560–569.
- ,,.Effect of hyperglycemia and continuous intravenous insulin infusions on outcomes of cardiac surgical procedures: the Portland Diabetic Project.Endocr Pract.2004;10(suppl 2):21–33.
- ,,.Hyperglycaemic index as a tool to assess glucose control: a retrospective study.Crit Care.2004;8:R122–R127.
- ,,, et al.Glucometrics in patients hospitalized with acute myocardial infarction: defining the optimal outcomes‐based measure of risk.Circulation.2008;117:1018–1027.
- ,,.Statistical process control as a tool for research and healthcare improvement.Qual Saf Health Care.2003;12:458–464.
The Venous Thromboembolism Quality Improvement Resource Room
The goal of this article is to explain how the first in a series of online resource rooms provides trainees and hospitalists with quality improvement tools that can be applied locally to improve inpatient care.1 During the emergence and explosive growth of hospital medicine, the SHM recognized the need to revise training relating to inpatient care and hospital process design to meet the evolving expectation of hospitalists that their performance will be measured, to actively set quality parameters, and to lead multidisciplinary teams to improve hospital performance.2 Armed with the appropriate skill set, hospitalists would be uniquely situated to lead and manage improvements in processes in the hospitals in which they work.
The content of the first Society of Hospital Medicine (SHM) Quality Improvement Resource Room (QI RR) supports hospitalists leading a multidisciplinary team dedicated to improving inpatient outcomes by preventing hospital‐acquired venous thromboembolism (VTE), a common cause of morbidity and mortality in hospitalized patients.3 The SHM developed this educational resource in the context of numerous reports on the incidence of medical errors in US hospitals and calls for action to improve the quality of health care.'47 Hospital report cards on quality measures are now public record, and hospitals will require uniformity in practice among physicians. Hospitalists are increasingly expected to lead initiatives that will implement national standards in key practices such as VTE prophylaxis2.
The QI RRs of the SHM are a collection of electronic tools accessible through the SHM Web site. They are designed to enhance the readiness of hospitalists and members of the multidisciplinary inpatient team to redesign care at the institutional level. Although all performance improvement is ultimately occurs locally, many QI methods and tools transcend hospital geography and disease topic. Leveraging a Web‐based platform, the SHM QI RRs present hospitalists with a general approach to QI, enriched by customizable workbooks that can be downloaded to best meet user needs. This resource is an innovation in practice‐based learning, quality improvement, and systems‐based practice.
METHODS
Development of the first QI RR followed a series of steps described in Curriculum Development for Medical Education8 (for process and timeline, see Table 1). Inadequate VTE prophylaxis was identified as an ongoing widespread problem of health care underutilization despite randomized clinical trials supporting the efficacy of prophylaxis.9, 10 Mirroring the AHRQ's assessment of underutilization of VTE prophylaxis as the single most important safety priority,6 the first QI RR focused on VTE, with plans to cover additional clinical conditions over time. As experts in the care of inpatients, hospitalists should be able to take custody of predictable complications of serious illness, identify and lower barriers to prevention, critically review prophylaxis options, utilize hospital‐specific data, and devise strategies to bridge the gap between knowledge and practice. Already leaders of multidisciplinary care teams, hospitalists are primed to lead multidisciplinary improvement teams as well.
| Phase 1 (January 2005April 2005): Executing the educational strategy |
|---|
| One‐hour conference calls |
| Curricular, clinical, technical, and creative aspects of production |
| Additional communication between members of working group between calls |
| Development of questionnaire for SHM membership, board, education, and hospital quality patient safety (HQPS) committees |
| Content freeze: fourth month of development |
| Implementation of revisions prior to April 2005 SHM Annual Meeting |
| Phase 2 (April 2005August 2005): revision based on feedback |
| Analysis of formative evaluation from Phase 1 |
| Launch of the VTE QI RR August 2005 |
| Secondary phases and venues for implementation |
| Workshops at hospital medicine educational events |
| SHM Quality course |
| Formal recognition of the learning, experience, or proficiency acquired by users |
| The working editorial team for the first resource room |
| Dedicated project manager (SHM staff) |
| Senior adviser for planning and development (SHM staff) |
| Senior adviser for education (SHM staff) |
| Content expert |
| Education editor |
| Hospital quality editor |
| Managing editor |
Available data on the demographics of hospitalists and feedback from the SHM membership, leadership, and committees indicated that most learners would have minimal previous exposure to QI concepts and only a few years of management experience. Any previous quality improvement initiatives would tend to have been isolated, experimental, or smaller in scale. The resource rooms are designed to facilitate quality improvement learning among hospitalists that is practice‐based and immediately relevant to patient care. Measurable improvement in particular care processes or outcomes should correlate with actual learning.
The educational strategy of the SHM was predicated on ensuring that a quality and patient safety curriculum would retain clinical applicability in the hospital setting. This approach, grounded in adult learning principles and common to medical education, teaches general principles by framing the learning experience as problem centered.11 Several domains were identified as universally important to any quality improvement effort: raising awareness of a local performance gap, applying the best current evidence to practice, tapping the experience of others leading QI efforts, and using measurements derived from rapid‐cycle tests of change. Such a template delineates the components of successful QI planning, implementation, and evaluation and provides users with a familiar RR format applicable to improving any care process, not just VTE.
The Internet was chosen as the mechanism for delivering training on the basis of previous surveys of the SHM membership in which members expressed a preference for electronic and Web‐based forms of educational content delivery. Drawing from the example of other organizations teaching quality improvement, including the Institute for Healthcare Improvement and Intermountain Health Care, the SHM valued the ubiquity of a Web‐based educational resource. To facilitate on‐the‐job training, the first SHM QI RR provides a comprehensive tool kit to guide hospitalists through the process of advocating, developing, implementing, and evaluating a QI initiative for VTE.
Prior to launching the resource room, formative input was collected from SHM leaders, a panel of education and QI experts, and attendees of the society's annual meetings. Such input followed each significant step in the development of the RR curricula. For example, visitors at a kiosk at the 2005 SHM annual meeting completed surveys as they navigated through the VTE QI RR. This focused feedback shaped prelaunch development. The ultimate performance evaluation and feedback for the QI RR curricula will be gauged by user reports of measurable improvement in specific hospital process or outcomes measures. The VTE QI RR was launched in August 2005 and promoted at the SHM Web site.
RESULTS
The content and layout of the VTE QI RR are depicted in Figure 1. The self‐directed learner may navigate through the entire resource room or just select areas for study. Those likely to visit only a single area are individuals looking for guidance to support discrete roles on the improvement team: champion, clinical leader, facilitator of the QI process, or educator of staff or patient audiences (see Figure 2).
Why Should You Act?
The visual center of the QI RR layout presents sobering statisticsalthough pulmonary embolism from deep vein thrombosis is the most common cause of preventable hospital death, most hospitalized medical patients at risk do not receive appropriate prophylaxisand then encourages hospitalist‐led action to reduce hospital‐acquired VTE. The role of the hospitalist is extracted from the competencies articulated in the Venous Thromboembolism, Quality Improvement, and Hospitalist as Teacher chapters of The Core Competencies in Hospital Medicine.2
Awareness
In the Awareness area of the VTE QI RR, materials to raise clinician, hospital staff, and patient awareness are suggested and made available. Through the SHM's lead sponsorship of the national DVT Awareness Month campaign, suggested Steps to Action depict exactly how a hospital medicine service can use the campaign's materials to raise institutional support for tackling this preventable problem.
Evidence
The Evidence section aggregates a list of the most pertinent VTE prophylaxis literature to help ground any QI effort firmly in the evidence base. Through an agreement with the American College of Physicians (ACP), VTE prophylaxis articles reviewed in the ACP Journal Club are presented here.12 Although the listed literature focuses on prophylaxis, plans are in place to include references on diagnosis and treatment.
Experience
Resource room visitors interested in tapping into the experience of hospitalists and other leaders of QI efforts can navigate directly to this area. Interactive resources here include downloadable and adaptable protocols for VTE prophylaxis and, most importantly, improvement stories profiling actual QI successes. The Experience section features comments from an author of a seminal trial that studied computer alerts for high‐risk patients not receiving prophylaxis.10 The educational goal of this section of the QI RR is to provide opportunities to learn from successful QI projects, from the composition of the improvement team to the relevant metrics, implementation plan, and next steps.
Ask the Expert
The most interactive part of the resource room, the Ask the Expert forum, provides a hybrid of experience and evidence. A visitor who posts a clinical or improvement question to this discussion community receives a multidisciplinary response. For each question posted, a hospitalist moderator collects and aggregates responses from a panel of VTE experts, QI experts, hospitalist teachers, and pharmacists. The online exchange permitted by this forum promotes wider debate and learning. The questions and responses are archived and thus are available for subsequent users to read.
Improve
This area features the focal point of the entire resource room, the VTE QI workbook, which was written and designed to provide action‐oriented learning in quality improvement. The workbook is a downloadable project outline to guide and document efforts aimed at reducing rates of hospital‐acquired VTE. Hospitalists who complete the workbook should have acquired familiarity with and a working proficiency in leading system‐level efforts to drive better patient care. Users new to the theory and practice of QI can also review key concepts from a slide presentation in this part of the resource room.
Educate
This content area profiles the hospital medicine core competencies that relate to VTE and QI while also offering teaching materials and advice for teachers of VTE or QI. Teaching resources for clinician educators include online CME and an up‐to‐date slide lecture about VTE prophylaxis. The lecture presentation can be downloaded and customized to serve the needs of the speaker and the audience, whether students, residents, or other hospital staff. Clinician educators can also share or review teaching pearls used by hospitalist colleagues who serve as ward attendings.
DISCUSSION
A case example, shown in Figure 3, demonstrates how content accessible through the SHM VTE QI RR may be used to catalyze a local quality improvement effort.
Hospitals will be measured on rates of VTE prophylaxis on medical and surgical services. Failure to standardize prophylaxis among different physician groups may adversely affect overall performance, with implications for both patient care and accreditation. The lack of a agreed‐on gold standard of what constitutes appropriate prophylaxis for a given patient does not absolve an institution of the duty to implement its own standards. The challenge of achieving local consensus on appropriate prophylaxis should not outweigh the urgency to address preventable in‐hospital deaths. In caring for increasing numbers of general medical and surgical patients, hospitalists are likely to be asked to develop and implement a protocol for VTE prophylaxis that can be used hospitalwide. In many instances hospitalists will accept this charge in the aftermath of previous hospital failures in which admission order sets or VTE assessment protocols were launched but never widely implemented. As the National Quality Forum or JCAHO regulations for uniformity among hospitals shift VTE prophylaxis from being voluntary to compulsory, hospitalists will need to develop improvement strategies that have greater reliability.
Hospitalists with no formal training in either vascular medicine or quality improvement may not be able to immediately cite the most current data about VTE prophylaxis rates and regimens and may not have the time to enroll in a training course on quality improvement. How would hospitalists determine baseline rates of appropriate VTE prophylaxis? How can medical education be used to build consensus and recruit support from other physicians? What should be the scope of the QI initiative, and what patient population should be targeted for intervention?
The goal of the SHM QI RR is to provide the tools and the framework to help hospitalists develop, implement, and manage a VTE prophylaxis quality improvement initiative. Suggested Steps to Action in the Awareness section depict exactly how a hospital medicine service can use the campaign's materials to raise institutional support for tackling this preventable problem. Hospital quality officers can direct the hospital's public relations department to the Awareness section for DVT Awareness Month materials, including public service announcements in audio, visual, and print formats. The hold music at the hospital can be temporarily replaced, television kiosks can be set up to run video loops, and banners can be printed and hung in central locations, all to get out the message simultaneously to patients and medical staff.
The Evidence section of the VTE QI RR references a key benchmark study, the DVT‐Free Prospective Registry.9 This study reported that at 183 sites in North America and Europe, more than twice as many medical patients as surgical patients failed to receive prophylaxis. The Evidence section includes the 7th American College of Chest Physicians Consensus Conference on Antithrombotic and Thrombolytic Therapy and also highlights 3 randomized placebo‐controlled clinical trials (MEDENOX 1999, ARTEMIS 2003, and PREVENT 2004) that have reported significant reduction of risk of VTE (50%‐60%) from pharmacologic prophylaxis in moderate‐risk medical inpatients.1315 Review of the data helps to determine which patient population to study first, which prophylaxis options a hospital could deploy appropriately, and the expected magnitude of the effect. Because the literature has already been narrowed and is kept current, hospitalists can save time in answering a range of questions, from the most commonly agreed‐on factors to stratify risk to which populations require alternative interventions.
The Experience section references the first clinical trial demonstrating improved patient outcomes from a quality improvement initiative aimed at improving utilization of VTE prophylaxis.10 At the large teaching hospital where the electronic alerts were studied, a preexisting wealth of educational information on the hospital Web site, in the form of multiple seminars and lectures on VTE prophylaxis by opinion leaders and international experts, had little impact on practice. For this reason, the investigators implemented a trial of how to change physician behavior by introducing a point‐of‐care intervention, the computer alerts. Clinicians prompted by an electronic alert to consider DVT prophylaxis for at‐risk patients employed nearly double the rate of pharmacologic prophylaxis and reduced the incidence of DVT or pulmonary embolism (PE) by 41%. This study suggests that a change introduced to the clinical workflow can improve evidence‐based VTE prophylaxis and also can reduce the incidence of VTE in acutely ill hospitalized patients.
We believe that if hospitalists use the current evidence and experience assembled in the VTE QI RR, they could develop and lead a systematic approach to improving utilization of VTE prophylaxis. Although there is no gold standard method for integrating VTE risk assessment into clinical workflow, the VTE QI RR presents key lessons both from the literature and real world experiences. The crucial take‐home message is that hospitalists can facilitate implementation of VTE risk assessments if they stress simplicity (ie, the sick, old, surgery benefit), link the risk assessment to a menu of evidence‐based prophylaxis options, and require assessment of VTE risk as part of a regular routine (on admission and at regular intervals). Although many hospitals do not yet have computerized entry of physician orders, the simple 4‐point VTE risk assessment described by Kucher et al might be applied to other hospitals.10 The 4‐point system would identify the patients at highest risk, a reasonable starting point for a QI initiative. Whatever the modelCPOE alerts of very high‐risk patients, CPOE‐forced VTE risk assessments, nursing assessments, or paper‐based order setsregular VTE risk assessment can be incorporated into the daily routine of hospital care.
The QI workbook sequences the steps of a multidisciplinary improvement team and prompts users to set specific goals, collect practical metrics, and conduct plan‐do‐study‐act (PDSA) cycles of learning and action (Figure 4). Hospitalists and other team members can use the information in the workbook to estimate the prevalence of use of the appropriate VTE prophylaxis and the incidence of hospital‐acquired VTE at their medical centers, develop a suitable VTE risk assessment model, and plan interventions. Starting with all patients admitted to one nurse on one unit, then expanding to an entire nursing unit, an improvement team could implement rapid PDSA cycles to iron out the wrinkles of a risk assessment protocol. After demonstrating a measurable benefit for the patients at highest risk, the team would then be expected to capture more patients at risk for VTE by modifying the risk assessment protocol to identify moderate‐risk patients (hospitalized patients with one risk factor), as in the MEDENOX, ARTEMIS, and PREVENT clinical trials. Within the first several months, the QI intervention could be expanded to more nursing units. An improvement report profiling a clinically important increase in the rate of appropriate VTE prophylaxis would advocate for additional local resources and projects.
As questions arise in assembling an improvement team, setting useful aims and metrics, choosing interventions, implementing and studying change, or collecting performance data, hospitalists can review answers to questions already posted and post their own questions in the Ask the Expert area. For example, one user asked whether there was a standard risk assessment tool for identifying patients at high risk of VTE. Another asked about the use of unfractionated heparin as a low‐cost alternative to low‐molecular‐weight heparin. Both these questions were answered within 24 hours by the content editor of the VTE QI RR and, for one question, also by 2 pharmacists and an international expert in VTE.
As other hospitalists begin de novo efforts of their own, success stories and strategies posted in the online forums of the VTE QI RR will be an evolving resource for basic know‐how and innovation.
Suggestions from a community of resource room users will be solicited, evaluated, and incorporated into the QI RR in order to improve its educational value and utility. The curricula could also be adapted or refined by others with an interest in systems‐based care or practice‐based learning, such as directors of residency training programs.
CONCLUSIONS
The QI RRs bring QI theory and practice to the hospitalist, when and wherever it is wanted, minimizing time away from patient care. The workbook links theory to practice and can be used to launch, sustain, and document a local VTE‐specific QI initiative. A range of experience is accommodated. Content is provided in a way that enables the user to immediately apply and adapt it to a local contextusers can access and download the subset of tools that best meet their needs. For practicing hospitalists, this QI resource offers an opportunity to bridge the training gap in systems‐based hospital care and should increase the quality and quantity of and support for opportunities to lead successful QI projects.
The Accreditation Council of Graduate Medical Education (ACGME) now requires education in health care systems, a requirement not previously mandated for traditional medical residency programs.17 Because the resource rooms should increase the number of hospitalists competently leading local efforts that achieve measurable gains in hospital outcomes, a wider potential constituency also includes residency program directors, internal medicine residents, physician assistants and nurse‐practitioners, nurses, hospital quality officers, and hospital medicine practice leaders.
Further research is needed to determine the clinical impact of the VTE QI workbook on outcomes for hospitalized patients. The effectiveness of such an educational method should be evaluated, at least in part, by documenting changes in clinically important process and outcome measures, in this case those specific to hospital‐acquired VTE. Investigation also will need to generate an impact assessment to see if the curricula are effective in meeting the strategic educational goals of the Society of Hospital Medicine. Further investigation will examine whether this resource can help residency training programs achieve ACGME goals for practice‐based learning and systems‐based care.
- Society of Hospital Medicine Available at: http://www.hospitalmedicine.org/AM/Template.cfm?Section=Quality_Improvement_Resource_Rooms1(suppl 1).
- ,,,,,.Physician practices in the prevention of venous thromboembolism.Arch Intern Med.1991;151:933–938.
- Kohn LT,Corrigan JM,Donaldson MS, eds.To Err Is Human.Washington, DC:National Academy Press;2000.
- Institute of Medicinehttp://www.iom.edu/CMS/3718.aspx
- Shojania KG,Duncan BW,McDonald KM,Wachter RM, eds.Making health care safer: a critical analysis of patient safety practices.Agency for Healthcare Research and Quality, Publication 01‐E058;2001.
- Joint Commission on the Accreditation of Health Care Organizations. Public policy initiatives. Available at: http://www.jcaho.org/about+us/public+policy+initiatives/pay_for_performance.htm
- .Curriculum Development for Medical Education: A Six‐Step Approach.Baltimore, Md:Johns Hopkins University Press;1998.
- ,;DVT FREE Steering Committee.A prospective registry of 5,451 patients with ultrasound‐confirmed deep vein thrombosis.Am J Cardiol.2004;93:259.
- ,,, et al.Electronic alerts to prevent venous thromboembolism among hospitalized patients.N Engl J Med.2005;352:969.
- ,,.Teaching the Case Method.3rd ed.Cambridge, Mass :Harvard Business School.
- American College of Physicians. Available at: http://www.acpjc.org/?hp
- ,,, et al.MEDENOX trial.N Engl J Med.1999;341:793–800.
- ,,.Fondaparinux versus placebo for the prevention of VTE in acutely ill medical patients (ARTEMIS).J Thromb Haemost.2003;1(suppl 1):2046.
- ,,,,,.PREVENT Medical Thromboprophylaxis Study Group.Circulation.2004;110:874–879.
- ,.Comparing the costs, risks and benefits of competing strategies for the primary prevention of VTE.Circulation.2004;110:IV25–IV32.
- Accreditation Council for Graduate Medical Education. Available at: http://www.acgme.org/acWebsite/programDir/pd_index.asp.
The goal of this article is to explain how the first in a series of online resource rooms provides trainees and hospitalists with quality improvement tools that can be applied locally to improve inpatient care.1 During the emergence and explosive growth of hospital medicine, the SHM recognized the need to revise training relating to inpatient care and hospital process design to meet the evolving expectation of hospitalists that their performance will be measured, to actively set quality parameters, and to lead multidisciplinary teams to improve hospital performance.2 Armed with the appropriate skill set, hospitalists would be uniquely situated to lead and manage improvements in processes in the hospitals in which they work.
The content of the first Society of Hospital Medicine (SHM) Quality Improvement Resource Room (QI RR) supports hospitalists leading a multidisciplinary team dedicated to improving inpatient outcomes by preventing hospital‐acquired venous thromboembolism (VTE), a common cause of morbidity and mortality in hospitalized patients.3 The SHM developed this educational resource in the context of numerous reports on the incidence of medical errors in US hospitals and calls for action to improve the quality of health care.'47 Hospital report cards on quality measures are now public record, and hospitals will require uniformity in practice among physicians. Hospitalists are increasingly expected to lead initiatives that will implement national standards in key practices such as VTE prophylaxis2.
The QI RRs of the SHM are a collection of electronic tools accessible through the SHM Web site. They are designed to enhance the readiness of hospitalists and members of the multidisciplinary inpatient team to redesign care at the institutional level. Although all performance improvement is ultimately occurs locally, many QI methods and tools transcend hospital geography and disease topic. Leveraging a Web‐based platform, the SHM QI RRs present hospitalists with a general approach to QI, enriched by customizable workbooks that can be downloaded to best meet user needs. This resource is an innovation in practice‐based learning, quality improvement, and systems‐based practice.
METHODS
Development of the first QI RR followed a series of steps described in Curriculum Development for Medical Education8 (for process and timeline, see Table 1). Inadequate VTE prophylaxis was identified as an ongoing widespread problem of health care underutilization despite randomized clinical trials supporting the efficacy of prophylaxis.9, 10 Mirroring the AHRQ's assessment of underutilization of VTE prophylaxis as the single most important safety priority,6 the first QI RR focused on VTE, with plans to cover additional clinical conditions over time. As experts in the care of inpatients, hospitalists should be able to take custody of predictable complications of serious illness, identify and lower barriers to prevention, critically review prophylaxis options, utilize hospital‐specific data, and devise strategies to bridge the gap between knowledge and practice. Already leaders of multidisciplinary care teams, hospitalists are primed to lead multidisciplinary improvement teams as well.
| Phase 1 (January 2005April 2005): Executing the educational strategy |
|---|
| One‐hour conference calls |
| Curricular, clinical, technical, and creative aspects of production |
| Additional communication between members of working group between calls |
| Development of questionnaire for SHM membership, board, education, and hospital quality patient safety (HQPS) committees |
| Content freeze: fourth month of development |
| Implementation of revisions prior to April 2005 SHM Annual Meeting |
| Phase 2 (April 2005August 2005): revision based on feedback |
| Analysis of formative evaluation from Phase 1 |
| Launch of the VTE QI RR August 2005 |
| Secondary phases and venues for implementation |
| Workshops at hospital medicine educational events |
| SHM Quality course |
| Formal recognition of the learning, experience, or proficiency acquired by users |
| The working editorial team for the first resource room |
| Dedicated project manager (SHM staff) |
| Senior adviser for planning and development (SHM staff) |
| Senior adviser for education (SHM staff) |
| Content expert |
| Education editor |
| Hospital quality editor |
| Managing editor |
Available data on the demographics of hospitalists and feedback from the SHM membership, leadership, and committees indicated that most learners would have minimal previous exposure to QI concepts and only a few years of management experience. Any previous quality improvement initiatives would tend to have been isolated, experimental, or smaller in scale. The resource rooms are designed to facilitate quality improvement learning among hospitalists that is practice‐based and immediately relevant to patient care. Measurable improvement in particular care processes or outcomes should correlate with actual learning.
The educational strategy of the SHM was predicated on ensuring that a quality and patient safety curriculum would retain clinical applicability in the hospital setting. This approach, grounded in adult learning principles and common to medical education, teaches general principles by framing the learning experience as problem centered.11 Several domains were identified as universally important to any quality improvement effort: raising awareness of a local performance gap, applying the best current evidence to practice, tapping the experience of others leading QI efforts, and using measurements derived from rapid‐cycle tests of change. Such a template delineates the components of successful QI planning, implementation, and evaluation and provides users with a familiar RR format applicable to improving any care process, not just VTE.
The Internet was chosen as the mechanism for delivering training on the basis of previous surveys of the SHM membership in which members expressed a preference for electronic and Web‐based forms of educational content delivery. Drawing from the example of other organizations teaching quality improvement, including the Institute for Healthcare Improvement and Intermountain Health Care, the SHM valued the ubiquity of a Web‐based educational resource. To facilitate on‐the‐job training, the first SHM QI RR provides a comprehensive tool kit to guide hospitalists through the process of advocating, developing, implementing, and evaluating a QI initiative for VTE.
Prior to launching the resource room, formative input was collected from SHM leaders, a panel of education and QI experts, and attendees of the society's annual meetings. Such input followed each significant step in the development of the RR curricula. For example, visitors at a kiosk at the 2005 SHM annual meeting completed surveys as they navigated through the VTE QI RR. This focused feedback shaped prelaunch development. The ultimate performance evaluation and feedback for the QI RR curricula will be gauged by user reports of measurable improvement in specific hospital process or outcomes measures. The VTE QI RR was launched in August 2005 and promoted at the SHM Web site.
RESULTS
The content and layout of the VTE QI RR are depicted in Figure 1. The self‐directed learner may navigate through the entire resource room or just select areas for study. Those likely to visit only a single area are individuals looking for guidance to support discrete roles on the improvement team: champion, clinical leader, facilitator of the QI process, or educator of staff or patient audiences (see Figure 2).
Why Should You Act?
The visual center of the QI RR layout presents sobering statisticsalthough pulmonary embolism from deep vein thrombosis is the most common cause of preventable hospital death, most hospitalized medical patients at risk do not receive appropriate prophylaxisand then encourages hospitalist‐led action to reduce hospital‐acquired VTE. The role of the hospitalist is extracted from the competencies articulated in the Venous Thromboembolism, Quality Improvement, and Hospitalist as Teacher chapters of The Core Competencies in Hospital Medicine.2
Awareness
In the Awareness area of the VTE QI RR, materials to raise clinician, hospital staff, and patient awareness are suggested and made available. Through the SHM's lead sponsorship of the national DVT Awareness Month campaign, suggested Steps to Action depict exactly how a hospital medicine service can use the campaign's materials to raise institutional support for tackling this preventable problem.
Evidence
The Evidence section aggregates a list of the most pertinent VTE prophylaxis literature to help ground any QI effort firmly in the evidence base. Through an agreement with the American College of Physicians (ACP), VTE prophylaxis articles reviewed in the ACP Journal Club are presented here.12 Although the listed literature focuses on prophylaxis, plans are in place to include references on diagnosis and treatment.
Experience
Resource room visitors interested in tapping into the experience of hospitalists and other leaders of QI efforts can navigate directly to this area. Interactive resources here include downloadable and adaptable protocols for VTE prophylaxis and, most importantly, improvement stories profiling actual QI successes. The Experience section features comments from an author of a seminal trial that studied computer alerts for high‐risk patients not receiving prophylaxis.10 The educational goal of this section of the QI RR is to provide opportunities to learn from successful QI projects, from the composition of the improvement team to the relevant metrics, implementation plan, and next steps.
Ask the Expert
The most interactive part of the resource room, the Ask the Expert forum, provides a hybrid of experience and evidence. A visitor who posts a clinical or improvement question to this discussion community receives a multidisciplinary response. For each question posted, a hospitalist moderator collects and aggregates responses from a panel of VTE experts, QI experts, hospitalist teachers, and pharmacists. The online exchange permitted by this forum promotes wider debate and learning. The questions and responses are archived and thus are available for subsequent users to read.
Improve
This area features the focal point of the entire resource room, the VTE QI workbook, which was written and designed to provide action‐oriented learning in quality improvement. The workbook is a downloadable project outline to guide and document efforts aimed at reducing rates of hospital‐acquired VTE. Hospitalists who complete the workbook should have acquired familiarity with and a working proficiency in leading system‐level efforts to drive better patient care. Users new to the theory and practice of QI can also review key concepts from a slide presentation in this part of the resource room.
Educate
This content area profiles the hospital medicine core competencies that relate to VTE and QI while also offering teaching materials and advice for teachers of VTE or QI. Teaching resources for clinician educators include online CME and an up‐to‐date slide lecture about VTE prophylaxis. The lecture presentation can be downloaded and customized to serve the needs of the speaker and the audience, whether students, residents, or other hospital staff. Clinician educators can also share or review teaching pearls used by hospitalist colleagues who serve as ward attendings.
DISCUSSION
A case example, shown in Figure 3, demonstrates how content accessible through the SHM VTE QI RR may be used to catalyze a local quality improvement effort.
Hospitals will be measured on rates of VTE prophylaxis on medical and surgical services. Failure to standardize prophylaxis among different physician groups may adversely affect overall performance, with implications for both patient care and accreditation. The lack of a agreed‐on gold standard of what constitutes appropriate prophylaxis for a given patient does not absolve an institution of the duty to implement its own standards. The challenge of achieving local consensus on appropriate prophylaxis should not outweigh the urgency to address preventable in‐hospital deaths. In caring for increasing numbers of general medical and surgical patients, hospitalists are likely to be asked to develop and implement a protocol for VTE prophylaxis that can be used hospitalwide. In many instances hospitalists will accept this charge in the aftermath of previous hospital failures in which admission order sets or VTE assessment protocols were launched but never widely implemented. As the National Quality Forum or JCAHO regulations for uniformity among hospitals shift VTE prophylaxis from being voluntary to compulsory, hospitalists will need to develop improvement strategies that have greater reliability.
Hospitalists with no formal training in either vascular medicine or quality improvement may not be able to immediately cite the most current data about VTE prophylaxis rates and regimens and may not have the time to enroll in a training course on quality improvement. How would hospitalists determine baseline rates of appropriate VTE prophylaxis? How can medical education be used to build consensus and recruit support from other physicians? What should be the scope of the QI initiative, and what patient population should be targeted for intervention?
The goal of the SHM QI RR is to provide the tools and the framework to help hospitalists develop, implement, and manage a VTE prophylaxis quality improvement initiative. Suggested Steps to Action in the Awareness section depict exactly how a hospital medicine service can use the campaign's materials to raise institutional support for tackling this preventable problem. Hospital quality officers can direct the hospital's public relations department to the Awareness section for DVT Awareness Month materials, including public service announcements in audio, visual, and print formats. The hold music at the hospital can be temporarily replaced, television kiosks can be set up to run video loops, and banners can be printed and hung in central locations, all to get out the message simultaneously to patients and medical staff.
The Evidence section of the VTE QI RR references a key benchmark study, the DVT‐Free Prospective Registry.9 This study reported that at 183 sites in North America and Europe, more than twice as many medical patients as surgical patients failed to receive prophylaxis. The Evidence section includes the 7th American College of Chest Physicians Consensus Conference on Antithrombotic and Thrombolytic Therapy and also highlights 3 randomized placebo‐controlled clinical trials (MEDENOX 1999, ARTEMIS 2003, and PREVENT 2004) that have reported significant reduction of risk of VTE (50%‐60%) from pharmacologic prophylaxis in moderate‐risk medical inpatients.1315 Review of the data helps to determine which patient population to study first, which prophylaxis options a hospital could deploy appropriately, and the expected magnitude of the effect. Because the literature has already been narrowed and is kept current, hospitalists can save time in answering a range of questions, from the most commonly agreed‐on factors to stratify risk to which populations require alternative interventions.
The Experience section references the first clinical trial demonstrating improved patient outcomes from a quality improvement initiative aimed at improving utilization of VTE prophylaxis.10 At the large teaching hospital where the electronic alerts were studied, a preexisting wealth of educational information on the hospital Web site, in the form of multiple seminars and lectures on VTE prophylaxis by opinion leaders and international experts, had little impact on practice. For this reason, the investigators implemented a trial of how to change physician behavior by introducing a point‐of‐care intervention, the computer alerts. Clinicians prompted by an electronic alert to consider DVT prophylaxis for at‐risk patients employed nearly double the rate of pharmacologic prophylaxis and reduced the incidence of DVT or pulmonary embolism (PE) by 41%. This study suggests that a change introduced to the clinical workflow can improve evidence‐based VTE prophylaxis and also can reduce the incidence of VTE in acutely ill hospitalized patients.
We believe that if hospitalists use the current evidence and experience assembled in the VTE QI RR, they could develop and lead a systematic approach to improving utilization of VTE prophylaxis. Although there is no gold standard method for integrating VTE risk assessment into clinical workflow, the VTE QI RR presents key lessons both from the literature and real world experiences. The crucial take‐home message is that hospitalists can facilitate implementation of VTE risk assessments if they stress simplicity (ie, the sick, old, surgery benefit), link the risk assessment to a menu of evidence‐based prophylaxis options, and require assessment of VTE risk as part of a regular routine (on admission and at regular intervals). Although many hospitals do not yet have computerized entry of physician orders, the simple 4‐point VTE risk assessment described by Kucher et al might be applied to other hospitals.10 The 4‐point system would identify the patients at highest risk, a reasonable starting point for a QI initiative. Whatever the modelCPOE alerts of very high‐risk patients, CPOE‐forced VTE risk assessments, nursing assessments, or paper‐based order setsregular VTE risk assessment can be incorporated into the daily routine of hospital care.
The QI workbook sequences the steps of a multidisciplinary improvement team and prompts users to set specific goals, collect practical metrics, and conduct plan‐do‐study‐act (PDSA) cycles of learning and action (Figure 4). Hospitalists and other team members can use the information in the workbook to estimate the prevalence of use of the appropriate VTE prophylaxis and the incidence of hospital‐acquired VTE at their medical centers, develop a suitable VTE risk assessment model, and plan interventions. Starting with all patients admitted to one nurse on one unit, then expanding to an entire nursing unit, an improvement team could implement rapid PDSA cycles to iron out the wrinkles of a risk assessment protocol. After demonstrating a measurable benefit for the patients at highest risk, the team would then be expected to capture more patients at risk for VTE by modifying the risk assessment protocol to identify moderate‐risk patients (hospitalized patients with one risk factor), as in the MEDENOX, ARTEMIS, and PREVENT clinical trials. Within the first several months, the QI intervention could be expanded to more nursing units. An improvement report profiling a clinically important increase in the rate of appropriate VTE prophylaxis would advocate for additional local resources and projects.
As questions arise in assembling an improvement team, setting useful aims and metrics, choosing interventions, implementing and studying change, or collecting performance data, hospitalists can review answers to questions already posted and post their own questions in the Ask the Expert area. For example, one user asked whether there was a standard risk assessment tool for identifying patients at high risk of VTE. Another asked about the use of unfractionated heparin as a low‐cost alternative to low‐molecular‐weight heparin. Both these questions were answered within 24 hours by the content editor of the VTE QI RR and, for one question, also by 2 pharmacists and an international expert in VTE.
As other hospitalists begin de novo efforts of their own, success stories and strategies posted in the online forums of the VTE QI RR will be an evolving resource for basic know‐how and innovation.
Suggestions from a community of resource room users will be solicited, evaluated, and incorporated into the QI RR in order to improve its educational value and utility. The curricula could also be adapted or refined by others with an interest in systems‐based care or practice‐based learning, such as directors of residency training programs.
CONCLUSIONS
The QI RRs bring QI theory and practice to the hospitalist, when and wherever it is wanted, minimizing time away from patient care. The workbook links theory to practice and can be used to launch, sustain, and document a local VTE‐specific QI initiative. A range of experience is accommodated. Content is provided in a way that enables the user to immediately apply and adapt it to a local contextusers can access and download the subset of tools that best meet their needs. For practicing hospitalists, this QI resource offers an opportunity to bridge the training gap in systems‐based hospital care and should increase the quality and quantity of and support for opportunities to lead successful QI projects.
The Accreditation Council of Graduate Medical Education (ACGME) now requires education in health care systems, a requirement not previously mandated for traditional medical residency programs.17 Because the resource rooms should increase the number of hospitalists competently leading local efforts that achieve measurable gains in hospital outcomes, a wider potential constituency also includes residency program directors, internal medicine residents, physician assistants and nurse‐practitioners, nurses, hospital quality officers, and hospital medicine practice leaders.
Further research is needed to determine the clinical impact of the VTE QI workbook on outcomes for hospitalized patients. The effectiveness of such an educational method should be evaluated, at least in part, by documenting changes in clinically important process and outcome measures, in this case those specific to hospital‐acquired VTE. Investigation also will need to generate an impact assessment to see if the curricula are effective in meeting the strategic educational goals of the Society of Hospital Medicine. Further investigation will examine whether this resource can help residency training programs achieve ACGME goals for practice‐based learning and systems‐based care.
- Society of Hospital Medicine Available at: http://www.hospitalmedicine.org/AM/Template.cfm?Section=Quality_Improvement_Resource_Rooms1(suppl 1).
- ,,,,,.Physician practices in the prevention of venous thromboembolism.Arch Intern Med.1991;151:933–938.
- Kohn LT,Corrigan JM,Donaldson MS, eds.To Err Is Human.Washington, DC:National Academy Press;2000.
- Institute of Medicinehttp://www.iom.edu/CMS/3718.aspx
- Shojania KG,Duncan BW,McDonald KM,Wachter RM, eds.Making health care safer: a critical analysis of patient safety practices.Agency for Healthcare Research and Quality, Publication 01‐E058;2001.
- Joint Commission on the Accreditation of Health Care Organizations. Public policy initiatives. Available at: http://www.jcaho.org/about+us/public+policy+initiatives/pay_for_performance.htm
- .Curriculum Development for Medical Education: A Six‐Step Approach.Baltimore, Md:Johns Hopkins University Press;1998.
- ,;DVT FREE Steering Committee.A prospective registry of 5,451 patients with ultrasound‐confirmed deep vein thrombosis.Am J Cardiol.2004;93:259.
- ,,, et al.Electronic alerts to prevent venous thromboembolism among hospitalized patients.N Engl J Med.2005;352:969.
- ,,.Teaching the Case Method.3rd ed.Cambridge, Mass :Harvard Business School.
- American College of Physicians. Available at: http://www.acpjc.org/?hp
- ,,, et al.MEDENOX trial.N Engl J Med.1999;341:793–800.
- ,,.Fondaparinux versus placebo for the prevention of VTE in acutely ill medical patients (ARTEMIS).J Thromb Haemost.2003;1(suppl 1):2046.
- ,,,,,.PREVENT Medical Thromboprophylaxis Study Group.Circulation.2004;110:874–879.
- ,.Comparing the costs, risks and benefits of competing strategies for the primary prevention of VTE.Circulation.2004;110:IV25–IV32.
- Accreditation Council for Graduate Medical Education. Available at: http://www.acgme.org/acWebsite/programDir/pd_index.asp.
Copyright © 2006 Society of Hospital Medicine
