User login
U.S. Physician Satisfaction
The burden of dissatisfaction among medical professionals concerns both physicians and policy makers, especially given the potential ramifications on the work force.1, 2 Abundant research documents a strong relationship between low levels of physician satisfaction and burnout,37 intention to leave,6, 815 and job turnover.13, 1618 Moreover, low physician satisfaction is associated with self‐reported psychiatric symptoms1921 and poorer perceived mental health.22 Not surprisingly, dissatisfied physicians are less likely to recommend to medical students that they pursue their specialty.23
Importantly, physician satisfaction appears to benefit patients. Several studies show a positive relationship between higher physician satisfaction and patient satisfaction and outcomes.2426 Patients cared for by satisfied physicians declare more trust and confidence in their physicians, have better continuity, higher ratings of their care,26, 27 lower no‐show rates,25 and enhanced adherence to their medical care.28 There is also some evidence that higher job satisfaction is associated with lower likelihood of patient errors and suboptimal patient care.29
Physician satisfaction can be influenced by factors intrinsic to the individual physician (age, gender, race, and specialty) and extrinsic to the physician (work environment, practice setting, patient characteristics, and income).22, 30 In this way, satisfaction is not a static property in any physician or physician group, but reflects a dynamic interplay among the expectations and environments within which they work. Although each physician, physician group, and specialty has distinct factors that affect satisfaction, none are immune to potential dissatisfaction.
Given the documented impact of physician satisfaction on multiple aspects of healthcare delivery, we undertook a systematic review of the existing literature to achieve a greater understanding of the current state of U.S. physician satisfaction. In addition, we sought to identify the major survey tools used to measure satisfaction and the characteristics intrinsic and extrinsic to the physician that are associated with satisfaction. We conclude by suggesting needed additional research.
Materials and Methods
We performed a literature search of MEDLINE (
Results
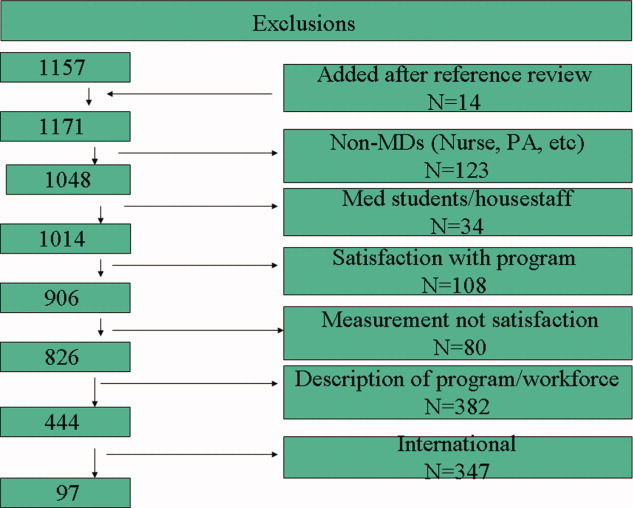
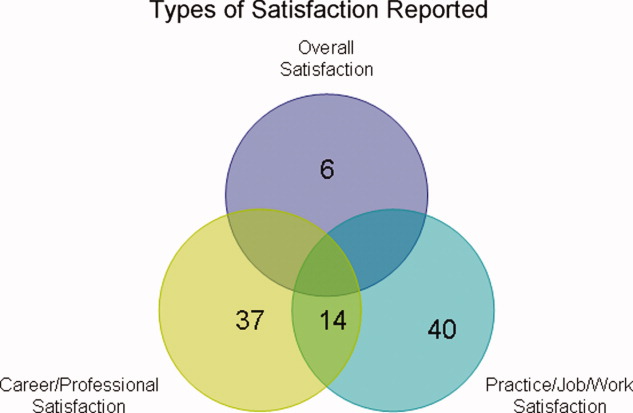
Of the 97 studies, 69 were cross‐sectional (distributed to purposive and often convenience samples of physicians) with sampling sizes ranging from 39 to 6441 and response rates ranging from 31% to 97% (Appendix 1). The other 28 were from larger nationally representative studies (Table 1), including the CTS (n = 92, 45, 71, 74, 91, 102, 104106), RWJS (n = 81, 18, 3334, 39, 40, 60, 61), PWS (n = 711, 22, 23, 55, 83, 92, 99), and WPHS (n = 444, 4951). Fourteen articles reported information from longitudinal (n = 2)18, 86 or repeated cross‐sectional studies (n = 12)1, 2, 39, 73, 76, 79, 85, 91, 96, 97, 102, 110 to help determine satisfaction trends. The survey instruments from the 4 national physician surveys are outlined in Table 1. The types of satisfaction reported are outlined in Figure 2.
| Survey | Satisfaction Measured | MD Type Sampled | Sampled/Responded/Adjusted Response [n/n/% (year of survey)] |
|---|---|---|---|
| |||
| PWS | 150‐item survey; 3 satisfaction domains (job, career, and specialty; all 5‐point Likert scales); 10 satisfaction facets | AMA Masterfile; random sample; FP, IM, IM specialists, pediatrics, and pediatric specialists | 5704/2326/52% |
| CTS | Career satisfaction (5 point Likert scale) | AMA Masterfile; random sample; all physicians in direct patient care 20+ hours a week | 19054/12385/65% (1996); 20131/12280/61% (1998); 20998/12389/59% (2000) |
| RWJ | Practice satisfaction (4‐point Likert scale); career satisfaction (3‐point Likert scale) | AMA Masterfile; random sample; 1987: physicians <40 years old in practice 1‐6 years; 1991: physicians <45 years old in practice 2‐9 years; 1997: physicians <52 years old in practice 8‐17 years | 8379/5865/70% (1987); 9745/4373/70% (1991); 2093/1549/74% (1997) |
| WPHS | Career satisfaction (5‐point Likert scale) | AMA Masterfile; random sample; female medical school graduates from 1950 to 1989 | 4501/2656/59% |
Trends in U.S. Physician Satisfaction
The CTS physician survey used sophisticated large‐scale random sampling methods and consistent questionnaires, thus allowing assessment of trends. From these repeated cross‐sectional surveys, career satisfaction from 1996 to 2001 was stable (81% to 80% among primary care physicians [PCPs], and 81% to 81% among specialists), although the portion of PCPs who report being very satisfied declined from 42% to 38% (P < 0.001) with no significant change for specialists (43% to 42%; P = 0.20).2
The RWJ surveys found small overall declines. From 1991 to 1997, practice satisfaction declined from 86% to 79%, and career satisfaction declined 96% to 88% (P = not available [NA]).1 A comparison of the 1991 RWJ survey to a 1996 age‐matched California physician survey and also found practice satisfaction declined slightly (86% to 82%, P = NA; very satisfied declined 48% to 37%, P = 0.05).39
Two studies of PCPs in Massachusetts found similar modest declines. The first found practice satisfaction declined from 80% to 66% (1996 to 1999; P < 0.001),73 and the second found a nonsignificant decline in professional satisfaction from 81% to 73% (1986 to 1997; P = not significant [NS]).85 Other studies of specific physician populations found insignificant changes in satisfaction levels during the study periods.76, 79, 86, 91, 96, 97, 110 In summary, recent overall physician satisfaction is relatively unchanged, although there may be modest declines in PCPs and young physicians who report high satisfaction, as evidenced from the CTS, RWJ studies, and other small physician cohorts.
Major Characteristics Associated with Physician Satisfaction
Both factors intrinsic to the physician and characteristics of the job influence physician satisfaction (Figure 3). Intrinsic physician factors are typically not changeable when developing strategies to improve satisfaction. However, they do significantly affect what physicians consider important when choosing a job, and influence how physicians respond to changes in the job. Job characteristics, or extrinsic factors, are generally considered more modifiable when developing institutional strategies to improve satisfaction. Although the intrinsic factors are seemingly unmodifiable, one must take them into account when assessing satisfaction in order to determine the independent effects that the more modifiable extrinsic factors have on satisfaction. The next section describes the variables associated with satisfaction, from the 37 studies that utilized multivariate analyses (Appendix 2) to control for other factors (Appendix 3).

Physician Factors
Physician Age
Age is likely weakly but independently associated with satisfaction, although interpretation is limited by the heterogeneity of the physician samples and the manner in which age is reported. Of the 18 studies that evaluated age, 3 (from the PWS, WPHS, and 1 other) found a weak but positive association.9, 23, 50 Five (from the CTS and others) found a U‐shaped relationship (those at the extremes of age were the most satisfied),59, 68, 70, 71, 74 and 3 found an inverse association (2 CTS PCP subsets, and 1 small single‐county study.35, 45, 106 Six found no association, of which only 1 was from a nationally representative sample (PWS PCPs).5, 96, 97, 109, 110, 112
As a surrogate for age, 6 studies evaluated years in practice or years since medical school graduation. Of these, 2 found a weak but positive association (although only seen in specialists, not PCPs in the CTS),89, 104 and 1 found a negative association (when dichotomized),73 with no association in 3 smaller studies.5, 56, 88
These studies support that age is weakly but independently associated with physician satisfaction when studied as a continuous variable. When studied within various age brackets, studies support a U‐shaped association, with the highest satisfaction in those at the extremes of ages, although this may not be true for PCPs. In addition, the association with older age may be the result of less satisfied physicians leaving the profession.
Physician Gender
The association between gender and overall satisfaction is difficult to interpret due to the heterogeneity of the satisfaction assessments and included confounders, although there may be gender differences in facets of satisfaction. Of the 22 studies that evaluated gender, 3 found an independent effect for women (PWS general internal medicine [GIM] sample, CTS, and 1 other),23, 104, 110 3 for men,41, 81, 98 and no gender effect in the others. Those that found men with higher satisfaction included 1 national study of family practitioners (FPs)98 and 2 academic studies, the latter of which found men with or without children with higher satisfaction compared to women with children, indicating children (or work life balance) may confound gender satisfaction.41, 81
Other national studies, including the CTS and PWS, did not find a gender difference in overall satisfaction,9, 35, 45, 56, 59, 68, 71, 73, 74, 88, 89, 96, 97, 106, 109 although the PWS did find differences in facets of satisfaction (women were more satisfied with relationships with colleagues and patients, but less satisfied with autonomy, pay, resources, and community relationships).83
In summary, the relationship between gender and overall satisfaction is likely confounded by many factors, and its independent effect is difficult to quantify given the heterogeneity of the studies reviewed. There may be gender differences in facets of satisfaction, evaluated only in the PWS.
Physician Race/Ethnicity
There were only 5 multivariate studies delineating the association of race/ethnicity with satisfaction, of which 4 found no difference.35, 50, 56, 88 One study found lower satisfaction in minorities compared to whites, but was only a small sample of preventive medicine physicians.93 Given the growing racial and ethnic diversity of physicians, future research should further explore this association.
Physician Specialty
Overall, pediatricians appear to have higher, and GIM to have lower, satisfaction when compared among the PCPs or specialists, although the interpretation is limited by the heterogeneity of the specialties included, how the specialties are demarcated, and the composition of the reference group.
Of the 17 studies that evaluated specialty, 6 found pediatricians had higher satisfaction (including the CTS),5, 70, 73, 74, 104, 106 and 5 found GIM to have lower satisfaction (including the CTS and PWS)5, 11, 74, 104, 106 than various other comparison groups. Generalized interpretation of the other studies is difficult, as 8 of the 11 arise from very specific convenience samples of physicians (within a state or county).35, 56, 68, 73, 89, 96, 97, 109
Job Factors
Job Demand
There is evidence of a relationship between subjective, but not objective, job demands and satisfaction (categorized in the literature as work stress/pressure, workload, and work hours). Of the 10 studies that evaluated various types of perceived work stress/pressure, 9 found a significant association with dissatisfaction.5, 11, 22, 23, 45, 50, 68, 98, 104
Of the 8 studies that evaluated workload, 4 of them evaluated subjective workload and found too much or too little was associated with dissatisfaction.50, 86, 107, 110 The other 4 evaluated actual number of visits (per week or per hour); 3 did not find an association5, 56, 68 and 1 found a weak but negative association with satisfaction.70
Of the 13 studies that evaluated work hours, 8 found no association (including the PWS, CTS, and WPHS).23, 50, 73, 88, 89, 104, 107, 112 Only 1 found a positive association; however, these results were from a stepwise regression analysis in which work stress had already been controlled for in the model, and a separate stepwise regression showed more work hours to be associated with higher stress levels.98 One found satisfaction with work hours had a strong association with overall satisfaction (but not actual work hours).86 Three found a weak negative association, the last of which found that a recent increase in work hours was significantly associated with dissatisfaction, but not actual work hours.2, 70, 84
Of the 3 studies that evaluated on‐call frequency, 2 found higher call frequency to be moderately negatively associated70, 88 and 1 found no association.50
In summary, there is unequivocal evidence that an imbalance between expected and experienced stress, pressure, or workload is moderately associated with dissatisfaction, but there is less evidence of a significant association with objective workload or work hours. On‐call duty may moderately negatively influence satisfaction, although based only on 2 small studies.
Job Control/Autonomy
There is also a strong association with satisfaction and physician control over elements in their work place. Although the studies are heterogeneous in their assessment of work control and autonomy, 15 of the 16 studies found these dimensions to be strongly and significantly associated with satisfaction.1, 2, 5, 20, 45, 50, 56, 68, 71, 86, 96, 97, 104, 107, 109, 112
Relationship with Colleagues
All 5 studies associating relationship with colleagues with satisfaction found the perception of collegial support/emnteraction to exert a moderate independent effect on satisfaction.5, 20, 89, 104, 112
Part‐time Work Status
Of the 3 studies that evaluated this factor in multivariate analysis, 2 did not find a significant association,71, 110 and 1 reported higher satisfaction with full time work (but did not report statistical values).9 Given the number of U.S. physicians working part time, this warrants further research.
Practice Characteristics (Size/Setting/Site/Ownership)
The interpretation of practice characteristics and satisfaction is limited by the heterogeneity in the way the studies partitioned the practice characteristics, and the reference group composition. Of the 10 studies that evaluated several types of practice settings, 5 found solo or small (1‐2 person) practice sizes more likely associated with dissatisfaction than larger practice sizes.88, 97, 104106 The PWS and CTS obstetrician‐gynecologist (ob‐gyn) subset also found health maintenance organization (HMO) satisfaction to be lower compared to various comparisons11, 71 (although the PWS GIM subset did not find a difference).23 Of the 6 surveys evaluating academic/medical school as the reference group, 4 found higher satisfaction with academics (including 2 from the CTS),9, 71, 104, 110 but 2 smaller studies did not find a difference with university affiliation or teaching.88, 96 Of those studies evaluating single vs. multispecialty groups, only 1 found single‐specialty with higher satisfaction than multispecialty89 and 3 others did not find a difference.56, 68, 73
Regarding practice size, 3 of the 4 found no association with satisfaction.56, 109, 110, 112 Only the CTS evaluated practice region and community size and found rural physicians, those in small metropolitan areas, and those in New England and West North central regions had higher satisfaction.45, 71, 74 The CTS also supports that physicians that are part‐owners or nonowners of their practice have higher satisfaction than full owners.45, 74
In summary, practice characteristics may influence physician satisfaction. Physicians in solo and HMO practices may be less satisfied than physicians in other practice settings and sizes, and academic affiliation may have a small but significant association with satisfaction. Practice size and single vs. multispecialty does not appear to significantly affect satisfaction, and satisfaction association with practice region, community size, and ownership is drawn primarily from the CTS and requires further study.
Patient‐payer Mix and Insurance Status
Capitation and provider‐managed care training does appear to affect satisfaction, but managed care or patient insurance status does not. Of the 9 studies that addressed the influence of managed care or capitation on satisfaction, the percentage of managed care practice revenue, number of managed care contracts, or percentage of managed care patients in a practice had no association with satisfaction.2, 71, 73, 74, 104, 105, 109, 112 Two studies did find that capitation was associated with provider dissatisfaction.2, 68 One CTS study found career satisfaction increased in states after the implementation of patient protection acts (implying physician satisfaction increased with less managed care control and more patient/provider empowerment).102 Two other studies found that physicians with training in managed care and positive attitudes about managed care were more likely to be satisfied.98, 112
Regarding insurance status, 3 studies of PCPs in different states did not find an association between satisfaction and insurance (private, none, Medicare, or Medicaid),35, 68, 89 although a study of rural PCPs found more dissatisfaction in those who reported a recent decrease in the number of patients with adequate insurance.84
In summary, there is unlikely an independent effect of patient‐payer mix or managed care on satisfaction. However, capitation may exert a negative effect, and managed care training (and attitude) may exert a positive effect.
Patient Characteristics
Most patient factors were not found to be independently associated with physician satisfaction, including patient complexity,23, 112 patient demands,5, 20 or specific patient demographics.56 The PWS and CTS studies found physicians who value and are able to maintain long‐term patient relationships were more satisfied.45, 104, 112 One study found that those who perceive patients lack confidence in physicians were more likely to be dissatisfied.109 In summary, patient characteristics do not appear to influence provider satisfaction, but a provider's value of, and ability to maintain, long‐term relationships, as well as their perception of patient trust, may influence satisfaction.
Income
Of the 14 studies that evaluated income, 11 found a positive association (the CTS, RWJ, and others) with actual income1, 2, 45, 74, 84, 88, 93, 104 and income satisfaction.97, 98, 109 Of the 3 that did not find an association with actual income, 2 were from the PWS,23, 112 and 1 from the CTS ob‐gyn subset.71
In summary, the association between actual income and satisfaction may be confounded by other variables (such as work hours and part‐time status), but satisfaction with income does appear to correlate with overall satisfaction.
Incentives
There does appear to be a moderate satisfaction association with the types of income incentives. The CTS studies found more satisfied physicians were those with the ability to make clinical decisions without affecting one's income (although that was not found for the PCP subset).45, 104, 106 Other studies found more satisfaction in those reporting a practice with incentives/emphasis based on quality, and less satisfaction in those with incentives/emphasis based on productivity or service reduction.1, 57, 112 Therefore, the evidence favors higher satisfaction with incentives based on quality rather than productivity or utilization.
Other Physician Factors
Board certification may be modestly positively associated with satisfaction, and being a foreign medical graduate may be modestly negatively associated with satisfaction, although this is limited to few studies.9, 45, 74, 98, 104, 106 Other physician characteristics, such as personal matters (marital status, home stress, mental health, personal satisfaction), work matters (amount of charity care they provide and history of work harassment), and personality (reform mindedness and tolerance for uncertainty) require further research.50, 56, 88, 98, 104
Discussion
Our review of satisfaction trends for U.S. physicians revealed relative stability except for a slight decline among PCPs. We found factors significantly associated with satisfaction to include both physician (age and specialty) and job factors (work demand, work control, colleague support, ability to maintain patient relationships, practice setting, income satisfaction, and incentive types). Based on limited data, the association with race/ethnicity and part‐time work requires more research, and factors that do not appear to have an independent effect on satisfaction include physician gender, patient‐payer mix, and patient characteristics.
As the fastest growing specialty in the history of American medicine, hospital medicine should focus on career satisfaction as a top priority in shaping the future of the more than 20,000 hospitalists now practicing. Although the term hospitalist was coined less than 15 years ago114 the demand for hospitalists is expected to grow to as many as 50,000 by 2020.115 In this time of rapid growth, in order to mold a sustainable specialty, we must all recognize the factors that contribute to satisfaction and strive to maintain good job‐person fit. For individual hospitalists, all of these mediators of satisfaction should be considered when contemplating employment. To ensure a mutual fit, each physician must reflect on how their goals and values coincide with those of the program they are considering. For hospital medicine program leaders, areas of program‐specific dissatisfaction must be continually sought and addressed.
In this review, the variables with the strongest associations with satisfaction that are most pertinent to hospitalists are work demand, control, income/emncentives, and collegial relationships. These variables coincide with the 4 pillars of career satisfaction identified in the Society of Hospital Medicine Career Satisfaction Task Force.116 Perceived work stress/pressure and objective workload can easily (and serially) be measured, and the latter can be compared to national benchmarks to ensure appropriate workload expectations.116 Reducing work pressure/stress may involve assessing and matching variations in workload with manpower, reducing nonclinical tasks by utilizing administrative assistants or physician extenders, or having an emergency plan for unexpected absences. Autonomy and control can be assessed by the job‐fit questionnaire to identify programwide and physician‐specific areas of potential discontent.116 Increasing autonomy/control may involve pursuing leadership within hospital projects or committees, creatively scheduling flexibility, and seeking support from hospital administration. Income expectations should also be couched within national benchmarks, and incentive programs should reflect work quality rather than quantity. Collegial support can be enhanced by instituting a mentoring program, journal club, regular social function, or configuration of offices spaces to allow proximity. Although the conclusions of this review are limited by the lack of hospitalists included in the studies and our inability to perform a meta‐analysis, we believe extrapolation of this information to hospitalist physicians is valid and appropriate. That said, future studies specifically addressing hospitalist satisfaction are needed to ensure this.
Conclusions
In summary, physician satisfaction is not a static parameter, but a dynamic entity mediated by both physician‐related and job‐related factors, the majority of which are modifiable. Thus hospitalists and hospital medicine program leaders can be optimistic that uncovering the presence of dissatisfaction through surveys, and addressing the issues triggering it, should enhance physician satisfaction. With improved awareness of mitigating factors of dissatisfaction and commitments to improvement, there is reason for hope. It is unreasonable to believe that dissatisfaction is intrinsic to any medical profession. It is reasonable to believe that physician satisfaction, with all of its desirable implications, can be attained through continual research and prioritization.
The burden of dissatisfaction among medical professionals concerns both physicians and policy makers, especially given the potential ramifications on the work force.1, 2 Abundant research documents a strong relationship between low levels of physician satisfaction and burnout,37 intention to leave,6, 815 and job turnover.13, 1618 Moreover, low physician satisfaction is associated with self‐reported psychiatric symptoms1921 and poorer perceived mental health.22 Not surprisingly, dissatisfied physicians are less likely to recommend to medical students that they pursue their specialty.23
Importantly, physician satisfaction appears to benefit patients. Several studies show a positive relationship between higher physician satisfaction and patient satisfaction and outcomes.2426 Patients cared for by satisfied physicians declare more trust and confidence in their physicians, have better continuity, higher ratings of their care,26, 27 lower no‐show rates,25 and enhanced adherence to their medical care.28 There is also some evidence that higher job satisfaction is associated with lower likelihood of patient errors and suboptimal patient care.29
Physician satisfaction can be influenced by factors intrinsic to the individual physician (age, gender, race, and specialty) and extrinsic to the physician (work environment, practice setting, patient characteristics, and income).22, 30 In this way, satisfaction is not a static property in any physician or physician group, but reflects a dynamic interplay among the expectations and environments within which they work. Although each physician, physician group, and specialty has distinct factors that affect satisfaction, none are immune to potential dissatisfaction.
Given the documented impact of physician satisfaction on multiple aspects of healthcare delivery, we undertook a systematic review of the existing literature to achieve a greater understanding of the current state of U.S. physician satisfaction. In addition, we sought to identify the major survey tools used to measure satisfaction and the characteristics intrinsic and extrinsic to the physician that are associated with satisfaction. We conclude by suggesting needed additional research.
Materials and Methods
We performed a literature search of MEDLINE (
Results
Of the 97 studies, 69 were cross‐sectional (distributed to purposive and often convenience samples of physicians) with sampling sizes ranging from 39 to 6441 and response rates ranging from 31% to 97% (Appendix 1). The other 28 were from larger nationally representative studies (Table 1), including the CTS (n = 92, 45, 71, 74, 91, 102, 104106), RWJS (n = 81, 18, 3334, 39, 40, 60, 61), PWS (n = 711, 22, 23, 55, 83, 92, 99), and WPHS (n = 444, 4951). Fourteen articles reported information from longitudinal (n = 2)18, 86 or repeated cross‐sectional studies (n = 12)1, 2, 39, 73, 76, 79, 85, 91, 96, 97, 102, 110 to help determine satisfaction trends. The survey instruments from the 4 national physician surveys are outlined in Table 1. The types of satisfaction reported are outlined in Figure 2.
| Survey | Satisfaction Measured | MD Type Sampled | Sampled/Responded/Adjusted Response [n/n/% (year of survey)] |
|---|---|---|---|
| |||
| PWS | 150‐item survey; 3 satisfaction domains (job, career, and specialty; all 5‐point Likert scales); 10 satisfaction facets | AMA Masterfile; random sample; FP, IM, IM specialists, pediatrics, and pediatric specialists | 5704/2326/52% |
| CTS | Career satisfaction (5 point Likert scale) | AMA Masterfile; random sample; all physicians in direct patient care 20+ hours a week | 19054/12385/65% (1996); 20131/12280/61% (1998); 20998/12389/59% (2000) |
| RWJ | Practice satisfaction (4‐point Likert scale); career satisfaction (3‐point Likert scale) | AMA Masterfile; random sample; 1987: physicians <40 years old in practice 1‐6 years; 1991: physicians <45 years old in practice 2‐9 years; 1997: physicians <52 years old in practice 8‐17 years | 8379/5865/70% (1987); 9745/4373/70% (1991); 2093/1549/74% (1997) |
| WPHS | Career satisfaction (5‐point Likert scale) | AMA Masterfile; random sample; female medical school graduates from 1950 to 1989 | 4501/2656/59% |
Trends in U.S. Physician Satisfaction
The CTS physician survey used sophisticated large‐scale random sampling methods and consistent questionnaires, thus allowing assessment of trends. From these repeated cross‐sectional surveys, career satisfaction from 1996 to 2001 was stable (81% to 80% among primary care physicians [PCPs], and 81% to 81% among specialists), although the portion of PCPs who report being very satisfied declined from 42% to 38% (P < 0.001) with no significant change for specialists (43% to 42%; P = 0.20).2
The RWJ surveys found small overall declines. From 1991 to 1997, practice satisfaction declined from 86% to 79%, and career satisfaction declined 96% to 88% (P = not available [NA]).1 A comparison of the 1991 RWJ survey to a 1996 age‐matched California physician survey and also found practice satisfaction declined slightly (86% to 82%, P = NA; very satisfied declined 48% to 37%, P = 0.05).39
Two studies of PCPs in Massachusetts found similar modest declines. The first found practice satisfaction declined from 80% to 66% (1996 to 1999; P < 0.001),73 and the second found a nonsignificant decline in professional satisfaction from 81% to 73% (1986 to 1997; P = not significant [NS]).85 Other studies of specific physician populations found insignificant changes in satisfaction levels during the study periods.76, 79, 86, 91, 96, 97, 110 In summary, recent overall physician satisfaction is relatively unchanged, although there may be modest declines in PCPs and young physicians who report high satisfaction, as evidenced from the CTS, RWJ studies, and other small physician cohorts.
Major Characteristics Associated with Physician Satisfaction
Both factors intrinsic to the physician and characteristics of the job influence physician satisfaction (Figure 3). Intrinsic physician factors are typically not changeable when developing strategies to improve satisfaction. However, they do significantly affect what physicians consider important when choosing a job, and influence how physicians respond to changes in the job. Job characteristics, or extrinsic factors, are generally considered more modifiable when developing institutional strategies to improve satisfaction. Although the intrinsic factors are seemingly unmodifiable, one must take them into account when assessing satisfaction in order to determine the independent effects that the more modifiable extrinsic factors have on satisfaction. The next section describes the variables associated with satisfaction, from the 37 studies that utilized multivariate analyses (Appendix 2) to control for other factors (Appendix 3).
Physician Factors
Physician Age
Age is likely weakly but independently associated with satisfaction, although interpretation is limited by the heterogeneity of the physician samples and the manner in which age is reported. Of the 18 studies that evaluated age, 3 (from the PWS, WPHS, and 1 other) found a weak but positive association.9, 23, 50 Five (from the CTS and others) found a U‐shaped relationship (those at the extremes of age were the most satisfied),59, 68, 70, 71, 74 and 3 found an inverse association (2 CTS PCP subsets, and 1 small single‐county study.35, 45, 106 Six found no association, of which only 1 was from a nationally representative sample (PWS PCPs).5, 96, 97, 109, 110, 112
As a surrogate for age, 6 studies evaluated years in practice or years since medical school graduation. Of these, 2 found a weak but positive association (although only seen in specialists, not PCPs in the CTS),89, 104 and 1 found a negative association (when dichotomized),73 with no association in 3 smaller studies.5, 56, 88
These studies support that age is weakly but independently associated with physician satisfaction when studied as a continuous variable. When studied within various age brackets, studies support a U‐shaped association, with the highest satisfaction in those at the extremes of ages, although this may not be true for PCPs. In addition, the association with older age may be the result of less satisfied physicians leaving the profession.
Physician Gender
The association between gender and overall satisfaction is difficult to interpret due to the heterogeneity of the satisfaction assessments and included confounders, although there may be gender differences in facets of satisfaction. Of the 22 studies that evaluated gender, 3 found an independent effect for women (PWS general internal medicine [GIM] sample, CTS, and 1 other),23, 104, 110 3 for men,41, 81, 98 and no gender effect in the others. Those that found men with higher satisfaction included 1 national study of family practitioners (FPs)98 and 2 academic studies, the latter of which found men with or without children with higher satisfaction compared to women with children, indicating children (or work life balance) may confound gender satisfaction.41, 81
Other national studies, including the CTS and PWS, did not find a gender difference in overall satisfaction,9, 35, 45, 56, 59, 68, 71, 73, 74, 88, 89, 96, 97, 106, 109 although the PWS did find differences in facets of satisfaction (women were more satisfied with relationships with colleagues and patients, but less satisfied with autonomy, pay, resources, and community relationships).83
In summary, the relationship between gender and overall satisfaction is likely confounded by many factors, and its independent effect is difficult to quantify given the heterogeneity of the studies reviewed. There may be gender differences in facets of satisfaction, evaluated only in the PWS.
Physician Race/Ethnicity
There were only 5 multivariate studies delineating the association of race/ethnicity with satisfaction, of which 4 found no difference.35, 50, 56, 88 One study found lower satisfaction in minorities compared to whites, but was only a small sample of preventive medicine physicians.93 Given the growing racial and ethnic diversity of physicians, future research should further explore this association.
Physician Specialty
Overall, pediatricians appear to have higher, and GIM to have lower, satisfaction when compared among the PCPs or specialists, although the interpretation is limited by the heterogeneity of the specialties included, how the specialties are demarcated, and the composition of the reference group.
Of the 17 studies that evaluated specialty, 6 found pediatricians had higher satisfaction (including the CTS),5, 70, 73, 74, 104, 106 and 5 found GIM to have lower satisfaction (including the CTS and PWS)5, 11, 74, 104, 106 than various other comparison groups. Generalized interpretation of the other studies is difficult, as 8 of the 11 arise from very specific convenience samples of physicians (within a state or county).35, 56, 68, 73, 89, 96, 97, 109
Job Factors
Job Demand
There is evidence of a relationship between subjective, but not objective, job demands and satisfaction (categorized in the literature as work stress/pressure, workload, and work hours). Of the 10 studies that evaluated various types of perceived work stress/pressure, 9 found a significant association with dissatisfaction.5, 11, 22, 23, 45, 50, 68, 98, 104
Of the 8 studies that evaluated workload, 4 of them evaluated subjective workload and found too much or too little was associated with dissatisfaction.50, 86, 107, 110 The other 4 evaluated actual number of visits (per week or per hour); 3 did not find an association5, 56, 68 and 1 found a weak but negative association with satisfaction.70
Of the 13 studies that evaluated work hours, 8 found no association (including the PWS, CTS, and WPHS).23, 50, 73, 88, 89, 104, 107, 112 Only 1 found a positive association; however, these results were from a stepwise regression analysis in which work stress had already been controlled for in the model, and a separate stepwise regression showed more work hours to be associated with higher stress levels.98 One found satisfaction with work hours had a strong association with overall satisfaction (but not actual work hours).86 Three found a weak negative association, the last of which found that a recent increase in work hours was significantly associated with dissatisfaction, but not actual work hours.2, 70, 84
Of the 3 studies that evaluated on‐call frequency, 2 found higher call frequency to be moderately negatively associated70, 88 and 1 found no association.50
In summary, there is unequivocal evidence that an imbalance between expected and experienced stress, pressure, or workload is moderately associated with dissatisfaction, but there is less evidence of a significant association with objective workload or work hours. On‐call duty may moderately negatively influence satisfaction, although based only on 2 small studies.
Job Control/Autonomy
There is also a strong association with satisfaction and physician control over elements in their work place. Although the studies are heterogeneous in their assessment of work control and autonomy, 15 of the 16 studies found these dimensions to be strongly and significantly associated with satisfaction.1, 2, 5, 20, 45, 50, 56, 68, 71, 86, 96, 97, 104, 107, 109, 112
Relationship with Colleagues
All 5 studies associating relationship with colleagues with satisfaction found the perception of collegial support/emnteraction to exert a moderate independent effect on satisfaction.5, 20, 89, 104, 112
Part‐time Work Status
Of the 3 studies that evaluated this factor in multivariate analysis, 2 did not find a significant association,71, 110 and 1 reported higher satisfaction with full time work (but did not report statistical values).9 Given the number of U.S. physicians working part time, this warrants further research.
Practice Characteristics (Size/Setting/Site/Ownership)
The interpretation of practice characteristics and satisfaction is limited by the heterogeneity in the way the studies partitioned the practice characteristics, and the reference group composition. Of the 10 studies that evaluated several types of practice settings, 5 found solo or small (1‐2 person) practice sizes more likely associated with dissatisfaction than larger practice sizes.88, 97, 104106 The PWS and CTS obstetrician‐gynecologist (ob‐gyn) subset also found health maintenance organization (HMO) satisfaction to be lower compared to various comparisons11, 71 (although the PWS GIM subset did not find a difference).23 Of the 6 surveys evaluating academic/medical school as the reference group, 4 found higher satisfaction with academics (including 2 from the CTS),9, 71, 104, 110 but 2 smaller studies did not find a difference with university affiliation or teaching.88, 96 Of those studies evaluating single vs. multispecialty groups, only 1 found single‐specialty with higher satisfaction than multispecialty89 and 3 others did not find a difference.56, 68, 73
Regarding practice size, 3 of the 4 found no association with satisfaction.56, 109, 110, 112 Only the CTS evaluated practice region and community size and found rural physicians, those in small metropolitan areas, and those in New England and West North central regions had higher satisfaction.45, 71, 74 The CTS also supports that physicians that are part‐owners or nonowners of their practice have higher satisfaction than full owners.45, 74
In summary, practice characteristics may influence physician satisfaction. Physicians in solo and HMO practices may be less satisfied than physicians in other practice settings and sizes, and academic affiliation may have a small but significant association with satisfaction. Practice size and single vs. multispecialty does not appear to significantly affect satisfaction, and satisfaction association with practice region, community size, and ownership is drawn primarily from the CTS and requires further study.
Patient‐payer Mix and Insurance Status
Capitation and provider‐managed care training does appear to affect satisfaction, but managed care or patient insurance status does not. Of the 9 studies that addressed the influence of managed care or capitation on satisfaction, the percentage of managed care practice revenue, number of managed care contracts, or percentage of managed care patients in a practice had no association with satisfaction.2, 71, 73, 74, 104, 105, 109, 112 Two studies did find that capitation was associated with provider dissatisfaction.2, 68 One CTS study found career satisfaction increased in states after the implementation of patient protection acts (implying physician satisfaction increased with less managed care control and more patient/provider empowerment).102 Two other studies found that physicians with training in managed care and positive attitudes about managed care were more likely to be satisfied.98, 112
Regarding insurance status, 3 studies of PCPs in different states did not find an association between satisfaction and insurance (private, none, Medicare, or Medicaid),35, 68, 89 although a study of rural PCPs found more dissatisfaction in those who reported a recent decrease in the number of patients with adequate insurance.84
In summary, there is unlikely an independent effect of patient‐payer mix or managed care on satisfaction. However, capitation may exert a negative effect, and managed care training (and attitude) may exert a positive effect.
Patient Characteristics
Most patient factors were not found to be independently associated with physician satisfaction, including patient complexity,23, 112 patient demands,5, 20 or specific patient demographics.56 The PWS and CTS studies found physicians who value and are able to maintain long‐term patient relationships were more satisfied.45, 104, 112 One study found that those who perceive patients lack confidence in physicians were more likely to be dissatisfied.109 In summary, patient characteristics do not appear to influence provider satisfaction, but a provider's value of, and ability to maintain, long‐term relationships, as well as their perception of patient trust, may influence satisfaction.
Income
Of the 14 studies that evaluated income, 11 found a positive association (the CTS, RWJ, and others) with actual income1, 2, 45, 74, 84, 88, 93, 104 and income satisfaction.97, 98, 109 Of the 3 that did not find an association with actual income, 2 were from the PWS,23, 112 and 1 from the CTS ob‐gyn subset.71
In summary, the association between actual income and satisfaction may be confounded by other variables (such as work hours and part‐time status), but satisfaction with income does appear to correlate with overall satisfaction.
Incentives
There does appear to be a moderate satisfaction association with the types of income incentives. The CTS studies found more satisfied physicians were those with the ability to make clinical decisions without affecting one's income (although that was not found for the PCP subset).45, 104, 106 Other studies found more satisfaction in those reporting a practice with incentives/emphasis based on quality, and less satisfaction in those with incentives/emphasis based on productivity or service reduction.1, 57, 112 Therefore, the evidence favors higher satisfaction with incentives based on quality rather than productivity or utilization.
Other Physician Factors
Board certification may be modestly positively associated with satisfaction, and being a foreign medical graduate may be modestly negatively associated with satisfaction, although this is limited to few studies.9, 45, 74, 98, 104, 106 Other physician characteristics, such as personal matters (marital status, home stress, mental health, personal satisfaction), work matters (amount of charity care they provide and history of work harassment), and personality (reform mindedness and tolerance for uncertainty) require further research.50, 56, 88, 98, 104
Discussion
Our review of satisfaction trends for U.S. physicians revealed relative stability except for a slight decline among PCPs. We found factors significantly associated with satisfaction to include both physician (age and specialty) and job factors (work demand, work control, colleague support, ability to maintain patient relationships, practice setting, income satisfaction, and incentive types). Based on limited data, the association with race/ethnicity and part‐time work requires more research, and factors that do not appear to have an independent effect on satisfaction include physician gender, patient‐payer mix, and patient characteristics.
As the fastest growing specialty in the history of American medicine, hospital medicine should focus on career satisfaction as a top priority in shaping the future of the more than 20,000 hospitalists now practicing. Although the term hospitalist was coined less than 15 years ago114 the demand for hospitalists is expected to grow to as many as 50,000 by 2020.115 In this time of rapid growth, in order to mold a sustainable specialty, we must all recognize the factors that contribute to satisfaction and strive to maintain good job‐person fit. For individual hospitalists, all of these mediators of satisfaction should be considered when contemplating employment. To ensure a mutual fit, each physician must reflect on how their goals and values coincide with those of the program they are considering. For hospital medicine program leaders, areas of program‐specific dissatisfaction must be continually sought and addressed.
In this review, the variables with the strongest associations with satisfaction that are most pertinent to hospitalists are work demand, control, income/emncentives, and collegial relationships. These variables coincide with the 4 pillars of career satisfaction identified in the Society of Hospital Medicine Career Satisfaction Task Force.116 Perceived work stress/pressure and objective workload can easily (and serially) be measured, and the latter can be compared to national benchmarks to ensure appropriate workload expectations.116 Reducing work pressure/stress may involve assessing and matching variations in workload with manpower, reducing nonclinical tasks by utilizing administrative assistants or physician extenders, or having an emergency plan for unexpected absences. Autonomy and control can be assessed by the job‐fit questionnaire to identify programwide and physician‐specific areas of potential discontent.116 Increasing autonomy/control may involve pursuing leadership within hospital projects or committees, creatively scheduling flexibility, and seeking support from hospital administration. Income expectations should also be couched within national benchmarks, and incentive programs should reflect work quality rather than quantity. Collegial support can be enhanced by instituting a mentoring program, journal club, regular social function, or configuration of offices spaces to allow proximity. Although the conclusions of this review are limited by the lack of hospitalists included in the studies and our inability to perform a meta‐analysis, we believe extrapolation of this information to hospitalist physicians is valid and appropriate. That said, future studies specifically addressing hospitalist satisfaction are needed to ensure this.
Conclusions
In summary, physician satisfaction is not a static parameter, but a dynamic entity mediated by both physician‐related and job‐related factors, the majority of which are modifiable. Thus hospitalists and hospital medicine program leaders can be optimistic that uncovering the presence of dissatisfaction through surveys, and addressing the issues triggering it, should enhance physician satisfaction. With improved awareness of mitigating factors of dissatisfaction and commitments to improvement, there is reason for hope. It is unreasonable to believe that dissatisfaction is intrinsic to any medical profession. It is reasonable to believe that physician satisfaction, with all of its desirable implications, can be attained through continual research and prioritization.

Physician Assistant/Hospitalist Service
Midlevel providers (physician assistants and nurse practitioners) have long been employed by academic medical centers, predominantly on surgical services, or on medical subspecialty services, where they have typically had a limited scope of practice, focused in a narrowly defined area or set of procedures.17 In contrast, there are relatively few reports of experiences deploying midlevel providers to replace house staff on inpatient general medicine services in academic centers,810 and few studies of the effect of midlevel providers on quality and efficiency of care in the academic setting. Despite this, reductions in house officer duty hours as mandated by the Accreditation Council on Graduate Medical Education (ACGME)11 have resulted in academic centers increasingly using midlevel providers to decrease house staff workload on inpatient services.12, 13 In general, midlevel practitioners on general medicine services have been deployed to: (1) care for a population of patients separate from and in parallel with house staff; this population may be narrowly defined (eg, patients with chest pain) or not; (2) assist with the management of patients cared for by house staff by performing certain tasks (eg, scheduling appointments, discharging patients). Even as midlevel providers become more prevalent on academic general medicine services, the best model of care incorporating them into clinical care remains unclear, and few studies have rigorously examined the care provided on services that use them.
We developed an inpatient general medicine service within a large academic medical center staffed by physician assistants and hospitalists to help our residency program meet ACGME duty hour requirements. We hypothesized that by creating a service that is geographically localized and supervised by full‐time hospitalists, by instituting multidisciplinary rounds, and by investing in the professional development of highly‐skilled physician assistants, we could provide care for medically complex, acutely ill general medicine inpatients with similar quality and efficiency as compared to house staff teams. We report our experience during the first year of implementing the service, and compare quality and efficiency of care on this service with that of our traditional house staff services. We also evaluate the effects of this service on patient satisfaction and self‐reported house staff workload.
PATIENTS AND METHODS
Study Setting
The study was conducted in a 747‐bed urban, academic medical center in the northeastern United States. The hospital's human research committee reviewed and approved the study design. The hospital has accredited residency and fellowship programs in all major specialties. Prior to July 2005, physician assistants were employed only on surgical and medical subspecialty services (ie, bone marrow transplant, interventional cardiology); none were employed on the inpatient general medicine service. There were approximately 44,000 inpatient admissions during the year of the study, with approximately 6500 of these to the general medicine service.
Description of the General Medicine Service
The General Medicine Service consisted of 8 traditional house staff teams, with 1 attending, 1 junior or senior resident, 2 interns, and 1 or 2 medical students. These teams admitted patients on a rotating basis every fourth day. On 4 of these teams, the attending was a hospitalist, with clinical responsibility for the majority of the patients admitted to the team. On the remaining 4 teams, the teaching attending was a primary care physician or medical subspecialist, responsible for the direct care of a small number of the team's patients, with the remainder cared for by private primary care physicians or subspecialists.
Description of the Physician Assistant/Hospitalist Service
The Physician Assistant/Clinician Educator (PACE) service opened in July 2005, and consisted of 15 beds localized to 2 adjacent inpatient pods, staffed by a single cadre of nurses and medically staffed by 1 hospitalist and 2 physician assistants from 7:00 AM to 7:00 PM on weekdays and by 1 hospitalist, 1 physician assistant, and 1 moonlighter (usually a senior medical resident or fellow) from 7:00 AM to 7:00 PM on weekends. A moonlighter, typically a senior resident or medical subspecialty fellow, admitted patients and covered nights on the service from 7:00 PM to 7:00 AM 7 days a week. The daily census goal for the service was 15 patients, limited by the number of available beds on the 2 pods, and the service accepted admissions 24 hours per day, 7 days per week, whenever beds were available. Daily morning rounds occurred at 8:00 AM and included the hospitalist, physician assistants, nurses, a care coordinator, and a pharmacist. The PACE service did not have triage guidelines related to diagnosis, complexity, or acuity, but only accepted patients via the emergency department or via a primary care physician's office, and did not accept patients transferred from outside hospitals or from the intensive care units.
Physician Assistants
All of the physician assistants on the PACE service had prior inpatient medicine experience, ranging from 6 months to 5 years. The physician assistants worked in 3‐day to 6‐day blocks of 12‐hour shifts. Their clinical responsibilities were similar to those of interns at the study hospital, and included taking histories and performing physical examinations, writing notes and orders, reviewing and assimilating data, creating and updating patient signouts, completing discharge summaries, consulting other services as needed, and communicating with nurses and family members.
Many physician assistants also had nonclinical responsibilities, taking on physician‐mentored roles in education, quality improvement, and administration. They were involved in several initiatives: (1) developing a physician assistant curriculum in hospital medicine, (2) presenting at hospital‐wide physician assistant grand rounds, (3) surveying and tracking patient and family satisfaction on the service, (4) reviewing all 72‐hour hospital readmissions, intensive care unit transfers, and deaths on the service, and (5) maintaining the service's compliance with state regulations regarding physician assistant scope of practice and prescribing.
Hospitalists
The 3 hospitalists on the PACE service worked in 7‐day blocks of 12‐hour shifts (7:00 AM to 7:00 PM). They directly supervised the physician assistants and had no competing responsibilities. The hospitalists were all recent graduates of the study hospital's internal medicine residency, with no prior clinical experience beyond residency. All were planning to work on the service for 1 to 2 years before beginning a subspecialty fellowship. In addition to supervising the clinical work of the physician assistants, the hospitalists were responsible for teaching the physician assistants on rounds and in weekly didactic sessions, guided by a curriculum in hospital medicine that focused on the most common general medicine diagnoses seen on the PACE service. The medical director of the PACE service periodically reviewed each physician assistant's clinical experience, skills and knowledge base, and held semiannual feedback sessions.
Study Patients
All general medicine patients admitted to the PACE service from July 1, 2005 to June 30, 2006 comprised the study population. The comparison group consisted of general medicine patients admitted to the 8 house staff general medicine teams; patients transferred from an intensive care unit (ICU) or another facility were excluded in order to match the admission criteria for the PACE service and improve comparability between the 2 study arms.
Data Collection and Study Outcomes
We obtained all patient data from the hospital's administrative databases. We identified patients assigned to the PACE service or to the comparison group based on the admitting service, team, and attending. We obtained patient demographics, insurance, admission source and discharge destination, admission and discharge times, dates, diagnoses, and diagnosis‐related groups (DRGs), as well as dates and times of transfers to other services, including to the intensive care unit. We also obtained the Medicare case‐mix index (CMI, based on DRG weight), and calculated a Charlson score based on billing diagnoses coded in the year prior to the index admission.14 Outcomes included length of stay (LOS) to the nearest hour, in‐hospital mortality, transfers to the intensive care unit, readmissions to the study hospital within 72 hours, 14 days, and 30 days, and total costs as derived from the hospital's cost accounting system (Transition Systems Inc., Boston, MA). Other outcomes included patient satisfaction as measured by responses to the Press‐Ganey survey routinely administered to a randomly selected 70% of recently discharged patients and effect on self‐reported resident work hours.
Statistical Analysis
Patient demographics, clinical characteristics, and study outcomes are presented using proportions, means with standard deviations, and medians with inter‐quartile ranges as appropriate. Unadjusted differences in outcomes between the two services were calculated using univariable regression techniques with service as the independent variable and each outcome as the dependent variable. We used logistic regression for dichotomous outcomes (readmissions, ICU transfers, and inpatient mortality), and linear regression for log‐transformed LOS and log‐transformed total costs of care. To adjust each outcome for potential confounders, we then built multivariable regression models. Each potential confounder was entered into the model one at a time as the independent variable. All variables found to be significant predictors of the outcome at the P < 0.10 level were then retained in the final model along with service as the predictor of interest. We used general estimating equations in all multivariable models to adjust for clustering of patients by attending physician. For logistic regression models, the effect size is presented as an odds ratio (OR); for log‐transformed linear regression models, the effect size is presented as the percent difference between groups. We also performed 2 subgroup analyses, limited to (1) the patients with the 10 most common discharge DRGs, and (2) patients admitted between the hours of 7:00 AM and 7:00 PM to remove the effects of moonlighters performing the initial admission. Except as noted above, 2‐sided P values < 0.05 were considered significant. SAS 9.1 (SAS Institute, Cary, NC) was used for all analyses.
RESULTS
Patient Demographics
Table 1 shows patient demographics and clinical characteristics of the PACE service and the comparison group. Patients in the comparison group were slightly older and tended to have slightly higher CMI and Charlson scores. Patients on the PACE service were more likely to be admitted at night (10:00 PM to 7:00 AM; 43.8% versus 30.3%; P < 0.0001). There were no significant differences in sex, race, insurance, or percentage of patients discharged to home. The 10 most common DRGs in the comparison group accounted for 37.0% of discharges, and these same DRGs accounted for 37.5% of discharges on the PACE service (Table 2).
| Characteristic | PACE Service (n = 992) | House Staff Services (n = 4,202) | P value |
|---|---|---|---|
| |||
| Age (years) | |||
| 1844 | 19.1 | 18.2 | |
| 4564 | 35.5 | 31.9 | 0.04 |
| 65+ | 45.5 | 49.9 | |
| Sex (% female) | 57.7 | 60.0 | NS |
| Race/ethnicity | |||
| White | 57.3 | 59.3 | |
| Black | 24.0 | 23.5 | NS |
| Hispanic | 14.1 | 13.3 | |
| Other | 4.6 | 3.9 | |
| Insurance | |||
| Medicare | 41.9 | 43.8 | |
| Commercial | 34.9 | 35.9 | |
| Medicaid | 14.4 | 11.7 | NS |
| Free care | 4.5 | 3.9 | |
| Self pay | 1.1 | 0.8 | |
| Median income by zip code of residence, USD (IQR) | 45,517 (32,49362,932) | 45,517 (35,88963,275) | NS |
| Case‐mix index, median (IQR) | 1.1 (0.81.5) | 1.2 (0.91.8) | 0.001 |
| Charlson score | |||
| 0 | 27.2 | 24.9 | |
| 1 | 22.6 | 21.1 | 0.02 |
| 2 | 16.2 | 16.5 | |
| 3+ | 34.0 | 37.6 | |
| Admissions between 10:00 PM and 7:00 AM | 43.8 | 30.3 | <0.0001 |
| Discharged to home | 81.1 | 80.5 | NS |
| Diagnosis‐Related Group at Discharge | PACE Service (n = 992)* | House Staff Services (n = 4,202)* |
|---|---|---|
| ||
| Chest pain | 5.4 | 6.4 |
| Esophagitis, gastroenteritis, and miscellaneous digestive disorders | 4.5 | 4.4 |
| Heart failure and shock | 3.4 | 4.6 |
| Simple pneumonia and pleurisy | 2.7 | 4.4 |
| Kidney and urinary tract infections | 4.7 | 3.2 |
| Chronic obstructive pulmonary disease | 4.0 | 3.3 |
| Renal failure | 2.7 | 3.5 |
| Gastrointestinal hemorrhage | 3.7 | 2.7 |
| Nutritional and miscellaneous metabolic disorders | 3.3 | 2.4 |
| Disorders of the pancreas except malignancy | 3.1 | 2.1 |
| Cumulative percent | 37.5 | 37.0 |
Efficiency and Quality of Care
Table 3 compares the performance of the PACE service and the comparison group on several efficiency and quality measures. Unadjusted LOS was not significantly different, and adjusted LOS was slightly but not statistically significantly higher on the study service (adjusted LOS 5.0% higher; 95% confidence interval [CI], 0.4% to +10%). Unadjusted and adjusted total costs of care were marginally lower on the study service (adjusted total cost of care 3.9% lower; 95% CI, 7.5% to 0.3%).
| PACE Service | House Staff Services | Unadjusted % Difference (95%CI) | Adjusted % Difference (95%CI)* | |
|---|---|---|---|---|
| PACE Service | House Staff Services | Unadjusted OR (95% CI) | Adjusted OR (95% CI) | |
| ||||
| Efficiency measure | ||||
| Length of stay, days, median (IQR) | 2.6 (1.6, 4.4) | 2.6 (1.4, 4.6) | +0.1% (5.6% to +6.1%) | +5.0% (0.4% to +10.0%) |
| Total costs, USD, median (IQR) | 4,536 (2,848, 7,201) | 4,749 (3,046, 8,161) | 9.1% (14.0% to 3.8%) | 3.9% (7.5% to 0.3%)‖ |
| Quality measure | ||||
| 72‐hour readmissions/100 discharges | 0.8 | 1.3 | 0.6 (0.31.3) | 0.7 (0.21.8) |
| 14‐day readmissions/100 discharges | 5.4 | 5.4 | 1.0 (0.71.4) | 1.1 (0.81.4) |
| 30‐day readmissions/100 discharges | 8.0 | 8.1 | 1.0 (0.81.3) | 1.1 (0.91.3) |
| ICU transfers/100 discharges | 2.0 | 2.3 | 0.9 (0.51.4) | 1.4 (0.82.4)# |
| Inpatient mortality/100 discharges | 0.7 | 1.2 | 0.6 (0.31.3) | 0.8 (0.31.8)** |
We found no differences between the PACE service and comparison group in unadjusted rates of hospital readmissions within 72 hours, 14 days, and 30 days, transfer to the intensive care units, or inpatient mortality (Table 3). The associated ORs for each outcome were similar after adjusting for patient demographics and clinical characteristics including severity of illness, as well as for clustering by attending physician.
Subgroup Analyses
When the analysis was limited to the subset of patients with the 10 most common discharge DRGs, the difference in adjusted total cost of care was similar but lost statistical significance (4.0% lower on PACE service; 95% CI, 11.0% to +3.3%). In this subgroup, LOS, readmission rates, and ICU transfer rates were not different. ORs for mortality could not be calculated because there were no deaths in this subgroup on the PACE service (data not shown). When analysis was limited to daytime admissions (to remove any potential effect of admitting by a moonlighter), the difference in total cost of care was attenuated and lost statistical significance (0.2% lower on PACE service; 95%CI, 5.9% to +5.5%). No differences were seen in LOS, mortality, and ICU transfers (data not shown). However, 14‐day readmissions (but not 72‐hour or 30‐day readmissions) were lower on the PACE service (OR, 0.49; 95% CI, 0.25‐0.93).
Patient Satisfaction
Patients were similarly satisfied with their care on the PACE service and on the house staff services. In specific areas and globally, percentages of patients satisfied with their physicians and with the discharge process were not different, as measured by the Press‐Ganey survey (Press‐Ganey Associates, South Bend, IN; Figures 1 and 2). The survey distinguishes between attendings and residents, but not physician assistants; therefore, Figure 1 only includes responses to the attending questions. Given the sampling procedure of the Press‐Ganey survey, exact response rates cannot be calculated, but Press‐Ganey reports a response rate of about 40% for the English survey and about 20% for the Spanish survey.
Resident Duty Hours
Comparing the same month 1 year prior to implementation of the PACE service, mean self‐reported resident duty hours on the general medicine service were unchanged; however, self‐reported data were incomplete, and multiple changes took place in the residency program during the study period. For example, implementation of the PACE service allowed for the dissolution of one full house staff general medicine team and redistribution of these house staff to night float positions and an expanded medical intensive care unit.
Costs of Implementation
The costs associated with implementing the PACE service included physician and physician assistant salaries (2.5 full‐time physicians, 5 full‐time physician assistants, plus fringe) and night coverage by resident and fellow moonlighters (without fringe, and estimated at 50% effort given other moonlighter coverage responsibilities on subspecialty services). We estimated these costs at $257.50/patient‐day ($115/patient‐day for attending physician compensation, $110/patient‐day for physician assistant compensation, and $32.50/patient‐day for moonlighting coverage).
DISCUSSION
As academic centers struggle with developing a workforce to provide patient care no longer provided by residents, questions about the ideal structure of nonhouse staff inpatient services abound. Although solutions to this problem will be determined to some extent by local factors such as institutional culture and resources, some lessons learned in developing such services will be more widely applicable. We found that by implementing a geographically localized, physician assistant‐staffed hospitalist service, we were able to provide care of similar quality and efficiency to that of traditional house staff services, despite inexperienced hospitalists staffing the service and a medical residency program commonly recognized as one of the best in the country. Adjusted total costs were slightly lower on the PACE service, but this difference was small and of borderline statistical significance. Likewise, no significant differences were seen in any of several quality measures or in patient satisfaction.
Our findings add to the available evidence supporting the use of physician assistants on academic general medicine services, and are germane to academic centers facing reductions in house staff availability and seeking alternative models of care for inpatients. Several specific characteristics of the PACE service and the implications of these should be considered:
The service accepted all patients, regardless of diagnosis, acuity, or complexity of illness. This was unlike many previously described nonhouse staff services which were more limited in scope, and allowed more flexibility with patient flow. However, in the end, patients on the PACE service did have a modestly lower case mix index and Charlson score, suggesting that, despite a lack of triage guidelines, there was some bias in the triage of admissions, possibly due to a perception that physician assistants should take care of lower complexity patients. If it is desirable to have a similar distribution of higher complexity patients across house staff and nonhouse staff services, extra efforts may be necessary to overcome this perception.
The service was geographically regionalized. Geographic regionalization offered many important advantages, especially with regards to communication among staff, nursing, and consultants, and allowed for multidisciplinary rounds. However, it is possible that the modest, but not statistically significant, trend toward an increased LOS seen on the PACE service might be a reflection of geographic admitting (less incentive to discharge since discharging a patient means taking a new admission).
The education and professional development of the physician assistants was a priority. Physician assistants had considerable autonomy and responsibility, and rather than being assigned only lower level administrative tasks, performed all aspects of patient care. They also received regular teaching from the hospitalists, attended house staff teaching conferences, and developed nonclinical roles in education and quality improvement. The higher standards expected of the physician assistants were quite possibly a factor in the quality of care delivered, and almost certainly contributed to physician assistant satisfaction and retention.
Our findings contrast with those of Myers et al.,9 who found that a nonteaching service staffed by hospitalists and nurse practitioners had a significantly lower median LOS and hospital charges compared to similar patients on resident‐based services. However, unlike ours, their service cared for a select patient population, and only accepted patients with chest pain at low risk for acute coronary syndrome. Van Rhee et al.10 found that physician assistants on a general medicine service used fewer resources for patients with pneumonia, stroke, and congestive heart failure than resident physicians, and did not exceed the resources used by residents in other diagnoses. The authors did not find a difference in LOS, but did find a significantly higher mortality among patients with pneumonia cared for by physician assistants.
Several limitations should be noted. First, the study was a retrospective analysis of administrative data rather than a randomized trial, and although we employed a standard approach to adjust for a wide range of patient characteristics including severity of illness, there may have been undetected differences in the patient populations studied that may have confounded our results. Second, resident moonlighters admitted patients to the PACE service and, at other times, to the house staff services, and this may have diluted any differences between the groups. However, when we limited our analysis to the subgroup of patients admitted during the day, similar results were obtained, with the exception that the PACE service had a lower rate of 14‐day readmissions, an unexpected finding deserving of further study. Third, the study was conducted in a single academic institution and our findings may not be generalizable to others with different needs and resources; indeed, the costs associated with implementing such a service may be prohibitive for some institutions. Fourth, because of simultaneous changes that were taking place in our residency program, we are unable to accurately assess the impact of the PACE service on resident duty hours. However, resident duty hours did not increase over this time period on the general medicine service, and implementation of the service allowed for redistribution of house staff to other services and positions. Fifth, patient satisfaction data were obtained from responses to the mailed Press‐Ganey survey, to which there is a relatively low response rate. Also, we did not survey providers regarding their satisfaction with the service during the study period. Sixth, the study had limited power to detect clinically important differences in mortality and ICU transfers. Finally, this study is unable to compare this particular model of incorporating midlevel providers into general medical services with other models, only with traditional house staff services.
Future research should focus on determining the most effective and efficient ways to incorporate midlevel providers on academic general medicine services. One important question from the standpoint of house staff training is whether such services should be separate but equal, or should house staff gain experience during residency working with midlevel providers, since they are likely to encounter them in the future whether they stay in academics or not. Different models of care will likely have large implications for the quality and efficiency of patient care, house staff education and satisfaction, and physician assistant job satisfaction and turnover.
In summary, our study demonstrates that a geographically regionalized, multidisciplinary service staffed by hospitalists and physician assistants can be a safe alternative to house staff‐based services for the care of general medicine inpatients in an academic medical center.
- ,,,,,.The physician's assistant as resident on surgical service. An example of creative problem solving in surgical manpower.Arch Surg.1980;115:310–314.
- ,,,.Coronary arteriography performed by a physician assistant.Am J Cardiol.1987;60:784–787.
- .The specialized physician assistant: an alternative to the clinical cardiology trainee.Am J Cardiol.1987;60:901–902.
- ,,.One hospital's successful 20‐year experience with physician assistants in graduate medical education.Acad Med.1999;74:641–645.
- ,.Physicians assistants in cardiothoracic surgery: a 30‐year experience in a university center.Ann Thorac Surg.2006;81:195–199; discussion 199–200.
- ,,.Comparative review of use of physician assistants in a level I trauma center.Am Surg.2004;70:272–279.
- ,,,,.Integrating midlevel practitioners into a teaching service.Am J Surg.2006;192:119–124.
- ,.Acute care nurse practitioners: creating and implementing a model of care for an inpatient general medical service.Am J Crit Care.2002;11:448–458.
- ,,,,.Improving resource utilization in a teaching hospital: development of a nonteaching service for chest pain admissions.Acad Med.2006;81:432–435.
- ,,.Resource use by physician assistant services versus teaching services.JAAPA.2002;15:33–38.
- ,,, for the ACGME Work Group on Resident Duty Hours, Accreditation Council for Graduate Medical Education.New requirements for resident duty hours.JAMA.2002;288:1112–1114.
- ,,.The substitution of physician assistants and nurse practitioners for physician residents in teaching hospitals.Health Aff.1995;14:181–191.
- ,,,,.Challenges of the 80‐hour resident work rules: collaboration between surgeons and nonphysician practitioners.Surg Clin North Am.2004;84:1573–1586.
- ,,.Adapting a clinical comorbidity index for use with ICD‐9‐CM administrative databases.J Clin Epidemiol.1992;45:613–619.
Midlevel providers (physician assistants and nurse practitioners) have long been employed by academic medical centers, predominantly on surgical services, or on medical subspecialty services, where they have typically had a limited scope of practice, focused in a narrowly defined area or set of procedures.17 In contrast, there are relatively few reports of experiences deploying midlevel providers to replace house staff on inpatient general medicine services in academic centers,810 and few studies of the effect of midlevel providers on quality and efficiency of care in the academic setting. Despite this, reductions in house officer duty hours as mandated by the Accreditation Council on Graduate Medical Education (ACGME)11 have resulted in academic centers increasingly using midlevel providers to decrease house staff workload on inpatient services.12, 13 In general, midlevel practitioners on general medicine services have been deployed to: (1) care for a population of patients separate from and in parallel with house staff; this population may be narrowly defined (eg, patients with chest pain) or not; (2) assist with the management of patients cared for by house staff by performing certain tasks (eg, scheduling appointments, discharging patients). Even as midlevel providers become more prevalent on academic general medicine services, the best model of care incorporating them into clinical care remains unclear, and few studies have rigorously examined the care provided on services that use them.
We developed an inpatient general medicine service within a large academic medical center staffed by physician assistants and hospitalists to help our residency program meet ACGME duty hour requirements. We hypothesized that by creating a service that is geographically localized and supervised by full‐time hospitalists, by instituting multidisciplinary rounds, and by investing in the professional development of highly‐skilled physician assistants, we could provide care for medically complex, acutely ill general medicine inpatients with similar quality and efficiency as compared to house staff teams. We report our experience during the first year of implementing the service, and compare quality and efficiency of care on this service with that of our traditional house staff services. We also evaluate the effects of this service on patient satisfaction and self‐reported house staff workload.
PATIENTS AND METHODS
Study Setting
The study was conducted in a 747‐bed urban, academic medical center in the northeastern United States. The hospital's human research committee reviewed and approved the study design. The hospital has accredited residency and fellowship programs in all major specialties. Prior to July 2005, physician assistants were employed only on surgical and medical subspecialty services (ie, bone marrow transplant, interventional cardiology); none were employed on the inpatient general medicine service. There were approximately 44,000 inpatient admissions during the year of the study, with approximately 6500 of these to the general medicine service.
Description of the General Medicine Service
The General Medicine Service consisted of 8 traditional house staff teams, with 1 attending, 1 junior or senior resident, 2 interns, and 1 or 2 medical students. These teams admitted patients on a rotating basis every fourth day. On 4 of these teams, the attending was a hospitalist, with clinical responsibility for the majority of the patients admitted to the team. On the remaining 4 teams, the teaching attending was a primary care physician or medical subspecialist, responsible for the direct care of a small number of the team's patients, with the remainder cared for by private primary care physicians or subspecialists.
Description of the Physician Assistant/Hospitalist Service
The Physician Assistant/Clinician Educator (PACE) service opened in July 2005, and consisted of 15 beds localized to 2 adjacent inpatient pods, staffed by a single cadre of nurses and medically staffed by 1 hospitalist and 2 physician assistants from 7:00 AM to 7:00 PM on weekdays and by 1 hospitalist, 1 physician assistant, and 1 moonlighter (usually a senior medical resident or fellow) from 7:00 AM to 7:00 PM on weekends. A moonlighter, typically a senior resident or medical subspecialty fellow, admitted patients and covered nights on the service from 7:00 PM to 7:00 AM 7 days a week. The daily census goal for the service was 15 patients, limited by the number of available beds on the 2 pods, and the service accepted admissions 24 hours per day, 7 days per week, whenever beds were available. Daily morning rounds occurred at 8:00 AM and included the hospitalist, physician assistants, nurses, a care coordinator, and a pharmacist. The PACE service did not have triage guidelines related to diagnosis, complexity, or acuity, but only accepted patients via the emergency department or via a primary care physician's office, and did not accept patients transferred from outside hospitals or from the intensive care units.
Physician Assistants
All of the physician assistants on the PACE service had prior inpatient medicine experience, ranging from 6 months to 5 years. The physician assistants worked in 3‐day to 6‐day blocks of 12‐hour shifts. Their clinical responsibilities were similar to those of interns at the study hospital, and included taking histories and performing physical examinations, writing notes and orders, reviewing and assimilating data, creating and updating patient signouts, completing discharge summaries, consulting other services as needed, and communicating with nurses and family members.
Many physician assistants also had nonclinical responsibilities, taking on physician‐mentored roles in education, quality improvement, and administration. They were involved in several initiatives: (1) developing a physician assistant curriculum in hospital medicine, (2) presenting at hospital‐wide physician assistant grand rounds, (3) surveying and tracking patient and family satisfaction on the service, (4) reviewing all 72‐hour hospital readmissions, intensive care unit transfers, and deaths on the service, and (5) maintaining the service's compliance with state regulations regarding physician assistant scope of practice and prescribing.
Hospitalists
The 3 hospitalists on the PACE service worked in 7‐day blocks of 12‐hour shifts (7:00 AM to 7:00 PM). They directly supervised the physician assistants and had no competing responsibilities. The hospitalists were all recent graduates of the study hospital's internal medicine residency, with no prior clinical experience beyond residency. All were planning to work on the service for 1 to 2 years before beginning a subspecialty fellowship. In addition to supervising the clinical work of the physician assistants, the hospitalists were responsible for teaching the physician assistants on rounds and in weekly didactic sessions, guided by a curriculum in hospital medicine that focused on the most common general medicine diagnoses seen on the PACE service. The medical director of the PACE service periodically reviewed each physician assistant's clinical experience, skills and knowledge base, and held semiannual feedback sessions.
Study Patients
All general medicine patients admitted to the PACE service from July 1, 2005 to June 30, 2006 comprised the study population. The comparison group consisted of general medicine patients admitted to the 8 house staff general medicine teams; patients transferred from an intensive care unit (ICU) or another facility were excluded in order to match the admission criteria for the PACE service and improve comparability between the 2 study arms.
Data Collection and Study Outcomes
We obtained all patient data from the hospital's administrative databases. We identified patients assigned to the PACE service or to the comparison group based on the admitting service, team, and attending. We obtained patient demographics, insurance, admission source and discharge destination, admission and discharge times, dates, diagnoses, and diagnosis‐related groups (DRGs), as well as dates and times of transfers to other services, including to the intensive care unit. We also obtained the Medicare case‐mix index (CMI, based on DRG weight), and calculated a Charlson score based on billing diagnoses coded in the year prior to the index admission.14 Outcomes included length of stay (LOS) to the nearest hour, in‐hospital mortality, transfers to the intensive care unit, readmissions to the study hospital within 72 hours, 14 days, and 30 days, and total costs as derived from the hospital's cost accounting system (Transition Systems Inc., Boston, MA). Other outcomes included patient satisfaction as measured by responses to the Press‐Ganey survey routinely administered to a randomly selected 70% of recently discharged patients and effect on self‐reported resident work hours.
Statistical Analysis
Patient demographics, clinical characteristics, and study outcomes are presented using proportions, means with standard deviations, and medians with inter‐quartile ranges as appropriate. Unadjusted differences in outcomes between the two services were calculated using univariable regression techniques with service as the independent variable and each outcome as the dependent variable. We used logistic regression for dichotomous outcomes (readmissions, ICU transfers, and inpatient mortality), and linear regression for log‐transformed LOS and log‐transformed total costs of care. To adjust each outcome for potential confounders, we then built multivariable regression models. Each potential confounder was entered into the model one at a time as the independent variable. All variables found to be significant predictors of the outcome at the P < 0.10 level were then retained in the final model along with service as the predictor of interest. We used general estimating equations in all multivariable models to adjust for clustering of patients by attending physician. For logistic regression models, the effect size is presented as an odds ratio (OR); for log‐transformed linear regression models, the effect size is presented as the percent difference between groups. We also performed 2 subgroup analyses, limited to (1) the patients with the 10 most common discharge DRGs, and (2) patients admitted between the hours of 7:00 AM and 7:00 PM to remove the effects of moonlighters performing the initial admission. Except as noted above, 2‐sided P values < 0.05 were considered significant. SAS 9.1 (SAS Institute, Cary, NC) was used for all analyses.
RESULTS
Patient Demographics
Table 1 shows patient demographics and clinical characteristics of the PACE service and the comparison group. Patients in the comparison group were slightly older and tended to have slightly higher CMI and Charlson scores. Patients on the PACE service were more likely to be admitted at night (10:00 PM to 7:00 AM; 43.8% versus 30.3%; P < 0.0001). There were no significant differences in sex, race, insurance, or percentage of patients discharged to home. The 10 most common DRGs in the comparison group accounted for 37.0% of discharges, and these same DRGs accounted for 37.5% of discharges on the PACE service (Table 2).
| Characteristic | PACE Service (n = 992) | House Staff Services (n = 4,202) | P value |
|---|---|---|---|
| |||
| Age (years) | |||
| 1844 | 19.1 | 18.2 | |
| 4564 | 35.5 | 31.9 | 0.04 |
| 65+ | 45.5 | 49.9 | |
| Sex (% female) | 57.7 | 60.0 | NS |
| Race/ethnicity | |||
| White | 57.3 | 59.3 | |
| Black | 24.0 | 23.5 | NS |
| Hispanic | 14.1 | 13.3 | |
| Other | 4.6 | 3.9 | |
| Insurance | |||
| Medicare | 41.9 | 43.8 | |
| Commercial | 34.9 | 35.9 | |
| Medicaid | 14.4 | 11.7 | NS |
| Free care | 4.5 | 3.9 | |
| Self pay | 1.1 | 0.8 | |
| Median income by zip code of residence, USD (IQR) | 45,517 (32,49362,932) | 45,517 (35,88963,275) | NS |
| Case‐mix index, median (IQR) | 1.1 (0.81.5) | 1.2 (0.91.8) | 0.001 |
| Charlson score | |||
| 0 | 27.2 | 24.9 | |
| 1 | 22.6 | 21.1 | 0.02 |
| 2 | 16.2 | 16.5 | |
| 3+ | 34.0 | 37.6 | |
| Admissions between 10:00 PM and 7:00 AM | 43.8 | 30.3 | <0.0001 |
| Discharged to home | 81.1 | 80.5 | NS |
| Diagnosis‐Related Group at Discharge | PACE Service (n = 992)* | House Staff Services (n = 4,202)* |
|---|---|---|
| ||
| Chest pain | 5.4 | 6.4 |
| Esophagitis, gastroenteritis, and miscellaneous digestive disorders | 4.5 | 4.4 |
| Heart failure and shock | 3.4 | 4.6 |
| Simple pneumonia and pleurisy | 2.7 | 4.4 |
| Kidney and urinary tract infections | 4.7 | 3.2 |
| Chronic obstructive pulmonary disease | 4.0 | 3.3 |
| Renal failure | 2.7 | 3.5 |
| Gastrointestinal hemorrhage | 3.7 | 2.7 |
| Nutritional and miscellaneous metabolic disorders | 3.3 | 2.4 |
| Disorders of the pancreas except malignancy | 3.1 | 2.1 |
| Cumulative percent | 37.5 | 37.0 |
Efficiency and Quality of Care
Table 3 compares the performance of the PACE service and the comparison group on several efficiency and quality measures. Unadjusted LOS was not significantly different, and adjusted LOS was slightly but not statistically significantly higher on the study service (adjusted LOS 5.0% higher; 95% confidence interval [CI], 0.4% to +10%). Unadjusted and adjusted total costs of care were marginally lower on the study service (adjusted total cost of care 3.9% lower; 95% CI, 7.5% to 0.3%).
| PACE Service | House Staff Services | Unadjusted % Difference (95%CI) | Adjusted % Difference (95%CI)* | |
|---|---|---|---|---|
| PACE Service | House Staff Services | Unadjusted OR (95% CI) | Adjusted OR (95% CI) | |
| ||||
| Efficiency measure | ||||
| Length of stay, days, median (IQR) | 2.6 (1.6, 4.4) | 2.6 (1.4, 4.6) | +0.1% (5.6% to +6.1%) | +5.0% (0.4% to +10.0%) |
| Total costs, USD, median (IQR) | 4,536 (2,848, 7,201) | 4,749 (3,046, 8,161) | 9.1% (14.0% to 3.8%) | 3.9% (7.5% to 0.3%)‖ |
| Quality measure | ||||
| 72‐hour readmissions/100 discharges | 0.8 | 1.3 | 0.6 (0.31.3) | 0.7 (0.21.8) |
| 14‐day readmissions/100 discharges | 5.4 | 5.4 | 1.0 (0.71.4) | 1.1 (0.81.4) |
| 30‐day readmissions/100 discharges | 8.0 | 8.1 | 1.0 (0.81.3) | 1.1 (0.91.3) |
| ICU transfers/100 discharges | 2.0 | 2.3 | 0.9 (0.51.4) | 1.4 (0.82.4)# |
| Inpatient mortality/100 discharges | 0.7 | 1.2 | 0.6 (0.31.3) | 0.8 (0.31.8)** |
We found no differences between the PACE service and comparison group in unadjusted rates of hospital readmissions within 72 hours, 14 days, and 30 days, transfer to the intensive care units, or inpatient mortality (Table 3). The associated ORs for each outcome were similar after adjusting for patient demographics and clinical characteristics including severity of illness, as well as for clustering by attending physician.
Subgroup Analyses
When the analysis was limited to the subset of patients with the 10 most common discharge DRGs, the difference in adjusted total cost of care was similar but lost statistical significance (4.0% lower on PACE service; 95% CI, 11.0% to +3.3%). In this subgroup, LOS, readmission rates, and ICU transfer rates were not different. ORs for mortality could not be calculated because there were no deaths in this subgroup on the PACE service (data not shown). When analysis was limited to daytime admissions (to remove any potential effect of admitting by a moonlighter), the difference in total cost of care was attenuated and lost statistical significance (0.2% lower on PACE service; 95%CI, 5.9% to +5.5%). No differences were seen in LOS, mortality, and ICU transfers (data not shown). However, 14‐day readmissions (but not 72‐hour or 30‐day readmissions) were lower on the PACE service (OR, 0.49; 95% CI, 0.25‐0.93).
Patient Satisfaction
Patients were similarly satisfied with their care on the PACE service and on the house staff services. In specific areas and globally, percentages of patients satisfied with their physicians and with the discharge process were not different, as measured by the Press‐Ganey survey (Press‐Ganey Associates, South Bend, IN; Figures 1 and 2). The survey distinguishes between attendings and residents, but not physician assistants; therefore, Figure 1 only includes responses to the attending questions. Given the sampling procedure of the Press‐Ganey survey, exact response rates cannot be calculated, but Press‐Ganey reports a response rate of about 40% for the English survey and about 20% for the Spanish survey.
Resident Duty Hours
Comparing the same month 1 year prior to implementation of the PACE service, mean self‐reported resident duty hours on the general medicine service were unchanged; however, self‐reported data were incomplete, and multiple changes took place in the residency program during the study period. For example, implementation of the PACE service allowed for the dissolution of one full house staff general medicine team and redistribution of these house staff to night float positions and an expanded medical intensive care unit.
Costs of Implementation
The costs associated with implementing the PACE service included physician and physician assistant salaries (2.5 full‐time physicians, 5 full‐time physician assistants, plus fringe) and night coverage by resident and fellow moonlighters (without fringe, and estimated at 50% effort given other moonlighter coverage responsibilities on subspecialty services). We estimated these costs at $257.50/patient‐day ($115/patient‐day for attending physician compensation, $110/patient‐day for physician assistant compensation, and $32.50/patient‐day for moonlighting coverage).
DISCUSSION
As academic centers struggle with developing a workforce to provide patient care no longer provided by residents, questions about the ideal structure of nonhouse staff inpatient services abound. Although solutions to this problem will be determined to some extent by local factors such as institutional culture and resources, some lessons learned in developing such services will be more widely applicable. We found that by implementing a geographically localized, physician assistant‐staffed hospitalist service, we were able to provide care of similar quality and efficiency to that of traditional house staff services, despite inexperienced hospitalists staffing the service and a medical residency program commonly recognized as one of the best in the country. Adjusted total costs were slightly lower on the PACE service, but this difference was small and of borderline statistical significance. Likewise, no significant differences were seen in any of several quality measures or in patient satisfaction.
Our findings add to the available evidence supporting the use of physician assistants on academic general medicine services, and are germane to academic centers facing reductions in house staff availability and seeking alternative models of care for inpatients. Several specific characteristics of the PACE service and the implications of these should be considered:
The service accepted all patients, regardless of diagnosis, acuity, or complexity of illness. This was unlike many previously described nonhouse staff services which were more limited in scope, and allowed more flexibility with patient flow. However, in the end, patients on the PACE service did have a modestly lower case mix index and Charlson score, suggesting that, despite a lack of triage guidelines, there was some bias in the triage of admissions, possibly due to a perception that physician assistants should take care of lower complexity patients. If it is desirable to have a similar distribution of higher complexity patients across house staff and nonhouse staff services, extra efforts may be necessary to overcome this perception.
The service was geographically regionalized. Geographic regionalization offered many important advantages, especially with regards to communication among staff, nursing, and consultants, and allowed for multidisciplinary rounds. However, it is possible that the modest, but not statistically significant, trend toward an increased LOS seen on the PACE service might be a reflection of geographic admitting (less incentive to discharge since discharging a patient means taking a new admission).
The education and professional development of the physician assistants was a priority. Physician assistants had considerable autonomy and responsibility, and rather than being assigned only lower level administrative tasks, performed all aspects of patient care. They also received regular teaching from the hospitalists, attended house staff teaching conferences, and developed nonclinical roles in education and quality improvement. The higher standards expected of the physician assistants were quite possibly a factor in the quality of care delivered, and almost certainly contributed to physician assistant satisfaction and retention.
Our findings contrast with those of Myers et al.,9 who found that a nonteaching service staffed by hospitalists and nurse practitioners had a significantly lower median LOS and hospital charges compared to similar patients on resident‐based services. However, unlike ours, their service cared for a select patient population, and only accepted patients with chest pain at low risk for acute coronary syndrome. Van Rhee et al.10 found that physician assistants on a general medicine service used fewer resources for patients with pneumonia, stroke, and congestive heart failure than resident physicians, and did not exceed the resources used by residents in other diagnoses. The authors did not find a difference in LOS, but did find a significantly higher mortality among patients with pneumonia cared for by physician assistants.
Several limitations should be noted. First, the study was a retrospective analysis of administrative data rather than a randomized trial, and although we employed a standard approach to adjust for a wide range of patient characteristics including severity of illness, there may have been undetected differences in the patient populations studied that may have confounded our results. Second, resident moonlighters admitted patients to the PACE service and, at other times, to the house staff services, and this may have diluted any differences between the groups. However, when we limited our analysis to the subgroup of patients admitted during the day, similar results were obtained, with the exception that the PACE service had a lower rate of 14‐day readmissions, an unexpected finding deserving of further study. Third, the study was conducted in a single academic institution and our findings may not be generalizable to others with different needs and resources; indeed, the costs associated with implementing such a service may be prohibitive for some institutions. Fourth, because of simultaneous changes that were taking place in our residency program, we are unable to accurately assess the impact of the PACE service on resident duty hours. However, resident duty hours did not increase over this time period on the general medicine service, and implementation of the service allowed for redistribution of house staff to other services and positions. Fifth, patient satisfaction data were obtained from responses to the mailed Press‐Ganey survey, to which there is a relatively low response rate. Also, we did not survey providers regarding their satisfaction with the service during the study period. Sixth, the study had limited power to detect clinically important differences in mortality and ICU transfers. Finally, this study is unable to compare this particular model of incorporating midlevel providers into general medical services with other models, only with traditional house staff services.
Future research should focus on determining the most effective and efficient ways to incorporate midlevel providers on academic general medicine services. One important question from the standpoint of house staff training is whether such services should be separate but equal, or should house staff gain experience during residency working with midlevel providers, since they are likely to encounter them in the future whether they stay in academics or not. Different models of care will likely have large implications for the quality and efficiency of patient care, house staff education and satisfaction, and physician assistant job satisfaction and turnover.
In summary, our study demonstrates that a geographically regionalized, multidisciplinary service staffed by hospitalists and physician assistants can be a safe alternative to house staff‐based services for the care of general medicine inpatients in an academic medical center.
- ,,,,,.The physician's assistant as resident on surgical service. An example of creative problem solving in surgical manpower.Arch Surg.1980;115:310–314.
- ,,,.Coronary arteriography performed by a physician assistant.Am J Cardiol.1987;60:784–787.
- .The specialized physician assistant: an alternative to the clinical cardiology trainee.Am J Cardiol.1987;60:901–902.
- ,,.One hospital's successful 20‐year experience with physician assistants in graduate medical education.Acad Med.1999;74:641–645.
- ,.Physicians assistants in cardiothoracic surgery: a 30‐year experience in a university center.Ann Thorac Surg.2006;81:195–199; discussion 199–200.
- ,,.Comparative review of use of physician assistants in a level I trauma center.Am Surg.2004;70:272–279.
- ,,,,.Integrating midlevel practitioners into a teaching service.Am J Surg.2006;192:119–124.
- ,.Acute care nurse practitioners: creating and implementing a model of care for an inpatient general medical service.Am J Crit Care.2002;11:448–458.
- ,,,,.Improving resource utilization in a teaching hospital: development of a nonteaching service for chest pain admissions.Acad Med.2006;81:432–435.
- ,,.Resource use by physician assistant services versus teaching services.JAAPA.2002;15:33–38.
- ,,, for the ACGME Work Group on Resident Duty Hours, Accreditation Council for Graduate Medical Education.New requirements for resident duty hours.JAMA.2002;288:1112–1114.
- ,,.The substitution of physician assistants and nurse practitioners for physician residents in teaching hospitals.Health Aff.1995;14:181–191.
- ,,,,.Challenges of the 80‐hour resident work rules: collaboration between surgeons and nonphysician practitioners.Surg Clin North Am.2004;84:1573–1586.
- ,,.Adapting a clinical comorbidity index for use with ICD‐9‐CM administrative databases.J Clin Epidemiol.1992;45:613–619.
Copyright © 2008 Society of Hospital Medicine

All Eyes on San Diego
SHM’s Annual Meeting highlights hospital medicine as a distinct field within internal medicine. Being able to, year after year, incorporate core clinical topics, evidence-based practice, quality-related content, and career development into three days is only possible because of the foundation laid from previous meetings over the past 10 years.
Expectations about the role of hospitalists have taken shape through recommendations from education summits and national experts on healthcare policy, and via publications like the Journal of Hospital Medicine and The Core Competencies in Hospital Medicine. The Annual Meeting Committee’s goal was to define a program that facilitates hospitalists in achieving that role.

The 2008 meeting April 3-5 in San Diego will feature:
- National leaders in hospital medicine and healthcare;
- Six precourses addressing timely and relevant topics; and
- Seven tracks addressing clinical, operational, quality, academic, and pediatric issues.
Issues that have broad appeal and present challenges for hospitalists will be addressed in three widely anticipated keynotes:
Quality: Don Berwick, MD, MPP, FRCP, president and CEO, Institute for Healthcare Improvement (IHI) and architect of both the 100,000 Lives and 5 Million Lives campaigns;
The future of healthcare: Ian Morrison, PhD, president emeritus and health advisory panel chair, Institute for the Future, and an internationally known author on long-term forecasting with particular emphasis on healthcare;
Thriving in the face of comanagement, non-teaching services, transparency, and the reality of perpetual change: Robert Wachter, MD, professor and chief of the division of hospital medicine, associate chairman of the department of medicine, University of California, San Francisco.
The future of hospital medicine: opportunities and challenges: A special plenary session presented by a panel of hospital medicine leaders who will share perspectives from:
- The large hospitalist company;
- The large hospital company as an employer;
- The hospital CEO; and
- The individual hospital employed/associated hospital medicine group.
The following program elements are only a few of the many highlights of “Hospital Medicine 2008”:
The Evidence-Based Rapid-Fire Track: This track was developed in response from last year’s attendees. It is designed to provide participants—new or old attendees, academic or community caregivers—with “rapid bursts” of content and to address specific questions framed by the committee, based on the highest level of medical evidence available.
Research, Innovations, and Clinical Vignettes (RIV) Competition: Building on a new feature from “Hospital Medicine 2007,” a nationally renowned professor will again tour the poster session and comment on the entries, meet with academic hospitalists, attend forums, and generally be a “visiting professor” for the duration of the meeting. Additionally, SHM’s RIV Committee, along with staff, are working on arrangements for junior faculty to interact with senior researchers during times that run concurrent with non-plenary sessions. Senior hospitalists with expertise in quality-improvement research will also provide individual feedback to authors at the poster sessions. Mini poster presentation sessions will provide a way for residents to highlight their work, and there will be new, separate receptions for the posters (April 3) and exhibits (April 4).
More networking: Networking provides a critical outlet to interact with senior hospitalists, find out what others are doing to advance their careers, and seek mentorship. In addition to the networking opportunities incorporated in the RIV Competition, other networking opportunities include the exhibits, President’s Luncheon and additional receptions, and two new special-interest forums on com-anagement and consultative medicine and international hospital medicine.
The Annual Meeting Committee sought improvements in developing and implementing this year’s program. Committee brainstorming sessions for this year’s meeting focused on:
- Balancing what works with innovation;
- Making the meeting more valuable to clinical educators and researchers, and more applicable to community hospitalists; and
- Showing national leaders the extraordinary talent behind and work of SHM.
A key innovation was a successful “call for speakers.” Submissions were sought for three breakout sessions to create additional opportunity for members to play an active role in “Hospital Medicine 2008.” Based on submissions, sessions were added on the following topics:
- “Prevention, Management, and Treatment of Acute Delirium”;
- “Designing Compensation and Bonus Plans to Drive Desired Behavior”; and
- “Acute Coronary Syndrome Trials and Tribulations.”
Changes for “Hospital Medicine 2008” reflect the volunteerism of many professionals and would not have been possible without the mentorship and expertise of seasoned veteran leaders in hospital medicine, as well as the feedback and participation of hospitalists providing daily inpatient care. As part of a continuous quality-improvement initiative, rules of engagement were developed so speakers would have useful information up front.
The success of the SHM Annual Meeting depends upon the participation and leadership of SHM members, staff, committees, and task forces, as well as the SHM Board. My thanks goes out to them all for their efforts in once again creating a top-flight program.
For more information on “Hospital Medicine 2008,” and to register, visit www.hospitalmedicine.org/hospitalmedicine2008.
SHM’s Annual Meeting highlights hospital medicine as a distinct field within internal medicine. Being able to, year after year, incorporate core clinical topics, evidence-based practice, quality-related content, and career development into three days is only possible because of the foundation laid from previous meetings over the past 10 years.
Expectations about the role of hospitalists have taken shape through recommendations from education summits and national experts on healthcare policy, and via publications like the Journal of Hospital Medicine and The Core Competencies in Hospital Medicine. The Annual Meeting Committee’s goal was to define a program that facilitates hospitalists in achieving that role.
The 2008 meeting April 3-5 in San Diego will feature:
- National leaders in hospital medicine and healthcare;
- Six precourses addressing timely and relevant topics; and
- Seven tracks addressing clinical, operational, quality, academic, and pediatric issues.
Issues that have broad appeal and present challenges for hospitalists will be addressed in three widely anticipated keynotes:
Quality: Don Berwick, MD, MPP, FRCP, president and CEO, Institute for Healthcare Improvement (IHI) and architect of both the 100,000 Lives and 5 Million Lives campaigns;
The future of healthcare: Ian Morrison, PhD, president emeritus and health advisory panel chair, Institute for the Future, and an internationally known author on long-term forecasting with particular emphasis on healthcare;
Thriving in the face of comanagement, non-teaching services, transparency, and the reality of perpetual change: Robert Wachter, MD, professor and chief of the division of hospital medicine, associate chairman of the department of medicine, University of California, San Francisco.
The future of hospital medicine: opportunities and challenges: A special plenary session presented by a panel of hospital medicine leaders who will share perspectives from:
- The large hospitalist company;
- The large hospital company as an employer;
- The hospital CEO; and
- The individual hospital employed/associated hospital medicine group.
The following program elements are only a few of the many highlights of “Hospital Medicine 2008”:
The Evidence-Based Rapid-Fire Track: This track was developed in response from last year’s attendees. It is designed to provide participants—new or old attendees, academic or community caregivers—with “rapid bursts” of content and to address specific questions framed by the committee, based on the highest level of medical evidence available.
Research, Innovations, and Clinical Vignettes (RIV) Competition: Building on a new feature from “Hospital Medicine 2007,” a nationally renowned professor will again tour the poster session and comment on the entries, meet with academic hospitalists, attend forums, and generally be a “visiting professor” for the duration of the meeting. Additionally, SHM’s RIV Committee, along with staff, are working on arrangements for junior faculty to interact with senior researchers during times that run concurrent with non-plenary sessions. Senior hospitalists with expertise in quality-improvement research will also provide individual feedback to authors at the poster sessions. Mini poster presentation sessions will provide a way for residents to highlight their work, and there will be new, separate receptions for the posters (April 3) and exhibits (April 4).
More networking: Networking provides a critical outlet to interact with senior hospitalists, find out what others are doing to advance their careers, and seek mentorship. In addition to the networking opportunities incorporated in the RIV Competition, other networking opportunities include the exhibits, President’s Luncheon and additional receptions, and two new special-interest forums on com-anagement and consultative medicine and international hospital medicine.
The Annual Meeting Committee sought improvements in developing and implementing this year’s program. Committee brainstorming sessions for this year’s meeting focused on:
- Balancing what works with innovation;
- Making the meeting more valuable to clinical educators and researchers, and more applicable to community hospitalists; and
- Showing national leaders the extraordinary talent behind and work of SHM.
A key innovation was a successful “call for speakers.” Submissions were sought for three breakout sessions to create additional opportunity for members to play an active role in “Hospital Medicine 2008.” Based on submissions, sessions were added on the following topics:
- “Prevention, Management, and Treatment of Acute Delirium”;
- “Designing Compensation and Bonus Plans to Drive Desired Behavior”; and
- “Acute Coronary Syndrome Trials and Tribulations.”
Changes for “Hospital Medicine 2008” reflect the volunteerism of many professionals and would not have been possible without the mentorship and expertise of seasoned veteran leaders in hospital medicine, as well as the feedback and participation of hospitalists providing daily inpatient care. As part of a continuous quality-improvement initiative, rules of engagement were developed so speakers would have useful information up front.
The success of the SHM Annual Meeting depends upon the participation and leadership of SHM members, staff, committees, and task forces, as well as the SHM Board. My thanks goes out to them all for their efforts in once again creating a top-flight program.
For more information on “Hospital Medicine 2008,” and to register, visit www.hospitalmedicine.org/hospitalmedicine2008.
In the Literature
In This Edition
- Pay-for-performance associated with limited benefits on quality in acute myocardial infarction patients.
- Meta-analysis finds increased risk of acute myocardial infarction with use of rosiglitazone.
- Rosiglitazone increases risk of heart failure, but not acute myocardial infarction or death, interim analysis shows.
- Surgery versus prolonged conservative treatment for severe sciatica.
- Predicting poor outcomes in upper gastrointestinal bleeds.
- Discharging patients with unresolved medical issues.
Does Pay for Performance Improve Hospital Quality?
Background: In 2003, the Centers for Medicare and Medicaid Services (CMS) instituted a pay-for-performance (P4P) pilot program in which participating hospitals would be reimbursed more if they met specific quality standards of care for patients with certain conditions, including acute myocardial infarction (AMI). It is unknown if this type of financial incentive produces improvements in the processes or outcomes of care.
Study design: Observational cohort.
Setting: 500 hospitals across the U.S.
Synopsis: This study compared compliance with CMS quality indicators in the treatment of more than 100,000 patients with acute non-ST-elevation myocardial infarction at 54 participating and 446 non-participating hospitals in the P4P pilot. They found no significant difference in mortality or in a composite measure of the six quality indicators but a slight improvement in two of the six quality indicators (aspirin at discharge and smoking cessation counseling). They did not find that P4P adversely affected indicators not subject to financial incentives.
Bottom line: P4P is associated with limited improvements in compliance with CMS quality indicators in patients with AMI.
Citation: Glickman SW, Ou F-S, DeLong ER, et al. Pay for performance, quality of care, and outcomes in acute myocardial infarction. JAMA. 2007 Jun;297(21):2373-2380.
Is Rosiglitazone Associated with Adverse Cardiovascular Outcomes in a Meta-analysis?
Background: Rosiglitazone (Avandia) is one of two approved oral thiazolidinedione drugs used for diabetic control. Muraglitazar, another thiazolidinedione drug, was not approved for market due to adverse cardiovascular outcomes. The cardiovascular effects of rosiglitazone had not previously been evaluated.
Study design: Meta-analysis.
Setting: All clinical trials (published and unpublished) involving rosiglitazone.
Synopsis: The authors reviewed data from all randomized trials of rosiglitazone versus placebo or other drugs for at least 24 weeks. From the 42 included trials (including more than 28,000 patients) researchers found a statistically significant increased risk of the odds of AMI (odds ratio 1.43, confidence interval 1.03-1.98) in the rosiglitazone group, and a non-significant risk of death from any cardiovascular cause (odds ratio 1.64, confidence interval 0.98-2.74) and all-cause mortality (odds ratio 1.18, confidence interval 0.89-1.55). The meta-analysis was criticized due to the small number of events (fewer than 100 acute AMIs in each group) and lack of patient-level data, but one expert wrote that “in view of the potential cardiovascular risks and in the absence of evidence of other health advantages ... the rationale for prescribing rosiglitazone at this time is unclear.”
The study raised larger concerns regarding Food and Drug Administration drug approvals, because the drug was approved due to its effect on lowering blood sugar levels (a surrogate outcome) without enough scrutiny of other patient outcomes.
Bottom line: Rosiglitazone is associated with increased risk of AMI. Alternative oral agents should be considered first for blood sugar control in diabetics.
Citation: Nissen SE, Wolski K. Effect of rosiglitazone on the risk of myocardial infarction and death from cardiovascular causes. N Engl J Med. 2007 Jun;356(24):2457-2471.
Editorial: Psaty BM, Furberg CD. Rosiglitazone and cardiovascular risk. N Engl J Med. 2007 Jun;356(24):2522-2524.
Is Rosiglitazone Associated with Adverse Cardiovascular Outcomes in Interim Analysis?
Background: In response to a meta-analysis, an interim analysis of an ongoing open-label manufacturer-sponsored trial was undertaken to determine the cardiovascular risks of rosiglitazone.
Study design: Unplanned interim analysis of a randomized, multicenter, open-label, non-inferiority trial.
Subjects: Outpatient, inadequately controlled type 2 diabetics.
Synopsis: This was an unplanned interim analysis of an open-label manufacturer-sponsored trial. There were 4,447 inadequately controlled type 2 diabetics on either metformin or sulfonylurea. The patients were randomized to receive both drugs (controls) or add-on rosiglitazone. After a mean follow up of 3.75 years, there was no statistically significant difference between the groups in the primary end point (hospitalization or death from cardiovascular causes), or other end points (MI and death from cardiovascular causes or any cause). However, rosiglitazone was associated with an increased risk of heart failure (hazard ratio 2.15, confidence interval 1.30-3.57). Because this was an unplanned interim analysis for a trial expected to continue for six years, experts caution that the results are inconclusive due to low statistical significance and small event rates.
Bottom line: Rosiglitazone is associated with an increased risk of heart failure, but the risks of hospitalization, death, and acute MI remain unclear.
Citation: Home PD, Phil D, Pockock SJ, et al. Rosiglitazone evaluated for cardiovascular outcomes—an interim analysis. N Engl J Med. 2007 Jul;357(1):28-38.
How Often do Discharged Patients with Unresolved Medical Issues Require Outpatient Workups?
Background: Patients are often discharged from the hospital with incomplete workups, but it is unknown how often and what factors affect the completion of the intended workup.
Study design: Retrospective cohort.
Setting: Single institution teaching hospital.
Synopsis: The authors evaluated the inpatient and outpatient medical records of all patients discharged from the medicine or geriatric service over 18 months. Of almost 700 discharges, 28% of the patients had outpatient workups recommended (48% diagnostic procedures, 35% referrals, and 17% lab tests) by the discharging physician. Completion of the workup did not occur 36% of the time, and the likelihood of non-completion increased with time to the first follow-up appointment and lack of availability of the discharge summary.
Bottom line: Outpatient workups are intended in almost a third of discharged patient, the completion of which can likely be enhanced by timely follow-up and discharge summary availability.
Citation: Moore C, McGinn T, Halm E. Tying up loose ends: discharging patients with unresolved medical issues. Arch Intern Med. 2007;167(12):1305-1311.
Can We Predict Patients at Low Risk for Compli-cations from Acute Upper Gastrointestinal Bleeds?
Background: Although multiple risk-prediction scales exist for patients with upper gastrointestinal (UGI) bleeds, few have been prospectively validated or widely used in clinical practice.
Study design: Prospective cohort.
Setting: Veterans Affairs (VA) hospitals.
Synopsis: VA researchers created and validated a risk predictor in 391 patients with acute upper gastrointestinal bleeding. Data from the derivation set (two-thirds of the patients) was used to create the model tested on the validation set (one-third of the patients). Outcome one (re-bleeding, need for intervention to stop bleeding, or all-cause hospital mortality) was predicted by an APACHE score >11, stigmata of recent bleeding, or varices. Outcome two (outcome one plus new/worsening co-morbidity) was predicted by the above three factors plus an unstable co-morbidity at admission. In the validation group, outcome one occurred in 1%, 5%, and 25% of patients with zero, one, and two or more factors. Outcome two occurred in 6%, 18%, and 49%, respectively. A score of zero accurately identified 93% and 91% of patients for outcomes one and two. The authors speculated that these patients could be safely treated as outpatients. The study excluded patients on anticoagulation, and this VA cohort (99% male) may not be generalizable to other populations.
Bottom line: This validated prediction model can accurately predict more than 90% of patients at low-risk of poor outcomes with UGI bleeding, which could be used to stratify patients in need of hospital admission.
Citation: Imperiale TF, Dominitz JA, Provenzale DT, et al. Predicting poor outcome from acute upper gastrointestinal hemorrhage. Arch Intern Med. 2007 Jun;167(12):1291-1296.
Does Surgery or Conservative Therapy Improve Symptoms of Sciatica Faster?
Background: The optimal timing and benefit of lumbar-disk surgery in patients with symptomatic lumbar disk herniation is unknown.
Study design: Multicenter randomized trial.
Setting: Netherlands.
Synopsis: 283 patients with severe sciatica were randomly chosen to receive early surgery or conservative treatment (with surgery as needed) for six to 12 weeks. The methods for determining the three primary outcomes were: score on the Roland Disability Questionnaire, leg pain score, and self-report of perceived recovery. At one year, 89% of the surgery group and 39% of the control group underwent surgery after a mean of 2.2 and 18.7 weeks, respectively. There was no difference between the groups in the disability score, but time to relief of leg pain and recovery was faster in the surgery group. At one year, 95% in each group reported perceived recovery.
Bottom line: Rates of pain relief and perceived recovery are faster with early surgery than conservative treatment in patients with severe sciatica, but one-year recovery rates are the same. TH
Citation: Peul WC, Van Houwelingen HC, van den Hout WB, et al. Surgery versus prolonged conservative treatment for sciatica. NEJM. 2007 May;356(22):2245-2256.
Status Report
The mission of the University HealthSystem Consortium, based in Chicago, is “to advance knowledge, foster collaboration, and promote change to help members succeed in their respective markets. UHC’s vision is to be a catalyst for change, accelerating the achievement of clinical and operational excellence.” (www.uhc.edu).
As part of UHC’s improvement and effectiveness initiatives, a benchmarking project (“Role of the Hospitalist 2006 Benchmarking Project Performance Scorecard”) was undertaken during the summer and fall of 2006 to examine what hospitalists nationwide do, as well as how they are incorporated into patient care and how they are funded by member hospitals. The benchmarking project articulated how hospitalist programs are measured and what they do to add value to their member organizations.
Methods
A seven-person steering committee was selected to provide guidance. Under the direction of Danielle Carrier, MBA, project manager, Operations Improvement; UHC, the committee developed a survey of hospitalist program characteristics, hospitalist value self-assessment, and hospitalist innovative strategies. Twenty-three member organizations participated.
Results
The most common reason for starting a hospitalist program was improving efficiency and reducing length of stay through enhanced on-site availability; however, the impetus for hospitalist services has changed in 81% of responding organizations. The most common changes were increasing the focus on teaching and academic pursuits, quality, and safety, and providing coverage for services to facilitate Accreditation Council for Graduate Medical Education (ACGME) compliance, including co-management of surgical patients. The direction of change differed by the age of the program and the hospitalist model (teaching, non-teaching, and mixed models).
The benchmarking project articulated the value that hospitalist programs bring to their organizations:
- Quality improvement initiatives (development of protocols or pathways, standardization of care, medication reconciliation, enhanced glycemic control, and physician availability at care transitions such as ICU and emergency department [ED], as well as for pre-operative consults);
- Development of new services (palliative care programs, surgical co-management); and
- Improvement of the educational process (through more contact with faculty, multidisciplinary team rounding, curriculum development around the core competencies, hospitalist training programs, and practice-based learning).
Of the respondents, 95% report that hospitalists assume leadership roles in quality and safety initiatives. For the key stakeholders (senior administrator or department chair) the aspects of the hospitalist program that bring the most value are quality of care and safety, throughput and LOS, and expanded admission capacity and coverage.
Measures of success include length of stay, relative value units and service workload, teaching evaluations, admission and consult volume, costs and cost savings, core measures and national quality indicators, patient satisfaction, referring physician satisfaction, and academic productivity.
Information on hospitalist program funding indicated the following:
- Sole funding of salaries by the hospital: 45% of respondents; and
- Joint funding (hospital and another organization such as a medical school, a practice plan, or a clinical department): 50% of respondents.
Although no organization offers incentives for the program itself, 35% of organizations offer incentives for individual hospitalists. Incentives for individual hospitalists include productivity and relative value units, LOS, budget, quality measures, and weekend work. Two-thirds of organizations with individual incentives reported that the incentives have altered behavior or helped achieve program objectives.
The survey of workload and schedule was notable for the following:
- An annual average of 10 weeks of protected non-direct patient-care time per hospitalist is offered at 52% percent of programs;
- A full-time hospitalist spends an average of 23 weeks attending on inpatient units; and
- Time spent on average for hospitalists: 2.5% administrative, 4.9% quality, 5.3% research, 14.9% teaching, 2.6% outpatient care.
Areas in which the hospitalist program needs to play a stronger or increased role include quality improvement and patient safety, non-internal medicine services, clinical education, research, and leadership within the health system. There was no major variation among hospital administrator and chair of medicine responses. Program directors of three years or less identified quality improvement and standardizing care as areas that need more emphasis. Program directors of more than three years identified quality, research, and health system leadership as areas they’d like to gain a more significant role.
The most common impediment to the continuation and growth of hospitalist programs: attracting and retaining physicians, given the ratio of salary to workload, the level of burnout, and the lack of a defined career path. Attracting quality candidates with academic skills and/or the ability to lead and manage change was identified as a major impediment.
Challenges included:
- Cultural and political issues;
- Inadequate commitment or support for the program;
- Lack of understanding with regard to the role of the hospitalist and the true value of the program;
- Lack of organizational clarity of program goals, expectations, and measures of success; and
- Improvement of academic and scholarly aspects of the program.
Conclusions
The “Role of the Hospitalist 2006 Benchmarking Project Performance Scorecard.” reported on the need to proactively manage the program direction and growth by developing and expanding lines of business, which may include:
- Non-internal medicine services such as co-management models, pre-operative clinics, and anticoagulation clinics;
- Palliative care services;
- Quality and safety improvement efforts;
- Facilitation of admissions from the emergency department and transfers both within and outside the network; and
- Care of extended care facility patients.
Hospitalist program satisfaction in academic models may be enhanced by increasing the academic and research presence and by supporting the role of the hospitalist in quality improvement. In addition, the project identifies the need to effectively manage increasing demand for hospitalists for other service lines.
Articulating the hospitalist program’s value is the first step in obtaining the resources to proactively manage the program’s direction and growth. UHC recommends clearly defining the hospitalist program goals, expectations, and measures of success. This requires obtaining input and buy-in from all key stakeholders and developing measures for all key aspects of the program, including intangible contributions. Key stakeholders should meet regularly with hospitalists to discuss program accomplishments. Hospitalist program representatives should assume leadership roles within the hospital and medical staff. For example, hospitalists should become members of the medical staff executive committee and the hospital’s operational committee, interwoven into the fabric of the hospital. It is also important to identify and monitor measures to support program funding and support, as well as to create a business case for new program roles.
Enhancing hospitalist career development and advancement is central to the recruitment and retention of experienced hospitalists. Development of effective recruitment and retention strategies includes creating a hospitalist career path, offering protected time for non-direct patient care activities, implementing innovative strategies to manage night and weekend coverage, defining and monitoring workload indicators, building reward and recognition programs, and implementing incentive programs. Training and education curriculum should focus on the needs of hospitalists and should include modules in areas of program growth such as palliative care and surgical co-management. TH
The Venous Thromboembolism Quality Improvement Resource Room
The goal of this article is to explain how the first in a series of online resource rooms provides trainees and hospitalists with quality improvement tools that can be applied locally to improve inpatient care.1 During the emergence and explosive growth of hospital medicine, the SHM recognized the need to revise training relating to inpatient care and hospital process design to meet the evolving expectation of hospitalists that their performance will be measured, to actively set quality parameters, and to lead multidisciplinary teams to improve hospital performance.2 Armed with the appropriate skill set, hospitalists would be uniquely situated to lead and manage improvements in processes in the hospitals in which they work.
The content of the first Society of Hospital Medicine (SHM) Quality Improvement Resource Room (QI RR) supports hospitalists leading a multidisciplinary team dedicated to improving inpatient outcomes by preventing hospital‐acquired venous thromboembolism (VTE), a common cause of morbidity and mortality in hospitalized patients.3 The SHM developed this educational resource in the context of numerous reports on the incidence of medical errors in US hospitals and calls for action to improve the quality of health care.'47 Hospital report cards on quality measures are now public record, and hospitals will require uniformity in practice among physicians. Hospitalists are increasingly expected to lead initiatives that will implement national standards in key practices such as VTE prophylaxis2.
The QI RRs of the SHM are a collection of electronic tools accessible through the SHM Web site. They are designed to enhance the readiness of hospitalists and members of the multidisciplinary inpatient team to redesign care at the institutional level. Although all performance improvement is ultimately occurs locally, many QI methods and tools transcend hospital geography and disease topic. Leveraging a Web‐based platform, the SHM QI RRs present hospitalists with a general approach to QI, enriched by customizable workbooks that can be downloaded to best meet user needs. This resource is an innovation in practice‐based learning, quality improvement, and systems‐based practice.
METHODS
Development of the first QI RR followed a series of steps described in Curriculum Development for Medical Education8 (for process and timeline, see Table 1). Inadequate VTE prophylaxis was identified as an ongoing widespread problem of health care underutilization despite randomized clinical trials supporting the efficacy of prophylaxis.9, 10 Mirroring the AHRQ's assessment of underutilization of VTE prophylaxis as the single most important safety priority,6 the first QI RR focused on VTE, with plans to cover additional clinical conditions over time. As experts in the care of inpatients, hospitalists should be able to take custody of predictable complications of serious illness, identify and lower barriers to prevention, critically review prophylaxis options, utilize hospital‐specific data, and devise strategies to bridge the gap between knowledge and practice. Already leaders of multidisciplinary care teams, hospitalists are primed to lead multidisciplinary improvement teams as well.
| Phase 1 (January 2005April 2005): Executing the educational strategy |
|---|
| One‐hour conference calls |
| Curricular, clinical, technical, and creative aspects of production |
| Additional communication between members of working group between calls |
| Development of questionnaire for SHM membership, board, education, and hospital quality patient safety (HQPS) committees |
| Content freeze: fourth month of development |
| Implementation of revisions prior to April 2005 SHM Annual Meeting |
| Phase 2 (April 2005August 2005): revision based on feedback |
| Analysis of formative evaluation from Phase 1 |
| Launch of the VTE QI RR August 2005 |
| Secondary phases and venues for implementation |
| Workshops at hospital medicine educational events |
| SHM Quality course |
| Formal recognition of the learning, experience, or proficiency acquired by users |
| The working editorial team for the first resource room |
| Dedicated project manager (SHM staff) |
| Senior adviser for planning and development (SHM staff) |
| Senior adviser for education (SHM staff) |
| Content expert |
| Education editor |
| Hospital quality editor |
| Managing editor |
Available data on the demographics of hospitalists and feedback from the SHM membership, leadership, and committees indicated that most learners would have minimal previous exposure to QI concepts and only a few years of management experience. Any previous quality improvement initiatives would tend to have been isolated, experimental, or smaller in scale. The resource rooms are designed to facilitate quality improvement learning among hospitalists that is practice‐based and immediately relevant to patient care. Measurable improvement in particular care processes or outcomes should correlate with actual learning.
The educational strategy of the SHM was predicated on ensuring that a quality and patient safety curriculum would retain clinical applicability in the hospital setting. This approach, grounded in adult learning principles and common to medical education, teaches general principles by framing the learning experience as problem centered.11 Several domains were identified as universally important to any quality improvement effort: raising awareness of a local performance gap, applying the best current evidence to practice, tapping the experience of others leading QI efforts, and using measurements derived from rapid‐cycle tests of change. Such a template delineates the components of successful QI planning, implementation, and evaluation and provides users with a familiar RR format applicable to improving any care process, not just VTE.
The Internet was chosen as the mechanism for delivering training on the basis of previous surveys of the SHM membership in which members expressed a preference for electronic and Web‐based forms of educational content delivery. Drawing from the example of other organizations teaching quality improvement, including the Institute for Healthcare Improvement and Intermountain Health Care, the SHM valued the ubiquity of a Web‐based educational resource. To facilitate on‐the‐job training, the first SHM QI RR provides a comprehensive tool kit to guide hospitalists through the process of advocating, developing, implementing, and evaluating a QI initiative for VTE.
Prior to launching the resource room, formative input was collected from SHM leaders, a panel of education and QI experts, and attendees of the society's annual meetings. Such input followed each significant step in the development of the RR curricula. For example, visitors at a kiosk at the 2005 SHM annual meeting completed surveys as they navigated through the VTE QI RR. This focused feedback shaped prelaunch development. The ultimate performance evaluation and feedback for the QI RR curricula will be gauged by user reports of measurable improvement in specific hospital process or outcomes measures. The VTE QI RR was launched in August 2005 and promoted at the SHM Web site.
RESULTS
The content and layout of the VTE QI RR are depicted in Figure 1. The self‐directed learner may navigate through the entire resource room or just select areas for study. Those likely to visit only a single area are individuals looking for guidance to support discrete roles on the improvement team: champion, clinical leader, facilitator of the QI process, or educator of staff or patient audiences (see Figure 2).
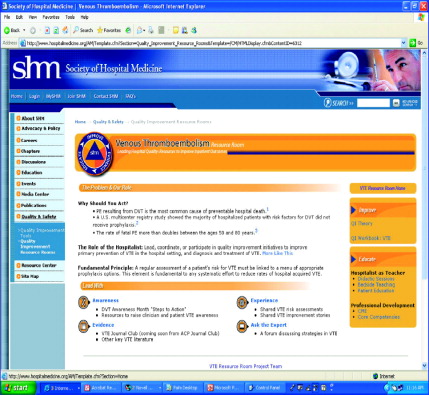
Why Should You Act?
The visual center of the QI RR layout presents sobering statisticsalthough pulmonary embolism from deep vein thrombosis is the most common cause of preventable hospital death, most hospitalized medical patients at risk do not receive appropriate prophylaxisand then encourages hospitalist‐led action to reduce hospital‐acquired VTE. The role of the hospitalist is extracted from the competencies articulated in the Venous Thromboembolism, Quality Improvement, and Hospitalist as Teacher chapters of The Core Competencies in Hospital Medicine.2
Awareness
In the Awareness area of the VTE QI RR, materials to raise clinician, hospital staff, and patient awareness are suggested and made available. Through the SHM's lead sponsorship of the national DVT Awareness Month campaign, suggested Steps to Action depict exactly how a hospital medicine service can use the campaign's materials to raise institutional support for tackling this preventable problem.
Evidence
The Evidence section aggregates a list of the most pertinent VTE prophylaxis literature to help ground any QI effort firmly in the evidence base. Through an agreement with the American College of Physicians (ACP), VTE prophylaxis articles reviewed in the ACP Journal Club are presented here.12 Although the listed literature focuses on prophylaxis, plans are in place to include references on diagnosis and treatment.
Experience
Resource room visitors interested in tapping into the experience of hospitalists and other leaders of QI efforts can navigate directly to this area. Interactive resources here include downloadable and adaptable protocols for VTE prophylaxis and, most importantly, improvement stories profiling actual QI successes. The Experience section features comments from an author of a seminal trial that studied computer alerts for high‐risk patients not receiving prophylaxis.10 The educational goal of this section of the QI RR is to provide opportunities to learn from successful QI projects, from the composition of the improvement team to the relevant metrics, implementation plan, and next steps.
Ask the Expert
The most interactive part of the resource room, the Ask the Expert forum, provides a hybrid of experience and evidence. A visitor who posts a clinical or improvement question to this discussion community receives a multidisciplinary response. For each question posted, a hospitalist moderator collects and aggregates responses from a panel of VTE experts, QI experts, hospitalist teachers, and pharmacists. The online exchange permitted by this forum promotes wider debate and learning. The questions and responses are archived and thus are available for subsequent users to read.
Improve
This area features the focal point of the entire resource room, the VTE QI workbook, which was written and designed to provide action‐oriented learning in quality improvement. The workbook is a downloadable project outline to guide and document efforts aimed at reducing rates of hospital‐acquired VTE. Hospitalists who complete the workbook should have acquired familiarity with and a working proficiency in leading system‐level efforts to drive better patient care. Users new to the theory and practice of QI can also review key concepts from a slide presentation in this part of the resource room.
Educate
This content area profiles the hospital medicine core competencies that relate to VTE and QI while also offering teaching materials and advice for teachers of VTE or QI. Teaching resources for clinician educators include online CME and an up‐to‐date slide lecture about VTE prophylaxis. The lecture presentation can be downloaded and customized to serve the needs of the speaker and the audience, whether students, residents, or other hospital staff. Clinician educators can also share or review teaching pearls used by hospitalist colleagues who serve as ward attendings.
DISCUSSION
A case example, shown in Figure 3, demonstrates how content accessible through the SHM VTE QI RR may be used to catalyze a local quality improvement effort.
Hospitals will be measured on rates of VTE prophylaxis on medical and surgical services. Failure to standardize prophylaxis among different physician groups may adversely affect overall performance, with implications for both patient care and accreditation. The lack of a agreed‐on gold standard of what constitutes appropriate prophylaxis for a given patient does not absolve an institution of the duty to implement its own standards. The challenge of achieving local consensus on appropriate prophylaxis should not outweigh the urgency to address preventable in‐hospital deaths. In caring for increasing numbers of general medical and surgical patients, hospitalists are likely to be asked to develop and implement a protocol for VTE prophylaxis that can be used hospitalwide. In many instances hospitalists will accept this charge in the aftermath of previous hospital failures in which admission order sets or VTE assessment protocols were launched but never widely implemented. As the National Quality Forum or JCAHO regulations for uniformity among hospitals shift VTE prophylaxis from being voluntary to compulsory, hospitalists will need to develop improvement strategies that have greater reliability.
Hospitalists with no formal training in either vascular medicine or quality improvement may not be able to immediately cite the most current data about VTE prophylaxis rates and regimens and may not have the time to enroll in a training course on quality improvement. How would hospitalists determine baseline rates of appropriate VTE prophylaxis? How can medical education be used to build consensus and recruit support from other physicians? What should be the scope of the QI initiative, and what patient population should be targeted for intervention?
The goal of the SHM QI RR is to provide the tools and the framework to help hospitalists develop, implement, and manage a VTE prophylaxis quality improvement initiative. Suggested Steps to Action in the Awareness section depict exactly how a hospital medicine service can use the campaign's materials to raise institutional support for tackling this preventable problem. Hospital quality officers can direct the hospital's public relations department to the Awareness section for DVT Awareness Month materials, including public service announcements in audio, visual, and print formats. The hold music at the hospital can be temporarily replaced, television kiosks can be set up to run video loops, and banners can be printed and hung in central locations, all to get out the message simultaneously to patients and medical staff.
The Evidence section of the VTE QI RR references a key benchmark study, the DVT‐Free Prospective Registry.9 This study reported that at 183 sites in North America and Europe, more than twice as many medical patients as surgical patients failed to receive prophylaxis. The Evidence section includes the 7th American College of Chest Physicians Consensus Conference on Antithrombotic and Thrombolytic Therapy and also highlights 3 randomized placebo‐controlled clinical trials (MEDENOX 1999, ARTEMIS 2003, and PREVENT 2004) that have reported significant reduction of risk of VTE (50%‐60%) from pharmacologic prophylaxis in moderate‐risk medical inpatients.1315 Review of the data helps to determine which patient population to study first, which prophylaxis options a hospital could deploy appropriately, and the expected magnitude of the effect. Because the literature has already been narrowed and is kept current, hospitalists can save time in answering a range of questions, from the most commonly agreed‐on factors to stratify risk to which populations require alternative interventions.
The Experience section references the first clinical trial demonstrating improved patient outcomes from a quality improvement initiative aimed at improving utilization of VTE prophylaxis.10 At the large teaching hospital where the electronic alerts were studied, a preexisting wealth of educational information on the hospital Web site, in the form of multiple seminars and lectures on VTE prophylaxis by opinion leaders and international experts, had little impact on practice. For this reason, the investigators implemented a trial of how to change physician behavior by introducing a point‐of‐care intervention, the computer alerts. Clinicians prompted by an electronic alert to consider DVT prophylaxis for at‐risk patients employed nearly double the rate of pharmacologic prophylaxis and reduced the incidence of DVT or pulmonary embolism (PE) by 41%. This study suggests that a change introduced to the clinical workflow can improve evidence‐based VTE prophylaxis and also can reduce the incidence of VTE in acutely ill hospitalized patients.
We believe that if hospitalists use the current evidence and experience assembled in the VTE QI RR, they could develop and lead a systematic approach to improving utilization of VTE prophylaxis. Although there is no gold standard method for integrating VTE risk assessment into clinical workflow, the VTE QI RR presents key lessons both from the literature and real world experiences. The crucial take‐home message is that hospitalists can facilitate implementation of VTE risk assessments if they stress simplicity (ie, the sick, old, surgery benefit), link the risk assessment to a menu of evidence‐based prophylaxis options, and require assessment of VTE risk as part of a regular routine (on admission and at regular intervals). Although many hospitals do not yet have computerized entry of physician orders, the simple 4‐point VTE risk assessment described by Kucher et al might be applied to other hospitals.10 The 4‐point system would identify the patients at highest risk, a reasonable starting point for a QI initiative. Whatever the modelCPOE alerts of very high‐risk patients, CPOE‐forced VTE risk assessments, nursing assessments, or paper‐based order setsregular VTE risk assessment can be incorporated into the daily routine of hospital care.
The QI workbook sequences the steps of a multidisciplinary improvement team and prompts users to set specific goals, collect practical metrics, and conduct plan‐do‐study‐act (PDSA) cycles of learning and action (Figure 4). Hospitalists and other team members can use the information in the workbook to estimate the prevalence of use of the appropriate VTE prophylaxis and the incidence of hospital‐acquired VTE at their medical centers, develop a suitable VTE risk assessment model, and plan interventions. Starting with all patients admitted to one nurse on one unit, then expanding to an entire nursing unit, an improvement team could implement rapid PDSA cycles to iron out the wrinkles of a risk assessment protocol. After demonstrating a measurable benefit for the patients at highest risk, the team would then be expected to capture more patients at risk for VTE by modifying the risk assessment protocol to identify moderate‐risk patients (hospitalized patients with one risk factor), as in the MEDENOX, ARTEMIS, and PREVENT clinical trials. Within the first several months, the QI intervention could be expanded to more nursing units. An improvement report profiling a clinically important increase in the rate of appropriate VTE prophylaxis would advocate for additional local resources and projects.
As questions arise in assembling an improvement team, setting useful aims and metrics, choosing interventions, implementing and studying change, or collecting performance data, hospitalists can review answers to questions already posted and post their own questions in the Ask the Expert area. For example, one user asked whether there was a standard risk assessment tool for identifying patients at high risk of VTE. Another asked about the use of unfractionated heparin as a low‐cost alternative to low‐molecular‐weight heparin. Both these questions were answered within 24 hours by the content editor of the VTE QI RR and, for one question, also by 2 pharmacists and an international expert in VTE.
As other hospitalists begin de novo efforts of their own, success stories and strategies posted in the online forums of the VTE QI RR will be an evolving resource for basic know‐how and innovation.
Suggestions from a community of resource room users will be solicited, evaluated, and incorporated into the QI RR in order to improve its educational value and utility. The curricula could also be adapted or refined by others with an interest in systems‐based care or practice‐based learning, such as directors of residency training programs.
CONCLUSIONS
The QI RRs bring QI theory and practice to the hospitalist, when and wherever it is wanted, minimizing time away from patient care. The workbook links theory to practice and can be used to launch, sustain, and document a local VTE‐specific QI initiative. A range of experience is accommodated. Content is provided in a way that enables the user to immediately apply and adapt it to a local contextusers can access and download the subset of tools that best meet their needs. For practicing hospitalists, this QI resource offers an opportunity to bridge the training gap in systems‐based hospital care and should increase the quality and quantity of and support for opportunities to lead successful QI projects.
The Accreditation Council of Graduate Medical Education (ACGME) now requires education in health care systems, a requirement not previously mandated for traditional medical residency programs.17 Because the resource rooms should increase the number of hospitalists competently leading local efforts that achieve measurable gains in hospital outcomes, a wider potential constituency also includes residency program directors, internal medicine residents, physician assistants and nurse‐practitioners, nurses, hospital quality officers, and hospital medicine practice leaders.
Further research is needed to determine the clinical impact of the VTE QI workbook on outcomes for hospitalized patients. The effectiveness of such an educational method should be evaluated, at least in part, by documenting changes in clinically important process and outcome measures, in this case those specific to hospital‐acquired VTE. Investigation also will need to generate an impact assessment to see if the curricula are effective in meeting the strategic educational goals of the Society of Hospital Medicine. Further investigation will examine whether this resource can help residency training programs achieve ACGME goals for practice‐based learning and systems‐based care.
- Society of Hospital Medicine Available at: http://www.hospitalmedicine.org/AM/Template.cfm?Section=Quality_Improvement_Resource_Rooms1(suppl 1).
- ,,,,,.Physician practices in the prevention of venous thromboembolism.Arch Intern Med.1991;151:933–938.
- Kohn LT,Corrigan JM,Donaldson MS, eds.To Err Is Human.Washington, DC:National Academy Press;2000.
- Institute of Medicinehttp://www.iom.edu/CMS/3718.aspx
- Shojania KG,Duncan BW,McDonald KM,Wachter RM, eds.Making health care safer: a critical analysis of patient safety practices.Agency for Healthcare Research and Quality, Publication 01‐E058;2001.
- Joint Commission on the Accreditation of Health Care Organizations. Public policy initiatives. Available at: http://www.jcaho.org/about+us/public+policy+initiatives/pay_for_performance.htm
- .Curriculum Development for Medical Education: A Six‐Step Approach.Baltimore, Md:Johns Hopkins University Press;1998.
- ,;DVT FREE Steering Committee.A prospective registry of 5,451 patients with ultrasound‐confirmed deep vein thrombosis.Am J Cardiol.2004;93:259.
- ,,, et al.Electronic alerts to prevent venous thromboembolism among hospitalized patients.N Engl J Med.2005;352:969.
- ,,.Teaching the Case Method.3rd ed.Cambridge, Mass :Harvard Business School.
- American College of Physicians. Available at: http://www.acpjc.org/?hp
- ,,, et al.MEDENOX trial.N Engl J Med.1999;341:793–800.
- ,,.Fondaparinux versus placebo for the prevention of VTE in acutely ill medical patients (ARTEMIS).J Thromb Haemost.2003;1(suppl 1):2046.
- ,,,,,.PREVENT Medical Thromboprophylaxis Study Group.Circulation.2004;110:874–879.
- ,.Comparing the costs, risks and benefits of competing strategies for the primary prevention of VTE.Circulation.2004;110:IV25–IV32.
- Accreditation Council for Graduate Medical Education. Available at: http://www.acgme.org/acWebsite/programDir/pd_index.asp.
The goal of this article is to explain how the first in a series of online resource rooms provides trainees and hospitalists with quality improvement tools that can be applied locally to improve inpatient care.1 During the emergence and explosive growth of hospital medicine, the SHM recognized the need to revise training relating to inpatient care and hospital process design to meet the evolving expectation of hospitalists that their performance will be measured, to actively set quality parameters, and to lead multidisciplinary teams to improve hospital performance.2 Armed with the appropriate skill set, hospitalists would be uniquely situated to lead and manage improvements in processes in the hospitals in which they work.
The content of the first Society of Hospital Medicine (SHM) Quality Improvement Resource Room (QI RR) supports hospitalists leading a multidisciplinary team dedicated to improving inpatient outcomes by preventing hospital‐acquired venous thromboembolism (VTE), a common cause of morbidity and mortality in hospitalized patients.3 The SHM developed this educational resource in the context of numerous reports on the incidence of medical errors in US hospitals and calls for action to improve the quality of health care.'47 Hospital report cards on quality measures are now public record, and hospitals will require uniformity in practice among physicians. Hospitalists are increasingly expected to lead initiatives that will implement national standards in key practices such as VTE prophylaxis2.
The QI RRs of the SHM are a collection of electronic tools accessible through the SHM Web site. They are designed to enhance the readiness of hospitalists and members of the multidisciplinary inpatient team to redesign care at the institutional level. Although all performance improvement is ultimately occurs locally, many QI methods and tools transcend hospital geography and disease topic. Leveraging a Web‐based platform, the SHM QI RRs present hospitalists with a general approach to QI, enriched by customizable workbooks that can be downloaded to best meet user needs. This resource is an innovation in practice‐based learning, quality improvement, and systems‐based practice.
METHODS
Development of the first QI RR followed a series of steps described in Curriculum Development for Medical Education8 (for process and timeline, see Table 1). Inadequate VTE prophylaxis was identified as an ongoing widespread problem of health care underutilization despite randomized clinical trials supporting the efficacy of prophylaxis.9, 10 Mirroring the AHRQ's assessment of underutilization of VTE prophylaxis as the single most important safety priority,6 the first QI RR focused on VTE, with plans to cover additional clinical conditions over time. As experts in the care of inpatients, hospitalists should be able to take custody of predictable complications of serious illness, identify and lower barriers to prevention, critically review prophylaxis options, utilize hospital‐specific data, and devise strategies to bridge the gap between knowledge and practice. Already leaders of multidisciplinary care teams, hospitalists are primed to lead multidisciplinary improvement teams as well.
| Phase 1 (January 2005April 2005): Executing the educational strategy |
|---|
| One‐hour conference calls |
| Curricular, clinical, technical, and creative aspects of production |
| Additional communication between members of working group between calls |
| Development of questionnaire for SHM membership, board, education, and hospital quality patient safety (HQPS) committees |
| Content freeze: fourth month of development |
| Implementation of revisions prior to April 2005 SHM Annual Meeting |
| Phase 2 (April 2005August 2005): revision based on feedback |
| Analysis of formative evaluation from Phase 1 |
| Launch of the VTE QI RR August 2005 |
| Secondary phases and venues for implementation |
| Workshops at hospital medicine educational events |
| SHM Quality course |
| Formal recognition of the learning, experience, or proficiency acquired by users |
| The working editorial team for the first resource room |
| Dedicated project manager (SHM staff) |
| Senior adviser for planning and development (SHM staff) |
| Senior adviser for education (SHM staff) |
| Content expert |
| Education editor |
| Hospital quality editor |
| Managing editor |
Available data on the demographics of hospitalists and feedback from the SHM membership, leadership, and committees indicated that most learners would have minimal previous exposure to QI concepts and only a few years of management experience. Any previous quality improvement initiatives would tend to have been isolated, experimental, or smaller in scale. The resource rooms are designed to facilitate quality improvement learning among hospitalists that is practice‐based and immediately relevant to patient care. Measurable improvement in particular care processes or outcomes should correlate with actual learning.
The educational strategy of the SHM was predicated on ensuring that a quality and patient safety curriculum would retain clinical applicability in the hospital setting. This approach, grounded in adult learning principles and common to medical education, teaches general principles by framing the learning experience as problem centered.11 Several domains were identified as universally important to any quality improvement effort: raising awareness of a local performance gap, applying the best current evidence to practice, tapping the experience of others leading QI efforts, and using measurements derived from rapid‐cycle tests of change. Such a template delineates the components of successful QI planning, implementation, and evaluation and provides users with a familiar RR format applicable to improving any care process, not just VTE.
The Internet was chosen as the mechanism for delivering training on the basis of previous surveys of the SHM membership in which members expressed a preference for electronic and Web‐based forms of educational content delivery. Drawing from the example of other organizations teaching quality improvement, including the Institute for Healthcare Improvement and Intermountain Health Care, the SHM valued the ubiquity of a Web‐based educational resource. To facilitate on‐the‐job training, the first SHM QI RR provides a comprehensive tool kit to guide hospitalists through the process of advocating, developing, implementing, and evaluating a QI initiative for VTE.
Prior to launching the resource room, formative input was collected from SHM leaders, a panel of education and QI experts, and attendees of the society's annual meetings. Such input followed each significant step in the development of the RR curricula. For example, visitors at a kiosk at the 2005 SHM annual meeting completed surveys as they navigated through the VTE QI RR. This focused feedback shaped prelaunch development. The ultimate performance evaluation and feedback for the QI RR curricula will be gauged by user reports of measurable improvement in specific hospital process or outcomes measures. The VTE QI RR was launched in August 2005 and promoted at the SHM Web site.
RESULTS
The content and layout of the VTE QI RR are depicted in Figure 1. The self‐directed learner may navigate through the entire resource room or just select areas for study. Those likely to visit only a single area are individuals looking for guidance to support discrete roles on the improvement team: champion, clinical leader, facilitator of the QI process, or educator of staff or patient audiences (see Figure 2).
Why Should You Act?
The visual center of the QI RR layout presents sobering statisticsalthough pulmonary embolism from deep vein thrombosis is the most common cause of preventable hospital death, most hospitalized medical patients at risk do not receive appropriate prophylaxisand then encourages hospitalist‐led action to reduce hospital‐acquired VTE. The role of the hospitalist is extracted from the competencies articulated in the Venous Thromboembolism, Quality Improvement, and Hospitalist as Teacher chapters of The Core Competencies in Hospital Medicine.2
Awareness
In the Awareness area of the VTE QI RR, materials to raise clinician, hospital staff, and patient awareness are suggested and made available. Through the SHM's lead sponsorship of the national DVT Awareness Month campaign, suggested Steps to Action depict exactly how a hospital medicine service can use the campaign's materials to raise institutional support for tackling this preventable problem.
Evidence
The Evidence section aggregates a list of the most pertinent VTE prophylaxis literature to help ground any QI effort firmly in the evidence base. Through an agreement with the American College of Physicians (ACP), VTE prophylaxis articles reviewed in the ACP Journal Club are presented here.12 Although the listed literature focuses on prophylaxis, plans are in place to include references on diagnosis and treatment.
Experience
Resource room visitors interested in tapping into the experience of hospitalists and other leaders of QI efforts can navigate directly to this area. Interactive resources here include downloadable and adaptable protocols for VTE prophylaxis and, most importantly, improvement stories profiling actual QI successes. The Experience section features comments from an author of a seminal trial that studied computer alerts for high‐risk patients not receiving prophylaxis.10 The educational goal of this section of the QI RR is to provide opportunities to learn from successful QI projects, from the composition of the improvement team to the relevant metrics, implementation plan, and next steps.
Ask the Expert
The most interactive part of the resource room, the Ask the Expert forum, provides a hybrid of experience and evidence. A visitor who posts a clinical or improvement question to this discussion community receives a multidisciplinary response. For each question posted, a hospitalist moderator collects and aggregates responses from a panel of VTE experts, QI experts, hospitalist teachers, and pharmacists. The online exchange permitted by this forum promotes wider debate and learning. The questions and responses are archived and thus are available for subsequent users to read.
Improve
This area features the focal point of the entire resource room, the VTE QI workbook, which was written and designed to provide action‐oriented learning in quality improvement. The workbook is a downloadable project outline to guide and document efforts aimed at reducing rates of hospital‐acquired VTE. Hospitalists who complete the workbook should have acquired familiarity with and a working proficiency in leading system‐level efforts to drive better patient care. Users new to the theory and practice of QI can also review key concepts from a slide presentation in this part of the resource room.
Educate
This content area profiles the hospital medicine core competencies that relate to VTE and QI while also offering teaching materials and advice for teachers of VTE or QI. Teaching resources for clinician educators include online CME and an up‐to‐date slide lecture about VTE prophylaxis. The lecture presentation can be downloaded and customized to serve the needs of the speaker and the audience, whether students, residents, or other hospital staff. Clinician educators can also share or review teaching pearls used by hospitalist colleagues who serve as ward attendings.
DISCUSSION
A case example, shown in Figure 3, demonstrates how content accessible through the SHM VTE QI RR may be used to catalyze a local quality improvement effort.
Hospitals will be measured on rates of VTE prophylaxis on medical and surgical services. Failure to standardize prophylaxis among different physician groups may adversely affect overall performance, with implications for both patient care and accreditation. The lack of a agreed‐on gold standard of what constitutes appropriate prophylaxis for a given patient does not absolve an institution of the duty to implement its own standards. The challenge of achieving local consensus on appropriate prophylaxis should not outweigh the urgency to address preventable in‐hospital deaths. In caring for increasing numbers of general medical and surgical patients, hospitalists are likely to be asked to develop and implement a protocol for VTE prophylaxis that can be used hospitalwide. In many instances hospitalists will accept this charge in the aftermath of previous hospital failures in which admission order sets or VTE assessment protocols were launched but never widely implemented. As the National Quality Forum or JCAHO regulations for uniformity among hospitals shift VTE prophylaxis from being voluntary to compulsory, hospitalists will need to develop improvement strategies that have greater reliability.
Hospitalists with no formal training in either vascular medicine or quality improvement may not be able to immediately cite the most current data about VTE prophylaxis rates and regimens and may not have the time to enroll in a training course on quality improvement. How would hospitalists determine baseline rates of appropriate VTE prophylaxis? How can medical education be used to build consensus and recruit support from other physicians? What should be the scope of the QI initiative, and what patient population should be targeted for intervention?
The goal of the SHM QI RR is to provide the tools and the framework to help hospitalists develop, implement, and manage a VTE prophylaxis quality improvement initiative. Suggested Steps to Action in the Awareness section depict exactly how a hospital medicine service can use the campaign's materials to raise institutional support for tackling this preventable problem. Hospital quality officers can direct the hospital's public relations department to the Awareness section for DVT Awareness Month materials, including public service announcements in audio, visual, and print formats. The hold music at the hospital can be temporarily replaced, television kiosks can be set up to run video loops, and banners can be printed and hung in central locations, all to get out the message simultaneously to patients and medical staff.
The Evidence section of the VTE QI RR references a key benchmark study, the DVT‐Free Prospective Registry.9 This study reported that at 183 sites in North America and Europe, more than twice as many medical patients as surgical patients failed to receive prophylaxis. The Evidence section includes the 7th American College of Chest Physicians Consensus Conference on Antithrombotic and Thrombolytic Therapy and also highlights 3 randomized placebo‐controlled clinical trials (MEDENOX 1999, ARTEMIS 2003, and PREVENT 2004) that have reported significant reduction of risk of VTE (50%‐60%) from pharmacologic prophylaxis in moderate‐risk medical inpatients.1315 Review of the data helps to determine which patient population to study first, which prophylaxis options a hospital could deploy appropriately, and the expected magnitude of the effect. Because the literature has already been narrowed and is kept current, hospitalists can save time in answering a range of questions, from the most commonly agreed‐on factors to stratify risk to which populations require alternative interventions.
The Experience section references the first clinical trial demonstrating improved patient outcomes from a quality improvement initiative aimed at improving utilization of VTE prophylaxis.10 At the large teaching hospital where the electronic alerts were studied, a preexisting wealth of educational information on the hospital Web site, in the form of multiple seminars and lectures on VTE prophylaxis by opinion leaders and international experts, had little impact on practice. For this reason, the investigators implemented a trial of how to change physician behavior by introducing a point‐of‐care intervention, the computer alerts. Clinicians prompted by an electronic alert to consider DVT prophylaxis for at‐risk patients employed nearly double the rate of pharmacologic prophylaxis and reduced the incidence of DVT or pulmonary embolism (PE) by 41%. This study suggests that a change introduced to the clinical workflow can improve evidence‐based VTE prophylaxis and also can reduce the incidence of VTE in acutely ill hospitalized patients.
We believe that if hospitalists use the current evidence and experience assembled in the VTE QI RR, they could develop and lead a systematic approach to improving utilization of VTE prophylaxis. Although there is no gold standard method for integrating VTE risk assessment into clinical workflow, the VTE QI RR presents key lessons both from the literature and real world experiences. The crucial take‐home message is that hospitalists can facilitate implementation of VTE risk assessments if they stress simplicity (ie, the sick, old, surgery benefit), link the risk assessment to a menu of evidence‐based prophylaxis options, and require assessment of VTE risk as part of a regular routine (on admission and at regular intervals). Although many hospitals do not yet have computerized entry of physician orders, the simple 4‐point VTE risk assessment described by Kucher et al might be applied to other hospitals.10 The 4‐point system would identify the patients at highest risk, a reasonable starting point for a QI initiative. Whatever the modelCPOE alerts of very high‐risk patients, CPOE‐forced VTE risk assessments, nursing assessments, or paper‐based order setsregular VTE risk assessment can be incorporated into the daily routine of hospital care.
The QI workbook sequences the steps of a multidisciplinary improvement team and prompts users to set specific goals, collect practical metrics, and conduct plan‐do‐study‐act (PDSA) cycles of learning and action (Figure 4). Hospitalists and other team members can use the information in the workbook to estimate the prevalence of use of the appropriate VTE prophylaxis and the incidence of hospital‐acquired VTE at their medical centers, develop a suitable VTE risk assessment model, and plan interventions. Starting with all patients admitted to one nurse on one unit, then expanding to an entire nursing unit, an improvement team could implement rapid PDSA cycles to iron out the wrinkles of a risk assessment protocol. After demonstrating a measurable benefit for the patients at highest risk, the team would then be expected to capture more patients at risk for VTE by modifying the risk assessment protocol to identify moderate‐risk patients (hospitalized patients with one risk factor), as in the MEDENOX, ARTEMIS, and PREVENT clinical trials. Within the first several months, the QI intervention could be expanded to more nursing units. An improvement report profiling a clinically important increase in the rate of appropriate VTE prophylaxis would advocate for additional local resources and projects.
As questions arise in assembling an improvement team, setting useful aims and metrics, choosing interventions, implementing and studying change, or collecting performance data, hospitalists can review answers to questions already posted and post their own questions in the Ask the Expert area. For example, one user asked whether there was a standard risk assessment tool for identifying patients at high risk of VTE. Another asked about the use of unfractionated heparin as a low‐cost alternative to low‐molecular‐weight heparin. Both these questions were answered within 24 hours by the content editor of the VTE QI RR and, for one question, also by 2 pharmacists and an international expert in VTE.
As other hospitalists begin de novo efforts of their own, success stories and strategies posted in the online forums of the VTE QI RR will be an evolving resource for basic know‐how and innovation.
Suggestions from a community of resource room users will be solicited, evaluated, and incorporated into the QI RR in order to improve its educational value and utility. The curricula could also be adapted or refined by others with an interest in systems‐based care or practice‐based learning, such as directors of residency training programs.
CONCLUSIONS
The QI RRs bring QI theory and practice to the hospitalist, when and wherever it is wanted, minimizing time away from patient care. The workbook links theory to practice and can be used to launch, sustain, and document a local VTE‐specific QI initiative. A range of experience is accommodated. Content is provided in a way that enables the user to immediately apply and adapt it to a local contextusers can access and download the subset of tools that best meet their needs. For practicing hospitalists, this QI resource offers an opportunity to bridge the training gap in systems‐based hospital care and should increase the quality and quantity of and support for opportunities to lead successful QI projects.
The Accreditation Council of Graduate Medical Education (ACGME) now requires education in health care systems, a requirement not previously mandated for traditional medical residency programs.17 Because the resource rooms should increase the number of hospitalists competently leading local efforts that achieve measurable gains in hospital outcomes, a wider potential constituency also includes residency program directors, internal medicine residents, physician assistants and nurse‐practitioners, nurses, hospital quality officers, and hospital medicine practice leaders.
Further research is needed to determine the clinical impact of the VTE QI workbook on outcomes for hospitalized patients. The effectiveness of such an educational method should be evaluated, at least in part, by documenting changes in clinically important process and outcome measures, in this case those specific to hospital‐acquired VTE. Investigation also will need to generate an impact assessment to see if the curricula are effective in meeting the strategic educational goals of the Society of Hospital Medicine. Further investigation will examine whether this resource can help residency training programs achieve ACGME goals for practice‐based learning and systems‐based care.
- Society of Hospital Medicine Available at: http://www.hospitalmedicine.org/AM/Template.cfm?Section=Quality_Improvement_Resource_Rooms1(suppl 1).
- ,,,,,.Physician practices in the prevention of venous thromboembolism.Arch Intern Med.1991;151:933–938.
- Kohn LT,Corrigan JM,Donaldson MS, eds.To Err Is Human.Washington, DC:National Academy Press;2000.
- Institute of Medicinehttp://www.iom.edu/CMS/3718.aspx
- Shojania KG,Duncan BW,McDonald KM,Wachter RM, eds.Making health care safer: a critical analysis of patient safety practices.Agency for Healthcare Research and Quality, Publication 01‐E058;2001.
- Joint Commission on the Accreditation of Health Care Organizations. Public policy initiatives. Available at: http://www.jcaho.org/about+us/public+policy+initiatives/pay_for_performance.htm
- .Curriculum Development for Medical Education: A Six‐Step Approach.Baltimore, Md:Johns Hopkins University Press;1998.
- ,;DVT FREE Steering Committee.A prospective registry of 5,451 patients with ultrasound‐confirmed deep vein thrombosis.Am J Cardiol.2004;93:259.
- ,,, et al.Electronic alerts to prevent venous thromboembolism among hospitalized patients.N Engl J Med.2005;352:969.
- ,,.Teaching the Case Method.3rd ed.Cambridge, Mass :Harvard Business School.
- American College of Physicians. Available at: http://www.acpjc.org/?hp
- ,,, et al.MEDENOX trial.N Engl J Med.1999;341:793–800.
- ,,.Fondaparinux versus placebo for the prevention of VTE in acutely ill medical patients (ARTEMIS).J Thromb Haemost.2003;1(suppl 1):2046.
- ,,,,,.PREVENT Medical Thromboprophylaxis Study Group.Circulation.2004;110:874–879.
- ,.Comparing the costs, risks and benefits of competing strategies for the primary prevention of VTE.Circulation.2004;110:IV25–IV32.
- Accreditation Council for Graduate Medical Education. Available at: http://www.acgme.org/acWebsite/programDir/pd_index.asp.
Copyright © 2006 Society of Hospital Medicine

Career Satisfaction Toolkit
Early survey data on hospitalists, which suggest high levels of job engagement and low turnover rates, may not be as relevant as programs mature in a competitive marketplace to meet important needs such as rising census and Accreditation Council for Graduate Medical Education (ACGME) requirements. There is also a paucity of data on how different models of compensation affect hospitalists’ career satisfaction.
In 2005 the role of the hospitalist has evolved from simply improving throughput (average length of stay) to one of leadership, quality improvement, and teaching that extends beyond direct patient care. Compensation for hospitalists should not, therefore, be based solely on billing revenue. Improving the efficiency of the hospitalists work environment, which may include IT support, adequate office space, and administrative support, may not only enhance productivity but also job satisfaction. More research is needed to examine these questions.
Progress Report
One of the Career Satisfaction Task Force’s major initiatives has been developing a toolkit for the SHM membership with the purpose of providing members with an action plan for attaining a long and satisfying career in hospital medicine. The following steps are being taken in the creation of the toolkit:
- Needs assessment—questionnaire at the SHM 2005 Annual Meeting;
- Monthly conference calls;
- Timeline:
- Toolkit draft completion—Sept. 2005;
- Review SHM Membership Committee—Oct. 2005;
- Further revision;
- Submission to SHM Board for review—Nov. 2005;
- Further revision; and
- Dissemination at SHM Annual Meeting—May 2006.
- Content—four workplace domains:
- Control/Autonomy;
- Workload/Schedule;
- Community/Environment; and
- Reward/Recognition.
- Elements comprising each domain:
- Definition: specific description of workplace domain;
- Background: review of literature, expert opinion, experience-based observation, executive summary of background content;
- Guidelines: practical actionable recommendations and educational initiatives;
- Pitfalls: specific examples;
- Examples: application to different settings (community, academic, pediatric); and
- References.
Research and Timeline
In parallel to the development of the work domains for the toolkit, the Career Satisfaction Task Force is developing a questionnaire to survey hospitalist physicians on career satisfaction and “worklife.” The last survey of this type was performed in 1999. This questionnaire will allow us to assess changes in hospitalist quality of working life over time to further explore how hospitalists are faring during this critical time of rapid growth of our specialty.
The task force is developing a list of important aspects of worklife, satisfaction, and stress for hospitalists. This list will be supplemented by semi-structured interviews of SHM members and leaders in hospital medicine to include a representative viewpoint of hospitalist worklife: adult and pediatric medicine, academic and community, gender and age, directors of programs, and different employer types.
The interviews were expected to be completed in the fall of 2005. Qualitative data analysis will allow us to ascertain important themes for job performance and satisfaction to be highlighted in the survey. The questionnaire development will also consider inclusion of aspects from the prior surveys to follow results over time and when possible will use validated questions from the quality of working life literature.
We anticipate completion of the questionnaire in spring 2006 followed by surveying of a random sample of hospitalists from the SHM membership through a Web-based survey. Sampling of groups of hospitalists based on job characteristics will occur because there is significant interest and need for information about hospitalist worklife in certain work settings. The questionnaire dissemination time will overlap with the annual meeting to maximize survey response. The task force will work with SHM annual meeting committee to discuss having a dedicated computer for filling out the Web-based survey on-site.
Any SHM member who would like to participate in the questionnaire on-site, even if they were not selected for the random sample, will be encouraged to do so. Data analysis will occur in mid-late 2006. The task force will use information from the analyses to update the SHM Worklife Toolkit. We will also provide numerous forums for dissemination of the data. In particular, we plan to showcase this data at the 2007 SHM Annual Meeting followed by journal publication and Web site posting. It is our hope that this data will provide key information on the current quality of working life of hospitalist physicians to support worklife recommendations that promote sustainable, enjoyable careers in hospital medicine.