User login
Midlevel providers (physician assistants and nurse practitioners) have long been employed by academic medical centers, predominantly on surgical services, or on medical subspecialty services, where they have typically had a limited scope of practice, focused in a narrowly defined area or set of procedures.17 In contrast, there are relatively few reports of experiences deploying midlevel providers to replace house staff on inpatient general medicine services in academic centers,810 and few studies of the effect of midlevel providers on quality and efficiency of care in the academic setting. Despite this, reductions in house officer duty hours as mandated by the Accreditation Council on Graduate Medical Education (ACGME)11 have resulted in academic centers increasingly using midlevel providers to decrease house staff workload on inpatient services.12, 13 In general, midlevel practitioners on general medicine services have been deployed to: (1) care for a population of patients separate from and in parallel with house staff; this population may be narrowly defined (eg, patients with chest pain) or not; (2) assist with the management of patients cared for by house staff by performing certain tasks (eg, scheduling appointments, discharging patients). Even as midlevel providers become more prevalent on academic general medicine services, the best model of care incorporating them into clinical care remains unclear, and few studies have rigorously examined the care provided on services that use them.
We developed an inpatient general medicine service within a large academic medical center staffed by physician assistants and hospitalists to help our residency program meet ACGME duty hour requirements. We hypothesized that by creating a service that is geographically localized and supervised by full‐time hospitalists, by instituting multidisciplinary rounds, and by investing in the professional development of highly‐skilled physician assistants, we could provide care for medically complex, acutely ill general medicine inpatients with similar quality and efficiency as compared to house staff teams. We report our experience during the first year of implementing the service, and compare quality and efficiency of care on this service with that of our traditional house staff services. We also evaluate the effects of this service on patient satisfaction and self‐reported house staff workload.
PATIENTS AND METHODS
Study Setting
The study was conducted in a 747‐bed urban, academic medical center in the northeastern United States. The hospital's human research committee reviewed and approved the study design. The hospital has accredited residency and fellowship programs in all major specialties. Prior to July 2005, physician assistants were employed only on surgical and medical subspecialty services (ie, bone marrow transplant, interventional cardiology); none were employed on the inpatient general medicine service. There were approximately 44,000 inpatient admissions during the year of the study, with approximately 6500 of these to the general medicine service.
Description of the General Medicine Service
The General Medicine Service consisted of 8 traditional house staff teams, with 1 attending, 1 junior or senior resident, 2 interns, and 1 or 2 medical students. These teams admitted patients on a rotating basis every fourth day. On 4 of these teams, the attending was a hospitalist, with clinical responsibility for the majority of the patients admitted to the team. On the remaining 4 teams, the teaching attending was a primary care physician or medical subspecialist, responsible for the direct care of a small number of the team's patients, with the remainder cared for by private primary care physicians or subspecialists.
Description of the Physician Assistant/Hospitalist Service
The Physician Assistant/Clinician Educator (PACE) service opened in July 2005, and consisted of 15 beds localized to 2 adjacent inpatient pods, staffed by a single cadre of nurses and medically staffed by 1 hospitalist and 2 physician assistants from 7:00 AM to 7:00 PM on weekdays and by 1 hospitalist, 1 physician assistant, and 1 moonlighter (usually a senior medical resident or fellow) from 7:00 AM to 7:00 PM on weekends. A moonlighter, typically a senior resident or medical subspecialty fellow, admitted patients and covered nights on the service from 7:00 PM to 7:00 AM 7 days a week. The daily census goal for the service was 15 patients, limited by the number of available beds on the 2 pods, and the service accepted admissions 24 hours per day, 7 days per week, whenever beds were available. Daily morning rounds occurred at 8:00 AM and included the hospitalist, physician assistants, nurses, a care coordinator, and a pharmacist. The PACE service did not have triage guidelines related to diagnosis, complexity, or acuity, but only accepted patients via the emergency department or via a primary care physician's office, and did not accept patients transferred from outside hospitals or from the intensive care units.
Physician Assistants
All of the physician assistants on the PACE service had prior inpatient medicine experience, ranging from 6 months to 5 years. The physician assistants worked in 3‐day to 6‐day blocks of 12‐hour shifts. Their clinical responsibilities were similar to those of interns at the study hospital, and included taking histories and performing physical examinations, writing notes and orders, reviewing and assimilating data, creating and updating patient signouts, completing discharge summaries, consulting other services as needed, and communicating with nurses and family members.
Many physician assistants also had nonclinical responsibilities, taking on physician‐mentored roles in education, quality improvement, and administration. They were involved in several initiatives: (1) developing a physician assistant curriculum in hospital medicine, (2) presenting at hospital‐wide physician assistant grand rounds, (3) surveying and tracking patient and family satisfaction on the service, (4) reviewing all 72‐hour hospital readmissions, intensive care unit transfers, and deaths on the service, and (5) maintaining the service's compliance with state regulations regarding physician assistant scope of practice and prescribing.
Hospitalists
The 3 hospitalists on the PACE service worked in 7‐day blocks of 12‐hour shifts (7:00 AM to 7:00 PM). They directly supervised the physician assistants and had no competing responsibilities. The hospitalists were all recent graduates of the study hospital's internal medicine residency, with no prior clinical experience beyond residency. All were planning to work on the service for 1 to 2 years before beginning a subspecialty fellowship. In addition to supervising the clinical work of the physician assistants, the hospitalists were responsible for teaching the physician assistants on rounds and in weekly didactic sessions, guided by a curriculum in hospital medicine that focused on the most common general medicine diagnoses seen on the PACE service. The medical director of the PACE service periodically reviewed each physician assistant's clinical experience, skills and knowledge base, and held semiannual feedback sessions.
Study Patients
All general medicine patients admitted to the PACE service from July 1, 2005 to June 30, 2006 comprised the study population. The comparison group consisted of general medicine patients admitted to the 8 house staff general medicine teams; patients transferred from an intensive care unit (ICU) or another facility were excluded in order to match the admission criteria for the PACE service and improve comparability between the 2 study arms.
Data Collection and Study Outcomes
We obtained all patient data from the hospital's administrative databases. We identified patients assigned to the PACE service or to the comparison group based on the admitting service, team, and attending. We obtained patient demographics, insurance, admission source and discharge destination, admission and discharge times, dates, diagnoses, and diagnosis‐related groups (DRGs), as well as dates and times of transfers to other services, including to the intensive care unit. We also obtained the Medicare case‐mix index (CMI, based on DRG weight), and calculated a Charlson score based on billing diagnoses coded in the year prior to the index admission.14 Outcomes included length of stay (LOS) to the nearest hour, in‐hospital mortality, transfers to the intensive care unit, readmissions to the study hospital within 72 hours, 14 days, and 30 days, and total costs as derived from the hospital's cost accounting system (Transition Systems Inc., Boston, MA). Other outcomes included patient satisfaction as measured by responses to the Press‐Ganey survey routinely administered to a randomly selected 70% of recently discharged patients and effect on self‐reported resident work hours.
Statistical Analysis
Patient demographics, clinical characteristics, and study outcomes are presented using proportions, means with standard deviations, and medians with inter‐quartile ranges as appropriate. Unadjusted differences in outcomes between the two services were calculated using univariable regression techniques with service as the independent variable and each outcome as the dependent variable. We used logistic regression for dichotomous outcomes (readmissions, ICU transfers, and inpatient mortality), and linear regression for log‐transformed LOS and log‐transformed total costs of care. To adjust each outcome for potential confounders, we then built multivariable regression models. Each potential confounder was entered into the model one at a time as the independent variable. All variables found to be significant predictors of the outcome at the P < 0.10 level were then retained in the final model along with service as the predictor of interest. We used general estimating equations in all multivariable models to adjust for clustering of patients by attending physician. For logistic regression models, the effect size is presented as an odds ratio (OR); for log‐transformed linear regression models, the effect size is presented as the percent difference between groups. We also performed 2 subgroup analyses, limited to (1) the patients with the 10 most common discharge DRGs, and (2) patients admitted between the hours of 7:00 AM and 7:00 PM to remove the effects of moonlighters performing the initial admission. Except as noted above, 2‐sided P values < 0.05 were considered significant. SAS 9.1 (SAS Institute, Cary, NC) was used for all analyses.
RESULTS
Patient Demographics
Table 1 shows patient demographics and clinical characteristics of the PACE service and the comparison group. Patients in the comparison group were slightly older and tended to have slightly higher CMI and Charlson scores. Patients on the PACE service were more likely to be admitted at night (10:00 PM to 7:00 AM; 43.8% versus 30.3%; P < 0.0001). There were no significant differences in sex, race, insurance, or percentage of patients discharged to home. The 10 most common DRGs in the comparison group accounted for 37.0% of discharges, and these same DRGs accounted for 37.5% of discharges on the PACE service (Table 2).
| Characteristic | PACE Service (n = 992) | House Staff Services (n = 4,202) | P value |
|---|---|---|---|
| |||
| Age (years) | |||
| 1844 | 19.1 | 18.2 | |
| 4564 | 35.5 | 31.9 | 0.04 |
| 65+ | 45.5 | 49.9 | |
| Sex (% female) | 57.7 | 60.0 | NS |
| Race/ethnicity | |||
| White | 57.3 | 59.3 | |
| Black | 24.0 | 23.5 | NS |
| Hispanic | 14.1 | 13.3 | |
| Other | 4.6 | 3.9 | |
| Insurance | |||
| Medicare | 41.9 | 43.8 | |
| Commercial | 34.9 | 35.9 | |
| Medicaid | 14.4 | 11.7 | NS |
| Free care | 4.5 | 3.9 | |
| Self pay | 1.1 | 0.8 | |
| Median income by zip code of residence, USD (IQR) | 45,517 (32,49362,932) | 45,517 (35,88963,275) | NS |
| Case‐mix index, median (IQR) | 1.1 (0.81.5) | 1.2 (0.91.8) | 0.001 |
| Charlson score | |||
| 0 | 27.2 | 24.9 | |
| 1 | 22.6 | 21.1 | 0.02 |
| 2 | 16.2 | 16.5 | |
| 3+ | 34.0 | 37.6 | |
| Admissions between 10:00 PM and 7:00 AM | 43.8 | 30.3 | <0.0001 |
| Discharged to home | 81.1 | 80.5 | NS |
| Diagnosis‐Related Group at Discharge | PACE Service (n = 992)* | House Staff Services (n = 4,202)* |
|---|---|---|
| ||
| Chest pain | 5.4 | 6.4 |
| Esophagitis, gastroenteritis, and miscellaneous digestive disorders | 4.5 | 4.4 |
| Heart failure and shock | 3.4 | 4.6 |
| Simple pneumonia and pleurisy | 2.7 | 4.4 |
| Kidney and urinary tract infections | 4.7 | 3.2 |
| Chronic obstructive pulmonary disease | 4.0 | 3.3 |
| Renal failure | 2.7 | 3.5 |
| Gastrointestinal hemorrhage | 3.7 | 2.7 |
| Nutritional and miscellaneous metabolic disorders | 3.3 | 2.4 |
| Disorders of the pancreas except malignancy | 3.1 | 2.1 |
| Cumulative percent | 37.5 | 37.0 |
Efficiency and Quality of Care
Table 3 compares the performance of the PACE service and the comparison group on several efficiency and quality measures. Unadjusted LOS was not significantly different, and adjusted LOS was slightly but not statistically significantly higher on the study service (adjusted LOS 5.0% higher; 95% confidence interval [CI], 0.4% to +10%). Unadjusted and adjusted total costs of care were marginally lower on the study service (adjusted total cost of care 3.9% lower; 95% CI, 7.5% to 0.3%).
| PACE Service | House Staff Services | Unadjusted % Difference (95%CI) | Adjusted % Difference (95%CI)* | |
|---|---|---|---|---|
| PACE Service | House Staff Services | Unadjusted OR (95% CI) | Adjusted OR (95% CI) | |
| ||||
| Efficiency measure | ||||
| Length of stay, days, median (IQR) | 2.6 (1.6, 4.4) | 2.6 (1.4, 4.6) | +0.1% (5.6% to +6.1%) | +5.0% (0.4% to +10.0%) |
| Total costs, USD, median (IQR) | 4,536 (2,848, 7,201) | 4,749 (3,046, 8,161) | 9.1% (14.0% to 3.8%) | 3.9% (7.5% to 0.3%)‖ |
| Quality measure | ||||
| 72‐hour readmissions/100 discharges | 0.8 | 1.3 | 0.6 (0.31.3) | 0.7 (0.21.8) |
| 14‐day readmissions/100 discharges | 5.4 | 5.4 | 1.0 (0.71.4) | 1.1 (0.81.4) |
| 30‐day readmissions/100 discharges | 8.0 | 8.1 | 1.0 (0.81.3) | 1.1 (0.91.3) |
| ICU transfers/100 discharges | 2.0 | 2.3 | 0.9 (0.51.4) | 1.4 (0.82.4)# |
| Inpatient mortality/100 discharges | 0.7 | 1.2 | 0.6 (0.31.3) | 0.8 (0.31.8)** |
We found no differences between the PACE service and comparison group in unadjusted rates of hospital readmissions within 72 hours, 14 days, and 30 days, transfer to the intensive care units, or inpatient mortality (Table 3). The associated ORs for each outcome were similar after adjusting for patient demographics and clinical characteristics including severity of illness, as well as for clustering by attending physician.
Subgroup Analyses
When the analysis was limited to the subset of patients with the 10 most common discharge DRGs, the difference in adjusted total cost of care was similar but lost statistical significance (4.0% lower on PACE service; 95% CI, 11.0% to +3.3%). In this subgroup, LOS, readmission rates, and ICU transfer rates were not different. ORs for mortality could not be calculated because there were no deaths in this subgroup on the PACE service (data not shown). When analysis was limited to daytime admissions (to remove any potential effect of admitting by a moonlighter), the difference in total cost of care was attenuated and lost statistical significance (0.2% lower on PACE service; 95%CI, 5.9% to +5.5%). No differences were seen in LOS, mortality, and ICU transfers (data not shown). However, 14‐day readmissions (but not 72‐hour or 30‐day readmissions) were lower on the PACE service (OR, 0.49; 95% CI, 0.25‐0.93).
Patient Satisfaction
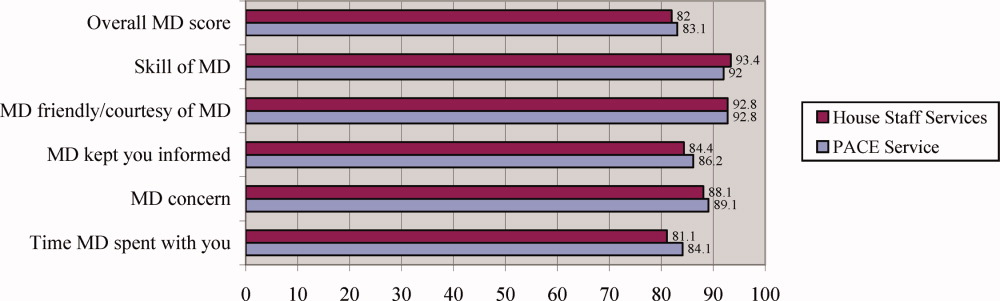
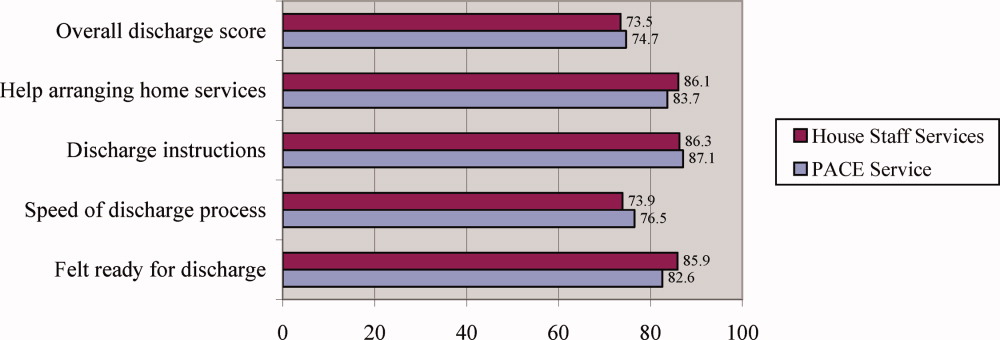
Patients were similarly satisfied with their care on the PACE service and on the house staff services. In specific areas and globally, percentages of patients satisfied with their physicians and with the discharge process were not different, as measured by the Press‐Ganey survey (Press‐Ganey Associates, South Bend, IN; Figures 1 and 2). The survey distinguishes between attendings and residents, but not physician assistants; therefore, Figure 1 only includes responses to the attending questions. Given the sampling procedure of the Press‐Ganey survey, exact response rates cannot be calculated, but Press‐Ganey reports a response rate of about 40% for the English survey and about 20% for the Spanish survey.
Resident Duty Hours
Comparing the same month 1 year prior to implementation of the PACE service, mean self‐reported resident duty hours on the general medicine service were unchanged; however, self‐reported data were incomplete, and multiple changes took place in the residency program during the study period. For example, implementation of the PACE service allowed for the dissolution of one full house staff general medicine team and redistribution of these house staff to night float positions and an expanded medical intensive care unit.
Costs of Implementation
The costs associated with implementing the PACE service included physician and physician assistant salaries (2.5 full‐time physicians, 5 full‐time physician assistants, plus fringe) and night coverage by resident and fellow moonlighters (without fringe, and estimated at 50% effort given other moonlighter coverage responsibilities on subspecialty services). We estimated these costs at $257.50/patient‐day ($115/patient‐day for attending physician compensation, $110/patient‐day for physician assistant compensation, and $32.50/patient‐day for moonlighting coverage).
DISCUSSION
As academic centers struggle with developing a workforce to provide patient care no longer provided by residents, questions about the ideal structure of nonhouse staff inpatient services abound. Although solutions to this problem will be determined to some extent by local factors such as institutional culture and resources, some lessons learned in developing such services will be more widely applicable. We found that by implementing a geographically localized, physician assistant‐staffed hospitalist service, we were able to provide care of similar quality and efficiency to that of traditional house staff services, despite inexperienced hospitalists staffing the service and a medical residency program commonly recognized as one of the best in the country. Adjusted total costs were slightly lower on the PACE service, but this difference was small and of borderline statistical significance. Likewise, no significant differences were seen in any of several quality measures or in patient satisfaction.
Our findings add to the available evidence supporting the use of physician assistants on academic general medicine services, and are germane to academic centers facing reductions in house staff availability and seeking alternative models of care for inpatients. Several specific characteristics of the PACE service and the implications of these should be considered:
The service accepted all patients, regardless of diagnosis, acuity, or complexity of illness. This was unlike many previously described nonhouse staff services which were more limited in scope, and allowed more flexibility with patient flow. However, in the end, patients on the PACE service did have a modestly lower case mix index and Charlson score, suggesting that, despite a lack of triage guidelines, there was some bias in the triage of admissions, possibly due to a perception that physician assistants should take care of lower complexity patients. If it is desirable to have a similar distribution of higher complexity patients across house staff and nonhouse staff services, extra efforts may be necessary to overcome this perception.
The service was geographically regionalized. Geographic regionalization offered many important advantages, especially with regards to communication among staff, nursing, and consultants, and allowed for multidisciplinary rounds. However, it is possible that the modest, but not statistically significant, trend toward an increased LOS seen on the PACE service might be a reflection of geographic admitting (less incentive to discharge since discharging a patient means taking a new admission).
The education and professional development of the physician assistants was a priority. Physician assistants had considerable autonomy and responsibility, and rather than being assigned only lower level administrative tasks, performed all aspects of patient care. They also received regular teaching from the hospitalists, attended house staff teaching conferences, and developed nonclinical roles in education and quality improvement. The higher standards expected of the physician assistants were quite possibly a factor in the quality of care delivered, and almost certainly contributed to physician assistant satisfaction and retention.
Our findings contrast with those of Myers et al.,9 who found that a nonteaching service staffed by hospitalists and nurse practitioners had a significantly lower median LOS and hospital charges compared to similar patients on resident‐based services. However, unlike ours, their service cared for a select patient population, and only accepted patients with chest pain at low risk for acute coronary syndrome. Van Rhee et al.10 found that physician assistants on a general medicine service used fewer resources for patients with pneumonia, stroke, and congestive heart failure than resident physicians, and did not exceed the resources used by residents in other diagnoses. The authors did not find a difference in LOS, but did find a significantly higher mortality among patients with pneumonia cared for by physician assistants.
Several limitations should be noted. First, the study was a retrospective analysis of administrative data rather than a randomized trial, and although we employed a standard approach to adjust for a wide range of patient characteristics including severity of illness, there may have been undetected differences in the patient populations studied that may have confounded our results. Second, resident moonlighters admitted patients to the PACE service and, at other times, to the house staff services, and this may have diluted any differences between the groups. However, when we limited our analysis to the subgroup of patients admitted during the day, similar results were obtained, with the exception that the PACE service had a lower rate of 14‐day readmissions, an unexpected finding deserving of further study. Third, the study was conducted in a single academic institution and our findings may not be generalizable to others with different needs and resources; indeed, the costs associated with implementing such a service may be prohibitive for some institutions. Fourth, because of simultaneous changes that were taking place in our residency program, we are unable to accurately assess the impact of the PACE service on resident duty hours. However, resident duty hours did not increase over this time period on the general medicine service, and implementation of the service allowed for redistribution of house staff to other services and positions. Fifth, patient satisfaction data were obtained from responses to the mailed Press‐Ganey survey, to which there is a relatively low response rate. Also, we did not survey providers regarding their satisfaction with the service during the study period. Sixth, the study had limited power to detect clinically important differences in mortality and ICU transfers. Finally, this study is unable to compare this particular model of incorporating midlevel providers into general medical services with other models, only with traditional house staff services.
Future research should focus on determining the most effective and efficient ways to incorporate midlevel providers on academic general medicine services. One important question from the standpoint of house staff training is whether such services should be separate but equal, or should house staff gain experience during residency working with midlevel providers, since they are likely to encounter them in the future whether they stay in academics or not. Different models of care will likely have large implications for the quality and efficiency of patient care, house staff education and satisfaction, and physician assistant job satisfaction and turnover.
In summary, our study demonstrates that a geographically regionalized, multidisciplinary service staffed by hospitalists and physician assistants can be a safe alternative to house staff‐based services for the care of general medicine inpatients in an academic medical center.
- ,,,,,.The physician's assistant as resident on surgical service. An example of creative problem solving in surgical manpower.Arch Surg.1980;115:310–314.
- ,,,.Coronary arteriography performed by a physician assistant.Am J Cardiol.1987;60:784–787.
- .The specialized physician assistant: an alternative to the clinical cardiology trainee.Am J Cardiol.1987;60:901–902.
- ,,.One hospital's successful 20‐year experience with physician assistants in graduate medical education.Acad Med.1999;74:641–645.
- ,.Physicians assistants in cardiothoracic surgery: a 30‐year experience in a university center.Ann Thorac Surg.2006;81:195–199; discussion 199–200.
- ,,.Comparative review of use of physician assistants in a level I trauma center.Am Surg.2004;70:272–279.
- ,,,,.Integrating midlevel practitioners into a teaching service.Am J Surg.2006;192:119–124.
- ,.Acute care nurse practitioners: creating and implementing a model of care for an inpatient general medical service.Am J Crit Care.2002;11:448–458.
- ,,,,.Improving resource utilization in a teaching hospital: development of a nonteaching service for chest pain admissions.Acad Med.2006;81:432–435.
- ,,.Resource use by physician assistant services versus teaching services.JAAPA.2002;15:33–38.
- ,,, for the ACGME Work Group on Resident Duty Hours, Accreditation Council for Graduate Medical Education.New requirements for resident duty hours.JAMA.2002;288:1112–1114.
- ,,.The substitution of physician assistants and nurse practitioners for physician residents in teaching hospitals.Health Aff.1995;14:181–191.
- ,,,,.Challenges of the 80‐hour resident work rules: collaboration between surgeons and nonphysician practitioners.Surg Clin North Am.2004;84:1573–1586.
- ,,.Adapting a clinical comorbidity index for use with ICD‐9‐CM administrative databases.J Clin Epidemiol.1992;45:613–619.
Midlevel providers (physician assistants and nurse practitioners) have long been employed by academic medical centers, predominantly on surgical services, or on medical subspecialty services, where they have typically had a limited scope of practice, focused in a narrowly defined area or set of procedures.17 In contrast, there are relatively few reports of experiences deploying midlevel providers to replace house staff on inpatient general medicine services in academic centers,810 and few studies of the effect of midlevel providers on quality and efficiency of care in the academic setting. Despite this, reductions in house officer duty hours as mandated by the Accreditation Council on Graduate Medical Education (ACGME)11 have resulted in academic centers increasingly using midlevel providers to decrease house staff workload on inpatient services.12, 13 In general, midlevel practitioners on general medicine services have been deployed to: (1) care for a population of patients separate from and in parallel with house staff; this population may be narrowly defined (eg, patients with chest pain) or not; (2) assist with the management of patients cared for by house staff by performing certain tasks (eg, scheduling appointments, discharging patients). Even as midlevel providers become more prevalent on academic general medicine services, the best model of care incorporating them into clinical care remains unclear, and few studies have rigorously examined the care provided on services that use them.
We developed an inpatient general medicine service within a large academic medical center staffed by physician assistants and hospitalists to help our residency program meet ACGME duty hour requirements. We hypothesized that by creating a service that is geographically localized and supervised by full‐time hospitalists, by instituting multidisciplinary rounds, and by investing in the professional development of highly‐skilled physician assistants, we could provide care for medically complex, acutely ill general medicine inpatients with similar quality and efficiency as compared to house staff teams. We report our experience during the first year of implementing the service, and compare quality and efficiency of care on this service with that of our traditional house staff services. We also evaluate the effects of this service on patient satisfaction and self‐reported house staff workload.
PATIENTS AND METHODS
Study Setting
The study was conducted in a 747‐bed urban, academic medical center in the northeastern United States. The hospital's human research committee reviewed and approved the study design. The hospital has accredited residency and fellowship programs in all major specialties. Prior to July 2005, physician assistants were employed only on surgical and medical subspecialty services (ie, bone marrow transplant, interventional cardiology); none were employed on the inpatient general medicine service. There were approximately 44,000 inpatient admissions during the year of the study, with approximately 6500 of these to the general medicine service.
Description of the General Medicine Service
The General Medicine Service consisted of 8 traditional house staff teams, with 1 attending, 1 junior or senior resident, 2 interns, and 1 or 2 medical students. These teams admitted patients on a rotating basis every fourth day. On 4 of these teams, the attending was a hospitalist, with clinical responsibility for the majority of the patients admitted to the team. On the remaining 4 teams, the teaching attending was a primary care physician or medical subspecialist, responsible for the direct care of a small number of the team's patients, with the remainder cared for by private primary care physicians or subspecialists.
Description of the Physician Assistant/Hospitalist Service
The Physician Assistant/Clinician Educator (PACE) service opened in July 2005, and consisted of 15 beds localized to 2 adjacent inpatient pods, staffed by a single cadre of nurses and medically staffed by 1 hospitalist and 2 physician assistants from 7:00 AM to 7:00 PM on weekdays and by 1 hospitalist, 1 physician assistant, and 1 moonlighter (usually a senior medical resident or fellow) from 7:00 AM to 7:00 PM on weekends. A moonlighter, typically a senior resident or medical subspecialty fellow, admitted patients and covered nights on the service from 7:00 PM to 7:00 AM 7 days a week. The daily census goal for the service was 15 patients, limited by the number of available beds on the 2 pods, and the service accepted admissions 24 hours per day, 7 days per week, whenever beds were available. Daily morning rounds occurred at 8:00 AM and included the hospitalist, physician assistants, nurses, a care coordinator, and a pharmacist. The PACE service did not have triage guidelines related to diagnosis, complexity, or acuity, but only accepted patients via the emergency department or via a primary care physician's office, and did not accept patients transferred from outside hospitals or from the intensive care units.
Physician Assistants
All of the physician assistants on the PACE service had prior inpatient medicine experience, ranging from 6 months to 5 years. The physician assistants worked in 3‐day to 6‐day blocks of 12‐hour shifts. Their clinical responsibilities were similar to those of interns at the study hospital, and included taking histories and performing physical examinations, writing notes and orders, reviewing and assimilating data, creating and updating patient signouts, completing discharge summaries, consulting other services as needed, and communicating with nurses and family members.
Many physician assistants also had nonclinical responsibilities, taking on physician‐mentored roles in education, quality improvement, and administration. They were involved in several initiatives: (1) developing a physician assistant curriculum in hospital medicine, (2) presenting at hospital‐wide physician assistant grand rounds, (3) surveying and tracking patient and family satisfaction on the service, (4) reviewing all 72‐hour hospital readmissions, intensive care unit transfers, and deaths on the service, and (5) maintaining the service's compliance with state regulations regarding physician assistant scope of practice and prescribing.
Hospitalists
The 3 hospitalists on the PACE service worked in 7‐day blocks of 12‐hour shifts (7:00 AM to 7:00 PM). They directly supervised the physician assistants and had no competing responsibilities. The hospitalists were all recent graduates of the study hospital's internal medicine residency, with no prior clinical experience beyond residency. All were planning to work on the service for 1 to 2 years before beginning a subspecialty fellowship. In addition to supervising the clinical work of the physician assistants, the hospitalists were responsible for teaching the physician assistants on rounds and in weekly didactic sessions, guided by a curriculum in hospital medicine that focused on the most common general medicine diagnoses seen on the PACE service. The medical director of the PACE service periodically reviewed each physician assistant's clinical experience, skills and knowledge base, and held semiannual feedback sessions.
Study Patients
All general medicine patients admitted to the PACE service from July 1, 2005 to June 30, 2006 comprised the study population. The comparison group consisted of general medicine patients admitted to the 8 house staff general medicine teams; patients transferred from an intensive care unit (ICU) or another facility were excluded in order to match the admission criteria for the PACE service and improve comparability between the 2 study arms.
Data Collection and Study Outcomes
We obtained all patient data from the hospital's administrative databases. We identified patients assigned to the PACE service or to the comparison group based on the admitting service, team, and attending. We obtained patient demographics, insurance, admission source and discharge destination, admission and discharge times, dates, diagnoses, and diagnosis‐related groups (DRGs), as well as dates and times of transfers to other services, including to the intensive care unit. We also obtained the Medicare case‐mix index (CMI, based on DRG weight), and calculated a Charlson score based on billing diagnoses coded in the year prior to the index admission.14 Outcomes included length of stay (LOS) to the nearest hour, in‐hospital mortality, transfers to the intensive care unit, readmissions to the study hospital within 72 hours, 14 days, and 30 days, and total costs as derived from the hospital's cost accounting system (Transition Systems Inc., Boston, MA). Other outcomes included patient satisfaction as measured by responses to the Press‐Ganey survey routinely administered to a randomly selected 70% of recently discharged patients and effect on self‐reported resident work hours.
Statistical Analysis
Patient demographics, clinical characteristics, and study outcomes are presented using proportions, means with standard deviations, and medians with inter‐quartile ranges as appropriate. Unadjusted differences in outcomes between the two services were calculated using univariable regression techniques with service as the independent variable and each outcome as the dependent variable. We used logistic regression for dichotomous outcomes (readmissions, ICU transfers, and inpatient mortality), and linear regression for log‐transformed LOS and log‐transformed total costs of care. To adjust each outcome for potential confounders, we then built multivariable regression models. Each potential confounder was entered into the model one at a time as the independent variable. All variables found to be significant predictors of the outcome at the P < 0.10 level were then retained in the final model along with service as the predictor of interest. We used general estimating equations in all multivariable models to adjust for clustering of patients by attending physician. For logistic regression models, the effect size is presented as an odds ratio (OR); for log‐transformed linear regression models, the effect size is presented as the percent difference between groups. We also performed 2 subgroup analyses, limited to (1) the patients with the 10 most common discharge DRGs, and (2) patients admitted between the hours of 7:00 AM and 7:00 PM to remove the effects of moonlighters performing the initial admission. Except as noted above, 2‐sided P values < 0.05 were considered significant. SAS 9.1 (SAS Institute, Cary, NC) was used for all analyses.
RESULTS
Patient Demographics
Table 1 shows patient demographics and clinical characteristics of the PACE service and the comparison group. Patients in the comparison group were slightly older and tended to have slightly higher CMI and Charlson scores. Patients on the PACE service were more likely to be admitted at night (10:00 PM to 7:00 AM; 43.8% versus 30.3%; P < 0.0001). There were no significant differences in sex, race, insurance, or percentage of patients discharged to home. The 10 most common DRGs in the comparison group accounted for 37.0% of discharges, and these same DRGs accounted for 37.5% of discharges on the PACE service (Table 2).
| Characteristic | PACE Service (n = 992) | House Staff Services (n = 4,202) | P value |
|---|---|---|---|
| |||
| Age (years) | |||
| 1844 | 19.1 | 18.2 | |
| 4564 | 35.5 | 31.9 | 0.04 |
| 65+ | 45.5 | 49.9 | |
| Sex (% female) | 57.7 | 60.0 | NS |
| Race/ethnicity | |||
| White | 57.3 | 59.3 | |
| Black | 24.0 | 23.5 | NS |
| Hispanic | 14.1 | 13.3 | |
| Other | 4.6 | 3.9 | |
| Insurance | |||
| Medicare | 41.9 | 43.8 | |
| Commercial | 34.9 | 35.9 | |
| Medicaid | 14.4 | 11.7 | NS |
| Free care | 4.5 | 3.9 | |
| Self pay | 1.1 | 0.8 | |
| Median income by zip code of residence, USD (IQR) | 45,517 (32,49362,932) | 45,517 (35,88963,275) | NS |
| Case‐mix index, median (IQR) | 1.1 (0.81.5) | 1.2 (0.91.8) | 0.001 |
| Charlson score | |||
| 0 | 27.2 | 24.9 | |
| 1 | 22.6 | 21.1 | 0.02 |
| 2 | 16.2 | 16.5 | |
| 3+ | 34.0 | 37.6 | |
| Admissions between 10:00 PM and 7:00 AM | 43.8 | 30.3 | <0.0001 |
| Discharged to home | 81.1 | 80.5 | NS |
| Diagnosis‐Related Group at Discharge | PACE Service (n = 992)* | House Staff Services (n = 4,202)* |
|---|---|---|
| ||
| Chest pain | 5.4 | 6.4 |
| Esophagitis, gastroenteritis, and miscellaneous digestive disorders | 4.5 | 4.4 |
| Heart failure and shock | 3.4 | 4.6 |
| Simple pneumonia and pleurisy | 2.7 | 4.4 |
| Kidney and urinary tract infections | 4.7 | 3.2 |
| Chronic obstructive pulmonary disease | 4.0 | 3.3 |
| Renal failure | 2.7 | 3.5 |
| Gastrointestinal hemorrhage | 3.7 | 2.7 |
| Nutritional and miscellaneous metabolic disorders | 3.3 | 2.4 |
| Disorders of the pancreas except malignancy | 3.1 | 2.1 |
| Cumulative percent | 37.5 | 37.0 |
Efficiency and Quality of Care
Table 3 compares the performance of the PACE service and the comparison group on several efficiency and quality measures. Unadjusted LOS was not significantly different, and adjusted LOS was slightly but not statistically significantly higher on the study service (adjusted LOS 5.0% higher; 95% confidence interval [CI], 0.4% to +10%). Unadjusted and adjusted total costs of care were marginally lower on the study service (adjusted total cost of care 3.9% lower; 95% CI, 7.5% to 0.3%).
| PACE Service | House Staff Services | Unadjusted % Difference (95%CI) | Adjusted % Difference (95%CI)* | |
|---|---|---|---|---|
| PACE Service | House Staff Services | Unadjusted OR (95% CI) | Adjusted OR (95% CI) | |
| ||||
| Efficiency measure | ||||
| Length of stay, days, median (IQR) | 2.6 (1.6, 4.4) | 2.6 (1.4, 4.6) | +0.1% (5.6% to +6.1%) | +5.0% (0.4% to +10.0%) |
| Total costs, USD, median (IQR) | 4,536 (2,848, 7,201) | 4,749 (3,046, 8,161) | 9.1% (14.0% to 3.8%) | 3.9% (7.5% to 0.3%)‖ |
| Quality measure | ||||
| 72‐hour readmissions/100 discharges | 0.8 | 1.3 | 0.6 (0.31.3) | 0.7 (0.21.8) |
| 14‐day readmissions/100 discharges | 5.4 | 5.4 | 1.0 (0.71.4) | 1.1 (0.81.4) |
| 30‐day readmissions/100 discharges | 8.0 | 8.1 | 1.0 (0.81.3) | 1.1 (0.91.3) |
| ICU transfers/100 discharges | 2.0 | 2.3 | 0.9 (0.51.4) | 1.4 (0.82.4)# |
| Inpatient mortality/100 discharges | 0.7 | 1.2 | 0.6 (0.31.3) | 0.8 (0.31.8)** |
We found no differences between the PACE service and comparison group in unadjusted rates of hospital readmissions within 72 hours, 14 days, and 30 days, transfer to the intensive care units, or inpatient mortality (Table 3). The associated ORs for each outcome were similar after adjusting for patient demographics and clinical characteristics including severity of illness, as well as for clustering by attending physician.
Subgroup Analyses
When the analysis was limited to the subset of patients with the 10 most common discharge DRGs, the difference in adjusted total cost of care was similar but lost statistical significance (4.0% lower on PACE service; 95% CI, 11.0% to +3.3%). In this subgroup, LOS, readmission rates, and ICU transfer rates were not different. ORs for mortality could not be calculated because there were no deaths in this subgroup on the PACE service (data not shown). When analysis was limited to daytime admissions (to remove any potential effect of admitting by a moonlighter), the difference in total cost of care was attenuated and lost statistical significance (0.2% lower on PACE service; 95%CI, 5.9% to +5.5%). No differences were seen in LOS, mortality, and ICU transfers (data not shown). However, 14‐day readmissions (but not 72‐hour or 30‐day readmissions) were lower on the PACE service (OR, 0.49; 95% CI, 0.25‐0.93).
Patient Satisfaction
Patients were similarly satisfied with their care on the PACE service and on the house staff services. In specific areas and globally, percentages of patients satisfied with their physicians and with the discharge process were not different, as measured by the Press‐Ganey survey (Press‐Ganey Associates, South Bend, IN; Figures 1 and 2). The survey distinguishes between attendings and residents, but not physician assistants; therefore, Figure 1 only includes responses to the attending questions. Given the sampling procedure of the Press‐Ganey survey, exact response rates cannot be calculated, but Press‐Ganey reports a response rate of about 40% for the English survey and about 20% for the Spanish survey.
Resident Duty Hours
Comparing the same month 1 year prior to implementation of the PACE service, mean self‐reported resident duty hours on the general medicine service were unchanged; however, self‐reported data were incomplete, and multiple changes took place in the residency program during the study period. For example, implementation of the PACE service allowed for the dissolution of one full house staff general medicine team and redistribution of these house staff to night float positions and an expanded medical intensive care unit.
Costs of Implementation
The costs associated with implementing the PACE service included physician and physician assistant salaries (2.5 full‐time physicians, 5 full‐time physician assistants, plus fringe) and night coverage by resident and fellow moonlighters (without fringe, and estimated at 50% effort given other moonlighter coverage responsibilities on subspecialty services). We estimated these costs at $257.50/patient‐day ($115/patient‐day for attending physician compensation, $110/patient‐day for physician assistant compensation, and $32.50/patient‐day for moonlighting coverage).
DISCUSSION
As academic centers struggle with developing a workforce to provide patient care no longer provided by residents, questions about the ideal structure of nonhouse staff inpatient services abound. Although solutions to this problem will be determined to some extent by local factors such as institutional culture and resources, some lessons learned in developing such services will be more widely applicable. We found that by implementing a geographically localized, physician assistant‐staffed hospitalist service, we were able to provide care of similar quality and efficiency to that of traditional house staff services, despite inexperienced hospitalists staffing the service and a medical residency program commonly recognized as one of the best in the country. Adjusted total costs were slightly lower on the PACE service, but this difference was small and of borderline statistical significance. Likewise, no significant differences were seen in any of several quality measures or in patient satisfaction.
Our findings add to the available evidence supporting the use of physician assistants on academic general medicine services, and are germane to academic centers facing reductions in house staff availability and seeking alternative models of care for inpatients. Several specific characteristics of the PACE service and the implications of these should be considered:
The service accepted all patients, regardless of diagnosis, acuity, or complexity of illness. This was unlike many previously described nonhouse staff services which were more limited in scope, and allowed more flexibility with patient flow. However, in the end, patients on the PACE service did have a modestly lower case mix index and Charlson score, suggesting that, despite a lack of triage guidelines, there was some bias in the triage of admissions, possibly due to a perception that physician assistants should take care of lower complexity patients. If it is desirable to have a similar distribution of higher complexity patients across house staff and nonhouse staff services, extra efforts may be necessary to overcome this perception.
The service was geographically regionalized. Geographic regionalization offered many important advantages, especially with regards to communication among staff, nursing, and consultants, and allowed for multidisciplinary rounds. However, it is possible that the modest, but not statistically significant, trend toward an increased LOS seen on the PACE service might be a reflection of geographic admitting (less incentive to discharge since discharging a patient means taking a new admission).
The education and professional development of the physician assistants was a priority. Physician assistants had considerable autonomy and responsibility, and rather than being assigned only lower level administrative tasks, performed all aspects of patient care. They also received regular teaching from the hospitalists, attended house staff teaching conferences, and developed nonclinical roles in education and quality improvement. The higher standards expected of the physician assistants were quite possibly a factor in the quality of care delivered, and almost certainly contributed to physician assistant satisfaction and retention.
Our findings contrast with those of Myers et al.,9 who found that a nonteaching service staffed by hospitalists and nurse practitioners had a significantly lower median LOS and hospital charges compared to similar patients on resident‐based services. However, unlike ours, their service cared for a select patient population, and only accepted patients with chest pain at low risk for acute coronary syndrome. Van Rhee et al.10 found that physician assistants on a general medicine service used fewer resources for patients with pneumonia, stroke, and congestive heart failure than resident physicians, and did not exceed the resources used by residents in other diagnoses. The authors did not find a difference in LOS, but did find a significantly higher mortality among patients with pneumonia cared for by physician assistants.
Several limitations should be noted. First, the study was a retrospective analysis of administrative data rather than a randomized trial, and although we employed a standard approach to adjust for a wide range of patient characteristics including severity of illness, there may have been undetected differences in the patient populations studied that may have confounded our results. Second, resident moonlighters admitted patients to the PACE service and, at other times, to the house staff services, and this may have diluted any differences between the groups. However, when we limited our analysis to the subgroup of patients admitted during the day, similar results were obtained, with the exception that the PACE service had a lower rate of 14‐day readmissions, an unexpected finding deserving of further study. Third, the study was conducted in a single academic institution and our findings may not be generalizable to others with different needs and resources; indeed, the costs associated with implementing such a service may be prohibitive for some institutions. Fourth, because of simultaneous changes that were taking place in our residency program, we are unable to accurately assess the impact of the PACE service on resident duty hours. However, resident duty hours did not increase over this time period on the general medicine service, and implementation of the service allowed for redistribution of house staff to other services and positions. Fifth, patient satisfaction data were obtained from responses to the mailed Press‐Ganey survey, to which there is a relatively low response rate. Also, we did not survey providers regarding their satisfaction with the service during the study period. Sixth, the study had limited power to detect clinically important differences in mortality and ICU transfers. Finally, this study is unable to compare this particular model of incorporating midlevel providers into general medical services with other models, only with traditional house staff services.
Future research should focus on determining the most effective and efficient ways to incorporate midlevel providers on academic general medicine services. One important question from the standpoint of house staff training is whether such services should be separate but equal, or should house staff gain experience during residency working with midlevel providers, since they are likely to encounter them in the future whether they stay in academics or not. Different models of care will likely have large implications for the quality and efficiency of patient care, house staff education and satisfaction, and physician assistant job satisfaction and turnover.
In summary, our study demonstrates that a geographically regionalized, multidisciplinary service staffed by hospitalists and physician assistants can be a safe alternative to house staff‐based services for the care of general medicine inpatients in an academic medical center.
- ,,,,,.The physician's assistant as resident on surgical service. An example of creative problem solving in surgical manpower.Arch Surg.1980;115:310–314.
- ,,,.Coronary arteriography performed by a physician assistant.Am J Cardiol.1987;60:784–787.
- .The specialized physician assistant: an alternative to the clinical cardiology trainee.Am J Cardiol.1987;60:901–902.
- ,,.One hospital's successful 20‐year experience with physician assistants in graduate medical education.Acad Med.1999;74:641–645.
- ,.Physicians assistants in cardiothoracic surgery: a 30‐year experience in a university center.Ann Thorac Surg.2006;81:195–199; discussion 199–200.
- ,,.Comparative review of use of physician assistants in a level I trauma center.Am Surg.2004;70:272–279.
- ,,,,.Integrating midlevel practitioners into a teaching service.Am J Surg.2006;192:119–124.
- ,.Acute care nurse practitioners: creating and implementing a model of care for an inpatient general medical service.Am J Crit Care.2002;11:448–458.
- ,,,,.Improving resource utilization in a teaching hospital: development of a nonteaching service for chest pain admissions.Acad Med.2006;81:432–435.
- ,,.Resource use by physician assistant services versus teaching services.JAAPA.2002;15:33–38.
- ,,, for the ACGME Work Group on Resident Duty Hours, Accreditation Council for Graduate Medical Education.New requirements for resident duty hours.JAMA.2002;288:1112–1114.
- ,,.The substitution of physician assistants and nurse practitioners for physician residents in teaching hospitals.Health Aff.1995;14:181–191.
- ,,,,.Challenges of the 80‐hour resident work rules: collaboration between surgeons and nonphysician practitioners.Surg Clin North Am.2004;84:1573–1586.
- ,,.Adapting a clinical comorbidity index for use with ICD‐9‐CM administrative databases.J Clin Epidemiol.1992;45:613–619.
Copyright © 2008 Society of Hospital Medicine
