User login
Regionalized Care and Adverse Events
Failures in communication among healthcare professionals are known threats to patient safety. These failures account for over 60% of root causes of sentinel events, the most serious events reported to The Joint Commission.[1] As such, identifying both patterns of effective communication as well as barriers to successful communication has been a focus of efforts aimed at improving patient safety. However, to date, the majority of this work has centered on improving communication in settings such as the operating room and intensive care unit,[2, 3, 4] or at times of care transitions.[5, 6, 7, 8]
Unique barriers exist for effective interdisciplinary communication in the hospital setting, particularly physiciannurse communication regarding shared hospitalized patients.[9] Traditionally, care of hospitalized patients is provided by physicians, nurses, and other team members working in varied workflow patterns, leading to dispersed team membership, where each team member cares for different groups of patients in different locations across the hospital. This dispersion is further heightened on teaching services, where residents' rotation schedules lead to frequent changes of care team membership, leaving inpatient care teams particularly vulnerable to ineffective communication. Evidence suggests that communication between nurses and physicians is currently suboptimal, leading to frequent disagreement regarding the patient's plan of care.[9, 10] This divergence between physician and nursing perceptions of patients' care plans may leave patients at greater risk of adverse events (AEs).
Several studies have examined the effects of regionalized inpatient care teams, where multidisciplinary team members care for the same patients on the same hospital unit, on communication and patient outcomes.[4, 11, 12, 13, 14] Results of these studies have been inconsistent, perhaps due to the particular characteristics of the care teams or to the study methodology. Thus, further rigorously done studies are required to better understand the impact of team regionalization on patient care. The goal of this study was to examine whether the implementation of regionalized inpatient care teams was associated with improvements in care team communication and preventable AEs.
METHODS
Setting, Patients, and Study Design
We performed a cohort analysis of patients at a 700‐bed tertiary care center, pre‐ and postregionalization of inpatient general medicine care teams. Our study protocol was approved by the Partners Healthcare Human Subjects Review Committee. Patients were eligible for inclusion if they were 18 years of age or older and discharged from the general medicine service (GMS) from any of the 3 participating nursing units between April 1, 2012 and June 19, 2012 (preregionalization) or April 1, 2013 and June 19, 2013 (postregionalization).
Intervention
On June 20, 2012, regionalized care was implemented on the GMS such that each of 3 GMS teams was localized to 1 of 3, 15‐bed nursing units. Prior to regionalization, the GMS physician care teams, each consisting of 1 hospitalist attending, 1 medical resident, and 2 medical interns, would care for patients on an average of 7 and up to 13 different nursing units on a given day.
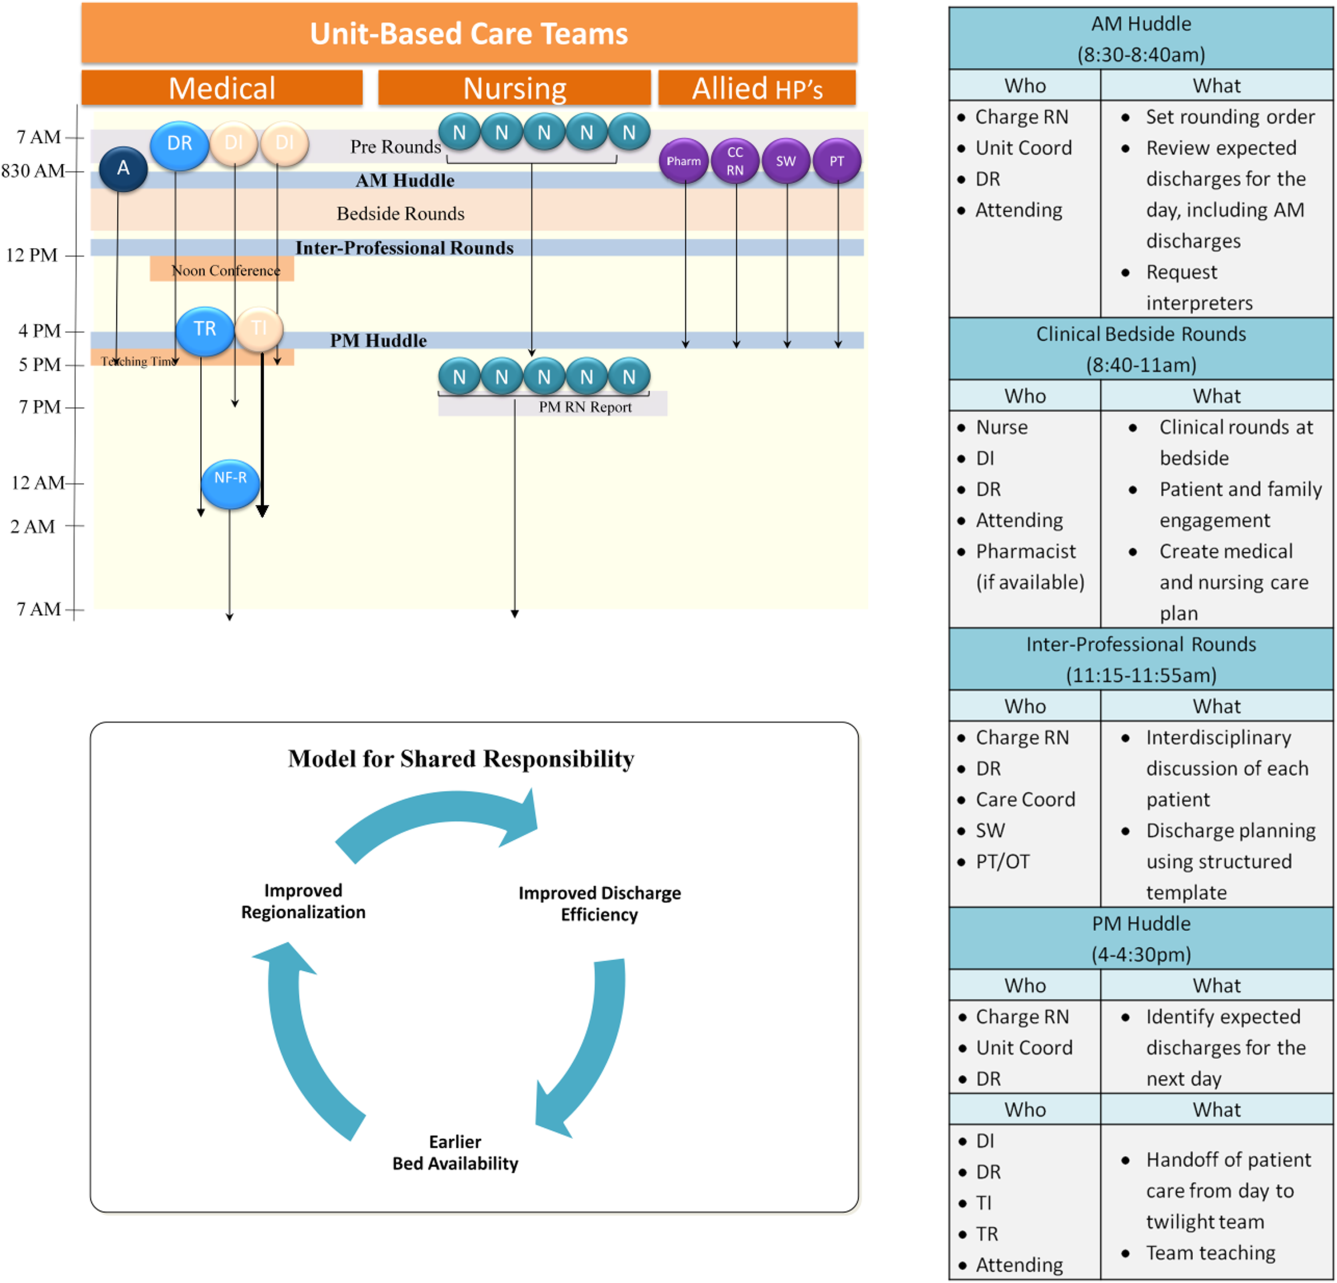
Regionalized care consisted of a multifaceted intervention codeveloped by hospitalist, residency, nursing, emergency department, and hospital leadership and included: (1) regionalizing GMS teams as much as possible; (2) change in resident call structure from a traditional 4‐day call cycle to daily admitting; (3) collaborative efforts to enhance GMS patient discharges before noon to promote regionalized placement of patients without prolonging time in the emergency department (ED); (4) daily morning and postround multidisciplinary huddles to prioritize sicker patients and discharges; (5) encouragement of daily rounds at patients' bedsides with presence of physician team, nurse, and team pharmacist if available; (6) creation of unit‐ and team‐level performance reports; and (7) creation of unit‐based physician and nursing co‐leadership (Figure 1).[15]
Concordance of Plan
Concordance of plan was measured via a 7‐question survey previously developed, pilot tested, and used to measure the impact of regionalized care on care team communication between inpatient nursephysician team members.[9] The survey was administered in‐person by 1 of 8 trained research assistants (RAs) (4/emntervention period) to nurse and intern pairs caring for patients on the study units pre‐ and postregionalization. GMS patients were eligible for inclusion if surveys could be administered to their nurse and intern within the first 24 hours of admission to the unit and within 48 hours of admission to the hospital, based on RA availability (thus excluding patients admitted on Fridays as surveys were not conducted over the weekend). Most often, all eligible patients admitted to the study units during time periods of data collection were included in the study. On limited occasions, the daily supply of patients surpassed RA capacity for inclusion, at which time computer‐generated randomization was utilized to randomly select patients for inclusion. Nurse and intern pairs were surveyed once during a patient's hospitalization, although they could be surveyed more than once about different patients, and patients could be included more than once if rehospitalized on the study unit and cared for by a different nurseintern pair. Of the 472 selected eligible patients, the nurses and interns of 418 patients were available and consented to survey administration, representing 361 unique nurse and intern pairs and 399 unique patients.
Each member of the pair was asked about 7 specific aspects of the patient's care plan for that day in isolation from the other team member, including: (1) the patient's primary diagnosis, (2) the patient's expressed chief concern, (3) the day's scheduled tests, (4) the day's scheduled procedures, (5) consulting services involved, (6) medication changes made that day, and (7) the patient's expected discharge date. In addition, each pair was asked the name of the other team member (ie, the nurse was asked the name of the intern and vice versa), and whether or not the patient care plan for the day had been discussed with the other team member, where concordance was defined as both members agreeing the plan had been discussed. All responses were recorded verbatim. Pairs were surveyed independently between 12 pm and 2 pm, limiting confounding by evolving plans of care over time.
Each set of surveys were then reviewed by 2 of 4 trained adjudicators, and responses to each question were scored as complete, partial, or no agreement. Rules for degree of agreement were based upon previously utilized parameters[9] as well as biweekly meetings during which common themes and disagreements in ratings were discussed, and rules generated to create consensus (see Supporting Information, Appendix, in the online version of this article).
Adverse Event Detection
Of the patients meeting eligibility criteria, 200 patients were randomly selected using computer‐generated randomization from each time period for AE outcome assessment, for a total of 400 patients.
Each patient's electronic medical record was retrospectively reviewed by a trained clinician using a previously validated screening tool to detect any possible AEs.[11] Any positive screen prompted documentation of a narrative summary including a short description of the possible AE and pertinent associated data. We defined AE as any injury due to medical management rather than the natural history of the illness, and further limited this definition to only include AEs that occurred on the study unit or as a result of care on that unit.
Two of 4 trained adjudicators, blinded to time period, then separately reviewed each narrative summary using previously validated 6‐point confidence scales to determine the presence and preventability of AE, with confidence ratings of 4 or greater used as cutoffs.[11] All AEs were also scored on a 4‐point severity scale (trivial, clinically significant, serious, or life threatening), with severe AE defined as serious or life threatening. Lastly, adjudicators grouped AEs into 1 of 10 prespecified categories.[11] Any disagreements in ratings or groupings were discussed by all 4 adjudicators to reach consensus.
Data Analysis
Patient characteristics are presented using descriptive statistics and were compared in the pre‐ and postregionalization time periods using 2 or t tests as appropriate.
To analyze whether regionalized care was associated with concordance of plan, adjudicated survey questions were assigned points of 1, 0.5, and 0 for complete, partial, and no agreement, respectively. Total mean concordance scores for any patient ranged from 0 to 7 points, and were divided by total number of answered questions (up to 7) for a range of 0 to 1. Total mean concordance scores as well as mean concordance score per survey question were compared pre‐ versus postregionalization using t tests. In sensitivity analyses, adjudicated survey responses were dichotomized with complete and partial agreement deemed concordant responses. Percent concordance for each question was then compared pre‐ versus postregionalization using 2 analysis. Questions about the name of the other team member and discussion of daily care plan with the other team member were excluded from total concordance score calculations and were compared individually pre‐ versus postregionalization, because they are not directly about the plan of care.
To analyze the association of regionalization with odds of preventable AE, we performed multivariable logistic regression adjusted for patient age, sex, race, language, and Elixhauser comorbidity score,[16] and utilized generalized estimating equations to account for clustering by hospital unit. Secondary outcomes included severe preventable AEs, nonpreventable AEs, and category of preventable AEs using similar methodology. Two‐sided P values <0.05 were considered significant, and SAS version 9.2 (SAS Institute Inc., Cary, NC) was used for all analyses.
RESULTS
The fidelity of the intervention in achieving its goal of regionalized care is discussed separately.[15] Briefly, the intervention was successful at achieving 85% regionalization by team (ie, average daily percentage of team's patients assigned to team's unit) and 87% regionalization by unit (ie, average daily percentage of unit's patients with assigned team) following implementation, compared to 20% regionalization by team and unit in the preintervention period. Importantly, the average daily census of physician care teams rose by 32%, from a mean of 10.8 patients/physician care team preregionalization to a mean of 14.3 patients/physician care team postregionalization.
Concordance of Plan
Of the 418 nurse and intern paired surveys, 4 surveys were excluded due to repeat surveys of the same patient during the same hospitalization, for a total of 197 distinct paired surveys preregionalization and 217 paired surveys postregionalization. There were no statistically significant differences in patients' age, sex, race, language, admission source, length of stay, Elixhauser comorbidity score and diagnosis‐related group weight pre‐ versus postregionalization (Table 1).
| Characteristic | Concordance of Care Plan | Adverse Events | ||||
|---|---|---|---|---|---|---|
| Pre, n = 197 | Post, n = 217 | P Value | Pre, n = 198 | Post, n = 194 | P Value | |
| ||||||
| Age, mean (SD) | 60.5 (19.4) | 57.6 (20.8) | 0.15 | 60.4 (18.9) | 58.0 (21.2) | 0.24 |
| Male, n (%) | 77 (39.1) | 92 (42.4) | 0.49 | 94 (47.5) | 85 (43.8) | 0.55 |
| Race/ethnicity, n (%) | 0.34 | 0.12 | ||||
| White | 134 (68.0) | 141 (65.0) | 132 (66.5) | 121 (62.4) | ||
| Black | 42 (21.3) | 45 (20.7) | 41 (20.8) | 54 (27.8) | ||
| Hispanic | 18 (9.1) | 21 (9.7) | 22 (11.3) | 13 (6.8) | ||
| Other/unknown | 3 (1.5) | 10 (4.6) | 3 (1.4) | 6 (2.9) | ||
| Language, n (%) | 0.30 | 0.73 | ||||
| English | 183 (92.9) | 203 (93.5) | 176 (88.7) | 175 (90.2) | ||
| Spanish | 6 (3.0) | 10 (4.6) | 10 (5.2) | 10 (5.3) | ||
| Other | 8 (4.1) | 4 (1.8) | 12 (6.1) | 9 (4.5) | ||
| Admitting source, n (%) | 1.00 | 0.10 | ||||
| Physician office | 13 (6.6) | 13 (6.0) | 13 (6.6) | 6 (3.1) | ||
| Emergency department | 136 (69.0) | 150 (69.1) | 126 (63.6) | 127 (65.5) | ||
| Transfer from different hospital | 40 (20.3) | 45 (20.7) | 54 (27.3) | 50 (25.8) | ||
| Transfer from skilled nursing facility | 8 (4.1) | 9 (4.2) | 5 (2.5) | 11 (5.6) | ||
| Length of stay, d, median (IQR) | 3.0 (4.0) | 3.0 (4.0) | 0.57 | 4.0 (5.0) | 3.0 (4.0) | 0.16 |
| Elixhauser Comorbidity Score, mean (SD) | 8.0 (8.8) | 8.3 (9.3) | 0.74 | 8.0 (8.6) | 7.8 (8.4) | 0.86 |
| DRG weight, mean (SD) | 1.6 (1.0) | 1.5 (1.0) | 0.37 | 1.5 (0.93) | 1.5 (1.1) | 0.96 |
Kappa scores for adjudications of concordance surveys (defined as both adjudicators scoring the same level of agreement (ie, both complete or partial agreement versus no agreement) ranged from 0.69 to 0.95, by question. There were no significant differences in total mean concordance scores in the care plan pre‐ versus postregionalization (0.65 vs 0.67, P = 0.26) (Table 2). Similarly, there were no significant differences in mean concordance score for each survey question, except agreement on expected date of discharge (0.56 vs 0.68, P = 0.003), knowledge of the other provider's name, and agreement that discussion of the daily plan had taken place with the other pair member. Similar results were seen when results were dichotomized (ie, partial or complete agreement vs no agreement) (Table 2).
| Concordance Outcome | Pre, n = 197 | Post, n = 217 | P Value |
|---|---|---|---|
| |||
| Concordance score* | |||
| Total concordance score, mean (SD) | 0.65 (0.17) | 0.67 (0.16) | 0.26 |
| Subgroups | |||
| Diagnosis | 0.77 (0.32) | 0.72 (0.35) | 0.11 |
| Patient's chief concern | 0.48 (0.44) | 0.48 (0.43) | 0.94 |
| Tests today | 0.67 (0.40) | 0.71 (0.42) | 0.36 |
| Procedures today | 0.93 (0.25) | 0.92 (0.25) | 0.71 |
| Medication changes today | 0.56 (0.44) | 0.59 (0.43) | 0.54 |
| Consulting services | 0.59 (0.44) | 0.60 (0.44) | 0.82 |
| Expected discharge date | 0.56 (0.44) | 0.68 (0.38) | 0.003 |
| Responding clinician knowledge of nurse's name | 0.56 (0.50) | 0.86 (0.35) | <0.001 |
| Nurse's knowledge of responding clinician's name | 0.56 (0.50) | 0.88 (0.33) | <0.001 |
| Plan discussed | 0.73 (0.45) | 0.88 (0.32) | <0.001 |
| Percent concordance, mean (SD) | |||
| Diagnosis | 92.0 (27.3) | 88.6 (31.9) | 0.25 |
| Patient's chief concern | 59.6 (49.1) | 60.6 (49.0) | 0.84 |
| Tests today | 78.9 (40.9) | 77.2 (42.1) | 0.67 |
| Procedures today | 93.5 (24.8) | 94.1 (23.7) | 0.80 |
| Medication changes today | 66.3 (33.6) | 69.9 (46.0) | 0.44 |
| Consulting services | 69.3 (46.2) | 68.9 (46.4) | 0.93 |
| Expected discharge date | 67.5 (47.0) | 82.6 (38.0) | <0.001 |
| Responding clinician knowledge of nurse's name | 55.7 (49.8) | 85.6 (35.2) | <0.001 |
| Nurse's knowledge of responding clinician's name | 55.9 (49.8) | 87.9 (32.8) | <0.001 |
| Plan discussed | 72.9 (44.6) | 88.2 (32.3) | <0.001 |
Adverse Events
Of the 400 patients screened for AEs, 8 were excluded due to missing medical record number (5) and discharge outside of study period (3). Of the final 392 patient screens (198 pre, 194 post), there were no significant differences in patients' age, sex, race, language, length of stay, or Elixhauser score pre‐ versus postregionalization (Table 1).
Kappa scores for adjudicator agreement were 0.35 for presence of AE and 0.34 for preventability of AE. Of the 392 reviewed patient records, there were 133 total AEs detected (66 pre, 67 post), 27 preventable AEs (13 pre, 14 post), and 9 severe preventable AEs (4 pre, 5 post) (Table 3). There was no significant difference in the adjusted odds of preventable AEs post‐ versus preregionalization (adjusted odds ratio: 1.37, 95% confidence interval: 0.69, 2.69). Although the low number of AEs rated as severe or life threatening precluded adjusted analysis, unadjusted results similarly demonstrated no difference in odds of severe preventable AEs pre‐ versus postregionalization. As expected, there was no significant difference in adjusted odds of nonpreventable AE after implementation of regionalized care (Table 3).
| Adverse Events | No. of Adverse Events | Adjusted Odds Ratio Post vs Pre (95% CI) | |
|---|---|---|---|
| Pre, n = 198 | Post, n = 194 | ||
| |||
| Preventable | 13 | 14 | 1.37 (0.69, 2.69) |
| Serious and preventable | 4 | 5 | |
| Nonpreventable | 47 | 50 | 1.20 (0.85, 1.75) |
Similarly, there were no significant differences in category of preventable AE pre‐ versus postregionalization. The most frequent preventable AEs in both time periods were those related to adverse drug events and to manifestations of poor glycemic control, examples of which are illustrated (Table 4).
| |
| Adverse drug event | 29‐year‐old male with history of alcohol abuse, complicated by prior withdrawal seizures/emntensive care unit admissions, presented with alcohol withdrawal. Started on standing and PRN lorazepam, kept on home medications including standing clonidine, gabapentin, citalopram, quetiapine. Became somnolent due to polypharmacy, ultimately discontinued quetiapine as discovered took only as needed at home for insomnia |
| Manifestations of poor glycemic control | 78‐year‐old male with recently diagnosed lymphoma, distant history of bladder and prostate cancer status post ileal loop diversion, presented status post syncopal event; during event, spilled boiling water on himself leading to second‐degree burns on 3% of his body. Initially admitted to trauma/burn service, ultimately transferred to medical service for ongoing multiple medical issues including obstructive uropathy, acute on chronic renal failure. Adverse event was hyperglycemia (>350 mg/dL on >2 consecutive readings) in the setting of holding his home insulin detemir and insulin aspart (had been placed on insulin aspart sliding scale alone). After hyperglycemic episodes, was placed back on weight‐based basal/nutritional insulin |
DISCUSSION
In this study of general medicine patients at a large academic medical center, we found that regionalization of care teams on general medicine services was associated with improved recognition of care team members and agreement on estimated date of patient discharge, but was not associated with improvement in overall nurse and physician concordance of the patient care plan, or the odds of preventable AEs.
This intervention importantly addresses the barrier of dispersion of team membership, a well‐recognized barrier to interdisciplinary collaboration,[17, 18] particularly with resident physician teams due to frequently changing team membership. Localization of all team members, in addition to encouragement of daily collaborative bedside rounds as part of the regionalization initiative, likely contributed to our observed improvement in team member identification and discussion of daily care plans. Similarly, regionalization resulted in improved agreement in estimations of date of patient discharge. Focus on early patient discharges was an integral part of the implementation efforts; we therefore hypothesize that mutual focus on discharge planning by both nurses and responding clinicians may have explained this observed result.
On the other hand, regionalization did not appreciably improve the overall concordance of care plan between nurses and interns, despite a significant increase in team members agreeing that the plan had been discussed. Our findings support similar prior research demonstrating that regionalizing hospitalist attendings to single nursing units had limited impact on agreement of care plan between physicians and nurses.[13] Similarly, in settings where physicians and nurses are inherently regionalized, such as the intensive care unit[4] or the operating room,[3] communication between physicians and nurses remains difficult. Collectively, our findings suggest that colocalization of physicians and nurses alone is likely insufficient to improve measured communication between care team members. Existing literature suggests that more standardized approaches to improve communication, such as structured communication tools used during daily inpatient care[19, 20] or formalized team training,[21, 22, 23] lead to improvements in communication and collaboration. Despite these findings, it is important to highlight that this study did not assess other measures of workplace culture, such as teamwork and care team cohesiveness, which may have been positively affected by this intervention, even without measurable effect on concordance of care plan. Additionally, as noted, the average daily census on each team increased by almost a third postintervention, which may have impeded improvements in care team communication.
In addition, we found that our intervention had no significant impact on preventable AEs or severe preventable AEs. Although we cannot exclude the possibility that more subtle AEs were missed with our methodology, our results indicate that regionalized care alone may be inadequate to improve major patient safety outcomes. As discussed, the volume of patients did increase postintervention; thus, another way to state our results is that we were able to increase the daily volume of patients without any significant decreases in patient safety. Nevertheless, the results on patient safety were less than desired. A recent review of interdisciplinary team care interventions on general medical wards similarly demonstrated underwhelming improvements in patient safety outcomes, although the reviewed interventions did not specifically address preventable AEs, a gap in the literature commented on by the authors.[24] Other albeit limited literature has demonstrated improvement in patient safety outcomes via multifaceted efforts aimed at improving care team member communication. Notably, these efforts include colocalization of care team members to single units but also involve additional measures to improve communication and collaboration between care team members, such as structured communication during interdisciplinary rounds, and certification of key interdisciplinary teamwork skills.[11, 14] Although our regionalized care intervention included many similar features to these accountable care units (ACUs) including unit‐based care teams, unit‐level performance reporting, and unit‐based physician and nursing coleadership, significant differences existed. Notably, in addition to the above features, the ACU model also incorporated highly structured communication models for interdisciplinary rounding, and certification processes to ensure an appropriate communication skill base among care team members.[14] Thus, although creation of regionalized care teams is likely a necessary precursor to implementation of these additional measures, alone it may be insufficient to improve patient safety outcomes.
Importantly, in our study we identified that adverse drug events and manifestations of poor glycemic control occurred in high frequency both before and following implementation of regionalized care, supporting other literature that describes the prevalence of these AEs.[11, 25, 26, 27] These results suggest that targeted interventions to address these specific AEs are likely necessary. Notably, the intervention units in our study did not consistently employ clinical pharmacists assigned specifically to that unit's care team to allow for integration within the care team. As prior research has suggested that greater collaboration with clinical pharmacists results in reduction of adverse drug events,[28] next steps may include improved integration of team‐based pharmacists into the activities of the regionalized care teams. Inpatient management of diabetes also requires specific interventions,[29, 30, 31] only some of which may be addressable by having regionalized care and better interdisciplinary communication.
Our findings are subject to several limitations. First, this was a single‐site study and thus our findings may not be generalizable to other institutions. However, regionalized care is increasingly encouraged to optimize communication between care team members.[17, 18] Therefore, our null findings may be pertinent to other institutions looking to improve patient safety outcomes, demonstrating that additional initiatives will likely be required. Second, our modes of outcome measurement possess limitations. In measuring concordance of care plan, although previously used survey techniques were employed,[9] the concordance survey has not been formally validated, and we believe some of the questions may have led to ambiguity on the part of the responders that may have resulted in less accurate responses, thus biasing toward the null. Similarly, in measuring AEs, the screening tool relied on retrospective chart review looking for specific AE types[11] and thus may not have captured more subtle AEs. Additionally, our study may have been underpowered to demonstrate significant reduction in preventable AEs, although other studies of similar methodology demonstrated significant results with similar sample size.[11] This was due in part to our lower‐than‐expected baseline AE rate (6.6% compared with approximately 10.3% in previous studies).[11] Lastly, our study solely examined the association of regionalization with concordance of care plan and preventable AEs, but importantly excluded other clinically important outcomes that may have been positively (or negatively) impacted by these regionalization efforts, such as ED wait times, provider efficiency (eg, fewer pages, less time in transit, more time at the bedside), interdisciplinary teamwork, or patient or provider satisfaction.
CONCLUSION
In summary, our findings suggest that regionalized care teams alone may be insufficient to effectively promote communication between care team members regarding the care plan or to lead to improvements in patient safety, although we recognize that there may have been benefits (or unintended harms) not measured in this study but are nonetheless important for clinical care and workplace culture. This is an important lesson, as many hospitals move toward regionalized care in an effort to improve patient safety outcomes. However, strengthening the infrastructure by colocalizing care team members to maximize opportunity for communication is likely a necessary first step toward facilitating implementation of additional initiatives that may lead to more robust patient safety improvements, such as structured interdisciplinary bedside rounds (eg, facilitating and training all team members to fulfill specific roles), teamwork training, and certification of key interdisciplinary teamwork skills. Additionally, close examination of identified prevalent and preventable AEs can help to determine which additional initiatives are most likely to have greatest impact in improving patient safety.
Disclosures: This research was supported by funds provided by Brigham and Women's Hospital (BWH) and by funds provided by the Department of Medicine at BWH. All authors had full access to all of the data in the study and were integrally involved in the design, implementation, data collection, and analyses. The first author, Dr. Stephanie Mueller, takes responsibility for the integrity for the data and the accuracy of the data analysis. Dr. Schnipper reports grants from Sanofi Aventis, outside the submitted work.
- Joint Commission on Accreditation of Healthcare Organizations. Understanding and Preventing Sentinel Events in Your Health Care Organization. Oak Brook, IL: Joint Commission; 2008.
- , , , et al. Communication failures in the operating room: an observational classification of recurrent types and effects. Qual Saf Health Care. 2004;13(5):330–334.
- , , , et al. Operating room teamwork among physicians and nurses: teamwork in the eye of the beholder. J Am Coll Surg. 2006;202(5):746–752.
- , , . Discrepant attitudes about teamwork among critical care nurses and physicians. Crit Care Med. 2003;31(3):956–959.
- , , , , . Communication failures in patient sign‐out and suggestions for improvement: a critical incident analysis. Qual Saf Health Care. 2005;14(6):401–407.
- , , , et al. Changes in medical errors after implementation of a handoff program. N Engl J Med. 2014;371(19):1803–1812.
- , , , et al. Communication and information deficits in patients discharged to rehabilitation facilities: an evaluation of five acute care hospitals. J Hosp Med. 2009;4(8):E28–E33.
- , , , , , . Deficits in communication and information transfer between hospital‐based and primary care physicians: implications for patient safety and continuity of care. JAMA. 2007;297(8):831–841.
- , , , et al. Patterns of nurse‐physician communication and agreement on the plan of care. Qual Saf Health Care. 2010;19(3):195–199.
- , , , , , . Can we talk? Priorities for patient care differed among health care providers. In: Henriksen K, Battles JB, Marks ES, Lewin DI, eds. Advances in Patient Safety: From Research to Implementation. Vol 1. Rockville, MD: Agency for Healthcare Research and Quality; 2005.
- , , , et al. Structured interdisciplinary rounds in a medical teaching unit: improving patient safety. Arch Intern Med. 2011;171(7):678–684.
- , , , , , . Improving teamwork: impact of structured interdisciplinary rounds on a hospitalist unit. J Hosp Med. 2011;6(2):88–93.
- , , , et al. Impact of localizing physicians to hospital units on nurse‐physician communication and agreement on the plan of care. J Gen Intern Med. 2009;24(11):1223–1227.
- , , , et al. Reorganizing a hospital ward as an accountable care unit. J Hosp Med. 2015;10(1):36–40.
- , , , et al. 5th time's a charm: creation of unit‐based care teams in a high occupancy hospital [abstract]. J Hosp Med. 2015;10 (suppl. 2). Available at: http://www.shmabstracts.com/abstract/5th‐times‐a‐charm‐creation‐of‐unit‐based‐care‐teams‐in‐a‐high‐occupancy‐hospital. Accessed July 28, 2015.
- , , , . Comorbidity measures for use with administrative data. Med Care. 1998;36(1):8–27.
- , , , , , . Teamwork on inpatient medical units: assessing attitudes and barriers. Qual Saf Health Care. 2010;19(2):117–121.
- , , , et al. A model for quality improvement programs in academic departments of medicine. Am J Med. 2008;121(10):922–929.
- , , , , . Improving nurse‐physician communication and satisfaction in the intensive care unit with a daily goals worksheet. Am J Crit Care. 2006;15(2):217–222.
- , , , , , . Improving communication in the ICU using daily goals. J Crit Care. 2003;18(2):71–75.
- , , , et al. Effect of crew resource management training in a multidisciplinary obstetrical setting. Int J Qual Health Care. 2008;20(4):254–263.
- , , , et al. Error reduction and performance improvement in the emergency department through formal teamwork training: evaluation results of the MedTeams project. Health Serv Res. 2002;37(6):1553–1581.
- , , , et al. Effects of teamwork training on adverse outcomes and process of care in labor and delivery: a randomized controlled trial. Obstet Gynecol. 2007;109(1):48–55.
- , , , et al. Effects of interdisciplinary team care interventions on general medical wards: a systematic review. JAMA Intern Med. 2015;175(8):1288–1298.
- , , , et al. Patient risk factors for adverse drug events in hospitalized patients. ADE Prevention Study Group. Arch Intern Med. 1999;159(21):2553–2560.
- , , , et al. Effect of a pharmacist intervention on clinically important medication errors after hospital discharge: a randomized trial. Ann Intern Med. 2012;157(1):1–10.
- , , , . Use of a standardized protocol to decrease medication errors and adverse events related to sliding scale insulin. Qual Saf Health Care. 2006;15(2):89–91.
- , , , . Clinical pharmacists and inpatient medical care: a systematic review. Arch Intern Med. 2006;166(9):955–964.
- , , , , . Improved inpatient use of basal insulin, reduced hypoglycemia, and improved glycemic control: effect of structured subcutaneous insulin orders and an insulin management algorithm. J Hosp Med. 2009;4(1):3–15.
- , , , . Effects of a computerized order set on the inpatient management of hyperglycemia: a cluster‐randomized controlled trial. Endocr Pract. 2010;16(2):209–218.
- , , , . Effects of a subcutaneous insulin protocol, clinical education, and computerized order set on the quality of inpatient management of hyperglycemia: results of a clinical trial. J Hosp Med. 2009;4(1):16–27.
Failures in communication among healthcare professionals are known threats to patient safety. These failures account for over 60% of root causes of sentinel events, the most serious events reported to The Joint Commission.[1] As such, identifying both patterns of effective communication as well as barriers to successful communication has been a focus of efforts aimed at improving patient safety. However, to date, the majority of this work has centered on improving communication in settings such as the operating room and intensive care unit,[2, 3, 4] or at times of care transitions.[5, 6, 7, 8]
Unique barriers exist for effective interdisciplinary communication in the hospital setting, particularly physiciannurse communication regarding shared hospitalized patients.[9] Traditionally, care of hospitalized patients is provided by physicians, nurses, and other team members working in varied workflow patterns, leading to dispersed team membership, where each team member cares for different groups of patients in different locations across the hospital. This dispersion is further heightened on teaching services, where residents' rotation schedules lead to frequent changes of care team membership, leaving inpatient care teams particularly vulnerable to ineffective communication. Evidence suggests that communication between nurses and physicians is currently suboptimal, leading to frequent disagreement regarding the patient's plan of care.[9, 10] This divergence between physician and nursing perceptions of patients' care plans may leave patients at greater risk of adverse events (AEs).
Several studies have examined the effects of regionalized inpatient care teams, where multidisciplinary team members care for the same patients on the same hospital unit, on communication and patient outcomes.[4, 11, 12, 13, 14] Results of these studies have been inconsistent, perhaps due to the particular characteristics of the care teams or to the study methodology. Thus, further rigorously done studies are required to better understand the impact of team regionalization on patient care. The goal of this study was to examine whether the implementation of regionalized inpatient care teams was associated with improvements in care team communication and preventable AEs.
METHODS
Setting, Patients, and Study Design
We performed a cohort analysis of patients at a 700‐bed tertiary care center, pre‐ and postregionalization of inpatient general medicine care teams. Our study protocol was approved by the Partners Healthcare Human Subjects Review Committee. Patients were eligible for inclusion if they were 18 years of age or older and discharged from the general medicine service (GMS) from any of the 3 participating nursing units between April 1, 2012 and June 19, 2012 (preregionalization) or April 1, 2013 and June 19, 2013 (postregionalization).
Intervention
On June 20, 2012, regionalized care was implemented on the GMS such that each of 3 GMS teams was localized to 1 of 3, 15‐bed nursing units. Prior to regionalization, the GMS physician care teams, each consisting of 1 hospitalist attending, 1 medical resident, and 2 medical interns, would care for patients on an average of 7 and up to 13 different nursing units on a given day.
Regionalized care consisted of a multifaceted intervention codeveloped by hospitalist, residency, nursing, emergency department, and hospital leadership and included: (1) regionalizing GMS teams as much as possible; (2) change in resident call structure from a traditional 4‐day call cycle to daily admitting; (3) collaborative efforts to enhance GMS patient discharges before noon to promote regionalized placement of patients without prolonging time in the emergency department (ED); (4) daily morning and postround multidisciplinary huddles to prioritize sicker patients and discharges; (5) encouragement of daily rounds at patients' bedsides with presence of physician team, nurse, and team pharmacist if available; (6) creation of unit‐ and team‐level performance reports; and (7) creation of unit‐based physician and nursing co‐leadership (Figure 1).[15]
Concordance of Plan
Concordance of plan was measured via a 7‐question survey previously developed, pilot tested, and used to measure the impact of regionalized care on care team communication between inpatient nursephysician team members.[9] The survey was administered in‐person by 1 of 8 trained research assistants (RAs) (4/emntervention period) to nurse and intern pairs caring for patients on the study units pre‐ and postregionalization. GMS patients were eligible for inclusion if surveys could be administered to their nurse and intern within the first 24 hours of admission to the unit and within 48 hours of admission to the hospital, based on RA availability (thus excluding patients admitted on Fridays as surveys were not conducted over the weekend). Most often, all eligible patients admitted to the study units during time periods of data collection were included in the study. On limited occasions, the daily supply of patients surpassed RA capacity for inclusion, at which time computer‐generated randomization was utilized to randomly select patients for inclusion. Nurse and intern pairs were surveyed once during a patient's hospitalization, although they could be surveyed more than once about different patients, and patients could be included more than once if rehospitalized on the study unit and cared for by a different nurseintern pair. Of the 472 selected eligible patients, the nurses and interns of 418 patients were available and consented to survey administration, representing 361 unique nurse and intern pairs and 399 unique patients.
Each member of the pair was asked about 7 specific aspects of the patient's care plan for that day in isolation from the other team member, including: (1) the patient's primary diagnosis, (2) the patient's expressed chief concern, (3) the day's scheduled tests, (4) the day's scheduled procedures, (5) consulting services involved, (6) medication changes made that day, and (7) the patient's expected discharge date. In addition, each pair was asked the name of the other team member (ie, the nurse was asked the name of the intern and vice versa), and whether or not the patient care plan for the day had been discussed with the other team member, where concordance was defined as both members agreeing the plan had been discussed. All responses were recorded verbatim. Pairs were surveyed independently between 12 pm and 2 pm, limiting confounding by evolving plans of care over time.
Each set of surveys were then reviewed by 2 of 4 trained adjudicators, and responses to each question were scored as complete, partial, or no agreement. Rules for degree of agreement were based upon previously utilized parameters[9] as well as biweekly meetings during which common themes and disagreements in ratings were discussed, and rules generated to create consensus (see Supporting Information, Appendix, in the online version of this article).
Adverse Event Detection
Of the patients meeting eligibility criteria, 200 patients were randomly selected using computer‐generated randomization from each time period for AE outcome assessment, for a total of 400 patients.
Each patient's electronic medical record was retrospectively reviewed by a trained clinician using a previously validated screening tool to detect any possible AEs.[11] Any positive screen prompted documentation of a narrative summary including a short description of the possible AE and pertinent associated data. We defined AE as any injury due to medical management rather than the natural history of the illness, and further limited this definition to only include AEs that occurred on the study unit or as a result of care on that unit.
Two of 4 trained adjudicators, blinded to time period, then separately reviewed each narrative summary using previously validated 6‐point confidence scales to determine the presence and preventability of AE, with confidence ratings of 4 or greater used as cutoffs.[11] All AEs were also scored on a 4‐point severity scale (trivial, clinically significant, serious, or life threatening), with severe AE defined as serious or life threatening. Lastly, adjudicators grouped AEs into 1 of 10 prespecified categories.[11] Any disagreements in ratings or groupings were discussed by all 4 adjudicators to reach consensus.
Data Analysis
Patient characteristics are presented using descriptive statistics and were compared in the pre‐ and postregionalization time periods using 2 or t tests as appropriate.
To analyze whether regionalized care was associated with concordance of plan, adjudicated survey questions were assigned points of 1, 0.5, and 0 for complete, partial, and no agreement, respectively. Total mean concordance scores for any patient ranged from 0 to 7 points, and were divided by total number of answered questions (up to 7) for a range of 0 to 1. Total mean concordance scores as well as mean concordance score per survey question were compared pre‐ versus postregionalization using t tests. In sensitivity analyses, adjudicated survey responses were dichotomized with complete and partial agreement deemed concordant responses. Percent concordance for each question was then compared pre‐ versus postregionalization using 2 analysis. Questions about the name of the other team member and discussion of daily care plan with the other team member were excluded from total concordance score calculations and were compared individually pre‐ versus postregionalization, because they are not directly about the plan of care.
To analyze the association of regionalization with odds of preventable AE, we performed multivariable logistic regression adjusted for patient age, sex, race, language, and Elixhauser comorbidity score,[16] and utilized generalized estimating equations to account for clustering by hospital unit. Secondary outcomes included severe preventable AEs, nonpreventable AEs, and category of preventable AEs using similar methodology. Two‐sided P values <0.05 were considered significant, and SAS version 9.2 (SAS Institute Inc., Cary, NC) was used for all analyses.
RESULTS
The fidelity of the intervention in achieving its goal of regionalized care is discussed separately.[15] Briefly, the intervention was successful at achieving 85% regionalization by team (ie, average daily percentage of team's patients assigned to team's unit) and 87% regionalization by unit (ie, average daily percentage of unit's patients with assigned team) following implementation, compared to 20% regionalization by team and unit in the preintervention period. Importantly, the average daily census of physician care teams rose by 32%, from a mean of 10.8 patients/physician care team preregionalization to a mean of 14.3 patients/physician care team postregionalization.
Concordance of Plan
Of the 418 nurse and intern paired surveys, 4 surveys were excluded due to repeat surveys of the same patient during the same hospitalization, for a total of 197 distinct paired surveys preregionalization and 217 paired surveys postregionalization. There were no statistically significant differences in patients' age, sex, race, language, admission source, length of stay, Elixhauser comorbidity score and diagnosis‐related group weight pre‐ versus postregionalization (Table 1).
| Characteristic | Concordance of Care Plan | Adverse Events | ||||
|---|---|---|---|---|---|---|
| Pre, n = 197 | Post, n = 217 | P Value | Pre, n = 198 | Post, n = 194 | P Value | |
| ||||||
| Age, mean (SD) | 60.5 (19.4) | 57.6 (20.8) | 0.15 | 60.4 (18.9) | 58.0 (21.2) | 0.24 |
| Male, n (%) | 77 (39.1) | 92 (42.4) | 0.49 | 94 (47.5) | 85 (43.8) | 0.55 |
| Race/ethnicity, n (%) | 0.34 | 0.12 | ||||
| White | 134 (68.0) | 141 (65.0) | 132 (66.5) | 121 (62.4) | ||
| Black | 42 (21.3) | 45 (20.7) | 41 (20.8) | 54 (27.8) | ||
| Hispanic | 18 (9.1) | 21 (9.7) | 22 (11.3) | 13 (6.8) | ||
| Other/unknown | 3 (1.5) | 10 (4.6) | 3 (1.4) | 6 (2.9) | ||
| Language, n (%) | 0.30 | 0.73 | ||||
| English | 183 (92.9) | 203 (93.5) | 176 (88.7) | 175 (90.2) | ||
| Spanish | 6 (3.0) | 10 (4.6) | 10 (5.2) | 10 (5.3) | ||
| Other | 8 (4.1) | 4 (1.8) | 12 (6.1) | 9 (4.5) | ||
| Admitting source, n (%) | 1.00 | 0.10 | ||||
| Physician office | 13 (6.6) | 13 (6.0) | 13 (6.6) | 6 (3.1) | ||
| Emergency department | 136 (69.0) | 150 (69.1) | 126 (63.6) | 127 (65.5) | ||
| Transfer from different hospital | 40 (20.3) | 45 (20.7) | 54 (27.3) | 50 (25.8) | ||
| Transfer from skilled nursing facility | 8 (4.1) | 9 (4.2) | 5 (2.5) | 11 (5.6) | ||
| Length of stay, d, median (IQR) | 3.0 (4.0) | 3.0 (4.0) | 0.57 | 4.0 (5.0) | 3.0 (4.0) | 0.16 |
| Elixhauser Comorbidity Score, mean (SD) | 8.0 (8.8) | 8.3 (9.3) | 0.74 | 8.0 (8.6) | 7.8 (8.4) | 0.86 |
| DRG weight, mean (SD) | 1.6 (1.0) | 1.5 (1.0) | 0.37 | 1.5 (0.93) | 1.5 (1.1) | 0.96 |
Kappa scores for adjudications of concordance surveys (defined as both adjudicators scoring the same level of agreement (ie, both complete or partial agreement versus no agreement) ranged from 0.69 to 0.95, by question. There were no significant differences in total mean concordance scores in the care plan pre‐ versus postregionalization (0.65 vs 0.67, P = 0.26) (Table 2). Similarly, there were no significant differences in mean concordance score for each survey question, except agreement on expected date of discharge (0.56 vs 0.68, P = 0.003), knowledge of the other provider's name, and agreement that discussion of the daily plan had taken place with the other pair member. Similar results were seen when results were dichotomized (ie, partial or complete agreement vs no agreement) (Table 2).
| Concordance Outcome | Pre, n = 197 | Post, n = 217 | P Value |
|---|---|---|---|
| |||
| Concordance score* | |||
| Total concordance score, mean (SD) | 0.65 (0.17) | 0.67 (0.16) | 0.26 |
| Subgroups | |||
| Diagnosis | 0.77 (0.32) | 0.72 (0.35) | 0.11 |
| Patient's chief concern | 0.48 (0.44) | 0.48 (0.43) | 0.94 |
| Tests today | 0.67 (0.40) | 0.71 (0.42) | 0.36 |
| Procedures today | 0.93 (0.25) | 0.92 (0.25) | 0.71 |
| Medication changes today | 0.56 (0.44) | 0.59 (0.43) | 0.54 |
| Consulting services | 0.59 (0.44) | 0.60 (0.44) | 0.82 |
| Expected discharge date | 0.56 (0.44) | 0.68 (0.38) | 0.003 |
| Responding clinician knowledge of nurse's name | 0.56 (0.50) | 0.86 (0.35) | <0.001 |
| Nurse's knowledge of responding clinician's name | 0.56 (0.50) | 0.88 (0.33) | <0.001 |
| Plan discussed | 0.73 (0.45) | 0.88 (0.32) | <0.001 |
| Percent concordance, mean (SD) | |||
| Diagnosis | 92.0 (27.3) | 88.6 (31.9) | 0.25 |
| Patient's chief concern | 59.6 (49.1) | 60.6 (49.0) | 0.84 |
| Tests today | 78.9 (40.9) | 77.2 (42.1) | 0.67 |
| Procedures today | 93.5 (24.8) | 94.1 (23.7) | 0.80 |
| Medication changes today | 66.3 (33.6) | 69.9 (46.0) | 0.44 |
| Consulting services | 69.3 (46.2) | 68.9 (46.4) | 0.93 |
| Expected discharge date | 67.5 (47.0) | 82.6 (38.0) | <0.001 |
| Responding clinician knowledge of nurse's name | 55.7 (49.8) | 85.6 (35.2) | <0.001 |
| Nurse's knowledge of responding clinician's name | 55.9 (49.8) | 87.9 (32.8) | <0.001 |
| Plan discussed | 72.9 (44.6) | 88.2 (32.3) | <0.001 |
Adverse Events
Of the 400 patients screened for AEs, 8 were excluded due to missing medical record number (5) and discharge outside of study period (3). Of the final 392 patient screens (198 pre, 194 post), there were no significant differences in patients' age, sex, race, language, length of stay, or Elixhauser score pre‐ versus postregionalization (Table 1).
Kappa scores for adjudicator agreement were 0.35 for presence of AE and 0.34 for preventability of AE. Of the 392 reviewed patient records, there were 133 total AEs detected (66 pre, 67 post), 27 preventable AEs (13 pre, 14 post), and 9 severe preventable AEs (4 pre, 5 post) (Table 3). There was no significant difference in the adjusted odds of preventable AEs post‐ versus preregionalization (adjusted odds ratio: 1.37, 95% confidence interval: 0.69, 2.69). Although the low number of AEs rated as severe or life threatening precluded adjusted analysis, unadjusted results similarly demonstrated no difference in odds of severe preventable AEs pre‐ versus postregionalization. As expected, there was no significant difference in adjusted odds of nonpreventable AE after implementation of regionalized care (Table 3).
| Adverse Events | No. of Adverse Events | Adjusted Odds Ratio Post vs Pre (95% CI) | |
|---|---|---|---|
| Pre, n = 198 | Post, n = 194 | ||
| |||
| Preventable | 13 | 14 | 1.37 (0.69, 2.69) |
| Serious and preventable | 4 | 5 | |
| Nonpreventable | 47 | 50 | 1.20 (0.85, 1.75) |
Similarly, there were no significant differences in category of preventable AE pre‐ versus postregionalization. The most frequent preventable AEs in both time periods were those related to adverse drug events and to manifestations of poor glycemic control, examples of which are illustrated (Table 4).
| |
| Adverse drug event | 29‐year‐old male with history of alcohol abuse, complicated by prior withdrawal seizures/emntensive care unit admissions, presented with alcohol withdrawal. Started on standing and PRN lorazepam, kept on home medications including standing clonidine, gabapentin, citalopram, quetiapine. Became somnolent due to polypharmacy, ultimately discontinued quetiapine as discovered took only as needed at home for insomnia |
| Manifestations of poor glycemic control | 78‐year‐old male with recently diagnosed lymphoma, distant history of bladder and prostate cancer status post ileal loop diversion, presented status post syncopal event; during event, spilled boiling water on himself leading to second‐degree burns on 3% of his body. Initially admitted to trauma/burn service, ultimately transferred to medical service for ongoing multiple medical issues including obstructive uropathy, acute on chronic renal failure. Adverse event was hyperglycemia (>350 mg/dL on >2 consecutive readings) in the setting of holding his home insulin detemir and insulin aspart (had been placed on insulin aspart sliding scale alone). After hyperglycemic episodes, was placed back on weight‐based basal/nutritional insulin |
DISCUSSION
In this study of general medicine patients at a large academic medical center, we found that regionalization of care teams on general medicine services was associated with improved recognition of care team members and agreement on estimated date of patient discharge, but was not associated with improvement in overall nurse and physician concordance of the patient care plan, or the odds of preventable AEs.
This intervention importantly addresses the barrier of dispersion of team membership, a well‐recognized barrier to interdisciplinary collaboration,[17, 18] particularly with resident physician teams due to frequently changing team membership. Localization of all team members, in addition to encouragement of daily collaborative bedside rounds as part of the regionalization initiative, likely contributed to our observed improvement in team member identification and discussion of daily care plans. Similarly, regionalization resulted in improved agreement in estimations of date of patient discharge. Focus on early patient discharges was an integral part of the implementation efforts; we therefore hypothesize that mutual focus on discharge planning by both nurses and responding clinicians may have explained this observed result.
On the other hand, regionalization did not appreciably improve the overall concordance of care plan between nurses and interns, despite a significant increase in team members agreeing that the plan had been discussed. Our findings support similar prior research demonstrating that regionalizing hospitalist attendings to single nursing units had limited impact on agreement of care plan between physicians and nurses.[13] Similarly, in settings where physicians and nurses are inherently regionalized, such as the intensive care unit[4] or the operating room,[3] communication between physicians and nurses remains difficult. Collectively, our findings suggest that colocalization of physicians and nurses alone is likely insufficient to improve measured communication between care team members. Existing literature suggests that more standardized approaches to improve communication, such as structured communication tools used during daily inpatient care[19, 20] or formalized team training,[21, 22, 23] lead to improvements in communication and collaboration. Despite these findings, it is important to highlight that this study did not assess other measures of workplace culture, such as teamwork and care team cohesiveness, which may have been positively affected by this intervention, even without measurable effect on concordance of care plan. Additionally, as noted, the average daily census on each team increased by almost a third postintervention, which may have impeded improvements in care team communication.
In addition, we found that our intervention had no significant impact on preventable AEs or severe preventable AEs. Although we cannot exclude the possibility that more subtle AEs were missed with our methodology, our results indicate that regionalized care alone may be inadequate to improve major patient safety outcomes. As discussed, the volume of patients did increase postintervention; thus, another way to state our results is that we were able to increase the daily volume of patients without any significant decreases in patient safety. Nevertheless, the results on patient safety were less than desired. A recent review of interdisciplinary team care interventions on general medical wards similarly demonstrated underwhelming improvements in patient safety outcomes, although the reviewed interventions did not specifically address preventable AEs, a gap in the literature commented on by the authors.[24] Other albeit limited literature has demonstrated improvement in patient safety outcomes via multifaceted efforts aimed at improving care team member communication. Notably, these efforts include colocalization of care team members to single units but also involve additional measures to improve communication and collaboration between care team members, such as structured communication during interdisciplinary rounds, and certification of key interdisciplinary teamwork skills.[11, 14] Although our regionalized care intervention included many similar features to these accountable care units (ACUs) including unit‐based care teams, unit‐level performance reporting, and unit‐based physician and nursing coleadership, significant differences existed. Notably, in addition to the above features, the ACU model also incorporated highly structured communication models for interdisciplinary rounding, and certification processes to ensure an appropriate communication skill base among care team members.[14] Thus, although creation of regionalized care teams is likely a necessary precursor to implementation of these additional measures, alone it may be insufficient to improve patient safety outcomes.
Importantly, in our study we identified that adverse drug events and manifestations of poor glycemic control occurred in high frequency both before and following implementation of regionalized care, supporting other literature that describes the prevalence of these AEs.[11, 25, 26, 27] These results suggest that targeted interventions to address these specific AEs are likely necessary. Notably, the intervention units in our study did not consistently employ clinical pharmacists assigned specifically to that unit's care team to allow for integration within the care team. As prior research has suggested that greater collaboration with clinical pharmacists results in reduction of adverse drug events,[28] next steps may include improved integration of team‐based pharmacists into the activities of the regionalized care teams. Inpatient management of diabetes also requires specific interventions,[29, 30, 31] only some of which may be addressable by having regionalized care and better interdisciplinary communication.
Our findings are subject to several limitations. First, this was a single‐site study and thus our findings may not be generalizable to other institutions. However, regionalized care is increasingly encouraged to optimize communication between care team members.[17, 18] Therefore, our null findings may be pertinent to other institutions looking to improve patient safety outcomes, demonstrating that additional initiatives will likely be required. Second, our modes of outcome measurement possess limitations. In measuring concordance of care plan, although previously used survey techniques were employed,[9] the concordance survey has not been formally validated, and we believe some of the questions may have led to ambiguity on the part of the responders that may have resulted in less accurate responses, thus biasing toward the null. Similarly, in measuring AEs, the screening tool relied on retrospective chart review looking for specific AE types[11] and thus may not have captured more subtle AEs. Additionally, our study may have been underpowered to demonstrate significant reduction in preventable AEs, although other studies of similar methodology demonstrated significant results with similar sample size.[11] This was due in part to our lower‐than‐expected baseline AE rate (6.6% compared with approximately 10.3% in previous studies).[11] Lastly, our study solely examined the association of regionalization with concordance of care plan and preventable AEs, but importantly excluded other clinically important outcomes that may have been positively (or negatively) impacted by these regionalization efforts, such as ED wait times, provider efficiency (eg, fewer pages, less time in transit, more time at the bedside), interdisciplinary teamwork, or patient or provider satisfaction.
CONCLUSION
In summary, our findings suggest that regionalized care teams alone may be insufficient to effectively promote communication between care team members regarding the care plan or to lead to improvements in patient safety, although we recognize that there may have been benefits (or unintended harms) not measured in this study but are nonetheless important for clinical care and workplace culture. This is an important lesson, as many hospitals move toward regionalized care in an effort to improve patient safety outcomes. However, strengthening the infrastructure by colocalizing care team members to maximize opportunity for communication is likely a necessary first step toward facilitating implementation of additional initiatives that may lead to more robust patient safety improvements, such as structured interdisciplinary bedside rounds (eg, facilitating and training all team members to fulfill specific roles), teamwork training, and certification of key interdisciplinary teamwork skills. Additionally, close examination of identified prevalent and preventable AEs can help to determine which additional initiatives are most likely to have greatest impact in improving patient safety.
Disclosures: This research was supported by funds provided by Brigham and Women's Hospital (BWH) and by funds provided by the Department of Medicine at BWH. All authors had full access to all of the data in the study and were integrally involved in the design, implementation, data collection, and analyses. The first author, Dr. Stephanie Mueller, takes responsibility for the integrity for the data and the accuracy of the data analysis. Dr. Schnipper reports grants from Sanofi Aventis, outside the submitted work.
- Joint Commission on Accreditation of Healthcare Organizations. Understanding and Preventing Sentinel Events in Your Health Care Organization. Oak Brook, IL: Joint Commission; 2008.
- , , , et al. Communication failures in the operating room: an observational classification of recurrent types and effects. Qual Saf Health Care. 2004;13(5):330–334.
- , , , et al. Operating room teamwork among physicians and nurses: teamwork in the eye of the beholder. J Am Coll Surg. 2006;202(5):746–752.
- , , . Discrepant attitudes about teamwork among critical care nurses and physicians. Crit Care Med. 2003;31(3):956–959.
- , , , , . Communication failures in patient sign‐out and suggestions for improvement: a critical incident analysis. Qual Saf Health Care. 2005;14(6):401–407.
- , , , et al. Changes in medical errors after implementation of a handoff program. N Engl J Med. 2014;371(19):1803–1812.
- , , , et al. Communication and information deficits in patients discharged to rehabilitation facilities: an evaluation of five acute care hospitals. J Hosp Med. 2009;4(8):E28–E33.
- , , , , , . Deficits in communication and information transfer between hospital‐based and primary care physicians: implications for patient safety and continuity of care. JAMA. 2007;297(8):831–841.
- , , , et al. Patterns of nurse‐physician communication and agreement on the plan of care. Qual Saf Health Care. 2010;19(3):195–199.
- , , , , , . Can we talk? Priorities for patient care differed among health care providers. In: Henriksen K, Battles JB, Marks ES, Lewin DI, eds. Advances in Patient Safety: From Research to Implementation. Vol 1. Rockville, MD: Agency for Healthcare Research and Quality; 2005.
- , , , et al. Structured interdisciplinary rounds in a medical teaching unit: improving patient safety. Arch Intern Med. 2011;171(7):678–684.
- , , , , , . Improving teamwork: impact of structured interdisciplinary rounds on a hospitalist unit. J Hosp Med. 2011;6(2):88–93.
- , , , et al. Impact of localizing physicians to hospital units on nurse‐physician communication and agreement on the plan of care. J Gen Intern Med. 2009;24(11):1223–1227.
- , , , et al. Reorganizing a hospital ward as an accountable care unit. J Hosp Med. 2015;10(1):36–40.
- , , , et al. 5th time's a charm: creation of unit‐based care teams in a high occupancy hospital [abstract]. J Hosp Med. 2015;10 (suppl. 2). Available at: http://www.shmabstracts.com/abstract/5th‐times‐a‐charm‐creation‐of‐unit‐based‐care‐teams‐in‐a‐high‐occupancy‐hospital. Accessed July 28, 2015.
- , , , . Comorbidity measures for use with administrative data. Med Care. 1998;36(1):8–27.
- , , , , , . Teamwork on inpatient medical units: assessing attitudes and barriers. Qual Saf Health Care. 2010;19(2):117–121.
- , , , et al. A model for quality improvement programs in academic departments of medicine. Am J Med. 2008;121(10):922–929.
- , , , , . Improving nurse‐physician communication and satisfaction in the intensive care unit with a daily goals worksheet. Am J Crit Care. 2006;15(2):217–222.
- , , , , , . Improving communication in the ICU using daily goals. J Crit Care. 2003;18(2):71–75.
- , , , et al. Effect of crew resource management training in a multidisciplinary obstetrical setting. Int J Qual Health Care. 2008;20(4):254–263.
- , , , et al. Error reduction and performance improvement in the emergency department through formal teamwork training: evaluation results of the MedTeams project. Health Serv Res. 2002;37(6):1553–1581.
- , , , et al. Effects of teamwork training on adverse outcomes and process of care in labor and delivery: a randomized controlled trial. Obstet Gynecol. 2007;109(1):48–55.
- , , , et al. Effects of interdisciplinary team care interventions on general medical wards: a systematic review. JAMA Intern Med. 2015;175(8):1288–1298.
- , , , et al. Patient risk factors for adverse drug events in hospitalized patients. ADE Prevention Study Group. Arch Intern Med. 1999;159(21):2553–2560.
- , , , et al. Effect of a pharmacist intervention on clinically important medication errors after hospital discharge: a randomized trial. Ann Intern Med. 2012;157(1):1–10.
- , , , . Use of a standardized protocol to decrease medication errors and adverse events related to sliding scale insulin. Qual Saf Health Care. 2006;15(2):89–91.
- , , , . Clinical pharmacists and inpatient medical care: a systematic review. Arch Intern Med. 2006;166(9):955–964.
- , , , , . Improved inpatient use of basal insulin, reduced hypoglycemia, and improved glycemic control: effect of structured subcutaneous insulin orders and an insulin management algorithm. J Hosp Med. 2009;4(1):3–15.
- , , , . Effects of a computerized order set on the inpatient management of hyperglycemia: a cluster‐randomized controlled trial. Endocr Pract. 2010;16(2):209–218.
- , , , . Effects of a subcutaneous insulin protocol, clinical education, and computerized order set on the quality of inpatient management of hyperglycemia: results of a clinical trial. J Hosp Med. 2009;4(1):16–27.

Actionability of TPAD Results
Effective communication between inpatient and primary care physicians (PCPs) is essential for safe, high‐quality transitions. Unfortunately, PCPs are often not meaningfully engaged in this process; communication is frequently challenging or nonexistent.[1, 2] Instead, information is suboptimally conveyed via lengthy, disorganized discharge summaries.[3] Consequently, timely knowledge is not transferred to PCPs, who instead must seek out and identify actionable information themselves. These deficiencies can lead to misinterpretation of information and patient harm.[4]
An important component of ideal transitions[5] is timely communication of results of tests pending at discharge (TPADs). TPADs are variably documented in discharge summaries, and physician awareness about them is strikingly poor.[3, 6, 7] Communication about TPADs should convey rationales for ordering tests and necessary actions to take in response to finalized results. Most often, this knowledge resides with the inpatient team.
Health information technology (HIT) is an effective strategy for improving test‐result management. We implemented an automated system that notifies inpatient attendings and PCPs of TPAD results via email and demonstrated increased awareness by these physicians at the time of required action.[8, 9] Nevertheless, without timely knowledge transfer, attendings and PCPs may have differing opinions regarding which TPAD results require action. We conducted a secondary analysis of survey respondents from our original clustered randomized controlled trial to measure the degree of agreement between inpatient and ambulatory physicians regarding actionability of TPAD results.
METHODS
The methods of our original study are described elsewhere.[9] In that study, the attending and PCP of each patient were independently surveyed (via email and then by fax if the electronic survey was not completed) to determine their awareness of finalized TPAD results, and to identify actionable results and the types of actions taken (or that would need to be taken). Discharge summaries were available in our electronic medical record (EMR) within 24 hours of discharge. Network physicians (affiliated with Partners HealthCare, Inc.) had access to all components of the EMR, including the discharge summary and test results. Non‐network PCPs were faxed discharge summaries within 48 hours of discharge per institutional policies. For this study, we identified all patients for whom the attending and PCP completed the survey and answered questions about TPAD actionability. We then compared the identified TPADs listed by the attending and PCP in that survey.
RESULTS
We enrolled 441 patients in our original study. We sent 441 surveys to 117 attendings and 353 surveys to 273 PCPs. Eighty‐eight patients did not have an identified PCP. We received 275 responses from 83 attendings (62% response rate), and 152 responses from 112 PCPs (43% response rate). Patient and physician characteristics are reported elsewhere.[9]
For this analysis, we identified the 98 patients (aged 6018 years, 44 male, 52 Caucasian, 46 non‐Caucasian, 85 network, 13 non‐network) cared for by 46 attendings (aged 4411 years, 33 male, 22 hospitalists, 24 nonhospitalists) and 79 PCPs (aged 4512.5, 33 male, 66 network, 13 non‐network) for whom we received completed surveys from both physicians. For 59 patients, both thought none of the TPAD results were actionable. For 12 patients, both thought at least 1 was actionable, and they identified the same actionable TPAD result for all 12. Overall, attendings and PCPs agreed on actionability in 72.5% (71/98) (Kappa 0.29, 95% confidence interval: 0.09‐0.50). Table 1 shows the type of action taken by responsible providers. There were 9 patients (9%) for whom the attending alone thought at least 1 TPAD result was actionable; of these, subsequent attending‐initiated communication occurred in 77.8% (7/9). There were 18 patients (18%) for whom the PCP alone thought at least 1 TPAD result was actionable; of these, subsequent PCP‐initiated communication occurred in 77.8% (14/18). Table 2 shows concordance of actionable TPAD by type. In instances of disagreement, the attending frequently reported microbiology TPADs (eg, culture data, viral serologies) as actionable, whereas the PCP reported all TPAD types (eg, culture data, colon biopsy, vitamin D, magnetic resonance imaging) as actionable.
| Inpatient Attending‐Initiated Action(s)a | PCP‐Initiated Action(s)a | |
|---|---|---|
| ||
| Patient was notifiedb | 11.1% (1/9) | 66.7% (12/18) |
| Subspecialist was contacted | 33.3% (3/9) | 16.7% (3/18) |
| PCP or inpatient team contacted | 33.3% (3/9) | 16.7% (3/18) |
| Further testing/modified treatment | 11.1% (1/9) | 33.3% (6/18) |
| Referred to ambulatory visit/emergency room | 0% (0/9) | 11.1% (2/18) |
| Documentation | 11.1% (1/9) | 16.7% (3/18) |
| Type of TPAD | Attending and PCP Agreed on Identity of Actionable TPADa | Attending and PCP Disagreed on Identity of Actionable TPADa | ||
|---|---|---|---|---|
| TPAD Identified | No TPAD Identified, n=59 | TPAD Identified by Attending Only | TPAD Identified by PCP Only | |
| ||||
| Microbiologyb | 25% (3/12) | N/A | 56% (5/9) | 17% (3/18) |
| Pathologyc | 17% (2/12) | N/A | 0% (0/9) | 17% (3/18) |
| Chemistry and hematologyd | 58% (7/12) | N/A | 11% (1/9) | 22% (4/18) |
| Radiologye | 0% (0/12) | N/A | 11% (1/9) | 39% (5/18) |
| Unclassified (left blank) | 0% (0/12) | N/A | 22% (1/9) | 17% (3/18) |
DISCUSSION
We found fair agreement between attendings and PCPs regarding actionability of TPAD results. In 27 patients (27.5%), either the attending or PCP considered TPAD results actionable when the other did not. Possible explanations for this include different thresholds for taking action (eg, inpatient physicians may view vitamin D levels as acceptable within broader ranges than PCPs, and PCPs may view negative results as actionable if they need to contact the patient whereas attendings may not), varying clinical context (eg, rationale for why microbiology culture data is actionable), and varying practices for escalating care (eg, referring patients back to the hospital).
Our study was limited by small sample size and low PCP response rate. Nonetheless, the findings suggest that poor concordance between inpatient and ambulatory physicians will persist without tools that promote more effective communication. Greater awareness alone may be insufficient to mitigate consequences of missed TPAD results if physicians are not on the same page regarding which results require action.
To better engage PCPs, healthcare systems require HIT infrastructure that facilitates seamless care team communication across care settings.[2] When optimally configured, HIT can facilitate greater PCP involvement in postdischarge communication. For example, our system promoted subsequent postdischarge communication in 78% of initial discordance in TPAD actionability; however, most of it was not between the attending and the PCP. Thus, improvements could be made to facilitate more effective communication among key inpatient and ambulatory providers. Furthermore, when configured to facilitate conversation among these providers regarding the discharge care plan throughout a patient's entire hospital course, HIT can promote effective knowledge transfer by virtue of adding clinical context to test ordering and follow‐up. Additional work is needed to understand whether such communication clarifies contingencies and facilitates appropriate postdischarge action. Nevertheless, current electronic solutions (eg, passive placement into results in‐baskets) will likely be ineffective because they do not reliably improve awareness and active communication about context, rationale, interpretation, suggested action, or transfer of responsibility.
In summary, discrepancies in TPAD actionability by inpatient and ambulatory providers still exist, even when awareness of TPAD results is improved by HIT. By fostering more effective communication among key care‐team members across care settings, HIT could mitigate the consequences of suboptimal care transitions. With regard to TPAD results, this may favorably impact unnecessary testing, diagnostic and therapeutic delays, and medical errors.
Disclosures: This article is based on research funded through AHRQ grant #R21HS018229; the authors have no other disclosures or conflicts or interest.
- , , , et al. Problems after discharge and understanding of communication with their primary care physicians among hospitalized seniors: a mixed methods study. J Hosp Med. 2010;5:385–391.
- . A primary care physician's ideal transitions of care—where's the evidence? J Hosp Med. 2013;8(8):472–477.
- , , , et al. Deficits in communication and information transfer between hospital‐based and primary care physicians: implications for patient safety and continuity of care. JAMA. 2007;297(8):831–841.
- , , , , . The incidence and severity of adverse events affecting patients after discharge from the hospital. Ann Intern Med. 2003;138:161–167.
- , , , . Moving beyond readmission penalties: creating an ideal process to improve transitional care. J Hosp Med. 2012;8(2):102–109.
- , , , et al. Adequacy of hospital discharge summaries in documenting tests with pending results and outpatient follow‐up providers. J Gen Intern Med. 2009;24(9):1002–1006.
- , , , et al. Patient safety concerns rising from test results that return after hospital discharge. Ann Intern Med. 2005;143:121–128.
- , , , et al. Design and implementation of an automated email notification system for results of tests pending at discharge. J Am Med Inform Assoc. 2012;19(4):523–528.
- , , , et al. Impact of an automated email notification system for results of rest pending at discharge: a cluster‐randomized controlled trial [published online ahead of print October 23, 2013]. J Am Med Inform Assoc. doi:10.1136/amiajnl‐2013‐002030.
Effective communication between inpatient and primary care physicians (PCPs) is essential for safe, high‐quality transitions. Unfortunately, PCPs are often not meaningfully engaged in this process; communication is frequently challenging or nonexistent.[1, 2] Instead, information is suboptimally conveyed via lengthy, disorganized discharge summaries.[3] Consequently, timely knowledge is not transferred to PCPs, who instead must seek out and identify actionable information themselves. These deficiencies can lead to misinterpretation of information and patient harm.[4]
An important component of ideal transitions[5] is timely communication of results of tests pending at discharge (TPADs). TPADs are variably documented in discharge summaries, and physician awareness about them is strikingly poor.[3, 6, 7] Communication about TPADs should convey rationales for ordering tests and necessary actions to take in response to finalized results. Most often, this knowledge resides with the inpatient team.
Health information technology (HIT) is an effective strategy for improving test‐result management. We implemented an automated system that notifies inpatient attendings and PCPs of TPAD results via email and demonstrated increased awareness by these physicians at the time of required action.[8, 9] Nevertheless, without timely knowledge transfer, attendings and PCPs may have differing opinions regarding which TPAD results require action. We conducted a secondary analysis of survey respondents from our original clustered randomized controlled trial to measure the degree of agreement between inpatient and ambulatory physicians regarding actionability of TPAD results.
METHODS
The methods of our original study are described elsewhere.[9] In that study, the attending and PCP of each patient were independently surveyed (via email and then by fax if the electronic survey was not completed) to determine their awareness of finalized TPAD results, and to identify actionable results and the types of actions taken (or that would need to be taken). Discharge summaries were available in our electronic medical record (EMR) within 24 hours of discharge. Network physicians (affiliated with Partners HealthCare, Inc.) had access to all components of the EMR, including the discharge summary and test results. Non‐network PCPs were faxed discharge summaries within 48 hours of discharge per institutional policies. For this study, we identified all patients for whom the attending and PCP completed the survey and answered questions about TPAD actionability. We then compared the identified TPADs listed by the attending and PCP in that survey.
RESULTS
We enrolled 441 patients in our original study. We sent 441 surveys to 117 attendings and 353 surveys to 273 PCPs. Eighty‐eight patients did not have an identified PCP. We received 275 responses from 83 attendings (62% response rate), and 152 responses from 112 PCPs (43% response rate). Patient and physician characteristics are reported elsewhere.[9]
For this analysis, we identified the 98 patients (aged 6018 years, 44 male, 52 Caucasian, 46 non‐Caucasian, 85 network, 13 non‐network) cared for by 46 attendings (aged 4411 years, 33 male, 22 hospitalists, 24 nonhospitalists) and 79 PCPs (aged 4512.5, 33 male, 66 network, 13 non‐network) for whom we received completed surveys from both physicians. For 59 patients, both thought none of the TPAD results were actionable. For 12 patients, both thought at least 1 was actionable, and they identified the same actionable TPAD result for all 12. Overall, attendings and PCPs agreed on actionability in 72.5% (71/98) (Kappa 0.29, 95% confidence interval: 0.09‐0.50). Table 1 shows the type of action taken by responsible providers. There were 9 patients (9%) for whom the attending alone thought at least 1 TPAD result was actionable; of these, subsequent attending‐initiated communication occurred in 77.8% (7/9). There were 18 patients (18%) for whom the PCP alone thought at least 1 TPAD result was actionable; of these, subsequent PCP‐initiated communication occurred in 77.8% (14/18). Table 2 shows concordance of actionable TPAD by type. In instances of disagreement, the attending frequently reported microbiology TPADs (eg, culture data, viral serologies) as actionable, whereas the PCP reported all TPAD types (eg, culture data, colon biopsy, vitamin D, magnetic resonance imaging) as actionable.
| Inpatient Attending‐Initiated Action(s)a | PCP‐Initiated Action(s)a | |
|---|---|---|
| ||
| Patient was notifiedb | 11.1% (1/9) | 66.7% (12/18) |
| Subspecialist was contacted | 33.3% (3/9) | 16.7% (3/18) |
| PCP or inpatient team contacted | 33.3% (3/9) | 16.7% (3/18) |
| Further testing/modified treatment | 11.1% (1/9) | 33.3% (6/18) |
| Referred to ambulatory visit/emergency room | 0% (0/9) | 11.1% (2/18) |
| Documentation | 11.1% (1/9) | 16.7% (3/18) |
| Type of TPAD | Attending and PCP Agreed on Identity of Actionable TPADa | Attending and PCP Disagreed on Identity of Actionable TPADa | ||
|---|---|---|---|---|
| TPAD Identified | No TPAD Identified, n=59 | TPAD Identified by Attending Only | TPAD Identified by PCP Only | |
| ||||
| Microbiologyb | 25% (3/12) | N/A | 56% (5/9) | 17% (3/18) |
| Pathologyc | 17% (2/12) | N/A | 0% (0/9) | 17% (3/18) |
| Chemistry and hematologyd | 58% (7/12) | N/A | 11% (1/9) | 22% (4/18) |
| Radiologye | 0% (0/12) | N/A | 11% (1/9) | 39% (5/18) |
| Unclassified (left blank) | 0% (0/12) | N/A | 22% (1/9) | 17% (3/18) |
DISCUSSION
We found fair agreement between attendings and PCPs regarding actionability of TPAD results. In 27 patients (27.5%), either the attending or PCP considered TPAD results actionable when the other did not. Possible explanations for this include different thresholds for taking action (eg, inpatient physicians may view vitamin D levels as acceptable within broader ranges than PCPs, and PCPs may view negative results as actionable if they need to contact the patient whereas attendings may not), varying clinical context (eg, rationale for why microbiology culture data is actionable), and varying practices for escalating care (eg, referring patients back to the hospital).
Our study was limited by small sample size and low PCP response rate. Nonetheless, the findings suggest that poor concordance between inpatient and ambulatory physicians will persist without tools that promote more effective communication. Greater awareness alone may be insufficient to mitigate consequences of missed TPAD results if physicians are not on the same page regarding which results require action.
To better engage PCPs, healthcare systems require HIT infrastructure that facilitates seamless care team communication across care settings.[2] When optimally configured, HIT can facilitate greater PCP involvement in postdischarge communication. For example, our system promoted subsequent postdischarge communication in 78% of initial discordance in TPAD actionability; however, most of it was not between the attending and the PCP. Thus, improvements could be made to facilitate more effective communication among key inpatient and ambulatory providers. Furthermore, when configured to facilitate conversation among these providers regarding the discharge care plan throughout a patient's entire hospital course, HIT can promote effective knowledge transfer by virtue of adding clinical context to test ordering and follow‐up. Additional work is needed to understand whether such communication clarifies contingencies and facilitates appropriate postdischarge action. Nevertheless, current electronic solutions (eg, passive placement into results in‐baskets) will likely be ineffective because they do not reliably improve awareness and active communication about context, rationale, interpretation, suggested action, or transfer of responsibility.
In summary, discrepancies in TPAD actionability by inpatient and ambulatory providers still exist, even when awareness of TPAD results is improved by HIT. By fostering more effective communication among key care‐team members across care settings, HIT could mitigate the consequences of suboptimal care transitions. With regard to TPAD results, this may favorably impact unnecessary testing, diagnostic and therapeutic delays, and medical errors.
Disclosures: This article is based on research funded through AHRQ grant #R21HS018229; the authors have no other disclosures or conflicts or interest.
- , , , et al. Problems after discharge and understanding of communication with their primary care physicians among hospitalized seniors: a mixed methods study. J Hosp Med. 2010;5:385–391.
- . A primary care physician's ideal transitions of care—where's the evidence? J Hosp Med. 2013;8(8):472–477.
- , , , et al. Deficits in communication and information transfer between hospital‐based and primary care physicians: implications for patient safety and continuity of care. JAMA. 2007;297(8):831–841.
- , , , , . The incidence and severity of adverse events affecting patients after discharge from the hospital. Ann Intern Med. 2003;138:161–167.
- , , , . Moving beyond readmission penalties: creating an ideal process to improve transitional care. J Hosp Med. 2012;8(2):102–109.
- , , , et al. Adequacy of hospital discharge summaries in documenting tests with pending results and outpatient follow‐up providers. J Gen Intern Med. 2009;24(9):1002–1006.
- , , , et al. Patient safety concerns rising from test results that return after hospital discharge. Ann Intern Med. 2005;143:121–128.
- , , , et al. Design and implementation of an automated email notification system for results of tests pending at discharge. J Am Med Inform Assoc. 2012;19(4):523–528.
- , , , et al. Impact of an automated email notification system for results of rest pending at discharge: a cluster‐randomized controlled trial [published online ahead of print October 23, 2013]. J Am Med Inform Assoc. doi:10.1136/amiajnl‐2013‐002030.
Continuing Medical Education Program in
If you wish to receive credit for this activity, which beginson the next page, please refer to the website:
Accreditation and Designation Statement
Blackwell Futura Media Services designates this educational activity for a 1 AMA PRA Category 1 Credit. Physicians should only claim credit commensurate with the extent of their participation in the activity.
Blackwell Futura Media Services is accredited by the Accreditation Council for Continuing Medical Education to provide continuing medical education for physicians.
Educational Objectives
Continuous participation in the Journal of Hospital Medicine CME program will enable learners to be better able to:
-
Interpret clinical guidelines and their applications for higher quality and more efficient care for all hospitalized patients.
-
Describe the standard of care for common illnesses and conditions treated in the hospital; such as pneumonia, COPD exacerbation, acute coronary syndrome, HF exacerbation, glycemic control, venous thromboembolic disease, stroke, etc.
-
Discuss evidence‐based recommendations involving transitions of care, including the hospital discharge process.
-
Gain insights into the roles of hospitalists as medical educators, researchers, medical ethicists, palliative care providers, and hospital‐based geriatricians.
-
Incorporate best practices for hospitalist administration, including quality improvement, patient safety, practice management, leadership, and demonstrating hospitalist value.
-
Identify evidence‐based best practices and trends for both adult and pediatric hospital medicine.
Instructions on Receiving Credit
For information on applicability and acceptance of continuing medical education credit for this activity, please consult your professional licensing board.
This activity is designed to be completed within the time designated on the title page; physicians should claim only those credits that reflect the time actually spent in the activity. To successfully earn credit, participants must complete the activity during the valid credit period that is noted on the title page.
Follow these steps to earn credit:
-
Log on to
www.blackwellpublishing.com/cme . -
Read the target audience, learning objectives, and author disclosures.
-
Read the article in print or online format.
-
Reflect on the article.
-
Access the CME Exam, and choose the best answer to each question.
-
Complete the required evaluation component of the activity.
Pending Tests at Discharge
The period following discharge is a vulnerable time for patientsthe prevalence of medical errors related to this transition is high and has important patient safety and medico‐legal ramifications.13 Factors contributing to this vulnerability include complexity of hospitalized patients, shorter lengths of stay, and increased discontinuity of care. Hospitalists have recognized this threat to patient safety and have worked toward improving information exchange between inpatient and outpatient providers at hospital discharge.46 Nonetheless, the evidence suggests that more work is necessary. A recent study found that discharge summaries are often incomplete, and do not contain important information requiring follow‐up, such as pending tests.7 Additionally, a review by Kripalani et al. characterizing information deficits at hospital discharge found few interventions which specifically improve communication of pending tests at hospital discharge.8
In a prior study we determined that 41% of patients left the hospital before all laboratory and radiology test results were finalized. Of these results, 9.4% were potentially actionable and could have altered management. Physicians were aware of only 38% of post‐discharge test results.9 This awareness gap is a consequence of several factors including the lack of systems to track and alert providers of test results finalized post discharge. Also, it is unclear who is responsible for pending tests at discharge, since these tests are ordered by the inpatient physicians but often reported in the time period between hospital discharge and the patient's first follow‐up appointment with the primary care physician (PCP). Because responsibility is not explicitly made in the final communication between physicians at discharge, such test results may not be reviewed in a timely manner, potentially resulting in delays in treatment, a need for readmission, or other unfavorable outcomes.
Even in integrated health systems with advanced electronic health records, missed test results which result in treatment delays remain prevalent.10, 11 Test result management applications aid clinicians in reviewing and acting upon results as they become available and such systems may provide solutions to this problem. At Partners Healthcare in Boston, the Results Manager (RM) application was developed to help clinicians in the ambulatory setting safely, reliably, and efficiently review and act upon test results. The application enables clinicians to prioritize test results, utilize guidelines, and generate letters to patients. This system also prompts physicians to set reminders for future testing.12 In a 2.5‐year study evaluating the impact of this intervention, PCPs at 26 adult primary care practices were able to expedite communication of outpatient laboratory and imaging test results to patients with the help of RM. Patients of physicians who participated in the project reported greater satisfaction with test result communication and with information provided about their condition than did a control group of similar patients.13 RM has not yet been studied in the inpatient setting or at care transitions. We describe an attempt at modifying the Partners RM application to help inpatient physicians manage pending tests at hospital discharge.
Methods
Study Setting and Participants
We piloted our application at 2 major academic medical centers (hospitals A and B) associated with Partners Healthcare, an integrated regional health delivery network in eastern Massachusetts, from October 2004 to March 2005. Both centers use the longitudinal medical record (LMR), the electronic medical record (EMR), for nearly all ambulatory practices. The LMR is an internally developed full‐featured EMR, including a repository of laboratory and radiology reports, discharge summaries, ambulatory care notes, medication lists, problem lists, coded allergies, and other patient data. Both centers also have their own inpatient results viewing and order entry systems which provide clinicians caring for patients in the hospital the ability to review results and write orders. Although possible, clinicians caring for patients in the inpatient setting do not routinely access LMR to view test results. Inpatient physician use of the LMR is generally limited to review of the outpatient record, medication lists, and ambulatory notes at admission.
At hospital A, the hospitalist attending physician is typically responsible for all communication to outpatient physicians at discharge, as well as for follow‐up on all test results that return after discharge. Hospital B has 2 types of hospitalist services. One is staffed only by hospitalist and nonhospitalist attending physicians. Nonhospitalist attending physicians were excluded because they care for their own patients in the inpatient and ambulatory setting and typically use RM to manage test results. The other hospitalist service at hospital B is a teaching service consisting of an attending physician, resident, and interns. For this service, the resident is responsible for communication at discharge and follow‐up on all pending tests. For purposes of this study inpatient physicians refers to those physicians responsible for communication with PCPs and follow‐up on pending tests. All inpatient physicians were eligible to participate during the study period.
Test Result Management Application
RM was originally developed by Partners Healthcare to improve timely review and appropriate management of test results in the ambulatory setting. RM was developed for and vetted by primarily ambulatory physicians. The application is browser‐based, provider‐centric, and embedded in the LMR to help ambulatory clinicians review and act upon test results in a safe, reliable, and efficient manner. Although RM has access to all inpatient and outpatient data in the Partners Clinical Data Repository (CDR), given the volume of inpatient tests ordered, hospital‐based results are suppressed by default to limit inundating ambulatory clinicians' queues. Therefore, users of RM only receive results of laboratory and radiology tests ordered in the ambulatory setting. They can track these tests for specific patients for a designated period of time by placing the patient on a watch list. Finally, RM incorporates extensive decision support features to classify the degree of abnormality for each result, presents guidelines to help clinicians manage abnormal results, allows clinicians to generate result letters to patients using predefined, context‐sensitive templates, and prompts physicians to set reminders for future testing. Because RM was developed from the ambulatory perspective, there was limited input from hospitalist physicians with regard to inpatient workflow in the original design of the module.12 See Figure 1 for a screen shot of RM and a description of its features.
figure can be viewed in the online issue, which is available at wileyonlinelibrary.com.]
For purposes of this pilot, we modified RM to allow results of tests ordered in the inpatient setting to be available for viewing (Hospitalist Results Manager, HRM). This feature was turned on only for inpatient physicians as previously defined. Inpatient tests, including pending tests at discharge, continued to be suppressed from PCP's RM queue (however, any physician could access a patient's test result(s) directly from the Partners CDR). Inpatient physicians could track laboratory and radiology results finalized after discharge by keeping discharged patients on their HRM watch list for a designated period of time. The finalized results would become available for review in their HRM queue and abnormal results were displayed prominently at the top of this queue. Inpatient physicians were trained to use HRM in a series of meetings and demonstrations. Although HRM could be accessed from inpatient clinical workstations, it was not part of the inpatient clinical information system.
Surveys
Study surveys were developed and refined through an iterative process and pilot tested among inpatient physicians at both centers for clarity. We surveyed inpatient physicians five months after HRM implementation. Inpatient physicians were asked how often they used HRM, what barriers they faced (respondents asked to quantify agreement to statements on a 5‐point Likert scale), and which elements of an ideal system they would prefer. Finally, we solicited comments regarding perceived obstacles and suggestions for improvement. Because HRM was targeted to inpatient physicians, and because RM has been evaluated from the ambulatory perspective in a prior study,13 PCPs were not surveyed. See Supporting Information Appendix for the survey instrument used in the study.
Results
A total of 35 inpatient physicians participated in the pilot. Among 649 patients discharged during the study period, there were 1075 tests pending of which 555 were subsequently flagged as abnormal in HRM. Study surveys were sent to the 35 inpatient physician participants and 29 were completed, including partial responses (83% survey response rate). The 35 inpatient physician participants had the following characteristics: 22 were male, 13 were female; 21 were trainees and 14 were nontrainees/faculty. All 21 trainees were PGY2s. Nontrainees and faculty varied in experience level (PGY 15: 5, PGY 610: 7, PGY 1120: 1, PGY 21+: 1). Of 29 survey respondents, 7 were from hospital A and 22 were from hospital B; 19 were trainees and 10 were nontrainees/faculty. Of the 6 nonrespondents, 2 were from hospital A and 4 were from hospital B; 2 were trainees and 4 were nontrainees/faculty.
Table 1 shows the results of our survey of inpatient physicians regarding usage of HRM. Of 29 survey respondents, 14 (48%) reported never using HRM. Thirteen (45%) reported using HRM 1 to 2 times per week. None of the respondents used it more than 4 times per week. The frequency of usage was similar for hospitals A and B. Table 2 details barriers to using HRM. Twenty‐three inpatient physicians (79%) reported barriers. Seventeen (59%) thought that results in their HRM queue were not clinically relevant, 16 (55%) felt that HRM did not fit into their daily workflow, 14 (48%) had limited time to use HRM, and 12 (41%) noted that too many results in their HRM queue were on other physician's patients. Seven (24%) reported operational issues and 3 (10%) reported technical issues prohibiting use of HRM. With regard to preferred elements of an ideal results manager system, 21 (72%) inpatient physician respondents wanted to receive notification of abnormal and clinician‐designated pending test results. Four (14%) wanted to receive only abnormal results and 1 (3%) wanted to receive all results. Twenty‐seven (93%) physicians agreed that an ideally designed computerized test result management application would be valuable for managing pending tests at discharge.
| Frequency | Number of Inpatient Physicians Using HRM, n (%) | ||
|---|---|---|---|
| Overall | Hospital A | Hospital B | |
| |||
| Never | 14 (48) | 3 (43) | 11 (50) |
| 12 times per week | 13 (45) | 3 (43) | 10 (45.5) |
| 34 times per week | 2 (7) | 1 (14) | 1 (4.5) |
| 57 times per week | 0 | 0 | 0 |
| >7 times per week | 0 | 0 | 0 |
| Barrier | Overall, n (%) | Hospital A, n (%) | Hospital B, n (%) |
|---|---|---|---|
| |||
| Forgot to use HRM | 23 (79) | 7 (100) | 16 (73) |
| Results not clinically relevant | 17 (59) | 7 (100) | 10 (45) |
| Did not fit daily workflow | 16 (55) | 7 (100) | 9 (41) |
| Too little time to use HRM | 14 (48) | 6 (86) | 8 (46) |
| Results on others' patients | 12 (41) | 6 (86) | 6 (27) |
| HRM was difficult to use | 7 (24) | 2 (29) | 5 (23) |
| Had technical difficulties | 3 (10) | 0 (0) | 3 (14) |
Table 3 provides comments from inpatient physician respondents regarding obstacles prohibiting use of HRM and suggestions for future systems.
|
| Suggestions |
| Would be more useful if accessible from (the inpatient clinical information system). |
| Email notification (would have been useful). |
| At time of discharge, if there is a way to find pending labs at discharge, this would be of great utility. |
| Linking responsibility for follow‐up to test ordering (would have been useful). |
| Smarter system for filtering results so less important results are filtered out (is desirable). |
| Can the system be tied into PCP's email somehow? |
| Obstacles |
| Blood cultures, abnormal films can be difficult and time‐consuming to look up. |
| A big problem is results that automatically trigger even though they're not clinically relevant. |
| Keeping a record of patients that left with tests pending (is often difficult to do). |
| Addressing pending results is very time consuming. |
Discussion
We describe a pilot implementation of a computerized application for the management of pending tests at hospital discharge. From responses to post‐implementation surveys, we were able to identify multiple factors prohibiting successful implementation of the application. These observations may help inform future interventions and evaluations.
Almost half of inpatient physicians reported never using HRM despite training and reminders. The feedback provided by physicians in our study suggested that HRM was not ideally designed from an inpatient physician perspective. We discovered several barriers to its use: (1) HRM overburdened physicians with clinically irrelevant test results, suggesting that more robust filtering of abnormal but low importance test results may be required (eg, a borderline electrolyte abnormality or low but stable hematocrit); (2) HRM did not integrate well into inpatient workflowthe system was not integrated into the inpatient results viewing and computerized physician order entry (CPOE) applications, and therefore required an extra step to access; (3) there was no mechanism of alerting inpatient physicians that finalized test results were available for viewing in their HRM queues (eg, by email or by an alert in the inpatient computer system); (4) because responsibility for these results was unclear, most inpatient physicians had no formal method of managing them, and for many, using HRM represented an additional task; and finally (5) several physicians commented on finding results in their HRM queue that belonged to other physician's patients, implying that the hospital databases were inaccurate in identifying the discharging physician or that rotation schedules, and therefore patient responsibility, had changed in the intervening period. Table 4 summarizes the advantages and respective limitations of features of HRM available to inpatient physicians.
| Advantages | Limitations |
|---|---|
| |
| Creates a physician‐managed queue of pending test results by patient | Does not provide alert or push notification when new results available for patients |
| Filters test results by severity with most critical results appearing at the top of the queue | Severity filter set for outpatients; not restrictive enough for post‐discharge period, resulting in excessive alerting |
| Independent, voluntary acknowledgement of results by user | Active acknowledgment not required; no audit trail, feedback, or escalation if result not acknowledged |
| Embedded within LMR (the ambulatory EMR) | LMR not routinely used by many inpatient physicians |
| Offers patient communication tools (eg, pre‐populated patient results letter) | Tools not optimized for post‐discharge test result communication by inpatient physicians (eg, a tool for PCP result notification and acknowledgment) |
In the literature, there is little information regarding optimal features of a test result management system for transitions from the inpatient to ambulatory care setting. Prior studies outline important functions for results management systems developed for noninpatient sites of care, including the ambulatory and emergency room setting.12, 14, 15 These include a method of prioritizing by degree of abnormality, the ability to reliably and efficiently act upon results, and an automated alerting system for abnormal results. Findings from our study provide insight in defining core functions for result management systems which focus on transitions from the inpatient to ambulatory care setting. These functions include tight integration with applications used by inpatient physicians, clear assignment of responsibility for test results finalized after hospital discharge (as well as a mechanism to reassign responsibility), automated alerts to responsible providers of test results finalized post‐discharge, and ways to automatically filter test results to avoid over‐burdening physicians with clinically irrelevant results.
Almost all surveyed inpatient physicians agreed that an ideally designed electronic post‐discharge results management system would be valuable. For such systems to be successfully adopted, we offer several principles to help guide future work. These include: (1) clarifying responsibility at the time a test is ordered and again at discharge, (2) understanding workflow and communication patterns among inpatient and outpatient clinicians, and (3) integrating technological solutions into existing systems to minimize workflow disruptions. For example, if the primary responsibility for post‐discharge result follow‐up lies with the ordering physician, the system should be integrated within the EMR most often used by inpatient physicians and become part of inpatient physician workflow. If the system depends on administrative databases to identify the responsible providers, these must be accurate. Alternatively, in organizations with computerized provider order entry, responsibility for the result could be assigned when the test is ordered and confirmed at discharge (ie, the results management system would be integrated into the discharge order such that pending tests are reviewed at the time of discharge). The discharging physician should have the ability to assign responsibility for each pending test and select preferred mode(s) of notification once its result is finalized (eg, e‐mail, alphanumeric page, etc.). The system should have the ability to generate an automatic notification to the inpatient and PCP (and perhaps other designated providers involved in the patient's inpatient care), but it should not burden busy clinicians with unnecessary alerts and warnings. Finally, the rules by which results are prioritized must be robust enough to filter out less urgent results, and should be modified to reflect the severity of illness of recently discharged patients. In essence, in consideration of the time constraints of busy clinicians, an ideal results management system should achieve automated notification of test results while minimizing the risk of alert fatigue from the potentially large volume of alerts generated.
Our study has several important limitations. First, although our survey response rate was high, the sample size of actual participants was small. Second, because the study was conducted in 2 similar, tertiary care academic centers, it may not generalize to other settings (we note that hospital B included a nonteaching service similar to those in nonacademic medical centers). This may be particularly true in assessing the importance of specific barriers to use of results management systems, which may vary at different institutions. Third, the representation of survey respondents were skeweda majority of the responses were from trainees (all post‐graduate level [PGY] level 2) and from hospital B. Fourth, we did not actively monitor physician interaction with the test result management application, and therefore, we depended heavily on physician recollection of use of the system when responding to surveys. Finally, we did not convene focus groups of key individuals with regard to the factors facilitating or prohibiting adoption of the system. Use of semi‐structured, key informant interviews (ie, focus groups) before and after implementation of an electronic results management application, have been shown to be effective in evaluating potential barriers and facilitators of adoption.16 Focus groups of and/or interviews with inpatient and PCPs, physician extenders, and housestaff could have been useful to better characterize the potential barriers and facilitators of adoption noted by survey respondents in our study.
In summary, we offer several lessons from our attempt to implement a system to manage pending tests at hospital discharge. The success of implementing future systems to address this patient safety concern will rely on accurately assigning responsibility for these test results, integrating the system within clinical information systems commonly used by the inpatient physician, addressing workflow issues and time constraints, maximizing appropriateness of alerting, and minimizing alert fatigue.
- ,,,,.The incidence and severity of adverse events affecting patients after discharge from the hospital.Ann Intern Med.2003;138(3):161–167.
- ,,,.Medical errors related to discontinuity of care from an inpatient to an outpatient setting.J Gen Intern Med.2003;18(8):646–651.
- .Key legal principles for hospitalists.Am J Med.2001;111(9B):5S–9S.
- ,,.Passing the clinical baton: 6 principles to guide the hospitalist.Am J Med.2001;111(9B):36S–39S.
- ,.Lost in transition: challenges and opportunities for improving the quality of transitional care.Ann Intern Med.2004;141(7):533–536.
- ,,,.Promoting effective transitions of care at hospital discharge: a review of key issues for hospitalists.J Hosp Med.2007;2(5):314–323.
- ,,, et al.Adequacy of hospital discharge summaries in documenting tests with pending results and outpatient follow‐up providers.J Gen Intern Med.2009;24(9):1002–1006.
- ,,,,,.Deficits in communication and information transfer between hospital‐based and primary care physicians: Implications for patient safety and continuity of care.JAMA.2007;297(8):831–841.
- ,,, et al.Patient safety concerns arising from test results that return after hospital discharge.Ann Intern Med.2005;143(2):121–128.
- ,,.The continuing problem of missed test results in an integrated health system with an advanced electronic medical record.Jt Comm J Qual Patient Saf.2007;33(8):485–492.
- ,.The frequency of missed test results and associated treatment delays in a highly computerized health system.BMC Fam Pract.2007;8:32.
- ,,,,.Design and implementation of a comprehensive outpatient results manager.J Biomed Inform.2003;36(1–2):80–91.
- ,,, et al.Impact of an automated test results management system on patients' satisfaction about test result communication.Arch Intern Med.2007;167(20):2233–2239.
- ,,,,,.“I wish I had seen this test result earlier!”: dissatisfaction with test result management systems in primary care.Arch Intern Med.2004;164(20):2223–2228.
- ,,.Potential impact of a computerized system to report late‐arriving laboratory results in the emergency department.Pediatr Emerg Care.2000;16(5):313–315.
- ,,, et al.Electronic results management in pediatric ambulatory care: Qualitative assessment.Pediatrics.2009;123Suppl 2:S85–S91.
The period following discharge is a vulnerable time for patientsthe prevalence of medical errors related to this transition is high and has important patient safety and medico‐legal ramifications.13 Factors contributing to this vulnerability include complexity of hospitalized patients, shorter lengths of stay, and increased discontinuity of care. Hospitalists have recognized this threat to patient safety and have worked toward improving information exchange between inpatient and outpatient providers at hospital discharge.46 Nonetheless, the evidence suggests that more work is necessary. A recent study found that discharge summaries are often incomplete, and do not contain important information requiring follow‐up, such as pending tests.7 Additionally, a review by Kripalani et al. characterizing information deficits at hospital discharge found few interventions which specifically improve communication of pending tests at hospital discharge.8
In a prior study we determined that 41% of patients left the hospital before all laboratory and radiology test results were finalized. Of these results, 9.4% were potentially actionable and could have altered management. Physicians were aware of only 38% of post‐discharge test results.9 This awareness gap is a consequence of several factors including the lack of systems to track and alert providers of test results finalized post discharge. Also, it is unclear who is responsible for pending tests at discharge, since these tests are ordered by the inpatient physicians but often reported in the time period between hospital discharge and the patient's first follow‐up appointment with the primary care physician (PCP). Because responsibility is not explicitly made in the final communication between physicians at discharge, such test results may not be reviewed in a timely manner, potentially resulting in delays in treatment, a need for readmission, or other unfavorable outcomes.
Even in integrated health systems with advanced electronic health records, missed test results which result in treatment delays remain prevalent.10, 11 Test result management applications aid clinicians in reviewing and acting upon results as they become available and such systems may provide solutions to this problem. At Partners Healthcare in Boston, the Results Manager (RM) application was developed to help clinicians in the ambulatory setting safely, reliably, and efficiently review and act upon test results. The application enables clinicians to prioritize test results, utilize guidelines, and generate letters to patients. This system also prompts physicians to set reminders for future testing.12 In a 2.5‐year study evaluating the impact of this intervention, PCPs at 26 adult primary care practices were able to expedite communication of outpatient laboratory and imaging test results to patients with the help of RM. Patients of physicians who participated in the project reported greater satisfaction with test result communication and with information provided about their condition than did a control group of similar patients.13 RM has not yet been studied in the inpatient setting or at care transitions. We describe an attempt at modifying the Partners RM application to help inpatient physicians manage pending tests at hospital discharge.
Methods
Study Setting and Participants
We piloted our application at 2 major academic medical centers (hospitals A and B) associated with Partners Healthcare, an integrated regional health delivery network in eastern Massachusetts, from October 2004 to March 2005. Both centers use the longitudinal medical record (LMR), the electronic medical record (EMR), for nearly all ambulatory practices. The LMR is an internally developed full‐featured EMR, including a repository of laboratory and radiology reports, discharge summaries, ambulatory care notes, medication lists, problem lists, coded allergies, and other patient data. Both centers also have their own inpatient results viewing and order entry systems which provide clinicians caring for patients in the hospital the ability to review results and write orders. Although possible, clinicians caring for patients in the inpatient setting do not routinely access LMR to view test results. Inpatient physician use of the LMR is generally limited to review of the outpatient record, medication lists, and ambulatory notes at admission.
At hospital A, the hospitalist attending physician is typically responsible for all communication to outpatient physicians at discharge, as well as for follow‐up on all test results that return after discharge. Hospital B has 2 types of hospitalist services. One is staffed only by hospitalist and nonhospitalist attending physicians. Nonhospitalist attending physicians were excluded because they care for their own patients in the inpatient and ambulatory setting and typically use RM to manage test results. The other hospitalist service at hospital B is a teaching service consisting of an attending physician, resident, and interns. For this service, the resident is responsible for communication at discharge and follow‐up on all pending tests. For purposes of this study inpatient physicians refers to those physicians responsible for communication with PCPs and follow‐up on pending tests. All inpatient physicians were eligible to participate during the study period.
Test Result Management Application
RM was originally developed by Partners Healthcare to improve timely review and appropriate management of test results in the ambulatory setting. RM was developed for and vetted by primarily ambulatory physicians. The application is browser‐based, provider‐centric, and embedded in the LMR to help ambulatory clinicians review and act upon test results in a safe, reliable, and efficient manner. Although RM has access to all inpatient and outpatient data in the Partners Clinical Data Repository (CDR), given the volume of inpatient tests ordered, hospital‐based results are suppressed by default to limit inundating ambulatory clinicians' queues. Therefore, users of RM only receive results of laboratory and radiology tests ordered in the ambulatory setting. They can track these tests for specific patients for a designated period of time by placing the patient on a watch list. Finally, RM incorporates extensive decision support features to classify the degree of abnormality for each result, presents guidelines to help clinicians manage abnormal results, allows clinicians to generate result letters to patients using predefined, context‐sensitive templates, and prompts physicians to set reminders for future testing. Because RM was developed from the ambulatory perspective, there was limited input from hospitalist physicians with regard to inpatient workflow in the original design of the module.12 See Figure 1 for a screen shot of RM and a description of its features.
figure can be viewed in the online issue, which is available at wileyonlinelibrary.com.]
For purposes of this pilot, we modified RM to allow results of tests ordered in the inpatient setting to be available for viewing (Hospitalist Results Manager, HRM). This feature was turned on only for inpatient physicians as previously defined. Inpatient tests, including pending tests at discharge, continued to be suppressed from PCP's RM queue (however, any physician could access a patient's test result(s) directly from the Partners CDR). Inpatient physicians could track laboratory and radiology results finalized after discharge by keeping discharged patients on their HRM watch list for a designated period of time. The finalized results would become available for review in their HRM queue and abnormal results were displayed prominently at the top of this queue. Inpatient physicians were trained to use HRM in a series of meetings and demonstrations. Although HRM could be accessed from inpatient clinical workstations, it was not part of the inpatient clinical information system.
Surveys
Study surveys were developed and refined through an iterative process and pilot tested among inpatient physicians at both centers for clarity. We surveyed inpatient physicians five months after HRM implementation. Inpatient physicians were asked how often they used HRM, what barriers they faced (respondents asked to quantify agreement to statements on a 5‐point Likert scale), and which elements of an ideal system they would prefer. Finally, we solicited comments regarding perceived obstacles and suggestions for improvement. Because HRM was targeted to inpatient physicians, and because RM has been evaluated from the ambulatory perspective in a prior study,13 PCPs were not surveyed. See Supporting Information Appendix for the survey instrument used in the study.
Results
A total of 35 inpatient physicians participated in the pilot. Among 649 patients discharged during the study period, there were 1075 tests pending of which 555 were subsequently flagged as abnormal in HRM. Study surveys were sent to the 35 inpatient physician participants and 29 were completed, including partial responses (83% survey response rate). The 35 inpatient physician participants had the following characteristics: 22 were male, 13 were female; 21 were trainees and 14 were nontrainees/faculty. All 21 trainees were PGY2s. Nontrainees and faculty varied in experience level (PGY 15: 5, PGY 610: 7, PGY 1120: 1, PGY 21+: 1). Of 29 survey respondents, 7 were from hospital A and 22 were from hospital B; 19 were trainees and 10 were nontrainees/faculty. Of the 6 nonrespondents, 2 were from hospital A and 4 were from hospital B; 2 were trainees and 4 were nontrainees/faculty.
Table 1 shows the results of our survey of inpatient physicians regarding usage of HRM. Of 29 survey respondents, 14 (48%) reported never using HRM. Thirteen (45%) reported using HRM 1 to 2 times per week. None of the respondents used it more than 4 times per week. The frequency of usage was similar for hospitals A and B. Table 2 details barriers to using HRM. Twenty‐three inpatient physicians (79%) reported barriers. Seventeen (59%) thought that results in their HRM queue were not clinically relevant, 16 (55%) felt that HRM did not fit into their daily workflow, 14 (48%) had limited time to use HRM, and 12 (41%) noted that too many results in their HRM queue were on other physician's patients. Seven (24%) reported operational issues and 3 (10%) reported technical issues prohibiting use of HRM. With regard to preferred elements of an ideal results manager system, 21 (72%) inpatient physician respondents wanted to receive notification of abnormal and clinician‐designated pending test results. Four (14%) wanted to receive only abnormal results and 1 (3%) wanted to receive all results. Twenty‐seven (93%) physicians agreed that an ideally designed computerized test result management application would be valuable for managing pending tests at discharge.
| Frequency | Number of Inpatient Physicians Using HRM, n (%) | ||
|---|---|---|---|
| Overall | Hospital A | Hospital B | |
| |||
| Never | 14 (48) | 3 (43) | 11 (50) |
| 12 times per week | 13 (45) | 3 (43) | 10 (45.5) |
| 34 times per week | 2 (7) | 1 (14) | 1 (4.5) |
| 57 times per week | 0 | 0 | 0 |
| >7 times per week | 0 | 0 | 0 |
| Barrier | Overall, n (%) | Hospital A, n (%) | Hospital B, n (%) |
|---|---|---|---|
| |||
| Forgot to use HRM | 23 (79) | 7 (100) | 16 (73) |
| Results not clinically relevant | 17 (59) | 7 (100) | 10 (45) |
| Did not fit daily workflow | 16 (55) | 7 (100) | 9 (41) |
| Too little time to use HRM | 14 (48) | 6 (86) | 8 (46) |
| Results on others' patients | 12 (41) | 6 (86) | 6 (27) |
| HRM was difficult to use | 7 (24) | 2 (29) | 5 (23) |
| Had technical difficulties | 3 (10) | 0 (0) | 3 (14) |
Table 3 provides comments from inpatient physician respondents regarding obstacles prohibiting use of HRM and suggestions for future systems.
|
| Suggestions |
| Would be more useful if accessible from (the inpatient clinical information system). |
| Email notification (would have been useful). |
| At time of discharge, if there is a way to find pending labs at discharge, this would be of great utility. |
| Linking responsibility for follow‐up to test ordering (would have been useful). |
| Smarter system for filtering results so less important results are filtered out (is desirable). |
| Can the system be tied into PCP's email somehow? |
| Obstacles |
| Blood cultures, abnormal films can be difficult and time‐consuming to look up. |
| A big problem is results that automatically trigger even though they're not clinically relevant. |
| Keeping a record of patients that left with tests pending (is often difficult to do). |
| Addressing pending results is very time consuming. |
Discussion
We describe a pilot implementation of a computerized application for the management of pending tests at hospital discharge. From responses to post‐implementation surveys, we were able to identify multiple factors prohibiting successful implementation of the application. These observations may help inform future interventions and evaluations.
Almost half of inpatient physicians reported never using HRM despite training and reminders. The feedback provided by physicians in our study suggested that HRM was not ideally designed from an inpatient physician perspective. We discovered several barriers to its use: (1) HRM overburdened physicians with clinically irrelevant test results, suggesting that more robust filtering of abnormal but low importance test results may be required (eg, a borderline electrolyte abnormality or low but stable hematocrit); (2) HRM did not integrate well into inpatient workflowthe system was not integrated into the inpatient results viewing and computerized physician order entry (CPOE) applications, and therefore required an extra step to access; (3) there was no mechanism of alerting inpatient physicians that finalized test results were available for viewing in their HRM queues (eg, by email or by an alert in the inpatient computer system); (4) because responsibility for these results was unclear, most inpatient physicians had no formal method of managing them, and for many, using HRM represented an additional task; and finally (5) several physicians commented on finding results in their HRM queue that belonged to other physician's patients, implying that the hospital databases were inaccurate in identifying the discharging physician or that rotation schedules, and therefore patient responsibility, had changed in the intervening period. Table 4 summarizes the advantages and respective limitations of features of HRM available to inpatient physicians.
| Advantages | Limitations |
|---|---|
| |
| Creates a physician‐managed queue of pending test results by patient | Does not provide alert or push notification when new results available for patients |
| Filters test results by severity with most critical results appearing at the top of the queue | Severity filter set for outpatients; not restrictive enough for post‐discharge period, resulting in excessive alerting |
| Independent, voluntary acknowledgement of results by user | Active acknowledgment not required; no audit trail, feedback, or escalation if result not acknowledged |
| Embedded within LMR (the ambulatory EMR) | LMR not routinely used by many inpatient physicians |
| Offers patient communication tools (eg, pre‐populated patient results letter) | Tools not optimized for post‐discharge test result communication by inpatient physicians (eg, a tool for PCP result notification and acknowledgment) |
In the literature, there is little information regarding optimal features of a test result management system for transitions from the inpatient to ambulatory care setting. Prior studies outline important functions for results management systems developed for noninpatient sites of care, including the ambulatory and emergency room setting.12, 14, 15 These include a method of prioritizing by degree of abnormality, the ability to reliably and efficiently act upon results, and an automated alerting system for abnormal results. Findings from our study provide insight in defining core functions for result management systems which focus on transitions from the inpatient to ambulatory care setting. These functions include tight integration with applications used by inpatient physicians, clear assignment of responsibility for test results finalized after hospital discharge (as well as a mechanism to reassign responsibility), automated alerts to responsible providers of test results finalized post‐discharge, and ways to automatically filter test results to avoid over‐burdening physicians with clinically irrelevant results.
Almost all surveyed inpatient physicians agreed that an ideally designed electronic post‐discharge results management system would be valuable. For such systems to be successfully adopted, we offer several principles to help guide future work. These include: (1) clarifying responsibility at the time a test is ordered and again at discharge, (2) understanding workflow and communication patterns among inpatient and outpatient clinicians, and (3) integrating technological solutions into existing systems to minimize workflow disruptions. For example, if the primary responsibility for post‐discharge result follow‐up lies with the ordering physician, the system should be integrated within the EMR most often used by inpatient physicians and become part of inpatient physician workflow. If the system depends on administrative databases to identify the responsible providers, these must be accurate. Alternatively, in organizations with computerized provider order entry, responsibility for the result could be assigned when the test is ordered and confirmed at discharge (ie, the results management system would be integrated into the discharge order such that pending tests are reviewed at the time of discharge). The discharging physician should have the ability to assign responsibility for each pending test and select preferred mode(s) of notification once its result is finalized (eg, e‐mail, alphanumeric page, etc.). The system should have the ability to generate an automatic notification to the inpatient and PCP (and perhaps other designated providers involved in the patient's inpatient care), but it should not burden busy clinicians with unnecessary alerts and warnings. Finally, the rules by which results are prioritized must be robust enough to filter out less urgent results, and should be modified to reflect the severity of illness of recently discharged patients. In essence, in consideration of the time constraints of busy clinicians, an ideal results management system should achieve automated notification of test results while minimizing the risk of alert fatigue from the potentially large volume of alerts generated.
Our study has several important limitations. First, although our survey response rate was high, the sample size of actual participants was small. Second, because the study was conducted in 2 similar, tertiary care academic centers, it may not generalize to other settings (we note that hospital B included a nonteaching service similar to those in nonacademic medical centers). This may be particularly true in assessing the importance of specific barriers to use of results management systems, which may vary at different institutions. Third, the representation of survey respondents were skeweda majority of the responses were from trainees (all post‐graduate level [PGY] level 2) and from hospital B. Fourth, we did not actively monitor physician interaction with the test result management application, and therefore, we depended heavily on physician recollection of use of the system when responding to surveys. Finally, we did not convene focus groups of key individuals with regard to the factors facilitating or prohibiting adoption of the system. Use of semi‐structured, key informant interviews (ie, focus groups) before and after implementation of an electronic results management application, have been shown to be effective in evaluating potential barriers and facilitators of adoption.16 Focus groups of and/or interviews with inpatient and PCPs, physician extenders, and housestaff could have been useful to better characterize the potential barriers and facilitators of adoption noted by survey respondents in our study.
In summary, we offer several lessons from our attempt to implement a system to manage pending tests at hospital discharge. The success of implementing future systems to address this patient safety concern will rely on accurately assigning responsibility for these test results, integrating the system within clinical information systems commonly used by the inpatient physician, addressing workflow issues and time constraints, maximizing appropriateness of alerting, and minimizing alert fatigue.
- ,,,,.The incidence and severity of adverse events affecting patients after discharge from the hospital.Ann Intern Med.2003;138(3):161–167.
- ,,,.Medical errors related to discontinuity of care from an inpatient to an outpatient setting.J Gen Intern Med.2003;18(8):646–651.
- .Key legal principles for hospitalists.Am J Med.2001;111(9B):5S–9S.
- ,,.Passing the clinical baton: 6 principles to guide the hospitalist.Am J Med.2001;111(9B):36S–39S.
- ,.Lost in transition: challenges and opportunities for improving the quality of transitional care.Ann Intern Med.2004;141(7):533–536.
- ,,,.Promoting effective transitions of care at hospital discharge: a review of key issues for hospitalists.J Hosp Med.2007;2(5):314–323.
- ,,, et al.Adequacy of hospital discharge summaries in documenting tests with pending results and outpatient follow‐up providers.J Gen Intern Med.2009;24(9):1002–1006.
- ,,,,,.Deficits in communication and information transfer between hospital‐based and primary care physicians: Implications for patient safety and continuity of care.JAMA.2007;297(8):831–841.
- ,,, et al.Patient safety concerns arising from test results that return after hospital discharge.Ann Intern Med.2005;143(2):121–128.
- ,,.The continuing problem of missed test results in an integrated health system with an advanced electronic medical record.Jt Comm J Qual Patient Saf.2007;33(8):485–492.
- ,.The frequency of missed test results and associated treatment delays in a highly computerized health system.BMC Fam Pract.2007;8:32.
- ,,,,.Design and implementation of a comprehensive outpatient results manager.J Biomed Inform.2003;36(1–2):80–91.
- ,,, et al.Impact of an automated test results management system on patients' satisfaction about test result communication.Arch Intern Med.2007;167(20):2233–2239.
- ,,,,,.“I wish I had seen this test result earlier!”: dissatisfaction with test result management systems in primary care.Arch Intern Med.2004;164(20):2223–2228.
- ,,.Potential impact of a computerized system to report late‐arriving laboratory results in the emergency department.Pediatr Emerg Care.2000;16(5):313–315.
- ,,, et al.Electronic results management in pediatric ambulatory care: Qualitative assessment.Pediatrics.2009;123Suppl 2:S85–S91.
Copyright © 2010 Society of Hospital Medicine

Nonphysicians in Hospital Medicine
Ford and Britting's1 editorial in this month's Journal of Hospital Medicine raises important questions concerning the use of nonphysician providers in hospital medicine. They focus primarily on the use of mid‐level providers (MLPs), namely physician‐assistants (PAs) and nurse practitioners (NPs), as a potential solution to the current physician workforce shortages in our field. While we acknowledge the challenges of meeting workforce needs, we also believe that much is unknown about the optimal use of MLPs on inpatient general medicine services and it is premature to tout MLPs as the solution to hospital medicine staffing problems. This is especially true in those hospitals where hospitalists care for complex, general medical patients with a wide variety of medical conditions, a trend that is especially common in academic medical centers.2
This article discusses the current literature, our own experiences with MLPs, and suggests some future initiatives that might help better integrate MLPs into hospital medicine.
The Literature on MLPs in Inpatient Venues
The existing literature on the use of MLPs in inpatient venues is quite limited, and a recent review, while suggesting that the existing literature does describe benefits of MLPs in the inpatient setting, also states that the overall quality of the evidence is quite poor and that many studies suffer from significant limitations, including small populations, limited patient mixes, use of selected settings, and short durations of outcome assessment.3
Ford and Britting,1 in their article, cite several studies46 as evidence that a MLP model of care either improved outcomes or provided cost benefits. Each of these studies has important limitations that are worth examining.
The study by Myers et al.4 described the use of MLPs in a chest pain unit. NPs partnered with hospitalists to care for a low‐acuity chest pain population. In addition, 5 NPs only staffed the unit during daytime weekday hours. Off‐hour and weekend staffing was accomplished through the use of resident physicians. Notably, the work suggests the service only admitted 113 low‐risk patients over 10 months. The service was staffed by 3 full‐time equivalent (FTE) NPs in addition to involving hospitalists during the day. It is not surprising, given the extremely low volume of patients coupled with a daytime‐only focus, that this service showed efficiency gains. In addition, given the service was only staffed by NPs 40 hours a week and by resident physicians on nights and weekends, the true cost of such an intervention needs to take into account the full cost of 24/7 coverage. In addition, the model of using residents to cover nonteaching patients is no longer permitted by the current Accreditation Council for Graduate Medical Education (ACGME) Internal Medicine Residency Requirements7 and thus implementation of a model such as this in 2009 would require alternative means of nighttime coverage.
The study by Nishimura et al.,5 also describing the use of MLPs in cardiovascular care, has important caveats that make full assessment of the model impossible. The model describes the implementation of a care team consisting of an attending, a fellow, and MLPs to replace a traditional teaching team of an attending, senior resident, and 2 interns. The study states that the model resulted in a lower length of stay (LOS) and lower costs per case. Importantly, the new MLP‐based team only admitted during the hours of 7 AM to 2 PM. The study does not fully describe the number of MLPs required nor does it fully describe the role of cardiovascular fellows in the model. The study does state that the cost savings offset the cost of the MLPs but it is not clear if this cost analysis took into account the cost of the fellow's daytime involvement or if it measured attending time required before and after the implementation of the new model. In addition, this model presumes the availability of other services to admit patients during afternoon and nighttime hours and so may not be generalizable to other settings.
The final study by Cowan et al.6 describes the addition of a NP, a hospitalist medical director, and daily multidisciplinary rounds to a traditional teaching service model. Importantly, the NP was not involved in the admission process nor were they the primary providers for day‐to‐day medical care but rather they focused on implementation of care protocols, multidisciplinary coordination of care and discharge planning, and postdischarge follow‐up. In addition, the NP worked only weekdays for about 40 hours a week. It is not surprising that adding multiple additional resources to existing care models might provide benefits but this does not address any issues in terms of the workforce since the care in this model required a higher total input of providers than the usual care model being studied. Cost savings from such a model may make it cost‐effective but it does not represent a workforce solution.
There have been other studies examining the use of MLPs in the inpatient setting in internal medicine. Some of these studies have suggested that MLP‐based models result in equivalent outcomes and efficiency810 to traditional teaching or nonteaching physician‐only models. There are 2 important caveats, however, that must be considered. The total resources required for such models may be quite high, especially taking into account the costs of 24/7 coverage and physician backup of the MLPs, and most importantly there is almost no literature that robustly examines ultimate clinical outcomes in these models. We do note that a recent study11 did show a lower inpatient mortality rate over a 2‐year period of time after substituting a PA‐hospitalist model for a traditional academic medicine residency model in a community hospital. Importantly, however, the new model also added 24/7 hospitalist physicians and night and weekend intensivists that were not present in the prior residency‐based model. Thus, the lower mortality rate could be attributed to the addition of hospitalists or the more robust in‐house physician coverage during off‐hours rather than the use of MLPs.
Notably, while the evidence base in internal medicine is not robust, many studies have described successful use of MLPs in non‐internal medicine inpatient settings.1214 The reasons for this success is debatable, but it may be that MLPs are more successful in settings where the care is either more protocol‐driven or where there is less diagnostic and therapeutic complexity.
Recent Experiences with MLPs in Academic Hospital Medicine
Given the paucity of data, it is clear that further research is needed on the role of MLPs in hospital medicine. While waiting for such evidence to appear, it may be worthwhile to reflect on the recent experience of 3 major medical centers. A recent article described 5 hospitalist models at major academic medical centers across the country. Two of the institutions described at the time (University of Michigan Health System, Ann Arbor, MI; and Brigham and Women's Hospital, Boston, MA) utilized MLPs as a major element of their staffing of nonresident hospitalist services while another (University of California, San Francisco [UCSF] Medical Center at Mt. Zion, San Francisco, CA) had previously used MLPs as part of its model but phased them out about 1 year prior to publication of the article.2 The model used by the Brigham and Women's Hospital was later described in more detail in a subsequent publication.8 Recently 1 of these institutions (Michigan) has chosen to phase out MLPs. At Michigan, a 4‐year experience with PAs on a general‐medicine focused hospitalist service eventually led to the conclusion that continued use of PAs was not cost‐effective. Significant barriers to success included a steep learning curve and the significant time required before PAs developed sufficient autonomy and efficiency in caring for a highly complex heterogeneous patient population. In the Michigan experience, PAs took up to 2 years to attain a significant level of autonomy and efficiency and even then some PAs still required a significant amount of physician oversight. Similar concerns at UCSF Mt. Zion led to the elimination of their MLP program as well. At Brigham and Women's, the MLP service continues but has required additional hospitalist staffing due to difficulties recruiting qualified MLPs with appropriate inpatient experience. In all cases, the models were challenged by high costs and the difficulty of developing MLPs to attain the level of autonomy and efficiency needed to justify their continued use. A key point is that in each institution, MLPs continue to play an important role in some specialty inpatient areas such as Hematology/Oncology and Bone Marrow Transplant, which is where MLPs have traditionally found their niche in inpatient Internal Medicine. These focus shops allow MLPs to develop a niche and expertise in a specialized area, where they may become more autonomous and efficient than house staff. Thus these settings may be more appropriate for MLPs than a heterogeneous general medicine inpatient setting.
Reviewing the Financial Case
In their article, Ford and Britting1 cite potential financial advantages for the use of MLPs in hospital medicine by comparing the relative salaries of MLPs to Hospitalists. What was missing in their analysis was the relative productivity of the 2 types of providers. We do have some limited data from the Society of Hospital Medicine (SHM) annual survey that looks at MLPs in hospital medicine but, again, the number of respondents for most data elements is less than 70, making generalizability difficult. Nonetheless, the data suggest that MLPs in hospital medicine average about 60% to 75% of the productivity of a physician when measured by encounters, although there is wide variability depending on the employment model (academic vs. multispecialty group).15 Importantly, the existing data do not provide any measure of how much physician input is provided to these MLPs but we suspect that in most models there is some physician time and input. If we presume that the MLPs bill independently and collect 85% of the physician fee schedule for a Medicare population, then collections would be about 50% to 65% of a typical physician. Given that median total compensation including benefits from the SHM survey was $120,000 for MLPs and $216,000 for physiciansabout a 55% ratiothis would argue for potential financial neutrality when substituting MLPs for physicians in a 2:1 ratio but only if we presume they require no physician supervision, which in our own experience is not likely in a general medicine population. In an alternative model, in which the physician sees every patient with the MLP and the physician bills, one would need to see roughly 50% more patients to achieve a financially neutral situation. In our experience at our own institutions, this level of increased productivity was not achievable. It is important to note that our figures are median compensation and benefit cost figures and local markets vary widely. We know that in major east and west coast cities MLPs may command far higher salaries while early career hospitalist physicians may be paid somewhat less than the reported medians. Recent market changes have significantly pressured MLP salaries,15, 16 further impacting the financial equation and perhaps tilting it farther against a financial benefit for MLPs. Furthermore, night coverage for MLP services should always be considered in a financial analysis and is not captured in this simple analysis.
Next Steps
Given the current shortage of physicians, we imagine that many hospitalist groups will consider the use of MLPs as a solution to the current workforce issues. However, data on how best to utilize MLPs and the true impact on both the cost and quality of such models is lacking. In addition to urging increased publication and dissemination of existing experiences with NP and PAs, we strongly suggest that groups considering starting a MLP model do so in a way which would facilitate robust analysis and comparison of the model with alternatives. We also suggest that SHM consider the following: modifying its biennial survey to better capture the nuances of MLP productivity (such as assessing the amount of physician input and supervision required); targeting MLPs so as to increase the number of respondents; and doing an additional survey to capture demographics and basic data on existing MLP models given the lack of published literature.
In addition to gathering more data on effective models, a critical gap that we have identified is the development of models for the training and development of MLPs interested in hospital medicine. It would be a mistake to believe that MLPs could function in a manner similar to residency‐trained physicians if they do not undergo similar training. NP/PA programs generally do not have a significant inpatient internal medicine focus and so newly minted graduates often lack the skills needed to succeed in hospital medicine.17 Some hospitalist programs train their MLPs on the job, but many programs cannot afford the amount of time and effort required to do this on their own. There are a small number of advanced training options for MLPs in hospital medicine18 but it is not likely such models will proliferate given the inherent opportunity costs that exist for extended training in the current competitive job market for MLPs. Instead we think that very motivated hospital medicine groups may develop training relationships with PA and NP schools in an effort to train their own. In addition, national initiatives such as the Hospital Medicine Boot Camp for NPs and PAs, which is cosponsored by SHM, the American Association of Physician Assistants (AAPA), and the American Academy of Nurse Practitioners (AANP),19 can help fill the educational needs for MLPs who are already in practice.
Conclusions
While some literature exists that suggests that MLPs can successfully be used in the inpatient internal medicine setting, it is important to note that the evidence is quite limited and cannot be generalized across all care settings and patient populations. There is an urgent need to gather more data and share our collective experiences to better inform our decision‐making before we state that MLPs are the solution to workforce shortages in hospital medicine. In addition, existing data and experience suggest that MLPs may not be a cost‐effective workforce solution for complex general medical patients who require significant physician input. We believe that redesigning the clinical training of MLPs to focus on inpatient skills may hold promise and encourage interested parties to consider developing partnerships with MLP training programs and hospital medicine groups, as a way to build a more robust and successful hospital medicine MLP workforce.
- ,.Nonphysician providers in the hospitalist model: a prescription for change and a warning about unintended side effects.J Hosp Med.2010;5:99–102.
- ,,,,.Non‐housestaff medicine services in academic medical centers: models and challenges.J Hosp Med.2008;3:247–255.
- ,,.Nurse practitioners and physician assistants in the intensive care unit: an evidence‐based review.Crit Care Med.2008;36:2888–2897.
- ,,.Improving resource utilization in a teaching hospital: development of a nonteaching service for chest pain admissions.Acad Med.2006;81:432–435.
- ,,,,,.A nonresident cardiovascular inpatient service improves residents' experiences in an academic medical center: a new model to meet the challenges of the new millennium.Acad Med.2004;79;426–431.
- .The effect of a multidisciplinary hospitalist/physician and advance practice nurse collaboration on hospital care.J Nurs Adm.2006;36:79–85.
- Accreditation Council for Graduate Medical Education. ACGME Program Requirements for Residency Education in Internal Medicine. Available at: http://www.acgme.org/acWebsite/downloads/RRC_progReq/140_internal_ medicine_07012009.pdf. Accessed July2009.
- ,,, et al.Implementation of a physician assistant/hospitalist service in an academic medical center: impact on efficiency and patient outcomes.J Hosp Med.2008;3:361–368.
- ,,.Resource use by physician assistant services versus teaching services.JAAPA.2002;15:33–38.
- ,,,, et al.Outcomes‐based trial of an inpatient nurse practitioner service for general medical patients.J Eval Clin Pract.2001;7:21–33.
- ,.Replacing an academic internal medicine residency program with a physician assistant‐hospitalist model: a comparative analysis study.Am J Med Qual.2009;2:132–139.
- ,,,,.Integrating midlevel practitioners into a teaching service.Am J Surg.2006;1:119–124.
- ,,, et al.Physician extenders impact trauma systems.J Trauma.2005;58(5):917–920.
- ,.Physician assistants in cardiothoracic surgery: a 30‐year experience in a university center.Ann Thorac Surg.2006;1:195–199.
- 2007–2008 Society of Hospital Medicine Bi‐Annual Survey: the Authoritative Source on the State of the Hospital Medicine Movement.Philadelphia:Society of Hospital Medicine;2008.
- American Association of Physician Assistants. Physician Assistant Income. Available at: http://www.aapa.org/images/stories/iu08incchange. pdf. Accessed July2009.
- Accreditation Review Commission on Education for the Physician Assistant. Accreditation Standards for Physician Assistant Education, 3rd ed. Available at: http://www.arcpa.org/Standards/3rdeditionwithPDchangesandregionals4.24.08a.pdf. Accessed July2009.
- Association of Postgraduate PA Programs. Postgraduate PA Program Listing by State. Available at: http://www.appap.org/index1.html. Accessed July2009.
- American Association of Physician Assistants. Adult Hospitalist Physician Assistant and Nurse Practitioner Boot Camp. Available at: http://www. aapa.org/component/content/article/23‐‐general‐/673‐adult‐hospitalist‐physician‐assistant‐and‐nurse‐practitioner‐boot‐camp. Accessed July2009.
Ford and Britting's1 editorial in this month's Journal of Hospital Medicine raises important questions concerning the use of nonphysician providers in hospital medicine. They focus primarily on the use of mid‐level providers (MLPs), namely physician‐assistants (PAs) and nurse practitioners (NPs), as a potential solution to the current physician workforce shortages in our field. While we acknowledge the challenges of meeting workforce needs, we also believe that much is unknown about the optimal use of MLPs on inpatient general medicine services and it is premature to tout MLPs as the solution to hospital medicine staffing problems. This is especially true in those hospitals where hospitalists care for complex, general medical patients with a wide variety of medical conditions, a trend that is especially common in academic medical centers.2
This article discusses the current literature, our own experiences with MLPs, and suggests some future initiatives that might help better integrate MLPs into hospital medicine.
The Literature on MLPs in Inpatient Venues
The existing literature on the use of MLPs in inpatient venues is quite limited, and a recent review, while suggesting that the existing literature does describe benefits of MLPs in the inpatient setting, also states that the overall quality of the evidence is quite poor and that many studies suffer from significant limitations, including small populations, limited patient mixes, use of selected settings, and short durations of outcome assessment.3
Ford and Britting,1 in their article, cite several studies46 as evidence that a MLP model of care either improved outcomes or provided cost benefits. Each of these studies has important limitations that are worth examining.
The study by Myers et al.4 described the use of MLPs in a chest pain unit. NPs partnered with hospitalists to care for a low‐acuity chest pain population. In addition, 5 NPs only staffed the unit during daytime weekday hours. Off‐hour and weekend staffing was accomplished through the use of resident physicians. Notably, the work suggests the service only admitted 113 low‐risk patients over 10 months. The service was staffed by 3 full‐time equivalent (FTE) NPs in addition to involving hospitalists during the day. It is not surprising, given the extremely low volume of patients coupled with a daytime‐only focus, that this service showed efficiency gains. In addition, given the service was only staffed by NPs 40 hours a week and by resident physicians on nights and weekends, the true cost of such an intervention needs to take into account the full cost of 24/7 coverage. In addition, the model of using residents to cover nonteaching patients is no longer permitted by the current Accreditation Council for Graduate Medical Education (ACGME) Internal Medicine Residency Requirements7 and thus implementation of a model such as this in 2009 would require alternative means of nighttime coverage.
The study by Nishimura et al.,5 also describing the use of MLPs in cardiovascular care, has important caveats that make full assessment of the model impossible. The model describes the implementation of a care team consisting of an attending, a fellow, and MLPs to replace a traditional teaching team of an attending, senior resident, and 2 interns. The study states that the model resulted in a lower length of stay (LOS) and lower costs per case. Importantly, the new MLP‐based team only admitted during the hours of 7 AM to 2 PM. The study does not fully describe the number of MLPs required nor does it fully describe the role of cardiovascular fellows in the model. The study does state that the cost savings offset the cost of the MLPs but it is not clear if this cost analysis took into account the cost of the fellow's daytime involvement or if it measured attending time required before and after the implementation of the new model. In addition, this model presumes the availability of other services to admit patients during afternoon and nighttime hours and so may not be generalizable to other settings.
The final study by Cowan et al.6 describes the addition of a NP, a hospitalist medical director, and daily multidisciplinary rounds to a traditional teaching service model. Importantly, the NP was not involved in the admission process nor were they the primary providers for day‐to‐day medical care but rather they focused on implementation of care protocols, multidisciplinary coordination of care and discharge planning, and postdischarge follow‐up. In addition, the NP worked only weekdays for about 40 hours a week. It is not surprising that adding multiple additional resources to existing care models might provide benefits but this does not address any issues in terms of the workforce since the care in this model required a higher total input of providers than the usual care model being studied. Cost savings from such a model may make it cost‐effective but it does not represent a workforce solution.
There have been other studies examining the use of MLPs in the inpatient setting in internal medicine. Some of these studies have suggested that MLP‐based models result in equivalent outcomes and efficiency810 to traditional teaching or nonteaching physician‐only models. There are 2 important caveats, however, that must be considered. The total resources required for such models may be quite high, especially taking into account the costs of 24/7 coverage and physician backup of the MLPs, and most importantly there is almost no literature that robustly examines ultimate clinical outcomes in these models. We do note that a recent study11 did show a lower inpatient mortality rate over a 2‐year period of time after substituting a PA‐hospitalist model for a traditional academic medicine residency model in a community hospital. Importantly, however, the new model also added 24/7 hospitalist physicians and night and weekend intensivists that were not present in the prior residency‐based model. Thus, the lower mortality rate could be attributed to the addition of hospitalists or the more robust in‐house physician coverage during off‐hours rather than the use of MLPs.
Notably, while the evidence base in internal medicine is not robust, many studies have described successful use of MLPs in non‐internal medicine inpatient settings.1214 The reasons for this success is debatable, but it may be that MLPs are more successful in settings where the care is either more protocol‐driven or where there is less diagnostic and therapeutic complexity.
Recent Experiences with MLPs in Academic Hospital Medicine
Given the paucity of data, it is clear that further research is needed on the role of MLPs in hospital medicine. While waiting for such evidence to appear, it may be worthwhile to reflect on the recent experience of 3 major medical centers. A recent article described 5 hospitalist models at major academic medical centers across the country. Two of the institutions described at the time (University of Michigan Health System, Ann Arbor, MI; and Brigham and Women's Hospital, Boston, MA) utilized MLPs as a major element of their staffing of nonresident hospitalist services while another (University of California, San Francisco [UCSF] Medical Center at Mt. Zion, San Francisco, CA) had previously used MLPs as part of its model but phased them out about 1 year prior to publication of the article.2 The model used by the Brigham and Women's Hospital was later described in more detail in a subsequent publication.8 Recently 1 of these institutions (Michigan) has chosen to phase out MLPs. At Michigan, a 4‐year experience with PAs on a general‐medicine focused hospitalist service eventually led to the conclusion that continued use of PAs was not cost‐effective. Significant barriers to success included a steep learning curve and the significant time required before PAs developed sufficient autonomy and efficiency in caring for a highly complex heterogeneous patient population. In the Michigan experience, PAs took up to 2 years to attain a significant level of autonomy and efficiency and even then some PAs still required a significant amount of physician oversight. Similar concerns at UCSF Mt. Zion led to the elimination of their MLP program as well. At Brigham and Women's, the MLP service continues but has required additional hospitalist staffing due to difficulties recruiting qualified MLPs with appropriate inpatient experience. In all cases, the models were challenged by high costs and the difficulty of developing MLPs to attain the level of autonomy and efficiency needed to justify their continued use. A key point is that in each institution, MLPs continue to play an important role in some specialty inpatient areas such as Hematology/Oncology and Bone Marrow Transplant, which is where MLPs have traditionally found their niche in inpatient Internal Medicine. These focus shops allow MLPs to develop a niche and expertise in a specialized area, where they may become more autonomous and efficient than house staff. Thus these settings may be more appropriate for MLPs than a heterogeneous general medicine inpatient setting.
Reviewing the Financial Case
In their article, Ford and Britting1 cite potential financial advantages for the use of MLPs in hospital medicine by comparing the relative salaries of MLPs to Hospitalists. What was missing in their analysis was the relative productivity of the 2 types of providers. We do have some limited data from the Society of Hospital Medicine (SHM) annual survey that looks at MLPs in hospital medicine but, again, the number of respondents for most data elements is less than 70, making generalizability difficult. Nonetheless, the data suggest that MLPs in hospital medicine average about 60% to 75% of the productivity of a physician when measured by encounters, although there is wide variability depending on the employment model (academic vs. multispecialty group).15 Importantly, the existing data do not provide any measure of how much physician input is provided to these MLPs but we suspect that in most models there is some physician time and input. If we presume that the MLPs bill independently and collect 85% of the physician fee schedule for a Medicare population, then collections would be about 50% to 65% of a typical physician. Given that median total compensation including benefits from the SHM survey was $120,000 for MLPs and $216,000 for physiciansabout a 55% ratiothis would argue for potential financial neutrality when substituting MLPs for physicians in a 2:1 ratio but only if we presume they require no physician supervision, which in our own experience is not likely in a general medicine population. In an alternative model, in which the physician sees every patient with the MLP and the physician bills, one would need to see roughly 50% more patients to achieve a financially neutral situation. In our experience at our own institutions, this level of increased productivity was not achievable. It is important to note that our figures are median compensation and benefit cost figures and local markets vary widely. We know that in major east and west coast cities MLPs may command far higher salaries while early career hospitalist physicians may be paid somewhat less than the reported medians. Recent market changes have significantly pressured MLP salaries,15, 16 further impacting the financial equation and perhaps tilting it farther against a financial benefit for MLPs. Furthermore, night coverage for MLP services should always be considered in a financial analysis and is not captured in this simple analysis.
Next Steps
Given the current shortage of physicians, we imagine that many hospitalist groups will consider the use of MLPs as a solution to the current workforce issues. However, data on how best to utilize MLPs and the true impact on both the cost and quality of such models is lacking. In addition to urging increased publication and dissemination of existing experiences with NP and PAs, we strongly suggest that groups considering starting a MLP model do so in a way which would facilitate robust analysis and comparison of the model with alternatives. We also suggest that SHM consider the following: modifying its biennial survey to better capture the nuances of MLP productivity (such as assessing the amount of physician input and supervision required); targeting MLPs so as to increase the number of respondents; and doing an additional survey to capture demographics and basic data on existing MLP models given the lack of published literature.
In addition to gathering more data on effective models, a critical gap that we have identified is the development of models for the training and development of MLPs interested in hospital medicine. It would be a mistake to believe that MLPs could function in a manner similar to residency‐trained physicians if they do not undergo similar training. NP/PA programs generally do not have a significant inpatient internal medicine focus and so newly minted graduates often lack the skills needed to succeed in hospital medicine.17 Some hospitalist programs train their MLPs on the job, but many programs cannot afford the amount of time and effort required to do this on their own. There are a small number of advanced training options for MLPs in hospital medicine18 but it is not likely such models will proliferate given the inherent opportunity costs that exist for extended training in the current competitive job market for MLPs. Instead we think that very motivated hospital medicine groups may develop training relationships with PA and NP schools in an effort to train their own. In addition, national initiatives such as the Hospital Medicine Boot Camp for NPs and PAs, which is cosponsored by SHM, the American Association of Physician Assistants (AAPA), and the American Academy of Nurse Practitioners (AANP),19 can help fill the educational needs for MLPs who are already in practice.
Conclusions
While some literature exists that suggests that MLPs can successfully be used in the inpatient internal medicine setting, it is important to note that the evidence is quite limited and cannot be generalized across all care settings and patient populations. There is an urgent need to gather more data and share our collective experiences to better inform our decision‐making before we state that MLPs are the solution to workforce shortages in hospital medicine. In addition, existing data and experience suggest that MLPs may not be a cost‐effective workforce solution for complex general medical patients who require significant physician input. We believe that redesigning the clinical training of MLPs to focus on inpatient skills may hold promise and encourage interested parties to consider developing partnerships with MLP training programs and hospital medicine groups, as a way to build a more robust and successful hospital medicine MLP workforce.
- ,.Nonphysician providers in the hospitalist model: a prescription for change and a warning about unintended side effects.J Hosp Med.2010;5:99–102.
- ,,,,.Non‐housestaff medicine services in academic medical centers: models and challenges.J Hosp Med.2008;3:247–255.
- ,,.Nurse practitioners and physician assistants in the intensive care unit: an evidence‐based review.Crit Care Med.2008;36:2888–2897.
- ,,.Improving resource utilization in a teaching hospital: development of a nonteaching service for chest pain admissions.Acad Med.2006;81:432–435.
- ,,,,,.A nonresident cardiovascular inpatient service improves residents' experiences in an academic medical center: a new model to meet the challenges of the new millennium.Acad Med.2004;79;426–431.
- .The effect of a multidisciplinary hospitalist/physician and advance practice nurse collaboration on hospital care.J Nurs Adm.2006;36:79–85.
- Accreditation Council for Graduate Medical Education. ACGME Program Requirements for Residency Education in Internal Medicine. Available at: http://www.acgme.org/acWebsite/downloads/RRC_progReq/140_internal_ medicine_07012009.pdf. Accessed July2009.
- ,,, et al.Implementation of a physician assistant/hospitalist service in an academic medical center: impact on efficiency and patient outcomes.J Hosp Med.2008;3:361–368.
- ,,.Resource use by physician assistant services versus teaching services.JAAPA.2002;15:33–38.
- ,,,, et al.Outcomes‐based trial of an inpatient nurse practitioner service for general medical patients.J Eval Clin Pract.2001;7:21–33.
- ,.Replacing an academic internal medicine residency program with a physician assistant‐hospitalist model: a comparative analysis study.Am J Med Qual.2009;2:132–139.
- ,,,,.Integrating midlevel practitioners into a teaching service.Am J Surg.2006;1:119–124.
- ,,, et al.Physician extenders impact trauma systems.J Trauma.2005;58(5):917–920.
- ,.Physician assistants in cardiothoracic surgery: a 30‐year experience in a university center.Ann Thorac Surg.2006;1:195–199.
- 2007–2008 Society of Hospital Medicine Bi‐Annual Survey: the Authoritative Source on the State of the Hospital Medicine Movement.Philadelphia:Society of Hospital Medicine;2008.
- American Association of Physician Assistants. Physician Assistant Income. Available at: http://www.aapa.org/images/stories/iu08incchange. pdf. Accessed July2009.
- Accreditation Review Commission on Education for the Physician Assistant. Accreditation Standards for Physician Assistant Education, 3rd ed. Available at: http://www.arcpa.org/Standards/3rdeditionwithPDchangesandregionals4.24.08a.pdf. Accessed July2009.
- Association of Postgraduate PA Programs. Postgraduate PA Program Listing by State. Available at: http://www.appap.org/index1.html. Accessed July2009.
- American Association of Physician Assistants. Adult Hospitalist Physician Assistant and Nurse Practitioner Boot Camp. Available at: http://www. aapa.org/component/content/article/23‐‐general‐/673‐adult‐hospitalist‐physician‐assistant‐and‐nurse‐practitioner‐boot‐camp. Accessed July2009.
Physician Assistant/Hospitalist Service
Midlevel providers (physician assistants and nurse practitioners) have long been employed by academic medical centers, predominantly on surgical services, or on medical subspecialty services, where they have typically had a limited scope of practice, focused in a narrowly defined area or set of procedures.17 In contrast, there are relatively few reports of experiences deploying midlevel providers to replace house staff on inpatient general medicine services in academic centers,810 and few studies of the effect of midlevel providers on quality and efficiency of care in the academic setting. Despite this, reductions in house officer duty hours as mandated by the Accreditation Council on Graduate Medical Education (ACGME)11 have resulted in academic centers increasingly using midlevel providers to decrease house staff workload on inpatient services.12, 13 In general, midlevel practitioners on general medicine services have been deployed to: (1) care for a population of patients separate from and in parallel with house staff; this population may be narrowly defined (eg, patients with chest pain) or not; (2) assist with the management of patients cared for by house staff by performing certain tasks (eg, scheduling appointments, discharging patients). Even as midlevel providers become more prevalent on academic general medicine services, the best model of care incorporating them into clinical care remains unclear, and few studies have rigorously examined the care provided on services that use them.
We developed an inpatient general medicine service within a large academic medical center staffed by physician assistants and hospitalists to help our residency program meet ACGME duty hour requirements. We hypothesized that by creating a service that is geographically localized and supervised by full‐time hospitalists, by instituting multidisciplinary rounds, and by investing in the professional development of highly‐skilled physician assistants, we could provide care for medically complex, acutely ill general medicine inpatients with similar quality and efficiency as compared to house staff teams. We report our experience during the first year of implementing the service, and compare quality and efficiency of care on this service with that of our traditional house staff services. We also evaluate the effects of this service on patient satisfaction and self‐reported house staff workload.
PATIENTS AND METHODS
Study Setting
The study was conducted in a 747‐bed urban, academic medical center in the northeastern United States. The hospital's human research committee reviewed and approved the study design. The hospital has accredited residency and fellowship programs in all major specialties. Prior to July 2005, physician assistants were employed only on surgical and medical subspecialty services (ie, bone marrow transplant, interventional cardiology); none were employed on the inpatient general medicine service. There were approximately 44,000 inpatient admissions during the year of the study, with approximately 6500 of these to the general medicine service.
Description of the General Medicine Service
The General Medicine Service consisted of 8 traditional house staff teams, with 1 attending, 1 junior or senior resident, 2 interns, and 1 or 2 medical students. These teams admitted patients on a rotating basis every fourth day. On 4 of these teams, the attending was a hospitalist, with clinical responsibility for the majority of the patients admitted to the team. On the remaining 4 teams, the teaching attending was a primary care physician or medical subspecialist, responsible for the direct care of a small number of the team's patients, with the remainder cared for by private primary care physicians or subspecialists.
Description of the Physician Assistant/Hospitalist Service
The Physician Assistant/Clinician Educator (PACE) service opened in July 2005, and consisted of 15 beds localized to 2 adjacent inpatient pods, staffed by a single cadre of nurses and medically staffed by 1 hospitalist and 2 physician assistants from 7:00 AM to 7:00 PM on weekdays and by 1 hospitalist, 1 physician assistant, and 1 moonlighter (usually a senior medical resident or fellow) from 7:00 AM to 7:00 PM on weekends. A moonlighter, typically a senior resident or medical subspecialty fellow, admitted patients and covered nights on the service from 7:00 PM to 7:00 AM 7 days a week. The daily census goal for the service was 15 patients, limited by the number of available beds on the 2 pods, and the service accepted admissions 24 hours per day, 7 days per week, whenever beds were available. Daily morning rounds occurred at 8:00 AM and included the hospitalist, physician assistants, nurses, a care coordinator, and a pharmacist. The PACE service did not have triage guidelines related to diagnosis, complexity, or acuity, but only accepted patients via the emergency department or via a primary care physician's office, and did not accept patients transferred from outside hospitals or from the intensive care units.
Physician Assistants
All of the physician assistants on the PACE service had prior inpatient medicine experience, ranging from 6 months to 5 years. The physician assistants worked in 3‐day to 6‐day blocks of 12‐hour shifts. Their clinical responsibilities were similar to those of interns at the study hospital, and included taking histories and performing physical examinations, writing notes and orders, reviewing and assimilating data, creating and updating patient signouts, completing discharge summaries, consulting other services as needed, and communicating with nurses and family members.
Many physician assistants also had nonclinical responsibilities, taking on physician‐mentored roles in education, quality improvement, and administration. They were involved in several initiatives: (1) developing a physician assistant curriculum in hospital medicine, (2) presenting at hospital‐wide physician assistant grand rounds, (3) surveying and tracking patient and family satisfaction on the service, (4) reviewing all 72‐hour hospital readmissions, intensive care unit transfers, and deaths on the service, and (5) maintaining the service's compliance with state regulations regarding physician assistant scope of practice and prescribing.
Hospitalists
The 3 hospitalists on the PACE service worked in 7‐day blocks of 12‐hour shifts (7:00 AM to 7:00 PM). They directly supervised the physician assistants and had no competing responsibilities. The hospitalists were all recent graduates of the study hospital's internal medicine residency, with no prior clinical experience beyond residency. All were planning to work on the service for 1 to 2 years before beginning a subspecialty fellowship. In addition to supervising the clinical work of the physician assistants, the hospitalists were responsible for teaching the physician assistants on rounds and in weekly didactic sessions, guided by a curriculum in hospital medicine that focused on the most common general medicine diagnoses seen on the PACE service. The medical director of the PACE service periodically reviewed each physician assistant's clinical experience, skills and knowledge base, and held semiannual feedback sessions.
Study Patients
All general medicine patients admitted to the PACE service from July 1, 2005 to June 30, 2006 comprised the study population. The comparison group consisted of general medicine patients admitted to the 8 house staff general medicine teams; patients transferred from an intensive care unit (ICU) or another facility were excluded in order to match the admission criteria for the PACE service and improve comparability between the 2 study arms.
Data Collection and Study Outcomes
We obtained all patient data from the hospital's administrative databases. We identified patients assigned to the PACE service or to the comparison group based on the admitting service, team, and attending. We obtained patient demographics, insurance, admission source and discharge destination, admission and discharge times, dates, diagnoses, and diagnosis‐related groups (DRGs), as well as dates and times of transfers to other services, including to the intensive care unit. We also obtained the Medicare case‐mix index (CMI, based on DRG weight), and calculated a Charlson score based on billing diagnoses coded in the year prior to the index admission.14 Outcomes included length of stay (LOS) to the nearest hour, in‐hospital mortality, transfers to the intensive care unit, readmissions to the study hospital within 72 hours, 14 days, and 30 days, and total costs as derived from the hospital's cost accounting system (Transition Systems Inc., Boston, MA). Other outcomes included patient satisfaction as measured by responses to the Press‐Ganey survey routinely administered to a randomly selected 70% of recently discharged patients and effect on self‐reported resident work hours.
Statistical Analysis
Patient demographics, clinical characteristics, and study outcomes are presented using proportions, means with standard deviations, and medians with inter‐quartile ranges as appropriate. Unadjusted differences in outcomes between the two services were calculated using univariable regression techniques with service as the independent variable and each outcome as the dependent variable. We used logistic regression for dichotomous outcomes (readmissions, ICU transfers, and inpatient mortality), and linear regression for log‐transformed LOS and log‐transformed total costs of care. To adjust each outcome for potential confounders, we then built multivariable regression models. Each potential confounder was entered into the model one at a time as the independent variable. All variables found to be significant predictors of the outcome at the P < 0.10 level were then retained in the final model along with service as the predictor of interest. We used general estimating equations in all multivariable models to adjust for clustering of patients by attending physician. For logistic regression models, the effect size is presented as an odds ratio (OR); for log‐transformed linear regression models, the effect size is presented as the percent difference between groups. We also performed 2 subgroup analyses, limited to (1) the patients with the 10 most common discharge DRGs, and (2) patients admitted between the hours of 7:00 AM and 7:00 PM to remove the effects of moonlighters performing the initial admission. Except as noted above, 2‐sided P values < 0.05 were considered significant. SAS 9.1 (SAS Institute, Cary, NC) was used for all analyses.
RESULTS
Patient Demographics
Table 1 shows patient demographics and clinical characteristics of the PACE service and the comparison group. Patients in the comparison group were slightly older and tended to have slightly higher CMI and Charlson scores. Patients on the PACE service were more likely to be admitted at night (10:00 PM to 7:00 AM; 43.8% versus 30.3%; P < 0.0001). There were no significant differences in sex, race, insurance, or percentage of patients discharged to home. The 10 most common DRGs in the comparison group accounted for 37.0% of discharges, and these same DRGs accounted for 37.5% of discharges on the PACE service (Table 2).
| Characteristic | PACE Service (n = 992) | House Staff Services (n = 4,202) | P value |
|---|---|---|---|
| |||
| Age (years) | |||
| 1844 | 19.1 | 18.2 | |
| 4564 | 35.5 | 31.9 | 0.04 |
| 65+ | 45.5 | 49.9 | |
| Sex (% female) | 57.7 | 60.0 | NS |
| Race/ethnicity | |||
| White | 57.3 | 59.3 | |
| Black | 24.0 | 23.5 | NS |
| Hispanic | 14.1 | 13.3 | |
| Other | 4.6 | 3.9 | |
| Insurance | |||
| Medicare | 41.9 | 43.8 | |
| Commercial | 34.9 | 35.9 | |
| Medicaid | 14.4 | 11.7 | NS |
| Free care | 4.5 | 3.9 | |
| Self pay | 1.1 | 0.8 | |
| Median income by zip code of residence, USD (IQR) | 45,517 (32,49362,932) | 45,517 (35,88963,275) | NS |
| Case‐mix index, median (IQR) | 1.1 (0.81.5) | 1.2 (0.91.8) | 0.001 |
| Charlson score | |||
| 0 | 27.2 | 24.9 | |
| 1 | 22.6 | 21.1 | 0.02 |
| 2 | 16.2 | 16.5 | |
| 3+ | 34.0 | 37.6 | |
| Admissions between 10:00 PM and 7:00 AM | 43.8 | 30.3 | <0.0001 |
| Discharged to home | 81.1 | 80.5 | NS |
| Diagnosis‐Related Group at Discharge | PACE Service (n = 992)* | House Staff Services (n = 4,202)* |
|---|---|---|
| ||
| Chest pain | 5.4 | 6.4 |
| Esophagitis, gastroenteritis, and miscellaneous digestive disorders | 4.5 | 4.4 |
| Heart failure and shock | 3.4 | 4.6 |
| Simple pneumonia and pleurisy | 2.7 | 4.4 |
| Kidney and urinary tract infections | 4.7 | 3.2 |
| Chronic obstructive pulmonary disease | 4.0 | 3.3 |
| Renal failure | 2.7 | 3.5 |
| Gastrointestinal hemorrhage | 3.7 | 2.7 |
| Nutritional and miscellaneous metabolic disorders | 3.3 | 2.4 |
| Disorders of the pancreas except malignancy | 3.1 | 2.1 |
| Cumulative percent | 37.5 | 37.0 |
Efficiency and Quality of Care
Table 3 compares the performance of the PACE service and the comparison group on several efficiency and quality measures. Unadjusted LOS was not significantly different, and adjusted LOS was slightly but not statistically significantly higher on the study service (adjusted LOS 5.0% higher; 95% confidence interval [CI], 0.4% to +10%). Unadjusted and adjusted total costs of care were marginally lower on the study service (adjusted total cost of care 3.9% lower; 95% CI, 7.5% to 0.3%).
| PACE Service | House Staff Services | Unadjusted % Difference (95%CI) | Adjusted % Difference (95%CI)* | |
|---|---|---|---|---|
| PACE Service | House Staff Services | Unadjusted OR (95% CI) | Adjusted OR (95% CI) | |
| ||||
| Efficiency measure | ||||
| Length of stay, days, median (IQR) | 2.6 (1.6, 4.4) | 2.6 (1.4, 4.6) | +0.1% (5.6% to +6.1%) | +5.0% (0.4% to +10.0%) |
| Total costs, USD, median (IQR) | 4,536 (2,848, 7,201) | 4,749 (3,046, 8,161) | 9.1% (14.0% to 3.8%) | 3.9% (7.5% to 0.3%)‖ |
| Quality measure | ||||
| 72‐hour readmissions/100 discharges | 0.8 | 1.3 | 0.6 (0.31.3) | 0.7 (0.21.8) |
| 14‐day readmissions/100 discharges | 5.4 | 5.4 | 1.0 (0.71.4) | 1.1 (0.81.4) |
| 30‐day readmissions/100 discharges | 8.0 | 8.1 | 1.0 (0.81.3) | 1.1 (0.91.3) |
| ICU transfers/100 discharges | 2.0 | 2.3 | 0.9 (0.51.4) | 1.4 (0.82.4)# |
| Inpatient mortality/100 discharges | 0.7 | 1.2 | 0.6 (0.31.3) | 0.8 (0.31.8)** |
We found no differences between the PACE service and comparison group in unadjusted rates of hospital readmissions within 72 hours, 14 days, and 30 days, transfer to the intensive care units, or inpatient mortality (Table 3). The associated ORs for each outcome were similar after adjusting for patient demographics and clinical characteristics including severity of illness, as well as for clustering by attending physician.
Subgroup Analyses
When the analysis was limited to the subset of patients with the 10 most common discharge DRGs, the difference in adjusted total cost of care was similar but lost statistical significance (4.0% lower on PACE service; 95% CI, 11.0% to +3.3%). In this subgroup, LOS, readmission rates, and ICU transfer rates were not different. ORs for mortality could not be calculated because there were no deaths in this subgroup on the PACE service (data not shown). When analysis was limited to daytime admissions (to remove any potential effect of admitting by a moonlighter), the difference in total cost of care was attenuated and lost statistical significance (0.2% lower on PACE service; 95%CI, 5.9% to +5.5%). No differences were seen in LOS, mortality, and ICU transfers (data not shown). However, 14‐day readmissions (but not 72‐hour or 30‐day readmissions) were lower on the PACE service (OR, 0.49; 95% CI, 0.25‐0.93).
Patient Satisfaction
Patients were similarly satisfied with their care on the PACE service and on the house staff services. In specific areas and globally, percentages of patients satisfied with their physicians and with the discharge process were not different, as measured by the Press‐Ganey survey (Press‐Ganey Associates, South Bend, IN; Figures 1 and 2). The survey distinguishes between attendings and residents, but not physician assistants; therefore, Figure 1 only includes responses to the attending questions. Given the sampling procedure of the Press‐Ganey survey, exact response rates cannot be calculated, but Press‐Ganey reports a response rate of about 40% for the English survey and about 20% for the Spanish survey.
Resident Duty Hours
Comparing the same month 1 year prior to implementation of the PACE service, mean self‐reported resident duty hours on the general medicine service were unchanged; however, self‐reported data were incomplete, and multiple changes took place in the residency program during the study period. For example, implementation of the PACE service allowed for the dissolution of one full house staff general medicine team and redistribution of these house staff to night float positions and an expanded medical intensive care unit.
Costs of Implementation
The costs associated with implementing the PACE service included physician and physician assistant salaries (2.5 full‐time physicians, 5 full‐time physician assistants, plus fringe) and night coverage by resident and fellow moonlighters (without fringe, and estimated at 50% effort given other moonlighter coverage responsibilities on subspecialty services). We estimated these costs at $257.50/patient‐day ($115/patient‐day for attending physician compensation, $110/patient‐day for physician assistant compensation, and $32.50/patient‐day for moonlighting coverage).
DISCUSSION
As academic centers struggle with developing a workforce to provide patient care no longer provided by residents, questions about the ideal structure of nonhouse staff inpatient services abound. Although solutions to this problem will be determined to some extent by local factors such as institutional culture and resources, some lessons learned in developing such services will be more widely applicable. We found that by implementing a geographically localized, physician assistant‐staffed hospitalist service, we were able to provide care of similar quality and efficiency to that of traditional house staff services, despite inexperienced hospitalists staffing the service and a medical residency program commonly recognized as one of the best in the country. Adjusted total costs were slightly lower on the PACE service, but this difference was small and of borderline statistical significance. Likewise, no significant differences were seen in any of several quality measures or in patient satisfaction.
Our findings add to the available evidence supporting the use of physician assistants on academic general medicine services, and are germane to academic centers facing reductions in house staff availability and seeking alternative models of care for inpatients. Several specific characteristics of the PACE service and the implications of these should be considered:
The service accepted all patients, regardless of diagnosis, acuity, or complexity of illness. This was unlike many previously described nonhouse staff services which were more limited in scope, and allowed more flexibility with patient flow. However, in the end, patients on the PACE service did have a modestly lower case mix index and Charlson score, suggesting that, despite a lack of triage guidelines, there was some bias in the triage of admissions, possibly due to a perception that physician assistants should take care of lower complexity patients. If it is desirable to have a similar distribution of higher complexity patients across house staff and nonhouse staff services, extra efforts may be necessary to overcome this perception.
The service was geographically regionalized. Geographic regionalization offered many important advantages, especially with regards to communication among staff, nursing, and consultants, and allowed for multidisciplinary rounds. However, it is possible that the modest, but not statistically significant, trend toward an increased LOS seen on the PACE service might be a reflection of geographic admitting (less incentive to discharge since discharging a patient means taking a new admission).
The education and professional development of the physician assistants was a priority. Physician assistants had considerable autonomy and responsibility, and rather than being assigned only lower level administrative tasks, performed all aspects of patient care. They also received regular teaching from the hospitalists, attended house staff teaching conferences, and developed nonclinical roles in education and quality improvement. The higher standards expected of the physician assistants were quite possibly a factor in the quality of care delivered, and almost certainly contributed to physician assistant satisfaction and retention.
Our findings contrast with those of Myers et al.,9 who found that a nonteaching service staffed by hospitalists and nurse practitioners had a significantly lower median LOS and hospital charges compared to similar patients on resident‐based services. However, unlike ours, their service cared for a select patient population, and only accepted patients with chest pain at low risk for acute coronary syndrome. Van Rhee et al.10 found that physician assistants on a general medicine service used fewer resources for patients with pneumonia, stroke, and congestive heart failure than resident physicians, and did not exceed the resources used by residents in other diagnoses. The authors did not find a difference in LOS, but did find a significantly higher mortality among patients with pneumonia cared for by physician assistants.
Several limitations should be noted. First, the study was a retrospective analysis of administrative data rather than a randomized trial, and although we employed a standard approach to adjust for a wide range of patient characteristics including severity of illness, there may have been undetected differences in the patient populations studied that may have confounded our results. Second, resident moonlighters admitted patients to the PACE service and, at other times, to the house staff services, and this may have diluted any differences between the groups. However, when we limited our analysis to the subgroup of patients admitted during the day, similar results were obtained, with the exception that the PACE service had a lower rate of 14‐day readmissions, an unexpected finding deserving of further study. Third, the study was conducted in a single academic institution and our findings may not be generalizable to others with different needs and resources; indeed, the costs associated with implementing such a service may be prohibitive for some institutions. Fourth, because of simultaneous changes that were taking place in our residency program, we are unable to accurately assess the impact of the PACE service on resident duty hours. However, resident duty hours did not increase over this time period on the general medicine service, and implementation of the service allowed for redistribution of house staff to other services and positions. Fifth, patient satisfaction data were obtained from responses to the mailed Press‐Ganey survey, to which there is a relatively low response rate. Also, we did not survey providers regarding their satisfaction with the service during the study period. Sixth, the study had limited power to detect clinically important differences in mortality and ICU transfers. Finally, this study is unable to compare this particular model of incorporating midlevel providers into general medical services with other models, only with traditional house staff services.
Future research should focus on determining the most effective and efficient ways to incorporate midlevel providers on academic general medicine services. One important question from the standpoint of house staff training is whether such services should be separate but equal, or should house staff gain experience during residency working with midlevel providers, since they are likely to encounter them in the future whether they stay in academics or not. Different models of care will likely have large implications for the quality and efficiency of patient care, house staff education and satisfaction, and physician assistant job satisfaction and turnover.
In summary, our study demonstrates that a geographically regionalized, multidisciplinary service staffed by hospitalists and physician assistants can be a safe alternative to house staff‐based services for the care of general medicine inpatients in an academic medical center.
- ,,,,,.The physician's assistant as resident on surgical service. An example of creative problem solving in surgical manpower.Arch Surg.1980;115:310–314.
- ,,,.Coronary arteriography performed by a physician assistant.Am J Cardiol.1987;60:784–787.
- .The specialized physician assistant: an alternative to the clinical cardiology trainee.Am J Cardiol.1987;60:901–902.
- ,,.One hospital's successful 20‐year experience with physician assistants in graduate medical education.Acad Med.1999;74:641–645.
- ,.Physicians assistants in cardiothoracic surgery: a 30‐year experience in a university center.Ann Thorac Surg.2006;81:195–199; discussion 199–200.
- ,,.Comparative review of use of physician assistants in a level I trauma center.Am Surg.2004;70:272–279.
- ,,,,.Integrating midlevel practitioners into a teaching service.Am J Surg.2006;192:119–124.
- ,.Acute care nurse practitioners: creating and implementing a model of care for an inpatient general medical service.Am J Crit Care.2002;11:448–458.
- ,,,,.Improving resource utilization in a teaching hospital: development of a nonteaching service for chest pain admissions.Acad Med.2006;81:432–435.
- ,,.Resource use by physician assistant services versus teaching services.JAAPA.2002;15:33–38.
- ,,, for the ACGME Work Group on Resident Duty Hours, Accreditation Council for Graduate Medical Education.New requirements for resident duty hours.JAMA.2002;288:1112–1114.
- ,,.The substitution of physician assistants and nurse practitioners for physician residents in teaching hospitals.Health Aff.1995;14:181–191.
- ,,,,.Challenges of the 80‐hour resident work rules: collaboration between surgeons and nonphysician practitioners.Surg Clin North Am.2004;84:1573–1586.
- ,,.Adapting a clinical comorbidity index for use with ICD‐9‐CM administrative databases.J Clin Epidemiol.1992;45:613–619.
Midlevel providers (physician assistants and nurse practitioners) have long been employed by academic medical centers, predominantly on surgical services, or on medical subspecialty services, where they have typically had a limited scope of practice, focused in a narrowly defined area or set of procedures.17 In contrast, there are relatively few reports of experiences deploying midlevel providers to replace house staff on inpatient general medicine services in academic centers,810 and few studies of the effect of midlevel providers on quality and efficiency of care in the academic setting. Despite this, reductions in house officer duty hours as mandated by the Accreditation Council on Graduate Medical Education (ACGME)11 have resulted in academic centers increasingly using midlevel providers to decrease house staff workload on inpatient services.12, 13 In general, midlevel practitioners on general medicine services have been deployed to: (1) care for a population of patients separate from and in parallel with house staff; this population may be narrowly defined (eg, patients with chest pain) or not; (2) assist with the management of patients cared for by house staff by performing certain tasks (eg, scheduling appointments, discharging patients). Even as midlevel providers become more prevalent on academic general medicine services, the best model of care incorporating them into clinical care remains unclear, and few studies have rigorously examined the care provided on services that use them.
We developed an inpatient general medicine service within a large academic medical center staffed by physician assistants and hospitalists to help our residency program meet ACGME duty hour requirements. We hypothesized that by creating a service that is geographically localized and supervised by full‐time hospitalists, by instituting multidisciplinary rounds, and by investing in the professional development of highly‐skilled physician assistants, we could provide care for medically complex, acutely ill general medicine inpatients with similar quality and efficiency as compared to house staff teams. We report our experience during the first year of implementing the service, and compare quality and efficiency of care on this service with that of our traditional house staff services. We also evaluate the effects of this service on patient satisfaction and self‐reported house staff workload.
PATIENTS AND METHODS
Study Setting
The study was conducted in a 747‐bed urban, academic medical center in the northeastern United States. The hospital's human research committee reviewed and approved the study design. The hospital has accredited residency and fellowship programs in all major specialties. Prior to July 2005, physician assistants were employed only on surgical and medical subspecialty services (ie, bone marrow transplant, interventional cardiology); none were employed on the inpatient general medicine service. There were approximately 44,000 inpatient admissions during the year of the study, with approximately 6500 of these to the general medicine service.
Description of the General Medicine Service
The General Medicine Service consisted of 8 traditional house staff teams, with 1 attending, 1 junior or senior resident, 2 interns, and 1 or 2 medical students. These teams admitted patients on a rotating basis every fourth day. On 4 of these teams, the attending was a hospitalist, with clinical responsibility for the majority of the patients admitted to the team. On the remaining 4 teams, the teaching attending was a primary care physician or medical subspecialist, responsible for the direct care of a small number of the team's patients, with the remainder cared for by private primary care physicians or subspecialists.
Description of the Physician Assistant/Hospitalist Service
The Physician Assistant/Clinician Educator (PACE) service opened in July 2005, and consisted of 15 beds localized to 2 adjacent inpatient pods, staffed by a single cadre of nurses and medically staffed by 1 hospitalist and 2 physician assistants from 7:00 AM to 7:00 PM on weekdays and by 1 hospitalist, 1 physician assistant, and 1 moonlighter (usually a senior medical resident or fellow) from 7:00 AM to 7:00 PM on weekends. A moonlighter, typically a senior resident or medical subspecialty fellow, admitted patients and covered nights on the service from 7:00 PM to 7:00 AM 7 days a week. The daily census goal for the service was 15 patients, limited by the number of available beds on the 2 pods, and the service accepted admissions 24 hours per day, 7 days per week, whenever beds were available. Daily morning rounds occurred at 8:00 AM and included the hospitalist, physician assistants, nurses, a care coordinator, and a pharmacist. The PACE service did not have triage guidelines related to diagnosis, complexity, or acuity, but only accepted patients via the emergency department or via a primary care physician's office, and did not accept patients transferred from outside hospitals or from the intensive care units.
Physician Assistants
All of the physician assistants on the PACE service had prior inpatient medicine experience, ranging from 6 months to 5 years. The physician assistants worked in 3‐day to 6‐day blocks of 12‐hour shifts. Their clinical responsibilities were similar to those of interns at the study hospital, and included taking histories and performing physical examinations, writing notes and orders, reviewing and assimilating data, creating and updating patient signouts, completing discharge summaries, consulting other services as needed, and communicating with nurses and family members.
Many physician assistants also had nonclinical responsibilities, taking on physician‐mentored roles in education, quality improvement, and administration. They were involved in several initiatives: (1) developing a physician assistant curriculum in hospital medicine, (2) presenting at hospital‐wide physician assistant grand rounds, (3) surveying and tracking patient and family satisfaction on the service, (4) reviewing all 72‐hour hospital readmissions, intensive care unit transfers, and deaths on the service, and (5) maintaining the service's compliance with state regulations regarding physician assistant scope of practice and prescribing.
Hospitalists
The 3 hospitalists on the PACE service worked in 7‐day blocks of 12‐hour shifts (7:00 AM to 7:00 PM). They directly supervised the physician assistants and had no competing responsibilities. The hospitalists were all recent graduates of the study hospital's internal medicine residency, with no prior clinical experience beyond residency. All were planning to work on the service for 1 to 2 years before beginning a subspecialty fellowship. In addition to supervising the clinical work of the physician assistants, the hospitalists were responsible for teaching the physician assistants on rounds and in weekly didactic sessions, guided by a curriculum in hospital medicine that focused on the most common general medicine diagnoses seen on the PACE service. The medical director of the PACE service periodically reviewed each physician assistant's clinical experience, skills and knowledge base, and held semiannual feedback sessions.
Study Patients
All general medicine patients admitted to the PACE service from July 1, 2005 to June 30, 2006 comprised the study population. The comparison group consisted of general medicine patients admitted to the 8 house staff general medicine teams; patients transferred from an intensive care unit (ICU) or another facility were excluded in order to match the admission criteria for the PACE service and improve comparability between the 2 study arms.
Data Collection and Study Outcomes
We obtained all patient data from the hospital's administrative databases. We identified patients assigned to the PACE service or to the comparison group based on the admitting service, team, and attending. We obtained patient demographics, insurance, admission source and discharge destination, admission and discharge times, dates, diagnoses, and diagnosis‐related groups (DRGs), as well as dates and times of transfers to other services, including to the intensive care unit. We also obtained the Medicare case‐mix index (CMI, based on DRG weight), and calculated a Charlson score based on billing diagnoses coded in the year prior to the index admission.14 Outcomes included length of stay (LOS) to the nearest hour, in‐hospital mortality, transfers to the intensive care unit, readmissions to the study hospital within 72 hours, 14 days, and 30 days, and total costs as derived from the hospital's cost accounting system (Transition Systems Inc., Boston, MA). Other outcomes included patient satisfaction as measured by responses to the Press‐Ganey survey routinely administered to a randomly selected 70% of recently discharged patients and effect on self‐reported resident work hours.
Statistical Analysis
Patient demographics, clinical characteristics, and study outcomes are presented using proportions, means with standard deviations, and medians with inter‐quartile ranges as appropriate. Unadjusted differences in outcomes between the two services were calculated using univariable regression techniques with service as the independent variable and each outcome as the dependent variable. We used logistic regression for dichotomous outcomes (readmissions, ICU transfers, and inpatient mortality), and linear regression for log‐transformed LOS and log‐transformed total costs of care. To adjust each outcome for potential confounders, we then built multivariable regression models. Each potential confounder was entered into the model one at a time as the independent variable. All variables found to be significant predictors of the outcome at the P < 0.10 level were then retained in the final model along with service as the predictor of interest. We used general estimating equations in all multivariable models to adjust for clustering of patients by attending physician. For logistic regression models, the effect size is presented as an odds ratio (OR); for log‐transformed linear regression models, the effect size is presented as the percent difference between groups. We also performed 2 subgroup analyses, limited to (1) the patients with the 10 most common discharge DRGs, and (2) patients admitted between the hours of 7:00 AM and 7:00 PM to remove the effects of moonlighters performing the initial admission. Except as noted above, 2‐sided P values < 0.05 were considered significant. SAS 9.1 (SAS Institute, Cary, NC) was used for all analyses.
RESULTS
Patient Demographics
Table 1 shows patient demographics and clinical characteristics of the PACE service and the comparison group. Patients in the comparison group were slightly older and tended to have slightly higher CMI and Charlson scores. Patients on the PACE service were more likely to be admitted at night (10:00 PM to 7:00 AM; 43.8% versus 30.3%; P < 0.0001). There were no significant differences in sex, race, insurance, or percentage of patients discharged to home. The 10 most common DRGs in the comparison group accounted for 37.0% of discharges, and these same DRGs accounted for 37.5% of discharges on the PACE service (Table 2).
| Characteristic | PACE Service (n = 992) | House Staff Services (n = 4,202) | P value |
|---|---|---|---|
| |||
| Age (years) | |||
| 1844 | 19.1 | 18.2 | |
| 4564 | 35.5 | 31.9 | 0.04 |
| 65+ | 45.5 | 49.9 | |
| Sex (% female) | 57.7 | 60.0 | NS |
| Race/ethnicity | |||
| White | 57.3 | 59.3 | |
| Black | 24.0 | 23.5 | NS |
| Hispanic | 14.1 | 13.3 | |
| Other | 4.6 | 3.9 | |
| Insurance | |||
| Medicare | 41.9 | 43.8 | |
| Commercial | 34.9 | 35.9 | |
| Medicaid | 14.4 | 11.7 | NS |
| Free care | 4.5 | 3.9 | |
| Self pay | 1.1 | 0.8 | |
| Median income by zip code of residence, USD (IQR) | 45,517 (32,49362,932) | 45,517 (35,88963,275) | NS |
| Case‐mix index, median (IQR) | 1.1 (0.81.5) | 1.2 (0.91.8) | 0.001 |
| Charlson score | |||
| 0 | 27.2 | 24.9 | |
| 1 | 22.6 | 21.1 | 0.02 |
| 2 | 16.2 | 16.5 | |
| 3+ | 34.0 | 37.6 | |
| Admissions between 10:00 PM and 7:00 AM | 43.8 | 30.3 | <0.0001 |
| Discharged to home | 81.1 | 80.5 | NS |
| Diagnosis‐Related Group at Discharge | PACE Service (n = 992)* | House Staff Services (n = 4,202)* |
|---|---|---|
| ||
| Chest pain | 5.4 | 6.4 |
| Esophagitis, gastroenteritis, and miscellaneous digestive disorders | 4.5 | 4.4 |
| Heart failure and shock | 3.4 | 4.6 |
| Simple pneumonia and pleurisy | 2.7 | 4.4 |
| Kidney and urinary tract infections | 4.7 | 3.2 |
| Chronic obstructive pulmonary disease | 4.0 | 3.3 |
| Renal failure | 2.7 | 3.5 |
| Gastrointestinal hemorrhage | 3.7 | 2.7 |
| Nutritional and miscellaneous metabolic disorders | 3.3 | 2.4 |
| Disorders of the pancreas except malignancy | 3.1 | 2.1 |
| Cumulative percent | 37.5 | 37.0 |
Efficiency and Quality of Care
Table 3 compares the performance of the PACE service and the comparison group on several efficiency and quality measures. Unadjusted LOS was not significantly different, and adjusted LOS was slightly but not statistically significantly higher on the study service (adjusted LOS 5.0% higher; 95% confidence interval [CI], 0.4% to +10%). Unadjusted and adjusted total costs of care were marginally lower on the study service (adjusted total cost of care 3.9% lower; 95% CI, 7.5% to 0.3%).
| PACE Service | House Staff Services | Unadjusted % Difference (95%CI) | Adjusted % Difference (95%CI)* | |
|---|---|---|---|---|
| PACE Service | House Staff Services | Unadjusted OR (95% CI) | Adjusted OR (95% CI) | |
| ||||
| Efficiency measure | ||||
| Length of stay, days, median (IQR) | 2.6 (1.6, 4.4) | 2.6 (1.4, 4.6) | +0.1% (5.6% to +6.1%) | +5.0% (0.4% to +10.0%) |
| Total costs, USD, median (IQR) | 4,536 (2,848, 7,201) | 4,749 (3,046, 8,161) | 9.1% (14.0% to 3.8%) | 3.9% (7.5% to 0.3%)‖ |
| Quality measure | ||||
| 72‐hour readmissions/100 discharges | 0.8 | 1.3 | 0.6 (0.31.3) | 0.7 (0.21.8) |
| 14‐day readmissions/100 discharges | 5.4 | 5.4 | 1.0 (0.71.4) | 1.1 (0.81.4) |
| 30‐day readmissions/100 discharges | 8.0 | 8.1 | 1.0 (0.81.3) | 1.1 (0.91.3) |
| ICU transfers/100 discharges | 2.0 | 2.3 | 0.9 (0.51.4) | 1.4 (0.82.4)# |
| Inpatient mortality/100 discharges | 0.7 | 1.2 | 0.6 (0.31.3) | 0.8 (0.31.8)** |
We found no differences between the PACE service and comparison group in unadjusted rates of hospital readmissions within 72 hours, 14 days, and 30 days, transfer to the intensive care units, or inpatient mortality (Table 3). The associated ORs for each outcome were similar after adjusting for patient demographics and clinical characteristics including severity of illness, as well as for clustering by attending physician.
Subgroup Analyses
When the analysis was limited to the subset of patients with the 10 most common discharge DRGs, the difference in adjusted total cost of care was similar but lost statistical significance (4.0% lower on PACE service; 95% CI, 11.0% to +3.3%). In this subgroup, LOS, readmission rates, and ICU transfer rates were not different. ORs for mortality could not be calculated because there were no deaths in this subgroup on the PACE service (data not shown). When analysis was limited to daytime admissions (to remove any potential effect of admitting by a moonlighter), the difference in total cost of care was attenuated and lost statistical significance (0.2% lower on PACE service; 95%CI, 5.9% to +5.5%). No differences were seen in LOS, mortality, and ICU transfers (data not shown). However, 14‐day readmissions (but not 72‐hour or 30‐day readmissions) were lower on the PACE service (OR, 0.49; 95% CI, 0.25‐0.93).
Patient Satisfaction
Patients were similarly satisfied with their care on the PACE service and on the house staff services. In specific areas and globally, percentages of patients satisfied with their physicians and with the discharge process were not different, as measured by the Press‐Ganey survey (Press‐Ganey Associates, South Bend, IN; Figures 1 and 2). The survey distinguishes between attendings and residents, but not physician assistants; therefore, Figure 1 only includes responses to the attending questions. Given the sampling procedure of the Press‐Ganey survey, exact response rates cannot be calculated, but Press‐Ganey reports a response rate of about 40% for the English survey and about 20% for the Spanish survey.
Resident Duty Hours
Comparing the same month 1 year prior to implementation of the PACE service, mean self‐reported resident duty hours on the general medicine service were unchanged; however, self‐reported data were incomplete, and multiple changes took place in the residency program during the study period. For example, implementation of the PACE service allowed for the dissolution of one full house staff general medicine team and redistribution of these house staff to night float positions and an expanded medical intensive care unit.
Costs of Implementation
The costs associated with implementing the PACE service included physician and physician assistant salaries (2.5 full‐time physicians, 5 full‐time physician assistants, plus fringe) and night coverage by resident and fellow moonlighters (without fringe, and estimated at 50% effort given other moonlighter coverage responsibilities on subspecialty services). We estimated these costs at $257.50/patient‐day ($115/patient‐day for attending physician compensation, $110/patient‐day for physician assistant compensation, and $32.50/patient‐day for moonlighting coverage).
DISCUSSION
As academic centers struggle with developing a workforce to provide patient care no longer provided by residents, questions about the ideal structure of nonhouse staff inpatient services abound. Although solutions to this problem will be determined to some extent by local factors such as institutional culture and resources, some lessons learned in developing such services will be more widely applicable. We found that by implementing a geographically localized, physician assistant‐staffed hospitalist service, we were able to provide care of similar quality and efficiency to that of traditional house staff services, despite inexperienced hospitalists staffing the service and a medical residency program commonly recognized as one of the best in the country. Adjusted total costs were slightly lower on the PACE service, but this difference was small and of borderline statistical significance. Likewise, no significant differences were seen in any of several quality measures or in patient satisfaction.
Our findings add to the available evidence supporting the use of physician assistants on academic general medicine services, and are germane to academic centers facing reductions in house staff availability and seeking alternative models of care for inpatients. Several specific characteristics of the PACE service and the implications of these should be considered:
The service accepted all patients, regardless of diagnosis, acuity, or complexity of illness. This was unlike many previously described nonhouse staff services which were more limited in scope, and allowed more flexibility with patient flow. However, in the end, patients on the PACE service did have a modestly lower case mix index and Charlson score, suggesting that, despite a lack of triage guidelines, there was some bias in the triage of admissions, possibly due to a perception that physician assistants should take care of lower complexity patients. If it is desirable to have a similar distribution of higher complexity patients across house staff and nonhouse staff services, extra efforts may be necessary to overcome this perception.
The service was geographically regionalized. Geographic regionalization offered many important advantages, especially with regards to communication among staff, nursing, and consultants, and allowed for multidisciplinary rounds. However, it is possible that the modest, but not statistically significant, trend toward an increased LOS seen on the PACE service might be a reflection of geographic admitting (less incentive to discharge since discharging a patient means taking a new admission).
The education and professional development of the physician assistants was a priority. Physician assistants had considerable autonomy and responsibility, and rather than being assigned only lower level administrative tasks, performed all aspects of patient care. They also received regular teaching from the hospitalists, attended house staff teaching conferences, and developed nonclinical roles in education and quality improvement. The higher standards expected of the physician assistants were quite possibly a factor in the quality of care delivered, and almost certainly contributed to physician assistant satisfaction and retention.
Our findings contrast with those of Myers et al.,9 who found that a nonteaching service staffed by hospitalists and nurse practitioners had a significantly lower median LOS and hospital charges compared to similar patients on resident‐based services. However, unlike ours, their service cared for a select patient population, and only accepted patients with chest pain at low risk for acute coronary syndrome. Van Rhee et al.10 found that physician assistants on a general medicine service used fewer resources for patients with pneumonia, stroke, and congestive heart failure than resident physicians, and did not exceed the resources used by residents in other diagnoses. The authors did not find a difference in LOS, but did find a significantly higher mortality among patients with pneumonia cared for by physician assistants.
Several limitations should be noted. First, the study was a retrospective analysis of administrative data rather than a randomized trial, and although we employed a standard approach to adjust for a wide range of patient characteristics including severity of illness, there may have been undetected differences in the patient populations studied that may have confounded our results. Second, resident moonlighters admitted patients to the PACE service and, at other times, to the house staff services, and this may have diluted any differences between the groups. However, when we limited our analysis to the subgroup of patients admitted during the day, similar results were obtained, with the exception that the PACE service had a lower rate of 14‐day readmissions, an unexpected finding deserving of further study. Third, the study was conducted in a single academic institution and our findings may not be generalizable to others with different needs and resources; indeed, the costs associated with implementing such a service may be prohibitive for some institutions. Fourth, because of simultaneous changes that were taking place in our residency program, we are unable to accurately assess the impact of the PACE service on resident duty hours. However, resident duty hours did not increase over this time period on the general medicine service, and implementation of the service allowed for redistribution of house staff to other services and positions. Fifth, patient satisfaction data were obtained from responses to the mailed Press‐Ganey survey, to which there is a relatively low response rate. Also, we did not survey providers regarding their satisfaction with the service during the study period. Sixth, the study had limited power to detect clinically important differences in mortality and ICU transfers. Finally, this study is unable to compare this particular model of incorporating midlevel providers into general medical services with other models, only with traditional house staff services.
Future research should focus on determining the most effective and efficient ways to incorporate midlevel providers on academic general medicine services. One important question from the standpoint of house staff training is whether such services should be separate but equal, or should house staff gain experience during residency working with midlevel providers, since they are likely to encounter them in the future whether they stay in academics or not. Different models of care will likely have large implications for the quality and efficiency of patient care, house staff education and satisfaction, and physician assistant job satisfaction and turnover.
In summary, our study demonstrates that a geographically regionalized, multidisciplinary service staffed by hospitalists and physician assistants can be a safe alternative to house staff‐based services for the care of general medicine inpatients in an academic medical center.
- ,,,,,.The physician's assistant as resident on surgical service. An example of creative problem solving in surgical manpower.Arch Surg.1980;115:310–314.
- ,,,.Coronary arteriography performed by a physician assistant.Am J Cardiol.1987;60:784–787.
- .The specialized physician assistant: an alternative to the clinical cardiology trainee.Am J Cardiol.1987;60:901–902.
- ,,.One hospital's successful 20‐year experience with physician assistants in graduate medical education.Acad Med.1999;74:641–645.
- ,.Physicians assistants in cardiothoracic surgery: a 30‐year experience in a university center.Ann Thorac Surg.2006;81:195–199; discussion 199–200.
- ,,.Comparative review of use of physician assistants in a level I trauma center.Am Surg.2004;70:272–279.
- ,,,,.Integrating midlevel practitioners into a teaching service.Am J Surg.2006;192:119–124.
- ,.Acute care nurse practitioners: creating and implementing a model of care for an inpatient general medical service.Am J Crit Care.2002;11:448–458.
- ,,,,.Improving resource utilization in a teaching hospital: development of a nonteaching service for chest pain admissions.Acad Med.2006;81:432–435.
- ,,.Resource use by physician assistant services versus teaching services.JAAPA.2002;15:33–38.
- ,,, for the ACGME Work Group on Resident Duty Hours, Accreditation Council for Graduate Medical Education.New requirements for resident duty hours.JAMA.2002;288:1112–1114.
- ,,.The substitution of physician assistants and nurse practitioners for physician residents in teaching hospitals.Health Aff.1995;14:181–191.
- ,,,,.Challenges of the 80‐hour resident work rules: collaboration between surgeons and nonphysician practitioners.Surg Clin North Am.2004;84:1573–1586.
- ,,.Adapting a clinical comorbidity index for use with ICD‐9‐CM administrative databases.J Clin Epidemiol.1992;45:613–619.
Copyright © 2008 Society of Hospital Medicine

Non–Housestaff Medicine Services in Academic Centers
Many academic medical centers (AMCs) have developed nonhousestaff services to provide clinical care once provided by physicians‐in‐training. These services, often staffed by hospitalists and/or midlevel providers, have experienced tremendous growth in the past few years, yet very little exists in the literature about their development, structure, efficacy, or impact on hospitals, patients, and hospital medicine programs. The primary forces driving this growth include Accreditation Council for Graduate Medical Education (ACGME) resident duty hour restrictions,1 growth of the hospitalist movement,2 and the emphasis on simultaneously improving financial performance and quality of care in AMCs.3
Resident Duty Hour Restrictions
In 2003, the ACGME mandated restrictions on resident work hours, limiting trainees to 80 hours per week.1 Many training programs struggled with how to provide important clinical services while complying with the new restrictionscreating numerous models that bridged care between different shifts of residents.45 Implementation of day floats (a dedicated resident who rounds with the postcall team), night floats (a dedicated overnight resident who admits and cross‐covers patients), or some variation of both was common.6 No guidelines accompanied the ACGME mandate, leaving institutions to independently structure their programs without a known best practice.
Subsequent literature carefully addressed how the duty hour restrictions affect residents' lives and education but failed to discuss models for providing care.711 Training programs began to institute necessary changes but in doing so, created greater patient discontinuity and increased handoffs between residents, elevating the potential for adverse patient outcomes.12 Recent large‐scale studies indicate that inpatient care is the same or improved since adoption of the duty hour restrictions,1316 but controversy continues, with several editorials debating the issue.1719
Because increasing the volume of patients on housestaff services was not a viable option,20 many AMCs created nonhousestaff services and hired midlevel providers (nurse practitioners and physician assistants) to offset resident workloads and comply with the new restrictions. However, this strategy represented a very expensive alternative.21 Moreover, the current 80‐hour work limits may be revised downward, particularly given the lower restrictions in other countries,22 and this will further drive the demand for nonhousestaff services. Hospitalists, with their documented impact on efficiency and return on investment,23 represent a solution to fill these needs and have quickly become the predominant approach at AMCs.
The Hospitalist Movement
Since the term hospitalist was first coined in 1996,24 the remarkable growth of the number of practicing hospitalists emphasizes how first community hospitals and now AMCs have embraced this approach.25 With more than 20,000 nationwide and projections that the field will grow to 30,000 by 2010,26 hospitalists are becoming the primary providers for in‐patients.2 This growth was further catalyzed when widely expressed concerns about safety and quality became public,2728 and hospitalists incorporated patient safety and quality improvement activities into their efforts.3 The confluence of these factors also prompted emergence of hospital medicine programs at AMCs, a growth that came with anticipated dangers.29 Reflecting the recognition that hospital medicine is becoming a separate specialty30 and is integral to the functioning of an AMC, institutions now operate dedicated divisions of hospital medicine.
AMCs and Hospital Performance
AMCs operate 3 related enterprises: a medical school that trains future physicians, a research arena that promotes basic and clinical investigation, and health care services that often encompass both hospitals and clinics. The financial viability of AMCs has always been a topic of debate, largely because of the different missions they pursue and the financial means by which they survive.3133 Over the past decade, cuts in Medicare reimbursement, challenges in balancing bed availability with occupancy rates, and a growing emphasis on cost reduction have created a more competitive health care environment, but without the predicted demise of AMCs.34 Because education and research generally fail to bolster the bottom line, AMCs have focused on optimizing clinical services to promote financial viability.
Hospitalists are uniquely positioned to help this bottom line, just as they do at community hospitals. Their involvement in patient care may produce reductions in length of stay, greater efficiency in discharge planning, and significant cost savings.3537 Hospitalists may also improve throughput in emergency departments and decrease wait times, leading to more efficient bed utilization.38 This leads to a potential for greater hospital revenue by increasing both the number of admissions, particularly surgical cases, and staffed inpatient beds, the latter a premium, as AMCs continue to expand their bed capacity almost annually. Finally, hospitalists may serve as change agents in improving the quality and safety of care delivered, an increasingly important metric given the desire for and expansion of publicly reported measures.
From a financial standpoint, Medicare support to AMCs for training residents now subsidizes fewer clinical care hours. Hospitalist‐driven nonhousestaff services will continue to fulfill a need created by this marked change in residency training. The tension of who pays for nonhousestaff servicesincreased federal support, financial backing from AMCs, or academic department fundsposes an ongoing struggle. In fact, this may be the most important issue currently debated among hospital administrators and department chairs. Regardless, AMCs continue to view hospitalists as a mechanism (or even solution) to maintaining their financial bottom line through improving care delivery systems, adhering to resident work hour restrictions, leading quality and safety improvement initiatives, and improving clinical patient outcomes.
MODELS FOR NONHOUSESTAFF MEDICAL SERVICES
For AMCs developing nonhousestaff services, the process begins by addressing a series of important questions (Table 1). How these questions are answered is often driven by local factors such as the vision of local leadership and the availability of important resources. Nonetheless, it is important for hospitals to share their experiences because best practices remain unclear. Table 2 provides a tabular snapshot of nonhousestaff medicine services at 5 AMCs to highlight similarities and differences. Data in the table were compiled by having a representative from each AMC report the different attributes, which reflects each program as of July 2007. Table 2 provides no data on the quality or efficiency of housestaff versus nonhousestaff services, though this type of investigation is underway and will be critical in future planning.3940
| Questions | Potential options |
|---|---|
| Who will provide care on nonhousestaff services? | Physicians seeking a 1‐year position |
| Physicians committed to a purely clinical career | |
| Physicians committed to an academic career in hospital medicine | |
| Will hospitalists share nonhousestaff service time, or will there be dedicated nonhousestaff hospitalists? | Hybrid positions |
| Dedicated nonhousestaff hospitalists | |
| Use of PGY‐4s1‐year positions (often individuals planning a fellowship) | |
| How should staffing be organized? | Hospitalist‐only services |
| Use of midlevel providers | |
| Will there be 24‐7 coverage, and if so, how will nights be staffed? | Dedicated nocturnists |
| Shared among daytime hospitalists | |
| Midlevel providers | |
| Moonlighters (fellows or residents) | |
| What type of schedule will provide blocks of clinical time to ensure continuity of care but also ensure adequate nonclinical time to prevent physician burnout and turnover? | 7 on/7 off sequences |
| 45 day sequences | |
| Longer shifts with fewer shifts per month | |
| Shorter shifts with more shifts per month | |
| Where will patients on a nonhousestaff service receive care? | Geographically designed serviced |
| ○ Different floor | |
| ○ Different hospital | |
| Mixed among housestaff service | |
| What patient population will be cared for on the nonhousestaff service? | Same as on housestaff service |
| Based on bed availability if nonhousestaff service is geographic (a unit) | |
| Based on triage guidelines (lower acuity, observation patients, specific diagnoses) | |
| What volume of patients will be cared for on the nonhousestaff service? | Fixed census cap based on staffing |
| Flexible census depending on activity of housestaff service (above their cap) | |
| Will compensation for providing nonhousestaff services differ from that on housestaff services? | Higher base salary |
| Incentives tied to nonhousestaff time | |
| Different incentive structures |
| Attributes | BWH | Emory | University of Michigan | Northwestern | UCSF |
|---|---|---|---|---|---|
| Description of staffing model | Mon.‐Sun.: 1 daytime Hospitalist | Mon.‐Sun.: 4 daytime hospitalists, 2 swing shift admitters | Weekdays: 7 daytime hospitalists, 1 swing shift hospitalist | Mon.‐Sun.: 8 daytime hospitalists, 1 triage hospitalist | Weekdays: 2 daytime hospitalists, 1 swing shift hospitalist |
| Nights: 1 MD | Nights: 1 MDs | Weekends: 7 daytime hospitalists | Nights: 2 MDs | Weekends: 2 daytime hospitalists | |
| Nights: 2 MDs | Nights: 1 MD | ||||
| Location of service | In same university hospital | In same university hospital | In same university hospital | In same university hospital | Physically separate hospital affiliate (UCSF Medical Center at Mount Zion) |
| Nonhousestaff FTEs/total hospitalist group | 3/15 | 10/14 | 20/30 | 25/34 | 6/36 |
| What hospitalists provide care on nonhous estaff services? | Core of 3 hospitalists (also do month on housestaff service) | Hospitalist group shares nonhousestaff services | Core of 14 FTEs dedicated to nonhousestaff services | Hospitalist group shares nonhousestaff services | Core of 6 Mount Zionbased hospitalists (also spend 23 months on housestaff service at university hospital) |
| Other 6 FTEs consist of 10 faculty with mixed roles | |||||
| Age of service | 2 years | 4 years | 3 years | 5 years | 3 years |
| How patients get assigned to non‐housestaff service? | 1. Only ED admissions with no transfers from ICU or other services | Assigned by rotation | 1. Alternating admissions with housestaff services during afternoon | 1. Alternating admissions with housestaff services during day | 1. Lower‐acuity admissions from ED |
| 2. Admit whenever bed open on service (geographic) | 2. Observation cases triaged directly to service | 2. Lower‐acuity patients and direct admissions | 2. Lower‐acuity admissions from clinics | ||
| 3. Once housestaff cap, all subsequent admits until midnight to nonhousestaff service | 3. Nonhousestaff service admits all patients once resident caps reached | 3. Transfers from housestaff service no longer requiring tertiary services (or with complex discharge planning) | |||
| Average daily census of nonhousestaff service | 12 | 56 | 70 (75 cap) | 8595 | 2026 |
| Number of shifts per month/shift duration | 15/1012 hours | 15/12 hours | 1517 (depending on number of nights covered)/812 hours (swing = 8 hours, day = 1012 hours, night = 12 hours) | 20/1012 hours | 1617/1012 hours |
| Shift sequences | 710 days consecutive | Variable | 67 days consecutive followed by 1 night for those who cover nights | 7 days consecutive | 4‐ to 6‐day variable sequences |
| Total clinical days worked/year | 168 | 182.5 | 185202 (depending on number of nights covered) | 212 | 196 |
| Weekend clinical time | 50% of weekends | 50% of weekends | 50% of weekends | 50% of weekends | 50% of weekends |
| Night coverage/by whom? | Yes/exclusively moonlighters | Yes/shared (50% covered by 1 dedicated nocturnist) | Yes/66% of nights staffed by dedicated nocturnists with remainder shared | Yes/exclusively by six 1‐year nocturnists | Yes/exclusively by moonlighters |
| Presence of midlevel providers | Yes 6 FTE PAs Mon.‐Sun. | No | Yes 8 FTE PAs weekdays | No | No |
| Presence of dedicated case manager | Yes | Yes | Yes | No | Yes |
| Presence of medical students for patient care | No | No | Yes, 4th‐year subinterns or students on elective rotation | No | No |
| Compensation model | Salary + weekend bonus beyond 10 | Salary + incentive | Base + shift‐based incentive + quality incentive | Salary + incentive | Salary |
| Pay differential compared to housestaff service compensation | 10% Higher because of weekend bonus | None | About 20% higher base compensation; loan forgiveness program tied to nonhousestaff time | None | About 20% higher compensation |
| Hospital financial support | Yes | Yes | Yes | Yes | Yes |
Table 2 does illustrate several important considerations in structuring nonhousestaff services. For example, if a nonhousestaff service operates at a different physical location, careful triage of patients is necessary. Resources, including the availability of subspecialty and surgical consultants, may differ, and thus patient complexity and acuity may dictate whether a patient gets admitted to the nonhousestaff service. These triage factors were a major challenge in the design of UCSF's nonhousestaff service. The other nonhousestaff services handle overflow admissions after the housestaff service reaches a census or admission cap; transfers between services rarely occur, and resources are similar.
Other observations include that hospitalists work a similar number of hours each year and cover 50% of weekends but with differing shift lengths and sequences. Each service also provides night coverage but only Emory, the University of Michigan, and Northwestern utilize dedicated nocturnists. The University of Michigan and Brigham & Women's Hospital are the only sites that employ midlevel providers who work closely with hospitalists. In terms of group structure, Northwestern's hospitalists are the most integrated, with each hospitalist sharing equal responsibility for nonhousestaff coverage. In contrast, the other programs use selected hospitalists or a dedicated core of hospitalists to provide nonhousestaff services. Compensation models also vary, with certain groups salaried and others having incentive systems, although all receive hospital‐based funding support. Hospital‐based funding support ranges from 40% to 100% of total program costs across sites, creating similar variance in a given program's deficit risk. Finally, most programs do compensate nonhousestaff services at higher rates.
All the decisions captured in Table 2 have implications for costs, recruitment, and service structure. Furthermore, the striking variations demonstrate how different academic hospitalist positions can occur both within a hospital medicine group and across institutions. Of note, Table 2 only characterizes nonhousestaff medicine services, not the growing number of comanagement (eg, orthopedics, neurosurgery, or hematology/oncology) and other clinical services (eg, observation unit or preoperative medicine clinic) also staffed by hospitalists at AMCs.
CHALLENGES
Hospital medicine programs and AMCs face several challenges in building non‐housestaff services, but these will likely become less daunting as programs learn from their own experiences, from those of colleagues at other institutions, and from future investigations of these care models. We highlight a few issues below that warrant important consideration.
The Equities of the System
Prior to developing nonhousestaff services, our academic hospitalist programs scheduled teaching service time in month or half‐month blocks, balancing holidays and weekends. Equity in scheduling became a function of required clinical time, sources of non‐clinical funding (eg, grants, educational or administrative roles), and expectations for scholarship, attributes typical of most subspecialty academic divisions. Given the differing clinical missions that have stimulated academic hospital medicine programs to form, concerns of scheduling equity have grown, posing challenges not experienced in other divisions.
Institutions that choose to divide housestaff and nonhousestaff duties among distinct groups of hospitalists create the potential for a 2‐tiered system, one in which those with housestaff roles are more valued and respected by the institution. Hospitalists working on nonhousestaff services admit patients, write orders, and field direct patient calls, a role rarely undertaken by subspecialty attendings or hospitalists on housestaff services. Our collective experiences provide evidence of the danger of this second‐class‐citizen status, one that requires attention to ensure job satisfaction, retention, and necessary career development.
Institutions have accentuated the second‐class‐citizen concern by staffing nonhousestaff roles with 1‐year hospitalistsPGY‐4s. Most of these hires in our institutions are individuals just out of residency and intent on pursuing a fellowship. We speculate that they enjoy the comforts of the AMC where they often trained and accept purely nonhousestaff positions because of what they view as an appealing work schedule and salary. Although this approach addresses the growing need for hospitalists on nonhousestaff services in the short term, these positions must remain attractive enough (both financially and professionally) to encourage residency graduates to pursue an academic hospitalist career instead of a 1‐year position as a transition to fellowship. Otherwise, the approach conveys a message that relatively inexperienced physicians are good enough to be hospitalists.
Developing a cadre of clinically focused hospitalists who provide outstanding patient care and also garner respect as successful academicians is a difficult task. Although 1 group in our sample (Northwestern) shares nonhousestaff responsibilities equally, others may find this impractical, particularly where faculty members were hired before nonhousestaff services were established. Redefining such clinical positions several years into a career may be challenging, as it forces faculty members into roles they didn't sign up for or grandfathers them out of such roles, adding to the risk of a 2‐tiered system. Alternatively, groups may focus on building academic activities into nonhousestaff services, including medical student teaching, quality improvement, or clinical research activities. In this article, we deliberately classified these services as nonhousestaff rather than non‐teaching because the latter fails to acknowledge that these hospitalists often serve as teachers (eg, housestaff conferences, supervision of midlevel providers, and/or rotating medical students)an important if not symbolic distinction. It is imperative that planning for nonhousestaff services balance the larger academic mission of hospital medicine groups with creating equitable, valued, and sustainable job descriptions.
Defining the Patient Mix
Developing an optimal patient mix on nonhousestaff services also carries important implications. For services that work in parallel with the housestaff service and simply take extra patients above the resident cap, this concern may be less significant. However, other nonhousestaff services have been structured to care for lower‐acuity patients (eg, cellulitis, asthma, pneumonia) or select patient populations (eg, sickle cell or inflammatory bowel disease). This distribution system potentially changes the educational experience on the housestaff servicedecreasing the bread‐and‐butter admissionsbut also may affect the job satisfaction of hospitalists and midlevel providers on nonhousestaff services. Building triage criteria, working with emergency department leadership, and avoiding patients being turfed between different services is critical. We strongly recommend a regular process to review admissions to each service and determine when the triage process requires further calibration.
Recruitment and Retention
Traditionally, graduates of residency or fellowship training programs chose academic positions because of an interest in teaching, a desire for scholarship, or a commitment to research. Those interested in primarily clinical roles typically pursued positions in nonacademic settings. The development of nonhousestaff services challenges this paradigm because the objective for academic hospitalist leadership now becomes recruiting pure clinicians as well as academicians. These might be the same individual, a hospitalist who provides both housestaff and nonhousestaff services, or 2 different individuals if the nonhousestaff service is covered by dedicated hospitalists. In addition, with the current promotion structure in academia, a purely clinical position may be less attractive, as it provides fewer opportunities for advancement.
Therefore, recruitment and retention of academic hospitalists will require job descriptions that provide dedicated teaching opportunities, time for participation in quality and safety improvement projects, or pursuit of a scholarly interest in non‐clinical timethe diastole of an academic hospitalist.41 Hospital medicine leadership will also need to better distinguish off‐time from non‐clinical time, as many young hospitalists struggle to balance professional and personal commitmentsa recipe for burnout.42 Regardless of how clinical responsibilities differ between 2 hospitalists, providing them with similar academic resources is what will distinguish their positions from that in the community. Furthermore, many groups have chosen to pay faculty a premium for their nonhousestaff roles or to use specific recruitment incentives such as educational loan forgiveness programs.
With the expected growth of nonhousestaff services and surgical comanagement, hospital medicine programs will also need to determine if new hires will focus on a specific service (eg, orthopedic hospitalist) or whether job descriptions will include a mix of activities (eg, 3 months' teaching service, 3 months' nonhousestaff medical service, and 3 months' surgical comanagement service). A second and equally important question is where does the hospitalist live? If cardiology wants hospitalists to care for their patients, should they be hired and mentored by cardiologists or by hospitalists in a division of general or hospital medicine? In many cases, a graduating resident with plans to pursue a fellowship (eg, cardiology or hematology/oncology) may be a perfect candidate for a 1‐year position on his or her future specialty service. However, in the long term, maintaining all the academic hospitalists under the same umbrella will provide greater mentorship, professional development, opportunities for collaboration, clinical diversity, and sense of belonging to a group, rather than being a token hospitalist for another division.
Compensation and Financial Relationships with AMCs
Salaries for hospitalists working on nonhousestaff services are typically higher at AMCs, which are competing with community standards given the similar level of clinical hours worked. However, although pay for nonhousestaff activities should reflect the nature of the work, compensation models based on clinical productivity alone may prove inadequate. It appears hospitalists working in academic facilities spend significant time on indirect patient care because of these hospitals' inefficiencies, usually not found in community settings.43 Devising compensation for an academic hospitalist requires careful attention and must balance a number of factors because these hospitalists will not generate their entire salary from clinical services. Financial support must come from either the division or medical center, an annual negotiation at AMCs.
Several methods exist to structure hospitalist compensation. A hospitalist's salary may be fixed, may have a base salary with incentives, or may be derived based on clinical productivity. For example, if a hospital medicine program provides both housestaff and nonhousestaff services and employs a fixed‐salary approach, it may choose a menu‐style method to determine compensation (eg, 6 months on nonhousestaff service at x dollars/month + 3 months on housestaff service at x dollars/month = annual salary). If a hospitalist takes on a funded nonclinical role or secures extramural funding, the salary menu gets adjusted accordingly as the clinical time is bought out. Critics of the fixed‐salary approach argue that paying each hospitalist the same salary regardless of the specific job description yields an inequitable system in which some are rewarded with less clinical time.
Compensation should probably have a guaranteed base salary with incentives, which could be determined by a formula that weighs clinical productivity, quality improvement efforts, scholarly activity, and teaching excellence. This model provides financial incentives to develop both clinically and academically but introduces complexity in determining a fair incentive structure. Finally, compensation can be structured without salary guarantee and putting compensation fully at risk based on clinical productivity, although this is an unlikely strategy for any hospital medicine group. This approach does disproportionately reward high volume providers, potentially at the risk of quality and safety, but also creates significant incentives to improve efficiency.
With respect to AMC relationships, hospital medicine programs must ensure the positive return on investment that drives financial support at their institutions. This fundamental economic dynamic makes AMCs dependent on their hospital medicine groups and vice versa. We caution programs from solely relying on measures such as reduced hospital costs or length of stay as a basis of funding unless there is a reward for maintaining performance once it inevitably plateaus. Moreover, explicitly tying utilization efficiency (ie, length of stay) to salary violates Stark rules44 and carries potential malpractice implications should patient care errors be attributable to premature hospital discharge. Over time hospitalists will need to maintain clinical benchmarks but also provide additional and valued services to their institutions, including quality and safety improvement activities and compliance with residency work hour restrictions.
Defining the Academic Hospitalist
The question is simple and perhaps philosophical: Are hospitalists who work at an AMC academic hospitalists? And what job description truly defines an academic hospitalist? Currently, there are no standards for the clinical activity of an academic hospitalist position (eg, number of weeks, weekends, and hours) or for assessment of nonclinical productivity. Hospital medicine programs face the challenge of defining positions that fulfill the growing clinical mission at AMCs but have little experience or guidance in ensuring they will lead to advancing the academic mission. Specifically, how do hospitalists who provide mostly clinical care, particularly on nonhousestaff services, achieve promotion? Hospital medicine program leadership must create enough opportunity and time for the development of skills in research, education, and quality or systems improvement if academic hospitalists are to succeed.
The Association of Chiefs of General Internal Medicine (ACGIM), the Society of General Internal Medicine (SGIM), and the Society of Hospital Medicine (SHM) are currently collaborating to develop consensus guidelines in this area. Ultimately, through the efforts of these important governing bodies, the specialty of hospital medicine will be able to demonstrate the unique skills and services they provide and move toward advocating for academic promotion criteria that recognize their value and accomplishments.
FUTURE DIRECTIONS
Many lament that the milieu for academic hospitalists raises more challenges than solutions, but we believe the current era is one of excitement and opportunity. In the coming years, we will experience continued growth of nonhousestaff services, including greater comanagement with our surgical and medical specialty colleagues. These opportunities will create new relationships and increase our visibility in AMCs. However, we must remain committed to studying nonhousestaff services and determine if and how they differ from their housestaff and community counterparts, as this will be an important step toward addressing current challenges.
As hospitalists take on increasingly diverse roles,45 we must also lead initiatives to better train, recruit, and retain those interested in our specialty. Promoting our field and recruiting future faculty should occur through local hospitalist career nights, events at national meetings (targeting students, housestaff, and fellows), and other mechanisms utilized by our subspecialty colleagues. For housestaff interested in fellowship training, the growing number of hospitalist fellowships can provide skills in teaching and quality improvement.46 For trainees committed to research, we should work with existing general medicine research fellowships and partner to provide hospitalist mentorship.
Hospitalists are in a unique position to influence the delivery of clinical services, shape the future of residency training, guide quality and safety improvement initiatives, and take on leadership roles through our departments, universities, and medical centers. With the growing number of clinical services being added to our portfolio, we will need careful planning and evaluation of our efforts to build successful partnerships and develop faculty roles that balance clinical and academic pursuits to sustain long‐term and satisfying hospitalist careers.
- Accreditation Council for Graduate Medical Education. Information related to the ACGME's effort to address resident duty hours and other relevant resource materials. Available at: http://www.acgme.org/acWebsite/dutyHours/dh_index.asp Accessed May 28,2007.
- ,,,.The status of hospital medicine groups in the United States.J Hosp Med.2006;1:75–80.
- .Reflections: the hospitalist movement a decade later.J Hosp Med.2006;1:248–252.
- .Duty hours for resident physicians—tough choices for teaching hospitals.N Engl J Med.2002;347:1275–1278.
- ,.Resident work hours, hospitalist programs and academic medical centers.The Hospitalist.2005;Jan/Feb:30–33.
- .Adapting to duty‐hour limits—four years on.N Engl J Med.2007;356:2668–2670.
- ,,,,,.Effects of work hour reduction on residents' lives: a systematic review.JAMA.2005;294:1088–1100.
- ,,,,.Impact of reduced duty hours on residents' educational satisfaction at the University of California, San Francisco.Acad Med.2006;81:76–81.
- ,,, et al.Effect of Residency Duty‐Hour Limits. Views of Key Clinical Faculty.Arch Intern Med.2007;167:1487–1492.
- ,,,.Perceived impact of duty hours regulation: a survey of residents and program directors.Am J Med.2007;120:644–648.
- ,,,.The impact of duty hours on resident self reports of errors.J Gen Intern Med.2007;22:205–209.
- ,,,,.Managing discontinuity in academic medical centers: strategies for a safe and effective resident sign‐out.J Hosp Med.2006;1:257–266.
- ,.Changes in hospital mortality associated with residency work‐hour regulations.Ann Intern Med.2007;147:73–80.
- ,,,.Changes in outcomes for internal medicine inpatients after work‐hour regulations.Ann Intern Med.2007;147:97–103.
- ,,, et al.Mortality among hospitalized Medicare beneficiaries in the first 2 years following ACGME resident duty hour reform.JAMA.2007;298:975–983.
- ,,, et al.Mortality among patients in VA hospitals in the first 2 years following ACGME resident duty hour reform.JAMA.2007;298:984–991.
- .An elusive balance—residents' work hours and the continuity of care.N Engl J Med.2007;356:2665–2667.
- ,.Hippocrates affirmed? Limiting residents' work hours does no harm to patients.Ann Intern Med.2007;356:143–144.
- ,.Evaluating resident duty hour reforms.JAMA.2007;298:1055–1057.
- ,,,,.Housestaff team workload and organization effects on patient outcomes in an academic general internal medicine inpatient service.Arch Intern Med.2007;167:47–52.
- ,,,.Predicting future staffing needs at teaching hospitals: use of an analytical program with multiple variables.Arch Surg.2007;142:329–334.
- . A primer on: resident work hours. American Medical Student Association. 6th ed. 2005. Available at: http://www.amsa.org/rwh/RWHprimer_6thEdition.pdf. Accessed May 28,2007.
- ,.The hospitalist movement 5 years later.JAMA.2002;287:487–494.
- ,.The emerging role of “hospitalists” in the American health care system.N Engl J Med.1996;335:514–517.
- .The future of hospital medicine: evolution or revolution?Am J Med.2004;117:446–450.
- Society of Hospital Medicine. Media Center link: Growth of hospital medicine nationwide. Available at www.hospitalmedicine.org. Accessed May 28,2007.
- Kohn L,Corrigan JM,Donaldson MS, eds.To Err Is Human: Building a Safer Health System.Washington DC:Committee on Quality of Health Care in America, Institute of Medicine, National Academy Press;2000.
- Committee on Quality of Health Care in America, Institute of Medicine.Crossing the Quality Chasm: A New Health System for the 21st Century.Washington, DC:National Academy Press;2001.
- ,.Hospitalists in teaching hospitals: opportunities but not without danger.J Gen Intern Med.2004;19:392–393.
- .What will board certification be‐and mean‐for hospitalists?J Hosp Med.2007;2:102–104.
- .Academic medical centers under siege.N Engl J Med.1994;331:1370–1371.
- ,.Academic medicine meets managed care: a high impact collision.Acad Med.1996;71:839–845.
- .Preventing the academic medical center from becoming an oxymoron.Acad Med.1996;71:117–120.
- ,,.Why have academic medical center survived?JAMA.2005:293;1495–1500.
- ,,,.Comparison of hospitalist and nonhospitalists in inpatient length of stay adjusting for patient and physician characteristics.J Gen Intern Med.2004;19:1127–1132.
- ,,.Comparison of hospital costs and length of stay for community internists, hospitalists, and academicians.J Gen Intern Med.2007;22;662–667.
- ,.The impact of hospitalists on the cost and quality of inpatient care in the United States: a research synthesis.Med Care Res Rev.2005;62:379–406.
- ,,.Hospitalists and an innovative emergency department admissions process.J Gen Intern Med.2004;19:266–268.
- ,,,,.Comparison of resource utilization and clinical outcomes between teaching and nonteaching medical services.J Hosp Med.2007;2:150–157.
- ,,.Comparison of hospital costs and length of stay for community internists, hospitalists, and academicians.J Gen Intern Med.2007;22:662–667.
- ,,,.Preparing for “diastole”: advanced training opportunities for academic hospitalists.J Hosp Med.2006;1:368–377.
- Society of Hospital Medicine Career Satisfaction Task Force. White Paper on Hospitalist Career Satisfaction. 2006;1–45. Available at: http://www.hospitalmedicine.org. Accessed August 11,2007.
- ,,.How hospitalists spend their time: insights on efficiency and safety.J Hosp Med.2006;1:88–93.
- A Guide to Complying with Stark Self‐Referral Rules.Washington, DC:Atlantic Information Services, Inc.; 2004. Available at: http://www.aispub.com/. Accessed September 9, 2007.
- ,.The expanding role of hospitalists in the United States.Swiss Med Wkly.2006;136:591–596.
- ,,,.Hospital medicine fellowships: works in progress.Am J Med.2006;119:72e71–e77.
Many academic medical centers (AMCs) have developed nonhousestaff services to provide clinical care once provided by physicians‐in‐training. These services, often staffed by hospitalists and/or midlevel providers, have experienced tremendous growth in the past few years, yet very little exists in the literature about their development, structure, efficacy, or impact on hospitals, patients, and hospital medicine programs. The primary forces driving this growth include Accreditation Council for Graduate Medical Education (ACGME) resident duty hour restrictions,1 growth of the hospitalist movement,2 and the emphasis on simultaneously improving financial performance and quality of care in AMCs.3
Resident Duty Hour Restrictions
In 2003, the ACGME mandated restrictions on resident work hours, limiting trainees to 80 hours per week.1 Many training programs struggled with how to provide important clinical services while complying with the new restrictionscreating numerous models that bridged care between different shifts of residents.45 Implementation of day floats (a dedicated resident who rounds with the postcall team), night floats (a dedicated overnight resident who admits and cross‐covers patients), or some variation of both was common.6 No guidelines accompanied the ACGME mandate, leaving institutions to independently structure their programs without a known best practice.
Subsequent literature carefully addressed how the duty hour restrictions affect residents' lives and education but failed to discuss models for providing care.711 Training programs began to institute necessary changes but in doing so, created greater patient discontinuity and increased handoffs between residents, elevating the potential for adverse patient outcomes.12 Recent large‐scale studies indicate that inpatient care is the same or improved since adoption of the duty hour restrictions,1316 but controversy continues, with several editorials debating the issue.1719
Because increasing the volume of patients on housestaff services was not a viable option,20 many AMCs created nonhousestaff services and hired midlevel providers (nurse practitioners and physician assistants) to offset resident workloads and comply with the new restrictions. However, this strategy represented a very expensive alternative.21 Moreover, the current 80‐hour work limits may be revised downward, particularly given the lower restrictions in other countries,22 and this will further drive the demand for nonhousestaff services. Hospitalists, with their documented impact on efficiency and return on investment,23 represent a solution to fill these needs and have quickly become the predominant approach at AMCs.
The Hospitalist Movement
Since the term hospitalist was first coined in 1996,24 the remarkable growth of the number of practicing hospitalists emphasizes how first community hospitals and now AMCs have embraced this approach.25 With more than 20,000 nationwide and projections that the field will grow to 30,000 by 2010,26 hospitalists are becoming the primary providers for in‐patients.2 This growth was further catalyzed when widely expressed concerns about safety and quality became public,2728 and hospitalists incorporated patient safety and quality improvement activities into their efforts.3 The confluence of these factors also prompted emergence of hospital medicine programs at AMCs, a growth that came with anticipated dangers.29 Reflecting the recognition that hospital medicine is becoming a separate specialty30 and is integral to the functioning of an AMC, institutions now operate dedicated divisions of hospital medicine.
AMCs and Hospital Performance
AMCs operate 3 related enterprises: a medical school that trains future physicians, a research arena that promotes basic and clinical investigation, and health care services that often encompass both hospitals and clinics. The financial viability of AMCs has always been a topic of debate, largely because of the different missions they pursue and the financial means by which they survive.3133 Over the past decade, cuts in Medicare reimbursement, challenges in balancing bed availability with occupancy rates, and a growing emphasis on cost reduction have created a more competitive health care environment, but without the predicted demise of AMCs.34 Because education and research generally fail to bolster the bottom line, AMCs have focused on optimizing clinical services to promote financial viability.
Hospitalists are uniquely positioned to help this bottom line, just as they do at community hospitals. Their involvement in patient care may produce reductions in length of stay, greater efficiency in discharge planning, and significant cost savings.3537 Hospitalists may also improve throughput in emergency departments and decrease wait times, leading to more efficient bed utilization.38 This leads to a potential for greater hospital revenue by increasing both the number of admissions, particularly surgical cases, and staffed inpatient beds, the latter a premium, as AMCs continue to expand their bed capacity almost annually. Finally, hospitalists may serve as change agents in improving the quality and safety of care delivered, an increasingly important metric given the desire for and expansion of publicly reported measures.
From a financial standpoint, Medicare support to AMCs for training residents now subsidizes fewer clinical care hours. Hospitalist‐driven nonhousestaff services will continue to fulfill a need created by this marked change in residency training. The tension of who pays for nonhousestaff servicesincreased federal support, financial backing from AMCs, or academic department fundsposes an ongoing struggle. In fact, this may be the most important issue currently debated among hospital administrators and department chairs. Regardless, AMCs continue to view hospitalists as a mechanism (or even solution) to maintaining their financial bottom line through improving care delivery systems, adhering to resident work hour restrictions, leading quality and safety improvement initiatives, and improving clinical patient outcomes.
MODELS FOR NONHOUSESTAFF MEDICAL SERVICES
For AMCs developing nonhousestaff services, the process begins by addressing a series of important questions (Table 1). How these questions are answered is often driven by local factors such as the vision of local leadership and the availability of important resources. Nonetheless, it is important for hospitals to share their experiences because best practices remain unclear. Table 2 provides a tabular snapshot of nonhousestaff medicine services at 5 AMCs to highlight similarities and differences. Data in the table were compiled by having a representative from each AMC report the different attributes, which reflects each program as of July 2007. Table 2 provides no data on the quality or efficiency of housestaff versus nonhousestaff services, though this type of investigation is underway and will be critical in future planning.3940
| Questions | Potential options |
|---|---|
| Who will provide care on nonhousestaff services? | Physicians seeking a 1‐year position |
| Physicians committed to a purely clinical career | |
| Physicians committed to an academic career in hospital medicine | |
| Will hospitalists share nonhousestaff service time, or will there be dedicated nonhousestaff hospitalists? | Hybrid positions |
| Dedicated nonhousestaff hospitalists | |
| Use of PGY‐4s1‐year positions (often individuals planning a fellowship) | |
| How should staffing be organized? | Hospitalist‐only services |
| Use of midlevel providers | |
| Will there be 24‐7 coverage, and if so, how will nights be staffed? | Dedicated nocturnists |
| Shared among daytime hospitalists | |
| Midlevel providers | |
| Moonlighters (fellows or residents) | |
| What type of schedule will provide blocks of clinical time to ensure continuity of care but also ensure adequate nonclinical time to prevent physician burnout and turnover? | 7 on/7 off sequences |
| 45 day sequences | |
| Longer shifts with fewer shifts per month | |
| Shorter shifts with more shifts per month | |
| Where will patients on a nonhousestaff service receive care? | Geographically designed serviced |
| ○ Different floor | |
| ○ Different hospital | |
| Mixed among housestaff service | |
| What patient population will be cared for on the nonhousestaff service? | Same as on housestaff service |
| Based on bed availability if nonhousestaff service is geographic (a unit) | |
| Based on triage guidelines (lower acuity, observation patients, specific diagnoses) | |
| What volume of patients will be cared for on the nonhousestaff service? | Fixed census cap based on staffing |
| Flexible census depending on activity of housestaff service (above their cap) | |
| Will compensation for providing nonhousestaff services differ from that on housestaff services? | Higher base salary |
| Incentives tied to nonhousestaff time | |
| Different incentive structures |
| Attributes | BWH | Emory | University of Michigan | Northwestern | UCSF |
|---|---|---|---|---|---|
| Description of staffing model | Mon.‐Sun.: 1 daytime Hospitalist | Mon.‐Sun.: 4 daytime hospitalists, 2 swing shift admitters | Weekdays: 7 daytime hospitalists, 1 swing shift hospitalist | Mon.‐Sun.: 8 daytime hospitalists, 1 triage hospitalist | Weekdays: 2 daytime hospitalists, 1 swing shift hospitalist |
| Nights: 1 MD | Nights: 1 MDs | Weekends: 7 daytime hospitalists | Nights: 2 MDs | Weekends: 2 daytime hospitalists | |
| Nights: 2 MDs | Nights: 1 MD | ||||
| Location of service | In same university hospital | In same university hospital | In same university hospital | In same university hospital | Physically separate hospital affiliate (UCSF Medical Center at Mount Zion) |
| Nonhousestaff FTEs/total hospitalist group | 3/15 | 10/14 | 20/30 | 25/34 | 6/36 |
| What hospitalists provide care on nonhous estaff services? | Core of 3 hospitalists (also do month on housestaff service) | Hospitalist group shares nonhousestaff services | Core of 14 FTEs dedicated to nonhousestaff services | Hospitalist group shares nonhousestaff services | Core of 6 Mount Zionbased hospitalists (also spend 23 months on housestaff service at university hospital) |
| Other 6 FTEs consist of 10 faculty with mixed roles | |||||
| Age of service | 2 years | 4 years | 3 years | 5 years | 3 years |
| How patients get assigned to non‐housestaff service? | 1. Only ED admissions with no transfers from ICU or other services | Assigned by rotation | 1. Alternating admissions with housestaff services during afternoon | 1. Alternating admissions with housestaff services during day | 1. Lower‐acuity admissions from ED |
| 2. Admit whenever bed open on service (geographic) | 2. Observation cases triaged directly to service | 2. Lower‐acuity patients and direct admissions | 2. Lower‐acuity admissions from clinics | ||
| 3. Once housestaff cap, all subsequent admits until midnight to nonhousestaff service | 3. Nonhousestaff service admits all patients once resident caps reached | 3. Transfers from housestaff service no longer requiring tertiary services (or with complex discharge planning) | |||
| Average daily census of nonhousestaff service | 12 | 56 | 70 (75 cap) | 8595 | 2026 |
| Number of shifts per month/shift duration | 15/1012 hours | 15/12 hours | 1517 (depending on number of nights covered)/812 hours (swing = 8 hours, day = 1012 hours, night = 12 hours) | 20/1012 hours | 1617/1012 hours |
| Shift sequences | 710 days consecutive | Variable | 67 days consecutive followed by 1 night for those who cover nights | 7 days consecutive | 4‐ to 6‐day variable sequences |
| Total clinical days worked/year | 168 | 182.5 | 185202 (depending on number of nights covered) | 212 | 196 |
| Weekend clinical time | 50% of weekends | 50% of weekends | 50% of weekends | 50% of weekends | 50% of weekends |
| Night coverage/by whom? | Yes/exclusively moonlighters | Yes/shared (50% covered by 1 dedicated nocturnist) | Yes/66% of nights staffed by dedicated nocturnists with remainder shared | Yes/exclusively by six 1‐year nocturnists | Yes/exclusively by moonlighters |
| Presence of midlevel providers | Yes 6 FTE PAs Mon.‐Sun. | No | Yes 8 FTE PAs weekdays | No | No |
| Presence of dedicated case manager | Yes | Yes | Yes | No | Yes |
| Presence of medical students for patient care | No | No | Yes, 4th‐year subinterns or students on elective rotation | No | No |
| Compensation model | Salary + weekend bonus beyond 10 | Salary + incentive | Base + shift‐based incentive + quality incentive | Salary + incentive | Salary |
| Pay differential compared to housestaff service compensation | 10% Higher because of weekend bonus | None | About 20% higher base compensation; loan forgiveness program tied to nonhousestaff time | None | About 20% higher compensation |
| Hospital financial support | Yes | Yes | Yes | Yes | Yes |
Table 2 does illustrate several important considerations in structuring nonhousestaff services. For example, if a nonhousestaff service operates at a different physical location, careful triage of patients is necessary. Resources, including the availability of subspecialty and surgical consultants, may differ, and thus patient complexity and acuity may dictate whether a patient gets admitted to the nonhousestaff service. These triage factors were a major challenge in the design of UCSF's nonhousestaff service. The other nonhousestaff services handle overflow admissions after the housestaff service reaches a census or admission cap; transfers between services rarely occur, and resources are similar.
Other observations include that hospitalists work a similar number of hours each year and cover 50% of weekends but with differing shift lengths and sequences. Each service also provides night coverage but only Emory, the University of Michigan, and Northwestern utilize dedicated nocturnists. The University of Michigan and Brigham & Women's Hospital are the only sites that employ midlevel providers who work closely with hospitalists. In terms of group structure, Northwestern's hospitalists are the most integrated, with each hospitalist sharing equal responsibility for nonhousestaff coverage. In contrast, the other programs use selected hospitalists or a dedicated core of hospitalists to provide nonhousestaff services. Compensation models also vary, with certain groups salaried and others having incentive systems, although all receive hospital‐based funding support. Hospital‐based funding support ranges from 40% to 100% of total program costs across sites, creating similar variance in a given program's deficit risk. Finally, most programs do compensate nonhousestaff services at higher rates.
All the decisions captured in Table 2 have implications for costs, recruitment, and service structure. Furthermore, the striking variations demonstrate how different academic hospitalist positions can occur both within a hospital medicine group and across institutions. Of note, Table 2 only characterizes nonhousestaff medicine services, not the growing number of comanagement (eg, orthopedics, neurosurgery, or hematology/oncology) and other clinical services (eg, observation unit or preoperative medicine clinic) also staffed by hospitalists at AMCs.
CHALLENGES
Hospital medicine programs and AMCs face several challenges in building non‐housestaff services, but these will likely become less daunting as programs learn from their own experiences, from those of colleagues at other institutions, and from future investigations of these care models. We highlight a few issues below that warrant important consideration.
The Equities of the System
Prior to developing nonhousestaff services, our academic hospitalist programs scheduled teaching service time in month or half‐month blocks, balancing holidays and weekends. Equity in scheduling became a function of required clinical time, sources of non‐clinical funding (eg, grants, educational or administrative roles), and expectations for scholarship, attributes typical of most subspecialty academic divisions. Given the differing clinical missions that have stimulated academic hospital medicine programs to form, concerns of scheduling equity have grown, posing challenges not experienced in other divisions.
Institutions that choose to divide housestaff and nonhousestaff duties among distinct groups of hospitalists create the potential for a 2‐tiered system, one in which those with housestaff roles are more valued and respected by the institution. Hospitalists working on nonhousestaff services admit patients, write orders, and field direct patient calls, a role rarely undertaken by subspecialty attendings or hospitalists on housestaff services. Our collective experiences provide evidence of the danger of this second‐class‐citizen status, one that requires attention to ensure job satisfaction, retention, and necessary career development.
Institutions have accentuated the second‐class‐citizen concern by staffing nonhousestaff roles with 1‐year hospitalistsPGY‐4s. Most of these hires in our institutions are individuals just out of residency and intent on pursuing a fellowship. We speculate that they enjoy the comforts of the AMC where they often trained and accept purely nonhousestaff positions because of what they view as an appealing work schedule and salary. Although this approach addresses the growing need for hospitalists on nonhousestaff services in the short term, these positions must remain attractive enough (both financially and professionally) to encourage residency graduates to pursue an academic hospitalist career instead of a 1‐year position as a transition to fellowship. Otherwise, the approach conveys a message that relatively inexperienced physicians are good enough to be hospitalists.
Developing a cadre of clinically focused hospitalists who provide outstanding patient care and also garner respect as successful academicians is a difficult task. Although 1 group in our sample (Northwestern) shares nonhousestaff responsibilities equally, others may find this impractical, particularly where faculty members were hired before nonhousestaff services were established. Redefining such clinical positions several years into a career may be challenging, as it forces faculty members into roles they didn't sign up for or grandfathers them out of such roles, adding to the risk of a 2‐tiered system. Alternatively, groups may focus on building academic activities into nonhousestaff services, including medical student teaching, quality improvement, or clinical research activities. In this article, we deliberately classified these services as nonhousestaff rather than non‐teaching because the latter fails to acknowledge that these hospitalists often serve as teachers (eg, housestaff conferences, supervision of midlevel providers, and/or rotating medical students)an important if not symbolic distinction. It is imperative that planning for nonhousestaff services balance the larger academic mission of hospital medicine groups with creating equitable, valued, and sustainable job descriptions.
Defining the Patient Mix
Developing an optimal patient mix on nonhousestaff services also carries important implications. For services that work in parallel with the housestaff service and simply take extra patients above the resident cap, this concern may be less significant. However, other nonhousestaff services have been structured to care for lower‐acuity patients (eg, cellulitis, asthma, pneumonia) or select patient populations (eg, sickle cell or inflammatory bowel disease). This distribution system potentially changes the educational experience on the housestaff servicedecreasing the bread‐and‐butter admissionsbut also may affect the job satisfaction of hospitalists and midlevel providers on nonhousestaff services. Building triage criteria, working with emergency department leadership, and avoiding patients being turfed between different services is critical. We strongly recommend a regular process to review admissions to each service and determine when the triage process requires further calibration.
Recruitment and Retention
Traditionally, graduates of residency or fellowship training programs chose academic positions because of an interest in teaching, a desire for scholarship, or a commitment to research. Those interested in primarily clinical roles typically pursued positions in nonacademic settings. The development of nonhousestaff services challenges this paradigm because the objective for academic hospitalist leadership now becomes recruiting pure clinicians as well as academicians. These might be the same individual, a hospitalist who provides both housestaff and nonhousestaff services, or 2 different individuals if the nonhousestaff service is covered by dedicated hospitalists. In addition, with the current promotion structure in academia, a purely clinical position may be less attractive, as it provides fewer opportunities for advancement.
Therefore, recruitment and retention of academic hospitalists will require job descriptions that provide dedicated teaching opportunities, time for participation in quality and safety improvement projects, or pursuit of a scholarly interest in non‐clinical timethe diastole of an academic hospitalist.41 Hospital medicine leadership will also need to better distinguish off‐time from non‐clinical time, as many young hospitalists struggle to balance professional and personal commitmentsa recipe for burnout.42 Regardless of how clinical responsibilities differ between 2 hospitalists, providing them with similar academic resources is what will distinguish their positions from that in the community. Furthermore, many groups have chosen to pay faculty a premium for their nonhousestaff roles or to use specific recruitment incentives such as educational loan forgiveness programs.
With the expected growth of nonhousestaff services and surgical comanagement, hospital medicine programs will also need to determine if new hires will focus on a specific service (eg, orthopedic hospitalist) or whether job descriptions will include a mix of activities (eg, 3 months' teaching service, 3 months' nonhousestaff medical service, and 3 months' surgical comanagement service). A second and equally important question is where does the hospitalist live? If cardiology wants hospitalists to care for their patients, should they be hired and mentored by cardiologists or by hospitalists in a division of general or hospital medicine? In many cases, a graduating resident with plans to pursue a fellowship (eg, cardiology or hematology/oncology) may be a perfect candidate for a 1‐year position on his or her future specialty service. However, in the long term, maintaining all the academic hospitalists under the same umbrella will provide greater mentorship, professional development, opportunities for collaboration, clinical diversity, and sense of belonging to a group, rather than being a token hospitalist for another division.
Compensation and Financial Relationships with AMCs
Salaries for hospitalists working on nonhousestaff services are typically higher at AMCs, which are competing with community standards given the similar level of clinical hours worked. However, although pay for nonhousestaff activities should reflect the nature of the work, compensation models based on clinical productivity alone may prove inadequate. It appears hospitalists working in academic facilities spend significant time on indirect patient care because of these hospitals' inefficiencies, usually not found in community settings.43 Devising compensation for an academic hospitalist requires careful attention and must balance a number of factors because these hospitalists will not generate their entire salary from clinical services. Financial support must come from either the division or medical center, an annual negotiation at AMCs.
Several methods exist to structure hospitalist compensation. A hospitalist's salary may be fixed, may have a base salary with incentives, or may be derived based on clinical productivity. For example, if a hospital medicine program provides both housestaff and nonhousestaff services and employs a fixed‐salary approach, it may choose a menu‐style method to determine compensation (eg, 6 months on nonhousestaff service at x dollars/month + 3 months on housestaff service at x dollars/month = annual salary). If a hospitalist takes on a funded nonclinical role or secures extramural funding, the salary menu gets adjusted accordingly as the clinical time is bought out. Critics of the fixed‐salary approach argue that paying each hospitalist the same salary regardless of the specific job description yields an inequitable system in which some are rewarded with less clinical time.
Compensation should probably have a guaranteed base salary with incentives, which could be determined by a formula that weighs clinical productivity, quality improvement efforts, scholarly activity, and teaching excellence. This model provides financial incentives to develop both clinically and academically but introduces complexity in determining a fair incentive structure. Finally, compensation can be structured without salary guarantee and putting compensation fully at risk based on clinical productivity, although this is an unlikely strategy for any hospital medicine group. This approach does disproportionately reward high volume providers, potentially at the risk of quality and safety, but also creates significant incentives to improve efficiency.
With respect to AMC relationships, hospital medicine programs must ensure the positive return on investment that drives financial support at their institutions. This fundamental economic dynamic makes AMCs dependent on their hospital medicine groups and vice versa. We caution programs from solely relying on measures such as reduced hospital costs or length of stay as a basis of funding unless there is a reward for maintaining performance once it inevitably plateaus. Moreover, explicitly tying utilization efficiency (ie, length of stay) to salary violates Stark rules44 and carries potential malpractice implications should patient care errors be attributable to premature hospital discharge. Over time hospitalists will need to maintain clinical benchmarks but also provide additional and valued services to their institutions, including quality and safety improvement activities and compliance with residency work hour restrictions.
Defining the Academic Hospitalist
The question is simple and perhaps philosophical: Are hospitalists who work at an AMC academic hospitalists? And what job description truly defines an academic hospitalist? Currently, there are no standards for the clinical activity of an academic hospitalist position (eg, number of weeks, weekends, and hours) or for assessment of nonclinical productivity. Hospital medicine programs face the challenge of defining positions that fulfill the growing clinical mission at AMCs but have little experience or guidance in ensuring they will lead to advancing the academic mission. Specifically, how do hospitalists who provide mostly clinical care, particularly on nonhousestaff services, achieve promotion? Hospital medicine program leadership must create enough opportunity and time for the development of skills in research, education, and quality or systems improvement if academic hospitalists are to succeed.
The Association of Chiefs of General Internal Medicine (ACGIM), the Society of General Internal Medicine (SGIM), and the Society of Hospital Medicine (SHM) are currently collaborating to develop consensus guidelines in this area. Ultimately, through the efforts of these important governing bodies, the specialty of hospital medicine will be able to demonstrate the unique skills and services they provide and move toward advocating for academic promotion criteria that recognize their value and accomplishments.
FUTURE DIRECTIONS
Many lament that the milieu for academic hospitalists raises more challenges than solutions, but we believe the current era is one of excitement and opportunity. In the coming years, we will experience continued growth of nonhousestaff services, including greater comanagement with our surgical and medical specialty colleagues. These opportunities will create new relationships and increase our visibility in AMCs. However, we must remain committed to studying nonhousestaff services and determine if and how they differ from their housestaff and community counterparts, as this will be an important step toward addressing current challenges.
As hospitalists take on increasingly diverse roles,45 we must also lead initiatives to better train, recruit, and retain those interested in our specialty. Promoting our field and recruiting future faculty should occur through local hospitalist career nights, events at national meetings (targeting students, housestaff, and fellows), and other mechanisms utilized by our subspecialty colleagues. For housestaff interested in fellowship training, the growing number of hospitalist fellowships can provide skills in teaching and quality improvement.46 For trainees committed to research, we should work with existing general medicine research fellowships and partner to provide hospitalist mentorship.
Hospitalists are in a unique position to influence the delivery of clinical services, shape the future of residency training, guide quality and safety improvement initiatives, and take on leadership roles through our departments, universities, and medical centers. With the growing number of clinical services being added to our portfolio, we will need careful planning and evaluation of our efforts to build successful partnerships and develop faculty roles that balance clinical and academic pursuits to sustain long‐term and satisfying hospitalist careers.
- Accreditation Council for Graduate Medical Education. Information related to the ACGME's effort to address resident duty hours and other relevant resource materials. Available at: http://www.acgme.org/acWebsite/dutyHours/dh_index.asp Accessed May 28,2007.
- ,,,.The status of hospital medicine groups in the United States.J Hosp Med.2006;1:75–80.
- .Reflections: the hospitalist movement a decade later.J Hosp Med.2006;1:248–252.
- .Duty hours for resident physicians—tough choices for teaching hospitals.N Engl J Med.2002;347:1275–1278.
- ,.Resident work hours, hospitalist programs and academic medical centers.The Hospitalist.2005;Jan/Feb:30–33.
- .Adapting to duty‐hour limits—four years on.N Engl J Med.2007;356:2668–2670.
- ,,,,,.Effects of work hour reduction on residents' lives: a systematic review.JAMA.2005;294:1088–1100.
- ,,,,.Impact of reduced duty hours on residents' educational satisfaction at the University of California, San Francisco.Acad Med.2006;81:76–81.
- ,,, et al.Effect of Residency Duty‐Hour Limits. Views of Key Clinical Faculty.Arch Intern Med.2007;167:1487–1492.
- ,,,.Perceived impact of duty hours regulation: a survey of residents and program directors.Am J Med.2007;120:644–648.
- ,,,.The impact of duty hours on resident self reports of errors.J Gen Intern Med.2007;22:205–209.
- ,,,,.Managing discontinuity in academic medical centers: strategies for a safe and effective resident sign‐out.J Hosp Med.2006;1:257–266.
- ,.Changes in hospital mortality associated with residency work‐hour regulations.Ann Intern Med.2007;147:73–80.
- ,,,.Changes in outcomes for internal medicine inpatients after work‐hour regulations.Ann Intern Med.2007;147:97–103.
- ,,, et al.Mortality among hospitalized Medicare beneficiaries in the first 2 years following ACGME resident duty hour reform.JAMA.2007;298:975–983.
- ,,, et al.Mortality among patients in VA hospitals in the first 2 years following ACGME resident duty hour reform.JAMA.2007;298:984–991.
- .An elusive balance—residents' work hours and the continuity of care.N Engl J Med.2007;356:2665–2667.
- ,.Hippocrates affirmed? Limiting residents' work hours does no harm to patients.Ann Intern Med.2007;356:143–144.
- ,.Evaluating resident duty hour reforms.JAMA.2007;298:1055–1057.
- ,,,,.Housestaff team workload and organization effects on patient outcomes in an academic general internal medicine inpatient service.Arch Intern Med.2007;167:47–52.
- ,,,.Predicting future staffing needs at teaching hospitals: use of an analytical program with multiple variables.Arch Surg.2007;142:329–334.
- . A primer on: resident work hours. American Medical Student Association. 6th ed. 2005. Available at: http://www.amsa.org/rwh/RWHprimer_6thEdition.pdf. Accessed May 28,2007.
- ,.The hospitalist movement 5 years later.JAMA.2002;287:487–494.
- ,.The emerging role of “hospitalists” in the American health care system.N Engl J Med.1996;335:514–517.
- .The future of hospital medicine: evolution or revolution?Am J Med.2004;117:446–450.
- Society of Hospital Medicine. Media Center link: Growth of hospital medicine nationwide. Available at www.hospitalmedicine.org. Accessed May 28,2007.
- Kohn L,Corrigan JM,Donaldson MS, eds.To Err Is Human: Building a Safer Health System.Washington DC:Committee on Quality of Health Care in America, Institute of Medicine, National Academy Press;2000.
- Committee on Quality of Health Care in America, Institute of Medicine.Crossing the Quality Chasm: A New Health System for the 21st Century.Washington, DC:National Academy Press;2001.
- ,.Hospitalists in teaching hospitals: opportunities but not without danger.J Gen Intern Med.2004;19:392–393.
- .What will board certification be‐and mean‐for hospitalists?J Hosp Med.2007;2:102–104.
- .Academic medical centers under siege.N Engl J Med.1994;331:1370–1371.
- ,.Academic medicine meets managed care: a high impact collision.Acad Med.1996;71:839–845.
- .Preventing the academic medical center from becoming an oxymoron.Acad Med.1996;71:117–120.
- ,,.Why have academic medical center survived?JAMA.2005:293;1495–1500.
- ,,,.Comparison of hospitalist and nonhospitalists in inpatient length of stay adjusting for patient and physician characteristics.J Gen Intern Med.2004;19:1127–1132.
- ,,.Comparison of hospital costs and length of stay for community internists, hospitalists, and academicians.J Gen Intern Med.2007;22;662–667.
- ,.The impact of hospitalists on the cost and quality of inpatient care in the United States: a research synthesis.Med Care Res Rev.2005;62:379–406.
- ,,.Hospitalists and an innovative emergency department admissions process.J Gen Intern Med.2004;19:266–268.
- ,,,,.Comparison of resource utilization and clinical outcomes between teaching and nonteaching medical services.J Hosp Med.2007;2:150–157.
- ,,.Comparison of hospital costs and length of stay for community internists, hospitalists, and academicians.J Gen Intern Med.2007;22:662–667.
- ,,,.Preparing for “diastole”: advanced training opportunities for academic hospitalists.J Hosp Med.2006;1:368–377.
- Society of Hospital Medicine Career Satisfaction Task Force. White Paper on Hospitalist Career Satisfaction. 2006;1–45. Available at: http://www.hospitalmedicine.org. Accessed August 11,2007.
- ,,.How hospitalists spend their time: insights on efficiency and safety.J Hosp Med.2006;1:88–93.
- A Guide to Complying with Stark Self‐Referral Rules.Washington, DC:Atlantic Information Services, Inc.; 2004. Available at: http://www.aispub.com/. Accessed September 9, 2007.
- ,.The expanding role of hospitalists in the United States.Swiss Med Wkly.2006;136:591–596.
- ,,,.Hospital medicine fellowships: works in progress.Am J Med.2006;119:72e71–e77.