User login
Hospital-based clinicians’ use of technology for patient care-related communication: a national survey
Communication among healthcare professionals is essential for high-quality patient care. However, communication is difficult in hospitals because of heavy workloads, rapidly evolving plans of care, and geographic dispersion of team members. When hospital-based professionals are not in the same place at the same time, they rely on technology to communicate. Pagers have historically been used to support communication in hospitals, but are limited in their capabilities. Several recent small studies have shown that some physicians have started using standard text messaging on smartphones for patient care–related (PCR) messages.1-3 Although potentially enhancing clinician efficiency, use of standard text messaging for PCR messages raises concern about security risks related to transmission of protected health information. Addressing these concerns are emerging secure mobile messaging applications designed for PCR communication. Although recent studies suggest these applications are well received by users, the adoption rate is largely unknown.4,5
We conducted a study to see if there was a shift in use of hospital-based communication technologies under way. We surveyed a national sample of hospital-based clinicians to characterize current use of communication technologies, assess potential risks and perceptions related to use of standard text messaging for PCR messages, and characterize the adoption of secure mobile messaging applications designed for PCR communication.
METHODS
Study Design
The study was a cross-sectional survey of hospitalists—physicians and advanced practice providers whose primary professional focus is care of hospitalized patients. We studied hospitalists because of their role in coordinating care for complex medical patients and because prior studies identified communication as a major component of their work.6,7 The Northwestern University Institutional Review Board deemed this study exempt.
Survey Instrument
Four investigators (Drs. O’Leary, Liebovitz, Wu, and Reddy) with expertise in interprofessional communication and information technology created a draft survey based in part on results of prior studies assessing clinicians’ use of smartphones and standard text messaging for PCR communication.1,3 In the first section of the survey, we asked respondents which technologies were provided by their organization and which technologies they used for PCR communication. In the second section, we asked respondents about their use and perceptions of standard text messaging for PCR communication. In the third section, we asked about implementation and adoption of secure mobile messaging applications at their hospital. In the fourth and final section, we asked for demographic information.
We randomly selected 8 attendees of the 2015 Midwest Hospital Medicine Conference and invited them to participate in a focus group that would review a paper version of the draft survey and recommend revisions. Using the group’s feedback, we revised the ordinal response scale for questions related to standard text messaging and made other minor edits. We then created an Internet-based version of the survey and pilot-tested it with 8 hospitalists from 4 diverse hospitalist groups within the Northwestern Medicine Health System. We made additional minor edits based on pilot-test feedback.
Sampling Strategy
We used the largest hospitalist database maintained by the Society of Hospital Medicine (SHM). This database includes information on more than 28,000 individuals, representing SHM members and nonmembers who had participated in organizational events. In addition to clinically active hospitalists, the database includes non-hospitalists and clinically inactive hospitalists. We used this database to try to capture the largest possible number of potentially eligible hospitalists.
Survey Administration
We administered the survey in collaboration with SHM staff. E-mails that included a link to the survey on the Survey Monkey website were sent by SHM staff to individuals within the database. These e-mails were sent through Real Magnet, an e-mail marketing platform8 that allowed the SHM staff to determine the number of individuals who received and opened the e-mail and the number who clicked on the survey link. To try to promote participation, we offered respondents the chance to enter a lottery to win one of four $50 gift certificates. The initial e-mail was sent in April 2016, a reminder in May 2016, and a final reminder in July 2016.
Data Analysis
We calculated descriptive statistics of participants’ demographic characteristics. We estimated nonresponse bias by comparing demographic characteristics across waves of respondents using analysis of variance, t tests, and χ2 tests. This method is based on the finding that characteristics of late respondents often resemble those of nonrespondents.9 We collapsed response categories for communication technologies to simplify interpretation. For example, numeric pagers, alphanumeric pagers, and 2-way pagers were collapsed into a pagers category. We used t tests and χ2 tests to assess for associations between receipt of standard text messages for PCR communication and respondents’ age, sex, race, professional type, hospital size, practice location, and hospital teaching status. Similarly, we used t tests and χ2 tests to explore associations between implementation of secure mobile messaging application and respondents’ age, sex, race, professional type, hospital size, practice location, and hospital teaching status. All statistical analyses were performed with Stata Release 11.2 (StataCorp).
RESULTS
Participant Characteristics
Overall, the survey link was sent to 28,870 e-mail addresses. Addresses for which e-mails were undeliverable or for which the e-mail was never opened were excluded, yielding a total of 5,786 eligible respondents in the sample. After rejecting 42 clinically inactive individuals, 70 individuals who responded to only the initial item, and 27 duplicates, a total of 620 participant surveys were included in the final analysis. The adjusted response rate was 11.0%.

As shown in Table 1, mean (SD) respondent age was 42.9 (10.0) years, nearly half of the respondents were female, nearly a third were of nonwhite race, an overwhelming majority were physicians, and workplaces were in a variety of hospital settings. The sample size used to calculate demographic characteristics varied from 538 to 549 because of missing data for these items. We found no significant differences in demographic characteristics of respondents across the 3 survey waves, suggesting a lack of survey response bias (Supplemental Table).
Provision and Use of Communication Technologies for PCR Communication
Pagers were provided to the majority of respondents by their hospitals (79.8%, 495/620). Other devices were provided much less frequently, with 21.0% (130/620) reporting their organization provided a smartphone, 20.2% (125/620) a mobile phone, and 4.4% (27/620) a hands-free communication device. Organizations provided no device to 8.2% (51/620) of respondents and an “other” device to 5.5% (34/620).

An overwhelming majority used multiple technologies to receive PCR communication, with 17.7
Participants’ Experiences With Standard Text Messaging for PCR Communication

Participants’ experiences with standard text messaging for PCR communication are summarized in Table 3. Overall, 65.1% (369/ 567) of respondents reported receiving standard text messages for PCR communication at least once per week when on clinical duty, and 52.9% (300/567) received standard text messages at least once per day.
Overall, 21.5% (122/567) of respondents received standard text messages that included individually identifiable information at least once per day, and 41.3% (234/567) received messages that included some identifiable information (eg, patient initials, room number) at least once per day. About one-fifth of respondents (21.0%, 119/567) indicated receiving standard text messages for urgent clinical issues at least once per day. Receipt of standard text messages for a patient for whom the respondent was no longer providing care, delays in receipt of messages, messages missed because smartphones were set to vibrate, and receipt of messages when not on clinical duty occurred, but less frequently. We found no significant associations between receipt of PCR standard text messages once or more per day and respondents’ age, sex, race, professional type, hospital size, or hospital teaching status. A higher percentage of respondents in the South (63.2%, 96/152) and West (57.9%, 70/121) reported receipt of at least 1 PCR standard text message per day, compared with respondents in the Northeast (51.9%, 54/104), Midwest (45.2%, 61/135), and other (25.0%, 4/16) (P = 0.003).
Senders of PCR standard text messages. Of respondents who received standard text messages for PCR communication at least once per week, a majority reported receiving messages from physicians in the same specialty (88.6%, 327/369) and from physicians in other specialties (71.3%, 263/369). A minority of respondents reported receiving messages from nurses (35.0%, 129/369), social workers (30.6%, 113/369), and pharmacists (27.9%, 103/369).
Perceptions among users. Of respondents who received standard text messages for PCR communication at least once per week, an overwhelming majority agreed or strongly agreed that use of standard text messaging allowed them to provide better care (81.7%, 295/361) and made them more efficient (87.3%, 315/361). A majority also agreed or strongly agreed that standard text messaging posed a risk to the privacy and confidentiality of patient information (56.4%, 203/360), and nearly a third indicated that standard text messaging posed a risk to the timely receipt of messages by the correct individual (27.6%, 100/362). Overall, a large majority agreed or strongly agreed that the benefits of using standard text messaging for PCR communication outweighed the risks (85.0%, 306/360).

Adoption of Organization-Approved Secure Mobile Messaging Applications
Participants’ reported adoption of organization-approved secure mobile messaging applications is shown in the Figure. About one-fourth (26.6%, 146/549) of respondents reported that their organization had implemented a secure messaging application and that some clinicians were using it, whereas relatively few (7.3%, 40/549) reported that their organization had implemented an application that was being used by most clinicians. A substantial portion of respondents (21.3%, 117/549) were not sure whether their organization was planning to implement a secure mobile messaging application for PCR communication. We found no significant associations between partial or nearly full implementation of a secure mobile messaging application and respondents’ age, sex, race, professional type, hospital size, or practice location. A lower percentage of respondents in major teaching hospitals (28.0%, 67/239) reported partial or nearly full implementation of a secure mobile messaging application, compared with respondents from teaching hospitals (39.6%, 74/187) and nonteaching hospitals (39.2%, 40/102) (P = 0.02).
DISCUSSION
We found that pagers were the technology most commonly used by hospital-based clinicians, but also that a majority have used standard text messaging for PCR communication, and that relatively few hospitals had fully implemented secure mobile messaging applications. Our findings reveal a wide range of technology use and suggest an evolution to support communication among healthcare professionals.
The persistence of pagers as the technology most commonly provided by hospitals and used by clinicians for communication is noteworthy in that pagers are limited in their capabilities, typically not allowing a response to the message sender or the ability to forward a message, and often not allowing the ability to send messages to multiple recipients. The continued heavy use of pagers may be explained by their relatively low cost, especially compared with investment in new technologies, and reliable receipt of messages, even in areas with no cell phone service or WiFi signal. Furthermore, hospitals’ providing pagers allows for oversight, directory creation, and the potential for integration into other information systems. In 2 recent studies, inpatient paging communication was evaluated in depth. Carlile et al.10 found that the majority of pages requested a response, requiring an interruption in physician workflow to initiate a callback. Kummerow Broman et al.11 similarly found that a majority of pages requested a callback; they also found a high volume of nonurgent messages. With pager use, a high volume of messages, many of which require a response but are nonurgent, makes for a highly interruptive workflow.
That more than half of our hospital-based clinicians received standard text messages for PCR communication once or more per day is consistent with other, smaller studies. Kuhlmann et al.1 surveyed 97 pediatric hospitalists and found that a majority sent and received work-related text messages. Prochaska et al.2 surveyed 131 residents and found that standard text messaging was the communication method preferred by the majority of residents. Similar to these studies, our study found that receipt of standard text messages that included protected health information was fairly common. However, we identified additional risks related to standard text messaging. One-fifth of our respondents received standard text messages for urgent clinical issues once or more per day, and many respondents reported occasional receipt of messages regarding a patient for whom they were no longer providing care and receipt of messages when not on clinical duty. The usual inability to automate forwarding of standard text messages to another clinician creates the potential for clinically important messages to be delayed or missed. These risks have not been reported in the literature, and we think healthcare systems may not be fully aware of them. Our findings suggest that many clinicians have migrated from pagers to standard text messaging for the enhanced efficiency, and they perceive that the benefit of improved efficiency outweighs the risks to protected health information and the delay in receipt of clinically important messages by the correct individual.
Secure mobile messaging applications seem to address the limitations of both pagers and standard text messaging. Secure mobile messaging applications typically allow message response, message forwarding, multiple recipients, directory creation, the potential to create escalation schemes for nonresponse, and integration with other information systems, including electronic health records. Although several hospitals have developed their own systems,4,12,13 most hospitals likely will purchase a vendor-based system. We found that a minority of hospitals had implemented a secure messaging application, and even fewer had most of their clinicians using it. Although little research has been conducted on these applications, studies suggest they are well received by users.4,5 Given that paging communication studies have found a large portion of pages are sent by nurses and other non-physician team members, secure mobile messaging applications should allow for direct message exchange with all professionals caring for a patient.10,11 Furthermore, hospitals will need to ensure adequate cell phone and WiFi signal strength throughout their facilities to ensure reliable and timely delivery of messages.
Our study had several limitations. We used a large database to conduct a national survey but had a low response rate and some drop-off of responses within surveys. Our sample reflected respondent diversity, and our analyses of demographic characteristics found no significant differences across survey response waves. Unfortunately, we did not have nonrespondents’ characteristics and therefore could not compare them with respondents’. It is possible that nonrespondents may have had different practices related to use of communication technology, especially in light of the fact that the survey was conducted by e-mail. However, given our finding that use of standard text messaging was comparable to that in other studies,1,2 and given the similarity of respondents’ characteristics across response waves, our findings likely were not affected by nonresponse bias.9 Last, we used a survey that had not been validated. However, this survey was created by experts in interprofessional collaboration and information technology, was informed by prior studies, and was iteratively refined during pretesting and pilot testing.
CONCLUSION
Pagers remain the technology most commonly used by hospital-based clinicians, but a majority also use standard text messaging for PCR communication, and relatively few hospitals have fully implemented secure mobile messaging applications. The wide range of technologies used suggests an evolution of methods to support communication among healthcare professionals. An optimized system will improve communication efficiency while ensuring the security of their patients’ information and the timely receipt of that information by the intended clinician.
Acknowledgment
The authors thank the Society of Hospital Medicine and the society staff who helped administer the survey, especially Mr. Ethan Gray.
Disclosure
Nothing to report.
1. Kuhlmann S, Ahlers-Schmidt CR, Steinberger E. TXT@WORK: pediatric hospitalists and text messaging. Telemed J E Health. 2014;20(7):647-652. PubMed
2. Prochaska MT, Bird AN, Chadaga A, Arora VM. Resident use of text messaging for patient care: ease of use or breach of privacy? JMIR Med Inform. 2015;3(4):e37. PubMed
3. Tran K, Morra D, Lo V, Quan SD, Abrams H, Wu RC. Medical students and personal smartphones in the clinical environment: the impact on confidentiality of personal health information and professionalism. J Med Internet Res. 2014;16(5):e132. PubMed
4. Patel N, Siegler JE, Stromberg N, Ravitz N, Hanson CW. Perfect storm of inpatient communication needs and an innovative solution utilizing smartphones and secured messaging. Appl Clin Inform. 2016;7(3):777-789. PubMed
5. Przybylo JA, Wang A, Loftus P, Evans KH, Chu I, Shieh L. Smarter hospital communication: secure smartphone text messaging improves provider satisfaction and perception of efficacy, workflow. J Hosp Med. 2014;9(9):573-578. PubMed
6. O’Leary KJ, Liebovitz DM, Baker DW. How hospitalists spend their time: insights on efficiency and safety. J Hosp Med. 2006;1(2):88-93. PubMed
7. Tipping MD, Forth VE, O’Leary KJ, et al. Where did the day go?—a time-motion study of hospitalists. J Hosp Med. 2010;5(6):323-328. PubMed
8. Real Magnet. http://www.realmagnet.com. Accessed December 20, 2016.
9. Armstrong JS, Overton T. Estimating nonresponse bias in mail surveys. J Mark Res. 1977;14(3):396-402.
10. Carlile N, Rhatigan JJ, Bates DW. Why do we still page each other? Examining the frequency, types and senders of pages in academic medical services. BMJ Qual Saf. 2017;26(1):24-29. PubMed
11. Kummerow Broman K, Kensinger C, Phillips C, et al. Characterizing the clamor: an in-depth analysis of inpatient paging communication. Acad Med. 2016;91(7):1015-1021. PubMed
12. Dalal AK, Schnipper J, Massaro A, et al. A web-based and mobile patient-centered “microblog” messaging platform to improve care team communication in acute care. J Am Med Inform Assoc. 2017;24(e1):e178-e184. PubMed
13. Wu R, Lo V, Morra D, et al. A smartphone-enabled communication system to improve hospital communication: usage and perceptions of medical trainees and nurses on general internal medicine wards. J Hosp Med. 2015;10(2):83-89. PubMed
Communication among healthcare professionals is essential for high-quality patient care. However, communication is difficult in hospitals because of heavy workloads, rapidly evolving plans of care, and geographic dispersion of team members. When hospital-based professionals are not in the same place at the same time, they rely on technology to communicate. Pagers have historically been used to support communication in hospitals, but are limited in their capabilities. Several recent small studies have shown that some physicians have started using standard text messaging on smartphones for patient care–related (PCR) messages.1-3 Although potentially enhancing clinician efficiency, use of standard text messaging for PCR messages raises concern about security risks related to transmission of protected health information. Addressing these concerns are emerging secure mobile messaging applications designed for PCR communication. Although recent studies suggest these applications are well received by users, the adoption rate is largely unknown.4,5
We conducted a study to see if there was a shift in use of hospital-based communication technologies under way. We surveyed a national sample of hospital-based clinicians to characterize current use of communication technologies, assess potential risks and perceptions related to use of standard text messaging for PCR messages, and characterize the adoption of secure mobile messaging applications designed for PCR communication.
METHODS
Study Design
The study was a cross-sectional survey of hospitalists—physicians and advanced practice providers whose primary professional focus is care of hospitalized patients. We studied hospitalists because of their role in coordinating care for complex medical patients and because prior studies identified communication as a major component of their work.6,7 The Northwestern University Institutional Review Board deemed this study exempt.
Survey Instrument
Four investigators (Drs. O’Leary, Liebovitz, Wu, and Reddy) with expertise in interprofessional communication and information technology created a draft survey based in part on results of prior studies assessing clinicians’ use of smartphones and standard text messaging for PCR communication.1,3 In the first section of the survey, we asked respondents which technologies were provided by their organization and which technologies they used for PCR communication. In the second section, we asked respondents about their use and perceptions of standard text messaging for PCR communication. In the third section, we asked about implementation and adoption of secure mobile messaging applications at their hospital. In the fourth and final section, we asked for demographic information.
We randomly selected 8 attendees of the 2015 Midwest Hospital Medicine Conference and invited them to participate in a focus group that would review a paper version of the draft survey and recommend revisions. Using the group’s feedback, we revised the ordinal response scale for questions related to standard text messaging and made other minor edits. We then created an Internet-based version of the survey and pilot-tested it with 8 hospitalists from 4 diverse hospitalist groups within the Northwestern Medicine Health System. We made additional minor edits based on pilot-test feedback.
Sampling Strategy
We used the largest hospitalist database maintained by the Society of Hospital Medicine (SHM). This database includes information on more than 28,000 individuals, representing SHM members and nonmembers who had participated in organizational events. In addition to clinically active hospitalists, the database includes non-hospitalists and clinically inactive hospitalists. We used this database to try to capture the largest possible number of potentially eligible hospitalists.
Survey Administration
We administered the survey in collaboration with SHM staff. E-mails that included a link to the survey on the Survey Monkey website were sent by SHM staff to individuals within the database. These e-mails were sent through Real Magnet, an e-mail marketing platform8 that allowed the SHM staff to determine the number of individuals who received and opened the e-mail and the number who clicked on the survey link. To try to promote participation, we offered respondents the chance to enter a lottery to win one of four $50 gift certificates. The initial e-mail was sent in April 2016, a reminder in May 2016, and a final reminder in July 2016.
Data Analysis
We calculated descriptive statistics of participants’ demographic characteristics. We estimated nonresponse bias by comparing demographic characteristics across waves of respondents using analysis of variance, t tests, and χ2 tests. This method is based on the finding that characteristics of late respondents often resemble those of nonrespondents.9 We collapsed response categories for communication technologies to simplify interpretation. For example, numeric pagers, alphanumeric pagers, and 2-way pagers were collapsed into a pagers category. We used t tests and χ2 tests to assess for associations between receipt of standard text messages for PCR communication and respondents’ age, sex, race, professional type, hospital size, practice location, and hospital teaching status. Similarly, we used t tests and χ2 tests to explore associations between implementation of secure mobile messaging application and respondents’ age, sex, race, professional type, hospital size, practice location, and hospital teaching status. All statistical analyses were performed with Stata Release 11.2 (StataCorp).
RESULTS
Participant Characteristics
Overall, the survey link was sent to 28,870 e-mail addresses. Addresses for which e-mails were undeliverable or for which the e-mail was never opened were excluded, yielding a total of 5,786 eligible respondents in the sample. After rejecting 42 clinically inactive individuals, 70 individuals who responded to only the initial item, and 27 duplicates, a total of 620 participant surveys were included in the final analysis. The adjusted response rate was 11.0%.
As shown in Table 1, mean (SD) respondent age was 42.9 (10.0) years, nearly half of the respondents were female, nearly a third were of nonwhite race, an overwhelming majority were physicians, and workplaces were in a variety of hospital settings. The sample size used to calculate demographic characteristics varied from 538 to 549 because of missing data for these items. We found no significant differences in demographic characteristics of respondents across the 3 survey waves, suggesting a lack of survey response bias (Supplemental Table).
Provision and Use of Communication Technologies for PCR Communication
Pagers were provided to the majority of respondents by their hospitals (79.8%, 495/620). Other devices were provided much less frequently, with 21.0% (130/620) reporting their organization provided a smartphone, 20.2% (125/620) a mobile phone, and 4.4% (27/620) a hands-free communication device. Organizations provided no device to 8.2% (51/620) of respondents and an “other” device to 5.5% (34/620).
An overwhelming majority used multiple technologies to receive PCR communication, with 17.7
Participants’ Experiences With Standard Text Messaging for PCR Communication
Participants’ experiences with standard text messaging for PCR communication are summarized in Table 3. Overall, 65.1% (369/ 567) of respondents reported receiving standard text messages for PCR communication at least once per week when on clinical duty, and 52.9% (300/567) received standard text messages at least once per day.
Overall, 21.5% (122/567) of respondents received standard text messages that included individually identifiable information at least once per day, and 41.3% (234/567) received messages that included some identifiable information (eg, patient initials, room number) at least once per day. About one-fifth of respondents (21.0%, 119/567) indicated receiving standard text messages for urgent clinical issues at least once per day. Receipt of standard text messages for a patient for whom the respondent was no longer providing care, delays in receipt of messages, messages missed because smartphones were set to vibrate, and receipt of messages when not on clinical duty occurred, but less frequently. We found no significant associations between receipt of PCR standard text messages once or more per day and respondents’ age, sex, race, professional type, hospital size, or hospital teaching status. A higher percentage of respondents in the South (63.2%, 96/152) and West (57.9%, 70/121) reported receipt of at least 1 PCR standard text message per day, compared with respondents in the Northeast (51.9%, 54/104), Midwest (45.2%, 61/135), and other (25.0%, 4/16) (P = 0.003).
Senders of PCR standard text messages. Of respondents who received standard text messages for PCR communication at least once per week, a majority reported receiving messages from physicians in the same specialty (88.6%, 327/369) and from physicians in other specialties (71.3%, 263/369). A minority of respondents reported receiving messages from nurses (35.0%, 129/369), social workers (30.6%, 113/369), and pharmacists (27.9%, 103/369).
Perceptions among users. Of respondents who received standard text messages for PCR communication at least once per week, an overwhelming majority agreed or strongly agreed that use of standard text messaging allowed them to provide better care (81.7%, 295/361) and made them more efficient (87.3%, 315/361). A majority also agreed or strongly agreed that standard text messaging posed a risk to the privacy and confidentiality of patient information (56.4%, 203/360), and nearly a third indicated that standard text messaging posed a risk to the timely receipt of messages by the correct individual (27.6%, 100/362). Overall, a large majority agreed or strongly agreed that the benefits of using standard text messaging for PCR communication outweighed the risks (85.0%, 306/360).
Adoption of Organization-Approved Secure Mobile Messaging Applications
Participants’ reported adoption of organization-approved secure mobile messaging applications is shown in the Figure. About one-fourth (26.6%, 146/549) of respondents reported that their organization had implemented a secure messaging application and that some clinicians were using it, whereas relatively few (7.3%, 40/549) reported that their organization had implemented an application that was being used by most clinicians. A substantial portion of respondents (21.3%, 117/549) were not sure whether their organization was planning to implement a secure mobile messaging application for PCR communication. We found no significant associations between partial or nearly full implementation of a secure mobile messaging application and respondents’ age, sex, race, professional type, hospital size, or practice location. A lower percentage of respondents in major teaching hospitals (28.0%, 67/239) reported partial or nearly full implementation of a secure mobile messaging application, compared with respondents from teaching hospitals (39.6%, 74/187) and nonteaching hospitals (39.2%, 40/102) (P = 0.02).
DISCUSSION
We found that pagers were the technology most commonly used by hospital-based clinicians, but also that a majority have used standard text messaging for PCR communication, and that relatively few hospitals had fully implemented secure mobile messaging applications. Our findings reveal a wide range of technology use and suggest an evolution to support communication among healthcare professionals.
The persistence of pagers as the technology most commonly provided by hospitals and used by clinicians for communication is noteworthy in that pagers are limited in their capabilities, typically not allowing a response to the message sender or the ability to forward a message, and often not allowing the ability to send messages to multiple recipients. The continued heavy use of pagers may be explained by their relatively low cost, especially compared with investment in new technologies, and reliable receipt of messages, even in areas with no cell phone service or WiFi signal. Furthermore, hospitals’ providing pagers allows for oversight, directory creation, and the potential for integration into other information systems. In 2 recent studies, inpatient paging communication was evaluated in depth. Carlile et al.10 found that the majority of pages requested a response, requiring an interruption in physician workflow to initiate a callback. Kummerow Broman et al.11 similarly found that a majority of pages requested a callback; they also found a high volume of nonurgent messages. With pager use, a high volume of messages, many of which require a response but are nonurgent, makes for a highly interruptive workflow.
That more than half of our hospital-based clinicians received standard text messages for PCR communication once or more per day is consistent with other, smaller studies. Kuhlmann et al.1 surveyed 97 pediatric hospitalists and found that a majority sent and received work-related text messages. Prochaska et al.2 surveyed 131 residents and found that standard text messaging was the communication method preferred by the majority of residents. Similar to these studies, our study found that receipt of standard text messages that included protected health information was fairly common. However, we identified additional risks related to standard text messaging. One-fifth of our respondents received standard text messages for urgent clinical issues once or more per day, and many respondents reported occasional receipt of messages regarding a patient for whom they were no longer providing care and receipt of messages when not on clinical duty. The usual inability to automate forwarding of standard text messages to another clinician creates the potential for clinically important messages to be delayed or missed. These risks have not been reported in the literature, and we think healthcare systems may not be fully aware of them. Our findings suggest that many clinicians have migrated from pagers to standard text messaging for the enhanced efficiency, and they perceive that the benefit of improved efficiency outweighs the risks to protected health information and the delay in receipt of clinically important messages by the correct individual.
Secure mobile messaging applications seem to address the limitations of both pagers and standard text messaging. Secure mobile messaging applications typically allow message response, message forwarding, multiple recipients, directory creation, the potential to create escalation schemes for nonresponse, and integration with other information systems, including electronic health records. Although several hospitals have developed their own systems,4,12,13 most hospitals likely will purchase a vendor-based system. We found that a minority of hospitals had implemented a secure messaging application, and even fewer had most of their clinicians using it. Although little research has been conducted on these applications, studies suggest they are well received by users.4,5 Given that paging communication studies have found a large portion of pages are sent by nurses and other non-physician team members, secure mobile messaging applications should allow for direct message exchange with all professionals caring for a patient.10,11 Furthermore, hospitals will need to ensure adequate cell phone and WiFi signal strength throughout their facilities to ensure reliable and timely delivery of messages.
Our study had several limitations. We used a large database to conduct a national survey but had a low response rate and some drop-off of responses within surveys. Our sample reflected respondent diversity, and our analyses of demographic characteristics found no significant differences across survey response waves. Unfortunately, we did not have nonrespondents’ characteristics and therefore could not compare them with respondents’. It is possible that nonrespondents may have had different practices related to use of communication technology, especially in light of the fact that the survey was conducted by e-mail. However, given our finding that use of standard text messaging was comparable to that in other studies,1,2 and given the similarity of respondents’ characteristics across response waves, our findings likely were not affected by nonresponse bias.9 Last, we used a survey that had not been validated. However, this survey was created by experts in interprofessional collaboration and information technology, was informed by prior studies, and was iteratively refined during pretesting and pilot testing.
CONCLUSION
Pagers remain the technology most commonly used by hospital-based clinicians, but a majority also use standard text messaging for PCR communication, and relatively few hospitals have fully implemented secure mobile messaging applications. The wide range of technologies used suggests an evolution of methods to support communication among healthcare professionals. An optimized system will improve communication efficiency while ensuring the security of their patients’ information and the timely receipt of that information by the intended clinician.
Acknowledgment
The authors thank the Society of Hospital Medicine and the society staff who helped administer the survey, especially Mr. Ethan Gray.
Disclosure
Nothing to report.
1. Kuhlmann S, Ahlers-Schmidt CR, Steinberger E. TXT@WORK: pediatric hospitalists and text messaging. Telemed J E Health. 2014;20(7):647-652. PubMed
2. Prochaska MT, Bird AN, Chadaga A, Arora VM. Resident use of text messaging for patient care: ease of use or breach of privacy? JMIR Med Inform. 2015;3(4):e37. PubMed
3. Tran K, Morra D, Lo V, Quan SD, Abrams H, Wu RC. Medical students and personal smartphones in the clinical environment: the impact on confidentiality of personal health information and professionalism. J Med Internet Res. 2014;16(5):e132. PubMed
4. Patel N, Siegler JE, Stromberg N, Ravitz N, Hanson CW. Perfect storm of inpatient communication needs and an innovative solution utilizing smartphones and secured messaging. Appl Clin Inform. 2016;7(3):777-789. PubMed
5. Przybylo JA, Wang A, Loftus P, Evans KH, Chu I, Shieh L. Smarter hospital communication: secure smartphone text messaging improves provider satisfaction and perception of efficacy, workflow. J Hosp Med. 2014;9(9):573-578. PubMed
6. O’Leary KJ, Liebovitz DM, Baker DW. How hospitalists spend their time: insights on efficiency and safety. J Hosp Med. 2006;1(2):88-93. PubMed
7. Tipping MD, Forth VE, O’Leary KJ, et al. Where did the day go?—a time-motion study of hospitalists. J Hosp Med. 2010;5(6):323-328. PubMed
8. Real Magnet. http://www.realmagnet.com. Accessed December 20, 2016.
9. Armstrong JS, Overton T. Estimating nonresponse bias in mail surveys. J Mark Res. 1977;14(3):396-402.
10. Carlile N, Rhatigan JJ, Bates DW. Why do we still page each other? Examining the frequency, types and senders of pages in academic medical services. BMJ Qual Saf. 2017;26(1):24-29. PubMed
11. Kummerow Broman K, Kensinger C, Phillips C, et al. Characterizing the clamor: an in-depth analysis of inpatient paging communication. Acad Med. 2016;91(7):1015-1021. PubMed
12. Dalal AK, Schnipper J, Massaro A, et al. A web-based and mobile patient-centered “microblog” messaging platform to improve care team communication in acute care. J Am Med Inform Assoc. 2017;24(e1):e178-e184. PubMed
13. Wu R, Lo V, Morra D, et al. A smartphone-enabled communication system to improve hospital communication: usage and perceptions of medical trainees and nurses on general internal medicine wards. J Hosp Med. 2015;10(2):83-89. PubMed
© 2017 Society of Hospital Medicine
GOC Discussions Among LTC Residents
Hospitalizations of long‐term care (LTC) residents are known to be frequent, costly, often preventable,[1, 2, 3] and potentially associated with negative health outcomes.[4] Often, an advance directive (AD) is made at LTC admission and updated annually when residents are in relatively stable health. An AD is a document that helps to inform a substitute decision maker (SDM) about the consent process for life‐sustaining treatments and is a resource that supports advance care planning (ACP). ACP is a process that allows individuals to consider, express, and plan for future healthcare in the event that they lack capacity to make their own decisions. When an LTC resident's health deteriorates and hospitalization is required, there is an opportunity to update prognosis, discuss risks and benefits of previously held treatment preferences, as well as reassess goals of care (GOC).
Engaging in ACP discussions during relatively stable health can help ensure patient preferences are followed.[5, 6] These discussions, however, are often insufficient, as they involve decision making for hypothetical situations that may not cover all potential scenarios, and may not reflect a patient's reality at the time of health status decline. Discussions held in the moment more authentically reflect the decisions of patients and/or SDM based on the specific needs and clinical realities particular to the patient at that time.[7] GOC discussions, defined in this context as ACP discussions occurring during hospitalization, have the potential to better align patient wishes with care received,[6] improve quality of life and satisfaction,[8, 9, 10] and reduce unwanted extra care.[11, 12] Although in‐the‐moment GOC discussions are recommended for all hospitalized patients who are seriously ill with a high risk of dying,[13] research suggests that this occurs infrequently for elderly patients. A recent multicenter survey of seriously ill hospitalized elderly patients found that only 25% of patients and 32% of family members reported that they had been asked about prior ACP or AD.[14] Another study of hospitalized LTC residents found that resuscitation status and family discussion was documented in only 55% and 42% of admissions, respectively.[15]
Further investigation is required to determine how often LTC patients have GOC discussions, what prompts these discussions, and what are the outcomes. Previous studies have focused on barriers to performing GOC discussions, rather than the factors that are associated with them.[16] By understanding why these discussions currently happen, we can potentially improve how often they occur and the quality of their outcomes.
The objectives of this study were to determine the rate of documented GOC discussions among hospitalized LTC residents, identify factors that were associated with documentation, and examine the association between documentation and outcomes of care.
METHODS
Study Population
We conducted a retrospective chart review of a random convenience sample of hospitalized patients admitted via the emergency department (ED) to the general internal medicine (GIM) service from January 1, 2012 through December 31, 2012, at 2 academic teaching hospitals in Toronto, Canada. Patients were identified through a search of each hospitals' electronic patient record (EPR). Patients were eligible for inclusion if they were (1) a LTC resident and (2) at least 65 years of age. For patients with multiple admissions to the GIM service during the specified 12‐month period, we only included data from the first hospitalization (index hospitalization). The hospital's research ethics board approved this study.
Our primary variable of interest was documentation in the hospital medical record of a discussion between physicians and the patient/family/SDM regarding GOC. A GOC discussion was considered to have taken place if there was documentation of (1) understanding/expectation of treatment options or (2) patient's preferences for life‐sustaining measures. Examples illustrating each criterion are provided in the Supporting Information, Appendix 1, in the online version of this article.
Factors Associated With GOC Documentation
From the EPR, we obtained visit‐level data including age, gender, Canadian Emergency Department Triage and Acuity Scale, vital signs at ED admission including temperature, respiratory rate, oxygen saturation, Glasgow Coma Scale (GCS) and shock index (defined as heart rate divided by systolic blood pressure), admission and discharge dates/times, discharge diagnosis, transfer to intensive care unit (ICU), and hospital use (number of ED visits and hospitalizations to the 2 study hospitals in the 1‐year period prior to index hospitalization).
Trained study personnel (J.W.) used a structured abstraction form to collect data from the hospital medical record that were not available through the EPR, including years living in LTC, contents of LTC AD forms, presence of SDM (identified as immediate family or surrogate with whom the care team communicated), dementia diagnosis (defined as documentation of dementia in the patient's past medical history and/or history of present illness), and measures of functional status. When available, we extracted the AD from LTC; they consisted of 4 levels (level 1: comfort careno transfer to hospital, no cardiopulmonary resuscitation [CPR]; level 2: supportive careadministration of antibiotics and/or other procedures that can be provided within LTC, no transfer to the hospital, no CPR; level 3: transfer to the hospitalno CPR; level 4: aggressive interventiontransfer to hospital for aggressive treatment, CPR).
GOC Documentation in the Discharge Summary
For the subset of patients who survived hospitalization and were discharged back to LTC, we examined whether the ADs ordered during hospitalization were communicated back to LTC via the discharge summary. We additionally assessed if the ADs determined during hospitalization differed from preferences documented prior to hospitalization. Physician orders for ADs were categorized as level 1: comfort measures only, level 3: no CPR, or level 4: full code. LTC level 2 was considered equivalent to physician‐ordered level 3 at admission; a patient with an LTC level 2 with no CPR (level 3) documented during hospitalized would be considered to have no change in the AD. An increase or decrease in the AD was determined by comparing LTC levels 1, 3, and 4 to physician‐ordered level 1, 3, and 4.
Outcomes of GOC Documentation
From the EPR, we obtained visit‐level outcome data including length of stay (LOS), resource intensity weight (RIW) (calculated based on patient case‐mix, severity, age, and procedures performed), visit disposition, number of ED visits and hospitalizations to the 2 study hospitals in the year following index hospitalization, in‐hospital death, and 1‐year mortality. We determined 1‐year mortality by following up with the LTC homes to determine whether the resident had died within the year following index hospitalization; only patients from LTC homes that responded to our request for data were included in 1‐year mortality analyses. We collected physician orders for the AD from chart review.
Statistical Analysis
Patients with and without documented GOC discussions were compared. Descriptive statistics including frequencies and percentages were used to characterize study variables. Differences between the study groups were assessed using Pearson 2/Fisher exact test. Multivariate logistic regression, which included variables that were significant in the bivariate analysis, was used to identify independent predictors of GOC discussion. Adjusted odds ratios (AOR) and 95% confidence intervals (CI) were presented for the logistic model. Patients with missing predictor data were excluded.
We also examined whether there was a correlation between GOC discussion and outcomes of care using Pearson 2/Fisher exact test. Outcomes included orders for the AD, LOS in days (stratified into quartiles), RIW (stratified into quartiles), visit disposition, hospital use in the year following index hospitalization, and 1‐year mortality following discharge back to LTC.
Lastly, to better understand the independent predictors of in‐hospital and 1‐year mortality, we used Pearson 2/Fisher exact test followed by logistic regression that included significant variables from the bivariate analyses.
All analyses were 2‐sided, and a P value of <0.05 was considered statistically significant. We used SPSS version 22.0 (SPSS Inc., Chicago, IL).
RESULTS
We identified a total of 7084 hospitalizations to GIM between January 1, 2012 and December 31, 2012, of which 665 (9.4%) met inclusion criteria of residence in LTC and age 65 years. Of these 665 hospitalizations, 512 were unique patients. We randomly selected a convenience sample of 200 index hospitalizations of the 512 eligible hospitalizations (39%) to perform the chart review.
Predictors of GOC Documentation
Of the 200 randomly sampled charts that were reviewed, 75 (37.5%) had a documented GOC discussion.
Characteristics of the study patients and results of bivariate analysis of the association between patient characteristics and GOC discussion are summarized in Table 1. No significant differences in demographic and baseline characteristics were seen between patients with and without discussion. However, a number of visit characteristics were found to be significantly associated with discussion. Forty percent of patients in the GOC discussion group had GCS scores 11 compared to 15.2% in the no‐discussion group. Higher respiratory rate, lower oxygen saturation, and ICU transfer were also significantly associated with discussions.
| Goals of Care Discussion Documented in Medical Chart | |||||
|---|---|---|---|---|---|
| No, N = 125 | Yes, N = 75 | P Value | |||
| |||||
| Baseline characteristics | |||||
| Gender, n (%) | 0.88 | ||||
| Male | 48 | (38.4) | 30 | (40.0) | |
| Female | 77 | (61.6) | 45 | (60.0) | |
| Age, y, n (%) | 0.85 | ||||
| 6579 | 36 | (28.8) | 19 | (25.3) | |
| 8084 | 30 | (24.0) | 19 | (25.3) | |
| 8589 | 30 | (24.0) | 16 | (21.3) | |
| 90101 | 29 | (23.2) | 21 | (28.0) | |
| Years living in long‐term care, n (%)* | 0.65 | ||||
| [0, 1) | 28 | (22.4) | 12 | (16.0) | |
| [1, 3) | 31 | (24.8) | 22 | (29.3) | |
| [3, 6) | 33 | (26.4) | 22 | (29.3) | |
| [6, 22) | 25 | (20.0) | 13 | (17.3) | |
| Unknown | 8 | (6.4) | 6 | (8.0) | |
| AD from long‐term care, n (%) | 0.14 | ||||
| Comfort measures only | 2 | (1.6) | 1 | (1.3) | |
| Supportive care with no transfer to hospital | 0 | (0.0) | 3 | (4.0) | |
| Supportive care with transfer to hospital | 70 | (56.0) | 44 | (58.7) | |
| Aggressive care | 53 | (42.4) | 27 | (36.0) | |
| Years since most recent AD signed, n (%)* | 0.12 | ||||
| [0, 1) | 79 | (63.2) | 48 | (64.0) | |
| [1, 2) | 21 | (16.8) | 6 | (8.0) | |
| [2, 6) | 9 | (7.2) | 10 | (13.3) | |
| Unknown | 16 | (12.8) | 11 | (14.7) | |
| Substitute decision maker, n (%) | 0.06 | ||||
| Child | 81 | (64.8) | 44 | (58.7) | |
| Spouse | 9 | (7.2) | 15 | (20.0) | |
| Other | 26 | (20.8) | 13 | (17.3) | |
| Public guardian trustee | 6 | (4.8) | 2 | (2.7) | |
| Unknown | 3 | (2.4) | 1 | (1.3) | |
| Dementia, n (%) | 1.00 | ||||
| No | 47 | (37.6) | 28 | (37.3) | |
| Yes | 78 | (62.4) | 47 | (62.7) | |
| Mobility, n (%) | 0.26 | ||||
| Walk without assistance | 5 | (4.0) | 3 | (4.0) | |
| Walker | 16 | (12.8) | 3 | (4.0) | |
| Wheelchair | 43 | (34.4) | 29 | (38.7) | |
| Bedridden | 7 | (5.6) | 4 | (5.3) | |
| Unknown | 54 | (43.2) | 36 | (48.0) | |
| Continence, n (%) | 0.05 | ||||
| Mostly continent | 16 | (12.8) | 3 | (4.0) | |
| Incontinent | 49 | (39.2) | 34 | (45.3) | |
| Catheter/stoma | 7 | (5.6) | 1 | (1.3) | |
| Unknown | 53 | (42.4) | 37 | (49.3) | |
| Feeding, n (%) | 0.17 | ||||
| Mostly feeds self | 38 | (30.4) | 13 | (17.3) | |
| Needs to be fed | 17 | (13.6) | 14 | (18.7) | |
| Gastrostomy tube | 8 | (6.4) | 5 | (6.7) | |
| Unknown | 62 | (49.6) | 43 | (57.3) | |
| Diet, n (%) | 0.68 | ||||
| Normal | 43 | (34.4) | 16 | (21.3) | |
| Dysphagic | 32 | (25.6) | 15 | (20.0) | |
| Gastrostomy tube | 8 | (6.4) | 5 | (6.7) | |
| Unknown | 42 | (33.6) | 39 | (52.0) | |
| Previous ED visits in last year, n (%) | 0.43 | ||||
| 0 | 70 | (56.0) | 41 | (54.7) | |
| 1 | 35 | (28.0) | 17 | (22.7) | |
| 2+ | 20 | (16.0) | 17 | (22.7) | |
| Previous hospitalizations in last year, n (%) | 0.19 | ||||
| 0 | 98 | (78.4) | 54 | (72.0) | |
| 1 | 23 | (18.4) | 14 | (18.7) | |
| 2+ | 4 | (3.2) | 7 | (9.3) | |
| Visit characteristics | |||||
| Glasgow Coma Scale, n (%) | <0.001 | ||||
| <7 | 4 | (3.2) | 4 | (5.3) | |
| 711 | 15 | (12.0) | 26 | (34.7) | |
| 1213 | 7 | (5.6) | 8 | (10.7) | |
| 1415 | 85 | (68.0) | 32 | (42.7) | |
| Unknown | 14 | (11.2) | 5 | (6.7) | |
| Shock index, n (%) | 0.13 | ||||
| 1 | 105 | (84.0) | 54 | (72.0) | |
| >1 | 19 | (15.2) | 18 | (24.0) | |
| Unknown | 1 | (0.8) | 3 | (4.0) | |
| Respiratory rate, n (%) | 0.02 | ||||
| <20 | 59 | (47.2) | 21 | (28.0) | |
| 20 | 66 | (52.8) | 52 | (69.3) | |
| Unknown | 0 | (0.0) | 2 | (2.7) | |
| Oxygen saturation, n (%) | 0.03 | ||||
| <88 | 2 | (1.6) | 6 | (8.0) | |
| 88 | 122 | (97.6) | 65 | (86.7) | |
| Unknown | 1 | (0.8) | 4 | (5.3) | |
| Temperature, n (%) | 0.09 | ||||
| <38.0 | 100 | (80.0) | 51 | (68.0) | |
| 38.0 | 25 | (20.0) | 23 | (30.7) | |
| Unknown | 0 | (0.0) | 1 | (1.3) | |
| Canadian Triage and Acuity Scale, n (%) | 0.13 | ||||
| Resuscitation | 1 | (0.8) | 3 | (4.0) | |
| Emergent | 70 | (56.0) | 49 | (65.3) | |
| Urgent | 52 | (41.6) | 22 | (29.3) | |
| Less urgent and nonurgent | 2 | (1.6) | 1 | (1.3) | |
| Discharge diagnosis, n (%) | 0.29 | ||||
| Aspiration pneumonia | 12 | (9.6) | 12 | (16.0) | |
| Chronic obstructive pulmonary disease | 15 | (12.0) | 3 | (4.0) | |
| Dehydration/disorders fluid/electrolytes | 9 | (7.2) | 5 | (6.7) | |
| Gastrointestinal hemorrhage | 4 | (3.2) | 3 | (4.0) | |
| Heart failure | 11 | (8.8) | 2 | (2.7) | |
| Infection (other or not identified) | 9 | (7.2) | 9 | (12.0) | |
| Influenza/pneumonia | 14 | (11.2) | 11 | (14.7) | |
| Lower urinary tract infection | 11 | (8.8) | 6 | (8.0) | |
| Other | 40 | (32.0) | 24 | (32.0) | |
| Hospitalization included ICU stay, n (%) | 0.01 | ||||
| No | 124 | (99.2) | 69 | (92.0) | |
| Yes | 1 | (0.8) | 6 | (8.0) | |
When these 4 significant clinical and visit characteristics were tested together in a logistic regression analysis, 2 remained statistically significant (Table 2). Patients with lower GCS scores (GCS 1213 and 711) were more likely to have discussions (AOR: 4.4 [95% CI: 1.4‐13.9] and AOR: 5.9 [95% CI: 2.6‐13.2], respectively) and patients with higher respiratory rates were also more likely to have discussions (AOR: 2.3 [95% CI: 1.1‐4.8]).
| Characteristic | Adjusted Odds Ratio | 95% Confidence Interval | P Value |
|---|---|---|---|
| |||
| Glasgow Coma Scale | <0.001 | ||
| <7 | 1.77 | 0.33‐9.58 | 0.51 |
| 711 | 5.90 | 2.64‐13.22 | <0.001 |
| 1213 | 4.43 | 1.41‐13.91 | 0.01 |
| 1415 | Reference | ||
| Respiration | |||
| <20 | Reference | ||
| 20 | 2.32 | 1.12‐4.78 | 0.02 |
| Oxygen saturation | |||
| <88 | 3.35 | 0.55‐20.56 | 0.19 |
| 88 | Reference | 0.05‐1.83 | |
| Hospitalization included ICU stay | |||
| No | Reference | ||
| Yes | 7.87 | 0.83‐74.73 | 0.07 |
GOC Documentation in the Discharge Summary
For the subset of patients who survived index hospitalization and were discharged back to LTC (176 patients or 88%), we also investigated whether the ADs were documented in the discharge summary back to LTC (data not shown). Of the 42 patients (23.9%) who had a change in the AD (18 patients had an AD increase in care intensity due to hospitalization; 24 had a decrease), only 11 (26%) had this AD change documented in the discharge summary.
Outcomes of GOC Documentation
A number of outcomes differed significantly between patients with and without GOC discussions in unadjusted comparisons (Table 3). Patients with discussions had higher rates of orders for no CPR (80% vs 55%) and orders for comfort measures only (7% vs 0%). They also had higher rates of in‐hospital death (29% vs 1%), 1‐year mortality (63% vs 28%), and longer LOS. However, RIW and subsequent hospital use were not found to be significant.
| Variable | Goals of Care Discussion Documented in Medical Chart | ||||
|---|---|---|---|---|---|
| No, N = 125 | Yes, N = 75 | P Value | |||
| |||||
| Physician orders, n (%) | <0.001 | ||||
| Comfort measures only | 0 | (0.0) | 5 | (6.7) | |
| No cardiopulmonary resuscitation | 69 | (55.2) | 60 | (80.0) | |
| Full code | 56 | (44.8) | 10 | (13.3) | |
| Visit disposition, n (%) | <0.001 | ||||
| Long‐term care home | 124 | (99.2) | 52 | (69.3) | |
| Died | 1 | (0.8) | 22 | (29.3) | |
| Transfer to palliative care facility | 0 | (0.0) | 1 | (1.3) | |
| Resource intensity weight, n (%) | 0.43 | ||||
| 0.250.75 | 35 | (28.0) | 19 | (25.3) | |
| 0.761.14 | 29 | (23.2) | 16 | (21.3) | |
| 1.151.60 | 34 | (27.2) | 16 | (21.3) | |
| 1.6125.5 | 27 | (21.6) | 24 | (32.0) | |
| Length of stay, d, n (%) | 0.01 | ||||
| 0.672.97 | 30 | (24.0) | 20 | (26.7) | |
| 2.984.60 | 40 | (32.0) | 10 | (13.3) | |
| 4.618.65 | 30 | (24.0) | 20 | (26.7) | |
| 8.66+ | 25 | (20.0) | 25 | (33.3) | |
| Subsequent emergency department visits in next year, n (% of applicable) | 0.38 | ||||
| 0 | 66 | (53.2) | 32 | (61.5) | |
| 1 | 30 | (24.2) | 13 | (25.0) | |
| 2+ | 28 | (22.6) | 7 | (13.5) | |
| Not applicable (died during index hospitalization or transfer to palliative care) | 1 | 23 | |||
| Subsequent hospitalizations in next year, n (% of applicable) | 0.87 | ||||
| 0 | 87 | (70.2) | 38 | (73.1) | |
| 1 | 24 | (19.4) | 10 | (19.2) | |
| 2+ | 13 | (10.5) | 4 | (7.7) | |
| Not applicable (died during index hospitalization or transfer to palliative care) | 1 | 23 | |||
| 1‐year mortality, n (% of applicable) | <0.001 | ||||
| Alive | 82 | (71.9) | 15 | (37.5) | |
| Dead | 32 | (28.1) | 25 | (62.5) | |
| Not applicable (died during index hospitalization or transfer to palliative care) | 1 | 23 | |||
| Not applicable (unsuccessful follow‐up with long‐term care home) | 10 | 12 | |||
Predictors of In‐hospital Death and 1‐Year Mortality
Given the significant positive associations between discussions and in‐hospital death and 1‐year mortality, we performed separate logistic regression analyses to test whether discussions independently predicted in‐hospital death and 1‐year mortality (Table 4). After adjusting for variables significant in their respective bivariate analyses, patients with discussions continued to have higher odds of in‐hospital death (AOR: 52.0 [95% CI: 6.2‐440.4]) and 1‐year mortality (AOR: 4.1 [95% CI: 1.7‐9.6]). Of note, the presence of dementia had significantly lower adjusted odds of in‐hospital death compared to the reference group of no dementia (AOR: 0.3 [95% CI: 0.1‐0.8]).
| Characteristic | Adjusted Odds Ratio | 95% Confidence Interval | P Value |
|---|---|---|---|
| |||
| In‐hospital death odds ratios | |||
| Advance directives from long‐term care | 0.91 | ||
| Comfort measures only | Reference | ||
| Supportive care no transfer | 3.43E +18 | 0‐. | 1.00 |
| Transfer to hospital | 3.10E +8 | 0‐. | 1.00 |
| Aggressive care | 4.85E +8 | 0‐. | 1.00 |
| Dementia | |||
| No | Reference | ||
| Yes | .25 | 0.08‐0.79 | 0.02 |
| Previous hospitalizations in last year | 0.05 | ||
| 0 | Reference | ||
| 1 | 0.43 | 0.08‐2.38 | 0.34 |
| 2+ | 6.30 | 1.10‐36.06 | 0.04 |
| Respiration | |||
| <20 | Reference | ||
| 20 | 3.64 | 0.82‐16.24 | 0.09 |
| Documented goals of care discussion | |||
| No | Reference | ||
| Yes | 52.04 | 6.15‐440.40 | <0.001 |
| 1‐year mortality odds ratios | |||
| Oxygen saturation, n (%) | |||
| <88 | 12.15 | 1.18‐124.97 | 0.04 |
| 88 | Reference | ||
| Previous ED visits in last year | 0.06 | ||
| 0 | Reference | ||
| 1 | 3.07 | 1.15‐8.17 | 0.03 |
| 2+ | 3.21 | 0.87‐11.81 | 0.08 |
| Previous hospitalizations in last year | 0.55 | ||
| 0 | Reference | ||
| 1 | 1.66 | 0.57‐4.86 | 0.36 |
| 2+ | 2.52 | 0.30‐20.89 | 0.39 |
| Documented goals of care discussion | |||
| No | Reference | ||
| Yes | 4.07 | 1.73‐9.56 | 0.001 |
DISCUSSION
Our retrospective study of LTC residents admitted to the GIM service showed that these admissions comprised 9.4% of all admissions and that GOC discussions occurred infrequently (37.5%). Our study revealed no differences in baseline patient characteristics associated with discussions, whereas patient acuity at hospital presentation independently contributed to the likelihood of discussions. We found strong associations between documentation and certain outcomes of care, including orders for AD, LOS, in‐hospital death, and 1‐year mortality. No significant associations were found between documentation and subsequent hospital use. Lastly, we found that consistent communication back to the LTC home when there was a change in AD was very poor; only 26% of discharge summaries included this documentation.
Our finding of infrequent GOC discussions during hospitalization aligns with prior studies. A study that identified code status discussions in transcripts of audio‐recorded admission encounters found that code status was discussed in only 24% of seriously ill patient admissions.[17] Furthermore, in a study specific to LTC residents, only 42% of admissions longer than 48 hours had a documented GOC discussion.[15]
We found visit‐level, but not baseline, characteristics were associated with discussions. These findings are supported by a recent study that found that whether GOC discussions took place largely depended on the acute condition presented on admission.[15] Although these results suggest that clinicians are appropriately prioritizing sicker patients who might have the most pressing need for GOC discussions, they also highlight the gap in care for less‐sick patients and the need to broaden clinical practice and consider underlying conditions and functional status. Of note, although the GCS score was found to be significantly associated with discussions, patients in the lowest GCS range did not have significantly different odds of discussions compared to the reference level (highest GCS range). A recent study by You et al. may offer some insight into this finding. They found that patients lacking capacity to make GOC decisions was ranked fifth, whereas lack of SDM availability was eighth among 21 barriers to GOC discussions, as perceived by hospital‐based clinicians.[16]
A major finding of this study was that both in‐hospital and 1‐year mortality were strongly associated with having a GOC discussion, suggesting that patients at higher risk of dying are more likely to have discussions. This is reflected by illness severity measured at initial assessment and by persistence of the association between discussions and mortality after discharge back to LTC. To the best of our knowledge, no previous studies have reported these findings. There are likely some unmeasured clinical factors such as clinical deterioration during hospitalization that contributed to this strong association. Interestingly, in our logistic regression analysis for independent predictors of in‐hospital death, we found that having dementia was associated with lower odds of in‐hospital death. One interpretation of this finding is that perhaps only patients with mild dementia were hospitalized, and those with more advanced dementia had an AD established in LTC that allowed them to remain in their LTC home. This possibility is supported by a systematic review of factors associated with LTC home hospitalization, which found that dementia was shown to be associated with less hospitalization.[18]
For patients who survived hospitalization, we did not find an association between GOC discussions and hospital use in the year following index hospitalization. In both groups, nearly 30% of patients had 1 or more subsequent hospitalizations. This is relevant especially in light of the finding that among patients where GOC discussions resulted in an AD change, only 26% of discharge summaries back to LTC included this documentation. We can only speculate that had these discussions been properly documented, subsequent hospitalizations would have decreased in the GOC group. Previous research has found that omissions of critical information in discharge summaries were common. In a study of hip fracture and stroke patients discharged from a large Midwestern academic medical center in the United States, code status was included in the discharge summary only 7% of the time.[19] The discharge summary is the primary means of sharing patient information between the hospital and LTC home. If GOC discussions are not included in the discharge summary, it is very unlikely that this information will be subsequently updated in the LTC medical record and impact the care the patient receives. A key recommendation for hospital‐based providers is ensuring that GOC discussions are clearly, consistently, and completely documented in the discharge summary so that the care provided is based on the patients' wishes.
Our study has several limitations. Our analysis was based on chart review, and although our analyses take into account a number of patient characteristics, we did not capture other characteristics that might influence GOC discussions such as culture/religion, language barriers, SDM availability, or whether patients clinically deteriorated during the index admission. Additionally, provider‐level predictors, including seniority, previous GOC training, and time available to conduct these discussions, were not captured. We also did not capture the timing or number of occasions that GOC discussions took place during hospitalization. Due to the retrospective nature of our study, we were able to only look at documented GOC discussions. GOC discussions may have happened but were never documented. However, the standard of care is to document these discussions as part of the medical record, and if they are not documented, it can be considered not to have happened and indicates a lower quality of practice. A recent survey of Canadian hospital‐based healthcare providers identified standardized GOC documentation as an effective practice to improve GOC communication.[20] Finally, because our study was conducted in 2 academic hospitals, our results may be less generalizable to other community hospitals. However, our hospitals' catchment areas capture a diverse population, both culturally and in terms of their socioeconomic status.
CONCLUSION
GOC discussions occurred infrequently, appeared to be triggered by illness severity, and were poorly communicated back to LTC. Important outcomes of care, including in‐hospital death and 1‐year mortality, were associated with discussions. This study serves to identify gaps in who might benefit from GOC discussions and illustrates opportunities for improvement including implementing standardized documentation practices.
Disclosures
Hannah J. Wong, PhD, and Robert C. Wu, MD, had full access to all of the data in the study and take responsibility for the integrity of the data and the accuracy of the data analysis. Robert C. Wu, MD, Hannah J. Wong, PhD, and Michelle Grinman, MD, were responsible for the conception and design of the study. Robert C. Wu, MD, Hannah J. Wong, PhD, and Jamie Wang were responsible for the acquisition of the data. All of the authors were responsible for the analysis and interpretation of the data, drafting of the manuscript, critical revision of the manuscript for important intellectual content, and final approval of the manuscript. Hannah J. Wong, PhD obtained the funding. Hannah J. Wong, PhD, and Robert C. Wu, MD, supervised the study. The authors report no conflicts of interest.
- , , , , . Trends in emergency department visits for ambulatory care sensitive conditions by elderly nursing home residents, 2001 to 2010. JAMA Intern Med. 2014;174(1):156–158.
- , , , . Hospital transfers of nursing home residents with advanced dementia. J Am Geriatr Soc. 2012;60(5):905–909.
- , , , , . Potentially avoidable hospitalizations for elderly long‐stay residents in nursing homes. Med Care. 2013;51(8):673–681.
- , . Reducing unnecessary hospitalizations of nursing home residents. N Engl J Med. 2011;365(13):1165–1167.
- , , . Advance directives and outcomes of surrogate decision making before death. N Engl J Med. 2010;362(13):1211–1218.
- , , , , , . The consistency between treatments provided to nursing facility residents and orders on the physician orders for life‐sustaining treatment form. J Am Geriatr Soc. 2011;59(11):2091–2099.
- , , . What should be the goal of advance care planning? JAMA Intern Med. 2014;174(7):1093–1094.
- , , , et al. Associations between end‐of‐life discussions, patient mental health, medical care near death, and caregiver bereavement adjustment. JAMA. 2008;300(14):1665–1673.
- , , , et al. Systematic implementation of an advance directive program in nursing homes: a randomized controlled trial. JAMA. 2000;283(11):1437–1444.
- , . Communication about serious illness care goals: a review and synthesis of best practices. JAMA Intern Med. 2014;174(12):1994–2003.
- , , . Predictors of nursing home residents' time to hospitalization. Health Serv Res. 2011;46(1 pt 1):82–104.
- , , , . Regional variation in the association between advance directives and end‐of‐life Medicare expenditures. JAMA. 2011;306(13):1447–1453.
- , , . Just ask: discussing goals of care with patients in hospital with serious illness. CMAJ. 2014;186(6):425–432.
- , , , et al. Failure to engage hospitalized elderly patients and their families in advance care planning. JAMA Intern Med. 2013;173(9):778–787.
- , , , . Hospitalisation of high‐care residents of aged care facilities: are goals of care discussed? Intern Med J. 2013;43(2):144–149.
- , , , et al. Barriers to goals of care discussions with seriously ill hospitalized patients and their families: a multicenter survey of clinicians. JAMA Intern Med. 2015;175(4):549–556.
- , , , , . Code status discussions between attending hospitalist physicians and medical patients at hospital admission. J Gen Intern Med. 2011;26(4):359–366.
- , , , . Predictors of nursing home hospitalization: a review of the literature. Med Care Res Rev. 2008;65(1):3–39.
- , , , , . Provider characteristics, clinical‐work processes and their relationship to discharge summary quality for sub‐acute care patients. J Gen Intern Med. 2012;27(1):78–84.
- , , , . Strategies for effective goals of care discussions and decision‐making: perspectives from a multi‐centre survey of Canadian hospital‐based healthcare providers. BMC Palliat Care. 2015;14:38.
Hospitalizations of long‐term care (LTC) residents are known to be frequent, costly, often preventable,[1, 2, 3] and potentially associated with negative health outcomes.[4] Often, an advance directive (AD) is made at LTC admission and updated annually when residents are in relatively stable health. An AD is a document that helps to inform a substitute decision maker (SDM) about the consent process for life‐sustaining treatments and is a resource that supports advance care planning (ACP). ACP is a process that allows individuals to consider, express, and plan for future healthcare in the event that they lack capacity to make their own decisions. When an LTC resident's health deteriorates and hospitalization is required, there is an opportunity to update prognosis, discuss risks and benefits of previously held treatment preferences, as well as reassess goals of care (GOC).
Engaging in ACP discussions during relatively stable health can help ensure patient preferences are followed.[5, 6] These discussions, however, are often insufficient, as they involve decision making for hypothetical situations that may not cover all potential scenarios, and may not reflect a patient's reality at the time of health status decline. Discussions held in the moment more authentically reflect the decisions of patients and/or SDM based on the specific needs and clinical realities particular to the patient at that time.[7] GOC discussions, defined in this context as ACP discussions occurring during hospitalization, have the potential to better align patient wishes with care received,[6] improve quality of life and satisfaction,[8, 9, 10] and reduce unwanted extra care.[11, 12] Although in‐the‐moment GOC discussions are recommended for all hospitalized patients who are seriously ill with a high risk of dying,[13] research suggests that this occurs infrequently for elderly patients. A recent multicenter survey of seriously ill hospitalized elderly patients found that only 25% of patients and 32% of family members reported that they had been asked about prior ACP or AD.[14] Another study of hospitalized LTC residents found that resuscitation status and family discussion was documented in only 55% and 42% of admissions, respectively.[15]
Further investigation is required to determine how often LTC patients have GOC discussions, what prompts these discussions, and what are the outcomes. Previous studies have focused on barriers to performing GOC discussions, rather than the factors that are associated with them.[16] By understanding why these discussions currently happen, we can potentially improve how often they occur and the quality of their outcomes.
The objectives of this study were to determine the rate of documented GOC discussions among hospitalized LTC residents, identify factors that were associated with documentation, and examine the association between documentation and outcomes of care.
METHODS
Study Population
We conducted a retrospective chart review of a random convenience sample of hospitalized patients admitted via the emergency department (ED) to the general internal medicine (GIM) service from January 1, 2012 through December 31, 2012, at 2 academic teaching hospitals in Toronto, Canada. Patients were identified through a search of each hospitals' electronic patient record (EPR). Patients were eligible for inclusion if they were (1) a LTC resident and (2) at least 65 years of age. For patients with multiple admissions to the GIM service during the specified 12‐month period, we only included data from the first hospitalization (index hospitalization). The hospital's research ethics board approved this study.
Our primary variable of interest was documentation in the hospital medical record of a discussion between physicians and the patient/family/SDM regarding GOC. A GOC discussion was considered to have taken place if there was documentation of (1) understanding/expectation of treatment options or (2) patient's preferences for life‐sustaining measures. Examples illustrating each criterion are provided in the Supporting Information, Appendix 1, in the online version of this article.
Factors Associated With GOC Documentation
From the EPR, we obtained visit‐level data including age, gender, Canadian Emergency Department Triage and Acuity Scale, vital signs at ED admission including temperature, respiratory rate, oxygen saturation, Glasgow Coma Scale (GCS) and shock index (defined as heart rate divided by systolic blood pressure), admission and discharge dates/times, discharge diagnosis, transfer to intensive care unit (ICU), and hospital use (number of ED visits and hospitalizations to the 2 study hospitals in the 1‐year period prior to index hospitalization).
Trained study personnel (J.W.) used a structured abstraction form to collect data from the hospital medical record that were not available through the EPR, including years living in LTC, contents of LTC AD forms, presence of SDM (identified as immediate family or surrogate with whom the care team communicated), dementia diagnosis (defined as documentation of dementia in the patient's past medical history and/or history of present illness), and measures of functional status. When available, we extracted the AD from LTC; they consisted of 4 levels (level 1: comfort careno transfer to hospital, no cardiopulmonary resuscitation [CPR]; level 2: supportive careadministration of antibiotics and/or other procedures that can be provided within LTC, no transfer to the hospital, no CPR; level 3: transfer to the hospitalno CPR; level 4: aggressive interventiontransfer to hospital for aggressive treatment, CPR).
GOC Documentation in the Discharge Summary
For the subset of patients who survived hospitalization and were discharged back to LTC, we examined whether the ADs ordered during hospitalization were communicated back to LTC via the discharge summary. We additionally assessed if the ADs determined during hospitalization differed from preferences documented prior to hospitalization. Physician orders for ADs were categorized as level 1: comfort measures only, level 3: no CPR, or level 4: full code. LTC level 2 was considered equivalent to physician‐ordered level 3 at admission; a patient with an LTC level 2 with no CPR (level 3) documented during hospitalized would be considered to have no change in the AD. An increase or decrease in the AD was determined by comparing LTC levels 1, 3, and 4 to physician‐ordered level 1, 3, and 4.
Outcomes of GOC Documentation
From the EPR, we obtained visit‐level outcome data including length of stay (LOS), resource intensity weight (RIW) (calculated based on patient case‐mix, severity, age, and procedures performed), visit disposition, number of ED visits and hospitalizations to the 2 study hospitals in the year following index hospitalization, in‐hospital death, and 1‐year mortality. We determined 1‐year mortality by following up with the LTC homes to determine whether the resident had died within the year following index hospitalization; only patients from LTC homes that responded to our request for data were included in 1‐year mortality analyses. We collected physician orders for the AD from chart review.
Statistical Analysis
Patients with and without documented GOC discussions were compared. Descriptive statistics including frequencies and percentages were used to characterize study variables. Differences between the study groups were assessed using Pearson 2/Fisher exact test. Multivariate logistic regression, which included variables that were significant in the bivariate analysis, was used to identify independent predictors of GOC discussion. Adjusted odds ratios (AOR) and 95% confidence intervals (CI) were presented for the logistic model. Patients with missing predictor data were excluded.
We also examined whether there was a correlation between GOC discussion and outcomes of care using Pearson 2/Fisher exact test. Outcomes included orders for the AD, LOS in days (stratified into quartiles), RIW (stratified into quartiles), visit disposition, hospital use in the year following index hospitalization, and 1‐year mortality following discharge back to LTC.
Lastly, to better understand the independent predictors of in‐hospital and 1‐year mortality, we used Pearson 2/Fisher exact test followed by logistic regression that included significant variables from the bivariate analyses.
All analyses were 2‐sided, and a P value of <0.05 was considered statistically significant. We used SPSS version 22.0 (SPSS Inc., Chicago, IL).
RESULTS
We identified a total of 7084 hospitalizations to GIM between January 1, 2012 and December 31, 2012, of which 665 (9.4%) met inclusion criteria of residence in LTC and age 65 years. Of these 665 hospitalizations, 512 were unique patients. We randomly selected a convenience sample of 200 index hospitalizations of the 512 eligible hospitalizations (39%) to perform the chart review.
Predictors of GOC Documentation
Of the 200 randomly sampled charts that were reviewed, 75 (37.5%) had a documented GOC discussion.
Characteristics of the study patients and results of bivariate analysis of the association between patient characteristics and GOC discussion are summarized in Table 1. No significant differences in demographic and baseline characteristics were seen between patients with and without discussion. However, a number of visit characteristics were found to be significantly associated with discussion. Forty percent of patients in the GOC discussion group had GCS scores 11 compared to 15.2% in the no‐discussion group. Higher respiratory rate, lower oxygen saturation, and ICU transfer were also significantly associated with discussions.
| Goals of Care Discussion Documented in Medical Chart | |||||
|---|---|---|---|---|---|
| No, N = 125 | Yes, N = 75 | P Value | |||
| |||||
| Baseline characteristics | |||||
| Gender, n (%) | 0.88 | ||||
| Male | 48 | (38.4) | 30 | (40.0) | |
| Female | 77 | (61.6) | 45 | (60.0) | |
| Age, y, n (%) | 0.85 | ||||
| 6579 | 36 | (28.8) | 19 | (25.3) | |
| 8084 | 30 | (24.0) | 19 | (25.3) | |
| 8589 | 30 | (24.0) | 16 | (21.3) | |
| 90101 | 29 | (23.2) | 21 | (28.0) | |
| Years living in long‐term care, n (%)* | 0.65 | ||||
| [0, 1) | 28 | (22.4) | 12 | (16.0) | |
| [1, 3) | 31 | (24.8) | 22 | (29.3) | |
| [3, 6) | 33 | (26.4) | 22 | (29.3) | |
| [6, 22) | 25 | (20.0) | 13 | (17.3) | |
| Unknown | 8 | (6.4) | 6 | (8.0) | |
| AD from long‐term care, n (%) | 0.14 | ||||
| Comfort measures only | 2 | (1.6) | 1 | (1.3) | |
| Supportive care with no transfer to hospital | 0 | (0.0) | 3 | (4.0) | |
| Supportive care with transfer to hospital | 70 | (56.0) | 44 | (58.7) | |
| Aggressive care | 53 | (42.4) | 27 | (36.0) | |
| Years since most recent AD signed, n (%)* | 0.12 | ||||
| [0, 1) | 79 | (63.2) | 48 | (64.0) | |
| [1, 2) | 21 | (16.8) | 6 | (8.0) | |
| [2, 6) | 9 | (7.2) | 10 | (13.3) | |
| Unknown | 16 | (12.8) | 11 | (14.7) | |
| Substitute decision maker, n (%) | 0.06 | ||||
| Child | 81 | (64.8) | 44 | (58.7) | |
| Spouse | 9 | (7.2) | 15 | (20.0) | |
| Other | 26 | (20.8) | 13 | (17.3) | |
| Public guardian trustee | 6 | (4.8) | 2 | (2.7) | |
| Unknown | 3 | (2.4) | 1 | (1.3) | |
| Dementia, n (%) | 1.00 | ||||
| No | 47 | (37.6) | 28 | (37.3) | |
| Yes | 78 | (62.4) | 47 | (62.7) | |
| Mobility, n (%) | 0.26 | ||||
| Walk without assistance | 5 | (4.0) | 3 | (4.0) | |
| Walker | 16 | (12.8) | 3 | (4.0) | |
| Wheelchair | 43 | (34.4) | 29 | (38.7) | |
| Bedridden | 7 | (5.6) | 4 | (5.3) | |
| Unknown | 54 | (43.2) | 36 | (48.0) | |
| Continence, n (%) | 0.05 | ||||
| Mostly continent | 16 | (12.8) | 3 | (4.0) | |
| Incontinent | 49 | (39.2) | 34 | (45.3) | |
| Catheter/stoma | 7 | (5.6) | 1 | (1.3) | |
| Unknown | 53 | (42.4) | 37 | (49.3) | |
| Feeding, n (%) | 0.17 | ||||
| Mostly feeds self | 38 | (30.4) | 13 | (17.3) | |
| Needs to be fed | 17 | (13.6) | 14 | (18.7) | |
| Gastrostomy tube | 8 | (6.4) | 5 | (6.7) | |
| Unknown | 62 | (49.6) | 43 | (57.3) | |
| Diet, n (%) | 0.68 | ||||
| Normal | 43 | (34.4) | 16 | (21.3) | |
| Dysphagic | 32 | (25.6) | 15 | (20.0) | |
| Gastrostomy tube | 8 | (6.4) | 5 | (6.7) | |
| Unknown | 42 | (33.6) | 39 | (52.0) | |
| Previous ED visits in last year, n (%) | 0.43 | ||||
| 0 | 70 | (56.0) | 41 | (54.7) | |
| 1 | 35 | (28.0) | 17 | (22.7) | |
| 2+ | 20 | (16.0) | 17 | (22.7) | |
| Previous hospitalizations in last year, n (%) | 0.19 | ||||
| 0 | 98 | (78.4) | 54 | (72.0) | |
| 1 | 23 | (18.4) | 14 | (18.7) | |
| 2+ | 4 | (3.2) | 7 | (9.3) | |
| Visit characteristics | |||||
| Glasgow Coma Scale, n (%) | <0.001 | ||||
| <7 | 4 | (3.2) | 4 | (5.3) | |
| 711 | 15 | (12.0) | 26 | (34.7) | |
| 1213 | 7 | (5.6) | 8 | (10.7) | |
| 1415 | 85 | (68.0) | 32 | (42.7) | |
| Unknown | 14 | (11.2) | 5 | (6.7) | |
| Shock index, n (%) | 0.13 | ||||
| 1 | 105 | (84.0) | 54 | (72.0) | |
| >1 | 19 | (15.2) | 18 | (24.0) | |
| Unknown | 1 | (0.8) | 3 | (4.0) | |
| Respiratory rate, n (%) | 0.02 | ||||
| <20 | 59 | (47.2) | 21 | (28.0) | |
| 20 | 66 | (52.8) | 52 | (69.3) | |
| Unknown | 0 | (0.0) | 2 | (2.7) | |
| Oxygen saturation, n (%) | 0.03 | ||||
| <88 | 2 | (1.6) | 6 | (8.0) | |
| 88 | 122 | (97.6) | 65 | (86.7) | |
| Unknown | 1 | (0.8) | 4 | (5.3) | |
| Temperature, n (%) | 0.09 | ||||
| <38.0 | 100 | (80.0) | 51 | (68.0) | |
| 38.0 | 25 | (20.0) | 23 | (30.7) | |
| Unknown | 0 | (0.0) | 1 | (1.3) | |
| Canadian Triage and Acuity Scale, n (%) | 0.13 | ||||
| Resuscitation | 1 | (0.8) | 3 | (4.0) | |
| Emergent | 70 | (56.0) | 49 | (65.3) | |
| Urgent | 52 | (41.6) | 22 | (29.3) | |
| Less urgent and nonurgent | 2 | (1.6) | 1 | (1.3) | |
| Discharge diagnosis, n (%) | 0.29 | ||||
| Aspiration pneumonia | 12 | (9.6) | 12 | (16.0) | |
| Chronic obstructive pulmonary disease | 15 | (12.0) | 3 | (4.0) | |
| Dehydration/disorders fluid/electrolytes | 9 | (7.2) | 5 | (6.7) | |
| Gastrointestinal hemorrhage | 4 | (3.2) | 3 | (4.0) | |
| Heart failure | 11 | (8.8) | 2 | (2.7) | |
| Infection (other or not identified) | 9 | (7.2) | 9 | (12.0) | |
| Influenza/pneumonia | 14 | (11.2) | 11 | (14.7) | |
| Lower urinary tract infection | 11 | (8.8) | 6 | (8.0) | |
| Other | 40 | (32.0) | 24 | (32.0) | |
| Hospitalization included ICU stay, n (%) | 0.01 | ||||
| No | 124 | (99.2) | 69 | (92.0) | |
| Yes | 1 | (0.8) | 6 | (8.0) | |
When these 4 significant clinical and visit characteristics were tested together in a logistic regression analysis, 2 remained statistically significant (Table 2). Patients with lower GCS scores (GCS 1213 and 711) were more likely to have discussions (AOR: 4.4 [95% CI: 1.4‐13.9] and AOR: 5.9 [95% CI: 2.6‐13.2], respectively) and patients with higher respiratory rates were also more likely to have discussions (AOR: 2.3 [95% CI: 1.1‐4.8]).
| Characteristic | Adjusted Odds Ratio | 95% Confidence Interval | P Value |
|---|---|---|---|
| |||
| Glasgow Coma Scale | <0.001 | ||
| <7 | 1.77 | 0.33‐9.58 | 0.51 |
| 711 | 5.90 | 2.64‐13.22 | <0.001 |
| 1213 | 4.43 | 1.41‐13.91 | 0.01 |
| 1415 | Reference | ||
| Respiration | |||
| <20 | Reference | ||
| 20 | 2.32 | 1.12‐4.78 | 0.02 |
| Oxygen saturation | |||
| <88 | 3.35 | 0.55‐20.56 | 0.19 |
| 88 | Reference | 0.05‐1.83 | |
| Hospitalization included ICU stay | |||
| No | Reference | ||
| Yes | 7.87 | 0.83‐74.73 | 0.07 |
GOC Documentation in the Discharge Summary
For the subset of patients who survived index hospitalization and were discharged back to LTC (176 patients or 88%), we also investigated whether the ADs were documented in the discharge summary back to LTC (data not shown). Of the 42 patients (23.9%) who had a change in the AD (18 patients had an AD increase in care intensity due to hospitalization; 24 had a decrease), only 11 (26%) had this AD change documented in the discharge summary.
Outcomes of GOC Documentation
A number of outcomes differed significantly between patients with and without GOC discussions in unadjusted comparisons (Table 3). Patients with discussions had higher rates of orders for no CPR (80% vs 55%) and orders for comfort measures only (7% vs 0%). They also had higher rates of in‐hospital death (29% vs 1%), 1‐year mortality (63% vs 28%), and longer LOS. However, RIW and subsequent hospital use were not found to be significant.
| Variable | Goals of Care Discussion Documented in Medical Chart | ||||
|---|---|---|---|---|---|
| No, N = 125 | Yes, N = 75 | P Value | |||
| |||||
| Physician orders, n (%) | <0.001 | ||||
| Comfort measures only | 0 | (0.0) | 5 | (6.7) | |
| No cardiopulmonary resuscitation | 69 | (55.2) | 60 | (80.0) | |
| Full code | 56 | (44.8) | 10 | (13.3) | |
| Visit disposition, n (%) | <0.001 | ||||
| Long‐term care home | 124 | (99.2) | 52 | (69.3) | |
| Died | 1 | (0.8) | 22 | (29.3) | |
| Transfer to palliative care facility | 0 | (0.0) | 1 | (1.3) | |
| Resource intensity weight, n (%) | 0.43 | ||||
| 0.250.75 | 35 | (28.0) | 19 | (25.3) | |
| 0.761.14 | 29 | (23.2) | 16 | (21.3) | |
| 1.151.60 | 34 | (27.2) | 16 | (21.3) | |
| 1.6125.5 | 27 | (21.6) | 24 | (32.0) | |
| Length of stay, d, n (%) | 0.01 | ||||
| 0.672.97 | 30 | (24.0) | 20 | (26.7) | |
| 2.984.60 | 40 | (32.0) | 10 | (13.3) | |
| 4.618.65 | 30 | (24.0) | 20 | (26.7) | |
| 8.66+ | 25 | (20.0) | 25 | (33.3) | |
| Subsequent emergency department visits in next year, n (% of applicable) | 0.38 | ||||
| 0 | 66 | (53.2) | 32 | (61.5) | |
| 1 | 30 | (24.2) | 13 | (25.0) | |
| 2+ | 28 | (22.6) | 7 | (13.5) | |
| Not applicable (died during index hospitalization or transfer to palliative care) | 1 | 23 | |||
| Subsequent hospitalizations in next year, n (% of applicable) | 0.87 | ||||
| 0 | 87 | (70.2) | 38 | (73.1) | |
| 1 | 24 | (19.4) | 10 | (19.2) | |
| 2+ | 13 | (10.5) | 4 | (7.7) | |
| Not applicable (died during index hospitalization or transfer to palliative care) | 1 | 23 | |||
| 1‐year mortality, n (% of applicable) | <0.001 | ||||
| Alive | 82 | (71.9) | 15 | (37.5) | |
| Dead | 32 | (28.1) | 25 | (62.5) | |
| Not applicable (died during index hospitalization or transfer to palliative care) | 1 | 23 | |||
| Not applicable (unsuccessful follow‐up with long‐term care home) | 10 | 12 | |||
Predictors of In‐hospital Death and 1‐Year Mortality
Given the significant positive associations between discussions and in‐hospital death and 1‐year mortality, we performed separate logistic regression analyses to test whether discussions independently predicted in‐hospital death and 1‐year mortality (Table 4). After adjusting for variables significant in their respective bivariate analyses, patients with discussions continued to have higher odds of in‐hospital death (AOR: 52.0 [95% CI: 6.2‐440.4]) and 1‐year mortality (AOR: 4.1 [95% CI: 1.7‐9.6]). Of note, the presence of dementia had significantly lower adjusted odds of in‐hospital death compared to the reference group of no dementia (AOR: 0.3 [95% CI: 0.1‐0.8]).
| Characteristic | Adjusted Odds Ratio | 95% Confidence Interval | P Value |
|---|---|---|---|
| |||
| In‐hospital death odds ratios | |||
| Advance directives from long‐term care | 0.91 | ||
| Comfort measures only | Reference | ||
| Supportive care no transfer | 3.43E +18 | 0‐. | 1.00 |
| Transfer to hospital | 3.10E +8 | 0‐. | 1.00 |
| Aggressive care | 4.85E +8 | 0‐. | 1.00 |
| Dementia | |||
| No | Reference | ||
| Yes | .25 | 0.08‐0.79 | 0.02 |
| Previous hospitalizations in last year | 0.05 | ||
| 0 | Reference | ||
| 1 | 0.43 | 0.08‐2.38 | 0.34 |
| 2+ | 6.30 | 1.10‐36.06 | 0.04 |
| Respiration | |||
| <20 | Reference | ||
| 20 | 3.64 | 0.82‐16.24 | 0.09 |
| Documented goals of care discussion | |||
| No | Reference | ||
| Yes | 52.04 | 6.15‐440.40 | <0.001 |
| 1‐year mortality odds ratios | |||
| Oxygen saturation, n (%) | |||
| <88 | 12.15 | 1.18‐124.97 | 0.04 |
| 88 | Reference | ||
| Previous ED visits in last year | 0.06 | ||
| 0 | Reference | ||
| 1 | 3.07 | 1.15‐8.17 | 0.03 |
| 2+ | 3.21 | 0.87‐11.81 | 0.08 |
| Previous hospitalizations in last year | 0.55 | ||
| 0 | Reference | ||
| 1 | 1.66 | 0.57‐4.86 | 0.36 |
| 2+ | 2.52 | 0.30‐20.89 | 0.39 |
| Documented goals of care discussion | |||
| No | Reference | ||
| Yes | 4.07 | 1.73‐9.56 | 0.001 |
DISCUSSION
Our retrospective study of LTC residents admitted to the GIM service showed that these admissions comprised 9.4% of all admissions and that GOC discussions occurred infrequently (37.5%). Our study revealed no differences in baseline patient characteristics associated with discussions, whereas patient acuity at hospital presentation independently contributed to the likelihood of discussions. We found strong associations between documentation and certain outcomes of care, including orders for AD, LOS, in‐hospital death, and 1‐year mortality. No significant associations were found between documentation and subsequent hospital use. Lastly, we found that consistent communication back to the LTC home when there was a change in AD was very poor; only 26% of discharge summaries included this documentation.
Our finding of infrequent GOC discussions during hospitalization aligns with prior studies. A study that identified code status discussions in transcripts of audio‐recorded admission encounters found that code status was discussed in only 24% of seriously ill patient admissions.[17] Furthermore, in a study specific to LTC residents, only 42% of admissions longer than 48 hours had a documented GOC discussion.[15]
We found visit‐level, but not baseline, characteristics were associated with discussions. These findings are supported by a recent study that found that whether GOC discussions took place largely depended on the acute condition presented on admission.[15] Although these results suggest that clinicians are appropriately prioritizing sicker patients who might have the most pressing need for GOC discussions, they also highlight the gap in care for less‐sick patients and the need to broaden clinical practice and consider underlying conditions and functional status. Of note, although the GCS score was found to be significantly associated with discussions, patients in the lowest GCS range did not have significantly different odds of discussions compared to the reference level (highest GCS range). A recent study by You et al. may offer some insight into this finding. They found that patients lacking capacity to make GOC decisions was ranked fifth, whereas lack of SDM availability was eighth among 21 barriers to GOC discussions, as perceived by hospital‐based clinicians.[16]
A major finding of this study was that both in‐hospital and 1‐year mortality were strongly associated with having a GOC discussion, suggesting that patients at higher risk of dying are more likely to have discussions. This is reflected by illness severity measured at initial assessment and by persistence of the association between discussions and mortality after discharge back to LTC. To the best of our knowledge, no previous studies have reported these findings. There are likely some unmeasured clinical factors such as clinical deterioration during hospitalization that contributed to this strong association. Interestingly, in our logistic regression analysis for independent predictors of in‐hospital death, we found that having dementia was associated with lower odds of in‐hospital death. One interpretation of this finding is that perhaps only patients with mild dementia were hospitalized, and those with more advanced dementia had an AD established in LTC that allowed them to remain in their LTC home. This possibility is supported by a systematic review of factors associated with LTC home hospitalization, which found that dementia was shown to be associated with less hospitalization.[18]
For patients who survived hospitalization, we did not find an association between GOC discussions and hospital use in the year following index hospitalization. In both groups, nearly 30% of patients had 1 or more subsequent hospitalizations. This is relevant especially in light of the finding that among patients where GOC discussions resulted in an AD change, only 26% of discharge summaries back to LTC included this documentation. We can only speculate that had these discussions been properly documented, subsequent hospitalizations would have decreased in the GOC group. Previous research has found that omissions of critical information in discharge summaries were common. In a study of hip fracture and stroke patients discharged from a large Midwestern academic medical center in the United States, code status was included in the discharge summary only 7% of the time.[19] The discharge summary is the primary means of sharing patient information between the hospital and LTC home. If GOC discussions are not included in the discharge summary, it is very unlikely that this information will be subsequently updated in the LTC medical record and impact the care the patient receives. A key recommendation for hospital‐based providers is ensuring that GOC discussions are clearly, consistently, and completely documented in the discharge summary so that the care provided is based on the patients' wishes.
Our study has several limitations. Our analysis was based on chart review, and although our analyses take into account a number of patient characteristics, we did not capture other characteristics that might influence GOC discussions such as culture/religion, language barriers, SDM availability, or whether patients clinically deteriorated during the index admission. Additionally, provider‐level predictors, including seniority, previous GOC training, and time available to conduct these discussions, were not captured. We also did not capture the timing or number of occasions that GOC discussions took place during hospitalization. Due to the retrospective nature of our study, we were able to only look at documented GOC discussions. GOC discussions may have happened but were never documented. However, the standard of care is to document these discussions as part of the medical record, and if they are not documented, it can be considered not to have happened and indicates a lower quality of practice. A recent survey of Canadian hospital‐based healthcare providers identified standardized GOC documentation as an effective practice to improve GOC communication.[20] Finally, because our study was conducted in 2 academic hospitals, our results may be less generalizable to other community hospitals. However, our hospitals' catchment areas capture a diverse population, both culturally and in terms of their socioeconomic status.
CONCLUSION
GOC discussions occurred infrequently, appeared to be triggered by illness severity, and were poorly communicated back to LTC. Important outcomes of care, including in‐hospital death and 1‐year mortality, were associated with discussions. This study serves to identify gaps in who might benefit from GOC discussions and illustrates opportunities for improvement including implementing standardized documentation practices.
Disclosures
Hannah J. Wong, PhD, and Robert C. Wu, MD, had full access to all of the data in the study and take responsibility for the integrity of the data and the accuracy of the data analysis. Robert C. Wu, MD, Hannah J. Wong, PhD, and Michelle Grinman, MD, were responsible for the conception and design of the study. Robert C. Wu, MD, Hannah J. Wong, PhD, and Jamie Wang were responsible for the acquisition of the data. All of the authors were responsible for the analysis and interpretation of the data, drafting of the manuscript, critical revision of the manuscript for important intellectual content, and final approval of the manuscript. Hannah J. Wong, PhD obtained the funding. Hannah J. Wong, PhD, and Robert C. Wu, MD, supervised the study. The authors report no conflicts of interest.
- , , , , . Trends in emergency department visits for ambulatory care sensitive conditions by elderly nursing home residents, 2001 to 2010. JAMA Intern Med. 2014;174(1):156–158.
- , , , . Hospital transfers of nursing home residents with advanced dementia. J Am Geriatr Soc. 2012;60(5):905–909.
- , , , , . Potentially avoidable hospitalizations for elderly long‐stay residents in nursing homes. Med Care. 2013;51(8):673–681.
- , . Reducing unnecessary hospitalizations of nursing home residents. N Engl J Med. 2011;365(13):1165–1167.
- , , . Advance directives and outcomes of surrogate decision making before death. N Engl J Med. 2010;362(13):1211–1218.
- , , , , , . The consistency between treatments provided to nursing facility residents and orders on the physician orders for life‐sustaining treatment form. J Am Geriatr Soc. 2011;59(11):2091–2099.
- , , . What should be the goal of advance care planning? JAMA Intern Med. 2014;174(7):1093–1094.
- , , , et al. Associations between end‐of‐life discussions, patient mental health, medical care near death, and caregiver bereavement adjustment. JAMA. 2008;300(14):1665–1673.
- , , , et al. Systematic implementation of an advance directive program in nursing homes: a randomized controlled trial. JAMA. 2000;283(11):1437–1444.
- , . Communication about serious illness care goals: a review and synthesis of best practices. JAMA Intern Med. 2014;174(12):1994–2003.
- , , . Predictors of nursing home residents' time to hospitalization. Health Serv Res. 2011;46(1 pt 1):82–104.
- , , , . Regional variation in the association between advance directives and end‐of‐life Medicare expenditures. JAMA. 2011;306(13):1447–1453.
- , , . Just ask: discussing goals of care with patients in hospital with serious illness. CMAJ. 2014;186(6):425–432.
- , , , et al. Failure to engage hospitalized elderly patients and their families in advance care planning. JAMA Intern Med. 2013;173(9):778–787.
- , , , . Hospitalisation of high‐care residents of aged care facilities: are goals of care discussed? Intern Med J. 2013;43(2):144–149.
- , , , et al. Barriers to goals of care discussions with seriously ill hospitalized patients and their families: a multicenter survey of clinicians. JAMA Intern Med. 2015;175(4):549–556.
- , , , , . Code status discussions between attending hospitalist physicians and medical patients at hospital admission. J Gen Intern Med. 2011;26(4):359–366.
- , , , . Predictors of nursing home hospitalization: a review of the literature. Med Care Res Rev. 2008;65(1):3–39.
- , , , , . Provider characteristics, clinical‐work processes and their relationship to discharge summary quality for sub‐acute care patients. J Gen Intern Med. 2012;27(1):78–84.
- , , , . Strategies for effective goals of care discussions and decision‐making: perspectives from a multi‐centre survey of Canadian hospital‐based healthcare providers. BMC Palliat Care. 2015;14:38.
Inconsistent Code Status Documentation
For hospitalized patients, providers should ideally establish advanced directives for cardiopulmonary resuscitation, commonly referred to as a patient's code status. Having an end‐of‐life plan is important and is associated with better quality of life for patients.[1, 2, 3, 4, 5] Advanced directive discussions and documentation are key quality measures to improve end‐of‐life care for vulnerable elders.[6, 7, 8]
Clear and consistent code status documentation is a prerequisite to providing care that respects hospitalized patients' preferences. Code status documentation only occurs in a minority of hospitalized patients, ranging from 25% of patients on a general medical ward to 36% of patients on elderly‐care wards.[9] Even in high‐risk patients, such as patients with metastatic cancer, providers only documented code status 20% of the time.[10] Even when code status documentation occurs, the amount of detail regarding patient goals and values, prognosis, and treatment options is generally poor.[11, 12] There are also concerns about the accuracy of code status documentation.[13, 14, 15, 16, 17, 18, 19] For example, a recent study found that for patients who had discussed their code status during their hospitalization, only 30% had documentation of their preferences in their chart that accurately reflected what was discussed.[20]
Further complicating matters is the fact that providers document key patient information, such as a patient's code status, in multiple places (eg, progress notes, physician orders). As a result, an additional documentation problem of inconsistency can arise for 2 reasons. First, code status documentation can be inconsistent because of incomplete documentation. Incomplete documentation is primarily a problem in patients who do not want to be resuscitated (ie, do not resuscitate [DNR]), because the absence of code status documentation leads front‐line staff to assume that the patient wants to be resuscitated (ie, full code). Second, inconsistent documentation can occur because of conflicting documentation (eg, a patient has a different code status documented in 2 or more places).
Together, these documentation problems have the potential to lead healthcare providers to resuscitate patients who do not wish to be resuscitated, or for patients who wish to be resuscitated to have delays in their resuscitation efforts. This study will extend the knowledge from the previous literature by exploring how the complexity and redundancy of clinical documentation practices affect the quality of code status documentation. To our knowledge, there are no prior studies that focus specifically on the frequency and clinical relevance of inconsistent code status documentation for inpatients across multiple documentation sources.
METHODS
Study Context
This is a point‐prevalence study conducted at 3 academic medical centers (AMCs) affiliated with the University of Toronto. At all 3 AMCs, the majority of general internal medicine (GIM) patients are admitted to 1 of 4 clinical teaching units (CTUs). The physician team on each CTU consists of 1 attending staff, 1 senior resident (second or third year resident), 2 to 3 first‐year residents, and 2 to 3 medical students. CTUs typically care for between 15 and 25 patients. The research ethics boards at each of the AMCs approved this study.
Existing Code Status Documentation Processes
At all 3 AMCs, providers document patient code status in 5 different places: (1) progress notes (admission and daily progress notes in the paper chart), (2) physician orders (computerized orders at 1 site, paper orders at the other 2 sites), (3) electronic sign‐out lists (Web‐based tools used by residents to support patient handover), (4) nursing‐care plan (used by nurses to document care plans for their assigned patients), and (5) DNR sheet (a cover sheet placed at the front of the paper chart in patients who have a DNR order) (see Supporting Information, Appendix, in the online version of this article). None of these documentation sources link automatically to one another. Once a physician establishes a patient's code status, it should be documented in the progress notes. The same physician should also write the code status as a physician order and update the patient's code status in the Web‐based electronic sign‐out list. The nurse responsible for the patient transcribes the code status order in the nursing‐care plan. For DNR patients, nurses or physicians (depending on the AMC) also place the DNR sheet in the front of the chart.
At our 3 AMCs, in the event of a cardiac arrest, resident physicians and nurses are typically the first responders. To quickly determine a patient's code status nurses and resident physicians look for the presence or absence of a DNR sheet. In addition, nurses rely on their nursing‐care plan and resident physicians rely on their electronic sign‐out list.
Eligibility Criteria and Sampling Strategy
Our study included GIM patients admitted to a CTU at 1 of 3 AMCs, and excluded admitted GIM patients who remained in the emergency department (due to differences in code status documentation processes). Data collection took place between September 2010 and September 2011 on days when the principal author (A.S.W.) was available to collect the data.
We collected data for all patients from a single GIM CTU on the same day to minimize the chance that a team updates or changes a patient's code status during data collection. We included each of the 4 CTUs at the 3 study sites once during the study period (ie, 12 full days of data collection).
Study Measures and Data Collection
One study author (A.S.W.) screened the 5 code status documentation sources listed above for each patient and recorded the documented code status as full code, DNR, or blank (if there was nothing entered) in a database. We also collected patient demographic data, admitting diagnosis, length of stay, admission to home ward (ie, the medicine ward affiliated with the CTU team that admitted the patient), free‐text code status documentation, transfer to the intensive care unit during their hospitalization, and whether the patient is receiving comfort measures, up to the time of data collection. Because the study investigators were not members of the team providing care to patients included in the study, we could not directly elicit the patient's actual code status.
The primary study outcome measures were the completeness and consistency of code status documentation across the 5 documentation sources. For completeness, we included data relating to 4 documentation sources only, excluding the DNR sheet because it is only relevant for DNR patients. We defined inconsistent code status documentation a priori as (1) the code status is conflicting in at least 2 documentation sources (eg, full code in 1 source and DNR in another) or (2) the code status is documented in 1 or more documentation source and not documented in at least 1 documentation source (eg, full code in 1 source and blank in another).
We then subdivided code status documentation inconsistencies into nonclinically relevant and clinically relevant subcategories. For example, a nonclinically relevant inconsistency would be if a physician documented full code in the physician orders, but a nurse did not document anything in the nursing‐care plan, because most providers would assume a preference for resuscitation in the absence of code status documentation in the nursing‐care plan.
We defined clinically relevant inconsistencies as those that would reasonably lead healthcare providers referring to different documentation sources to respond differently in the event of a cardiac arrest (eg, the physician orders show DNR whereas the nursing‐care plan is blanka provider who refers to the physician orders would not resuscitate the patient, but another provider who refers to the blank nursing‐care plan would resuscitate the patient).
We determined the proportion of patients with inconsistent code status documentation by listing the 31 different permutations of code status documentation in our data (Figure 1). Using the prespecified definition of inconsistent code status documentation, 3 study authors (I.A.D., B.M.W., R.C.W.) independently determined whether each permutation met the criteria for inconsistent code status documentation, and judged the clinical relevance of each documentation inconsistency. We resolved disagreements by consensus.

Statistical Analysis
We calculated descriptive statistics for all variables, summarizing continuous measures using means and standard deviations, and categorical measures using counts, percentages, and their associated 95% confidence intervals. Logistic regression analyses adjusting for the correlation among observations taken from the same team were carried out. Each of the 4 variables of interest (patient age, length of stay, receiving comfort measures, free text code status documentation) was run in a bivariate model to obtain unadjusted estimates as well as the final multivariable model. All estimates were displayed as odds ratios (ORs) and their associated 95% confidence intervals (CIs). A P value <0.05 was used to denote statistical significance. We also carried out a kappa analysis to assess inter‐rater agreement when judging whether inconsistent documentation is clinically relevant. All analyses were carried out using SAS version 9.3 (SAS Institute, Cary, NC).
RESULTS
There were 194 patients potentially eligible for inclusion. Seven admitted GIM patients who had not been transferred from the emergency department were excluded, leaving 187 patients in the study. The mean patient age was 70 years; 83 (44%) were female. The median length of stay up to the time of data collection was 6 days, with the majority (156 [83%]) of patients admitted to their home ward. Ten (5%) patients were receiving comfort measures.
Completeness of Code Status Documentation
Thirty‐eight (20%; 95% CI, 14%‐26%) patients had complete and consistent code status documentation across all documentation sources, whereas 27 (14%; 95% CI, 9%‐19%) patients had no code status documented in any documentation source. By documentation source, providers documented code status in the progress notes for 89 patients (48%; 95% CI, 40%‐55%), the physician orders for 107 patients (57%; 95% CI, 50%‐64%), the nursing‐care plan for 110 patients (59%; 95% CI, 51%‐66%), and the electronic sign‐out list for 129 patients (69%; 95% CI, 62%‐76%).
Consistency of Code Status Documentation
The remaining 122 patients (65%; 95% CI, 58%‐72%) had at least 1 code status documentation inconsistency. Of these, 38 patients (20%; 95% CI, 14%‐26%) had a clinically relevant code status documentation inconsistency. Code status documentation inconsistency differed by site; the 2 hospitals with paper‐based physician orders had fewer patients with complete and consistent code status documentation compared to the hospital where physician orders are electronic (15% vs 42%, respectively, P<0.001) (Table 1).
| Physician Code Status Order | Sites 1 & 2: Paper‐Based, N=108 | Site 3: Electronic, N=52 | P Value |
|---|---|---|---|
| Consistent code status documentation | 16 (15%) | 22 (42%) | |
| Inconsistent code status documentation, nonclinically relevant | 60 (56%) | 30 (58%) | <0.0001 |
| Inconsistent code status documentation, clinically relevant | 32 (30%) | 6 (12%) |
The permutations of clinically relevant and nonclinically relevant inconsistencies are summarized in Figure 1. We achieved high inter‐rater reliability among the 3 independent reviewers with respect to rating the clinical relevance of documentation inconsistencies (=0.86 [95% CI, 0.76‐0.95]).
To identify correlates of clinically relevant code status documentation inconsistencies, we included 4 variables of interest (patient age, length of stay, receiving comfort measures, and free text code status documentation) in a logistic regression analysis. Bivariate analyses demonstrated that increased age (OR =1.07 [95% CI, 1.05‐1.10] for every 1‐year increase in age, P<0.001) and receiving comfort measures (OR= 10.98 [95% CI, 1.94‐62.12], P=0.007) were associated with a clinically relevant code status documentation inconsistency. Using these 4 variables in a multivariable analysis clustering for physician team, increased age (OR=1.07 [95% CI, 1.04‐1.10] for every 1‐year increase in age, P<0.0001) and receiving comfort measures (OR=9.39 [95% CI, 1.3565.19], P=0.02) remained as independent positive correlates of having a clinically relevant code status documentation inconsistency (Table 2).
| Clinically Relevant Inconsistencies, N=38 | No Inconsistencies and Nonclinically Relevant Inconsistencies, N=149 | P Value | |
|---|---|---|---|
| |||
| Age, y, mean (SD) | 83 (10) | 67 (19) | <0.0001* |
| Length of stay, d, median (IQR) | 6.5 (310) | 6 (219) | 0.39 |
| Receiving comfort measures, n (%) | 7 (18%) | 3 (2%) | <0.0001* |
| Free‐text code status documentation, n (%) | 18 (47%) | 58 (39%) | 0.34 |
DISCUSSION
We found that 2 out of 3 patients had at least 1 inconsistency in code status documentation, and that 1 in 5 patients had at least 1 clinically relevant code status documentation inconsistency. The majority of clinically relevant inconsistencies occurred because there was a DNR order written in some sources of code status documentation, and no orders in other documentation sources. However, there were 4 striking examples where DNR was written in some sources of code status documentation and full code was written in other documentation sources (Figure 1).
Older patients and patients receiving comfort measures were more likely to have a clinically relevant inconsistency in code status documentation. This is particularly concerning, because they are among the most vulnerable patients at highest risk for having an in‐hospital cardiac arrest.
Our study extends the findings of prior studies that identified gaps in completeness and accuracy of code status documentation and describes another important gap in the quality and consistency of code status documentation.[20] This becomes particularly important because efforts aimed at increasing documentation of patients' code status without ensuring consistency across documentation sources may still result in patients being resuscitated or not resuscitated inappropriately.
This issue of poorly integrated health records is relevant for many other aspects of patient care. For example, 1 study found significant discrepancies in patient medication allergy documentation across multiple health records.[21] This fragmentation of documentation of the same patient information in multiple health records requires attention and should be the focus of institutional quality improvement efforts.
There are several potential ways to improve the code status documentation process. First, the use of standard fields or standardized orders can increase the completeness and improve the clarity of code status documentation.[22, 23] For institutions with an electronic medical record, forcing functions may further increase code status documentation. One study found that the implementation of an electronic medical record increased code status documentation from 4% to 63%.[24] We found similarly that the site with electronic physician orders had higher rates of complete and consistent code status documentation.
A second approach is to minimize the number of different sources for code status documentation. Institutions should critically examine each place where providers could document code status and decide whether this information adds value, and create policies to restrict unnecessary duplicate documentation and ensure accurate documentation of code status in several key, centralized locations.[25] A third option would be to automatically synchronize all code status documentation sources.[25] This final approach requires a fully integrated electronic health record.
Our study has several limitations. Although we report a large number of code status documentation inconsistencies, we do not know how many of these lead to incorrect resuscitative measures, so the actual impact on patient care is unknown. Also, because we were focusing on inconsistencies among sources of code status documentation, and not on accurate documentation of a patients' code status, the patients' actual preferences were not elicited and are not known. Finally, we carried out our study in 3 AMCs with residents that rotate from 1 site to another. The transient nature of resident work may increase the likelihood of documentation inconsistencies, because trainees may be less aware of local processes. In addition, the way front‐line staff uses clinical documentation sources to determine a patient's code status may differ at other institutions. Therefore, our estimate of clinical relevance may not be generalizable to other institutions with different front‐line processes or with healthcare teams that are more stable and aware of local documentation processes.
In summary, our study uncovered significant gaps in the quality of code status documentation that span 3 different AMCs. Having multiple, poorly integrated sources for code status documentation leads to a significant number of concerning inconsistencies that create opportunities for healthcare providers to inappropriately deliver or withhold resuscitative measures that conflict with patients' expressed wishes. Institutions need to be aware of this potential documentation hazard and take steps to minimize code status documentation inconsistencies. Even though cardiac arrests occur infrequently, if healthcare teams take inappropriate action because of these code status documentation inconsistencies, the consequences can be devastating.
Disclosure
Nothing to report.
- , , , et al. Advance directives for medical care—a case for greater use. N Engl J Med. 1991;324(13):889–895.
- , , , et al; Canadian Researchers at the End of Life Network (CARENET). What matters most in end‐of‐life care: perceptions of seriously ill patients and their family memebrs. CMAJ. 2006;174(5):627–633.
- , , . Advance directives and outcomes of surrogate decision making before death. N Eng J Med. 2010;362(13):1211–1218.
- , , , et al. Associations between end‐of‐life discussions, patient mental health, medical care near death, and caregiver bereavement adjustment. JAMA. 2008;300(14):1665–1673.
- , , , . The impact of advance care planning on end of life care in elderly patients: randomized controlled trial. BMJ. 2010;340:c1345.
- , . Quality indicators for end‐of‐life care in vulnerable elders. Ann Intern Med. 2001;135(8):667–685.
- , , , . Assessing care of vulnerable elders: methods for developing quality indicators. Ann Intern Med. 2001;135:647–652.
- , , , et al. Perceptions by family members of the dying experience of older and seriously ill patients. Ann Intern Med. 1997;126(2):97–106.
- , . Cardiopulmonary resuscitation: capacity, discussion and documentation. Q J Med. 2006;99(10):683–690.
- , , , et al. Code status documentation in the outpatient electronic medical records or patients with metastatic cancer. J Gen Intern Med. 2009;25(2):150–153.
- , , , et al. Factors associated with discussion of care plans and code status at the time of hospital admission: results from the multicenter hospitalist study. J Hosp Med. 2008;3(6):437–445.
- , , , . Documentation quality of inpatient code status discussions. J Pain Symptom Manage. 2014;48(4):632–638.
- , , , . The use of life‐sustaining treatments in hospitalized persons aged 80 and older. J Am Geriatr Soc. 2002;50(5):930–934.
- The SUPPORT Principal Investigators. A controlled trial to improve care for seriously ill hospitalized patients: the Study to Understand Prognoses and Preferences for Outcomes and Risks of Treatments (SUPPORT). JAMA. 1995;274(20):1591–1598.
- , , . Some treatment‐withholding implications of no‐code orders in an academic hospital. Crit Care Med. 1984;12(10):879–881.
- . A prospective study of patients with DNR orders in a teaching hospital. Arch Intern Med. 1998;148(10):2193–2198.
- , . Compliance with do‐not‐resuscitate orders for hospitalized patient transported to radiology department. Ann Int Med. 1998;129(10):801–805.
- , . Identification of inpatient DNR status: a safety hazard begging for standardization. J Hosp Med. 2007;2(6):366–371.
- . Controlling death: the false promise of advance directives. Ann Int Med. 2007;147(1):51–57.
- , , , et al. Failure to engage hospitalized elderly patients and their families in advance care planning. JAMA Intern Med. 2013;173(9):778–787.
- , , , et al. The recording of drug sensitivities for older people living in care homes. Br J Clin Pharmacol. 2010;69(5):553–557.
- , , , , , . A comparison of methods to communicate treatment preferences in nursing facilities: traditional practices versus the physician orders for life‐sustaining treatment program. J Am Geriatr Soc. 2010;58(7):1241–1248.
- , , , et al. Evaluation of a treatment limitation policy with a specific treatment‐limiting order page. Arch Intern Med. 1994;154(4):425–432.
- , , , et al. An electronic medical record intervention increased nursing home advance directive orders and documentation. J Am Geriatr Soc. 2007;55(7):1001–1006.
- , , , et al. Honouring patient's resuscitation wishes: a multiphased effort to improve identification and documentation. BMJ Quality Safety. 2013;22(1):85–92.
For hospitalized patients, providers should ideally establish advanced directives for cardiopulmonary resuscitation, commonly referred to as a patient's code status. Having an end‐of‐life plan is important and is associated with better quality of life for patients.[1, 2, 3, 4, 5] Advanced directive discussions and documentation are key quality measures to improve end‐of‐life care for vulnerable elders.[6, 7, 8]
Clear and consistent code status documentation is a prerequisite to providing care that respects hospitalized patients' preferences. Code status documentation only occurs in a minority of hospitalized patients, ranging from 25% of patients on a general medical ward to 36% of patients on elderly‐care wards.[9] Even in high‐risk patients, such as patients with metastatic cancer, providers only documented code status 20% of the time.[10] Even when code status documentation occurs, the amount of detail regarding patient goals and values, prognosis, and treatment options is generally poor.[11, 12] There are also concerns about the accuracy of code status documentation.[13, 14, 15, 16, 17, 18, 19] For example, a recent study found that for patients who had discussed their code status during their hospitalization, only 30% had documentation of their preferences in their chart that accurately reflected what was discussed.[20]
Further complicating matters is the fact that providers document key patient information, such as a patient's code status, in multiple places (eg, progress notes, physician orders). As a result, an additional documentation problem of inconsistency can arise for 2 reasons. First, code status documentation can be inconsistent because of incomplete documentation. Incomplete documentation is primarily a problem in patients who do not want to be resuscitated (ie, do not resuscitate [DNR]), because the absence of code status documentation leads front‐line staff to assume that the patient wants to be resuscitated (ie, full code). Second, inconsistent documentation can occur because of conflicting documentation (eg, a patient has a different code status documented in 2 or more places).
Together, these documentation problems have the potential to lead healthcare providers to resuscitate patients who do not wish to be resuscitated, or for patients who wish to be resuscitated to have delays in their resuscitation efforts. This study will extend the knowledge from the previous literature by exploring how the complexity and redundancy of clinical documentation practices affect the quality of code status documentation. To our knowledge, there are no prior studies that focus specifically on the frequency and clinical relevance of inconsistent code status documentation for inpatients across multiple documentation sources.
METHODS
Study Context
This is a point‐prevalence study conducted at 3 academic medical centers (AMCs) affiliated with the University of Toronto. At all 3 AMCs, the majority of general internal medicine (GIM) patients are admitted to 1 of 4 clinical teaching units (CTUs). The physician team on each CTU consists of 1 attending staff, 1 senior resident (second or third year resident), 2 to 3 first‐year residents, and 2 to 3 medical students. CTUs typically care for between 15 and 25 patients. The research ethics boards at each of the AMCs approved this study.
Existing Code Status Documentation Processes
At all 3 AMCs, providers document patient code status in 5 different places: (1) progress notes (admission and daily progress notes in the paper chart), (2) physician orders (computerized orders at 1 site, paper orders at the other 2 sites), (3) electronic sign‐out lists (Web‐based tools used by residents to support patient handover), (4) nursing‐care plan (used by nurses to document care plans for their assigned patients), and (5) DNR sheet (a cover sheet placed at the front of the paper chart in patients who have a DNR order) (see Supporting Information, Appendix, in the online version of this article). None of these documentation sources link automatically to one another. Once a physician establishes a patient's code status, it should be documented in the progress notes. The same physician should also write the code status as a physician order and update the patient's code status in the Web‐based electronic sign‐out list. The nurse responsible for the patient transcribes the code status order in the nursing‐care plan. For DNR patients, nurses or physicians (depending on the AMC) also place the DNR sheet in the front of the chart.
At our 3 AMCs, in the event of a cardiac arrest, resident physicians and nurses are typically the first responders. To quickly determine a patient's code status nurses and resident physicians look for the presence or absence of a DNR sheet. In addition, nurses rely on their nursing‐care plan and resident physicians rely on their electronic sign‐out list.
Eligibility Criteria and Sampling Strategy
Our study included GIM patients admitted to a CTU at 1 of 3 AMCs, and excluded admitted GIM patients who remained in the emergency department (due to differences in code status documentation processes). Data collection took place between September 2010 and September 2011 on days when the principal author (A.S.W.) was available to collect the data.
We collected data for all patients from a single GIM CTU on the same day to minimize the chance that a team updates or changes a patient's code status during data collection. We included each of the 4 CTUs at the 3 study sites once during the study period (ie, 12 full days of data collection).
Study Measures and Data Collection
One study author (A.S.W.) screened the 5 code status documentation sources listed above for each patient and recorded the documented code status as full code, DNR, or blank (if there was nothing entered) in a database. We also collected patient demographic data, admitting diagnosis, length of stay, admission to home ward (ie, the medicine ward affiliated with the CTU team that admitted the patient), free‐text code status documentation, transfer to the intensive care unit during their hospitalization, and whether the patient is receiving comfort measures, up to the time of data collection. Because the study investigators were not members of the team providing care to patients included in the study, we could not directly elicit the patient's actual code status.
The primary study outcome measures were the completeness and consistency of code status documentation across the 5 documentation sources. For completeness, we included data relating to 4 documentation sources only, excluding the DNR sheet because it is only relevant for DNR patients. We defined inconsistent code status documentation a priori as (1) the code status is conflicting in at least 2 documentation sources (eg, full code in 1 source and DNR in another) or (2) the code status is documented in 1 or more documentation source and not documented in at least 1 documentation source (eg, full code in 1 source and blank in another).
We then subdivided code status documentation inconsistencies into nonclinically relevant and clinically relevant subcategories. For example, a nonclinically relevant inconsistency would be if a physician documented full code in the physician orders, but a nurse did not document anything in the nursing‐care plan, because most providers would assume a preference for resuscitation in the absence of code status documentation in the nursing‐care plan.
We defined clinically relevant inconsistencies as those that would reasonably lead healthcare providers referring to different documentation sources to respond differently in the event of a cardiac arrest (eg, the physician orders show DNR whereas the nursing‐care plan is blanka provider who refers to the physician orders would not resuscitate the patient, but another provider who refers to the blank nursing‐care plan would resuscitate the patient).
We determined the proportion of patients with inconsistent code status documentation by listing the 31 different permutations of code status documentation in our data (Figure 1). Using the prespecified definition of inconsistent code status documentation, 3 study authors (I.A.D., B.M.W., R.C.W.) independently determined whether each permutation met the criteria for inconsistent code status documentation, and judged the clinical relevance of each documentation inconsistency. We resolved disagreements by consensus.
Statistical Analysis
We calculated descriptive statistics for all variables, summarizing continuous measures using means and standard deviations, and categorical measures using counts, percentages, and their associated 95% confidence intervals. Logistic regression analyses adjusting for the correlation among observations taken from the same team were carried out. Each of the 4 variables of interest (patient age, length of stay, receiving comfort measures, free text code status documentation) was run in a bivariate model to obtain unadjusted estimates as well as the final multivariable model. All estimates were displayed as odds ratios (ORs) and their associated 95% confidence intervals (CIs). A P value <0.05 was used to denote statistical significance. We also carried out a kappa analysis to assess inter‐rater agreement when judging whether inconsistent documentation is clinically relevant. All analyses were carried out using SAS version 9.3 (SAS Institute, Cary, NC).
RESULTS
There were 194 patients potentially eligible for inclusion. Seven admitted GIM patients who had not been transferred from the emergency department were excluded, leaving 187 patients in the study. The mean patient age was 70 years; 83 (44%) were female. The median length of stay up to the time of data collection was 6 days, with the majority (156 [83%]) of patients admitted to their home ward. Ten (5%) patients were receiving comfort measures.
Completeness of Code Status Documentation
Thirty‐eight (20%; 95% CI, 14%‐26%) patients had complete and consistent code status documentation across all documentation sources, whereas 27 (14%; 95% CI, 9%‐19%) patients had no code status documented in any documentation source. By documentation source, providers documented code status in the progress notes for 89 patients (48%; 95% CI, 40%‐55%), the physician orders for 107 patients (57%; 95% CI, 50%‐64%), the nursing‐care plan for 110 patients (59%; 95% CI, 51%‐66%), and the electronic sign‐out list for 129 patients (69%; 95% CI, 62%‐76%).
Consistency of Code Status Documentation
The remaining 122 patients (65%; 95% CI, 58%‐72%) had at least 1 code status documentation inconsistency. Of these, 38 patients (20%; 95% CI, 14%‐26%) had a clinically relevant code status documentation inconsistency. Code status documentation inconsistency differed by site; the 2 hospitals with paper‐based physician orders had fewer patients with complete and consistent code status documentation compared to the hospital where physician orders are electronic (15% vs 42%, respectively, P<0.001) (Table 1).
| Physician Code Status Order | Sites 1 & 2: Paper‐Based, N=108 | Site 3: Electronic, N=52 | P Value |
|---|---|---|---|
| Consistent code status documentation | 16 (15%) | 22 (42%) | |
| Inconsistent code status documentation, nonclinically relevant | 60 (56%) | 30 (58%) | <0.0001 |
| Inconsistent code status documentation, clinically relevant | 32 (30%) | 6 (12%) |
The permutations of clinically relevant and nonclinically relevant inconsistencies are summarized in Figure 1. We achieved high inter‐rater reliability among the 3 independent reviewers with respect to rating the clinical relevance of documentation inconsistencies (=0.86 [95% CI, 0.76‐0.95]).
To identify correlates of clinically relevant code status documentation inconsistencies, we included 4 variables of interest (patient age, length of stay, receiving comfort measures, and free text code status documentation) in a logistic regression analysis. Bivariate analyses demonstrated that increased age (OR =1.07 [95% CI, 1.05‐1.10] for every 1‐year increase in age, P<0.001) and receiving comfort measures (OR= 10.98 [95% CI, 1.94‐62.12], P=0.007) were associated with a clinically relevant code status documentation inconsistency. Using these 4 variables in a multivariable analysis clustering for physician team, increased age (OR=1.07 [95% CI, 1.04‐1.10] for every 1‐year increase in age, P<0.0001) and receiving comfort measures (OR=9.39 [95% CI, 1.3565.19], P=0.02) remained as independent positive correlates of having a clinically relevant code status documentation inconsistency (Table 2).
| Clinically Relevant Inconsistencies, N=38 | No Inconsistencies and Nonclinically Relevant Inconsistencies, N=149 | P Value | |
|---|---|---|---|
| |||
| Age, y, mean (SD) | 83 (10) | 67 (19) | <0.0001* |
| Length of stay, d, median (IQR) | 6.5 (310) | 6 (219) | 0.39 |
| Receiving comfort measures, n (%) | 7 (18%) | 3 (2%) | <0.0001* |
| Free‐text code status documentation, n (%) | 18 (47%) | 58 (39%) | 0.34 |
DISCUSSION
We found that 2 out of 3 patients had at least 1 inconsistency in code status documentation, and that 1 in 5 patients had at least 1 clinically relevant code status documentation inconsistency. The majority of clinically relevant inconsistencies occurred because there was a DNR order written in some sources of code status documentation, and no orders in other documentation sources. However, there were 4 striking examples where DNR was written in some sources of code status documentation and full code was written in other documentation sources (Figure 1).
Older patients and patients receiving comfort measures were more likely to have a clinically relevant inconsistency in code status documentation. This is particularly concerning, because they are among the most vulnerable patients at highest risk for having an in‐hospital cardiac arrest.
Our study extends the findings of prior studies that identified gaps in completeness and accuracy of code status documentation and describes another important gap in the quality and consistency of code status documentation.[20] This becomes particularly important because efforts aimed at increasing documentation of patients' code status without ensuring consistency across documentation sources may still result in patients being resuscitated or not resuscitated inappropriately.
This issue of poorly integrated health records is relevant for many other aspects of patient care. For example, 1 study found significant discrepancies in patient medication allergy documentation across multiple health records.[21] This fragmentation of documentation of the same patient information in multiple health records requires attention and should be the focus of institutional quality improvement efforts.
There are several potential ways to improve the code status documentation process. First, the use of standard fields or standardized orders can increase the completeness and improve the clarity of code status documentation.[22, 23] For institutions with an electronic medical record, forcing functions may further increase code status documentation. One study found that the implementation of an electronic medical record increased code status documentation from 4% to 63%.[24] We found similarly that the site with electronic physician orders had higher rates of complete and consistent code status documentation.
A second approach is to minimize the number of different sources for code status documentation. Institutions should critically examine each place where providers could document code status and decide whether this information adds value, and create policies to restrict unnecessary duplicate documentation and ensure accurate documentation of code status in several key, centralized locations.[25] A third option would be to automatically synchronize all code status documentation sources.[25] This final approach requires a fully integrated electronic health record.
Our study has several limitations. Although we report a large number of code status documentation inconsistencies, we do not know how many of these lead to incorrect resuscitative measures, so the actual impact on patient care is unknown. Also, because we were focusing on inconsistencies among sources of code status documentation, and not on accurate documentation of a patients' code status, the patients' actual preferences were not elicited and are not known. Finally, we carried out our study in 3 AMCs with residents that rotate from 1 site to another. The transient nature of resident work may increase the likelihood of documentation inconsistencies, because trainees may be less aware of local processes. In addition, the way front‐line staff uses clinical documentation sources to determine a patient's code status may differ at other institutions. Therefore, our estimate of clinical relevance may not be generalizable to other institutions with different front‐line processes or with healthcare teams that are more stable and aware of local documentation processes.
In summary, our study uncovered significant gaps in the quality of code status documentation that span 3 different AMCs. Having multiple, poorly integrated sources for code status documentation leads to a significant number of concerning inconsistencies that create opportunities for healthcare providers to inappropriately deliver or withhold resuscitative measures that conflict with patients' expressed wishes. Institutions need to be aware of this potential documentation hazard and take steps to minimize code status documentation inconsistencies. Even though cardiac arrests occur infrequently, if healthcare teams take inappropriate action because of these code status documentation inconsistencies, the consequences can be devastating.
Disclosure
Nothing to report.
- , , , et al. Advance directives for medical care—a case for greater use. N Engl J Med. 1991;324(13):889–895.
- , , , et al; Canadian Researchers at the End of Life Network (CARENET). What matters most in end‐of‐life care: perceptions of seriously ill patients and their family memebrs. CMAJ. 2006;174(5):627–633.
- , , . Advance directives and outcomes of surrogate decision making before death. N Eng J Med. 2010;362(13):1211–1218.
- , , , et al. Associations between end‐of‐life discussions, patient mental health, medical care near death, and caregiver bereavement adjustment. JAMA. 2008;300(14):1665–1673.
- , , , . The impact of advance care planning on end of life care in elderly patients: randomized controlled trial. BMJ. 2010;340:c1345.
- , . Quality indicators for end‐of‐life care in vulnerable elders. Ann Intern Med. 2001;135(8):667–685.
- , , , . Assessing care of vulnerable elders: methods for developing quality indicators. Ann Intern Med. 2001;135:647–652.
- , , , et al. Perceptions by family members of the dying experience of older and seriously ill patients. Ann Intern Med. 1997;126(2):97–106.
- , . Cardiopulmonary resuscitation: capacity, discussion and documentation. Q J Med. 2006;99(10):683–690.
- , , , et al. Code status documentation in the outpatient electronic medical records or patients with metastatic cancer. J Gen Intern Med. 2009;25(2):150–153.
- , , , et al. Factors associated with discussion of care plans and code status at the time of hospital admission: results from the multicenter hospitalist study. J Hosp Med. 2008;3(6):437–445.
- , , , . Documentation quality of inpatient code status discussions. J Pain Symptom Manage. 2014;48(4):632–638.
- , , , . The use of life‐sustaining treatments in hospitalized persons aged 80 and older. J Am Geriatr Soc. 2002;50(5):930–934.
- The SUPPORT Principal Investigators. A controlled trial to improve care for seriously ill hospitalized patients: the Study to Understand Prognoses and Preferences for Outcomes and Risks of Treatments (SUPPORT). JAMA. 1995;274(20):1591–1598.
- , , . Some treatment‐withholding implications of no‐code orders in an academic hospital. Crit Care Med. 1984;12(10):879–881.
- . A prospective study of patients with DNR orders in a teaching hospital. Arch Intern Med. 1998;148(10):2193–2198.
- , . Compliance with do‐not‐resuscitate orders for hospitalized patient transported to radiology department. Ann Int Med. 1998;129(10):801–805.
- , . Identification of inpatient DNR status: a safety hazard begging for standardization. J Hosp Med. 2007;2(6):366–371.
- . Controlling death: the false promise of advance directives. Ann Int Med. 2007;147(1):51–57.
- , , , et al. Failure to engage hospitalized elderly patients and their families in advance care planning. JAMA Intern Med. 2013;173(9):778–787.
- , , , et al. The recording of drug sensitivities for older people living in care homes. Br J Clin Pharmacol. 2010;69(5):553–557.
- , , , , , . A comparison of methods to communicate treatment preferences in nursing facilities: traditional practices versus the physician orders for life‐sustaining treatment program. J Am Geriatr Soc. 2010;58(7):1241–1248.
- , , , et al. Evaluation of a treatment limitation policy with a specific treatment‐limiting order page. Arch Intern Med. 1994;154(4):425–432.
- , , , et al. An electronic medical record intervention increased nursing home advance directive orders and documentation. J Am Geriatr Soc. 2007;55(7):1001–1006.
- , , , et al. Honouring patient's resuscitation wishes: a multiphased effort to improve identification and documentation. BMJ Quality Safety. 2013;22(1):85–92.
© 2015 Society of Hospital Medicine
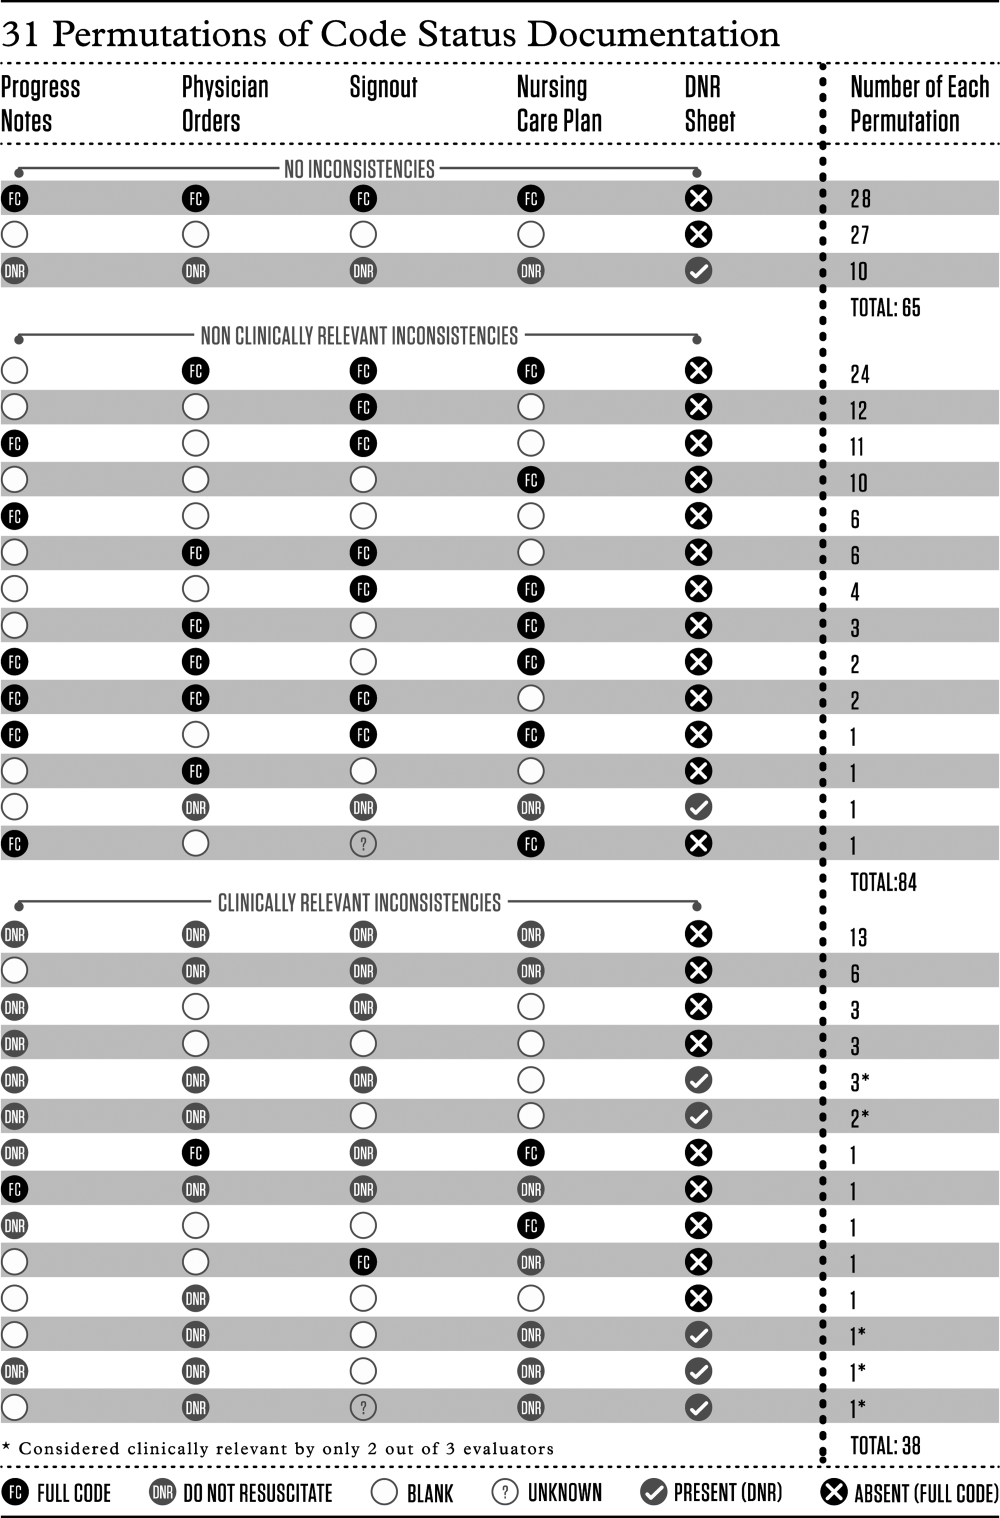
Educational Impact of Smartphones
Medical residents are rapidly adopting smartphones. Recent statistics revealed that 85% of medical providers currently own a smartphone, and the majority use it in their clinical work.[1] Smartphone capabilities that include the use of text messaging, e‐mail, and mobile phone functions in the clinical setting may improve efficiency and quality of care by reducing the response time for urgent issues.[2] There is, however, increasing recognition that healthcare information technology can create unintended negative consequences. For example, studies have suggested that healthcare information technologies, such as the computerized physician order entry, may actually increase errors by creating new work, changing clinical workflow, and altering communication patterns.[3, 4, 5]
Smartphone use for clinical communication can have unintended consequences by increasing interruptions, reducing interprofessional relationships, and widening the gap between what nurses and physicians perceive as urgent clinical problems.[6] However, no studies have evaluated the impact of smartphones on the educational experience of medical trainees. Although previous studies have described the use of smartphones by trainees for rapid access to electronic medical resources,[7, 8, 9] we did not identify in our literature review any previous studies on the impact of using the smartphone's primary functionas a communication deviceon the educational experience of residents and medical students. Therefore, our study aimed to examine the impact of using smartphones for clinical communication on medical education.
METHODS
Design
The design of the study was qualitative research methodology using interview data, ethnographic data, and content analysis of text‐based messages.
Setting
From June 2009 to September 2010, we conducted a multisite evaluation study on general internal medicine (GIM) wards at 5 large academic teaching hospitals in the city of Toronto, Canada at St. Michael's Hospital, Sunnybrook Health Sciences Centre, Toronto General Hospital, Toronto Western Hospital, and Mount Sinai Hospital. Each hospital has clinical teaching units consisting typically of 4 medical teams. Each team includes 1 attending physician, 1 senior resident, 2 or more junior residents, and 2 to 4 medical students. Each hospital had 2 to 4 GIM wards in different geographic locations.
Communication Systems
To make it easier for nurses and other health professionals to communicate with the physician teams, all sites centralized communication to 1 team member, who acts as the single point of contact on behalf of their assigned team in the communication of patient‐related issues. We facilitated this communication through a shared device (either a pager or a smartphone). The senior resident typically carried the shared device during the day and the on‐call junior resident at night and on the weekends. Two hospitals provided smartphones to all residents, whereas a third site provided smartphones only to the senior residents. The standard processes of communication required that physicians respond to all calls and text messages. At the 3 sites with institutional smartphones, nurses could send text messages with patient information using a Web‐based system. We encrypted data sent to institutional smartphones to protect patient information.
Data Collection
Using a mixed‐methods ethnographic approach, we collected data using semistructured interviews, ethnographic observations, and content analysis of text messages. The original larger study focused primarily on examining the overall clinical impact of smartphone use.[10] For our current study, we analyzed the data with a focus on evaluating the impact of smartphones on the educational experience of medical trainees on the GIM teaching service. The respective institutions' research ethics boards approved the study.
Interviews
We conducted semistructured interviews with residents, medical students, attending physicians, and other clinicians across all of the sites to examine how clinicians perceived the impact of smartphones on medical education. We used a purposeful sampling strategy where we interviewed different groups of healthcare professionals who we suspected would represent different viewpoints on the use of smartphones for clinical communication. To obtain diverse perspectives, we snowball sampled by asking interviewees to suggest colleagues with differing views to participate in the interviews. The interview guide consisted of open‐ended questions with additional probes to elicit more detailed information from these frontline clinicians who initiate and receive communication. One of the study investigators (V.L.) conducted interviews that varied from 15 to 45 minutes in duration. We recorded, transcribed verbatim, and analyzed the interviews using NVivo software (QSR International, Doncaster, Victoria, Australia). We added additional questions iteratively as themes emerged from the initial interviews. One of the study investigators (V.L.) encouraged participants to speak freely, to raise issues that they perceived to be important, and to support their responses with examples.
Observations
We observed the communication processes in the hospitals by conducting a work‐shadowing approach that followed individual residents in their work environments. These observations included 1‐on‐1 supervision encounters involving attending staff, medical students, and other residents, and informal and formal teaching rounds. The observation periods included the usual working day (from 8 am to 6 pm) as well as the busiest times on call, typically from 6 pm until 11 pm. We sampled different residents for different time periods. We adopted a nonparticipatory observation technique where we observed all interruptions, communication interactions, and patterns from a distance. We defined workflow interruptions as an intrusion of an unplanned and unscheduled task, causing a discontinuation of tasks, a noticeable break, or task switch behaviour.[11] Data collection included timing of events and writing field notes. One of the study investigators (V.L.) performed all the work‐shadowing observations.
E‐mail
To study the volume and content of messages, we collected e‐mail communications between January 2009 and June 2009 from consenting residents at the 2 hospitals that provided smartphones to all GIM residents. E‐mail information included the sender, the receiver, the time of message, and the message content. To look at usage, we calculated the average number of e‐mails sent and received. To assess interruptions on formal teaching sessions, we paid particular attention to e‐mails received and sent during protected educational timeweekdays from 8 am to 9 am (morning report) and 12 pm to 1 pm (noon rounds). We randomly sampled 20% of all e‐mails sent between residents for content analysis and organized content related to medical education into thematic categories.
Analysis
We used a deductive approach to analyze the interview transcripts by applying a conceptual framework that assessed the educational impact of patient safety interventions.[12] This framework identified 5 educational domains (learning, teaching, supervision, assessment, and feedback). Three study investigators mapped interview data, work‐shadowing data, and e‐mail content to themes (V.L., B.W., and R.W.), and grouped data that did not translate into themes into new categories. We then triangulated the data to develop themes of the educational impact of smartphone communication by both perceived use and actual use, and subsequently constructed a framework of how smartphone communication affected education.
RESULTS
We conducted 124 semistructured interviews with residents, medical students, attending physicians, and other clinicians across all the sites to examine how clinicians perceived the impact of smartphones on medical education. We work‐shadowed 40 individual residents for a total of 196 hours (Table 1). We analyzed the 13,714 e‐mails sent from or received to 34 residents. To analyze e‐mail content, we reviewed 1179 e‐mails sent among residents.
| Methods | Sites | |||||
|---|---|---|---|---|---|---|
| St. Michael's Hospital | Sunnybrook Health Sciences Centre | Toronto General Hospital | Toronto Western Hospital | Mount Sinai Hospital | All Hospitals | |
| ||||||
| Work‐shadowing residents | ||||||
| Hours | 60 hours | 35 hours | 57 hours 55 minutes | 27 hours 46 minutes | 15 hours | 196 hours |
| No. of residents | 12 | 7 | 12 | 6 | 3 | 40 |
| Interviews with clinicians | ||||||
| Physicians | 10 | 5 | 13 | 5 | 33 | |
| Medical students | 5 | 4 | 1 | 1 | 11 | |
| Nurses | 9 | 11 | 15 | 14 | 49 | |
| Other health professionsa | 7 | 10 | 8 | 6 | 31 | |
| Total | 31 | 30 | 37 | 26 | 124 | |
We found that 2 key characteristics of smartphone use for clinical communication, namely an increase in connectedness leading to an increase in interruptions, impacted 3 educational domains: teaching, supervision, and professionalism (Figure 1).

Increased Connectedness
As a communication device, smartphones increase the ability to receive and respond to messages through voice, e‐mail, and text messaging. Not surprisingly, with the improved ability and mobility to communicate, medical trainees perceived being more connected with their team members, who included other residents, medical students, and attending staff as well as with other clinical services and professions. These smartphone communication activities appeared to be pervasive, occurring on the wards, at the bedside, while in transit, and in teaching sessions (Box 1: increased connectedness).
Box
Increased connectedness
I've used the Blackberry system and it's nice to be able to quickly text each other little messages especially for meeting times because then you don't have to page them and wait by the phone. So that's been great for in the team. (Interview Resident 3)
It's incredibly useful for when you're paging somebody else. Often times I'll be consulting with another physician on a patient and I'll say This is my BlackBerry. Call me back after you've seen the patient' or Call me back when you have a plan' or, you know, whatever. So that's extremely valuable which we never had with pages and no one would ever page you for that because it was too much of a pain. (Interview Resident 1)
My personal experience has been that if you need to speak to a more senior individual it's much easier to contact them via the BlackBerry. (Interview Medical Student 1)
At 7:25 pm, MD11 returns to the patient's room and continues examining her. While in the patient's room, I could see her talking on the BlackBerrys. I asked her later what calls she had while in the room. It turns out she had 3 phone calls and 2 texts. Two of the calls were from the radiation oncologists and 1 call from the pathologist. She also received 1 text on the Team BlackBerry and 1 text on the Senior's BlackBerry from the pharmacist. (Field Notes, Work-shadowing MD11)
Interruptions
The increased connectedness caused by smartphone use led residents to perceive an increase in the frequency of interruptions. The multitude of communication and contact options made available by smartphones to health providers created an expansive network of connected individuals who were in constant communication with each other. Instead of the difficulties associated with numeric paging and waiting for a response, nurses typically found it easier to call directly or send a text message to residents' smartphones. From the e‐mail analysis, residents received, on a daily basis, on average 25.7 e‐mails, (median, 20; interquartile range [IQR]: 1428) to the team smartphone and sent 7.5 e‐mails (median, 6; IQR: 410). During protected educational time, each resident received an average of 1.0 e‐mail (median, 1; IQR: 01) between 8 am and 9 am and an average of 2.3 e‐mails (median, 2; IQR: 13) during 12 pm to 1 pm (Figure 2). Each of these communication events, whether a phone call, e‐mail, or text‐message, led to an interruption (Box 2). Given that smartphones made it easier for nurses to contact residents, some residents attributed the increase in interruptions to a reduction in the threshold for nurses to communicate.
Box
Increased interruptions
The only negative I can think of is just the incredible number of communications that you get, you know, text messages and e‐mails and everything else. So just the, the number can sometimes be overwhelming. (Interview Resident 1)
Some of [the nurses] rely a little bit more on the BlackBerry so that they will tend to call you a bit more frequently for things that maybe sometimes they should try to find answer for themselves (Interview Resident 2)
And now with the option of being able to, if you really needed to, call them and talk to them directly, I think that kind of improves communication. They're easier to find. (Interview Nurse 4)
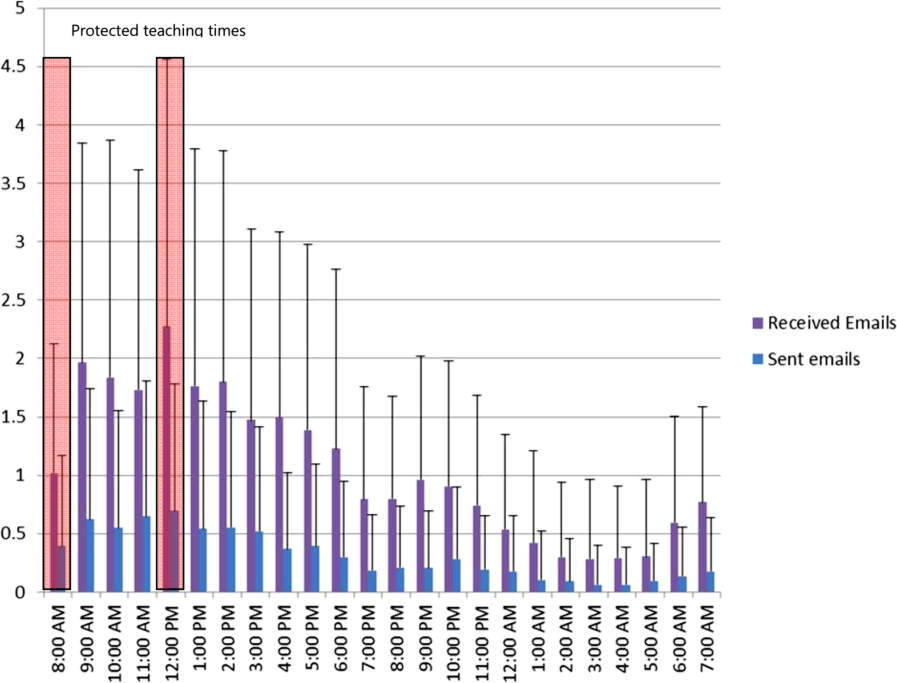
Supervision
Smartphone communication appeared to positively impact trainee supervision. Increased connectedness between team members allowed junior trainees to have access and rapidly communicate with a more experienced clinician, which provided them with greater support. Residents found smartphones particularly useful in situations where they felt uncomfortable or where they did not feel competent. Some of these instances related to procedural competence, with residents feeling more comfortable knowing they have rapid access to support (Box 3: increased support).
Box
Supervision
Increased support
It makes me feel more comfortable in the sense that I can instantly make a call or a text and have a question answered if I need an answer. Or if it were an emergency having the ability to talk on the phone and be talked through an emergency situation, or a procedure for example like if you were in a remote area or the physician was in a remote area and you were in hospital and you would need some of that guidance or counselling, there's no substitution. (Interview Medical Student 1)
I'm ready can u dblchk [sic] that I landmarked correctly. (Email from Junior to Senior)
MD3 returns to the patient's room to do a paracentesis with [junior resident]. He calls on his BB to [senior resident] to inform her that they are starting and then hangs up. [Senior resident] arrives at the patient's room. (Field Notes, Workshadowing MD3)
Decreased autonomy
The difference with the Blackberry is they're more likely to say By the way, this happened. Should I do this?' And I write back Yes', No.' If they didn't have that contact like I said they probably would have done something and then because they're making a decision on their own they could very easily have spent the time to research whatever to figure whether that was the right thing to do before doing it. Now they have an outlet where they can pass an idea off of me and then have me make, it's easier for me to make a decision for them. So that can negatively impact education. (Interview Attending 1)
What do I do for a high phosphate?(Email from Junior to Senior)
Hey Pt X's k is 5.5. Was going to shift her. What do u think? (Email from Junior to Senior)
You probably saw the hb 92. Let's give prbc asap while he's on HD.(Email from Staff to Residents on the team)
hb‐ hemoglobin, prbc packed red blood cells, HD ‐ hemodialysis
Hi. Just checking the bloodwork. What is happening to ms X? [sic] Creatinine rising still. Is a foley in? Urology reconsulted? (Email from Attending Staff to Junior Resident)
On the other hand, supervisors perceived that the easy rapid access afforded by smartphone use lowered the threshold for trainees to contact them. In some instances, these attending physicians felt that their trainees would text them for advice when they could have looked up the information themselves. As a result, the increased reliance on the attending physician's input prior to committing to a management plan decreased the trainee's autonomy and independent decision making (Box 3: decreased autonomy). In addition to trainee requests for increased staff involvement, smartphone use made it easier for attending physicians to initiate text messages to their residents as well. In some instances, staff physicians adopted a more hands‐on approach by directing their residents on how to manage their patients. It is unclear if trainees perceived this taking over of care as negatively influencing their education.
Teaching
Medical teams also frequently used smartphones to communicate the location and timing of educational rounds. We observed instances where residents communicated updated information relating to scheduled rounds, as well as for informing team members about spontaneous teaching sessions (Box 4: communicating rounds). Despite this initial benefit, staff physicians worried that interruptions resulting from smartphone use during educational sessions lowered the effectiveness of these sessions for all learners by creating a fragmented learning experience (Box 4: fragmented learning). Our data indicated that residents carrying the team smartphones received and sent a high number of e‐mails throughout the day, which continued at a similar rate during the protected educational time (Figure 2). Additionally, some of the teaching experiences that traditionally would occur in a face‐to‐face manner appeared to have migrated to text‐based interactions. It is unclear whether trainees perceive these text‐based interactions as more or less effective teaching encounters (Box 4: text‐based teaching).
Box
Teaching
Communicating rounds
One is that they can more efficiently communicate about the timing and location of education rounds in case they forget or sort of as an organizer for them (Interview Attending 3)
Physical Exam rounds is at 1:00 outside the morning report room. K. has kindly volunteered! If you miss us then the exam will be on the 3rd floor in room X. Pt X. See you there (Email from chief medical resident to trainees)
Fragmented learning
Because Blackberry is there, it's something that is potentially time occupying and can take the attention away from things and this is true of any Blackberries. People who have Blackberries they always look at their Blackberries so, you know, there are times when I'm sitting face to face with people and residents are looking at their Blackberries. So it's another way that they can be distracted. (Interview Attending 1).
I've seen that be an issue. I've certainly seen them losing concentration during a teaching session because they're being Blackberried, getting Blackberry messages. (Interview Attending 3)
2:06 Team meeting with Attending in a conference room.
2:29 Team BlackBerry (BB) beeps. Senior glances at BB. She dials a number on the Team BB. Speaks on the Team BB and turns to [Junior resident] to inform her that the family is here. She returns to the caller. Senior then hangs up and resumes to her teaching.
2:35 Attending's BB rings. She takes a look and ends the BB call.
2:39 Senior's BB rings. Senior picks up and talks about a patient's case and condition. Senior turns to [junior resident] and asks a question. Team members resume talking among themselves.
2:46 Senior hangs up on the phone call.
2:49 Team discusses another patient's condition/case.
2:57 Junior resident uses her BB to text.
3:02 Team BB beeps. It is a message about a patient's case.
3:05 Meeting ends. (Field Note excerpts, Work‐shadowing MD6)
Text‐based teaching
The resident would get very frustrated with how many questions we have once we've started. Like if three different medical students or four different medical students or four different places all texting him with, oh by the way, what does this stand for?, and he's responding to each of them individually then he has to answer it four different times as opposed to just in person when he can get us all together in a group and it's actually a learning experience. If questions are answered in an email, it's not really helpful for the rest of us. (Interview, medical student SB1)
That would be a great unifying diagnosis, but there may be some underlying element of ROH/NASH also I would hold off on A/C as we do not know if he has varices. Will need to review noncontrast CT ?HCC. Thx (Email from Consulting Staff to Junior)
A/C anticoagulation, CT computed tomography, HCC‐ hepatocellular carcinoma, NASH non‐alcoholic steatohepatitis, ROH alcohol
Professionalism
Our data revealed that smartphone interruptions occurred during teaching rounds and interactions with patients and with other clinical staff. Often these interruptions involved messages or phone calls pertaining to clinical concerns or tasks that nurses communicated to the residents via their smartphone (Box 5). Yet, by responding to these interruptions and initiating communications on their smartphones during patient care encounters and formal teaching sessions, trainees were perceived by other clinicians who were in attendance with them as being rude or disrespectful. Attending staff also tended to role model similar smartphone behaviors. Although we did not specifically work‐shadow attending staff, we did observe frequent usage of their personal smartphones during their interactions with residents.
Box
Professionalism
I don't like it when I see them checking messages when you're trying to talk to them. I think you're losing some of that communication sort of polite behaviour that maybe we knew a little bit more before all this texting and Blackberry. (Interview Allied Health 5)
I think that the etiquette of the Blackberry can be offensive, could be offensive especially with some of our older patients (Interview Allied Health 6)
Senior walks out of the patient's room while typing on the BlackBerry. She finishes typing and returns to the room at 5:36. Senior looks at her BlackBerry and starts typing inside the room in front of the patient. She paused to look at the patient and the resident doing the procedure [paracentesis]. She resumes texting again and walks out of the room at 5:38. Another resident walks out and Senior speaks with the resident. Senior returns to the room and speaks with the patient. She asks the patient if he has ever gotten a successful tap before. Senior looks at her BlackBerry and starts typing. (Field NotesWork‐shadowing MD2)
I think it is almost completely negative in terms of its medical education [Any positive] factors are grossly outweighed by the significant disruptions to their ability to concentrate and participate in the educational session. And I think almost to some extent it's an implicit permission that gets granted to the house staff to disrupt their own teaching experience and disrupt others around them because everybody is doing it because everybody is being Blackberried. So it almost becomes the new social norm and while that may be a new social norm I'm not sure that that's a good thing How big is the negative impact? That's much harder to say. It's probably not a big impact on top of the endless other disruptions in the day to teaching, but it is measurable because it's a new factor so it's observable by me on top of all the other factors which have been there for years. (Interview Attending 3)
2:10‐Attending goes to the whiteboard to teach research methods to the team. Spotted Medical student#1 looking at his IPhone and typing.
2:15‐Med student#1 using the calculator function on his IPhone.
2:20‐Attending glances at his BB quickly.
2:28‐Attending resumes discussion of the patients' cases (Field notes, Work‐shadowing MD7).
DISCUSSION
The educational impacts of smartphone use for communication appear to center on increased connectedness of medical trainees and increased interruptions, which have positive and negative impacts in the areas of teaching, supervision, and professionalism. Smartphone communication provided potential educational benefits through (1) safer supervision with rapid access to help and (2) easier coordination of teaching sessions. Threats to the educational experience included (1) a high level of interruptions to both teachers and learners, which may reduce the effectiveness of formal and informal teaching; (2) replacement of face‐to‐face teaching with texting; (3) a potential erosion of autonomy and independence due to easy access to supervisors and easy ability for supervisors to take over; and (4) professionalism issues with difficulties balancing between clinical service demands and communication during patient and interprofessional encounters.
This study is the first to describe the intersection of clinical communication with smartphones and medical education. A recent study found that residents reported high use of smartphones during rounds for patient care as well as personal issues.[13] We have previously described the perceived impacts of smartphones on clinical communication, which included improved efficiency but concerns for increased interruptions and threats to professionalism.[6] We also observed that sites that used smartphones had increased interruptions compared to those with just pagers.[10] We have also described the content of e‐mail messages between clinicians and found that all e‐mails from nurses to physicians involved clinical care, but e‐mail exchanges between physicians were split between clinical care (60.4%), coordination within the team (53.5%), medical education (9.4%), and social communication (3.9%).[14] This study adds to the literature by focusing on the impacts of smartphone use to medical education and describing the perceived and observed impacts. This study provides a further example of how healthcare information technology can cause unintended consequences on medical education and appear to relate to the linked impacts of increased connectivity and the increased interruptions.[3] In essence, the trainee becomes more global, less local. Being more global translates to increased connections with people separated in physical space. Yet, this increased global connectedness resulted in the trainee being less local, with attention diverted elsewhere, taking away from the quality of patient interactions and interactions with other interprofessional team members. It also reduces the effectiveness of educational sessions for all participants. Although the level of supervision and autonomy are independently related, being too connected to supervisors may lower trainee autonomy by reducing independent thinking around patient issues.[15] It may also move teaching and learning from face‐to‐face conversations to text‐based messages. Although there have been existing tensions between service delivery and medical education, increased connectedness may tilt the balance toward the demands of service delivery and efficiency optimization at the expense of the educational experience. Finally, smartphone use appeared to create an internal tension among trainees, who have to juggle balancing professional behaviors and expectations in their dual role as learner and care provider; it would be educationally unprofessional to interrupt a teaching session and respond to a text message. However, failing to respond to a nurse who has sent a message and is expecting a response would be clinically unprofessional.
To address these threats, we advocate improving systems and processes to reduce interruptions and provide education on the tensions created by increased connectedness. Smarter communication systems could limit interrupting messages to urgent messages and queue nonurgent messages.[16] They could also inform senders about protected educational time. Even more sophisticated systems could inform the sender on the status of the receiver. For example, systems could indicate if they are available or if they are busy in an educational session or an important meeting with a patient and their family. Processes to reduce interruptions include interprofessional consensus on what constitutes an urgent issue and giving explicit permission to learners to ignore their smartphones during educational sessions except for critical communications purposes. Finally, education around smartphone communication for both learners and teachers may help minimize threats to learner autonomy, to face‐to‐face teaching, and to professionalism.[17]
Our study has several limitations. We derived this information from a general study of the impact of smartphones on clinical communication. Our study can be seen as hypothesis generating, and further research is warranted to validate these findings. There may be limits to generalizability as all sites adopted similar communication processes that included centralizing communications to make it easier for senders to reach a responsible physician.
In conclusion, we have provided a summary of the impact of rapidly emerging information technology on the educational experience of medical trainees and identified both positive and negative impacts. Of note, the negative impacts appear to be related to being more global and less local and high interruptions. Further research is required to confirm these unintended consequences as well as to develop solutions to address them. Educators should be aware of these findings and the need to develop curriculum to address and manage the negative impacts of smartphone use in the clinical training environment.
Acknowledgments
Disclosure: Nothing to report.
- , . Smartphone app use among medical providers in ACGME training programs. J Med Syst. 2012;36:3135–3139.
- , , , et al. The use of smartphones for clinical communication on internal medicine wards. J Hosp Med. 2010;5:553–559.
- , , , , , . Anticipating and addressing the unintended consequences of health IT and policy: a report from the AMIA 2009 Health Policy Meeting. J Am Med Inform Assoc. 2011;18(1):82–90.
- , , , , . Types of unintended consequences related to computerized provider order entry. J Am Med Inform Assoc. 2006;13(5):547–556.
- , , , . “e‐Iatrogenesis”: the most critical unintended consequence of CPOE and other HIT. J Am Med Inform Assoc. 2007;14(3):387–388.
- , , , et al. An evaluation of the use of smartphones to communicate between clinicians: a mixed‐methods study. J Med Internet Res. 2011;13(3):e59.
- . Smartphones in clinical practice, medical education, and research. Arch Intern Med. 2011;171(14):1294–1296.
- , , , . Use of handheld computers in medical education. A systematic review. J Gen Intern Med. 2006;21(5):531–537.
- , , , . A review and a framework of handheld computer adoption in healthcare. Int J Med Inform. 2005;74(5):409–422.
- , , , et al. The intended and unintended consequences of communication systems on General Internal Medicine inpatient care delivery: a prospective observational case study of five teaching hospitals [published online ahead of print January 25, 2013]. J Am Med Inform Assoc. doi:10.1136/amiajnl‐2012‐001160.
- , , , , . Hospital doctors' workflow interruptions and activities: an observation study. BMJ Qual Saf. 2011;20(6):491–497.
- , , , et al. Computerised provider order entry and residency education in an academic medical centre. Med Educ. 2012;46:795–806.
- , , , . Smartphone use during inpatient attending rounds: Prevalence, patterns and potential for distraction. J Hosp Med. 2012;7(8):595–599.
- , , , et al. Understanding interprofessional communication: a content analysis of email communications between doctors and nurses. Applied Clinical Informatics. 2012;3:38–51.
- , , , . Preserving professional credibility: grounded theory study of medical trainees' requests for clinical support. BMJ. 2009;338:b128.
- , , , , . Beyond paging: building a web‐based communication tool for nurses and physicians. J Gen Intern Med. 2009;24(1):105–110.
- , . Distracted doctoring: smartphones before patients? CMAJ. 2012;184:1440.
Medical residents are rapidly adopting smartphones. Recent statistics revealed that 85% of medical providers currently own a smartphone, and the majority use it in their clinical work.[1] Smartphone capabilities that include the use of text messaging, e‐mail, and mobile phone functions in the clinical setting may improve efficiency and quality of care by reducing the response time for urgent issues.[2] There is, however, increasing recognition that healthcare information technology can create unintended negative consequences. For example, studies have suggested that healthcare information technologies, such as the computerized physician order entry, may actually increase errors by creating new work, changing clinical workflow, and altering communication patterns.[3, 4, 5]
Smartphone use for clinical communication can have unintended consequences by increasing interruptions, reducing interprofessional relationships, and widening the gap between what nurses and physicians perceive as urgent clinical problems.[6] However, no studies have evaluated the impact of smartphones on the educational experience of medical trainees. Although previous studies have described the use of smartphones by trainees for rapid access to electronic medical resources,[7, 8, 9] we did not identify in our literature review any previous studies on the impact of using the smartphone's primary functionas a communication deviceon the educational experience of residents and medical students. Therefore, our study aimed to examine the impact of using smartphones for clinical communication on medical education.
METHODS
Design
The design of the study was qualitative research methodology using interview data, ethnographic data, and content analysis of text‐based messages.
Setting
From June 2009 to September 2010, we conducted a multisite evaluation study on general internal medicine (GIM) wards at 5 large academic teaching hospitals in the city of Toronto, Canada at St. Michael's Hospital, Sunnybrook Health Sciences Centre, Toronto General Hospital, Toronto Western Hospital, and Mount Sinai Hospital. Each hospital has clinical teaching units consisting typically of 4 medical teams. Each team includes 1 attending physician, 1 senior resident, 2 or more junior residents, and 2 to 4 medical students. Each hospital had 2 to 4 GIM wards in different geographic locations.
Communication Systems
To make it easier for nurses and other health professionals to communicate with the physician teams, all sites centralized communication to 1 team member, who acts as the single point of contact on behalf of their assigned team in the communication of patient‐related issues. We facilitated this communication through a shared device (either a pager or a smartphone). The senior resident typically carried the shared device during the day and the on‐call junior resident at night and on the weekends. Two hospitals provided smartphones to all residents, whereas a third site provided smartphones only to the senior residents. The standard processes of communication required that physicians respond to all calls and text messages. At the 3 sites with institutional smartphones, nurses could send text messages with patient information using a Web‐based system. We encrypted data sent to institutional smartphones to protect patient information.
Data Collection
Using a mixed‐methods ethnographic approach, we collected data using semistructured interviews, ethnographic observations, and content analysis of text messages. The original larger study focused primarily on examining the overall clinical impact of smartphone use.[10] For our current study, we analyzed the data with a focus on evaluating the impact of smartphones on the educational experience of medical trainees on the GIM teaching service. The respective institutions' research ethics boards approved the study.
Interviews
We conducted semistructured interviews with residents, medical students, attending physicians, and other clinicians across all of the sites to examine how clinicians perceived the impact of smartphones on medical education. We used a purposeful sampling strategy where we interviewed different groups of healthcare professionals who we suspected would represent different viewpoints on the use of smartphones for clinical communication. To obtain diverse perspectives, we snowball sampled by asking interviewees to suggest colleagues with differing views to participate in the interviews. The interview guide consisted of open‐ended questions with additional probes to elicit more detailed information from these frontline clinicians who initiate and receive communication. One of the study investigators (V.L.) conducted interviews that varied from 15 to 45 minutes in duration. We recorded, transcribed verbatim, and analyzed the interviews using NVivo software (QSR International, Doncaster, Victoria, Australia). We added additional questions iteratively as themes emerged from the initial interviews. One of the study investigators (V.L.) encouraged participants to speak freely, to raise issues that they perceived to be important, and to support their responses with examples.
Observations
We observed the communication processes in the hospitals by conducting a work‐shadowing approach that followed individual residents in their work environments. These observations included 1‐on‐1 supervision encounters involving attending staff, medical students, and other residents, and informal and formal teaching rounds. The observation periods included the usual working day (from 8 am to 6 pm) as well as the busiest times on call, typically from 6 pm until 11 pm. We sampled different residents for different time periods. We adopted a nonparticipatory observation technique where we observed all interruptions, communication interactions, and patterns from a distance. We defined workflow interruptions as an intrusion of an unplanned and unscheduled task, causing a discontinuation of tasks, a noticeable break, or task switch behaviour.[11] Data collection included timing of events and writing field notes. One of the study investigators (V.L.) performed all the work‐shadowing observations.
E‐mail
To study the volume and content of messages, we collected e‐mail communications between January 2009 and June 2009 from consenting residents at the 2 hospitals that provided smartphones to all GIM residents. E‐mail information included the sender, the receiver, the time of message, and the message content. To look at usage, we calculated the average number of e‐mails sent and received. To assess interruptions on formal teaching sessions, we paid particular attention to e‐mails received and sent during protected educational timeweekdays from 8 am to 9 am (morning report) and 12 pm to 1 pm (noon rounds). We randomly sampled 20% of all e‐mails sent between residents for content analysis and organized content related to medical education into thematic categories.
Analysis
We used a deductive approach to analyze the interview transcripts by applying a conceptual framework that assessed the educational impact of patient safety interventions.[12] This framework identified 5 educational domains (learning, teaching, supervision, assessment, and feedback). Three study investigators mapped interview data, work‐shadowing data, and e‐mail content to themes (V.L., B.W., and R.W.), and grouped data that did not translate into themes into new categories. We then triangulated the data to develop themes of the educational impact of smartphone communication by both perceived use and actual use, and subsequently constructed a framework of how smartphone communication affected education.
RESULTS
We conducted 124 semistructured interviews with residents, medical students, attending physicians, and other clinicians across all the sites to examine how clinicians perceived the impact of smartphones on medical education. We work‐shadowed 40 individual residents for a total of 196 hours (Table 1). We analyzed the 13,714 e‐mails sent from or received to 34 residents. To analyze e‐mail content, we reviewed 1179 e‐mails sent among residents.
| Methods | Sites | |||||
|---|---|---|---|---|---|---|
| St. Michael's Hospital | Sunnybrook Health Sciences Centre | Toronto General Hospital | Toronto Western Hospital | Mount Sinai Hospital | All Hospitals | |
| ||||||
| Work‐shadowing residents | ||||||
| Hours | 60 hours | 35 hours | 57 hours 55 minutes | 27 hours 46 minutes | 15 hours | 196 hours |
| No. of residents | 12 | 7 | 12 | 6 | 3 | 40 |
| Interviews with clinicians | ||||||
| Physicians | 10 | 5 | 13 | 5 | 33 | |
| Medical students | 5 | 4 | 1 | 1 | 11 | |
| Nurses | 9 | 11 | 15 | 14 | 49 | |
| Other health professionsa | 7 | 10 | 8 | 6 | 31 | |
| Total | 31 | 30 | 37 | 26 | 124 | |
We found that 2 key characteristics of smartphone use for clinical communication, namely an increase in connectedness leading to an increase in interruptions, impacted 3 educational domains: teaching, supervision, and professionalism (Figure 1).
Increased Connectedness
As a communication device, smartphones increase the ability to receive and respond to messages through voice, e‐mail, and text messaging. Not surprisingly, with the improved ability and mobility to communicate, medical trainees perceived being more connected with their team members, who included other residents, medical students, and attending staff as well as with other clinical services and professions. These smartphone communication activities appeared to be pervasive, occurring on the wards, at the bedside, while in transit, and in teaching sessions (Box 1: increased connectedness).
Box
Increased connectedness
I've used the Blackberry system and it's nice to be able to quickly text each other little messages especially for meeting times because then you don't have to page them and wait by the phone. So that's been great for in the team. (Interview Resident 3)
It's incredibly useful for when you're paging somebody else. Often times I'll be consulting with another physician on a patient and I'll say This is my BlackBerry. Call me back after you've seen the patient' or Call me back when you have a plan' or, you know, whatever. So that's extremely valuable which we never had with pages and no one would ever page you for that because it was too much of a pain. (Interview Resident 1)
My personal experience has been that if you need to speak to a more senior individual it's much easier to contact them via the BlackBerry. (Interview Medical Student 1)
At 7:25 pm, MD11 returns to the patient's room and continues examining her. While in the patient's room, I could see her talking on the BlackBerrys. I asked her later what calls she had while in the room. It turns out she had 3 phone calls and 2 texts. Two of the calls were from the radiation oncologists and 1 call from the pathologist. She also received 1 text on the Team BlackBerry and 1 text on the Senior's BlackBerry from the pharmacist. (Field Notes, Work-shadowing MD11)
Interruptions
The increased connectedness caused by smartphone use led residents to perceive an increase in the frequency of interruptions. The multitude of communication and contact options made available by smartphones to health providers created an expansive network of connected individuals who were in constant communication with each other. Instead of the difficulties associated with numeric paging and waiting for a response, nurses typically found it easier to call directly or send a text message to residents' smartphones. From the e‐mail analysis, residents received, on a daily basis, on average 25.7 e‐mails, (median, 20; interquartile range [IQR]: 1428) to the team smartphone and sent 7.5 e‐mails (median, 6; IQR: 410). During protected educational time, each resident received an average of 1.0 e‐mail (median, 1; IQR: 01) between 8 am and 9 am and an average of 2.3 e‐mails (median, 2; IQR: 13) during 12 pm to 1 pm (Figure 2). Each of these communication events, whether a phone call, e‐mail, or text‐message, led to an interruption (Box 2). Given that smartphones made it easier for nurses to contact residents, some residents attributed the increase in interruptions to a reduction in the threshold for nurses to communicate.
Box
Increased interruptions
The only negative I can think of is just the incredible number of communications that you get, you know, text messages and e‐mails and everything else. So just the, the number can sometimes be overwhelming. (Interview Resident 1)
Some of [the nurses] rely a little bit more on the BlackBerry so that they will tend to call you a bit more frequently for things that maybe sometimes they should try to find answer for themselves (Interview Resident 2)
And now with the option of being able to, if you really needed to, call them and talk to them directly, I think that kind of improves communication. They're easier to find. (Interview Nurse 4)
Supervision
Smartphone communication appeared to positively impact trainee supervision. Increased connectedness between team members allowed junior trainees to have access and rapidly communicate with a more experienced clinician, which provided them with greater support. Residents found smartphones particularly useful in situations where they felt uncomfortable or where they did not feel competent. Some of these instances related to procedural competence, with residents feeling more comfortable knowing they have rapid access to support (Box 3: increased support).
Box
Supervision
Increased support
It makes me feel more comfortable in the sense that I can instantly make a call or a text and have a question answered if I need an answer. Or if it were an emergency having the ability to talk on the phone and be talked through an emergency situation, or a procedure for example like if you were in a remote area or the physician was in a remote area and you were in hospital and you would need some of that guidance or counselling, there's no substitution. (Interview Medical Student 1)
I'm ready can u dblchk [sic] that I landmarked correctly. (Email from Junior to Senior)
MD3 returns to the patient's room to do a paracentesis with [junior resident]. He calls on his BB to [senior resident] to inform her that they are starting and then hangs up. [Senior resident] arrives at the patient's room. (Field Notes, Workshadowing MD3)
Decreased autonomy
The difference with the Blackberry is they're more likely to say By the way, this happened. Should I do this?' And I write back Yes', No.' If they didn't have that contact like I said they probably would have done something and then because they're making a decision on their own they could very easily have spent the time to research whatever to figure whether that was the right thing to do before doing it. Now they have an outlet where they can pass an idea off of me and then have me make, it's easier for me to make a decision for them. So that can negatively impact education. (Interview Attending 1)
What do I do for a high phosphate?(Email from Junior to Senior)
Hey Pt X's k is 5.5. Was going to shift her. What do u think? (Email from Junior to Senior)
You probably saw the hb 92. Let's give prbc asap while he's on HD.(Email from Staff to Residents on the team)
hb‐ hemoglobin, prbc packed red blood cells, HD ‐ hemodialysis
Hi. Just checking the bloodwork. What is happening to ms X? [sic] Creatinine rising still. Is a foley in? Urology reconsulted? (Email from Attending Staff to Junior Resident)
On the other hand, supervisors perceived that the easy rapid access afforded by smartphone use lowered the threshold for trainees to contact them. In some instances, these attending physicians felt that their trainees would text them for advice when they could have looked up the information themselves. As a result, the increased reliance on the attending physician's input prior to committing to a management plan decreased the trainee's autonomy and independent decision making (Box 3: decreased autonomy). In addition to trainee requests for increased staff involvement, smartphone use made it easier for attending physicians to initiate text messages to their residents as well. In some instances, staff physicians adopted a more hands‐on approach by directing their residents on how to manage their patients. It is unclear if trainees perceived this taking over of care as negatively influencing their education.
Teaching
Medical teams also frequently used smartphones to communicate the location and timing of educational rounds. We observed instances where residents communicated updated information relating to scheduled rounds, as well as for informing team members about spontaneous teaching sessions (Box 4: communicating rounds). Despite this initial benefit, staff physicians worried that interruptions resulting from smartphone use during educational sessions lowered the effectiveness of these sessions for all learners by creating a fragmented learning experience (Box 4: fragmented learning). Our data indicated that residents carrying the team smartphones received and sent a high number of e‐mails throughout the day, which continued at a similar rate during the protected educational time (Figure 2). Additionally, some of the teaching experiences that traditionally would occur in a face‐to‐face manner appeared to have migrated to text‐based interactions. It is unclear whether trainees perceive these text‐based interactions as more or less effective teaching encounters (Box 4: text‐based teaching).
Box
Teaching
Communicating rounds
One is that they can more efficiently communicate about the timing and location of education rounds in case they forget or sort of as an organizer for them (Interview Attending 3)
Physical Exam rounds is at 1:00 outside the morning report room. K. has kindly volunteered! If you miss us then the exam will be on the 3rd floor in room X. Pt X. See you there (Email from chief medical resident to trainees)
Fragmented learning
Because Blackberry is there, it's something that is potentially time occupying and can take the attention away from things and this is true of any Blackberries. People who have Blackberries they always look at their Blackberries so, you know, there are times when I'm sitting face to face with people and residents are looking at their Blackberries. So it's another way that they can be distracted. (Interview Attending 1).
I've seen that be an issue. I've certainly seen them losing concentration during a teaching session because they're being Blackberried, getting Blackberry messages. (Interview Attending 3)
2:06 Team meeting with Attending in a conference room.
2:29 Team BlackBerry (BB) beeps. Senior glances at BB. She dials a number on the Team BB. Speaks on the Team BB and turns to [Junior resident] to inform her that the family is here. She returns to the caller. Senior then hangs up and resumes to her teaching.
2:35 Attending's BB rings. She takes a look and ends the BB call.
2:39 Senior's BB rings. Senior picks up and talks about a patient's case and condition. Senior turns to [junior resident] and asks a question. Team members resume talking among themselves.
2:46 Senior hangs up on the phone call.
2:49 Team discusses another patient's condition/case.
2:57 Junior resident uses her BB to text.
3:02 Team BB beeps. It is a message about a patient's case.
3:05 Meeting ends. (Field Note excerpts, Work‐shadowing MD6)
Text‐based teaching
The resident would get very frustrated with how many questions we have once we've started. Like if three different medical students or four different medical students or four different places all texting him with, oh by the way, what does this stand for?, and he's responding to each of them individually then he has to answer it four different times as opposed to just in person when he can get us all together in a group and it's actually a learning experience. If questions are answered in an email, it's not really helpful for the rest of us. (Interview, medical student SB1)
That would be a great unifying diagnosis, but there may be some underlying element of ROH/NASH also I would hold off on A/C as we do not know if he has varices. Will need to review noncontrast CT ?HCC. Thx (Email from Consulting Staff to Junior)
A/C anticoagulation, CT computed tomography, HCC‐ hepatocellular carcinoma, NASH non‐alcoholic steatohepatitis, ROH alcohol
Professionalism
Our data revealed that smartphone interruptions occurred during teaching rounds and interactions with patients and with other clinical staff. Often these interruptions involved messages or phone calls pertaining to clinical concerns or tasks that nurses communicated to the residents via their smartphone (Box 5). Yet, by responding to these interruptions and initiating communications on their smartphones during patient care encounters and formal teaching sessions, trainees were perceived by other clinicians who were in attendance with them as being rude or disrespectful. Attending staff also tended to role model similar smartphone behaviors. Although we did not specifically work‐shadow attending staff, we did observe frequent usage of their personal smartphones during their interactions with residents.
Box
Professionalism
I don't like it when I see them checking messages when you're trying to talk to them. I think you're losing some of that communication sort of polite behaviour that maybe we knew a little bit more before all this texting and Blackberry. (Interview Allied Health 5)
I think that the etiquette of the Blackberry can be offensive, could be offensive especially with some of our older patients (Interview Allied Health 6)
Senior walks out of the patient's room while typing on the BlackBerry. She finishes typing and returns to the room at 5:36. Senior looks at her BlackBerry and starts typing inside the room in front of the patient. She paused to look at the patient and the resident doing the procedure [paracentesis]. She resumes texting again and walks out of the room at 5:38. Another resident walks out and Senior speaks with the resident. Senior returns to the room and speaks with the patient. She asks the patient if he has ever gotten a successful tap before. Senior looks at her BlackBerry and starts typing. (Field NotesWork‐shadowing MD2)
I think it is almost completely negative in terms of its medical education [Any positive] factors are grossly outweighed by the significant disruptions to their ability to concentrate and participate in the educational session. And I think almost to some extent it's an implicit permission that gets granted to the house staff to disrupt their own teaching experience and disrupt others around them because everybody is doing it because everybody is being Blackberried. So it almost becomes the new social norm and while that may be a new social norm I'm not sure that that's a good thing How big is the negative impact? That's much harder to say. It's probably not a big impact on top of the endless other disruptions in the day to teaching, but it is measurable because it's a new factor so it's observable by me on top of all the other factors which have been there for years. (Interview Attending 3)
2:10‐Attending goes to the whiteboard to teach research methods to the team. Spotted Medical student#1 looking at his IPhone and typing.
2:15‐Med student#1 using the calculator function on his IPhone.
2:20‐Attending glances at his BB quickly.
2:28‐Attending resumes discussion of the patients' cases (Field notes, Work‐shadowing MD7).
DISCUSSION
The educational impacts of smartphone use for communication appear to center on increased connectedness of medical trainees and increased interruptions, which have positive and negative impacts in the areas of teaching, supervision, and professionalism. Smartphone communication provided potential educational benefits through (1) safer supervision with rapid access to help and (2) easier coordination of teaching sessions. Threats to the educational experience included (1) a high level of interruptions to both teachers and learners, which may reduce the effectiveness of formal and informal teaching; (2) replacement of face‐to‐face teaching with texting; (3) a potential erosion of autonomy and independence due to easy access to supervisors and easy ability for supervisors to take over; and (4) professionalism issues with difficulties balancing between clinical service demands and communication during patient and interprofessional encounters.
This study is the first to describe the intersection of clinical communication with smartphones and medical education. A recent study found that residents reported high use of smartphones during rounds for patient care as well as personal issues.[13] We have previously described the perceived impacts of smartphones on clinical communication, which included improved efficiency but concerns for increased interruptions and threats to professionalism.[6] We also observed that sites that used smartphones had increased interruptions compared to those with just pagers.[10] We have also described the content of e‐mail messages between clinicians and found that all e‐mails from nurses to physicians involved clinical care, but e‐mail exchanges between physicians were split between clinical care (60.4%), coordination within the team (53.5%), medical education (9.4%), and social communication (3.9%).[14] This study adds to the literature by focusing on the impacts of smartphone use to medical education and describing the perceived and observed impacts. This study provides a further example of how healthcare information technology can cause unintended consequences on medical education and appear to relate to the linked impacts of increased connectivity and the increased interruptions.[3] In essence, the trainee becomes more global, less local. Being more global translates to increased connections with people separated in physical space. Yet, this increased global connectedness resulted in the trainee being less local, with attention diverted elsewhere, taking away from the quality of patient interactions and interactions with other interprofessional team members. It also reduces the effectiveness of educational sessions for all participants. Although the level of supervision and autonomy are independently related, being too connected to supervisors may lower trainee autonomy by reducing independent thinking around patient issues.[15] It may also move teaching and learning from face‐to‐face conversations to text‐based messages. Although there have been existing tensions between service delivery and medical education, increased connectedness may tilt the balance toward the demands of service delivery and efficiency optimization at the expense of the educational experience. Finally, smartphone use appeared to create an internal tension among trainees, who have to juggle balancing professional behaviors and expectations in their dual role as learner and care provider; it would be educationally unprofessional to interrupt a teaching session and respond to a text message. However, failing to respond to a nurse who has sent a message and is expecting a response would be clinically unprofessional.
To address these threats, we advocate improving systems and processes to reduce interruptions and provide education on the tensions created by increased connectedness. Smarter communication systems could limit interrupting messages to urgent messages and queue nonurgent messages.[16] They could also inform senders about protected educational time. Even more sophisticated systems could inform the sender on the status of the receiver. For example, systems could indicate if they are available or if they are busy in an educational session or an important meeting with a patient and their family. Processes to reduce interruptions include interprofessional consensus on what constitutes an urgent issue and giving explicit permission to learners to ignore their smartphones during educational sessions except for critical communications purposes. Finally, education around smartphone communication for both learners and teachers may help minimize threats to learner autonomy, to face‐to‐face teaching, and to professionalism.[17]
Our study has several limitations. We derived this information from a general study of the impact of smartphones on clinical communication. Our study can be seen as hypothesis generating, and further research is warranted to validate these findings. There may be limits to generalizability as all sites adopted similar communication processes that included centralizing communications to make it easier for senders to reach a responsible physician.
In conclusion, we have provided a summary of the impact of rapidly emerging information technology on the educational experience of medical trainees and identified both positive and negative impacts. Of note, the negative impacts appear to be related to being more global and less local and high interruptions. Further research is required to confirm these unintended consequences as well as to develop solutions to address them. Educators should be aware of these findings and the need to develop curriculum to address and manage the negative impacts of smartphone use in the clinical training environment.
Acknowledgments
Disclosure: Nothing to report.
- , . Smartphone app use among medical providers in ACGME training programs. J Med Syst. 2012;36:3135–3139.
- , , , et al. The use of smartphones for clinical communication on internal medicine wards. J Hosp Med. 2010;5:553–559.
- , , , , , . Anticipating and addressing the unintended consequences of health IT and policy: a report from the AMIA 2009 Health Policy Meeting. J Am Med Inform Assoc. 2011;18(1):82–90.
- , , , , . Types of unintended consequences related to computerized provider order entry. J Am Med Inform Assoc. 2006;13(5):547–556.
- , , , . “e‐Iatrogenesis”: the most critical unintended consequence of CPOE and other HIT. J Am Med Inform Assoc. 2007;14(3):387–388.
- , , , et al. An evaluation of the use of smartphones to communicate between clinicians: a mixed‐methods study. J Med Internet Res. 2011;13(3):e59.
- . Smartphones in clinical practice, medical education, and research. Arch Intern Med. 2011;171(14):1294–1296.
- , , , . Use of handheld computers in medical education. A systematic review. J Gen Intern Med. 2006;21(5):531–537.
- , , , . A review and a framework of handheld computer adoption in healthcare. Int J Med Inform. 2005;74(5):409–422.
- , , , et al. The intended and unintended consequences of communication systems on General Internal Medicine inpatient care delivery: a prospective observational case study of five teaching hospitals [published online ahead of print January 25, 2013]. J Am Med Inform Assoc. doi:10.1136/amiajnl‐2012‐001160.
- , , , , . Hospital doctors' workflow interruptions and activities: an observation study. BMJ Qual Saf. 2011;20(6):491–497.
- , , , et al. Computerised provider order entry and residency education in an academic medical centre. Med Educ. 2012;46:795–806.
- , , , . Smartphone use during inpatient attending rounds: Prevalence, patterns and potential for distraction. J Hosp Med. 2012;7(8):595–599.
- , , , et al. Understanding interprofessional communication: a content analysis of email communications between doctors and nurses. Applied Clinical Informatics. 2012;3:38–51.
- , , , . Preserving professional credibility: grounded theory study of medical trainees' requests for clinical support. BMJ. 2009;338:b128.
- , , , , . Beyond paging: building a web‐based communication tool for nurses and physicians. J Gen Intern Med. 2009;24(1):105–110.
- , . Distracted doctoring: smartphones before patients? CMAJ. 2012;184:1440.
© 2013 Society of Hospital Medicine