User login
Electrocardiographic changes of severe hyperkalemia
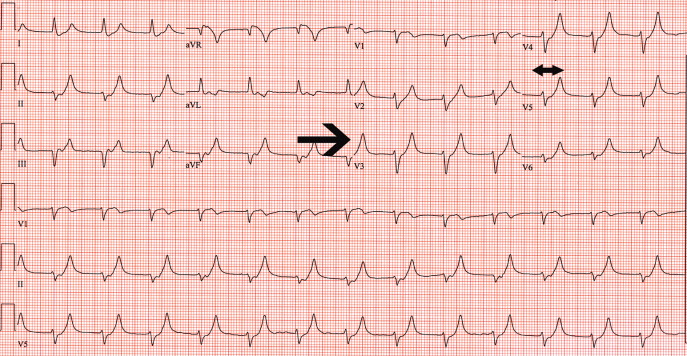
A 62‐year‐old woman with an extensive medical and surgical history presented with complaints of 2 days of weakness. Physical examination demonstrated a lethargic, but arousable woman in no distress. Her lower extremity motor strength was 4/5 bilaterally. The patient's electrocardiogram (ECG) demonstrated peaked T waves (Figure 1, arrow), absence of P waves, poor R wave progression and QRS interval widening (Figure 1, 2‐headed arrow.) Serum chemistries revealed a potassium level of 10.4 mmol/L and a creatinine of 0.9 mg/dL.

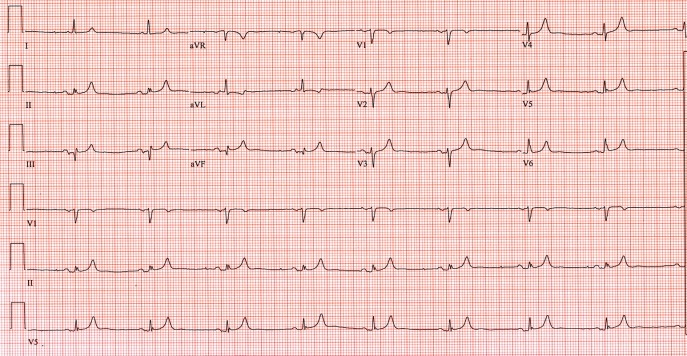
One ampule of D50, 10 units of insulin, 1 ampule of Calcium gluconate and 1 ampule of sodium bicarbonate were given intravenously along with oral Kayexalate. A repeat ECG showed a return of P waves, narrowing of the QRS interval, improved R wave progression and less peaking of the T waves (Figure 2). A repeat potassium level at that time was 9.2 mmol/L.

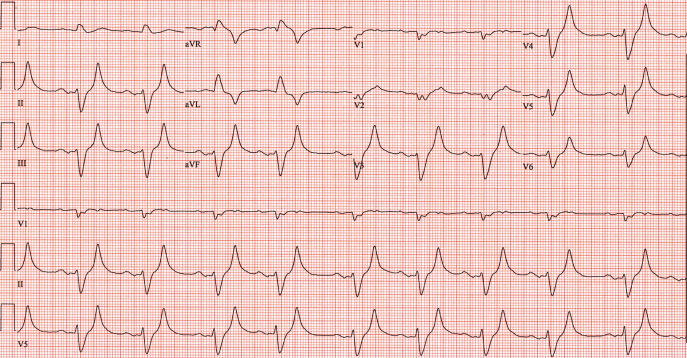
Despite continued therapy to lower the potassium, another ECG showed a return of peaked T waves, a prolonged PR interval and marked widening of the QRS interval to 205 msec; the potassium level was now 10.0 mmol/L (Figure 3).

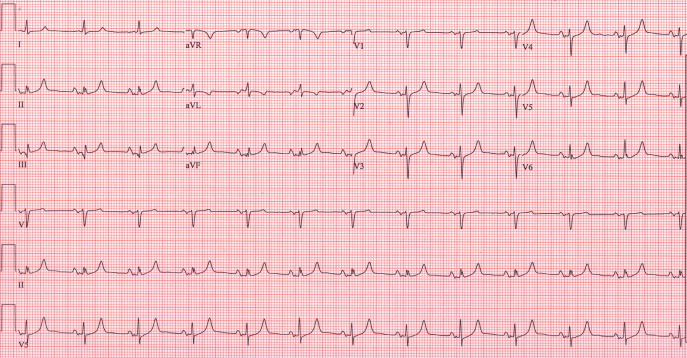
Despite the patient's renal function being normal, she was emergently dialyzed. After a single dialysis, the patient's potassium level remained normal for the remainder of the hospitalization and a follow‐up ECG returned to baseline (Figure 4). No physiologic explanation was found for her hyperkalemia and it was concluded, despite her denials, that she had taken large quantities of exogenous potassium she had available from previous prescriptions.

A 62‐year‐old woman with an extensive medical and surgical history presented with complaints of 2 days of weakness. Physical examination demonstrated a lethargic, but arousable woman in no distress. Her lower extremity motor strength was 4/5 bilaterally. The patient's electrocardiogram (ECG) demonstrated peaked T waves (Figure 1, arrow), absence of P waves, poor R wave progression and QRS interval widening (Figure 1, 2‐headed arrow.) Serum chemistries revealed a potassium level of 10.4 mmol/L and a creatinine of 0.9 mg/dL.

One ampule of D50, 10 units of insulin, 1 ampule of Calcium gluconate and 1 ampule of sodium bicarbonate were given intravenously along with oral Kayexalate. A repeat ECG showed a return of P waves, narrowing of the QRS interval, improved R wave progression and less peaking of the T waves (Figure 2). A repeat potassium level at that time was 9.2 mmol/L.

Despite continued therapy to lower the potassium, another ECG showed a return of peaked T waves, a prolonged PR interval and marked widening of the QRS interval to 205 msec; the potassium level was now 10.0 mmol/L (Figure 3).

Despite the patient's renal function being normal, she was emergently dialyzed. After a single dialysis, the patient's potassium level remained normal for the remainder of the hospitalization and a follow‐up ECG returned to baseline (Figure 4). No physiologic explanation was found for her hyperkalemia and it was concluded, despite her denials, that she had taken large quantities of exogenous potassium she had available from previous prescriptions.

A 62‐year‐old woman with an extensive medical and surgical history presented with complaints of 2 days of weakness. Physical examination demonstrated a lethargic, but arousable woman in no distress. Her lower extremity motor strength was 4/5 bilaterally. The patient's electrocardiogram (ECG) demonstrated peaked T waves (Figure 1, arrow), absence of P waves, poor R wave progression and QRS interval widening (Figure 1, 2‐headed arrow.) Serum chemistries revealed a potassium level of 10.4 mmol/L and a creatinine of 0.9 mg/dL.

One ampule of D50, 10 units of insulin, 1 ampule of Calcium gluconate and 1 ampule of sodium bicarbonate were given intravenously along with oral Kayexalate. A repeat ECG showed a return of P waves, narrowing of the QRS interval, improved R wave progression and less peaking of the T waves (Figure 2). A repeat potassium level at that time was 9.2 mmol/L.

Despite continued therapy to lower the potassium, another ECG showed a return of peaked T waves, a prolonged PR interval and marked widening of the QRS interval to 205 msec; the potassium level was now 10.0 mmol/L (Figure 3).

Despite the patient's renal function being normal, she was emergently dialyzed. After a single dialysis, the patient's potassium level remained normal for the remainder of the hospitalization and a follow‐up ECG returned to baseline (Figure 4). No physiologic explanation was found for her hyperkalemia and it was concluded, despite her denials, that she had taken large quantities of exogenous potassium she had available from previous prescriptions.

