User login
Real‐Time Patient Experience Surveys
In 2010, the Centers for Medicare and Medicaid Services implemented value‐based purchasing, a payment model that incentivizes hospitals for reaching certain quality and patient experience thresholds and penalizes those that do not, in part on the basis of patient satisfaction scores.[1] Although low patient satisfaction scores will adversely affect institutions financially, they also reflect patients' perceptions of their care. Some studies suggest that hospitals with higher patient satisfaction scores score higher overall on clinical care processes such as core measures compliance, readmission rates, lower mortality rates, and other quality‐of‐care metrics.[2, 3, 4, 5, 6, 7, 8, 9, 10, 11]
The Hospital Consumer Assessment of Healthcare Providers and Systems (HCAHPS) survey assesses patients' experience following their hospital stay.[1] The percent of top box scores (ie, response of always on a four point scale, or scores of 9 or 10 on a 10‐point scale) are utilized to compare hospitals and determine the reimbursement or penalty a hospital will receive. Although these scores are available to the public on the Hospital Compare website,[12] physicians may not know how their hospital is ranked or how they are individually perceived by their patients. Additionally, these surveys are typically conducted 48 hours to 6 weeks after patients are discharged, and the results are distributed back to the hospitals well after the time that care was provided, thereby offering providers no chance of improving patient satisfaction during a given hospital stay.
Institutions across the country are trying to improve their HCAHPS scores, but there is limited research identifying specific measures providers can implement. Some studies have suggested that utilizing etiquette‐based communication and sitting at the bedside[13, 14] may help improve patient experience with their providers, and more recently, it has been suggested that providing real‐time deidentified patient experience survey results with education and a rewards/emncentive system to residents may help as well.[15]
Surveys conducted during a patient's hospitalization can offer real‐time actionable feedback to providers. We performed a quality‐improvement project that was designed to determine if real‐time feedback to hospitalist physicians, followed by coaching, and revisits to the patients' bedside could improve the results recorded on provider‐specific patient surveys and/or patients' HCAHPS scores or percentile rankings.
METHODS
Design
This was a prospective, randomized quality‐improvement initiative that was approved by the Colorado Multiple Institutional Review Board and conducted at Denver Health, a 525‐bed university‐affiliated public safety net hospital. The initiative was conducted on both teaching and nonteaching general internal medicine services, which typically have a daily census of between 10 and 15 patients. No protocol changes occurred during the study.
Participants
Participants included all English‐ or Spanish‐speaking patients who were hospitalized on a general internal medicine service, had been admitted within the 2 days prior to enrollment, and had a hospitalist as their attending physician. Patients were excluded if they were enrolled in the study during a previous hospitalization, refused to participate, lacked capacity to participate, had hearing or speech impediments precluding regular conversation, were prisoners, if their clinical condition precluded participation, or their attending was an investigator in the project.
Intervention
Participants were prescreened by investigators by reviewing team sign‐outs to determine if patients had any exclusion criteria. Investigators attempted to survey each patient who met inclusion criteria on a daily basis between 9:00 am and 11:00 am. An investigator administered the survey to each patient verbally using scripted language. Patients were asked to rate how well their doctors were listening to them, explaining what they wanted to know, and whether the doctors were being friendly and helpful, all questions taken from a survey that was available on the US Department of Health and Human Services website (to be referred to as here forward daily survey).[16] We converted the original 5‐point Likert scale used in this survey to a 4‐point scale by removing the option of ok, leaving participants the options of poor, fair, good, or great. Patients were also asked to provide any personalized feedback they had, and these comments were recorded in writing by the investigator.
After being surveyed on day 1, patients were randomized to an intervention or control group using an automated randomization module in Research Electronic Data Capture (REDCap).[17] Patients in both groups who did not provide answers to all 3 questions that qualified as being top box (ie, great) were resurveyed on a daily basis until their responses were all top box or they were discharged, met exclusion criteria, or had been surveyed for a total of 4 consecutive days. In the pilot phase of this study, we found that if patients reported all top box scores on the initial survey their responses typically did not change over time, and the patients became frustrated if asked the same questions again when the patient felt there was not room for improvement. Accordingly, we elected to stop surveying patients when all top box responses were reported.
The attending hospitalist caring for each patient in the intervention group was given feedback about their patients' survey results (both their scores and any specific comments) on a daily basis. Feedback was provided in person by 1 of the investigators. The hospitalist also received an automatically generated electronic mail message with the survey results at 11:00 am on each study day. After informing the hospitalists of the patients' scores, the investigator provided a brief education session that included discussing Denver Health's most recent HCAHPS scores, value‐based purchasing, and the financial consequences of poor patient satisfaction scores. The investigator then coached the hospitalist on etiquette‐based communication,[18, 19] suggested that they sit down when communicating with their patients,[19, 20] and then asked the hospitalist to revisit each patient to discuss how the team could improve in any of the 3 areas where the patient did not give a top box score. These educational sessions were conducted in person and lasted a maximum of 5 minutes. An investigator followed up with each hospitalist the following day to determine whether the revisit occurred. Hospitalists caring for patients who were randomized to the control group were not given real‐time feedback or coaching and were not asked to revisit patients.
A random sample of patients surveyed for this initiative also received HCAHPS surveys 48 hours to 6 weeks following their hospital discharge, according to the standard methodology used to acquire HCAHPS data,[21] by an outside vendor contracted by Denver Health. Our vendor conducted these surveys via telephone in English or Spanish.
Outcomes
The primary outcome was the proportion of patients in each group who reported top box scores on the daily surveys. Secondary outcomes included the percent change for the scores recorded for 3 provider‐specific questions from the daily survey, the median top box HCAHPS scores for the 3 provider related questions and overall hospital rating, and the HCAHPS percentiles of top box scores for these questions.
Sample Size
The sample size for this intervention assumed that the proportion of patients whose treating physicians did not receive real‐time feedback who rated their providers as top box would be 75%, and that the effect of providing real‐time feedback would increase this proportion to 85% on the daily surveys. To have 80% power with a type 1 error of 0.05, we estimated a need to enroll 430 patients, 215 in each group.
Statistics
Data were collected and managed using a secure, Web‐based electronic data capture tool hosted at Denver Health (REDCap), which is designed to support data collection for research studies providing: (1) an intuitive interface for validated data entry, (2) audit trails for tracking data manipulation and export procedures, (3) automated export procedures for seamless data downloads to common statistical packages, and (4) procedures for importing data from external sources.[17]
A 2 test was used to compare the proportion of patients in the 2 groups who reported great scores for each question on the study survey on the first and last day. With the intent of providing a framework for understanding the effect real‐time feedback could have on patient experience, a secondary analysis of HCAHPS results was conducted using several different methods.
First, the proportion of patients in the 2 groups who reported scores of 9 or 10 for the overall hospital rating question or reported always for each doctor communication question on the HCHAPS survey was compared using a 2. Second, to allow for detection of differences in a sample with a smaller N, the median overall hospital rating scores from the HCAHPS survey reported by patients in the 2 groups who completed a survey following discharge were compared using a Wilcoxon rank sum test. Lastly, to place changes in proportion into a larger context (ie, how these changes would relate to value‐based purchasing), HCAHPS scores were converted to percentiles of national performance using the 2014 percentile rankings obtained from the external vendor that conducts the HCAHPS surveys for our hospital and compared between the intervention and control groups using a Wilcoxon rank sum test.
All comments collected from patients during their daily surveys were reviewed, and key words were abstracted from each comment. These key words were sorted and reviewed to categorize recurring key words into themes. Exemplars were then selected for each theme derived from patient comments.
RESULTS
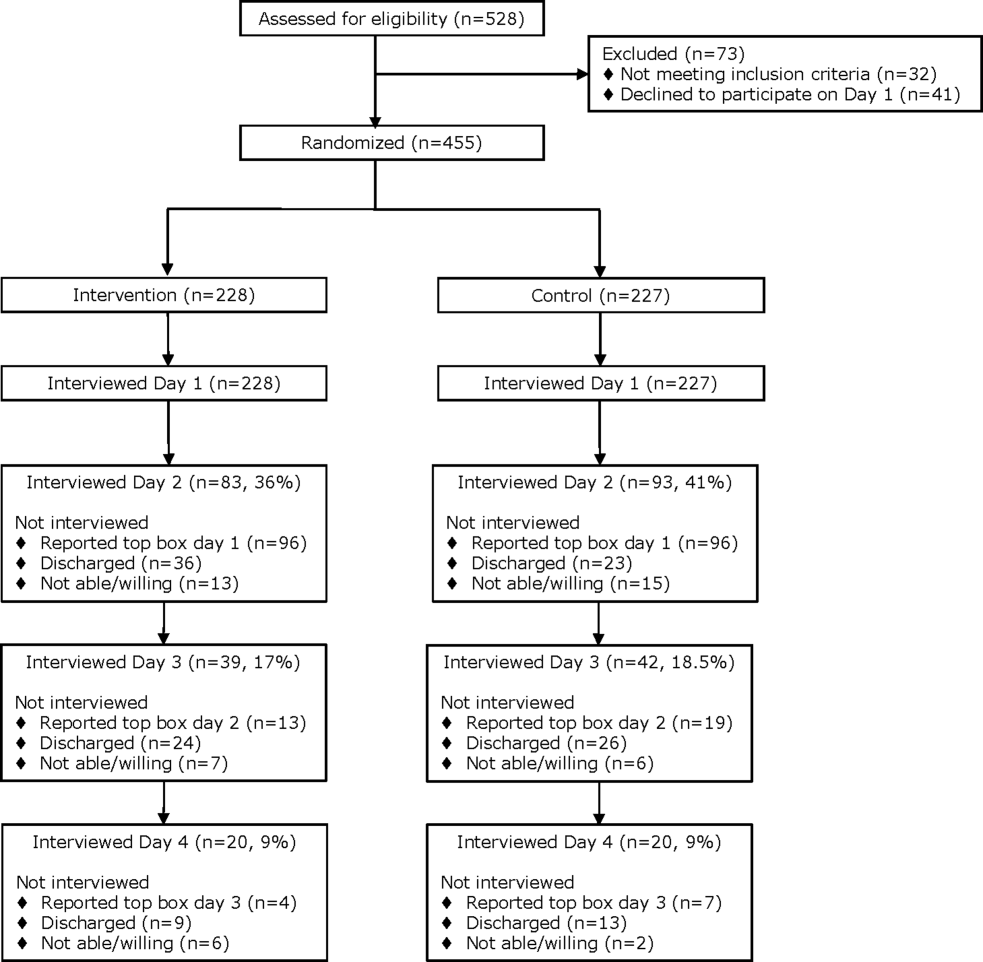
From April 14, 2014 to September 19, 2014, we enrolled 227 patients in the control group and 228 in the intervention group (Figure 1). Patient demographics are summarized in Table 1. Of the 132 patients in the intervention group who reported anything less than top box scores for any of the 3 questions (thus prompting a revisit by their provider), 106 (80%) were revisited by their provider at least once during their hospitalization.
| All Patients | HCAHPS Patients | |||
|---|---|---|---|---|
| Control, N = 227 | Intervention, N = 228 | Control, N = 35 | Intervention, N = 30 | |
| ||||
| Age, mean SD | 55 14 | 55 15 | 55 15 | 57 16 |
| Gender | ||||
| Male | 126 (60) | 121 (55) | 20 (57) | 12 (40) |
| Female | 85 (40) | 98 (45) | 15(43) | 18 (60) |
| Race/ethnicity | ||||
| Hispanic | 84 (40) | 90 (41) | 17 (49) | 12 (40) |
| Black | 38 (18) | 28 (13) | 6 (17) | 7 (23) |
| White | 87 (41) | 97 (44) | 12 (34) | 10 (33) |
| Other | 2 (1) | 4 (2) | 0 (0) | 1 (3) |
| Payer | ||||
| Medicare | 65 (29) | 82 (36) | 15 (43) | 12 (40) |
| Medicaid | 122 (54) | 108 (47) | 17 (49) | 14 (47) |
| Commercial | 12 (5) | 15 (7) | 1 (3) | 1 (3) |
| Medically indigent | 4 (2) | 7 (3) | 0 (0) | 3 (10) |
| Self‐pay | 5 (2) | 4 (2) | 1 (3) | 0 (0) |
| Other/unknown | 19 (8) | 12 (5) | 0 (0) | 0 (0) |
| Team | ||||
| Teaching | 187 (82) | 196 (86) | 27 (77) | 24 (80) |
| Nonteaching | 40 (18) | 32 (14) | 8 (23) | 6 (20) |
| Top 5 primary discharge diagnoses* | ||||
| Septicemia | 26 (11) | 34 (15) | 3 (9) | 5 (17) |
| Heart failure | 14 (6) | 13 (6) | 2 (6) | |
| Acute pancreatitis | 12 (5) | 9 (4) | 3 (9) | 2 (7) |
| Diabetes mellitus | 11 (5) | 8 (4) | 2 (6) | |
| Alcohol withdrawal | 9 (4) | |||
| Cellulitis | 7 (3) | 2 (7) | ||
| Pulmonary embolism | 2 (7) | |||
| Chest pain | 2 (7) | |||
| Atrial fibrillation | 2 (6) | |||
| Length of stay, median (IQR) | 3 (2, 5) | 3 (2, 5) | 3 (2, 5) | 3 (2, 4) |
| Charlson Comorbidity Index, median (IQR) | 1 (0, 3) | 2 (0, 3) | 1 (0, 3) | 1.5 (1, 3) |
Daily Surveys
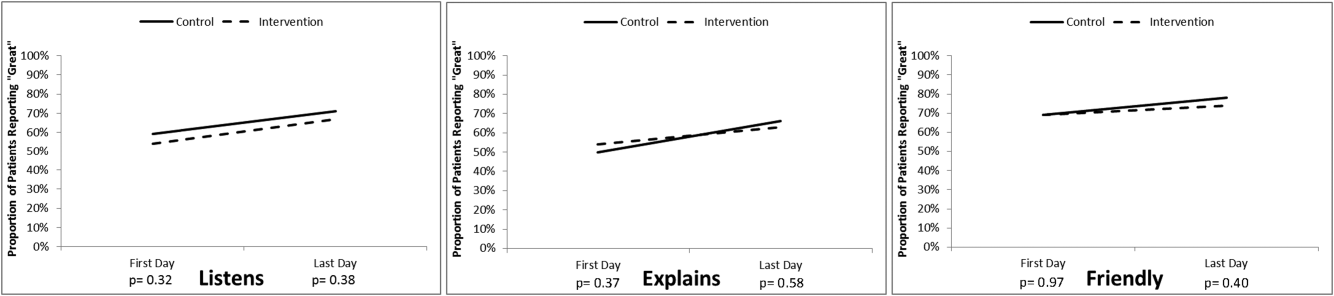
The proportion of patients in both study groups reporting top box scores tended to increase from the first day to the last day of the survey (Figure 2); however, we found no statistically significant differences between the proportion of patients who reported top box scores on first day or last day in the intervention group compared to the control group. The comments made by the patients are summarized in Supporting Table 1 in the online version of this article.
HCAHPS Scores
The proportion of top box scores from the HCAHPS surveys were higher, though not statistically significant, for all 3 provider‐specific questions and for the overall hospital rating for patients whose hospitalists received real‐time feedback (Table 2). The median [interquartile range] score for the overall hospital rating was higher for patients in the intervention group compared with those in the control group, (10 [9, 10] vs 9 [8, 10], P = 0.04]. After converting the HCAHPS scores to percentiles, we found considerably higher rankings for all 3 provider‐related questions and for the overall hospital rating in the intervention group compared to the control group (P = 0.02 for overall differences in percentiles [Table 2]).
| HCAHPS Questions | Proportion Top Box* | Percentile Rank | ||
|---|---|---|---|---|
| Control, N = 35 | Intervention, N = 30 | Control, N = 35 | Intervention, N = 30 | |
| ||||
| Overall hospital rating | 61% | 80% | 6 | 87 |
| Courtesy/respect | 86% | 93% | 23 | 88 |
| Clear communication | 77% | 80% | 39 | 60 |
| Listening | 83% | 90% | 57 | 95 |
No adverse events occurred during the course of the study in either group.
DISCUSSION
The important findings of this study were that (1) daily patient satisfaction scores improved from first day to last day regardless of study group, (2) patients whose providers received real‐time feedback had a trend toward higher HCAHPS proportions for the 3 provider‐related questions as well as the overall rating of the hospital but were not statistically significant, (3) the percentile differences in these 3 questions as well as the overall rating of the hospital were significantly higher in the intervention group as was the median score for the overall hospital rating.
Our original sample size calculation was based upon our own preliminary data, indicating that our baseline top box scores for the daily survey was around 75%. The daily survey top box score on the first day was, however, much lower (Figure 2). Accordingly, although we did not find a significant difference in these daily scores, we were underpowered to find such a difference. Additionally, because only a small percentage of patients are selected for the HCAHPS survey, our ability to detect a difference in this secondary outcome was also limited. We felt that it was important to analyze the percentile comparisons in addition to the proportion of top box scores on the HCAHPS, because the metrics for value‐based purchasing are based upon, in part, how a hospital system compares to other systems. Finally, to improve our power to detect a difference given a small sample size, we converted the scoring system for overall hospital ranking to a continuous variable, which again was noted to be significant.
To our knowledge, this is the first randomized investigation designed to assess the effect of real‐time, patient‐specific feedback to physicians. Real‐time feedback is increasingly being incorporated into medical practice, but there is only limited information available describing how this type of feedback affects outcomes.[22, 23, 24] Banka et al.[15] found that HCAHPS scores improved as a result of real‐time feedback given to residents, but the study was not randomized, utilized a pre‐post design that resulted in there being differences between the patients studied before and after the intervention, and did not provide patient‐specific data to the residents. Tabib et al.[25] found that operating costs decreased 17% after instituting real‐time feedback to providers about these costs. Reeves et al.[26] conducted a cluster randomized trial of a patient feedback survey that was designed to improve nursing care, but the results were reviewed by the nurses several months after patients had been discharged.
The differences in median top box scores and percentile rank that we observed could have resulted from the real‐time feedback, the educational coaching, the fact that the providers revisited the majority of the patients, or a combination of all of the above. Gross et al.[27] found that longer visits lead to higher satisfaction, though others have not found this to necessarily be the case.[28, 29] Lin et al.[30] found that patient satisfaction was affected by the perceived duration of the visit as well as whether expectations on visit length were met and/or exceeded. Brown et al.[31] found that training providers in communication skills improved the providers perception of their communication skills, although patient experience scores did not improve. We feel that the results seen are more likely a combination thereof as opposed to any 1 component of the intervention.
The most commonly reported complaints or concerns in patients' undirected comments often related to communication issues. Comments on subsequent surveys suggested that patient satisfaction improved over time in the intervention group, indicating that perhaps physicians did try to improve in areas that were highlighted by the real‐time feedback, and that patients perceived the physician efforts to do so (eg, They're doing better than the last time you asked. They sat down and talked to me and listened better. They came back and explained to me about my care. They listened better. They should do this survey at the clinic. See Supporting Table 1 in the online version of this article).
Our study has several limitations. First, we did not randomize providers, and many of our providers (approximately 65%) participated in both the control group and also in the intervention group, and thus received real‐time feedback at some point during the study, which could have affected their overall practice and limited our ability to find a difference between the 2 groups. In an attempt to control for this possibility, the study was conducted on an intermittent basis during the study time frame. Furthermore, the proportion of patients who reported top box scores at the beginning of the study did not have a clear trend of change by the end of the study, suggesting that overall clinician practices with respect to patient satisfaction did not change during this short time period.
Second, only a small number of our patients were randomly selected for the HCAHPS survey, which limited our ability to detect significant differences in HCAHPS proportions. Third, the HCAHPS percentiles at our institution at that time were low. Accordingly, the improvements that we observed in patient satisfaction scores might not be reproducible at institutions with higher satisfactions scores. Fourth, time and resources were needed to obtain patient feedback to provide to providers during this study. There are, however, other ways to obtain feedback that are less resource intensive (eg, electronic feedback, the utilization of volunteers, or partnering this with manager rounding). Finally, the study was conducted at a single, university‐affiliated public teaching hospital and was a quality‐improvement initiative, and thus our results are not generalizable to other institutions.
In conclusion, real‐time feedback of patient experience to their providers, coupled with provider education, coaching, and revisits, seems to improve satisfaction of patients hospitalized on general internal medicine units who were cared for by hospitalists.
Acknowledgements
The authors thank Kate Fagan, MPH, for her excellent technical assistance.
Disclosure: Nothing to report.
- HCAHPS Fact Sheet. 2015. Available at: http://www.hcahpsonline.org/Files/HCAHPS_Fact_Sheet_June_2015.pdf. Accessed August 25, 2015.
- , , , . The relationship between commercial website ratings and traditional hospital performance measures in the USA. BMJ Qual Saf. 2013;22:194–202.
- , , , . Patients' perception of hospital care in the United States. N Engl J Med. 2008;359:1921–1931.
- , , , . The relationship between patients' perception of care and measures of hospital quality and safety. Health Serv Res. 2010;45:1024–1040.
- , , , et al. Relationship between quality of diabetes care and patient satisfaction. J Natl Med Assoc. 2003;95:64–70.
- , , , , . Relationship between patient satisfaction with inpatient care and hospital readmission within 30 days. Am J Manag Care. 2011;17:41–48.
- , , . A systematic review of evidence on the links between patient experience and clinical safety and effectiveness. BMJ Open. 2013;3(1).
- , . The association between satisfaction with services provided in primary care and outcomes in type 2 diabetes mellitus. Diabet Med. 2003;20:486–490.
- , , , et al. Associations between Web‐based patient ratings and objective measures of hospital quality. Arch Intern Med. 2012;172:435–436.
- , , , et al. Patient satisfaction and its relationship with clinical quality and inpatient mortality in acute myocardial infarction. Circ Cardiovasc Qual Outcomes. 2010;3:188–195.
- , , , , . Patients' perceptions of care are associated with quality of hospital care: a survey of 4605 hospitals. Am J Med Qual. 2015;30(4):382–388.
- Centers for Medicare 28:908–913.
- , , , , , . Effect of sitting vs. standing on perception of provider time at bedside: a pilot study. Patient Educ Couns. 2012;86:166–171.
- , , , et al. Improving patient satisfaction through physician education, feedback, and incentives. J Hosp Med. 2015;10:497–502.
- US Department of Health and Human Services. Patient satisfaction survey. Available at: http://bphc.hrsa.gov/policiesregulations/performancemeasures/patientsurvey/surveyform.html. Accessed November 15, 2013.
- , , , , , . Research electronic data capture (REDCap)—a metadata‐driven methodology and workflow process for providing translational research informatics support. J Biomed Inform. 2009;42:377–381.
- . The HCAHPS Handbook. Gulf Breeze, FL: Fire Starter; 2010.
- . Etiquette‐based medicine. N Engl J Med. 2008;358:1988–1989.
- . 5 years after the Kahn's etiquette‐based medicine: a brief checklist proposal for a functional second meeting with the patient. Front Psychol. 2013;4:723.
- Frequently Asked Questions. Hospital Value‐Based Purchasing Program. Available at: http://www.cms.gov/Medicare/Quality‐Initiatives‐Patient‐Assessment‐Instruments/hospital‐value‐based‐purchasing/Downloads/FY‐2013‐Program‐Frequently‐Asked‐Questions‐about‐Hospital‐VBP‐3‐9‐12.pdf. Accessed February 8, 2014.
- , , , . Real‐time patient survey data during routine clinical activities for rapid‐cycle quality improvement. JMIR Med Inform. 2015;3:e13.
- . Mount Sinai launches real‐time patient‐feedback survey tool. Healthcare Informatics website. Available at: http://www.healthcare‐informatics.com/news‐item/mount‐sinai‐launches‐real‐time‐patient‐feedback‐survey‐tool. Accessed August 25, 2015.
- , . Hospitals are finally starting to put real‐time data to use. Harvard Business Review website. Available at: https://hbr.org/2014/11/hospitals‐are‐finally‐starting‐to‐put‐real‐time‐data‐to‐use. Published November 12, 2014. Accessed August 25, 2015.
- , , , , . Reducing operating room costs through real‐time cost information feedback: a pilot study. J Endourol. 2015;29:963–968.
- , , . Facilitated patient experience feedback can improve nursing care: a pilot study for a phase III cluster randomised controlled trial. BMC Health Serv Res. 2013;13:259.
- , , , , . Patient satisfaction with time spent with their physician. J Fam Pract. 1998;47:133–137.
- , , , , , . The relationship between time spent communicating and communication outcomes on a hospital medicine service. J Gen Intern Med. 2012;27:185–189.
- , . Cognitive interview techniques reveal specific behaviors and issues that could affect patient satisfaction relative to hospitalists. J Hosp Med. 2009;4:E1–E6.
- , , , et al. Is patients' perception of time spent with the physician a determinant of ambulatory patient satisfaction? Arch Intern Med. 2001;161:1437–1442.
- , , , . Effect of clinician communication skills training on patient satisfaction. A randomized, controlled trial. Ann Intern Med. 1999;131:822–829.
In 2010, the Centers for Medicare and Medicaid Services implemented value‐based purchasing, a payment model that incentivizes hospitals for reaching certain quality and patient experience thresholds and penalizes those that do not, in part on the basis of patient satisfaction scores.[1] Although low patient satisfaction scores will adversely affect institutions financially, they also reflect patients' perceptions of their care. Some studies suggest that hospitals with higher patient satisfaction scores score higher overall on clinical care processes such as core measures compliance, readmission rates, lower mortality rates, and other quality‐of‐care metrics.[2, 3, 4, 5, 6, 7, 8, 9, 10, 11]
The Hospital Consumer Assessment of Healthcare Providers and Systems (HCAHPS) survey assesses patients' experience following their hospital stay.[1] The percent of top box scores (ie, response of always on a four point scale, or scores of 9 or 10 on a 10‐point scale) are utilized to compare hospitals and determine the reimbursement or penalty a hospital will receive. Although these scores are available to the public on the Hospital Compare website,[12] physicians may not know how their hospital is ranked or how they are individually perceived by their patients. Additionally, these surveys are typically conducted 48 hours to 6 weeks after patients are discharged, and the results are distributed back to the hospitals well after the time that care was provided, thereby offering providers no chance of improving patient satisfaction during a given hospital stay.
Institutions across the country are trying to improve their HCAHPS scores, but there is limited research identifying specific measures providers can implement. Some studies have suggested that utilizing etiquette‐based communication and sitting at the bedside[13, 14] may help improve patient experience with their providers, and more recently, it has been suggested that providing real‐time deidentified patient experience survey results with education and a rewards/emncentive system to residents may help as well.[15]
Surveys conducted during a patient's hospitalization can offer real‐time actionable feedback to providers. We performed a quality‐improvement project that was designed to determine if real‐time feedback to hospitalist physicians, followed by coaching, and revisits to the patients' bedside could improve the results recorded on provider‐specific patient surveys and/or patients' HCAHPS scores or percentile rankings.
METHODS
Design
This was a prospective, randomized quality‐improvement initiative that was approved by the Colorado Multiple Institutional Review Board and conducted at Denver Health, a 525‐bed university‐affiliated public safety net hospital. The initiative was conducted on both teaching and nonteaching general internal medicine services, which typically have a daily census of between 10 and 15 patients. No protocol changes occurred during the study.
Participants
Participants included all English‐ or Spanish‐speaking patients who were hospitalized on a general internal medicine service, had been admitted within the 2 days prior to enrollment, and had a hospitalist as their attending physician. Patients were excluded if they were enrolled in the study during a previous hospitalization, refused to participate, lacked capacity to participate, had hearing or speech impediments precluding regular conversation, were prisoners, if their clinical condition precluded participation, or their attending was an investigator in the project.
Intervention
Participants were prescreened by investigators by reviewing team sign‐outs to determine if patients had any exclusion criteria. Investigators attempted to survey each patient who met inclusion criteria on a daily basis between 9:00 am and 11:00 am. An investigator administered the survey to each patient verbally using scripted language. Patients were asked to rate how well their doctors were listening to them, explaining what they wanted to know, and whether the doctors were being friendly and helpful, all questions taken from a survey that was available on the US Department of Health and Human Services website (to be referred to as here forward daily survey).[16] We converted the original 5‐point Likert scale used in this survey to a 4‐point scale by removing the option of ok, leaving participants the options of poor, fair, good, or great. Patients were also asked to provide any personalized feedback they had, and these comments were recorded in writing by the investigator.
After being surveyed on day 1, patients were randomized to an intervention or control group using an automated randomization module in Research Electronic Data Capture (REDCap).[17] Patients in both groups who did not provide answers to all 3 questions that qualified as being top box (ie, great) were resurveyed on a daily basis until their responses were all top box or they were discharged, met exclusion criteria, or had been surveyed for a total of 4 consecutive days. In the pilot phase of this study, we found that if patients reported all top box scores on the initial survey their responses typically did not change over time, and the patients became frustrated if asked the same questions again when the patient felt there was not room for improvement. Accordingly, we elected to stop surveying patients when all top box responses were reported.
The attending hospitalist caring for each patient in the intervention group was given feedback about their patients' survey results (both their scores and any specific comments) on a daily basis. Feedback was provided in person by 1 of the investigators. The hospitalist also received an automatically generated electronic mail message with the survey results at 11:00 am on each study day. After informing the hospitalists of the patients' scores, the investigator provided a brief education session that included discussing Denver Health's most recent HCAHPS scores, value‐based purchasing, and the financial consequences of poor patient satisfaction scores. The investigator then coached the hospitalist on etiquette‐based communication,[18, 19] suggested that they sit down when communicating with their patients,[19, 20] and then asked the hospitalist to revisit each patient to discuss how the team could improve in any of the 3 areas where the patient did not give a top box score. These educational sessions were conducted in person and lasted a maximum of 5 minutes. An investigator followed up with each hospitalist the following day to determine whether the revisit occurred. Hospitalists caring for patients who were randomized to the control group were not given real‐time feedback or coaching and were not asked to revisit patients.
A random sample of patients surveyed for this initiative also received HCAHPS surveys 48 hours to 6 weeks following their hospital discharge, according to the standard methodology used to acquire HCAHPS data,[21] by an outside vendor contracted by Denver Health. Our vendor conducted these surveys via telephone in English or Spanish.
Outcomes
The primary outcome was the proportion of patients in each group who reported top box scores on the daily surveys. Secondary outcomes included the percent change for the scores recorded for 3 provider‐specific questions from the daily survey, the median top box HCAHPS scores for the 3 provider related questions and overall hospital rating, and the HCAHPS percentiles of top box scores for these questions.
Sample Size
The sample size for this intervention assumed that the proportion of patients whose treating physicians did not receive real‐time feedback who rated their providers as top box would be 75%, and that the effect of providing real‐time feedback would increase this proportion to 85% on the daily surveys. To have 80% power with a type 1 error of 0.05, we estimated a need to enroll 430 patients, 215 in each group.
Statistics
Data were collected and managed using a secure, Web‐based electronic data capture tool hosted at Denver Health (REDCap), which is designed to support data collection for research studies providing: (1) an intuitive interface for validated data entry, (2) audit trails for tracking data manipulation and export procedures, (3) automated export procedures for seamless data downloads to common statistical packages, and (4) procedures for importing data from external sources.[17]
A 2 test was used to compare the proportion of patients in the 2 groups who reported great scores for each question on the study survey on the first and last day. With the intent of providing a framework for understanding the effect real‐time feedback could have on patient experience, a secondary analysis of HCAHPS results was conducted using several different methods.
First, the proportion of patients in the 2 groups who reported scores of 9 or 10 for the overall hospital rating question or reported always for each doctor communication question on the HCHAPS survey was compared using a 2. Second, to allow for detection of differences in a sample with a smaller N, the median overall hospital rating scores from the HCAHPS survey reported by patients in the 2 groups who completed a survey following discharge were compared using a Wilcoxon rank sum test. Lastly, to place changes in proportion into a larger context (ie, how these changes would relate to value‐based purchasing), HCAHPS scores were converted to percentiles of national performance using the 2014 percentile rankings obtained from the external vendor that conducts the HCAHPS surveys for our hospital and compared between the intervention and control groups using a Wilcoxon rank sum test.
All comments collected from patients during their daily surveys were reviewed, and key words were abstracted from each comment. These key words were sorted and reviewed to categorize recurring key words into themes. Exemplars were then selected for each theme derived from patient comments.
RESULTS
From April 14, 2014 to September 19, 2014, we enrolled 227 patients in the control group and 228 in the intervention group (Figure 1). Patient demographics are summarized in Table 1. Of the 132 patients in the intervention group who reported anything less than top box scores for any of the 3 questions (thus prompting a revisit by their provider), 106 (80%) were revisited by their provider at least once during their hospitalization.
| All Patients | HCAHPS Patients | |||
|---|---|---|---|---|
| Control, N = 227 | Intervention, N = 228 | Control, N = 35 | Intervention, N = 30 | |
| ||||
| Age, mean SD | 55 14 | 55 15 | 55 15 | 57 16 |
| Gender | ||||
| Male | 126 (60) | 121 (55) | 20 (57) | 12 (40) |
| Female | 85 (40) | 98 (45) | 15(43) | 18 (60) |
| Race/ethnicity | ||||
| Hispanic | 84 (40) | 90 (41) | 17 (49) | 12 (40) |
| Black | 38 (18) | 28 (13) | 6 (17) | 7 (23) |
| White | 87 (41) | 97 (44) | 12 (34) | 10 (33) |
| Other | 2 (1) | 4 (2) | 0 (0) | 1 (3) |
| Payer | ||||
| Medicare | 65 (29) | 82 (36) | 15 (43) | 12 (40) |
| Medicaid | 122 (54) | 108 (47) | 17 (49) | 14 (47) |
| Commercial | 12 (5) | 15 (7) | 1 (3) | 1 (3) |
| Medically indigent | 4 (2) | 7 (3) | 0 (0) | 3 (10) |
| Self‐pay | 5 (2) | 4 (2) | 1 (3) | 0 (0) |
| Other/unknown | 19 (8) | 12 (5) | 0 (0) | 0 (0) |
| Team | ||||
| Teaching | 187 (82) | 196 (86) | 27 (77) | 24 (80) |
| Nonteaching | 40 (18) | 32 (14) | 8 (23) | 6 (20) |
| Top 5 primary discharge diagnoses* | ||||
| Septicemia | 26 (11) | 34 (15) | 3 (9) | 5 (17) |
| Heart failure | 14 (6) | 13 (6) | 2 (6) | |
| Acute pancreatitis | 12 (5) | 9 (4) | 3 (9) | 2 (7) |
| Diabetes mellitus | 11 (5) | 8 (4) | 2 (6) | |
| Alcohol withdrawal | 9 (4) | |||
| Cellulitis | 7 (3) | 2 (7) | ||
| Pulmonary embolism | 2 (7) | |||
| Chest pain | 2 (7) | |||
| Atrial fibrillation | 2 (6) | |||
| Length of stay, median (IQR) | 3 (2, 5) | 3 (2, 5) | 3 (2, 5) | 3 (2, 4) |
| Charlson Comorbidity Index, median (IQR) | 1 (0, 3) | 2 (0, 3) | 1 (0, 3) | 1.5 (1, 3) |
Daily Surveys
The proportion of patients in both study groups reporting top box scores tended to increase from the first day to the last day of the survey (Figure 2); however, we found no statistically significant differences between the proportion of patients who reported top box scores on first day or last day in the intervention group compared to the control group. The comments made by the patients are summarized in Supporting Table 1 in the online version of this article.
HCAHPS Scores
The proportion of top box scores from the HCAHPS surveys were higher, though not statistically significant, for all 3 provider‐specific questions and for the overall hospital rating for patients whose hospitalists received real‐time feedback (Table 2). The median [interquartile range] score for the overall hospital rating was higher for patients in the intervention group compared with those in the control group, (10 [9, 10] vs 9 [8, 10], P = 0.04]. After converting the HCAHPS scores to percentiles, we found considerably higher rankings for all 3 provider‐related questions and for the overall hospital rating in the intervention group compared to the control group (P = 0.02 for overall differences in percentiles [Table 2]).
| HCAHPS Questions | Proportion Top Box* | Percentile Rank | ||
|---|---|---|---|---|
| Control, N = 35 | Intervention, N = 30 | Control, N = 35 | Intervention, N = 30 | |
| ||||
| Overall hospital rating | 61% | 80% | 6 | 87 |
| Courtesy/respect | 86% | 93% | 23 | 88 |
| Clear communication | 77% | 80% | 39 | 60 |
| Listening | 83% | 90% | 57 | 95 |
No adverse events occurred during the course of the study in either group.
DISCUSSION
The important findings of this study were that (1) daily patient satisfaction scores improved from first day to last day regardless of study group, (2) patients whose providers received real‐time feedback had a trend toward higher HCAHPS proportions for the 3 provider‐related questions as well as the overall rating of the hospital but were not statistically significant, (3) the percentile differences in these 3 questions as well as the overall rating of the hospital were significantly higher in the intervention group as was the median score for the overall hospital rating.
Our original sample size calculation was based upon our own preliminary data, indicating that our baseline top box scores for the daily survey was around 75%. The daily survey top box score on the first day was, however, much lower (Figure 2). Accordingly, although we did not find a significant difference in these daily scores, we were underpowered to find such a difference. Additionally, because only a small percentage of patients are selected for the HCAHPS survey, our ability to detect a difference in this secondary outcome was also limited. We felt that it was important to analyze the percentile comparisons in addition to the proportion of top box scores on the HCAHPS, because the metrics for value‐based purchasing are based upon, in part, how a hospital system compares to other systems. Finally, to improve our power to detect a difference given a small sample size, we converted the scoring system for overall hospital ranking to a continuous variable, which again was noted to be significant.
To our knowledge, this is the first randomized investigation designed to assess the effect of real‐time, patient‐specific feedback to physicians. Real‐time feedback is increasingly being incorporated into medical practice, but there is only limited information available describing how this type of feedback affects outcomes.[22, 23, 24] Banka et al.[15] found that HCAHPS scores improved as a result of real‐time feedback given to residents, but the study was not randomized, utilized a pre‐post design that resulted in there being differences between the patients studied before and after the intervention, and did not provide patient‐specific data to the residents. Tabib et al.[25] found that operating costs decreased 17% after instituting real‐time feedback to providers about these costs. Reeves et al.[26] conducted a cluster randomized trial of a patient feedback survey that was designed to improve nursing care, but the results were reviewed by the nurses several months after patients had been discharged.
The differences in median top box scores and percentile rank that we observed could have resulted from the real‐time feedback, the educational coaching, the fact that the providers revisited the majority of the patients, or a combination of all of the above. Gross et al.[27] found that longer visits lead to higher satisfaction, though others have not found this to necessarily be the case.[28, 29] Lin et al.[30] found that patient satisfaction was affected by the perceived duration of the visit as well as whether expectations on visit length were met and/or exceeded. Brown et al.[31] found that training providers in communication skills improved the providers perception of their communication skills, although patient experience scores did not improve. We feel that the results seen are more likely a combination thereof as opposed to any 1 component of the intervention.
The most commonly reported complaints or concerns in patients' undirected comments often related to communication issues. Comments on subsequent surveys suggested that patient satisfaction improved over time in the intervention group, indicating that perhaps physicians did try to improve in areas that were highlighted by the real‐time feedback, and that patients perceived the physician efforts to do so (eg, They're doing better than the last time you asked. They sat down and talked to me and listened better. They came back and explained to me about my care. They listened better. They should do this survey at the clinic. See Supporting Table 1 in the online version of this article).
Our study has several limitations. First, we did not randomize providers, and many of our providers (approximately 65%) participated in both the control group and also in the intervention group, and thus received real‐time feedback at some point during the study, which could have affected their overall practice and limited our ability to find a difference between the 2 groups. In an attempt to control for this possibility, the study was conducted on an intermittent basis during the study time frame. Furthermore, the proportion of patients who reported top box scores at the beginning of the study did not have a clear trend of change by the end of the study, suggesting that overall clinician practices with respect to patient satisfaction did not change during this short time period.
Second, only a small number of our patients were randomly selected for the HCAHPS survey, which limited our ability to detect significant differences in HCAHPS proportions. Third, the HCAHPS percentiles at our institution at that time were low. Accordingly, the improvements that we observed in patient satisfaction scores might not be reproducible at institutions with higher satisfactions scores. Fourth, time and resources were needed to obtain patient feedback to provide to providers during this study. There are, however, other ways to obtain feedback that are less resource intensive (eg, electronic feedback, the utilization of volunteers, or partnering this with manager rounding). Finally, the study was conducted at a single, university‐affiliated public teaching hospital and was a quality‐improvement initiative, and thus our results are not generalizable to other institutions.
In conclusion, real‐time feedback of patient experience to their providers, coupled with provider education, coaching, and revisits, seems to improve satisfaction of patients hospitalized on general internal medicine units who were cared for by hospitalists.
Acknowledgements
The authors thank Kate Fagan, MPH, for her excellent technical assistance.
Disclosure: Nothing to report.
- HCAHPS Fact Sheet. 2015. Available at: http://www.hcahpsonline.org/Files/HCAHPS_Fact_Sheet_June_2015.pdf. Accessed August 25, 2015.
- , , , . The relationship between commercial website ratings and traditional hospital performance measures in the USA. BMJ Qual Saf. 2013;22:194–202.
- , , , . Patients' perception of hospital care in the United States. N Engl J Med. 2008;359:1921–1931.
- , , , . The relationship between patients' perception of care and measures of hospital quality and safety. Health Serv Res. 2010;45:1024–1040.
- , , , et al. Relationship between quality of diabetes care and patient satisfaction. J Natl Med Assoc. 2003;95:64–70.
- , , , , . Relationship between patient satisfaction with inpatient care and hospital readmission within 30 days. Am J Manag Care. 2011;17:41–48.
- , , . A systematic review of evidence on the links between patient experience and clinical safety and effectiveness. BMJ Open. 2013;3(1).
- , . The association between satisfaction with services provided in primary care and outcomes in type 2 diabetes mellitus. Diabet Med. 2003;20:486–490.
- , , , et al. Associations between Web‐based patient ratings and objective measures of hospital quality. Arch Intern Med. 2012;172:435–436.
- , , , et al. Patient satisfaction and its relationship with clinical quality and inpatient mortality in acute myocardial infarction. Circ Cardiovasc Qual Outcomes. 2010;3:188–195.
- , , , , . Patients' perceptions of care are associated with quality of hospital care: a survey of 4605 hospitals. Am J Med Qual. 2015;30(4):382–388.
- Centers for Medicare 28:908–913.
- , , , , , . Effect of sitting vs. standing on perception of provider time at bedside: a pilot study. Patient Educ Couns. 2012;86:166–171.
- , , , et al. Improving patient satisfaction through physician education, feedback, and incentives. J Hosp Med. 2015;10:497–502.
- US Department of Health and Human Services. Patient satisfaction survey. Available at: http://bphc.hrsa.gov/policiesregulations/performancemeasures/patientsurvey/surveyform.html. Accessed November 15, 2013.
- , , , , , . Research electronic data capture (REDCap)—a metadata‐driven methodology and workflow process for providing translational research informatics support. J Biomed Inform. 2009;42:377–381.
- . The HCAHPS Handbook. Gulf Breeze, FL: Fire Starter; 2010.
- . Etiquette‐based medicine. N Engl J Med. 2008;358:1988–1989.
- . 5 years after the Kahn's etiquette‐based medicine: a brief checklist proposal for a functional second meeting with the patient. Front Psychol. 2013;4:723.
- Frequently Asked Questions. Hospital Value‐Based Purchasing Program. Available at: http://www.cms.gov/Medicare/Quality‐Initiatives‐Patient‐Assessment‐Instruments/hospital‐value‐based‐purchasing/Downloads/FY‐2013‐Program‐Frequently‐Asked‐Questions‐about‐Hospital‐VBP‐3‐9‐12.pdf. Accessed February 8, 2014.
- , , , . Real‐time patient survey data during routine clinical activities for rapid‐cycle quality improvement. JMIR Med Inform. 2015;3:e13.
- . Mount Sinai launches real‐time patient‐feedback survey tool. Healthcare Informatics website. Available at: http://www.healthcare‐informatics.com/news‐item/mount‐sinai‐launches‐real‐time‐patient‐feedback‐survey‐tool. Accessed August 25, 2015.
- , . Hospitals are finally starting to put real‐time data to use. Harvard Business Review website. Available at: https://hbr.org/2014/11/hospitals‐are‐finally‐starting‐to‐put‐real‐time‐data‐to‐use. Published November 12, 2014. Accessed August 25, 2015.
- , , , , . Reducing operating room costs through real‐time cost information feedback: a pilot study. J Endourol. 2015;29:963–968.
- , , . Facilitated patient experience feedback can improve nursing care: a pilot study for a phase III cluster randomised controlled trial. BMC Health Serv Res. 2013;13:259.
- , , , , . Patient satisfaction with time spent with their physician. J Fam Pract. 1998;47:133–137.
- , , , , , . The relationship between time spent communicating and communication outcomes on a hospital medicine service. J Gen Intern Med. 2012;27:185–189.
- , . Cognitive interview techniques reveal specific behaviors and issues that could affect patient satisfaction relative to hospitalists. J Hosp Med. 2009;4:E1–E6.
- , , , et al. Is patients' perception of time spent with the physician a determinant of ambulatory patient satisfaction? Arch Intern Med. 2001;161:1437–1442.
- , , , . Effect of clinician communication skills training on patient satisfaction. A randomized, controlled trial. Ann Intern Med. 1999;131:822–829.
© 2016 Society of Hospital Medicine
