User login
Hand Hygiene Intervention in Japan
Healthcare‐associated infections are a major cause of illness and death in hospitalized patients, and preventing healthcare‐associated infection is a global challenge.[1] Worldwide, the prevalence of healthcare‐associated infections in developed and undeveloped countries ranges from 5.1% to 11.6% and 5.7% to 19.1%, respectively.[2] In the United States, roughly 2 million such infections occur annually, resulting in approximately 99,000 deaths[3] and estimated annual direct medical costs between $28.4 and $33.8 billion.[4] In Japan, nearly 9% of patients admitted to the intensive care unit (ICU) develop an infection during hospitalization,[5] and 5% of all patients hospitalized become infected with methicillin‐resistant Staphylococcus aureus.[6] The management of healthcare‐associated infections in Japan accounts for up to 5% of total annual healthcare costs, with an estimated $6.8 billion estimated to be potentially preventable.[7] In addition, healthcare‐associated infections are associated with increased length of stay in the hospital. Studies estimate surgical site infections extend length of stay by 9.7 days,[8] and bloodstream infections increase length of stay by 10 days.[9]
Improving hand hygiene practice for healthcare workers is considered a core strategy to decrease the incidence of healthcare‐associated infection.[6, 10] Specifically, the use of alcohol‐based hand rub is strongly recommended in acute care hospitals by both the World Health Organization (WHO) and the US Centers for Disease Control and Prevention.[11, 12] Improving hand hygiene adherence may reduce healthcare‐associated infection by 9% to 50%,[13, 14] and multiple studies have reported that greater use of alcohol‐based hand rubs results in significant reductions in healthcare‐associated infections.[14, 15]
Due to the difficulty in improving hand hygiene in various settings across the world, the WHO strategy for improving hand hygiene has been adopted and implemented by several studies in varying locations, such as Costa Rica, Italy, Mali, Pakistan, and Saudi Arabia.[16] Implementations of these multimodal strategies, following WHObased guidelines, have been shown to increase the level of hand hygiene adherence among healthcare workers and reduce infections at these locations.[14, 17, 18] This study expands upon that work by extending the same implementation strategy to assess the effectiveness of the introduction of alcohol‐based hand rub on hand hygiene practice at multiple hospitals in Japan.
In a previous article[19] we reported results from an observational study assessing healthcare worker hand hygiene adherence before touching the patient in 4 geographically diverse hospitals in Japan. The study reported that hand hygiene adherence in Japanese hospitals was lower than reported mean values from other international studies, and that greater adherence to hand hygiene should be encouraged. In this article, we present the results of a multimodal intervention intended to improve levels of healthcare worker hand hygiene in 3 of these hospitals.
METHODS
Participating Institutions
Three of the 4 hospitals participating in the prior observational study chose to participate in this intervention. Evaluation of hand hygiene practice was performed in at least 3 wards of each hospital including an inpatient surgical ward, an inpatient medicine ward, an ICU, or an emergency ward.
Table 1 lists the characteristics of the participating hospitals. Hospital A is a university‐affiliated, tertiary care medical center with 312 beds in East Japan. Although the hospital did not have an infection prevention unit or designated infection control nurses during the preintervention periods, the hospital hired a designated infection prevention nurse and established a department of infection prevention before this intervention in April 2012. Hospital B is a community‐based, tertiary care medical center with 428 beds, located in Midwest Japan. Although the facility had no infection control nurses at the outset of the study, a physician certified by the American Board of Internal Medicine and Infectious Diseases provided educational sessions of hand hygiene. Hospital B hired a designated infection prevention nurse and established a department of infection prevention in April 2012. Hospital C, located in Northern Japan, is a community‐based, tertiary care medical center with 562 beds. The department of infection prevention was established in 2010 and has 1 full‐time and 2 part‐time infection prevention nurses.
| Hospital A | Hospital B | Hospital C | ||||
|---|---|---|---|---|---|---|
| Preintervention | Postintervention | Preintervention | Postintervention | Preintervention | Postintervention | |
| ||||||
| Hospital characteristics | ||||||
| Location | East Japan | Midwest Japan | Northern Japan | |||
| Hospital type | University affiliated | Community based | Community based | |||
| Level of care | Tertiary care | Tertiary care | Tertiary care | |||
| Residency program | Yes | Yes | Yes | |||
| No. of beds | 250 | 312 | 428 | 428 | 550 | 562 |
| No. of employees | 398 | 475 | 1,035 | 1,263 | 1,500 | 1,568 |
| No. of physicians | 73 | 91 | 179 | 188 | 207 | 217 |
| No. of nurses | 172 | 210 | 410 | 540 | 616 | 800 |
| Infection control practice | ||||||
| Establishment of infection prevention units (year) | N/A | Yes (2012) | N/A | Yes (2012) | Yes (2010) | Yes |
| Employment of certified nurses in infection control (FTE) | 0 | 1 (1) | 0 | 1 (1) | 3 (1.5) | 3 (1.5) |
| Employment of ABIM‐IDcertified physician | 0 | 0 | 1 | 1 | 1 | 0 |
Role of the Funding Source
This study was unfunded. The prize for the contest was provided by an American collaborator (S.S.) who was not affiliated with any of the participating hospitals.
Intervention
In the prior preintervention study, hand hygiene adherence rates of healthcare workers were evaluated between July 2011 and November 2011.[19] To improve hand hygiene adherence in these facilities, we initiated a multimodal intervention based on WHO recommendations and the findings from the prior study. Each facility was provided the same guidance on how to improve hand hygiene adherence (Table 2) and encouraged to tailor the intervention to their local setting. As an added incentive, we initiated a contest, where the facility obtaining the highest hand hygiene adherence postintervention would win a trophy and 500,000 Japanese yen (approximately $5000 US dollars). The recommended strategies consisted of 15 components (Table 2): infrastructure (3 components), training and education (2 components), evaluation and feedback (5 components), reminder in the workplace (1 component), and institution safety climate (4 components). Of note, the participating institutions had already implemented a varying number of the intervention components prior to the start of the intervention. Each facility conducted a 6‐month intervention to improve hand hygiene adherence; however, the actual timing of interventions varied slightly by institution. Hospitals A and C conducted an intervention from October 2012 through March 2013, whereas hospital B's intervention was from April 2012 to September 2012. Details of the multimodal intervention performed at each participating hospital are shown in Table 3.
| Intervention Components | Description |
|---|---|
| 1. Infrastructure (3 components) | |
| Hand‐washing faucets for each room | At least 1 faucet and sink for each room was available. |
| Placement of alcohol hand rub at patient's room entrance | Alcohol hand rub was placed at all patient room entrances. |
| Portable alcohol hand rub distributed for each healthcare worker | Personal, portable alcohol hand rub dispensers were provided for healthcare workers who contact patients. |
| 2. Training/education (2 components) | |
| Educational resources | At least 1 physician or 1 nurse who provides educational sessions regarding hand hygiene practice was available. |
| Periodic seminars and lectures regarding hand hygiene education | Hospital‐wide hand hygiene seminar or educational activities were held during the intervention period. |
| 3. Evaluation and feedback (5 components) | |
| Evaluation of hand hygiene practice by direct observation | Hospitals utilize direct observation for healthcare worker's hand hygiene practice. |
| Evaluation of hand hygiene practice by monitoring the amount of alcohol hand rub consumption | Hospitals utilize the amount of alcohol hand rub consumption as a parameter for healthcare worker's hand hygiene practice. |
| Hand hygiene rate feedback at infection control committee | Hand hygiene adherence rate was reported and discussed at hospital infection control committee. |
| Hand hygiene rate feedback to the designated wards/units | Hand hygiene adherence rate was reported and discussed with healthcare workers at the designated wards/units where hand hygiene observation was performed. |
| Granting the award of top‐rated person of hand hygiene | Hospitals established the system to assess individual healthcare worker's hand hygiene adherence rate. |
| 4. Reminder in the workplace (1 components) | |
| Poster notification | Poster notification for hand hygiene practice was performed in the intervention period. |
| 5. Institutional safety climate (4 components) | |
| Commitment of hospital president or hospital executives | Hospital executives including the president agreed on the importance of hand hygiene practice and declared to healthcare workers to enhance hand hygiene practice during the intervention period. |
| Commitment of nurse managers and physician leaders | Commitment of improving hand hygiene practice by representative healthcare workers at the designated wards/units (eg, meeting by nurse manager or physician leaders at the designated wards/units and collaborative work with infection prevention services). |
| Meeting at the designated wards/units | A ward/unit‐level meeting or voluntary session for hands‐on hand hygiene practice by healthcare workers at the designated wards/units. |
| Identifying champions at the designated wards/units | An individual healthcare worker who contributed to improving hand hygiene practice was appointed. |
| Hospital A | Hospital Ba | Hospital C | ||||
|---|---|---|---|---|---|---|
| ||||||
| Intervention period | October 2012March 2013 | April 2012September 2012 | October 2012March 2013 | |||
| Evaluation of hand hygiene in the postintervention period | May 2013July 2013 | October 2012 | June 2013 | |||
| Suggested intervention components | Preintervention | Postintervention | Preintervention | Postintervention | Preintervention | Postintervention |
| No. of implemented components | 2/15 | 10/15 | 9/15 | 10/15 | 6/15 | 8/15 |
| Infrastructure (3 components) | ||||||
| Hand‐washing faucets for each room | No | No | Yes | Yes | Yes | Yes |
| Placement of alcohol hand rubs at patient's room entrance | Yes | Yes | Yes | Yes | Yes | Yes |
| Portable alcohol hand rub distributed for each healthcare worker | No | Yesb | No | Yesb | No | No |
| Training/education (2 components) | ||||||
| Educational resources | No | Yesb | Yes | Yesb | Yes | Yes |
| Periodic seminars and lectures regarding hand hygiene education | No | Yesb | Yes | Yes | Yes | Yes |
| Evaluation and feedback (5 components) | ||||||
| Evaluation of hand hygiene practice by direct observation | No | Yesb | Yes | Yes | No | No |
| Evaluation of hand hygiene practice by the amount of alcohol hand rub consumption | No | No | Yes | Yes | Yes | Yes |
| Hand hygiene rate feedback at infection control committee | No | Yesb | Yes | Yes | No | Yesb |
| Hand hygiene rate feedback to designated departments | No | Yesb | Yes | Yes | No | Yesb |
| Granting the award of top‐rated person | No | No | No | No | No | No |
| Reminders in the workplace (1 component) | ||||||
| Poster notification | Yes | Yes | Yes | Yes | Yes | Yes |
| 5. Institutional safety climate (4 components) | ||||||
| Commitment of hospital president or hospital executives | No | Yesb | No | No | No | No |
| Commitment of nurse managers and physicians leaders | No | Yesb | No | No | No | No |
| Meeting regarding hand hygiene practice by the designated wards/units | No | No | No | No | No | No |
| Identifying champions at the designated wards/units | No | No | No | No | No | No |
Observation of Hand Hygiene Practice
The same methods for hand hygiene observation used for the preintervention study was used for postintervention assessment. Ten distinct units across the 3 participating hospitals were evaluated for healthcare worker hand hygiene prior to patient contact. Three to 4 units were observed at each facility. One of the study authors (T.S.), a Japanese board‐certified infection control nurse, conducted all of the hand hygiene observations for both the preintervention and postintervention studies. Intraobserver variation was minimized by providing the same training outlined in the previous study.[19] Appropriate hand hygiene was defined as the use of soap and water or alcohol‐based hand rub before patient contact, which corresponds to the first moment of the WHO's 5 moments of hand hygiene.[11]
Hand hygiene practice prior to patient contact for each individual provider‐patient encounter was observed and recorded using the hand hygiene observation form adapted from a previous study by Saint et al.[6, 20] Identical to the preintervention study,[19] the form captured the following information: unit in which observations were performed, time of initiation and completion of observations, healthcare worker subgroup (physician or nurse), and the type of hand hygiene before patient contact (ie, hand washing with soap and water, use of alcohol‐based hand rub, or no hand hygiene). Unit physicians and nurses were informed that their clinical practices were going to be observed, but were not informed of the purpose of the observations (eg, hand hygiene adherence). To avoid interfering with clinical care delivery, the observer was given strict instructions to maintain a certain distance from the observed healthcare workers. The observer was instructed to leave immediately if asked for any reason by the unit staff or patients.
Statistical Analysis
Overall hand hygiene adherence rates were calculated and compared between the pre‐ and the postintervention periods. Comparison of hand hygiene adherence by healthcare worker subgroup and by hospital unit between the pre‐ and postintervention periods was also performed. Hand hygiene adherence rates were compared using JMP 9.0 and SAS 9.3 (SAS Institute Inc., Cary, NC). Comparison of hand hygiene adherence rates by observational periods was calculated by Pearson [2] tests, and 95% confidence intervals (CIs) were estimated using binomial distribution. Pearson correlations were used to determine the relationship of hand hygiene between physicians and nurses in the same unit. Two‐tailed P value0.05 was considered statistically significant. The study protocol was reviewed and approved by the ethics committees at the participating hospitals.
RESULTS
Data were collected from May 2013 to July 2013 in hospital A, in October 2012 in hospital B, and June 2013 in hospital C to ensure data were collected after the 6‐month intervention at each site. A total of 2982 observations of hand hygiene were performed in 10 distinct units across the 3 participating hospitals during the postintervention periods. Hand hygiene observations were performed during the day Monday through Friday between 8:30 am and 7:30 pm, with the majority occurring prior to 1:00 pm.
The overall postintervention hand hygiene adherence rate (in all 3 hospitals) was significantly higher at 32.7% (974/2982) adherence compared to 18.0% (482/2679) adherence in the preintervention period (P<0.001). An increased hand hygiene adherence rate in each participating hospital in the postintervention period was observed (Figure 1). Similar trends of higher overall hand hygiene adherence rates for both nurses and physicians in the postintervention period were seen. Use of alcohol‐based hand rub among those with appropriate hand hygiene was significantly higher, with 90.0% (880/974) using hand rub in the postintervention period versus 67.0% (322/482) in the preintervention period (P<0.001). Comparison of overall hand hygiene adherence rates by unit type and healthcare worker subgroup between the pre‐ and postintervention periods are shown in Table 4. Detailed comparisons of hand hygiene adherence rates for each hospital are available in the supplementary appendix. Although a significant improvement of hand hygiene practice was observed in the majority of participating units (6/10), there was a significant decline in hand hygiene practice in 2 units for nurses and 1 unit for physicians. Hand hygiene adherence rates by healthcare worker subgroups (both physicians and nurses) were significantly higher in the postintervention period than those in the preintervention period. Trends toward higher hand hygiene adherence rate of nurses in the postintervention period were observed (34.8% adherence for nurses compared to 30.4% adherence for physicians); the difference between nurses and physicians were not statistically significant (P=0.07).

| Ward/Unit | Healthcare Worker Subgroup | Preintervention Period | Postintervention Period | Improvement After Intervention (%) | P Value | ||
|---|---|---|---|---|---|---|---|
| No. of Observations | Hand hygiene Adherence (%) | No. of Observations | Hand Hygiene Adherence (%) | ||||
| |||||||
| All 3 hospitals | |||||||
| Surgery | Nurse | 455 | 20 | 480 | 40 | 20 | <0.001 |
| Physician | 424 | 18 | 448 | 43 | 25 | <0.001 | |
| All | 879 | 19 | 928 | 41 | 22 | <0.001 | |
| Medicine | Nurse | 455 | 23 | 508 | 39 | 16 | <0.001 |
| Physician | 435 | 15 | 452 | 33 | 18 | <0.001 | |
| All | 890 | 20 | 960 | 36 | 16 | <0.001 | |
| ICU | Nurse | 305 | 21 | 379 | 25 | 4 | 0.17 |
| Physician | 203 | 9 | 268 | 28 | 19 | <0.001 | |
| All | 508 | 16 | 647 | 26 | 10 | <0.001 | |
| ED | Nurse | 170 | 16 | 173 | 27 | 11 | 0.01 |
| Physician | 232 | 14 | 274 | 9 | ‐5 | 0.07 | |
| All | 402 | 15 | 447 | 16 | 1 | 0.64 | |
| All units | Nurse | 1385 | 21 | 1540 | 35 | 14 | <0.001 |
| Physician | 1294 | 15 | 1442 | 30 | 15 | <0.001 | |
| All | 2679 | 18 | 2982 | 33 | 15 | <0.001 | |
Hospital A achieved the highest postintervention adherence rates (39.9% adherence postintervention), as well as the greatest absolute improvement in hand hygiene (increase of 29.0%). There were significant improvements in 3 of the 4 participating units in hospital A, with the emergency department showing improvements only in the nurse subgroup. In hospital B, total hand hygiene adherence increased from 24.7% to 30.0% (P=0.01); however, this increase was mainly due to increase in hand hygiene adherence rates of nurses. There were significant increases in hand hygiene adherence rates for nurses in the medicine (+11%, P=0.04) and surgery wards (+14%, P=0.01), with nonsignificant increases for physicians (+10% medicine, P=0.07;+2% surgery, P=0.78). However, in the emergency department, nurses showed no significant improvement, and physicians had a significant decrease in adherence (15.7% preintervention vs 7.4% postintervention; P=0.02). In hospital C, total hand hygiene practice rates were significantly improved (from 18.9% to 26.5%; P<0.001); however, this was driven by improvements only in the surgical ward (14.6% preintervention to 42.3% postintervention; P<0.001). The rates for nurses declined significantly in both the medicine and ICU wards, leading to no observed improvements on those wards.
DISCUSSION
Our multicenter intervention study in Japan included observations from almost 3000 encounters between clinicians and patients. Before the intervention, the overall rate of hand hygiene adherence was 18%. After the multimodal intervention, the absolute increase in healthcare worker hand hygiene adherence was 15%. Although there was overall improvement, the adherence rates varied by hospital, with hospital A increasing by 29% and hospital B and C only attaining increases of 5% and 7%, respectively.
Despite the importance of hand hygiene of healthcare workers, it is challenging to increase hand hygiene adherence because it requires behavioral modification. Moreover, it remains uncertain what factors will affect healthcare worker behavior. We implemented pragmatic strategies to evaluate the efficacy of hand hygiene multimodal interventions based on internationally recognized WHO hand hygiene adherence strategies[11] and an institutional‐level contest with financial incentives. The findings in the current study help us understand not only how a multimodal intervention importantly improves hand hygiene adherence, but also what factors potentially make healthcare workers modify their behaviors.
In this study, we evaluated whether an institutional‐level contest with financial incentives contributed to improved hand hygiene adherence of healthcare workers. This study demonstrated improvement of hand hygiene practice after implementation of a multimodal hand hygiene intervention combined with an institutional‐level contest with financial incentives. The contest might have had a modest effect to help motivate the participating hospitals to improve their hand hygiene adherence rate. This is consistent with a previous study that demonstrated financial incentives were associated with modifying healthcare workers' hand hygiene practice.[21] However, we did not strictly standardize how the contest information was distributed in each participating institution and the objective assessment for changes in motivation by the contest was lacking in this study. Thus, changes in motivation by the contest with financial incentives likely varied by each participating institution. Further studies are needed to assess if this type of approach is worth pursuing.
We observed several noteworthy associations between the intervention components that were implemented at each facility and their improvement in hand hygiene adherence. Among the participating hospitals, hospital A was most successful with improving hand hygiene adherence, although all participating hospitals achieved a similar number of the 15 recommended intervention components during the intervention (8 to 10 per hospital). Interestingly, hospital A initiated the most new components during the intervention period (8 new components for a total of 10 out of 15), whereas hospital B and hospital C initiated only 1 or 2 new components during the intervention period. Hospital A also successfully involved hospital executives, and elicited the commitment of a nurse manager and physician leader. Consistent with a previous study,[22] we believe that involvement of hospital executives appears to be important to increase overall hand hygiene rate among healthcare workers.
In contrast, hospitals B and C did not involve senior executives or identify nurse or physician champions for all participating units. Based on the results in this study, we believe that the involvement of hospital executives is likely a key for the penetration of hospital‐wide hand hygiene culture among healthcare workers.
Although this study was unable to determine which components are precisely associated with improving hand hygiene adherence, the findings suggest initiating multiple intervention components at the same time may provide more motivation for change than initiating only 1 or 2 components at a time. It is also possible that certain intervention components were more beneficial than others. For example, hospital A, which achieved the most success, was the only hospital to obtain leadership support. Other studies have demonstrated that the presence of leadership appeared to play a key role in improving hand hygiene adherence.[23, 24] Moreover, a recent Japanese nationwide survey demonstrated higher safety centeredness was associated with regular use of standard infection prevention practice.[25] Consistent with a previous study, improving hand hygiene adherence cannot be simply achieved by improving infrastructure (eg, introduction of portable alcohol‐based hand rub) alone, but it depends on altering healthcare worker behavior.[26]
This study has several limitations. Because participating hospitals could tailor the specific interventions chosen for their facility, the improvement in hand hygiene adherence was likely multifactorial. We are unable in the existing study to determine a direct causal relationship between any of the individual intervention components and hand hygiene adherence. We are also unable to determine whether the improvements seen in hospital A were due to participation in the contest or due to the specific intervention components that were implemented. However, WHO hand hygiene guidelines point out that recognition of the importance of hand hygiene varies in different regions and countries, and the goal for hand hygiene interventions is to establish a culture of hand hygiene practice through pragmatic intervention strategies, frequent evaluation, and feedback to healthcare workers.[27] Thus, we prioritized pragmatic strategies to include in our intervention to promote hand hygiene adherence. Another limitation was the date of implementation of the multimodal intervention was slightly different at each facility. It was challenging to implement the intervention simultaneously across institutions due to competing priorities at each facility. Although the primary goal of hand hygiene is to reduce the burden of healthcare‐associated infection, we were unable to measure infection rates at the participating facilities. It is possible the presence of an external observer had an impact on the healthcare workers' behavior.[28] However, the healthcare workers were not informed as to what the observer was monitoring to minimize this potential effect. Lastly, the findings in this study provide immediate intervention effects but further study will be required to determine if these effects are sustainable.
Altering healthcare worker behavior is likely the key element to improve hand hygiene adherence, and behavioral modification may be achieved with the support of leadership at the unit and facility level. However, even though we found significant improvements in healthcare worker hand hygiene adherence after the intervention, the adherence rates are still relatively low compared to reported adherence rates from other countries,[29] suggesting further intervention is needed in this setting to optimize and hygiene practice. Because hand hygiene practice is a crucial strategy to prevent healthcare‐associated infections, every effort should be made to enhance the hand hygiene practice of healthcare workers.
Acknowledgements
The authors thank the International Ann Arbor Safety Collaborative (
Disclosure: Nothing to report.
- . Infection control—a problem for patient safety. N Engl J Med. 2003;348(7):651–656.
- World Health Organization. The burden of health care‐associated infection worldwide: a summary. Available at: http://www.who.int/gpsc/country_work/summary_20100430_en.pdf. Accessed October 6, 2014.
- , , , et al. Estimating health care‐associated infections and deaths in U.S. hospitals, 2002. Public Health Rep. 2007;122(2):160–166.
- . The direct medical costs of healthcare‐associated infections in U.S. hospitals and the benefits of prevention. Atlanta, GA: Centers for Disease Control and Prevention; 2009. Available at: http://www.cdc.gov/HAI/pdfs/hai/Scott_CostPaper.pdf. Accessed April 20, 2015.
- , , . Epidemiological approach to nosocomial infection surveillance data: the Japanese Nosocomial Infection Surveillance System. Environ Health Prev Med. 2008;13(1):30–35.
- , , , et al. Improving healthcare worker hand hygiene adherence before patient contact: a before‐and‐after five‐unit multimodal intervention in Tuscany. Qual Saf Health Care. 2009;18(6):429–433.
- . Economical efficiency of infection control. Antibiot Chemother (Northfield). 2004;20:635–638.
- , , , , , . Surgical site infection: incidence and impact on hospital utilization and treatment costs. Am J Infect Control. 2009;37(5):387–397.
- , , , , , . Hospital‐acquired, laboratory‐confirmed bloodstream infections: linking national surveillance data to clinical and financial hospital data to estimate increased length of stay and healthcare costs. J Hosp Infect. 2010;75(3):158–162.
- . APIC guideline for handwashing and hand antisepsis in health care settings. Am J Infect Control. 1995;23(4):251–269.
- World Health Organization. WHO Guidelines on Hand Hygiene in Health Care. Clean care is safer care: first global patient safety challenge. Geneva, Switzerland; 2009. Available at: http://www.who.int/gpsc/en/index.html. Accessed October 6, 2014.
- , ; Healthcare Infection Control Practices Advisory Committee, HICPAC SHEA APIC IDSA Hand Hygiene Task Force. Guideline for hand hygiene in health‐care settings. Recommendations of the Healthcare Infection Control Practices Advisory Committee and the HICPAC/SHEA/APIC/IDSA Hand Hygiene Task Force. Society for Healthcare Epidemiology of America/Association for Professionals in Infection Control/Infectious Diseases Society of America. MMWR Recomm Rep. 2002;51(RR‐16):1–45.
- National Patient Safety Agency. The economic case: implementing near‐patient alcohol hand rum in your trust. London, United Kingdom; 2004. Available at: http://www.npsa.nhs.uk/cleanyourhands/resource‐area/evidence‐base/?EntryId34=58433. Accessed October 9, 2014.
- , , , et al. Effectiveness of a hospital‐wide programme to improve compliance with hand hygiene. Infection Control Programme. Lancet. 2000;356(9238):1307–1312.
- , . Role of hand hygiene in healthcare‐associated infection prevention. J Hosp Infect. 2009;73(4):305–315.
- , , , et al. Global implementation of WHO's multimodal strategy for improvement of hand hygiene: a quasi‐experimental study. Lancet Infect Dis. 2013;13(10):843–851.
- , , , et al. Impact of the International Nosocomial Infection Control Consortium (INICC) multidimensional hand hygiene approach over 13 years in 51 cities of 19 limited‐resource countries from Latin America, Asia, the Middle East, and Europe. Infect Control Hosp Epidemiol. 2013;34(4):415–423.
- , , , . Bundling hand hygiene interventions and measurement to decrease health care‐associated infections. Am J Infect Control. 2012;40(4 suppl 1):S18–S27.
- , , , et al. Hand hygiene adherence among health care workers at Japanese hospitals: a multicenter observational study in Japan [published online April 8, 2014]. J Patient Saf. doi: 10.1097/PTS.0000000000000108.
- , , , et al. Marked variability in adherence to hand hygiene: a 5‐unit observational study in Tuscany. Am J Infect Control. 2009;37(4):306–310.
- , , , et al. Sustained improvement in hand hygiene adherence: utilizing shared accountability and financial incentives. Infect Control Hosp Epidemiol. 2013;34(11):1129–1136.
- , , , . Status of the implementation of the World Health Organization multimodal hand hygiene strategy in United States of America health care facilities. Am J Infect Control. 2014;42(3):224–230.
- , , , et al. The effect of leadership on hand hygiene: assessing hand hygiene adherence prior to patient contact in 2 infectious disease units in Tuscany. Infect Control Hosp Epidemiol. 2014;35(3):313–316.
- , , , , , . Impact of a hospital‐wide hand hygiene initiative on healthcare‐associated infections: results of an interrupted time series. BMJ Qual Saf. 2012;21(12):1019–1026.
- , , , , , . Health care‐associated infection prevention in Japan: the role of safety culture. Am J Infect Control. 2014;42(8):888–893.
- , , . Why healthcare workers don't wash their hands: a behavioral explanation. Infect Control Hosp Epidemiol. 2006;27(5):484–492.
- World Health Organization. Guide to implementation. A guide to the implementation of the WHO multimodal hand hygiene improvement strategy. Available at: http://whqlibdoc.who.int/hq/2009/WHO_IER_PSP_2009.02_eng.pdf. Accessed October 9, 2014.
- , , , et al. Compliance of health care workers with hand hygiene practices: independent advantages of overt and covert observers. PLoS One. 2013;8(1):e53746.
- , , , et al. Systematic review of studies on compliance with hand hygiene guidelines in hospital care. Infect Control Hosp Epidemiol. 2010;31(3):283–294.
Healthcare‐associated infections are a major cause of illness and death in hospitalized patients, and preventing healthcare‐associated infection is a global challenge.[1] Worldwide, the prevalence of healthcare‐associated infections in developed and undeveloped countries ranges from 5.1% to 11.6% and 5.7% to 19.1%, respectively.[2] In the United States, roughly 2 million such infections occur annually, resulting in approximately 99,000 deaths[3] and estimated annual direct medical costs between $28.4 and $33.8 billion.[4] In Japan, nearly 9% of patients admitted to the intensive care unit (ICU) develop an infection during hospitalization,[5] and 5% of all patients hospitalized become infected with methicillin‐resistant Staphylococcus aureus.[6] The management of healthcare‐associated infections in Japan accounts for up to 5% of total annual healthcare costs, with an estimated $6.8 billion estimated to be potentially preventable.[7] In addition, healthcare‐associated infections are associated with increased length of stay in the hospital. Studies estimate surgical site infections extend length of stay by 9.7 days,[8] and bloodstream infections increase length of stay by 10 days.[9]
Improving hand hygiene practice for healthcare workers is considered a core strategy to decrease the incidence of healthcare‐associated infection.[6, 10] Specifically, the use of alcohol‐based hand rub is strongly recommended in acute care hospitals by both the World Health Organization (WHO) and the US Centers for Disease Control and Prevention.[11, 12] Improving hand hygiene adherence may reduce healthcare‐associated infection by 9% to 50%,[13, 14] and multiple studies have reported that greater use of alcohol‐based hand rubs results in significant reductions in healthcare‐associated infections.[14, 15]
Due to the difficulty in improving hand hygiene in various settings across the world, the WHO strategy for improving hand hygiene has been adopted and implemented by several studies in varying locations, such as Costa Rica, Italy, Mali, Pakistan, and Saudi Arabia.[16] Implementations of these multimodal strategies, following WHObased guidelines, have been shown to increase the level of hand hygiene adherence among healthcare workers and reduce infections at these locations.[14, 17, 18] This study expands upon that work by extending the same implementation strategy to assess the effectiveness of the introduction of alcohol‐based hand rub on hand hygiene practice at multiple hospitals in Japan.
In a previous article[19] we reported results from an observational study assessing healthcare worker hand hygiene adherence before touching the patient in 4 geographically diverse hospitals in Japan. The study reported that hand hygiene adherence in Japanese hospitals was lower than reported mean values from other international studies, and that greater adherence to hand hygiene should be encouraged. In this article, we present the results of a multimodal intervention intended to improve levels of healthcare worker hand hygiene in 3 of these hospitals.
METHODS
Participating Institutions
Three of the 4 hospitals participating in the prior observational study chose to participate in this intervention. Evaluation of hand hygiene practice was performed in at least 3 wards of each hospital including an inpatient surgical ward, an inpatient medicine ward, an ICU, or an emergency ward.
Table 1 lists the characteristics of the participating hospitals. Hospital A is a university‐affiliated, tertiary care medical center with 312 beds in East Japan. Although the hospital did not have an infection prevention unit or designated infection control nurses during the preintervention periods, the hospital hired a designated infection prevention nurse and established a department of infection prevention before this intervention in April 2012. Hospital B is a community‐based, tertiary care medical center with 428 beds, located in Midwest Japan. Although the facility had no infection control nurses at the outset of the study, a physician certified by the American Board of Internal Medicine and Infectious Diseases provided educational sessions of hand hygiene. Hospital B hired a designated infection prevention nurse and established a department of infection prevention in April 2012. Hospital C, located in Northern Japan, is a community‐based, tertiary care medical center with 562 beds. The department of infection prevention was established in 2010 and has 1 full‐time and 2 part‐time infection prevention nurses.
| Hospital A | Hospital B | Hospital C | ||||
|---|---|---|---|---|---|---|
| Preintervention | Postintervention | Preintervention | Postintervention | Preintervention | Postintervention | |
| ||||||
| Hospital characteristics | ||||||
| Location | East Japan | Midwest Japan | Northern Japan | |||
| Hospital type | University affiliated | Community based | Community based | |||
| Level of care | Tertiary care | Tertiary care | Tertiary care | |||
| Residency program | Yes | Yes | Yes | |||
| No. of beds | 250 | 312 | 428 | 428 | 550 | 562 |
| No. of employees | 398 | 475 | 1,035 | 1,263 | 1,500 | 1,568 |
| No. of physicians | 73 | 91 | 179 | 188 | 207 | 217 |
| No. of nurses | 172 | 210 | 410 | 540 | 616 | 800 |
| Infection control practice | ||||||
| Establishment of infection prevention units (year) | N/A | Yes (2012) | N/A | Yes (2012) | Yes (2010) | Yes |
| Employment of certified nurses in infection control (FTE) | 0 | 1 (1) | 0 | 1 (1) | 3 (1.5) | 3 (1.5) |
| Employment of ABIM‐IDcertified physician | 0 | 0 | 1 | 1 | 1 | 0 |
Role of the Funding Source
This study was unfunded. The prize for the contest was provided by an American collaborator (S.S.) who was not affiliated with any of the participating hospitals.
Intervention
In the prior preintervention study, hand hygiene adherence rates of healthcare workers were evaluated between July 2011 and November 2011.[19] To improve hand hygiene adherence in these facilities, we initiated a multimodal intervention based on WHO recommendations and the findings from the prior study. Each facility was provided the same guidance on how to improve hand hygiene adherence (Table 2) and encouraged to tailor the intervention to their local setting. As an added incentive, we initiated a contest, where the facility obtaining the highest hand hygiene adherence postintervention would win a trophy and 500,000 Japanese yen (approximately $5000 US dollars). The recommended strategies consisted of 15 components (Table 2): infrastructure (3 components), training and education (2 components), evaluation and feedback (5 components), reminder in the workplace (1 component), and institution safety climate (4 components). Of note, the participating institutions had already implemented a varying number of the intervention components prior to the start of the intervention. Each facility conducted a 6‐month intervention to improve hand hygiene adherence; however, the actual timing of interventions varied slightly by institution. Hospitals A and C conducted an intervention from October 2012 through March 2013, whereas hospital B's intervention was from April 2012 to September 2012. Details of the multimodal intervention performed at each participating hospital are shown in Table 3.
| Intervention Components | Description |
|---|---|
| 1. Infrastructure (3 components) | |
| Hand‐washing faucets for each room | At least 1 faucet and sink for each room was available. |
| Placement of alcohol hand rub at patient's room entrance | Alcohol hand rub was placed at all patient room entrances. |
| Portable alcohol hand rub distributed for each healthcare worker | Personal, portable alcohol hand rub dispensers were provided for healthcare workers who contact patients. |
| 2. Training/education (2 components) | |
| Educational resources | At least 1 physician or 1 nurse who provides educational sessions regarding hand hygiene practice was available. |
| Periodic seminars and lectures regarding hand hygiene education | Hospital‐wide hand hygiene seminar or educational activities were held during the intervention period. |
| 3. Evaluation and feedback (5 components) | |
| Evaluation of hand hygiene practice by direct observation | Hospitals utilize direct observation for healthcare worker's hand hygiene practice. |
| Evaluation of hand hygiene practice by monitoring the amount of alcohol hand rub consumption | Hospitals utilize the amount of alcohol hand rub consumption as a parameter for healthcare worker's hand hygiene practice. |
| Hand hygiene rate feedback at infection control committee | Hand hygiene adherence rate was reported and discussed at hospital infection control committee. |
| Hand hygiene rate feedback to the designated wards/units | Hand hygiene adherence rate was reported and discussed with healthcare workers at the designated wards/units where hand hygiene observation was performed. |
| Granting the award of top‐rated person of hand hygiene | Hospitals established the system to assess individual healthcare worker's hand hygiene adherence rate. |
| 4. Reminder in the workplace (1 components) | |
| Poster notification | Poster notification for hand hygiene practice was performed in the intervention period. |
| 5. Institutional safety climate (4 components) | |
| Commitment of hospital president or hospital executives | Hospital executives including the president agreed on the importance of hand hygiene practice and declared to healthcare workers to enhance hand hygiene practice during the intervention period. |
| Commitment of nurse managers and physician leaders | Commitment of improving hand hygiene practice by representative healthcare workers at the designated wards/units (eg, meeting by nurse manager or physician leaders at the designated wards/units and collaborative work with infection prevention services). |
| Meeting at the designated wards/units | A ward/unit‐level meeting or voluntary session for hands‐on hand hygiene practice by healthcare workers at the designated wards/units. |
| Identifying champions at the designated wards/units | An individual healthcare worker who contributed to improving hand hygiene practice was appointed. |
| Hospital A | Hospital Ba | Hospital C | ||||
|---|---|---|---|---|---|---|
| ||||||
| Intervention period | October 2012March 2013 | April 2012September 2012 | October 2012March 2013 | |||
| Evaluation of hand hygiene in the postintervention period | May 2013July 2013 | October 2012 | June 2013 | |||
| Suggested intervention components | Preintervention | Postintervention | Preintervention | Postintervention | Preintervention | Postintervention |
| No. of implemented components | 2/15 | 10/15 | 9/15 | 10/15 | 6/15 | 8/15 |
| Infrastructure (3 components) | ||||||
| Hand‐washing faucets for each room | No | No | Yes | Yes | Yes | Yes |
| Placement of alcohol hand rubs at patient's room entrance | Yes | Yes | Yes | Yes | Yes | Yes |
| Portable alcohol hand rub distributed for each healthcare worker | No | Yesb | No | Yesb | No | No |
| Training/education (2 components) | ||||||
| Educational resources | No | Yesb | Yes | Yesb | Yes | Yes |
| Periodic seminars and lectures regarding hand hygiene education | No | Yesb | Yes | Yes | Yes | Yes |
| Evaluation and feedback (5 components) | ||||||
| Evaluation of hand hygiene practice by direct observation | No | Yesb | Yes | Yes | No | No |
| Evaluation of hand hygiene practice by the amount of alcohol hand rub consumption | No | No | Yes | Yes | Yes | Yes |
| Hand hygiene rate feedback at infection control committee | No | Yesb | Yes | Yes | No | Yesb |
| Hand hygiene rate feedback to designated departments | No | Yesb | Yes | Yes | No | Yesb |
| Granting the award of top‐rated person | No | No | No | No | No | No |
| Reminders in the workplace (1 component) | ||||||
| Poster notification | Yes | Yes | Yes | Yes | Yes | Yes |
| 5. Institutional safety climate (4 components) | ||||||
| Commitment of hospital president or hospital executives | No | Yesb | No | No | No | No |
| Commitment of nurse managers and physicians leaders | No | Yesb | No | No | No | No |
| Meeting regarding hand hygiene practice by the designated wards/units | No | No | No | No | No | No |
| Identifying champions at the designated wards/units | No | No | No | No | No | No |
Observation of Hand Hygiene Practice
The same methods for hand hygiene observation used for the preintervention study was used for postintervention assessment. Ten distinct units across the 3 participating hospitals were evaluated for healthcare worker hand hygiene prior to patient contact. Three to 4 units were observed at each facility. One of the study authors (T.S.), a Japanese board‐certified infection control nurse, conducted all of the hand hygiene observations for both the preintervention and postintervention studies. Intraobserver variation was minimized by providing the same training outlined in the previous study.[19] Appropriate hand hygiene was defined as the use of soap and water or alcohol‐based hand rub before patient contact, which corresponds to the first moment of the WHO's 5 moments of hand hygiene.[11]
Hand hygiene practice prior to patient contact for each individual provider‐patient encounter was observed and recorded using the hand hygiene observation form adapted from a previous study by Saint et al.[6, 20] Identical to the preintervention study,[19] the form captured the following information: unit in which observations were performed, time of initiation and completion of observations, healthcare worker subgroup (physician or nurse), and the type of hand hygiene before patient contact (ie, hand washing with soap and water, use of alcohol‐based hand rub, or no hand hygiene). Unit physicians and nurses were informed that their clinical practices were going to be observed, but were not informed of the purpose of the observations (eg, hand hygiene adherence). To avoid interfering with clinical care delivery, the observer was given strict instructions to maintain a certain distance from the observed healthcare workers. The observer was instructed to leave immediately if asked for any reason by the unit staff or patients.
Statistical Analysis
Overall hand hygiene adherence rates were calculated and compared between the pre‐ and the postintervention periods. Comparison of hand hygiene adherence by healthcare worker subgroup and by hospital unit between the pre‐ and postintervention periods was also performed. Hand hygiene adherence rates were compared using JMP 9.0 and SAS 9.3 (SAS Institute Inc., Cary, NC). Comparison of hand hygiene adherence rates by observational periods was calculated by Pearson [2] tests, and 95% confidence intervals (CIs) were estimated using binomial distribution. Pearson correlations were used to determine the relationship of hand hygiene between physicians and nurses in the same unit. Two‐tailed P value0.05 was considered statistically significant. The study protocol was reviewed and approved by the ethics committees at the participating hospitals.
RESULTS
Data were collected from May 2013 to July 2013 in hospital A, in October 2012 in hospital B, and June 2013 in hospital C to ensure data were collected after the 6‐month intervention at each site. A total of 2982 observations of hand hygiene were performed in 10 distinct units across the 3 participating hospitals during the postintervention periods. Hand hygiene observations were performed during the day Monday through Friday between 8:30 am and 7:30 pm, with the majority occurring prior to 1:00 pm.
The overall postintervention hand hygiene adherence rate (in all 3 hospitals) was significantly higher at 32.7% (974/2982) adherence compared to 18.0% (482/2679) adherence in the preintervention period (P<0.001). An increased hand hygiene adherence rate in each participating hospital in the postintervention period was observed (Figure 1). Similar trends of higher overall hand hygiene adherence rates for both nurses and physicians in the postintervention period were seen. Use of alcohol‐based hand rub among those with appropriate hand hygiene was significantly higher, with 90.0% (880/974) using hand rub in the postintervention period versus 67.0% (322/482) in the preintervention period (P<0.001). Comparison of overall hand hygiene adherence rates by unit type and healthcare worker subgroup between the pre‐ and postintervention periods are shown in Table 4. Detailed comparisons of hand hygiene adherence rates for each hospital are available in the supplementary appendix. Although a significant improvement of hand hygiene practice was observed in the majority of participating units (6/10), there was a significant decline in hand hygiene practice in 2 units for nurses and 1 unit for physicians. Hand hygiene adherence rates by healthcare worker subgroups (both physicians and nurses) were significantly higher in the postintervention period than those in the preintervention period. Trends toward higher hand hygiene adherence rate of nurses in the postintervention period were observed (34.8% adherence for nurses compared to 30.4% adherence for physicians); the difference between nurses and physicians were not statistically significant (P=0.07).
| Ward/Unit | Healthcare Worker Subgroup | Preintervention Period | Postintervention Period | Improvement After Intervention (%) | P Value | ||
|---|---|---|---|---|---|---|---|
| No. of Observations | Hand hygiene Adherence (%) | No. of Observations | Hand Hygiene Adherence (%) | ||||
| |||||||
| All 3 hospitals | |||||||
| Surgery | Nurse | 455 | 20 | 480 | 40 | 20 | <0.001 |
| Physician | 424 | 18 | 448 | 43 | 25 | <0.001 | |
| All | 879 | 19 | 928 | 41 | 22 | <0.001 | |
| Medicine | Nurse | 455 | 23 | 508 | 39 | 16 | <0.001 |
| Physician | 435 | 15 | 452 | 33 | 18 | <0.001 | |
| All | 890 | 20 | 960 | 36 | 16 | <0.001 | |
| ICU | Nurse | 305 | 21 | 379 | 25 | 4 | 0.17 |
| Physician | 203 | 9 | 268 | 28 | 19 | <0.001 | |
| All | 508 | 16 | 647 | 26 | 10 | <0.001 | |
| ED | Nurse | 170 | 16 | 173 | 27 | 11 | 0.01 |
| Physician | 232 | 14 | 274 | 9 | ‐5 | 0.07 | |
| All | 402 | 15 | 447 | 16 | 1 | 0.64 | |
| All units | Nurse | 1385 | 21 | 1540 | 35 | 14 | <0.001 |
| Physician | 1294 | 15 | 1442 | 30 | 15 | <0.001 | |
| All | 2679 | 18 | 2982 | 33 | 15 | <0.001 | |
Hospital A achieved the highest postintervention adherence rates (39.9% adherence postintervention), as well as the greatest absolute improvement in hand hygiene (increase of 29.0%). There were significant improvements in 3 of the 4 participating units in hospital A, with the emergency department showing improvements only in the nurse subgroup. In hospital B, total hand hygiene adherence increased from 24.7% to 30.0% (P=0.01); however, this increase was mainly due to increase in hand hygiene adherence rates of nurses. There were significant increases in hand hygiene adherence rates for nurses in the medicine (+11%, P=0.04) and surgery wards (+14%, P=0.01), with nonsignificant increases for physicians (+10% medicine, P=0.07;+2% surgery, P=0.78). However, in the emergency department, nurses showed no significant improvement, and physicians had a significant decrease in adherence (15.7% preintervention vs 7.4% postintervention; P=0.02). In hospital C, total hand hygiene practice rates were significantly improved (from 18.9% to 26.5%; P<0.001); however, this was driven by improvements only in the surgical ward (14.6% preintervention to 42.3% postintervention; P<0.001). The rates for nurses declined significantly in both the medicine and ICU wards, leading to no observed improvements on those wards.
DISCUSSION
Our multicenter intervention study in Japan included observations from almost 3000 encounters between clinicians and patients. Before the intervention, the overall rate of hand hygiene adherence was 18%. After the multimodal intervention, the absolute increase in healthcare worker hand hygiene adherence was 15%. Although there was overall improvement, the adherence rates varied by hospital, with hospital A increasing by 29% and hospital B and C only attaining increases of 5% and 7%, respectively.
Despite the importance of hand hygiene of healthcare workers, it is challenging to increase hand hygiene adherence because it requires behavioral modification. Moreover, it remains uncertain what factors will affect healthcare worker behavior. We implemented pragmatic strategies to evaluate the efficacy of hand hygiene multimodal interventions based on internationally recognized WHO hand hygiene adherence strategies[11] and an institutional‐level contest with financial incentives. The findings in the current study help us understand not only how a multimodal intervention importantly improves hand hygiene adherence, but also what factors potentially make healthcare workers modify their behaviors.
In this study, we evaluated whether an institutional‐level contest with financial incentives contributed to improved hand hygiene adherence of healthcare workers. This study demonstrated improvement of hand hygiene practice after implementation of a multimodal hand hygiene intervention combined with an institutional‐level contest with financial incentives. The contest might have had a modest effect to help motivate the participating hospitals to improve their hand hygiene adherence rate. This is consistent with a previous study that demonstrated financial incentives were associated with modifying healthcare workers' hand hygiene practice.[21] However, we did not strictly standardize how the contest information was distributed in each participating institution and the objective assessment for changes in motivation by the contest was lacking in this study. Thus, changes in motivation by the contest with financial incentives likely varied by each participating institution. Further studies are needed to assess if this type of approach is worth pursuing.
We observed several noteworthy associations between the intervention components that were implemented at each facility and their improvement in hand hygiene adherence. Among the participating hospitals, hospital A was most successful with improving hand hygiene adherence, although all participating hospitals achieved a similar number of the 15 recommended intervention components during the intervention (8 to 10 per hospital). Interestingly, hospital A initiated the most new components during the intervention period (8 new components for a total of 10 out of 15), whereas hospital B and hospital C initiated only 1 or 2 new components during the intervention period. Hospital A also successfully involved hospital executives, and elicited the commitment of a nurse manager and physician leader. Consistent with a previous study,[22] we believe that involvement of hospital executives appears to be important to increase overall hand hygiene rate among healthcare workers.
In contrast, hospitals B and C did not involve senior executives or identify nurse or physician champions for all participating units. Based on the results in this study, we believe that the involvement of hospital executives is likely a key for the penetration of hospital‐wide hand hygiene culture among healthcare workers.
Although this study was unable to determine which components are precisely associated with improving hand hygiene adherence, the findings suggest initiating multiple intervention components at the same time may provide more motivation for change than initiating only 1 or 2 components at a time. It is also possible that certain intervention components were more beneficial than others. For example, hospital A, which achieved the most success, was the only hospital to obtain leadership support. Other studies have demonstrated that the presence of leadership appeared to play a key role in improving hand hygiene adherence.[23, 24] Moreover, a recent Japanese nationwide survey demonstrated higher safety centeredness was associated with regular use of standard infection prevention practice.[25] Consistent with a previous study, improving hand hygiene adherence cannot be simply achieved by improving infrastructure (eg, introduction of portable alcohol‐based hand rub) alone, but it depends on altering healthcare worker behavior.[26]
This study has several limitations. Because participating hospitals could tailor the specific interventions chosen for their facility, the improvement in hand hygiene adherence was likely multifactorial. We are unable in the existing study to determine a direct causal relationship between any of the individual intervention components and hand hygiene adherence. We are also unable to determine whether the improvements seen in hospital A were due to participation in the contest or due to the specific intervention components that were implemented. However, WHO hand hygiene guidelines point out that recognition of the importance of hand hygiene varies in different regions and countries, and the goal for hand hygiene interventions is to establish a culture of hand hygiene practice through pragmatic intervention strategies, frequent evaluation, and feedback to healthcare workers.[27] Thus, we prioritized pragmatic strategies to include in our intervention to promote hand hygiene adherence. Another limitation was the date of implementation of the multimodal intervention was slightly different at each facility. It was challenging to implement the intervention simultaneously across institutions due to competing priorities at each facility. Although the primary goal of hand hygiene is to reduce the burden of healthcare‐associated infection, we were unable to measure infection rates at the participating facilities. It is possible the presence of an external observer had an impact on the healthcare workers' behavior.[28] However, the healthcare workers were not informed as to what the observer was monitoring to minimize this potential effect. Lastly, the findings in this study provide immediate intervention effects but further study will be required to determine if these effects are sustainable.
Altering healthcare worker behavior is likely the key element to improve hand hygiene adherence, and behavioral modification may be achieved with the support of leadership at the unit and facility level. However, even though we found significant improvements in healthcare worker hand hygiene adherence after the intervention, the adherence rates are still relatively low compared to reported adherence rates from other countries,[29] suggesting further intervention is needed in this setting to optimize and hygiene practice. Because hand hygiene practice is a crucial strategy to prevent healthcare‐associated infections, every effort should be made to enhance the hand hygiene practice of healthcare workers.
Acknowledgements
The authors thank the International Ann Arbor Safety Collaborative (
Disclosure: Nothing to report.
- . Infection control—a problem for patient safety. N Engl J Med. 2003;348(7):651–656.
- World Health Organization. The burden of health care‐associated infection worldwide: a summary. Available at: http://www.who.int/gpsc/country_work/summary_20100430_en.pdf. Accessed October 6, 2014.
- , , , et al. Estimating health care‐associated infections and deaths in U.S. hospitals, 2002. Public Health Rep. 2007;122(2):160–166.
- . The direct medical costs of healthcare‐associated infections in U.S. hospitals and the benefits of prevention. Atlanta, GA: Centers for Disease Control and Prevention; 2009. Available at: http://www.cdc.gov/HAI/pdfs/hai/Scott_CostPaper.pdf. Accessed April 20, 2015.
- , , . Epidemiological approach to nosocomial infection surveillance data: the Japanese Nosocomial Infection Surveillance System. Environ Health Prev Med. 2008;13(1):30–35.
- , , , et al. Improving healthcare worker hand hygiene adherence before patient contact: a before‐and‐after five‐unit multimodal intervention in Tuscany. Qual Saf Health Care. 2009;18(6):429–433.
- . Economical efficiency of infection control. Antibiot Chemother (Northfield). 2004;20:635–638.
- , , , , , . Surgical site infection: incidence and impact on hospital utilization and treatment costs. Am J Infect Control. 2009;37(5):387–397.
- , , , , , . Hospital‐acquired, laboratory‐confirmed bloodstream infections: linking national surveillance data to clinical and financial hospital data to estimate increased length of stay and healthcare costs. J Hosp Infect. 2010;75(3):158–162.
- . APIC guideline for handwashing and hand antisepsis in health care settings. Am J Infect Control. 1995;23(4):251–269.
- World Health Organization. WHO Guidelines on Hand Hygiene in Health Care. Clean care is safer care: first global patient safety challenge. Geneva, Switzerland; 2009. Available at: http://www.who.int/gpsc/en/index.html. Accessed October 6, 2014.
- , ; Healthcare Infection Control Practices Advisory Committee, HICPAC SHEA APIC IDSA Hand Hygiene Task Force. Guideline for hand hygiene in health‐care settings. Recommendations of the Healthcare Infection Control Practices Advisory Committee and the HICPAC/SHEA/APIC/IDSA Hand Hygiene Task Force. Society for Healthcare Epidemiology of America/Association for Professionals in Infection Control/Infectious Diseases Society of America. MMWR Recomm Rep. 2002;51(RR‐16):1–45.
- National Patient Safety Agency. The economic case: implementing near‐patient alcohol hand rum in your trust. London, United Kingdom; 2004. Available at: http://www.npsa.nhs.uk/cleanyourhands/resource‐area/evidence‐base/?EntryId34=58433. Accessed October 9, 2014.
- , , , et al. Effectiveness of a hospital‐wide programme to improve compliance with hand hygiene. Infection Control Programme. Lancet. 2000;356(9238):1307–1312.
- , . Role of hand hygiene in healthcare‐associated infection prevention. J Hosp Infect. 2009;73(4):305–315.
- , , , et al. Global implementation of WHO's multimodal strategy for improvement of hand hygiene: a quasi‐experimental study. Lancet Infect Dis. 2013;13(10):843–851.
- , , , et al. Impact of the International Nosocomial Infection Control Consortium (INICC) multidimensional hand hygiene approach over 13 years in 51 cities of 19 limited‐resource countries from Latin America, Asia, the Middle East, and Europe. Infect Control Hosp Epidemiol. 2013;34(4):415–423.
- , , , . Bundling hand hygiene interventions and measurement to decrease health care‐associated infections. Am J Infect Control. 2012;40(4 suppl 1):S18–S27.
- , , , et al. Hand hygiene adherence among health care workers at Japanese hospitals: a multicenter observational study in Japan [published online April 8, 2014]. J Patient Saf. doi: 10.1097/PTS.0000000000000108.
- , , , et al. Marked variability in adherence to hand hygiene: a 5‐unit observational study in Tuscany. Am J Infect Control. 2009;37(4):306–310.
- , , , et al. Sustained improvement in hand hygiene adherence: utilizing shared accountability and financial incentives. Infect Control Hosp Epidemiol. 2013;34(11):1129–1136.
- , , , . Status of the implementation of the World Health Organization multimodal hand hygiene strategy in United States of America health care facilities. Am J Infect Control. 2014;42(3):224–230.
- , , , et al. The effect of leadership on hand hygiene: assessing hand hygiene adherence prior to patient contact in 2 infectious disease units in Tuscany. Infect Control Hosp Epidemiol. 2014;35(3):313–316.
- , , , , , . Impact of a hospital‐wide hand hygiene initiative on healthcare‐associated infections: results of an interrupted time series. BMJ Qual Saf. 2012;21(12):1019–1026.
- , , , , , . Health care‐associated infection prevention in Japan: the role of safety culture. Am J Infect Control. 2014;42(8):888–893.
- , , . Why healthcare workers don't wash their hands: a behavioral explanation. Infect Control Hosp Epidemiol. 2006;27(5):484–492.
- World Health Organization. Guide to implementation. A guide to the implementation of the WHO multimodal hand hygiene improvement strategy. Available at: http://whqlibdoc.who.int/hq/2009/WHO_IER_PSP_2009.02_eng.pdf. Accessed October 9, 2014.
- , , , et al. Compliance of health care workers with hand hygiene practices: independent advantages of overt and covert observers. PLoS One. 2013;8(1):e53746.
- , , , et al. Systematic review of studies on compliance with hand hygiene guidelines in hospital care. Infect Control Hosp Epidemiol. 2010;31(3):283–294.
© 2015 Society of Hospital Medicine
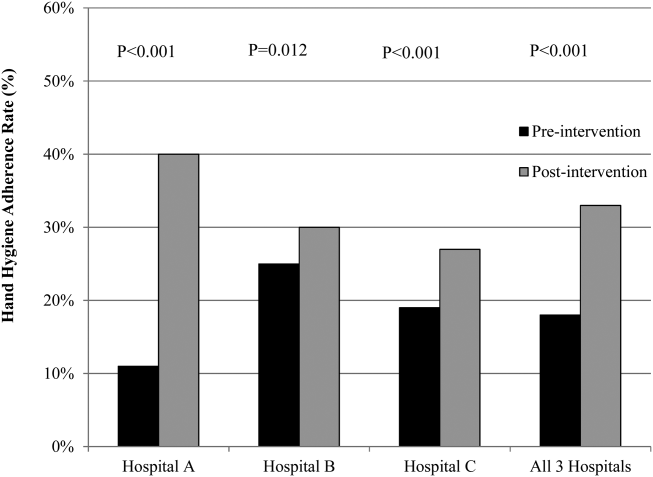
SIAD in Elderly Pneumonia Patients
One of the most common causes of hospitalization in the elderly is aspiration pneumonia related to dysphagia due to numerous underlying diseases.1 Thus, it is clinically important to identify prognostic factors associated with increased mortality in elderly patients with aspiration pneumonia. Hyponatremia is the most common electrolyte abnormality in hospitalized patients occurring in up to 11% of elderly patients in hospital.2 Previous studies have suggested that the presence and degree of hyponatremia is associated with the severity of pneumonia in adults and children, although the results have differed among studies.37
Hyponatremia is caused by various factors, including volume depletion, use of diuretics, hypothyroidism, adrenal insufficiency, heart failure, renal failure, and cirrhosis. Additionally, the syndrome of inappropriate antidiuresis (SIAD) is a frequent and heterogeneous disorder characterized by hyponatremia and impaired urinary dilution in the absence of any recognized stimulation of antidiuretic hormone secretion.8 Because not all patients with SIAD have elevated circulating levels of arginine vasopressin (AVP), the term SIAD is preferred to the term syndrome of inappropriate secretion of antidiuretic hormone (SIADH).9 One study has shown an association between the severity of pneumonia in children and the development of hyponatremia due to SIAD.10 To our knowledge, there have been no studies evaluating the impact of different causes of hyponatremia on mortality in elderly patients with aspiration pneumonia.
We therefore sought to investigate whether hyponatremia of all etiologies (all‐cause hyponatremia) was associated with mortality in elderly patients with aspiration pneumonia. Additionally, we compared the impact of hyponatremia due to SIAD, with hyponatremia of other etiologies, on mortality in this population
METHODS
Patients and Data Source
The Aspiration Pneumonia Dataset (APD) is the product of a retrospective analysis of elderly patients hospitalized with aspiration pneumonia from July 2004 to March 2007, performed by our second author (T.S.). The aim of the APD was to provide a dataset to allow for the development of a prediction rule for mortality, in elderly patients with aspiration pneumonia. All patients were hospitalized at Rakuwakai Otowa Hospital, in Kyoto, Japan, a 430‐bed community teaching hospital. Patients hospitalized with a diagnosis of aspiration pneumonia were identified, but those who required intensive care unit level care or intubation were excluded. The diagnosis of aspiration pneumonia was based on clinical evaluation, including a history of aspiration, a comorbidity associated with aspiration, symptoms or objective findings relevant to the respiratory system, and chest radiographic findings consistent with pneumonia.
From the APD dataset, we identified patients with hyponatremia at admission. After abstraction of the data, clinical charts were examined to obtain the data relevant to the etiologies of hyponatremia. The data were reviewed independently by 2 internal medicine physicians (J.M. and T.S.). Disagreements were resolved by consensus. Inter‐rater agreement was evaluated by using kappa statistics. The study was approved by the Ethics Committee of the Kyoto University Graduate School and Faculty of Medicine (project approval No. E290).
Definition of Hyponatremia and Its Causes
The definitions of hyponatremia and SIAD are given in Table 1. Hyponatremia was defined as serum sodium <135 mEq/L. Normonatremia was defined as serum sodium 135 mEq/L and 145 mEq/L, and hypernatremia was defined as serum sodium >145 mEq/L. Severity of hyponatremia was defined as mild (130 Na <135 mEq/L), moderate (125 Na <130 mEq/L), or severe (Na <125 mEq/L). Effective serum osmolality was calculated by the formula: [Effective serum osmolality (mOsm/kg H2O) = 2 Na (mEq/L) + glucose (mg/dL)/18].9 Hypotonic hyponatremia was defined as hyponatremia in the setting of effective serum osmolality <280 mOsm/kg H2O. Hypotonic hyponatremia was classified by extracellular fluid volume (ECFV) status as hypovolemic, SIAD euvolemic, non‐SIAD euvolemic or hypervolemic.11, 12
| Hypovolemic* | 1. Either of the terms volume depletion or hypovolemic documented in the admission notes. |
| 2. Clinical signs suggestive of volume depletion observed on physical examination and documented in admission notes (ie, dry oral cavity or dry skin in the axilla). | |
| 3. Volume depletion detected by biochemical or physiological examination (ie, metabolic alkalosis in arterial gas studies or collapsed inferior vena cava on echocardiography, respectively). | |
| 4. Increase in sodium concentration to within the normal range, together with decrease in blood urea nitrogen, following administration of hypotonic fluid. | |
| Euvolemic* | 1. The term euvolemic documented in admission notes. |
| 2. Criteria for hypovolemic and hypervolemic hyponatremia not met. | |
| Hypervolemic* | 1. The terms hypervolemic or an excess of ECFV documented in admission notes. |
| 2. Clinical signs suggestive of an excess of ECFV observed on physical examination and documented in admission notes (ie, edema or jugular venous distension). | |
| 3. Excess of ECFV detected by physiological examination (ie, dilated inferior vena cava on echocardiography). | |
| SIAD | Euvolemic hyponatremia with the following findings: |
| Urinary sodium concentration >30 mEq/L; | |
| Urinary osmolality >100 mOsm/kg H2O; | |
| Normal thyroid, adrenal, and renal function. | |
Clinical Outcomes
The primary outcome of analysis was defined as mortality within 30 days of admission (30‐day mortality). The secondary outcome was defined as mortality during the hospital stay (in‐hospital mortality).
Statistical Methods
First, for the subsequent analyses, we used a cohort from which hypernatremia and non‐hypotonic hyponatremia patients were excluded. Multivariate logistic regression was used to evaluate the impacts of hyponatremia and SIAD on the outcomes of interest. The following baseline risk factors associated with the severity of pneumonia in previous studies were considered for inclusion in the multivariate model1315: age, gender, living in a care facility, use of a feeding tube, disorientation, systolic blood pressure <90 mmHg or diastolic blood pressure <60 mmHg, heart rate >125 beats/min, body temperature <35C or >40C, respiratory failure (defined as oxygen saturation 90% or partial pressure of oxygen 60 mmHg or respiratory rate >30 breaths/min), blood glucose >250 mg/dL, anemia (defined as hematocrit <30%), blood urea nitrogen (BUN) >20 mg/dL, serum C‐reactive protein >10 mg/dL, serum albumin <3 g/dL, congestive heart failure, diabetes mellitus, chronic respiratory disease, malignancy, cirrhosis, chronic kidney failure, and central nervous system disease. The severity of pneumonia was evaluated by using the 6‐point scale of the A‐DROP (Age, Dehydration, Respiratory failure, Orientation disturbance, and low blood Pressure) scoring system proposed by the Japanese Respiratory Society.15 This is a modified version of the CURB‐65 (Confusion, Uremia, Respiratory rate, BP, age 65 years) clinical prediction rule and assesses the following parameters: age (men 70 years; women 75 years), dehydration (BUN concentration 21 mg/dL), respiratory failure (oxygen saturation 90%, partial pressure of oxygen 60 mmHg, ratio of partial pressure of oxygen to fraction of inspired oxygen 300), orientation disturbance (defined as disorientation at admission), and systolic blood pressure <90 mmHg. Patients with scores of 0 or 1 were classified as mild, patients scoring 2 as moderate, and patients scoring 3 to 5 as severe. In univariate analyses, the chi‐squared test was used. Those variables with P < 0.2 in the univariate analyses were included in the multivariate analyses. The HosmerLemeshow test was used to assess the goodness‐of‐fit for multivariate logistic regression models. Data were analyzed with STATA 10 (StataCorp, College Station, TX). Two‐tailed P values <0.05 were considered statistically significant.
RESULTS
The baseline characteristics of the study population are listed in Table 2. There were 221 elderly patients identified as having aspiration pneumonia. Of those, 65 (29%) had hyponatremia; 3 (5%) with non‐hypotonic and 62 (95%) with hypotonic hyponatremia. In the latter group, patients were characterized has having hypovolemic (39 [63%]), hypervolemic (3 [5%]), and euvolemic (20 [32%]) hyponatremia. Among the euvolemic patients, SIAD occurred in 14 (70%) of patients. Non‐SIAD euvolemic hyponatremia occurred in 6 (30%) patients and was associated with hypothyroidism (1 patient), adrenal insufficiency (1 patient), and was unclassifiable due to lack of available clinical data in 4 patients. The kappa value was 0.87 for inter‐rater agreement of the classification of hypotonic hyponatremia.
| |
| Age (yr) | 84 8.6* |
| Male | 90 (41) |
| Living in care facilities | 143 (65) |
| Use of a feeding tube | 40 (18) |
| Comorbidity | |
| Congestive heart failure | 21 (10) |
| Diabetes mellitus | 33 (15) |
| Chronic respiratory disease | 31 (14) |
| Malignancy | 14 (6) |
| Liver cirrhosis | 13 (6) |
| Chronic renal failure | 23 (10) |
| Central nervous system disease | 194 (88) |
| Disorientation | 36 (16) |
| Systolic blood pressure (mmHg) | 131 28* |
| Heart rate (beats/min) | 92 20* |
| Body temperature (C) | 37.5 1.1* |
| Respiratory rate (breaths/min) | 24 (IQR, 2030) |
| Oxygen saturation (%) | 95 (IQR, 9197) |
| pH | 7.44 (IQR, 7.407.47) |
| Glucose (mg/dL) | 140 57* |
| Hematocrit (%) | 34.7 5.9* |
| Blood urea nitrogen (mg/dL) | 22.7 15* |
| C‐reactive protein (mg/dL) | 5.2 (IQR, 1.811.7) |
| Albumin (g/dL) | 3.3 0.60* |
| A‐DROP severity class | |
| Mild (score, 0 or 1) | 83 (38) |
| Moderate (score, 2) | 84 (38) |
| Severe (score, 35) | 54 (24) |
| Sodium (mEq/L) | 137 6.98* |
| Sodium range (mEq/L) | 101162 |
| Distribution and classification of sodium concentration (mEq/L) | |
| Hypernatremia: Na >145 | 16 (7) |
| Normonatremia: 135 Na 145 | 140 (64) |
| Hyponatremia: Na <135 | 65 (29) |
| Mild: 130 Na <135 | 44 (20) |
| Moderate: 125 Na <130 | 11 (5) |
| Severe: Na <125 | 10 (4) |
| Length of stay (days) | 34.6 39* |
| 30‐day mortality | 28 (13) |
| LOS in these patients (days) | 14.7 9.6 |
| In‐hospital mortality | 63 (29) |
| LOS in these patients (days) | 41.9 33.8* |
The following variables were included in multivariate logistic analyses: congestive heart failure, cirrhosis, chronic renal failure, disorientation, body temperature <35C or >40C, anemia, and serum albumin <3 g/dL (see Supporting Information, Appendix, in the online version of this article).
In the multivariate logistic analyses, all‐cause hyponatremia was not associated with increased 30‐day mortality (odds ratio [OR] 1.85, 95% confidence interval [CI] 0.635.48; P = 0.262), but was associated with a trend toward increased risk of in‐hospital mortality (OR 2.10, 95% CI 1.004.42; P = 0.050) (Table 3). Moderate and severe hyponatremia were both significantly associated with increased in‐hospital mortality (OR 6.05, 95% CI 1.4625.0; P = 0.013 and OR 5.65, 95% CI 1.1428.1; P = 0.034, respectively). The same trends were observed for 30‐day mortality, although the results were not statistically significant. No such trend was observed for mild hyponatremia.
| Normonatremia | Hypotonic Hyponatremia | ||||
|---|---|---|---|---|---|
| All‐Cause | Mild | Moderate | Severe | ||
| n = 140 | n = 62 | n = 42 | n = 10 | n = 10 | |
| |||||
| 30‐day mortality, n (%) | 11 (8) | 11 (17) | 4 (10) | 2 (18) | 4 (60) |
| Odds ratio (95% CI) | 1 (ref) | 1.85 (0.635.48) | 1.30 (0.354.82) | 3.15 (0.5019.9) | 3.44 (0.5719.3) |
| P value | P = 0.262 | P = 0.691 | P = 0.222 | P = 0.184 | |
| In‐hospital mortality, n (%) | 28 (20) | 25 (39) | 10 (24) | 6 (55) | 7 (70) |
| Odds ratio (95% CI) | 1 (ref) | 2.10 (1.004.42) | 1.26 (0.523.07) | 6.05 (1.4625.0) | 5.65 (1.1428.1) |
| P value | P = 0.050 | P = 0.606 | P = 0.013 | P = 0.034 | |
In the multivariate logistic regression analyses, hypotonic hyponatremia due to SIAD was significantly associated with both increased risk of 30‐day mortality (OR 7.40, 95% CI 1.7331.7; P = 0.007) and increased risk of in‐hospital mortality (OR 22.3, 95% CI 4.26117; P < 0.001) (Table 4). In contrast, hypovolemic or non‐SIAD euvolemic hyponatremia was associated with neither increased risk of 30‐day mortality nor increased risk of in‐hospital mortality. There were too few hypervolemic hyponatremia patients for us to perform effective logistic analyses. The P values of the HosmerLemeshow tests were 0.45 for the multivariate logistic regression model (hypovolemic, SIAD, and non‐SIAD euvolemic vs normonatremia) with 30‐day mortality, and 0.30 for the model with in‐hospital mortality.
| Normonatremia | Hypotonic Hyponatremia | ||||
|---|---|---|---|---|---|
| Hypovolemic | Euvolemic | Hypervolemic | |||
| SIAD | non‐SIAD* | ||||
| n = 140 | n = 39 | n = 14 | n = 6 | n = 3 | |
| |||||
| 30‐day mortality, n (%) | 11 (8) | 2 (5) | 6 (43) | 1 (17) | 1 (33) |
| Odds ratio (95% CI) | 1 (ref) | 0.58 (0.113.10) | 7.40 (1.7331.7) | 2.71 (0.2430.6) | |
| P value | P = 0.525 | P = 0.007 | P = 0.421 | ||
| In‐hospital mortality, n (%) | 28 (20) | 7 (18) | 12 (86) | 1 (17) | 3 (100) |
| Odds ratio (95% CI) | 1 (ref) | 0.85 (0.322.30) | 22.3 (4.26117) | 0.93 (0.108.98) | |
| P value | P = 0.751 | P < 0.001 | P = 0.948 | ||
Six patients with SIAD were classified as having an A‐DROP severity class of mild, 4 as moderate, and 4 as severe (P = 0.908, Wilcoxon‐type test for trend). There was no association between the occurrence of SIAD and the severity of pneumonia.
DISCUSSION
We demonstrated that mortality in elderly patients with aspiration pneumonia was significantly associated with SIAD, but not with all‐cause hyponatremia. Unlike SIAD, other etiologies of hyponatremia were not associated with mortality in elderly patients with aspiration pneumonia. A recent study by Waikar and colleagues concluded that hyponatremia subgrouped by severity was not significantly associated with in‐hospital mortality in pneumonia patients, although a trend between severe hyponatremia and mortality was observed.16 Likewise, a study by Zilberberg and colleagues reported no significant increased risk of death with hyponatremia compared with normonatremia.4 These results are similar to our results for all‐cause hyponatremia and for hyponatremia subgrouped by severity. In contrast, a study by Nair and colleagues reported some increased risk of death with hyponatremia.5 Our results suggest that the heterogeneity of these previous results was probably due to the fact that SIAD was not identified in these other studies.
While the rationale for increased mortality in patients with pneumonia associated with SIAD is not known, it may be that there is a direct deleterious effect of elevated AVP. AVP has 3 distinct receptor subtypes, V1A, V1B, and V2. Stimulation of the V1A receptor in vascular smooth muscle promotes an increase in systemic vascular resistance, and stimulation of the same receptor in cardiac myocytes promotes myocyte hypertrophy. Stimulation of the V1B receptor in the anterior pituitary promotes adrenocorticotropic hormone release, and stimulation of the V2 receptor in the renal collecting ducts promotes an increase in water retention, which plays the main role in SIAD.1719 Our hypothesis in elderly SIAD patients with aspiration pneumonia is that increased AVP levels may lead not only to water retention and hyponatremia, but also to other effects such as vasoconstriction and myocyte hypertrophy, which may adversely influence the cardiovascular systems of elderly patients (Figure 1).

In our study, SIAD in elderly patients with aspiration pneumonia was more strongly associated with in‐hospital mortality than with 30‐day mortality. The average length of stay (LOS) of all patients dying in hospital (42 days) was significantly longer than the average LOS of those dying within 30 days of admission (15 days; P < 0.001, MannWhitney Test; Table 2). These findings suggest that SIAD was associated more strongly with longer‐term mortality than with acute‐stage mortality. The reason for the association between SIAD and longer‐term mortality remains unclear, although there may be some association between longer‐term mortality and the pathophysiologic mechanisms of AVP.
Our study has some limitations. First, because of the retrospective observational design, there is a potential for bias. We used multivariate analyses adjusted for confounding factors, however, other residual confounding factors may have remained. In addition, since the diagnosis of pneumonia was based on chart review, there may have been imprecision in the accuracy of diagnosing aspiration pneumonia. Aspiration pneumonia sometimes occurs without apparent episodes of aspiration, and this would have led to underdiagnosis. In contrast, aspiration pneumonitis can be mistaken for aspiration pneumonia; this would have led to overdiagnosis.
Second, volume status is difficult to evaluate prospectively, and thus by nature of our design, appropriate assignment of volume status was difficult. Several studies have used test infusions of isotonic saline to discriminate between these alternatives, but because our study was retrospective, we were unable to use this test.11, 20 Some studies have reported that, in patients in a state of volume depletion, volume repletion removes the stimulus for antidiuretic hormone release, allowing excess water to be excreted in a dilute urine and the serum sodium concentration to return toward normal.21, 22 According to this theory, instead of using an isotonic test infusion, we added in our study a criterion of volume depletion in which patients with a sustained increase in serum sodium concentration of 5 mEq/L and a sustained decrease in blood urea nitrogen, even with administration of hypotonic solution, were classified as volume depleted.
Third, all patients were analyzed according to status on admission, although some patients with hypovolemic hyponatremia at admission were found to have hyponatremia due to SIAD after admission.
Fourth, because the sample size of this study was small with our results revealing wide confidence intervals, an effect between other causes of hyponatremia and mortality might not have been identified. However, for 80% power, the calculated sample size was 100 non‐SIAD patients with aspiration pneumonia versus 10 SIAD patients, given that the mortality rate of elderly patients with aspiration pneumonia was, at a moderate estimate, 15% according to the studies of both Stukenborg and colleagues and Oliver and colleagues, and the mortality rate of SIAD patients was increased by 400% compared with that of non‐SIAD patients according to the study of Song and colleagues, with an alpha error of 0.05.7, 23, 24 Our sample size was therefore greater than the required size.
Fifth, because the APD dataset was compiled in 2007 for another study, it was not concurrent, and this may have led to other limitations in interpreting the data.
Finally, in Japan, the average length of hospital stay was 36.3 days in 2004 and 34.1 days in 2007much longer than other developed countries.25 Because of this situation, in‐hospital mortality, and not 30‐day mortality, represented long‐term mortality. Therefore, our results may not be easily applicable to the situation in other developed countries.
In conclusion, our results suggest that the presence of SIAD on admission in elderly patients with aspiration pneumonia is associated with increased mortality. This novel finding should be re‐evaluated, but it does raise the question of a direct, negative impact of AVP on patients' clinical outcomes. In the future, a larger prospective cohort study should be conducted to confirm the findings of this study, given the small sample size and the retrospective nature of the study. Additionally, a different population of pneumonia patients, such as those with community‐acquired pneumonia, should be examined to further evaluate the etiologies of hyponatremia in pneumonia and the association between hyponatremia of these different etiologies and mortality.
Acknowledgements
Disclosures: Jun Miyashita and Toshihiko Shimada report receiving a grant‐in‐aid from the Ministry of Health, Labour and Welfare of Japan, Development of Clinical Research Fellowship (Principal Investigator, Shunichi Fukuhara), grant H18‐001. No other potential conflict of interest relevant to this article was reported.
- ,.Aspiration pneumonia and dysphagia in the elderly.Chest.2003;124(1):328–336.
- ,.Hyponatraemia in the elderly.Age Ageing.1983;12(1):77–80.
- ,.Frequency and significance of electrolyte abnormalities in pneumonia.Indian Pediatr.1992;29(6):735–740.
- ,,, et al.Hyponatremia and hospital outcomes among patients with pneumonia: a retrospective cohort study.BMC Pulm Med.2008;8(2):16.
- ,,,.Hyponatremia in community‐acquired pneumonia.Am J Nephrol.2007;27(2):184–190.
- ,,,.Hyponatremia in pediatric community‐acquired pneumonia.Pediatr Nephrol.2008;23(12):2247–2253.
- ,,, et al.Epidemiology and clinical outcomes of community‐acquired pneumonia in adult patients in Asian countries: a prospective study by the Asian network for surveillance of resistant pathogens.Int J Antimicrob Agents.2008;31(2):107–114.
- ,.The syndrome of inappropriate secretion of antidiuretic hormone.Am J Med.1967;42(5):790–806.
- ,.Clinical practice. The syndrome of inappropriate antidiuresis.N Engl J Med.2007;356(20):2064–2072.
- ,,.Hyponatraemia and the inappropriate ADH syndrome in pneumonia.Ann Trop Paediatr.1992;12(4):455–462.
- ,,, et al.Value of fractional uric acid excretion in differential diagnosis of hyponatremic patients on diuretics.J Clin Endocrinol Metab.2008;93(8):2991–2997.
- ,.The syndrome of inappropriate antidiuretic hormone: prevalence, causes and consequences.Eur J Endocrinol.2010;162(suppl 1):S5–S12.
- ,,, et al.A prediction rule to identify low‐risk patients with community‐acquired pneumonia.N Engl J Med.1997;336(4):243–250.
- ,,, et al.Defining community acquired pneumonia severity on presentation to hospital: an international derivation and validation study.Thorax.2003;58(5):377–382.
- ,,, et al.Comparison of severity scoring systems A‐DROP and CURB‐65 for community‐acquired pneumonia.Respirology.2008;13(5):731–735.
- ,,.Mortality after hospitalization with mild, moderate, and severe hyponatremia.Am J Med.2009;122(9):857–865.
- .The role of vasopressin in congestive heart failure.Cleve Clin J Med.2006;73(suppl 3):S19–S23.
- .Vasopressin antagonists—progress and promise.N Engl J Med.2006;355(20):2146–2148.
- ,,, et al.A novel vasopressin dual V1A/V2 receptor antagonist, conivaptan hydrochloride, improves hyponatremia in rats with syndrome of inappropriate secretion of antidiuretic hormone (SIADH).Biol Pharm Bull.2007;30(1):91–95.
- ,.Clinical laboratory evaluation of the syndrome of inappropriate secretion of antidiuretic hormone.Clin J Am Soc Nephrol.2008;3(4):1175–1184.
- ,,,,,.Danger of central pontine myelinolysis in hypotonic dehydration and recommendation for treatment.Am J Med Sci.1989;298(1):41–43.
- ,.Treatment of hyponatremia: a quantitative analysis.Am J Kidney Dis.1993;21(4):439–443.
- ,,, et al.Hospital discharge abstract data on comorbidity improved the prediction of death among patients hospitalized with aspiration pneumonia.J Clin Epidemiol.2004;57(5):522–532.
- ,,, et al.Comorbid disease and the effect of race and ethnicity on in‐hospital mortality from aspiration pneumonia.J Natl Med Assoc.2004;96(11):1462–1469.
- Ministry of Health, Labour and Welfare, Japan. Health Statistics in Japan 2007. Available at: http://www.mhlw.go.jp/english/database/db‐hss/hs2007.html. Accessed August 18,2010.
One of the most common causes of hospitalization in the elderly is aspiration pneumonia related to dysphagia due to numerous underlying diseases.1 Thus, it is clinically important to identify prognostic factors associated with increased mortality in elderly patients with aspiration pneumonia. Hyponatremia is the most common electrolyte abnormality in hospitalized patients occurring in up to 11% of elderly patients in hospital.2 Previous studies have suggested that the presence and degree of hyponatremia is associated with the severity of pneumonia in adults and children, although the results have differed among studies.37
Hyponatremia is caused by various factors, including volume depletion, use of diuretics, hypothyroidism, adrenal insufficiency, heart failure, renal failure, and cirrhosis. Additionally, the syndrome of inappropriate antidiuresis (SIAD) is a frequent and heterogeneous disorder characterized by hyponatremia and impaired urinary dilution in the absence of any recognized stimulation of antidiuretic hormone secretion.8 Because not all patients with SIAD have elevated circulating levels of arginine vasopressin (AVP), the term SIAD is preferred to the term syndrome of inappropriate secretion of antidiuretic hormone (SIADH).9 One study has shown an association between the severity of pneumonia in children and the development of hyponatremia due to SIAD.10 To our knowledge, there have been no studies evaluating the impact of different causes of hyponatremia on mortality in elderly patients with aspiration pneumonia.
We therefore sought to investigate whether hyponatremia of all etiologies (all‐cause hyponatremia) was associated with mortality in elderly patients with aspiration pneumonia. Additionally, we compared the impact of hyponatremia due to SIAD, with hyponatremia of other etiologies, on mortality in this population
METHODS
Patients and Data Source
The Aspiration Pneumonia Dataset (APD) is the product of a retrospective analysis of elderly patients hospitalized with aspiration pneumonia from July 2004 to March 2007, performed by our second author (T.S.). The aim of the APD was to provide a dataset to allow for the development of a prediction rule for mortality, in elderly patients with aspiration pneumonia. All patients were hospitalized at Rakuwakai Otowa Hospital, in Kyoto, Japan, a 430‐bed community teaching hospital. Patients hospitalized with a diagnosis of aspiration pneumonia were identified, but those who required intensive care unit level care or intubation were excluded. The diagnosis of aspiration pneumonia was based on clinical evaluation, including a history of aspiration, a comorbidity associated with aspiration, symptoms or objective findings relevant to the respiratory system, and chest radiographic findings consistent with pneumonia.
From the APD dataset, we identified patients with hyponatremia at admission. After abstraction of the data, clinical charts were examined to obtain the data relevant to the etiologies of hyponatremia. The data were reviewed independently by 2 internal medicine physicians (J.M. and T.S.). Disagreements were resolved by consensus. Inter‐rater agreement was evaluated by using kappa statistics. The study was approved by the Ethics Committee of the Kyoto University Graduate School and Faculty of Medicine (project approval No. E290).
Definition of Hyponatremia and Its Causes
The definitions of hyponatremia and SIAD are given in Table 1. Hyponatremia was defined as serum sodium <135 mEq/L. Normonatremia was defined as serum sodium 135 mEq/L and 145 mEq/L, and hypernatremia was defined as serum sodium >145 mEq/L. Severity of hyponatremia was defined as mild (130 Na <135 mEq/L), moderate (125 Na <130 mEq/L), or severe (Na <125 mEq/L). Effective serum osmolality was calculated by the formula: [Effective serum osmolality (mOsm/kg H2O) = 2 Na (mEq/L) + glucose (mg/dL)/18].9 Hypotonic hyponatremia was defined as hyponatremia in the setting of effective serum osmolality <280 mOsm/kg H2O. Hypotonic hyponatremia was classified by extracellular fluid volume (ECFV) status as hypovolemic, SIAD euvolemic, non‐SIAD euvolemic or hypervolemic.11, 12
| Hypovolemic* | 1. Either of the terms volume depletion or hypovolemic documented in the admission notes. |
| 2. Clinical signs suggestive of volume depletion observed on physical examination and documented in admission notes (ie, dry oral cavity or dry skin in the axilla). | |
| 3. Volume depletion detected by biochemical or physiological examination (ie, metabolic alkalosis in arterial gas studies or collapsed inferior vena cava on echocardiography, respectively). | |
| 4. Increase in sodium concentration to within the normal range, together with decrease in blood urea nitrogen, following administration of hypotonic fluid. | |
| Euvolemic* | 1. The term euvolemic documented in admission notes. |
| 2. Criteria for hypovolemic and hypervolemic hyponatremia not met. | |
| Hypervolemic* | 1. The terms hypervolemic or an excess of ECFV documented in admission notes. |
| 2. Clinical signs suggestive of an excess of ECFV observed on physical examination and documented in admission notes (ie, edema or jugular venous distension). | |
| 3. Excess of ECFV detected by physiological examination (ie, dilated inferior vena cava on echocardiography). | |
| SIAD | Euvolemic hyponatremia with the following findings: |
| Urinary sodium concentration >30 mEq/L; | |
| Urinary osmolality >100 mOsm/kg H2O; | |
| Normal thyroid, adrenal, and renal function. | |
Clinical Outcomes
The primary outcome of analysis was defined as mortality within 30 days of admission (30‐day mortality). The secondary outcome was defined as mortality during the hospital stay (in‐hospital mortality).
Statistical Methods
First, for the subsequent analyses, we used a cohort from which hypernatremia and non‐hypotonic hyponatremia patients were excluded. Multivariate logistic regression was used to evaluate the impacts of hyponatremia and SIAD on the outcomes of interest. The following baseline risk factors associated with the severity of pneumonia in previous studies were considered for inclusion in the multivariate model1315: age, gender, living in a care facility, use of a feeding tube, disorientation, systolic blood pressure <90 mmHg or diastolic blood pressure <60 mmHg, heart rate >125 beats/min, body temperature <35C or >40C, respiratory failure (defined as oxygen saturation 90% or partial pressure of oxygen 60 mmHg or respiratory rate >30 breaths/min), blood glucose >250 mg/dL, anemia (defined as hematocrit <30%), blood urea nitrogen (BUN) >20 mg/dL, serum C‐reactive protein >10 mg/dL, serum albumin <3 g/dL, congestive heart failure, diabetes mellitus, chronic respiratory disease, malignancy, cirrhosis, chronic kidney failure, and central nervous system disease. The severity of pneumonia was evaluated by using the 6‐point scale of the A‐DROP (Age, Dehydration, Respiratory failure, Orientation disturbance, and low blood Pressure) scoring system proposed by the Japanese Respiratory Society.15 This is a modified version of the CURB‐65 (Confusion, Uremia, Respiratory rate, BP, age 65 years) clinical prediction rule and assesses the following parameters: age (men 70 years; women 75 years), dehydration (BUN concentration 21 mg/dL), respiratory failure (oxygen saturation 90%, partial pressure of oxygen 60 mmHg, ratio of partial pressure of oxygen to fraction of inspired oxygen 300), orientation disturbance (defined as disorientation at admission), and systolic blood pressure <90 mmHg. Patients with scores of 0 or 1 were classified as mild, patients scoring 2 as moderate, and patients scoring 3 to 5 as severe. In univariate analyses, the chi‐squared test was used. Those variables with P < 0.2 in the univariate analyses were included in the multivariate analyses. The HosmerLemeshow test was used to assess the goodness‐of‐fit for multivariate logistic regression models. Data were analyzed with STATA 10 (StataCorp, College Station, TX). Two‐tailed P values <0.05 were considered statistically significant.
RESULTS
The baseline characteristics of the study population are listed in Table 2. There were 221 elderly patients identified as having aspiration pneumonia. Of those, 65 (29%) had hyponatremia; 3 (5%) with non‐hypotonic and 62 (95%) with hypotonic hyponatremia. In the latter group, patients were characterized has having hypovolemic (39 [63%]), hypervolemic (3 [5%]), and euvolemic (20 [32%]) hyponatremia. Among the euvolemic patients, SIAD occurred in 14 (70%) of patients. Non‐SIAD euvolemic hyponatremia occurred in 6 (30%) patients and was associated with hypothyroidism (1 patient), adrenal insufficiency (1 patient), and was unclassifiable due to lack of available clinical data in 4 patients. The kappa value was 0.87 for inter‐rater agreement of the classification of hypotonic hyponatremia.
| |
| Age (yr) | 84 8.6* |
| Male | 90 (41) |
| Living in care facilities | 143 (65) |
| Use of a feeding tube | 40 (18) |
| Comorbidity | |
| Congestive heart failure | 21 (10) |
| Diabetes mellitus | 33 (15) |
| Chronic respiratory disease | 31 (14) |
| Malignancy | 14 (6) |
| Liver cirrhosis | 13 (6) |
| Chronic renal failure | 23 (10) |
| Central nervous system disease | 194 (88) |
| Disorientation | 36 (16) |
| Systolic blood pressure (mmHg) | 131 28* |
| Heart rate (beats/min) | 92 20* |
| Body temperature (C) | 37.5 1.1* |
| Respiratory rate (breaths/min) | 24 (IQR, 2030) |
| Oxygen saturation (%) | 95 (IQR, 9197) |
| pH | 7.44 (IQR, 7.407.47) |
| Glucose (mg/dL) | 140 57* |
| Hematocrit (%) | 34.7 5.9* |
| Blood urea nitrogen (mg/dL) | 22.7 15* |
| C‐reactive protein (mg/dL) | 5.2 (IQR, 1.811.7) |
| Albumin (g/dL) | 3.3 0.60* |
| A‐DROP severity class | |
| Mild (score, 0 or 1) | 83 (38) |
| Moderate (score, 2) | 84 (38) |
| Severe (score, 35) | 54 (24) |
| Sodium (mEq/L) | 137 6.98* |
| Sodium range (mEq/L) | 101162 |
| Distribution and classification of sodium concentration (mEq/L) | |
| Hypernatremia: Na >145 | 16 (7) |
| Normonatremia: 135 Na 145 | 140 (64) |
| Hyponatremia: Na <135 | 65 (29) |
| Mild: 130 Na <135 | 44 (20) |
| Moderate: 125 Na <130 | 11 (5) |
| Severe: Na <125 | 10 (4) |
| Length of stay (days) | 34.6 39* |
| 30‐day mortality | 28 (13) |
| LOS in these patients (days) | 14.7 9.6 |
| In‐hospital mortality | 63 (29) |
| LOS in these patients (days) | 41.9 33.8* |
The following variables were included in multivariate logistic analyses: congestive heart failure, cirrhosis, chronic renal failure, disorientation, body temperature <35C or >40C, anemia, and serum albumin <3 g/dL (see Supporting Information, Appendix, in the online version of this article).
In the multivariate logistic analyses, all‐cause hyponatremia was not associated with increased 30‐day mortality (odds ratio [OR] 1.85, 95% confidence interval [CI] 0.635.48; P = 0.262), but was associated with a trend toward increased risk of in‐hospital mortality (OR 2.10, 95% CI 1.004.42; P = 0.050) (Table 3). Moderate and severe hyponatremia were both significantly associated with increased in‐hospital mortality (OR 6.05, 95% CI 1.4625.0; P = 0.013 and OR 5.65, 95% CI 1.1428.1; P = 0.034, respectively). The same trends were observed for 30‐day mortality, although the results were not statistically significant. No such trend was observed for mild hyponatremia.
| Normonatremia | Hypotonic Hyponatremia | ||||
|---|---|---|---|---|---|
| All‐Cause | Mild | Moderate | Severe | ||
| n = 140 | n = 62 | n = 42 | n = 10 | n = 10 | |
| |||||
| 30‐day mortality, n (%) | 11 (8) | 11 (17) | 4 (10) | 2 (18) | 4 (60) |
| Odds ratio (95% CI) | 1 (ref) | 1.85 (0.635.48) | 1.30 (0.354.82) | 3.15 (0.5019.9) | 3.44 (0.5719.3) |
| P value | P = 0.262 | P = 0.691 | P = 0.222 | P = 0.184 | |
| In‐hospital mortality, n (%) | 28 (20) | 25 (39) | 10 (24) | 6 (55) | 7 (70) |
| Odds ratio (95% CI) | 1 (ref) | 2.10 (1.004.42) | 1.26 (0.523.07) | 6.05 (1.4625.0) | 5.65 (1.1428.1) |
| P value | P = 0.050 | P = 0.606 | P = 0.013 | P = 0.034 | |
In the multivariate logistic regression analyses, hypotonic hyponatremia due to SIAD was significantly associated with both increased risk of 30‐day mortality (OR 7.40, 95% CI 1.7331.7; P = 0.007) and increased risk of in‐hospital mortality (OR 22.3, 95% CI 4.26117; P < 0.001) (Table 4). In contrast, hypovolemic or non‐SIAD euvolemic hyponatremia was associated with neither increased risk of 30‐day mortality nor increased risk of in‐hospital mortality. There were too few hypervolemic hyponatremia patients for us to perform effective logistic analyses. The P values of the HosmerLemeshow tests were 0.45 for the multivariate logistic regression model (hypovolemic, SIAD, and non‐SIAD euvolemic vs normonatremia) with 30‐day mortality, and 0.30 for the model with in‐hospital mortality.
| Normonatremia | Hypotonic Hyponatremia | ||||
|---|---|---|---|---|---|
| Hypovolemic | Euvolemic | Hypervolemic | |||
| SIAD | non‐SIAD* | ||||
| n = 140 | n = 39 | n = 14 | n = 6 | n = 3 | |
| |||||
| 30‐day mortality, n (%) | 11 (8) | 2 (5) | 6 (43) | 1 (17) | 1 (33) |
| Odds ratio (95% CI) | 1 (ref) | 0.58 (0.113.10) | 7.40 (1.7331.7) | 2.71 (0.2430.6) | |
| P value | P = 0.525 | P = 0.007 | P = 0.421 | ||
| In‐hospital mortality, n (%) | 28 (20) | 7 (18) | 12 (86) | 1 (17) | 3 (100) |
| Odds ratio (95% CI) | 1 (ref) | 0.85 (0.322.30) | 22.3 (4.26117) | 0.93 (0.108.98) | |
| P value | P = 0.751 | P < 0.001 | P = 0.948 | ||
Six patients with SIAD were classified as having an A‐DROP severity class of mild, 4 as moderate, and 4 as severe (P = 0.908, Wilcoxon‐type test for trend). There was no association between the occurrence of SIAD and the severity of pneumonia.
DISCUSSION
We demonstrated that mortality in elderly patients with aspiration pneumonia was significantly associated with SIAD, but not with all‐cause hyponatremia. Unlike SIAD, other etiologies of hyponatremia were not associated with mortality in elderly patients with aspiration pneumonia. A recent study by Waikar and colleagues concluded that hyponatremia subgrouped by severity was not significantly associated with in‐hospital mortality in pneumonia patients, although a trend between severe hyponatremia and mortality was observed.16 Likewise, a study by Zilberberg and colleagues reported no significant increased risk of death with hyponatremia compared with normonatremia.4 These results are similar to our results for all‐cause hyponatremia and for hyponatremia subgrouped by severity. In contrast, a study by Nair and colleagues reported some increased risk of death with hyponatremia.5 Our results suggest that the heterogeneity of these previous results was probably due to the fact that SIAD was not identified in these other studies.
While the rationale for increased mortality in patients with pneumonia associated with SIAD is not known, it may be that there is a direct deleterious effect of elevated AVP. AVP has 3 distinct receptor subtypes, V1A, V1B, and V2. Stimulation of the V1A receptor in vascular smooth muscle promotes an increase in systemic vascular resistance, and stimulation of the same receptor in cardiac myocytes promotes myocyte hypertrophy. Stimulation of the V1B receptor in the anterior pituitary promotes adrenocorticotropic hormone release, and stimulation of the V2 receptor in the renal collecting ducts promotes an increase in water retention, which plays the main role in SIAD.1719 Our hypothesis in elderly SIAD patients with aspiration pneumonia is that increased AVP levels may lead not only to water retention and hyponatremia, but also to other effects such as vasoconstriction and myocyte hypertrophy, which may adversely influence the cardiovascular systems of elderly patients (Figure 1).
In our study, SIAD in elderly patients with aspiration pneumonia was more strongly associated with in‐hospital mortality than with 30‐day mortality. The average length of stay (LOS) of all patients dying in hospital (42 days) was significantly longer than the average LOS of those dying within 30 days of admission (15 days; P < 0.001, MannWhitney Test; Table 2). These findings suggest that SIAD was associated more strongly with longer‐term mortality than with acute‐stage mortality. The reason for the association between SIAD and longer‐term mortality remains unclear, although there may be some association between longer‐term mortality and the pathophysiologic mechanisms of AVP.
Our study has some limitations. First, because of the retrospective observational design, there is a potential for bias. We used multivariate analyses adjusted for confounding factors, however, other residual confounding factors may have remained. In addition, since the diagnosis of pneumonia was based on chart review, there may have been imprecision in the accuracy of diagnosing aspiration pneumonia. Aspiration pneumonia sometimes occurs without apparent episodes of aspiration, and this would have led to underdiagnosis. In contrast, aspiration pneumonitis can be mistaken for aspiration pneumonia; this would have led to overdiagnosis.
Second, volume status is difficult to evaluate prospectively, and thus by nature of our design, appropriate assignment of volume status was difficult. Several studies have used test infusions of isotonic saline to discriminate between these alternatives, but because our study was retrospective, we were unable to use this test.11, 20 Some studies have reported that, in patients in a state of volume depletion, volume repletion removes the stimulus for antidiuretic hormone release, allowing excess water to be excreted in a dilute urine and the serum sodium concentration to return toward normal.21, 22 According to this theory, instead of using an isotonic test infusion, we added in our study a criterion of volume depletion in which patients with a sustained increase in serum sodium concentration of 5 mEq/L and a sustained decrease in blood urea nitrogen, even with administration of hypotonic solution, were classified as volume depleted.
Third, all patients were analyzed according to status on admission, although some patients with hypovolemic hyponatremia at admission were found to have hyponatremia due to SIAD after admission.
Fourth, because the sample size of this study was small with our results revealing wide confidence intervals, an effect between other causes of hyponatremia and mortality might not have been identified. However, for 80% power, the calculated sample size was 100 non‐SIAD patients with aspiration pneumonia versus 10 SIAD patients, given that the mortality rate of elderly patients with aspiration pneumonia was, at a moderate estimate, 15% according to the studies of both Stukenborg and colleagues and Oliver and colleagues, and the mortality rate of SIAD patients was increased by 400% compared with that of non‐SIAD patients according to the study of Song and colleagues, with an alpha error of 0.05.7, 23, 24 Our sample size was therefore greater than the required size.
Fifth, because the APD dataset was compiled in 2007 for another study, it was not concurrent, and this may have led to other limitations in interpreting the data.
Finally, in Japan, the average length of hospital stay was 36.3 days in 2004 and 34.1 days in 2007much longer than other developed countries.25 Because of this situation, in‐hospital mortality, and not 30‐day mortality, represented long‐term mortality. Therefore, our results may not be easily applicable to the situation in other developed countries.
In conclusion, our results suggest that the presence of SIAD on admission in elderly patients with aspiration pneumonia is associated with increased mortality. This novel finding should be re‐evaluated, but it does raise the question of a direct, negative impact of AVP on patients' clinical outcomes. In the future, a larger prospective cohort study should be conducted to confirm the findings of this study, given the small sample size and the retrospective nature of the study. Additionally, a different population of pneumonia patients, such as those with community‐acquired pneumonia, should be examined to further evaluate the etiologies of hyponatremia in pneumonia and the association between hyponatremia of these different etiologies and mortality.
Acknowledgements
Disclosures: Jun Miyashita and Toshihiko Shimada report receiving a grant‐in‐aid from the Ministry of Health, Labour and Welfare of Japan, Development of Clinical Research Fellowship (Principal Investigator, Shunichi Fukuhara), grant H18‐001. No other potential conflict of interest relevant to this article was reported.
- ,.Aspiration pneumonia and dysphagia in the elderly.Chest.2003;124(1):328–336.
- ,.Hyponatraemia in the elderly.Age Ageing.1983;12(1):77–80.
- ,.Frequency and significance of electrolyte abnormalities in pneumonia.Indian Pediatr.1992;29(6):735–740.
- ,,, et al.Hyponatremia and hospital outcomes among patients with pneumonia: a retrospective cohort study.BMC Pulm Med.2008;8(2):16.
- ,,,.Hyponatremia in community‐acquired pneumonia.Am J Nephrol.2007;27(2):184–190.
- ,,,.Hyponatremia in pediatric community‐acquired pneumonia.Pediatr Nephrol.2008;23(12):2247–2253.
- ,,, et al.Epidemiology and clinical outcomes of community‐acquired pneumonia in adult patients in Asian countries: a prospective study by the Asian network for surveillance of resistant pathogens.Int J Antimicrob Agents.2008;31(2):107–114.
- ,.The syndrome of inappropriate secretion of antidiuretic hormone.Am J Med.1967;42(5):790–806.
- ,.Clinical practice. The syndrome of inappropriate antidiuresis.N Engl J Med.2007;356(20):2064–2072.
- ,,.Hyponatraemia and the inappropriate ADH syndrome in pneumonia.Ann Trop Paediatr.1992;12(4):455–462.
- ,,, et al.Value of fractional uric acid excretion in differential diagnosis of hyponatremic patients on diuretics.J Clin Endocrinol Metab.2008;93(8):2991–2997.
- ,.The syndrome of inappropriate antidiuretic hormone: prevalence, causes and consequences.Eur J Endocrinol.2010;162(suppl 1):S5–S12.
- ,,, et al.A prediction rule to identify low‐risk patients with community‐acquired pneumonia.N Engl J Med.1997;336(4):243–250.
- ,,, et al.Defining community acquired pneumonia severity on presentation to hospital: an international derivation and validation study.Thorax.2003;58(5):377–382.
- ,,, et al.Comparison of severity scoring systems A‐DROP and CURB‐65 for community‐acquired pneumonia.Respirology.2008;13(5):731–735.
- ,,.Mortality after hospitalization with mild, moderate, and severe hyponatremia.Am J Med.2009;122(9):857–865.
- .The role of vasopressin in congestive heart failure.Cleve Clin J Med.2006;73(suppl 3):S19–S23.
- .Vasopressin antagonists—progress and promise.N Engl J Med.2006;355(20):2146–2148.
- ,,, et al.A novel vasopressin dual V1A/V2 receptor antagonist, conivaptan hydrochloride, improves hyponatremia in rats with syndrome of inappropriate secretion of antidiuretic hormone (SIADH).Biol Pharm Bull.2007;30(1):91–95.
- ,.Clinical laboratory evaluation of the syndrome of inappropriate secretion of antidiuretic hormone.Clin J Am Soc Nephrol.2008;3(4):1175–1184.
- ,,,,,.Danger of central pontine myelinolysis in hypotonic dehydration and recommendation for treatment.Am J Med Sci.1989;298(1):41–43.
- ,.Treatment of hyponatremia: a quantitative analysis.Am J Kidney Dis.1993;21(4):439–443.
- ,,, et al.Hospital discharge abstract data on comorbidity improved the prediction of death among patients hospitalized with aspiration pneumonia.J Clin Epidemiol.2004;57(5):522–532.
- ,,, et al.Comorbid disease and the effect of race and ethnicity on in‐hospital mortality from aspiration pneumonia.J Natl Med Assoc.2004;96(11):1462–1469.
- Ministry of Health, Labour and Welfare, Japan. Health Statistics in Japan 2007. Available at: http://www.mhlw.go.jp/english/database/db‐hss/hs2007.html. Accessed August 18,2010.
Copyright © 2012 Society of Hospital Medicine