User login
Multifaceted Hospitalist QI Intervention
Waste in US healthcare is a public health threat, with an estimated value of $910 billion per year.[1] It constitutes some of the relatively high per‐discharge healthcare spending seen in the United States when compared to other nations.[2] Waste takes many forms, one of which is excessive use of diagnostic laboratory testing.[1] Many hospital providers obtain common labs, such as complete blood counts (CBCs) and basic metabolic panels (BMPs), in an open‐ended, daily manner for their hospitalized patients, without regard for the patient's clinical condition or despite stability of the previous results. Reasons for ordering these tests in a nonpatient‐centered manner include provider convenience (such as inclusion in an order set), ease of access, habit, or defensive practice.[3, 4, 5] All of these reasons may represent waste.
Although the potential waste of routine daily labs may seem small, the frequency with which they are ordered results in a substantial real and potential cost, both financially and clinically. Multiple studies have shown a link between excessive diagnostic phlebotomy and hospital‐acquired anemia.[6, 7, 8, 9] Hospital‐acquired anemia itself has been associated with increased mortality.[10] In addition to blood loss and financial cost, patient experience and satisfaction are also detrimentally affected by excessive laboratory testing in the form of pain and inconvenience from the act of phlebotomy.[11]
There are many reports of strategies to decrease excessive diagnostic laboratory testing as a means of addressing this waste in the inpatient setting.[12, 13, 14, 15, 16, 17, 18, 19, 20, 21] All of these studies have taken place in a traditional academic setting, and many implemented their intervention through a computer‐based order entry system. Based on the literature search regarding this topic, we found no examples of studies conducted among and within community‐based hospitalist practices. More recently, this issue was highlighted as part of the Choosing Wisely campaign sponsored by the American Board of Internal Medicine Foundation, Consumer Reports, and more than 60 specialty societies. The Society of Hospital Medicine, the professional society for hospitalists, recommended avoidance of repetitive common laboratory testing in the face of clinical stability.[22]
Much has been written about quality improvement (QI) by the Institute for Healthcare Improvement, the Society of Hospitalist Medicine, and others.[23, 24, 25] How best to move from a Choosing Wisely recommendation to highly reliable incorporation in clinical practice in a community setting is not known and likely varies depending upon the care environment. Successful QI interventions are often multifaceted and include academic detailing and provider education, transparent display of data, and regular audit and feedback of performance data.[26, 27, 28, 29] Prior to the publication of the Society of Hospital Medicine's Choosing Wisely recommendations, we chose to implement the recommendation to decrease ordering of daily labs using 3 QI strategies in our community 4‐hospital health system.
METHODS
Study Participants
This activity was undertaken as a QI initiative by Swedish Hospital Medicine (SHM), a 53‐provider employed hospitalist group that staffs a total of 1420 beds across 4 inpatient facilities. SHM has a longstanding record of working together as a team on QI projects.
An informal preliminary audit of our common lab ordering by a member of the study team revealed multiple examples of labs ordered every day without medical‐record evidence of intervention or management decisions being made based on the results. This preliminary activity raised the notion within the hospitalist group that this was a topic ripe for intervention and improvement. Four common labs, CBC, BMP, nutrition panel (called TPN 2 in our system, consisting of a BMP and magnesium and phosphorus) and comprehensive metabolic panel (BMP and liver function tests), formed the bulk of the repetitively ordered labs and were the focus of our activity. We excluded prothrombin time/International Normalized Ratio, as it was less clear that obtaining these daily clearly represented waste. We then reviewed medical literature for successful QI strategies and chose academic detailing, transparent display of data, and audit and feedback as our QI tactics.[29]
Using data from our electronic medical record, we chose a convenience preintervention period of 10 months for our baseline data. We allowed for a 2‐month wash‐in period in August 2013, and a convenience period of 7 months was chosen as the intervention period.
Intervention
An introductory email was sent out in mid‐August 2013 to all hospitalist providers describing the waste and potential harm to patients associated with unnecessary common blood tests, in particular those ordered as daily. The email recommended 2 changes: (1) immediate cessation of the practice of ordering common labs as daily, in an open, unending manner and (2) assessing the need for common labs in the next 24 hours, and ordering based on that need, but no further into the future.
Hospitalist providers were additionally informed that the number of common labs ordered daily would be tracked prospectively, with monthly reporting of individual provider ordering. In addition, the 5 members of the hospitalist team who most frequently ordered common labs as daily during January 2013 to March 2013 were sent individual emails informing them of their top‐5 position.
During the 7‐month intervention period, a monthly email was sent to all members of the hospitalist team with 4 basic components: (1) reiteration of the recommendations and reasoning stated in the original email; (2) a list of all members of the hospitalist team and the corresponding frequency of common labs ordered as daily (open ended) per provider for the month; (3) a recommendation to discontinue any common labs ordered as daily; and (4) at least 1 example of a patient cared for during the month by the hospitalist team, who had at least 1 common lab ordered for at least 5 days in a row, with no mention of the results in the progress notes and no apparent contribution to the management of the medical conditions for which the patient was being treated.
The change in number of tests ordered during the intervention was not shared with the team until early January 2014.
Data Elements and Endpoints
Number of common labs ordered as daily, and the total number of common labs per hospital‐day, ordered by any frequency, on hospitalist patients were abstracted from the electronic medical record. Hospitalist patients were defined as those both admitted and discharged by a hospitalist provider. We chose to compare the 10 months prior to the intervention with the 7 months during the intervention, allowing 1 month as the intervention wash‐in period. No other interventions related to lab ordering occurred during the study period. Additional variables collected included duration of hospitalization, mortality, readmission, and transfusion data. Consistency of providers in the preintervention and intervention period was high. Two providers were included in some of the preintervention data, but were not included in the intervention data, as they both left for other positions. Otherwise, all other providers in the data were consistent between the 2 time periods.
The primary endpoint was chosen a priori as the total number of common labs ordered per hospital‐day. Additionally, we identified a priori potential confounders, including age, sex, and primary discharge diagnosis, as captured by the all‐patient refined diagnosis‐related group (APR‐DRG, hereafter DRG). DRG was chosen as a clinical risk adjustment variable because there does not exist an established method to model the effects of clinical conditions on the propensity to obtain labs, the primary endpoint. Many models used for risk adjustment in patient quality reporting use hospital mortality as the primary endpoint, not the need for laboratory testing.[30, 31] As our primary endpoint was common labs and not mortality, we chose DRG as the best single variable to model changes in the clinical case mix that might affect the number of common labs.
Secondary endpoints were also determined a priori. Out of desire to assess the patient safety implications of an intervention targeting decreased monitoring, we included hospital mortality, duration of hospitalization, and readmission as safety variables. Two secondary endpoints were obtained as possible additional efficacy endpoints to test the hypothesis that the intervention might be associated with a reduction in transfusion burden: red blood cell transfusion and transfusion volume. We also tracked the frequency with which providers ordered common labs as daily in the baseline and intervention periods, as this was the behavior targeted by the interventions.
Costs to the hospital to produce the lab studies were also considered as a secondary endpoint. Median hospital costs were obtained from the first‐quarter, 2013 Premier dataset, a national dataset of hospital costs (basic metabolic panel $14.69, complete blood count $11.68, comprehensive metabolic panel $18.66). Of note, the Premier data did not include cost data on what our institution calls a TPN 2, and BMP cost was used as a substitute, given the overlap of the 2 tests' components and a desire to conservatively estimate the effects on cost to produce. Additionally, we factored in estimate of hospitalist and analyst time at $150/hour and $75/hour, respectively, to conduct that data abstraction and analysis and to manage the program. We did not formally factor in other costs, including electronic medical record acquisition costs.
Statistical Analyses
Descriptive statistics were used to describe the 2 cohorts. To test our primary hypothesis about the association between cohort membership and number of common labs per patient day, a clustered multivariable linear regression model was constructed to adjust for the a priori identified potential confounders, including sex, age, and principle discharge diagnosis. Each DRG was entered as a categorical variable in the model. Clustering was employed to account for correlation of lab ordering behavior by a given hospitalist. Separate clustered multivariable models were constructed to test the association between cohort and secondary outcomes, including duration of hospitalization, readmission, mortality, transfusion frequency, and transfusion volume using the same potential confounders. All P values were 2‐sided, and a P<0.05 was considered statistically significant. All analyses were conducted with Stata 11.2 (StataCorp, College Station, TX). The study was reviewed by the Swedish Health Services Clinical Research Center and determined to be nonhuman subjects research.
RESULTS
Patient Characteristics
Patient characteristics in the before and after cohorts are shown in Table 1. Both proportion of male sex (44.9% vs 44.9%, P=1.0) and the mean age (64.6 vs 64.8 years, P=0.5) did not significantly differ between the 2 cohorts. Interestingly, there was a significant change in the distribution of DRGs between the 2 cohorts, with each of the top 10 DRGs becoming more common in the intervention cohort. For example, the percentage of patients with sepsis or severe sepsis, DRGs 871 and 872, increased by 2.2% (8.2% vs 10.4%, P<0.01).
| Baseline, n=7832 | Intervention, n=5759 | P Valuea | |
|---|---|---|---|
| |||
| Age, y, mean (SD) | 64.6 (19.6) | 64.8 | 0.5 |
| Male, n (%) | 3,514 (44.9) | 2,585 (44.9) | 1.0 |
| Primary discharge diagnosis, DRG no., name, n (%)b | |||
| 871 and 872, severe sepsis | 641 (8.2) | 599 (10.4) | <0.01 |
| 885, psychoses | 72 (0.9) | 141 (2.4) | <0.01 |
| 392, esophagitis, gastroenteritis and miscellaneous intestinal disorders | 171 (2.2) | 225 (3.9) | <0.01 |
| 313, chest pain | 114 (1.5) | 123 (2.1) | <0.01 |
| 378, gastrointestinal bleed | 100 (1.3) | 117 (2.0) | <0.01 |
| 291, congestive heart failure and shock | 83 (1.1) | 101 (1.8) | <0.01 |
| 189, pulmonary edema and respiratory failure | 69 (0.9) | 112 (1.9) | <0.01 |
| 312, syncope and collapse | 82 (1.0) | 119 (2.1) | <0.01 |
| 64, intracranial hemorrhage or cerebral infarction | 49 (0.6) | 54 (0.9) | 0.04 |
| 603, cellulitis | 96 (1.2) | 94 (1.6) | 0.05 |
Primary Endpoint
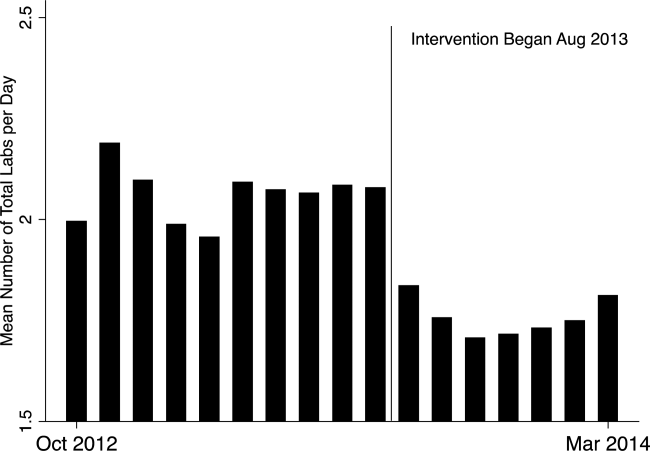
In the unadjusted comparison, 3 of the 4 common labs showed a similar decrease in the intervention cohort from the baseline (Table 2). For example, the mean number of CBCs ordered per patient‐day decreased by 0.15 labs per patient day (1.06 vs 0.91, P<0.01). The total number of common labs ordered per patient‐day decreased by 0.30 labs per patient‐day (2.06 vs 1.76, P<0.01) in the unadjusted analysis (Figure 1 and Table 2). Part of our hypothesis was that decreasing the number of labs that were ordered as daily, in an open‐ended manner, would likely decrease the number of common labs obtained per day. We found that the number of labs ordered as daily decreased by 0.71 labs per patient‐day (0.872.90 vs 0.161.01, P<0.01), an 81.6% decrease from the preintervention time period.
| Baseline | Intervention | P Valuea | |
|---|---|---|---|
| |||
| Complete blood count, per patient‐day, mean (SD) | 1.06 (0.76) | 0.91 (0.75) | <0.01 |
| Basic metabolic panel, per patient‐day, mean (SD) | 0.68 (0.71) | 0.55 (0.60) | <0.01 |
| Nutrition panel, mean (SD)b | 0.06 (0.24) | 0.07 (0.32) | 0.01 |
| Comprehensive metabolic panel, per patient‐day, mean (SD) | 0.27 (0.49) | 0.23 (0.46) | <0.01 |
| Total no. of basic labs ordered per patient‐day, mean (SD) | 2.06 (1.40) | 1.76 (1.37) | <0.01 |
| Transfused, n (%) | 414 (5.3) | 268 (4.7) | 0.1 |
| Transfused volume, mL, mean (SD) | 847.3 (644.3) | 744.9 (472.0) | 0.02 |
| Length of stay, days, mean (SD) | 3.79 (4.58) | 3.81 (4.50) | 0.7 |
| Readmitted, n (%) | 1049 (13.3) | 733 (12.7) | 0.3 |
| Died, n (%) | 173 (2.2) | 104 (1.8) | 0.1 |
In our multivariable regression model, after adjusting for sex, age, and the primary reason for admission as captured by DRG, the number of common labs ordered per day was reduced by 0.22 (95% CI, 0.34 to 0.11; P<0.01). This represents a 10.7% reduction in common labs ordered per patient day.
Secondary Endpoints
Table 2 shows secondary outcomes of the study. Patient safety endpoints were not changed in unadjusted analyses. For example, the hospital length of stay in number of days was similar in both the baseline and intervention cohorts (3.784.58 vs 3.814.50, P=0.7). There was a nonsignificant reduction in the hospital mortality rate during the intervention period by 0.4% (2.2% vs 1.8%, P=0.1). No significant differences were found when the multivariable model was rerun for each of the 3 secondary endpoints individually, readmissions, mortality, and length of stay.
Two secondary efficacy endpoints were also evaluated. The percentage of patients receiving transfusions did not decrease in either the unadjusted or adjusted analysis. However, the volume of blood transfused per patient who received a transfusion decreased by 91.9 mL in the bivariate analysis (836.8 mL621.4 mL vs 744.9 mL472.0 mL; P=0.03) (Table 2). The decrease, however, was not significant in the multivariable model (127.2 mL; 95% CI, 257.9 to 3.6; P=0.06).
Cost Data
Based on the Premier estimate of the cost to the hospital to perform the common lab tests, the intervention likely decreased direct costs by $16.19 per patient (95% CI, $12.95 to $19.43). The cost saving was decreased by the expense of the intervention, which is estimated to be $8000 and was driven by hospitalist and analyst time. Based on the patient volume in our health system, and factoring in the cost of implementation, we estimate that this intervention resulted in annualized savings of $151,682 (95% CI, $119,746 to $187,618).
DISCUSSION
Ordering common labs daily is a routine practice among providers at many institutions. In fact, at our institution, prior to the intervention, 42% of all common labs were ordered as daily, meaning they were obtained each day without regard to the previous value or the patient's clinical condition. The practice is one of convenience or habit, and many times not clinically indicated.[5, 32]
We observed a significant reduction in the number of common labs ordered as daily, and more importantly, the total number of common labs in the intervention period. The rapid change in provider behavior is notable and likely due to several factors. First, there was a general sentiment among the hospitalists in the merits of the project. Second, there may have been an aversion to the display of lower performance relative to peers in the monthly e‐mails. Third, and perhaps most importantly, our hospitalist team had worked together for many years on projects like this, creating a culture of QI and willingness to change practice patterns in response to data.[33]
Concern about decreasing waste and increasing the value of healthcare abound, particularly in the United States.[1] Decreasing the cost to produce equivalent or improved health outcomes for a given episode of care has been proposed as a way to improve value.[34] This intervention results in modest waste reduction, the benefits of which are readily apparent in a DRG‐based reimbursement model, where the hospital realizes any saving in the cost of producing a hospital stay, as well as in a total cost of care environment, such as could be found in an Accountable Care Organization.
The previous work in the field of lab reduction has all been performed at university‐affiliated academic institutions. We demonstrated that the QI tactics described in the literature can be successfully employed in a community‐based hospitalist practice. This has broad applicability to increasing the value of healthcare and could serve as a model for future community‐based hospitalist QI projects.
The study has several limitations. First, the length of follow‐up is only 7 months, and although there was rapid and effective adoption of the intervention, provider behavior may regress to previous practice patterns over time. Second, the simple before‐after nature of our trial design raises the possibility that environmental influences exist and that changes in ordering behavior may have been the result of something other than the intervention. Most notably, the Choosing Wisely recommendation for hospitalists was published in September of 2013, coinciding with our intervention period.[22] The reduction in number of labs ordered may have been a partial result of these recommendations. Third, the 2 cohorts included different times of the year based on the distribution of DRGs, which likely had a different composition of diagnoses being treated. To address this we adjusted for DRG, but there may have been some residual confounding, as some diagnoses may be managed with more laboratory tests than others in a way that was not fully adjusted for in our model. Fourth, the intervention was made possible because of the substantial and ongoing investments that our health system has made in our electronic medical record and data analytics capability. The variability of these resources across institutions limits generalizability. Fifth, although we used the QI tools that were described, we did not do a formal process map or utilize other Lean or Six Sigma tools. As the healthcare industry continues on its journey to high reliability, these use tools will hopefully become more widespread. We demonstrated that even with these simple tactics, significant progress can be made.
Finally, there exists a concern that decreasing regular laboratory monitoring might be associated with undetected worsening in the patient's clinical status. We did not observe any significant adverse effects on coarse measures of clinical performance, including length of stay, readmission rate, or mortality. However, we did not collect data on all clinical parameters, and it is possible that there could have been an undetected effect on incident renal failure or hemodialysis or intensive care unit transfer. Other studies on this type of intervention have evaluated some of these possible adverse outcomes and have not noted an association.[12, 15, 18, 20, 22] Future studies should evaluate harms associated with implementation of Choosing Wisely and other interventions targeted at waste reduction. Future work is also needed to disseminate more formal and rigorous QI tools and methodologies.
CONCLUSION
We implemented a multifaceted QI intervention including provider education, transparent display of data, and audit and feedback that was associated with a significant reduction in the number of common labs ordered in a large community‐based hospitalist group, without evidence of harm. Further study is needed to understand how hospitalist groups can optimally decrease waste in healthcare.
Disclosures
This work was performed at the Swedish Health System, Seattle, Washington. Dr. Corson served as primary author, designed the study protocol, obtained the data, analyzed all the data and wrote the manuscript and its revisions, and approved the final version of the manuscript. He attests that no undisclosed authors contributed to the manuscript. Dr. Fan designed the study protocol, reviewed the manuscript, and approved the final version of the manuscript. Mr. White reviewed the study protocol, obtained the study data, reviewed the manuscript, and approved the final version of the manuscript. Sean D. Sullivan, PhD, designed the study protocol, obtained study data, reviewed the manuscript, and approved the final version of the manuscript. Dr. Asakura designed the study protocol, reviewed the manuscript, and approved the final version of the manuscript. Dr. Myint reviewed the study protocol and data, reviewed the manuscript, and approved the final version of the manuscript. Dr. Dale designed the study protocol, analyzed the data, reviewed the manuscript, and approved the final version of the manuscript. The authors report no conflicts of interest.
- . Eliminating “waste” in health care. JAMA. 2012;307(14):1513–1516.
- . The U.S. health system in perspective: a comparison of twelve industrialized nations. Issue Brief (Commonw Fund). 2011;16:1–14.
- , . Is the defensive use of diagnostic tests good for patients, or bad? Med Decis Mak. 1998;18(1):19–28.
- , . Physician characteristics and organizational factors influencing use of ambulatory tests. Med Decis Making. 1985;5:401–415.
- , , ; Pilot Group of the Appropriate Utilization of Laboratory Tests (REDCONLAB) Working Group. Differences in laboratory requesting patterns in emergency department in Spain. Ann Clin Biochem. 2013;50:353–359.
- , . Hospital‐acquired anemia. J Med Assoc Thail. 2006;89(1):63–67.
- , , , , . Do blood tests cause anemia in hospitalized patients? The effect of diagnostic phlebotomy on hemoglobin and hematocrit levels. J Gen Intern Med. 2005;20(6):520–524.
- , . Phlebotomy for diagnostic laboratory tests in adults. Pattern of use and effect on transfusion requirements. N Engl J Med. 1986;314(19):1233–1235.
- , , , et al. Diagnostic blood loss from phlebotomy and hospital‐acquired anemia during acute myocardial infarction. Arch Intern Med. 2011;171(18):1646–1653.
- , , , et al. Hospital‐acquired anemia: prevalence, outcomes, and healthcare implications. J Hosp Med. 2013;8(9):506–512.
- , , . Laboratory phlebotomy. College of American Pathologists Q‐Probe study of patient satisfaction and complications in 23,783 patients. Arch Pathol Lab Med. 1991;115:867–872.
- , , , et al. A cost‐effective method for reducing the volume of laboratory tests in a university‐associated teaching hospital. Mt Sinai J Med. 2006;73(5):787–794.
- , . Inappropriate use of laboratory services: long term combined approach to modify request patterns. BMJ. 1990;301(6764):1305–1307.
- , . Effect of a controlled feedback intervention on laboratory test ordering by community physicians. Clin Chem. 2004;50(2):321–326.
- , , , , . An administrative intervention to improve the utilization of laboratory tests within a university hospital. Int J Qual Heal Care. 2005;17(3):243–248.
- . Surgical vampires and rising health care expenditure. Arch Surg. 2011;146(5):524–527.
- , , , et al. Trial of strategy for reducing the use of laboratory tests. Br Med J (Clin Res Ed). 1986;292(6524):883–885.
- , , , et al. Improving house staff ordering of three common laboratory tests. Reductions in test ordering need not result in underutilization. Med Care. 1987;25(10):928–935.
- , , , et al. Reducing unnecessary inpatient laboratory testing in a teaching hospital. Am J Clin Pathol. 2006;126(2):200–206.
- , , , et al. Improving patient care the impact of peer management on test‐ordering behavior. Ann Intern Med. 2004;141(3):196–204.
- , , . The laboratory test justified. An effective means to reduce routine laboratory testing. Am J Clin Pathol. 1985;86(6):756–759.
- , , , et al. Choosing wisely in adult hospital medicine: five opportunities for improved healthcare value. J Hosp Med. 2013;8(9):486–492.
- . Quality Improvement in the intensive care unit. In: Scales DC, Rubenfeld GD, eds. The Organization of Critical Care. New York, NY: Humana Press; 2014:279.
- , , , et al. Intensive care unit quality improvement: a “how‐to” guide for the interdisciplinary team. Crit Care Med. 2006;34:211–218.
- . Navigating adaptive challenges in quality improvement. BMJ Qual Safety. 2011;20(7):560–563.
- , , , et al. A multifaceted intervention for quality improvement in a network of intensive care units: a cluster randomized trial. JAMA. 2011;305:363–372.
- O'Neill SM. How do quality improvement interventions succeed? Archetypes of success and failure. Available at: http://www.rand.org/pubs/rgs_dissertations/RGSD282.html. Published 2011.
- , , , et al. Effect of a multifaceted intervention on use of evidence‐based therapies in patients with acute coronary syndromes in Brazil: the BRIDGE‐ACS randomized trial. JAMA. 2012;307:2041–2049.
- , , , et al. Audit and feedback: effects on professional practice and healthcare outcomes. Cochrane Database Syst Rev. 2012;6:CD000259.
- , , , . Impact of the present‐on‐admission indicator on hospital quality measurement: experience with the Agency for Healthcare Research and Quality (AHRQ) Inpatient Quality Indicators. Med Care. 2008;46:112–119.
- , , , et al. Enhancement of claims data to improve risk adjustment of hospital mortality. JAMA. 2007;297:71–76.
- , , , . Primary care use of laboratory tests in Spain: measurement through appropriateness indicators. Clin Lab. 2014;60(3):483–490.
- , , , et al. What distinguishes top‐performing hospitals in acute myocardial infarction mortality rates? a qualitative study. Ann Intern Med. 2011;154(6):384–390.
- . What is value in health care? N Engl J Med. 2010;363(26):2477–2481.
Waste in US healthcare is a public health threat, with an estimated value of $910 billion per year.[1] It constitutes some of the relatively high per‐discharge healthcare spending seen in the United States when compared to other nations.[2] Waste takes many forms, one of which is excessive use of diagnostic laboratory testing.[1] Many hospital providers obtain common labs, such as complete blood counts (CBCs) and basic metabolic panels (BMPs), in an open‐ended, daily manner for their hospitalized patients, without regard for the patient's clinical condition or despite stability of the previous results. Reasons for ordering these tests in a nonpatient‐centered manner include provider convenience (such as inclusion in an order set), ease of access, habit, or defensive practice.[3, 4, 5] All of these reasons may represent waste.
Although the potential waste of routine daily labs may seem small, the frequency with which they are ordered results in a substantial real and potential cost, both financially and clinically. Multiple studies have shown a link between excessive diagnostic phlebotomy and hospital‐acquired anemia.[6, 7, 8, 9] Hospital‐acquired anemia itself has been associated with increased mortality.[10] In addition to blood loss and financial cost, patient experience and satisfaction are also detrimentally affected by excessive laboratory testing in the form of pain and inconvenience from the act of phlebotomy.[11]
There are many reports of strategies to decrease excessive diagnostic laboratory testing as a means of addressing this waste in the inpatient setting.[12, 13, 14, 15, 16, 17, 18, 19, 20, 21] All of these studies have taken place in a traditional academic setting, and many implemented their intervention through a computer‐based order entry system. Based on the literature search regarding this topic, we found no examples of studies conducted among and within community‐based hospitalist practices. More recently, this issue was highlighted as part of the Choosing Wisely campaign sponsored by the American Board of Internal Medicine Foundation, Consumer Reports, and more than 60 specialty societies. The Society of Hospital Medicine, the professional society for hospitalists, recommended avoidance of repetitive common laboratory testing in the face of clinical stability.[22]
Much has been written about quality improvement (QI) by the Institute for Healthcare Improvement, the Society of Hospitalist Medicine, and others.[23, 24, 25] How best to move from a Choosing Wisely recommendation to highly reliable incorporation in clinical practice in a community setting is not known and likely varies depending upon the care environment. Successful QI interventions are often multifaceted and include academic detailing and provider education, transparent display of data, and regular audit and feedback of performance data.[26, 27, 28, 29] Prior to the publication of the Society of Hospital Medicine's Choosing Wisely recommendations, we chose to implement the recommendation to decrease ordering of daily labs using 3 QI strategies in our community 4‐hospital health system.
METHODS
Study Participants
This activity was undertaken as a QI initiative by Swedish Hospital Medicine (SHM), a 53‐provider employed hospitalist group that staffs a total of 1420 beds across 4 inpatient facilities. SHM has a longstanding record of working together as a team on QI projects.
An informal preliminary audit of our common lab ordering by a member of the study team revealed multiple examples of labs ordered every day without medical‐record evidence of intervention or management decisions being made based on the results. This preliminary activity raised the notion within the hospitalist group that this was a topic ripe for intervention and improvement. Four common labs, CBC, BMP, nutrition panel (called TPN 2 in our system, consisting of a BMP and magnesium and phosphorus) and comprehensive metabolic panel (BMP and liver function tests), formed the bulk of the repetitively ordered labs and were the focus of our activity. We excluded prothrombin time/International Normalized Ratio, as it was less clear that obtaining these daily clearly represented waste. We then reviewed medical literature for successful QI strategies and chose academic detailing, transparent display of data, and audit and feedback as our QI tactics.[29]
Using data from our electronic medical record, we chose a convenience preintervention period of 10 months for our baseline data. We allowed for a 2‐month wash‐in period in August 2013, and a convenience period of 7 months was chosen as the intervention period.
Intervention
An introductory email was sent out in mid‐August 2013 to all hospitalist providers describing the waste and potential harm to patients associated with unnecessary common blood tests, in particular those ordered as daily. The email recommended 2 changes: (1) immediate cessation of the practice of ordering common labs as daily, in an open, unending manner and (2) assessing the need for common labs in the next 24 hours, and ordering based on that need, but no further into the future.
Hospitalist providers were additionally informed that the number of common labs ordered daily would be tracked prospectively, with monthly reporting of individual provider ordering. In addition, the 5 members of the hospitalist team who most frequently ordered common labs as daily during January 2013 to March 2013 were sent individual emails informing them of their top‐5 position.
During the 7‐month intervention period, a monthly email was sent to all members of the hospitalist team with 4 basic components: (1) reiteration of the recommendations and reasoning stated in the original email; (2) a list of all members of the hospitalist team and the corresponding frequency of common labs ordered as daily (open ended) per provider for the month; (3) a recommendation to discontinue any common labs ordered as daily; and (4) at least 1 example of a patient cared for during the month by the hospitalist team, who had at least 1 common lab ordered for at least 5 days in a row, with no mention of the results in the progress notes and no apparent contribution to the management of the medical conditions for which the patient was being treated.
The change in number of tests ordered during the intervention was not shared with the team until early January 2014.
Data Elements and Endpoints
Number of common labs ordered as daily, and the total number of common labs per hospital‐day, ordered by any frequency, on hospitalist patients were abstracted from the electronic medical record. Hospitalist patients were defined as those both admitted and discharged by a hospitalist provider. We chose to compare the 10 months prior to the intervention with the 7 months during the intervention, allowing 1 month as the intervention wash‐in period. No other interventions related to lab ordering occurred during the study period. Additional variables collected included duration of hospitalization, mortality, readmission, and transfusion data. Consistency of providers in the preintervention and intervention period was high. Two providers were included in some of the preintervention data, but were not included in the intervention data, as they both left for other positions. Otherwise, all other providers in the data were consistent between the 2 time periods.
The primary endpoint was chosen a priori as the total number of common labs ordered per hospital‐day. Additionally, we identified a priori potential confounders, including age, sex, and primary discharge diagnosis, as captured by the all‐patient refined diagnosis‐related group (APR‐DRG, hereafter DRG). DRG was chosen as a clinical risk adjustment variable because there does not exist an established method to model the effects of clinical conditions on the propensity to obtain labs, the primary endpoint. Many models used for risk adjustment in patient quality reporting use hospital mortality as the primary endpoint, not the need for laboratory testing.[30, 31] As our primary endpoint was common labs and not mortality, we chose DRG as the best single variable to model changes in the clinical case mix that might affect the number of common labs.
Secondary endpoints were also determined a priori. Out of desire to assess the patient safety implications of an intervention targeting decreased monitoring, we included hospital mortality, duration of hospitalization, and readmission as safety variables. Two secondary endpoints were obtained as possible additional efficacy endpoints to test the hypothesis that the intervention might be associated with a reduction in transfusion burden: red blood cell transfusion and transfusion volume. We also tracked the frequency with which providers ordered common labs as daily in the baseline and intervention periods, as this was the behavior targeted by the interventions.
Costs to the hospital to produce the lab studies were also considered as a secondary endpoint. Median hospital costs were obtained from the first‐quarter, 2013 Premier dataset, a national dataset of hospital costs (basic metabolic panel $14.69, complete blood count $11.68, comprehensive metabolic panel $18.66). Of note, the Premier data did not include cost data on what our institution calls a TPN 2, and BMP cost was used as a substitute, given the overlap of the 2 tests' components and a desire to conservatively estimate the effects on cost to produce. Additionally, we factored in estimate of hospitalist and analyst time at $150/hour and $75/hour, respectively, to conduct that data abstraction and analysis and to manage the program. We did not formally factor in other costs, including electronic medical record acquisition costs.
Statistical Analyses
Descriptive statistics were used to describe the 2 cohorts. To test our primary hypothesis about the association between cohort membership and number of common labs per patient day, a clustered multivariable linear regression model was constructed to adjust for the a priori identified potential confounders, including sex, age, and principle discharge diagnosis. Each DRG was entered as a categorical variable in the model. Clustering was employed to account for correlation of lab ordering behavior by a given hospitalist. Separate clustered multivariable models were constructed to test the association between cohort and secondary outcomes, including duration of hospitalization, readmission, mortality, transfusion frequency, and transfusion volume using the same potential confounders. All P values were 2‐sided, and a P<0.05 was considered statistically significant. All analyses were conducted with Stata 11.2 (StataCorp, College Station, TX). The study was reviewed by the Swedish Health Services Clinical Research Center and determined to be nonhuman subjects research.
RESULTS
Patient Characteristics
Patient characteristics in the before and after cohorts are shown in Table 1. Both proportion of male sex (44.9% vs 44.9%, P=1.0) and the mean age (64.6 vs 64.8 years, P=0.5) did not significantly differ between the 2 cohorts. Interestingly, there was a significant change in the distribution of DRGs between the 2 cohorts, with each of the top 10 DRGs becoming more common in the intervention cohort. For example, the percentage of patients with sepsis or severe sepsis, DRGs 871 and 872, increased by 2.2% (8.2% vs 10.4%, P<0.01).
| Baseline, n=7832 | Intervention, n=5759 | P Valuea | |
|---|---|---|---|
| |||
| Age, y, mean (SD) | 64.6 (19.6) | 64.8 | 0.5 |
| Male, n (%) | 3,514 (44.9) | 2,585 (44.9) | 1.0 |
| Primary discharge diagnosis, DRG no., name, n (%)b | |||
| 871 and 872, severe sepsis | 641 (8.2) | 599 (10.4) | <0.01 |
| 885, psychoses | 72 (0.9) | 141 (2.4) | <0.01 |
| 392, esophagitis, gastroenteritis and miscellaneous intestinal disorders | 171 (2.2) | 225 (3.9) | <0.01 |
| 313, chest pain | 114 (1.5) | 123 (2.1) | <0.01 |
| 378, gastrointestinal bleed | 100 (1.3) | 117 (2.0) | <0.01 |
| 291, congestive heart failure and shock | 83 (1.1) | 101 (1.8) | <0.01 |
| 189, pulmonary edema and respiratory failure | 69 (0.9) | 112 (1.9) | <0.01 |
| 312, syncope and collapse | 82 (1.0) | 119 (2.1) | <0.01 |
| 64, intracranial hemorrhage or cerebral infarction | 49 (0.6) | 54 (0.9) | 0.04 |
| 603, cellulitis | 96 (1.2) | 94 (1.6) | 0.05 |
Primary Endpoint
In the unadjusted comparison, 3 of the 4 common labs showed a similar decrease in the intervention cohort from the baseline (Table 2). For example, the mean number of CBCs ordered per patient‐day decreased by 0.15 labs per patient day (1.06 vs 0.91, P<0.01). The total number of common labs ordered per patient‐day decreased by 0.30 labs per patient‐day (2.06 vs 1.76, P<0.01) in the unadjusted analysis (Figure 1 and Table 2). Part of our hypothesis was that decreasing the number of labs that were ordered as daily, in an open‐ended manner, would likely decrease the number of common labs obtained per day. We found that the number of labs ordered as daily decreased by 0.71 labs per patient‐day (0.872.90 vs 0.161.01, P<0.01), an 81.6% decrease from the preintervention time period.
| Baseline | Intervention | P Valuea | |
|---|---|---|---|
| |||
| Complete blood count, per patient‐day, mean (SD) | 1.06 (0.76) | 0.91 (0.75) | <0.01 |
| Basic metabolic panel, per patient‐day, mean (SD) | 0.68 (0.71) | 0.55 (0.60) | <0.01 |
| Nutrition panel, mean (SD)b | 0.06 (0.24) | 0.07 (0.32) | 0.01 |
| Comprehensive metabolic panel, per patient‐day, mean (SD) | 0.27 (0.49) | 0.23 (0.46) | <0.01 |
| Total no. of basic labs ordered per patient‐day, mean (SD) | 2.06 (1.40) | 1.76 (1.37) | <0.01 |
| Transfused, n (%) | 414 (5.3) | 268 (4.7) | 0.1 |
| Transfused volume, mL, mean (SD) | 847.3 (644.3) | 744.9 (472.0) | 0.02 |
| Length of stay, days, mean (SD) | 3.79 (4.58) | 3.81 (4.50) | 0.7 |
| Readmitted, n (%) | 1049 (13.3) | 733 (12.7) | 0.3 |
| Died, n (%) | 173 (2.2) | 104 (1.8) | 0.1 |
In our multivariable regression model, after adjusting for sex, age, and the primary reason for admission as captured by DRG, the number of common labs ordered per day was reduced by 0.22 (95% CI, 0.34 to 0.11; P<0.01). This represents a 10.7% reduction in common labs ordered per patient day.
Secondary Endpoints
Table 2 shows secondary outcomes of the study. Patient safety endpoints were not changed in unadjusted analyses. For example, the hospital length of stay in number of days was similar in both the baseline and intervention cohorts (3.784.58 vs 3.814.50, P=0.7). There was a nonsignificant reduction in the hospital mortality rate during the intervention period by 0.4% (2.2% vs 1.8%, P=0.1). No significant differences were found when the multivariable model was rerun for each of the 3 secondary endpoints individually, readmissions, mortality, and length of stay.
Two secondary efficacy endpoints were also evaluated. The percentage of patients receiving transfusions did not decrease in either the unadjusted or adjusted analysis. However, the volume of blood transfused per patient who received a transfusion decreased by 91.9 mL in the bivariate analysis (836.8 mL621.4 mL vs 744.9 mL472.0 mL; P=0.03) (Table 2). The decrease, however, was not significant in the multivariable model (127.2 mL; 95% CI, 257.9 to 3.6; P=0.06).
Cost Data
Based on the Premier estimate of the cost to the hospital to perform the common lab tests, the intervention likely decreased direct costs by $16.19 per patient (95% CI, $12.95 to $19.43). The cost saving was decreased by the expense of the intervention, which is estimated to be $8000 and was driven by hospitalist and analyst time. Based on the patient volume in our health system, and factoring in the cost of implementation, we estimate that this intervention resulted in annualized savings of $151,682 (95% CI, $119,746 to $187,618).
DISCUSSION
Ordering common labs daily is a routine practice among providers at many institutions. In fact, at our institution, prior to the intervention, 42% of all common labs were ordered as daily, meaning they were obtained each day without regard to the previous value or the patient's clinical condition. The practice is one of convenience or habit, and many times not clinically indicated.[5, 32]
We observed a significant reduction in the number of common labs ordered as daily, and more importantly, the total number of common labs in the intervention period. The rapid change in provider behavior is notable and likely due to several factors. First, there was a general sentiment among the hospitalists in the merits of the project. Second, there may have been an aversion to the display of lower performance relative to peers in the monthly e‐mails. Third, and perhaps most importantly, our hospitalist team had worked together for many years on projects like this, creating a culture of QI and willingness to change practice patterns in response to data.[33]
Concern about decreasing waste and increasing the value of healthcare abound, particularly in the United States.[1] Decreasing the cost to produce equivalent or improved health outcomes for a given episode of care has been proposed as a way to improve value.[34] This intervention results in modest waste reduction, the benefits of which are readily apparent in a DRG‐based reimbursement model, where the hospital realizes any saving in the cost of producing a hospital stay, as well as in a total cost of care environment, such as could be found in an Accountable Care Organization.
The previous work in the field of lab reduction has all been performed at university‐affiliated academic institutions. We demonstrated that the QI tactics described in the literature can be successfully employed in a community‐based hospitalist practice. This has broad applicability to increasing the value of healthcare and could serve as a model for future community‐based hospitalist QI projects.
The study has several limitations. First, the length of follow‐up is only 7 months, and although there was rapid and effective adoption of the intervention, provider behavior may regress to previous practice patterns over time. Second, the simple before‐after nature of our trial design raises the possibility that environmental influences exist and that changes in ordering behavior may have been the result of something other than the intervention. Most notably, the Choosing Wisely recommendation for hospitalists was published in September of 2013, coinciding with our intervention period.[22] The reduction in number of labs ordered may have been a partial result of these recommendations. Third, the 2 cohorts included different times of the year based on the distribution of DRGs, which likely had a different composition of diagnoses being treated. To address this we adjusted for DRG, but there may have been some residual confounding, as some diagnoses may be managed with more laboratory tests than others in a way that was not fully adjusted for in our model. Fourth, the intervention was made possible because of the substantial and ongoing investments that our health system has made in our electronic medical record and data analytics capability. The variability of these resources across institutions limits generalizability. Fifth, although we used the QI tools that were described, we did not do a formal process map or utilize other Lean or Six Sigma tools. As the healthcare industry continues on its journey to high reliability, these use tools will hopefully become more widespread. We demonstrated that even with these simple tactics, significant progress can be made.
Finally, there exists a concern that decreasing regular laboratory monitoring might be associated with undetected worsening in the patient's clinical status. We did not observe any significant adverse effects on coarse measures of clinical performance, including length of stay, readmission rate, or mortality. However, we did not collect data on all clinical parameters, and it is possible that there could have been an undetected effect on incident renal failure or hemodialysis or intensive care unit transfer. Other studies on this type of intervention have evaluated some of these possible adverse outcomes and have not noted an association.[12, 15, 18, 20, 22] Future studies should evaluate harms associated with implementation of Choosing Wisely and other interventions targeted at waste reduction. Future work is also needed to disseminate more formal and rigorous QI tools and methodologies.
CONCLUSION
We implemented a multifaceted QI intervention including provider education, transparent display of data, and audit and feedback that was associated with a significant reduction in the number of common labs ordered in a large community‐based hospitalist group, without evidence of harm. Further study is needed to understand how hospitalist groups can optimally decrease waste in healthcare.
Disclosures
This work was performed at the Swedish Health System, Seattle, Washington. Dr. Corson served as primary author, designed the study protocol, obtained the data, analyzed all the data and wrote the manuscript and its revisions, and approved the final version of the manuscript. He attests that no undisclosed authors contributed to the manuscript. Dr. Fan designed the study protocol, reviewed the manuscript, and approved the final version of the manuscript. Mr. White reviewed the study protocol, obtained the study data, reviewed the manuscript, and approved the final version of the manuscript. Sean D. Sullivan, PhD, designed the study protocol, obtained study data, reviewed the manuscript, and approved the final version of the manuscript. Dr. Asakura designed the study protocol, reviewed the manuscript, and approved the final version of the manuscript. Dr. Myint reviewed the study protocol and data, reviewed the manuscript, and approved the final version of the manuscript. Dr. Dale designed the study protocol, analyzed the data, reviewed the manuscript, and approved the final version of the manuscript. The authors report no conflicts of interest.
- . Eliminating “waste” in health care. JAMA. 2012;307(14):1513–1516.
- . The U.S. health system in perspective: a comparison of twelve industrialized nations. Issue Brief (Commonw Fund). 2011;16:1–14.
- , . Is the defensive use of diagnostic tests good for patients, or bad? Med Decis Mak. 1998;18(1):19–28.
- , . Physician characteristics and organizational factors influencing use of ambulatory tests. Med Decis Making. 1985;5:401–415.
- , , ; Pilot Group of the Appropriate Utilization of Laboratory Tests (REDCONLAB) Working Group. Differences in laboratory requesting patterns in emergency department in Spain. Ann Clin Biochem. 2013;50:353–359.
- , . Hospital‐acquired anemia. J Med Assoc Thail. 2006;89(1):63–67.
- , , , , . Do blood tests cause anemia in hospitalized patients? The effect of diagnostic phlebotomy on hemoglobin and hematocrit levels. J Gen Intern Med. 2005;20(6):520–524.
- , . Phlebotomy for diagnostic laboratory tests in adults. Pattern of use and effect on transfusion requirements. N Engl J Med. 1986;314(19):1233–1235.
- , , , et al. Diagnostic blood loss from phlebotomy and hospital‐acquired anemia during acute myocardial infarction. Arch Intern Med. 2011;171(18):1646–1653.
- , , , et al. Hospital‐acquired anemia: prevalence, outcomes, and healthcare implications. J Hosp Med. 2013;8(9):506–512.
- , , . Laboratory phlebotomy. College of American Pathologists Q‐Probe study of patient satisfaction and complications in 23,783 patients. Arch Pathol Lab Med. 1991;115:867–872.
- , , , et al. A cost‐effective method for reducing the volume of laboratory tests in a university‐associated teaching hospital. Mt Sinai J Med. 2006;73(5):787–794.
- , . Inappropriate use of laboratory services: long term combined approach to modify request patterns. BMJ. 1990;301(6764):1305–1307.
- , . Effect of a controlled feedback intervention on laboratory test ordering by community physicians. Clin Chem. 2004;50(2):321–326.
- , , , , . An administrative intervention to improve the utilization of laboratory tests within a university hospital. Int J Qual Heal Care. 2005;17(3):243–248.
- . Surgical vampires and rising health care expenditure. Arch Surg. 2011;146(5):524–527.
- , , , et al. Trial of strategy for reducing the use of laboratory tests. Br Med J (Clin Res Ed). 1986;292(6524):883–885.
- , , , et al. Improving house staff ordering of three common laboratory tests. Reductions in test ordering need not result in underutilization. Med Care. 1987;25(10):928–935.
- , , , et al. Reducing unnecessary inpatient laboratory testing in a teaching hospital. Am J Clin Pathol. 2006;126(2):200–206.
- , , , et al. Improving patient care the impact of peer management on test‐ordering behavior. Ann Intern Med. 2004;141(3):196–204.
- , , . The laboratory test justified. An effective means to reduce routine laboratory testing. Am J Clin Pathol. 1985;86(6):756–759.
- , , , et al. Choosing wisely in adult hospital medicine: five opportunities for improved healthcare value. J Hosp Med. 2013;8(9):486–492.
- . Quality Improvement in the intensive care unit. In: Scales DC, Rubenfeld GD, eds. The Organization of Critical Care. New York, NY: Humana Press; 2014:279.
- , , , et al. Intensive care unit quality improvement: a “how‐to” guide for the interdisciplinary team. Crit Care Med. 2006;34:211–218.
- . Navigating adaptive challenges in quality improvement. BMJ Qual Safety. 2011;20(7):560–563.
- , , , et al. A multifaceted intervention for quality improvement in a network of intensive care units: a cluster randomized trial. JAMA. 2011;305:363–372.
- O'Neill SM. How do quality improvement interventions succeed? Archetypes of success and failure. Available at: http://www.rand.org/pubs/rgs_dissertations/RGSD282.html. Published 2011.
- , , , et al. Effect of a multifaceted intervention on use of evidence‐based therapies in patients with acute coronary syndromes in Brazil: the BRIDGE‐ACS randomized trial. JAMA. 2012;307:2041–2049.
- , , , et al. Audit and feedback: effects on professional practice and healthcare outcomes. Cochrane Database Syst Rev. 2012;6:CD000259.
- , , , . Impact of the present‐on‐admission indicator on hospital quality measurement: experience with the Agency for Healthcare Research and Quality (AHRQ) Inpatient Quality Indicators. Med Care. 2008;46:112–119.
- , , , et al. Enhancement of claims data to improve risk adjustment of hospital mortality. JAMA. 2007;297:71–76.
- , , , . Primary care use of laboratory tests in Spain: measurement through appropriateness indicators. Clin Lab. 2014;60(3):483–490.
- , , , et al. What distinguishes top‐performing hospitals in acute myocardial infarction mortality rates? a qualitative study. Ann Intern Med. 2011;154(6):384–390.
- . What is value in health care? N Engl J Med. 2010;363(26):2477–2481.
