User login
Evidence exists that physicians consider what may be called “social” or “nonmedical” factors (lack of social support or barriers to access) in hospital admission decision-making and that patients are hospitalized even in the absence of a level of medical acuity warranting admission.1-3 Although hospitalization is associated with the risk of adverse events (AEs),4 whether this risk is related to the medical acuity of admission remains unclear. Our study sought to quantify the AEs experienced by patients hospitalized without definite medical acuity compared with those experienced by patients hospitalized with a definite medically appropriate indication for admission.
METHODS
Setting and Database Used for Analysis
This study was conducted at an urban, safety-net, public teaching hospital. At our site, calls for medical admissions are always answered by a hospital medicine attending physician (“triage physician”) who works collaboratively with the referring physician to facilitate appropriate disposition. Many of these discussions occur via telephone, but the triage physician may also assess the patient directly if needed. This study involved 24 triage physicians who directly assessed the patient in 65% of the cases.
At the time of each admission call, the triage physician logs the following information into a central triage database: date and time of call, patient location, reason for admission, assessment of appropriateness for medical floor, contributing factors to admission decision-making, and patient disposition.
Admission Appropriateness Group Designation
To be considered for inclusion in this study, calls must have originated from the emergency department and resulted in admission to the general medicine floor on either a resident teaching or hospitalist service from February 1, 2018 to June 1, 2018. This time frame was selected to avoid the start of a new academic cycle in late June that may confound AE rates.
The designation of appropriateness was determined by the triage physician’s logged response to triage database questions at the time of the admission call. Of the 748 admissions meeting inclusion criteria, 513 (68.6%) were considered definitely appropriate on the basis of the triage physician’s response to the question “Based ONLY on the medical reason for hospitalization, in your opinion, how appropriate is this admission to the medicine floor service?” Furthermore, 169 (22.6%) were considered without definite medical acuity on the basis of the triage physician’s indication that “severity of medical problems alone may not require inpatient hospitalization” (Appendix Figure 1).
Study Design
Following a retrospective cohort study design, we systematically sampled 150 admissions from those “admitted without definite medical acuity” to create the exposure group and 150 from the “definitely medically appropriate” admissions to create the nonexposure group. Our sampling method involved selecting every third record until reaching the target sample size. This method and group sizes were determined prior to beginning data collection. Given the expected incidence of 33% AEs in the unexposed group (consistent with previous reports of AEs using the trigger tool5), we anticipated that a total sample size of 300 would be appropriate to capture a relative risk of at least 1.5 with 80% power and 95% confidence level.
Chart review was performed to capture patient demographics, admission characteristics, and hospitalization outcomes. We captured emergency severity index (ESI)6, a validated, reliable triage assessment score assigned by our emergency department, as a measurement of acute illness and calculated the Charlson comorbidity index (CCI)7 as a measurement of chronic comorbidity.
Identification of Adverse Events
We measured AEs by using the Institute for Healthcare Improvement Global Trigger Tool,8,9 which is estimated to identify up to 10 times more AEs than other methods, such as voluntary reporting.5 This protocol includes 28 triggers in the Cares and Medication Modules that serve as indicators that an AE may have occurred. The presence of a trigger is not necessarily an AE but a clue for further analysis. Two investigators (AS and CS) independently systematically searched for the presence of triggers within each patient chart. Trigger identification prompted in-depth analysis to confirm the occurrence of an AE and to characterize its severity by using the National Coordinating Council for Medication Error Reporting and Prevention categorization.10 An AE was coded when independent reviewers identified evidence of a preventable or nonpreventable “noxious and unintended event occurring in association with medical care.”9 By definition, any AEs identified were patient harms. Findings were reviewed weekly to ensure agreement, and discrepancies were adjudicated by a third investigator (MB).
All study data were collected by using REDCap electronic data capture tools hosted at the University of Washington.11 The University of Washington Institutional Review Board granted approval for this study.
Study Outcome and Statistical Analysis
The primary outcome was AEs per group with results calculated in three ways: AEs per 1,000 patient-days, AEs per 100 admissions, and percent of admissions with an AE. The risk ratio (RR) for the percent of admissions with an AE and the incidence rate ratio (IRR) for AEs per 1,000 patient-days were calculated for the comparison of significance.
Other data were analyzed by using Pearson’s chi square for categorical data, Student t test for normally distributed quantitative data, and Wilcoxon rank-sum (Mann–Whitney) for the length of stay (due to skew). Analyses were conducted using STATA (version 15.1, College Station, TX).
This work follows standards for reporting observational students as outlined in the STROBE statement.12
RESULTS
Patient Demographics
Both groups were predominantly white/non-Hispanic, male, and English-speaking (Table 1). More patients without definite medical acuity were covered by public insurance (78.9% vs 69.8%, P = .010) and discharged to homelessness (34.8% vs 22.6%, P = .041).
Measures of Illness
Patients considered definitely medically appropriate had lower ESI scores, indicative of more acute presentation, than those without definite medical acuity (2.73 [95% CI 2.64-2.81] vs 2.87 [95% CI 2.78-2.95], P = .026). There was no difference in CCI scores (Table 1).
Reason for Admission and Outcomes
Admissions considered definitely medically appropriate more frequently had an identified diagnosis/syndrome (66% vs 53%) or objective measurement (8.7% vs 2.7%) listed as the reason for admission, whereas patients admitted without definite medical acuity more freuqently had undifferentiated symptoms (34.7% vs 24%) or other/disposition (6% vs 1.3%) listed. The most common factors that triage physicians cited as contributing to the decision to admit patients without definite medical acuity included homelessness (34%), lack of outpatient social support (32%), and substance use disorder (25%). More details are available in Appendix Tables 1 and 2.
Admissions without definite medical acuity were longer than those with definite medical acuity (6.6 vs 6.0 days, P = .038), but there was no difference in emergency department readmissions within 48 hours or hospital readmissions within 30 days (Table 1).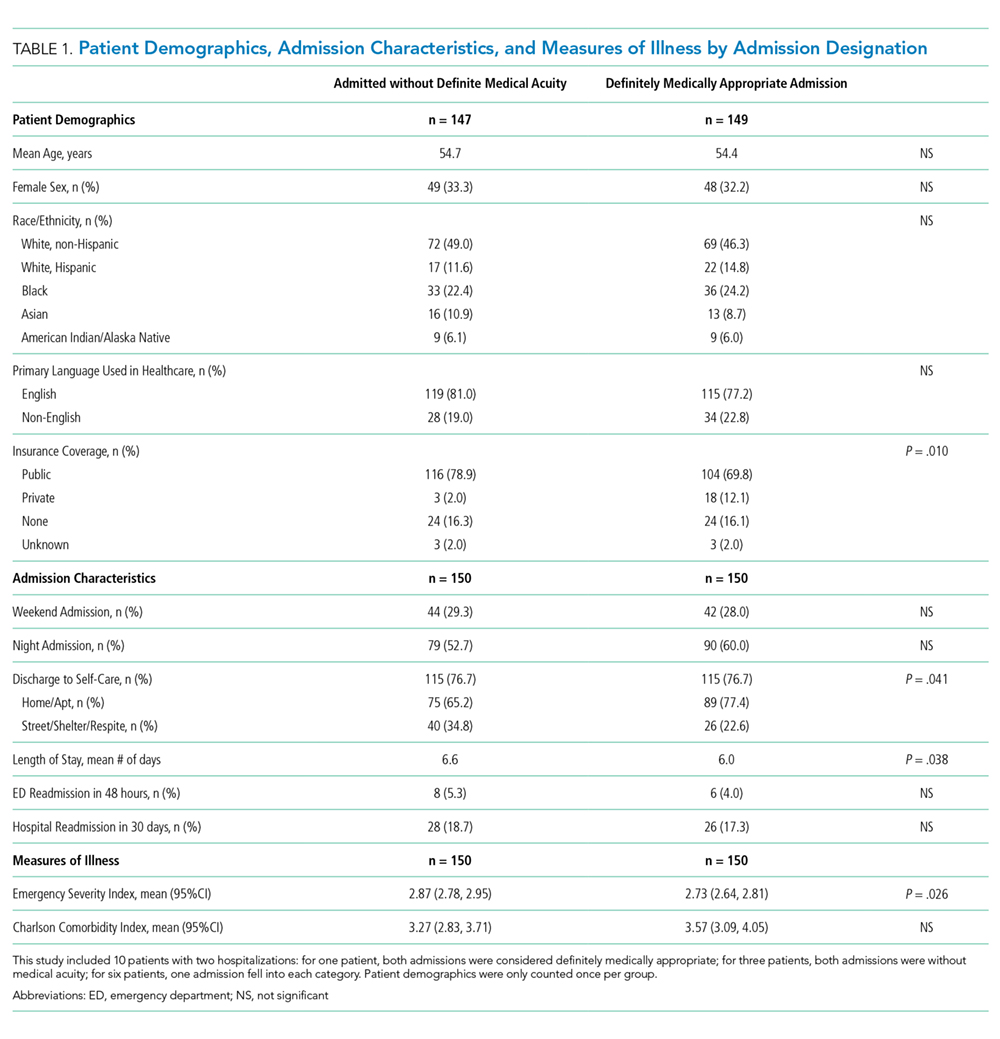
Adverse Events
We identified 76 AEs in 41 admissions without definite medical acuity (range 0-10 AEs per admission) and 63 AEs in 44 definitely medically appropriate admissions (range 0-4 AEs per admission). The percentage of admissions with AE (27.3% vs 29.3%; RR 0.93, 95% CI 0.65-1.34, P = .70) and the rate of AE/1,000 patient-days (76.8 vs 70.4; IRR 1.09, 95% CI 0.77-1.55, P = .61) did not show statistically significant differences. The distribution of AE severity was similar between the two groups (Table 2). Most identified AEs caused temporary harm to the patient and were rated at severity levels E or F. Severe AEs, including at least one level I (patient death), occurred in both groups. The complete listing of positive triggers leading to adverse event identification by group and severity is available in Appendix Table 3.
DISCUSSION
By using a robust, standardized method, we found that patients admitted without definite medical acuity experienced the same number of inpatient AEs as patients admitted for definitely medically appropriate reasons. While the groups were relatively similar overall in terms of demographics and chronic comorbidity, we found evidence of social vulnerability in the group admitted without definite medical acuity in the form of increased rates of homelessness, triage physician concern regarding the lack of outpatient social support, and disposition-related reasons for admission. That both groups suffered harm―including patient death―while admitted to the hospital is striking, in particular for those patients who were admitted because of the lack of suitable outpatient options.
The potential limitations to the generalizability of this work include the single-site, safety-net setting and the use of individual physician determination of admission appropriateness. The proportion of admissions without definite medical acuity reported here is similar to that reported by previously published admission decision-making studies,2,3 and the rate of AEs observed is similar to rates measured in other studies using the trigger tool methodology.5,13 These similarities suggest some commonality across settings. Our study treats triage physician assessment as the marker of difference in defining the two groups and is an inherently subjective assessment that is reflective of real-world, holistic decision-making. Notably, the triage physician assessment was corroborated by corresponding differences in the ESI score, an acute triage assessment completed by a clinician outside of our team.
This study adds foundational knowledge to the risk/benefit discussion surrounding the decision to admit. Physician admission decisions are likely influenced by concern for the safety of vulnerable patients. Our results suggest that considering the risk of hospitalization itself in this decision-making remains important.
1. Mushlin AI, Appel FA. Extramedical factors in the decision to hospitalize medical patients. Am J Public Health. 1976;66(2):170-172. https://doi.org/10.2105/AJPH.66.2.170.
2. Lewis Hunter AE, Spatz ES, Bernstein SL, Rosenthal MS. Factors influencing hospital admission of noncritically ill patients presenting to the emergency department: a cross-sectional study. J Gen Intern Med. 2016;31(1):37-44. https://doi.org/10.1007/s11606-015-3438-8.
3. Pope I, Burn H, Ismail SA, Harris T, McCoy D. A qualitative study exploring the factors influencing admission to hospital from the emergency department. BMJ Open. 2017;7(8):e011543. https://doi.org/10.1136/bmjopen-2016-011543.
4. Levinson DR. Adverse Events in Hospitals: National Incidence among Medicare Beneficiaries. 2010. https://oig.hhs.gov/oei/reports/oei-06-09-00090.pdf. Accessed May 20, 2019.
5. Classen DC, Resar R, Griffin F, et al. ‘Global trigger tool’ shows that adverse events in hospitals may be ten times greater than previously measured. Health Aff (Millwood). 2011;30(4):581-589. https://doi.org/10.1377/hlthaff.2011.0190.
6. Wuerz RC, Milne LW, Eitel DR, Travers D, Gilboy N. Reliability and validity of a new five-level triage instrument. Acad Emerg Med. 2000;7(3):236-242.https://doi.org/10.1111/j.1553-2712.2000.tb01066.x.
7. Charlson ME, Pompei P, Ales KL, MacKenzie CR. A new method of classifying prognostic comorbidity in longitudinal studies: development and validation. J Chron Dis. 1987;40:373-383. https://doi.org/10.1016/0021-9681(87)90171-8.
8. Resar RK, Rozich JD, Classen D. Methodology and rationale for the measurement of harm with trigger tools. Qual Saf Health Care. 2003;12(2):ii39-ii45. https://doi.org/10.1136/qhc.12.suppl_2.ii39.
9. Griffen FA, Resar RK. IHI Global Trigger Tool for Measuring Adverse Events (Second Edition). Cambridge, Massachusetts: Institute for Healthcare Improvement; 2009.
10. National Coordinating Council for Medication Error Reporting and Prevention (NCC MERP) Index for Categorizing Errors. https://www.nccmerp.org/types-medication-errors Accessed May 20, 2019.
11. Harris PA, Taylor R, Thielke R, Payne J, Gonzalez N, Conde JG. Research electronic data capture (REDCap)--a metadata-driven methodology and workflow process for providing translational research informatics support. J Biomed Inform. 2009;42(2):377-381. https://doi.org/10.1016/j.jbi.2008.08.010.
12. von Elm E, Altman DG, Egger M, Pocock SJ, Gøtzsche PC, Vandenbroucke JP. The Strengthening the Reporting of Observational Studies in Epidemiology (STROBE) statement: guidelines for reporting observational studies. Ann Intern Med. 2007;147(8):573-577.
13. Kennerly DA, Kudyakov R, da Graca B, et al. Characterization of adverse events detected in a large health care delivery system using an enhanced global trigger tool over a five-year interval. Health Serv Res. 2014;49(5):1407-1425. https://doi.org/10.1111/1475-6773.12163.
Evidence exists that physicians consider what may be called “social” or “nonmedical” factors (lack of social support or barriers to access) in hospital admission decision-making and that patients are hospitalized even in the absence of a level of medical acuity warranting admission.1-3 Although hospitalization is associated with the risk of adverse events (AEs),4 whether this risk is related to the medical acuity of admission remains unclear. Our study sought to quantify the AEs experienced by patients hospitalized without definite medical acuity compared with those experienced by patients hospitalized with a definite medically appropriate indication for admission.
METHODS
Setting and Database Used for Analysis
This study was conducted at an urban, safety-net, public teaching hospital. At our site, calls for medical admissions are always answered by a hospital medicine attending physician (“triage physician”) who works collaboratively with the referring physician to facilitate appropriate disposition. Many of these discussions occur via telephone, but the triage physician may also assess the patient directly if needed. This study involved 24 triage physicians who directly assessed the patient in 65% of the cases.
At the time of each admission call, the triage physician logs the following information into a central triage database: date and time of call, patient location, reason for admission, assessment of appropriateness for medical floor, contributing factors to admission decision-making, and patient disposition.
Admission Appropriateness Group Designation
To be considered for inclusion in this study, calls must have originated from the emergency department and resulted in admission to the general medicine floor on either a resident teaching or hospitalist service from February 1, 2018 to June 1, 2018. This time frame was selected to avoid the start of a new academic cycle in late June that may confound AE rates.
The designation of appropriateness was determined by the triage physician’s logged response to triage database questions at the time of the admission call. Of the 748 admissions meeting inclusion criteria, 513 (68.6%) were considered definitely appropriate on the basis of the triage physician’s response to the question “Based ONLY on the medical reason for hospitalization, in your opinion, how appropriate is this admission to the medicine floor service?” Furthermore, 169 (22.6%) were considered without definite medical acuity on the basis of the triage physician’s indication that “severity of medical problems alone may not require inpatient hospitalization” (Appendix Figure 1).
Study Design
Following a retrospective cohort study design, we systematically sampled 150 admissions from those “admitted without definite medical acuity” to create the exposure group and 150 from the “definitely medically appropriate” admissions to create the nonexposure group. Our sampling method involved selecting every third record until reaching the target sample size. This method and group sizes were determined prior to beginning data collection. Given the expected incidence of 33% AEs in the unexposed group (consistent with previous reports of AEs using the trigger tool5), we anticipated that a total sample size of 300 would be appropriate to capture a relative risk of at least 1.5 with 80% power and 95% confidence level.
Chart review was performed to capture patient demographics, admission characteristics, and hospitalization outcomes. We captured emergency severity index (ESI)6, a validated, reliable triage assessment score assigned by our emergency department, as a measurement of acute illness and calculated the Charlson comorbidity index (CCI)7 as a measurement of chronic comorbidity.
Identification of Adverse Events
We measured AEs by using the Institute for Healthcare Improvement Global Trigger Tool,8,9 which is estimated to identify up to 10 times more AEs than other methods, such as voluntary reporting.5 This protocol includes 28 triggers in the Cares and Medication Modules that serve as indicators that an AE may have occurred. The presence of a trigger is not necessarily an AE but a clue for further analysis. Two investigators (AS and CS) independently systematically searched for the presence of triggers within each patient chart. Trigger identification prompted in-depth analysis to confirm the occurrence of an AE and to characterize its severity by using the National Coordinating Council for Medication Error Reporting and Prevention categorization.10 An AE was coded when independent reviewers identified evidence of a preventable or nonpreventable “noxious and unintended event occurring in association with medical care.”9 By definition, any AEs identified were patient harms. Findings were reviewed weekly to ensure agreement, and discrepancies were adjudicated by a third investigator (MB).
All study data were collected by using REDCap electronic data capture tools hosted at the University of Washington.11 The University of Washington Institutional Review Board granted approval for this study.
Study Outcome and Statistical Analysis
The primary outcome was AEs per group with results calculated in three ways: AEs per 1,000 patient-days, AEs per 100 admissions, and percent of admissions with an AE. The risk ratio (RR) for the percent of admissions with an AE and the incidence rate ratio (IRR) for AEs per 1,000 patient-days were calculated for the comparison of significance.
Other data were analyzed by using Pearson’s chi square for categorical data, Student t test for normally distributed quantitative data, and Wilcoxon rank-sum (Mann–Whitney) for the length of stay (due to skew). Analyses were conducted using STATA (version 15.1, College Station, TX).
This work follows standards for reporting observational students as outlined in the STROBE statement.12
RESULTS
Patient Demographics
Both groups were predominantly white/non-Hispanic, male, and English-speaking (Table 1). More patients without definite medical acuity were covered by public insurance (78.9% vs 69.8%, P = .010) and discharged to homelessness (34.8% vs 22.6%, P = .041).
Measures of Illness
Patients considered definitely medically appropriate had lower ESI scores, indicative of more acute presentation, than those without definite medical acuity (2.73 [95% CI 2.64-2.81] vs 2.87 [95% CI 2.78-2.95], P = .026). There was no difference in CCI scores (Table 1).
Reason for Admission and Outcomes
Admissions considered definitely medically appropriate more frequently had an identified diagnosis/syndrome (66% vs 53%) or objective measurement (8.7% vs 2.7%) listed as the reason for admission, whereas patients admitted without definite medical acuity more freuqently had undifferentiated symptoms (34.7% vs 24%) or other/disposition (6% vs 1.3%) listed. The most common factors that triage physicians cited as contributing to the decision to admit patients without definite medical acuity included homelessness (34%), lack of outpatient social support (32%), and substance use disorder (25%). More details are available in Appendix Tables 1 and 2.
Admissions without definite medical acuity were longer than those with definite medical acuity (6.6 vs 6.0 days, P = .038), but there was no difference in emergency department readmissions within 48 hours or hospital readmissions within 30 days (Table 1).
Adverse Events
We identified 76 AEs in 41 admissions without definite medical acuity (range 0-10 AEs per admission) and 63 AEs in 44 definitely medically appropriate admissions (range 0-4 AEs per admission). The percentage of admissions with AE (27.3% vs 29.3%; RR 0.93, 95% CI 0.65-1.34, P = .70) and the rate of AE/1,000 patient-days (76.8 vs 70.4; IRR 1.09, 95% CI 0.77-1.55, P = .61) did not show statistically significant differences. The distribution of AE severity was similar between the two groups (Table 2). Most identified AEs caused temporary harm to the patient and were rated at severity levels E or F. Severe AEs, including at least one level I (patient death), occurred in both groups. The complete listing of positive triggers leading to adverse event identification by group and severity is available in Appendix Table 3.
DISCUSSION
By using a robust, standardized method, we found that patients admitted without definite medical acuity experienced the same number of inpatient AEs as patients admitted for definitely medically appropriate reasons. While the groups were relatively similar overall in terms of demographics and chronic comorbidity, we found evidence of social vulnerability in the group admitted without definite medical acuity in the form of increased rates of homelessness, triage physician concern regarding the lack of outpatient social support, and disposition-related reasons for admission. That both groups suffered harm―including patient death―while admitted to the hospital is striking, in particular for those patients who were admitted because of the lack of suitable outpatient options.
The potential limitations to the generalizability of this work include the single-site, safety-net setting and the use of individual physician determination of admission appropriateness. The proportion of admissions without definite medical acuity reported here is similar to that reported by previously published admission decision-making studies,2,3 and the rate of AEs observed is similar to rates measured in other studies using the trigger tool methodology.5,13 These similarities suggest some commonality across settings. Our study treats triage physician assessment as the marker of difference in defining the two groups and is an inherently subjective assessment that is reflective of real-world, holistic decision-making. Notably, the triage physician assessment was corroborated by corresponding differences in the ESI score, an acute triage assessment completed by a clinician outside of our team.
This study adds foundational knowledge to the risk/benefit discussion surrounding the decision to admit. Physician admission decisions are likely influenced by concern for the safety of vulnerable patients. Our results suggest that considering the risk of hospitalization itself in this decision-making remains important.
1. Mushlin AI, Appel FA. Extramedical factors in the decision to hospitalize medical patients. Am J Public Health. 1976;66(2):170-172. https://doi.org/10.2105/AJPH.66.2.170.
2. Lewis Hunter AE, Spatz ES, Bernstein SL, Rosenthal MS. Factors influencing hospital admission of noncritically ill patients presenting to the emergency department: a cross-sectional study. J Gen Intern Med. 2016;31(1):37-44. https://doi.org/10.1007/s11606-015-3438-8.
3. Pope I, Burn H, Ismail SA, Harris T, McCoy D. A qualitative study exploring the factors influencing admission to hospital from the emergency department. BMJ Open. 2017;7(8):e011543. https://doi.org/10.1136/bmjopen-2016-011543.
4. Levinson DR. Adverse Events in Hospitals: National Incidence among Medicare Beneficiaries. 2010. https://oig.hhs.gov/oei/reports/oei-06-09-00090.pdf. Accessed May 20, 2019.
5. Classen DC, Resar R, Griffin F, et al. ‘Global trigger tool’ shows that adverse events in hospitals may be ten times greater than previously measured. Health Aff (Millwood). 2011;30(4):581-589. https://doi.org/10.1377/hlthaff.2011.0190.
6. Wuerz RC, Milne LW, Eitel DR, Travers D, Gilboy N. Reliability and validity of a new five-level triage instrument. Acad Emerg Med. 2000;7(3):236-242.https://doi.org/10.1111/j.1553-2712.2000.tb01066.x.
7. Charlson ME, Pompei P, Ales KL, MacKenzie CR. A new method of classifying prognostic comorbidity in longitudinal studies: development and validation. J Chron Dis. 1987;40:373-383. https://doi.org/10.1016/0021-9681(87)90171-8.
8. Resar RK, Rozich JD, Classen D. Methodology and rationale for the measurement of harm with trigger tools. Qual Saf Health Care. 2003;12(2):ii39-ii45. https://doi.org/10.1136/qhc.12.suppl_2.ii39.
9. Griffen FA, Resar RK. IHI Global Trigger Tool for Measuring Adverse Events (Second Edition). Cambridge, Massachusetts: Institute for Healthcare Improvement; 2009.
10. National Coordinating Council for Medication Error Reporting and Prevention (NCC MERP) Index for Categorizing Errors. https://www.nccmerp.org/types-medication-errors Accessed May 20, 2019.
11. Harris PA, Taylor R, Thielke R, Payne J, Gonzalez N, Conde JG. Research electronic data capture (REDCap)--a metadata-driven methodology and workflow process for providing translational research informatics support. J Biomed Inform. 2009;42(2):377-381. https://doi.org/10.1016/j.jbi.2008.08.010.
12. von Elm E, Altman DG, Egger M, Pocock SJ, Gøtzsche PC, Vandenbroucke JP. The Strengthening the Reporting of Observational Studies in Epidemiology (STROBE) statement: guidelines for reporting observational studies. Ann Intern Med. 2007;147(8):573-577.
13. Kennerly DA, Kudyakov R, da Graca B, et al. Characterization of adverse events detected in a large health care delivery system using an enhanced global trigger tool over a five-year interval. Health Serv Res. 2014;49(5):1407-1425. https://doi.org/10.1111/1475-6773.12163.
© 2020 Society of Hospital Medicine