User login
Adverse Events Experienced by Patients Hospitalized without Definite Medical Acuity: A Retrospective Cohort Study
Evidence exists that physicians consider what may be called “social” or “nonmedical” factors (lack of social support or barriers to access) in hospital admission decision-making and that patients are hospitalized even in the absence of a level of medical acuity warranting admission.1-3 Although hospitalization is associated with the risk of adverse events (AEs),4 whether this risk is related to the medical acuity of admission remains unclear. Our study sought to quantify the AEs experienced by patients hospitalized without definite medical acuity compared with those experienced by patients hospitalized with a definite medically appropriate indication for admission.
METHODS
Setting and Database Used for Analysis
This study was conducted at an urban, safety-net, public teaching hospital. At our site, calls for medical admissions are always answered by a hospital medicine attending physician (“triage physician”) who works collaboratively with the referring physician to facilitate appropriate disposition. Many of these discussions occur via telephone, but the triage physician may also assess the patient directly if needed. This study involved 24 triage physicians who directly assessed the patient in 65% of the cases.
At the time of each admission call, the triage physician logs the following information into a central triage database: date and time of call, patient location, reason for admission, assessment of appropriateness for medical floor, contributing factors to admission decision-making, and patient disposition.
Admission Appropriateness Group Designation
To be considered for inclusion in this study, calls must have originated from the emergency department and resulted in admission to the general medicine floor on either a resident teaching or hospitalist service from February 1, 2018 to June 1, 2018. This time frame was selected to avoid the start of a new academic cycle in late June that may confound AE rates.
The designation of appropriateness was determined by the triage physician’s logged response to triage database questions at the time of the admission call. Of the 748 admissions meeting inclusion criteria, 513 (68.6%) were considered definitely appropriate on the basis of the triage physician’s response to the question “Based ONLY on the medical reason for hospitalization, in your opinion, how appropriate is this admission to the medicine floor service?” Furthermore, 169 (22.6%) were considered without definite medical acuity on the basis of the triage physician’s indication that “severity of medical problems alone may not require inpatient hospitalization” (Appendix Figure 1).
Study Design
Following a retrospective cohort study design, we systematically sampled 150 admissions from those “admitted without definite medical acuity” to create the exposure group and 150 from the “definitely medically appropriate” admissions to create the nonexposure group. Our sampling method involved selecting every third record until reaching the target sample size. This method and group sizes were determined prior to beginning data collection. Given the expected incidence of 33% AEs in the unexposed group (consistent with previous reports of AEs using the trigger tool5), we anticipated that a total sample size of 300 would be appropriate to capture a relative risk of at least 1.5 with 80% power and 95% confidence level.
Chart review was performed to capture patient demographics, admission characteristics, and hospitalization outcomes. We captured emergency severity index (ESI)6, a validated, reliable triage assessment score assigned by our emergency department, as a measurement of acute illness and calculated the Charlson comorbidity index (CCI)7 as a measurement of chronic comorbidity.
Identification of Adverse Events
We measured AEs by using the Institute for Healthcare Improvement Global Trigger Tool,8,9 which is estimated to identify up to 10 times more AEs than other methods, such as voluntary reporting.5 This protocol includes 28 triggers in the Cares and Medication Modules that serve as indicators that an AE may have occurred. The presence of a trigger is not necessarily an AE but a clue for further analysis. Two investigators (AS and CS) independently systematically searched for the presence of triggers within each patient chart. Trigger identification prompted in-depth analysis to confirm the occurrence of an AE and to characterize its severity by using the National Coordinating Council for Medication Error Reporting and Prevention categorization.10 An AE was coded when independent reviewers identified evidence of a preventable or nonpreventable “noxious and unintended event occurring in association with medical care.”9 By definition, any AEs identified were patient harms. Findings were reviewed weekly to ensure agreement, and discrepancies were adjudicated by a third investigator (MB).
All study data were collected by using REDCap electronic data capture tools hosted at the University of Washington.11 The University of Washington Institutional Review Board granted approval for this study.
Study Outcome and Statistical Analysis
The primary outcome was AEs per group with results calculated in three ways: AEs per 1,000 patient-days, AEs per 100 admissions, and percent of admissions with an AE. The risk ratio (RR) for the percent of admissions with an AE and the incidence rate ratio (IRR) for AEs per 1,000 patient-days were calculated for the comparison of significance.
Other data were analyzed by using Pearson’s chi square for categorical data, Student t test for normally distributed quantitative data, and Wilcoxon rank-sum (Mann–Whitney) for the length of stay (due to skew). Analyses were conducted using STATA (version 15.1, College Station, TX).
This work follows standards for reporting observational students as outlined in the STROBE statement.12
RESULTS
Patient Demographics
Both groups were predominantly white/non-Hispanic, male, and English-speaking (Table 1). More patients without definite medical acuity were covered by public insurance (78.9% vs 69.8%, P = .010) and discharged to homelessness (34.8% vs 22.6%, P = .041).
Measures of Illness
Patients considered definitely medically appropriate had lower ESI scores, indicative of more acute presentation, than those without definite medical acuity (2.73 [95% CI 2.64-2.81] vs 2.87 [95% CI 2.78-2.95], P = .026). There was no difference in CCI scores (Table 1).
Reason for Admission and Outcomes
Admissions considered definitely medically appropriate more frequently had an identified diagnosis/syndrome (66% vs 53%) or objective measurement (8.7% vs 2.7%) listed as the reason for admission, whereas patients admitted without definite medical acuity more freuqently had undifferentiated symptoms (34.7% vs 24%) or other/disposition (6% vs 1.3%) listed. The most common factors that triage physicians cited as contributing to the decision to admit patients without definite medical acuity included homelessness (34%), lack of outpatient social support (32%), and substance use disorder (25%). More details are available in Appendix Tables 1 and 2.
Admissions without definite medical acuity were longer than those with definite medical acuity (6.6 vs 6.0 days, P = .038), but there was no difference in emergency department readmissions within 48 hours or hospital readmissions within 30 days (Table 1).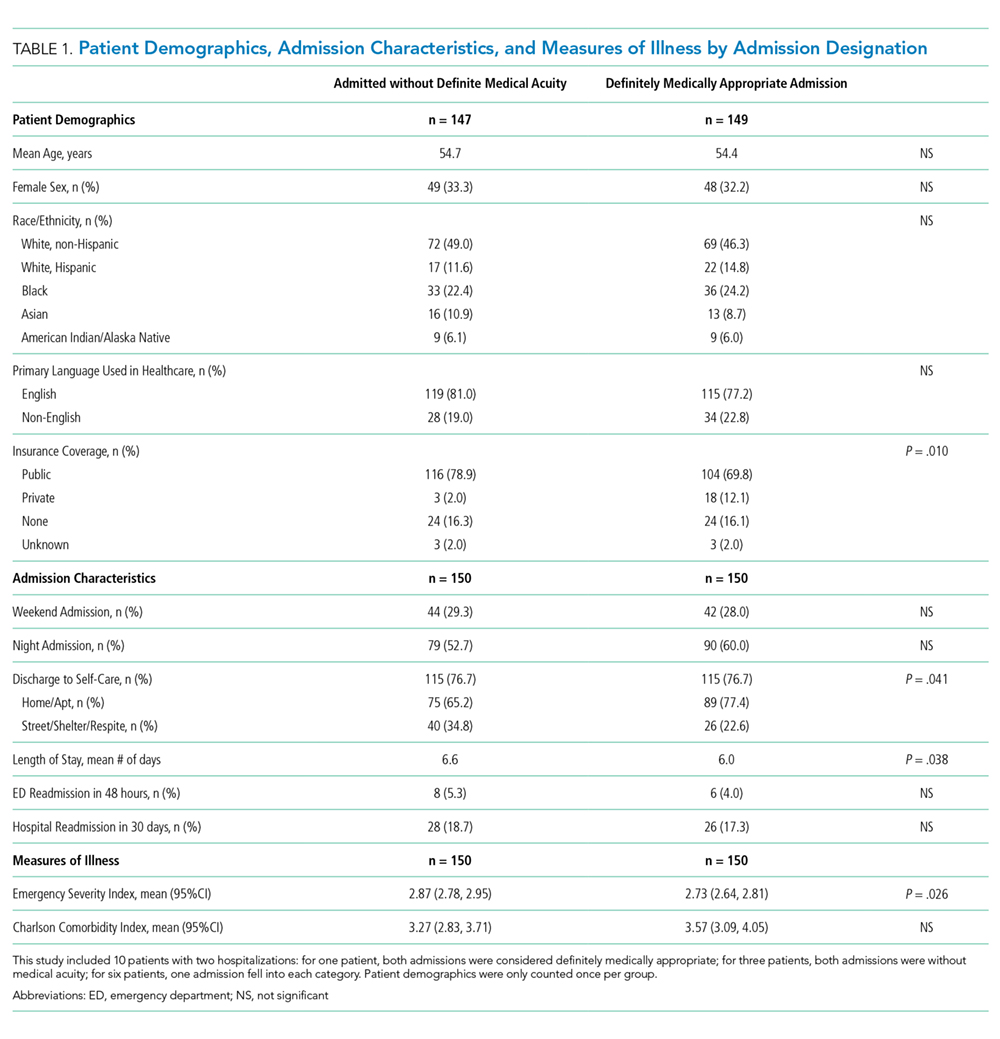
Adverse Events
We identified 76 AEs in 41 admissions without definite medical acuity (range 0-10 AEs per admission) and 63 AEs in 44 definitely medically appropriate admissions (range 0-4 AEs per admission). The percentage of admissions with AE (27.3% vs 29.3%; RR 0.93, 95% CI 0.65-1.34, P = .70) and the rate of AE/1,000 patient-days (76.8 vs 70.4; IRR 1.09, 95% CI 0.77-1.55, P = .61) did not show statistically significant differences. The distribution of AE severity was similar between the two groups (Table 2). Most identified AEs caused temporary harm to the patient and were rated at severity levels E or F. Severe AEs, including at least one level I (patient death), occurred in both groups. The complete listing of positive triggers leading to adverse event identification by group and severity is available in Appendix Table 3.
DISCUSSION
By using a robust, standardized method, we found that patients admitted without definite medical acuity experienced the same number of inpatient AEs as patients admitted for definitely medically appropriate reasons. While the groups were relatively similar overall in terms of demographics and chronic comorbidity, we found evidence of social vulnerability in the group admitted without definite medical acuity in the form of increased rates of homelessness, triage physician concern regarding the lack of outpatient social support, and disposition-related reasons for admission. That both groups suffered harm―including patient death―while admitted to the hospital is striking, in particular for those patients who were admitted because of the lack of suitable outpatient options.
The potential limitations to the generalizability of this work include the single-site, safety-net setting and the use of individual physician determination of admission appropriateness. The proportion of admissions without definite medical acuity reported here is similar to that reported by previously published admission decision-making studies,2,3 and the rate of AEs observed is similar to rates measured in other studies using the trigger tool methodology.5,13 These similarities suggest some commonality across settings. Our study treats triage physician assessment as the marker of difference in defining the two groups and is an inherently subjective assessment that is reflective of real-world, holistic decision-making. Notably, the triage physician assessment was corroborated by corresponding differences in the ESI score, an acute triage assessment completed by a clinician outside of our team.
This study adds foundational knowledge to the risk/benefit discussion surrounding the decision to admit. Physician admission decisions are likely influenced by concern for the safety of vulnerable patients. Our results suggest that considering the risk of hospitalization itself in this decision-making remains important.
1. Mushlin AI, Appel FA. Extramedical factors in the decision to hospitalize medical patients. Am J Public Health. 1976;66(2):170-172. https://doi.org/10.2105/AJPH.66.2.170.
2. Lewis Hunter AE, Spatz ES, Bernstein SL, Rosenthal MS. Factors influencing hospital admission of noncritically ill patients presenting to the emergency department: a cross-sectional study. J Gen Intern Med. 2016;31(1):37-44. https://doi.org/10.1007/s11606-015-3438-8.
3. Pope I, Burn H, Ismail SA, Harris T, McCoy D. A qualitative study exploring the factors influencing admission to hospital from the emergency department. BMJ Open. 2017;7(8):e011543. https://doi.org/10.1136/bmjopen-2016-011543.
4. Levinson DR. Adverse Events in Hospitals: National Incidence among Medicare Beneficiaries. 2010. https://oig.hhs.gov/oei/reports/oei-06-09-00090.pdf. Accessed May 20, 2019.
5. Classen DC, Resar R, Griffin F, et al. ‘Global trigger tool’ shows that adverse events in hospitals may be ten times greater than previously measured. Health Aff (Millwood). 2011;30(4):581-589. https://doi.org/10.1377/hlthaff.2011.0190.
6. Wuerz RC, Milne LW, Eitel DR, Travers D, Gilboy N. Reliability and validity of a new five-level triage instrument. Acad Emerg Med. 2000;7(3):236-242.https://doi.org/10.1111/j.1553-2712.2000.tb01066.x.
7. Charlson ME, Pompei P, Ales KL, MacKenzie CR. A new method of classifying prognostic comorbidity in longitudinal studies: development and validation. J Chron Dis. 1987;40:373-383. https://doi.org/10.1016/0021-9681(87)90171-8.
8. Resar RK, Rozich JD, Classen D. Methodology and rationale for the measurement of harm with trigger tools. Qual Saf Health Care. 2003;12(2):ii39-ii45. https://doi.org/10.1136/qhc.12.suppl_2.ii39.
9. Griffen FA, Resar RK. IHI Global Trigger Tool for Measuring Adverse Events (Second Edition). Cambridge, Massachusetts: Institute for Healthcare Improvement; 2009.
10. National Coordinating Council for Medication Error Reporting and Prevention (NCC MERP) Index for Categorizing Errors. https://www.nccmerp.org/types-medication-errors Accessed May 20, 2019.
11. Harris PA, Taylor R, Thielke R, Payne J, Gonzalez N, Conde JG. Research electronic data capture (REDCap)--a metadata-driven methodology and workflow process for providing translational research informatics support. J Biomed Inform. 2009;42(2):377-381. https://doi.org/10.1016/j.jbi.2008.08.010.
12. von Elm E, Altman DG, Egger M, Pocock SJ, Gøtzsche PC, Vandenbroucke JP. The Strengthening the Reporting of Observational Studies in Epidemiology (STROBE) statement: guidelines for reporting observational studies. Ann Intern Med. 2007;147(8):573-577.
13. Kennerly DA, Kudyakov R, da Graca B, et al. Characterization of adverse events detected in a large health care delivery system using an enhanced global trigger tool over a five-year interval. Health Serv Res. 2014;49(5):1407-1425. https://doi.org/10.1111/1475-6773.12163.
Evidence exists that physicians consider what may be called “social” or “nonmedical” factors (lack of social support or barriers to access) in hospital admission decision-making and that patients are hospitalized even in the absence of a level of medical acuity warranting admission.1-3 Although hospitalization is associated with the risk of adverse events (AEs),4 whether this risk is related to the medical acuity of admission remains unclear. Our study sought to quantify the AEs experienced by patients hospitalized without definite medical acuity compared with those experienced by patients hospitalized with a definite medically appropriate indication for admission.
METHODS
Setting and Database Used for Analysis
This study was conducted at an urban, safety-net, public teaching hospital. At our site, calls for medical admissions are always answered by a hospital medicine attending physician (“triage physician”) who works collaboratively with the referring physician to facilitate appropriate disposition. Many of these discussions occur via telephone, but the triage physician may also assess the patient directly if needed. This study involved 24 triage physicians who directly assessed the patient in 65% of the cases.
At the time of each admission call, the triage physician logs the following information into a central triage database: date and time of call, patient location, reason for admission, assessment of appropriateness for medical floor, contributing factors to admission decision-making, and patient disposition.
Admission Appropriateness Group Designation
To be considered for inclusion in this study, calls must have originated from the emergency department and resulted in admission to the general medicine floor on either a resident teaching or hospitalist service from February 1, 2018 to June 1, 2018. This time frame was selected to avoid the start of a new academic cycle in late June that may confound AE rates.
The designation of appropriateness was determined by the triage physician’s logged response to triage database questions at the time of the admission call. Of the 748 admissions meeting inclusion criteria, 513 (68.6%) were considered definitely appropriate on the basis of the triage physician’s response to the question “Based ONLY on the medical reason for hospitalization, in your opinion, how appropriate is this admission to the medicine floor service?” Furthermore, 169 (22.6%) were considered without definite medical acuity on the basis of the triage physician’s indication that “severity of medical problems alone may not require inpatient hospitalization” (Appendix Figure 1).
Study Design
Following a retrospective cohort study design, we systematically sampled 150 admissions from those “admitted without definite medical acuity” to create the exposure group and 150 from the “definitely medically appropriate” admissions to create the nonexposure group. Our sampling method involved selecting every third record until reaching the target sample size. This method and group sizes were determined prior to beginning data collection. Given the expected incidence of 33% AEs in the unexposed group (consistent with previous reports of AEs using the trigger tool5), we anticipated that a total sample size of 300 would be appropriate to capture a relative risk of at least 1.5 with 80% power and 95% confidence level.
Chart review was performed to capture patient demographics, admission characteristics, and hospitalization outcomes. We captured emergency severity index (ESI)6, a validated, reliable triage assessment score assigned by our emergency department, as a measurement of acute illness and calculated the Charlson comorbidity index (CCI)7 as a measurement of chronic comorbidity.
Identification of Adverse Events
We measured AEs by using the Institute for Healthcare Improvement Global Trigger Tool,8,9 which is estimated to identify up to 10 times more AEs than other methods, such as voluntary reporting.5 This protocol includes 28 triggers in the Cares and Medication Modules that serve as indicators that an AE may have occurred. The presence of a trigger is not necessarily an AE but a clue for further analysis. Two investigators (AS and CS) independently systematically searched for the presence of triggers within each patient chart. Trigger identification prompted in-depth analysis to confirm the occurrence of an AE and to characterize its severity by using the National Coordinating Council for Medication Error Reporting and Prevention categorization.10 An AE was coded when independent reviewers identified evidence of a preventable or nonpreventable “noxious and unintended event occurring in association with medical care.”9 By definition, any AEs identified were patient harms. Findings were reviewed weekly to ensure agreement, and discrepancies were adjudicated by a third investigator (MB).
All study data were collected by using REDCap electronic data capture tools hosted at the University of Washington.11 The University of Washington Institutional Review Board granted approval for this study.
Study Outcome and Statistical Analysis
The primary outcome was AEs per group with results calculated in three ways: AEs per 1,000 patient-days, AEs per 100 admissions, and percent of admissions with an AE. The risk ratio (RR) for the percent of admissions with an AE and the incidence rate ratio (IRR) for AEs per 1,000 patient-days were calculated for the comparison of significance.
Other data were analyzed by using Pearson’s chi square for categorical data, Student t test for normally distributed quantitative data, and Wilcoxon rank-sum (Mann–Whitney) for the length of stay (due to skew). Analyses were conducted using STATA (version 15.1, College Station, TX).
This work follows standards for reporting observational students as outlined in the STROBE statement.12
RESULTS
Patient Demographics
Both groups were predominantly white/non-Hispanic, male, and English-speaking (Table 1). More patients without definite medical acuity were covered by public insurance (78.9% vs 69.8%, P = .010) and discharged to homelessness (34.8% vs 22.6%, P = .041).
Measures of Illness
Patients considered definitely medically appropriate had lower ESI scores, indicative of more acute presentation, than those without definite medical acuity (2.73 [95% CI 2.64-2.81] vs 2.87 [95% CI 2.78-2.95], P = .026). There was no difference in CCI scores (Table 1).
Reason for Admission and Outcomes
Admissions considered definitely medically appropriate more frequently had an identified diagnosis/syndrome (66% vs 53%) or objective measurement (8.7% vs 2.7%) listed as the reason for admission, whereas patients admitted without definite medical acuity more freuqently had undifferentiated symptoms (34.7% vs 24%) or other/disposition (6% vs 1.3%) listed. The most common factors that triage physicians cited as contributing to the decision to admit patients without definite medical acuity included homelessness (34%), lack of outpatient social support (32%), and substance use disorder (25%). More details are available in Appendix Tables 1 and 2.
Admissions without definite medical acuity were longer than those with definite medical acuity (6.6 vs 6.0 days, P = .038), but there was no difference in emergency department readmissions within 48 hours or hospital readmissions within 30 days (Table 1).
Adverse Events
We identified 76 AEs in 41 admissions without definite medical acuity (range 0-10 AEs per admission) and 63 AEs in 44 definitely medically appropriate admissions (range 0-4 AEs per admission). The percentage of admissions with AE (27.3% vs 29.3%; RR 0.93, 95% CI 0.65-1.34, P = .70) and the rate of AE/1,000 patient-days (76.8 vs 70.4; IRR 1.09, 95% CI 0.77-1.55, P = .61) did not show statistically significant differences. The distribution of AE severity was similar between the two groups (Table 2). Most identified AEs caused temporary harm to the patient and were rated at severity levels E or F. Severe AEs, including at least one level I (patient death), occurred in both groups. The complete listing of positive triggers leading to adverse event identification by group and severity is available in Appendix Table 3.
DISCUSSION
By using a robust, standardized method, we found that patients admitted without definite medical acuity experienced the same number of inpatient AEs as patients admitted for definitely medically appropriate reasons. While the groups were relatively similar overall in terms of demographics and chronic comorbidity, we found evidence of social vulnerability in the group admitted without definite medical acuity in the form of increased rates of homelessness, triage physician concern regarding the lack of outpatient social support, and disposition-related reasons for admission. That both groups suffered harm―including patient death―while admitted to the hospital is striking, in particular for those patients who were admitted because of the lack of suitable outpatient options.
The potential limitations to the generalizability of this work include the single-site, safety-net setting and the use of individual physician determination of admission appropriateness. The proportion of admissions without definite medical acuity reported here is similar to that reported by previously published admission decision-making studies,2,3 and the rate of AEs observed is similar to rates measured in other studies using the trigger tool methodology.5,13 These similarities suggest some commonality across settings. Our study treats triage physician assessment as the marker of difference in defining the two groups and is an inherently subjective assessment that is reflective of real-world, holistic decision-making. Notably, the triage physician assessment was corroborated by corresponding differences in the ESI score, an acute triage assessment completed by a clinician outside of our team.
This study adds foundational knowledge to the risk/benefit discussion surrounding the decision to admit. Physician admission decisions are likely influenced by concern for the safety of vulnerable patients. Our results suggest that considering the risk of hospitalization itself in this decision-making remains important.
1. Mushlin AI, Appel FA. Extramedical factors in the decision to hospitalize medical patients. Am J Public Health. 1976;66(2):170-172. https://doi.org/10.2105/AJPH.66.2.170.
2. Lewis Hunter AE, Spatz ES, Bernstein SL, Rosenthal MS. Factors influencing hospital admission of noncritically ill patients presenting to the emergency department: a cross-sectional study. J Gen Intern Med. 2016;31(1):37-44. https://doi.org/10.1007/s11606-015-3438-8.
3. Pope I, Burn H, Ismail SA, Harris T, McCoy D. A qualitative study exploring the factors influencing admission to hospital from the emergency department. BMJ Open. 2017;7(8):e011543. https://doi.org/10.1136/bmjopen-2016-011543.
4. Levinson DR. Adverse Events in Hospitals: National Incidence among Medicare Beneficiaries. 2010. https://oig.hhs.gov/oei/reports/oei-06-09-00090.pdf. Accessed May 20, 2019.
5. Classen DC, Resar R, Griffin F, et al. ‘Global trigger tool’ shows that adverse events in hospitals may be ten times greater than previously measured. Health Aff (Millwood). 2011;30(4):581-589. https://doi.org/10.1377/hlthaff.2011.0190.
6. Wuerz RC, Milne LW, Eitel DR, Travers D, Gilboy N. Reliability and validity of a new five-level triage instrument. Acad Emerg Med. 2000;7(3):236-242.https://doi.org/10.1111/j.1553-2712.2000.tb01066.x.
7. Charlson ME, Pompei P, Ales KL, MacKenzie CR. A new method of classifying prognostic comorbidity in longitudinal studies: development and validation. J Chron Dis. 1987;40:373-383. https://doi.org/10.1016/0021-9681(87)90171-8.
8. Resar RK, Rozich JD, Classen D. Methodology and rationale for the measurement of harm with trigger tools. Qual Saf Health Care. 2003;12(2):ii39-ii45. https://doi.org/10.1136/qhc.12.suppl_2.ii39.
9. Griffen FA, Resar RK. IHI Global Trigger Tool for Measuring Adverse Events (Second Edition). Cambridge, Massachusetts: Institute for Healthcare Improvement; 2009.
10. National Coordinating Council for Medication Error Reporting and Prevention (NCC MERP) Index for Categorizing Errors. https://www.nccmerp.org/types-medication-errors Accessed May 20, 2019.
11. Harris PA, Taylor R, Thielke R, Payne J, Gonzalez N, Conde JG. Research electronic data capture (REDCap)--a metadata-driven methodology and workflow process for providing translational research informatics support. J Biomed Inform. 2009;42(2):377-381. https://doi.org/10.1016/j.jbi.2008.08.010.
12. von Elm E, Altman DG, Egger M, Pocock SJ, Gøtzsche PC, Vandenbroucke JP. The Strengthening the Reporting of Observational Studies in Epidemiology (STROBE) statement: guidelines for reporting observational studies. Ann Intern Med. 2007;147(8):573-577.
13. Kennerly DA, Kudyakov R, da Graca B, et al. Characterization of adverse events detected in a large health care delivery system using an enhanced global trigger tool over a five-year interval. Health Serv Res. 2014;49(5):1407-1425. https://doi.org/10.1111/1475-6773.12163.
© 2020 Society of Hospital Medicine
Heparin Bridging for Atrial Fibrillation
Clinical question: In patients with atrial fibrillation (AF) or flutter, is heparin bridging needed during interruption of warfarin therapy for surgery or invasive procedures?
Background: Bridging is intended to decrease the risk of stroke or other arterial thromboembolism by minimizing time off anticoagulation. Bridging may increase the risk of serious bleeding, offsetting any benefit. Guidelines have provided weak and inconsistent recommendations due to a lack of randomized trials.
Study design: Randomized, double blind, placebo-controlled trial.
Setting: More than 100 centers in the U.S. and Canada, from 2009-2014.
Synopsis: Investigators randomized 1,884 patients on warfarin with a CHADS2 risk factor of one or higher undergoing elective surgery or procedure to dalteparin or placebo, from three days to 24 hours before the procedure and for five to 10 days after. Mean CHADS2 score was 2.3; 3% of patients had scores of five to six. Approximately one-third of patients were on aspirin, and most procedures (89%) were classified as minor. Patients with mechanical heart valves, stroke/transient ischemic attack (TIA)/systemic embolization within 12 weeks, major bleeding within six weeks, renal insufficiency, thrombocytopenia or planned cardiac, intracranial, or intraspinal surgery were excluded.
Thirty-day incidence of arterial thromboembolism (stroke, TIA, systemic embolization) was 0.4% in the non-bridging group and 0.3% in the bridging group (P=0.01 for noninferiority). Patients suffering arterial thromboembolism had mean CHADS2 scores of 2.6; most events occurred after minor procedures. Major bleeding was less common with no bridge (1.3% vs. 3.2%, relative risk 0.41, P=0.005 for superiority).
In this trial, most patients underwent minor procedures and few CHADS2 5-6 patients were enrolled; however, this well-designed, randomized trial adds important evidence to existing observational data.
Bottom line: Bridging is not warranted for most AF patients with CHADS2 scores of four or lower, at least for low-risk procedures.
Citation: Douketis JD, Spyropoulos AC, Kaatz S, et al. Perioperative bridging anticoagulation in patients with atrial fibrillation. N Engl J Med. 2015;373(9):823-833.
Modified Valsalva Better than Standard Maneuver to Restore Sinus Rhythm
Clinical question: Does a postural modification to the Valsalva maneuver improve its effectiveness?
Background: The Valsalva maneuver, often used to treat supraventricular tachycardia, is rarely successful. A modification to the maneuver to increase relaxation phase venous return and vagal stimulation could improve its efficacy.
Study design: Multicenter, randomized controlled trial (RCT).
Setting: Ten emergency departments in England.
Synopsis: Four hundred thirty-three patients with stable supraventricular tachycardia (excluding atrial fibrillation or flutter) were randomized to use the Valsalva maneuver (control) or modified Valsalva maneuver (intervention). In the control group, strain was standardized using a manometer (40 mm Hg for 15 seconds). In the intervention group, patients underwent the same maneuver, followed by lying supine with passive leg raise to 45 degrees for 15 seconds. Participants could repeat the maneuver if it was initially unsuccessful. Randomization was stratified by center.
Using an intention-to-treat analysis, 43% of the intervention group achieved the primary outcome of sinus rhythm one minute after straining, compared with 17% of the control group (P<0.0001). The intervention group was less likely to receive adenosine (50% vs. 69%, P=0.0002) or any emergency, anti-arrhythmic treatment (80% vs. 57%, P<0.0001).
No significant differences were seen in hospital admissions, length of ED stay, or adverse events between groups.
Bottom line: In patients with stable supraventricular tachycardia, modifying the Valsalva maneuver is significantly more effective in restoring sinus rhythm.
Citation: Appelboam A, Reuben A, Mann C, et al. Postural modification to the standard Valsalva manoeuvre for emergency treatment of supraventricular tachycardias (REVERT): a randomised controlled trial [published online ahead of print August 24, 2015]. Lancet. doi: 10.1016/S0140-6736(15)61485-4.
CHA2DS2-Vasc Score Modestly Predicts Stroke, Thromboembolism, Death
Clinical question: For patients with heart failure (HF), with and without concurrent Afib (AF), does the CHA2DS2-VASc score predict ischemic stroke, thromboembolism, and death?
Background: Factors in the CHA2DS2-VASc score predict increased risk of stroke, thromboembolism, and death, regardless of whether AF is present. It is unknown if this score can identify subgroups of patients with HF, with and without AF, at particularly high or low risk of these events.
Study design: Prospective, cohort study.
Setting: Three Danish registries, 2000-2012.
Synopsis: Among 42,987 patients 50 years and older with incident HF not on anticoagulation, the absolute risk of stroke among patients without AF was 1.5% per year or higher with a CHA2DS2-VASc score of two or higher. The absolute risk of stroke was 4% or higher at five years. Risks were higher in the 21.9% of patients with AF. The CHA2DS2-VASc score modestly predicted endpoints and had an approximately 90% negative predictive value for stroke, thromboembolism, and death at one-year follow-up, regardless of whether or not AF was present.
In this large study, HF patients in a non-diverse population were studied, and some patients may have had undiagnosed AF. Functional status and ejection fraction in patients with HF could not be categorized; however, reported five-year results may be generalizable to patients with chronic HF. Select patients with HF without AF, who have two or more factors of the score besides HF, might benefit from anticoagulation.
Bottom line: The CHA2DS2-VASc score modestly predicts stroke, thromboembolism, and death among patients with HF, but further studies are needed to determine its clinical usefulness.
Citation: Melgaard L, Gorst-Rasmussen A, Lane DA, Rasmussen LH, Larsen TB, Lip GY. Assessment of the CHA2DS2-VASc Score in predicting ischemic stroke, thromboembolism, and death in patients with heart failure with and without atrial fibrillation. JAMA. 2015;314(10):1030-1038.
Intraoperative Hypotension Predicts Postoperative Mortality
Clinical question: What blood pressure deviations during surgery are predictive of mortality?
Background: Despite the widely assumed importance of blood pressure (BP) management on postoperative outcomes, there are no accepted thresholds requiring intervention.
Study design: Retrospective cohort.
Setting: Six Veterans’ Affairs hospitals, 2001-2008.
Synopsis: Intraoperative BP data from 18,756 patients undergoing major noncardiac surgery were linked with procedure, patient-related risk factors, and 30-day mortality data from the VA Surgical Quality Improvement Program database. Overall 30-day mortality was 1.8%. Using three different methods for defining hyper- or hypotension (based on standard deviations from the mean in this population, absolute thresholds suggested by medical literature, or by changes from baseline BP), no measure of hypertension predicted mortality; however, after adjusting for 10 preoperative patient-related risk factors, extremely low BP for five minutes or more (whether defined as systolic BP <70 mmHg, mean arterial pressure <49 mmHg, or diastolic BP <30 mmHg) was associated with 30-day mortality, with statistically significant odds ratios in the 2.4-3.2 range.
Because this is an observational study, no causal relationship can be established from these data. Low BPs could be markers for sicker patients with increased mortality, despite researchers’ efforts to adjust for known preoperative risks.
Bottom line: Intraoperative hypotension lasting five minutes or more, but not intraoperative hypertension, predicts 30-day mortality.
Citation: Monk TG, Bronsert MR, Henderson WG, et al. Association between intraoperative hypotension and hypertension and 30-day postoperative mortality in noncardiac surgery. Anesthesiology. 2015;123(2):307-319.
Caprini Risk Assessment Tool Can Distinguish High Risk of VTE in Critically Ill Surgical Patients
Clinical question: Is the Caprini Risk Assessment Model for VTE risk valid in critically ill surgical patients?
Background: Critically ill surgical patients are at increased risk of developing VTE. Chemoprophylaxis decreases VTE risk, but benefits must be balanced against bleeding risk. Rapid and accurate risk stratification supports decisions about prophylaxis; however, data regarding appropriate risk stratification are limited.
Study design: Retrospective, cohort study.
Setting: Surgical ICU (SICU) at a single, U.S. academic medical center, 2007-2013.
Synopsis: Among 4,844 consecutive admissions, the in-hospital VTE rate was 7.5% (364). Using a previously validated, computer-generated, retrospective risk score based on the 2005 Caprini model, patients were most commonly at moderate risk for VTE upon ICU admission (32%). Fifteen percent (723) were extremely high risk. VTE incidence increased linearly with increasing Caprini scores. Data were abstracted from multiple electronic sources.
Younger age, recent sepsis or pneumonia, central venous access on ICU admission, personal VTE history, and operative procedure were significantly associated with inpatient VTE events. The proportion of patients who received chemoprophylaxis postoperatively was similar regardless of VTE risk. Patients at higher risk were more likely to receive chemoprophylaxis preoperatively.
Results from this retrospective, single-center study suggest that Caprini is a valid tool to predict inpatient VTE risk in this population. Inclusion of multiple risk factors may make calculation of this score prohibitive in other settings unless it can be computer generated.
Bottom line: Caprini risk scores accurately distinguish critically ill surgical patients at high risk of VTE from those at lower risk.
Citation: Obi AT, Pannucci CJ, Nackashi A, et al. Validation of the Caprini venous thromboembolism risk assessment model in critically ill surgical patients. JAMA Surg. 2015;150(10):941-948. doi:10.1001/jamasurg.2015.1841.
Adherence to Restrictive Red Blood Cell Transfusion Guidelines Improved with Peer Feedback
Clinical question: Can a multifaceted approach involving clinician education, peer email feedback, and monthly audit data improve adherence to restrictive red blood cell (RBC) transfusion guidelines?
Background: Randomized controlled trials and professional society guidelines support adoption of RBC transfusion strategies in stable, low-risk patients. Studies suggest that education and feedback from specialists may decrease inappropriate transfusion practices, but peer-to-peer feedback has not yet been explored.
Study design: Prospective, interventional study.
Setting: Tertiary care center SICU, single U.S. academic center.
Synopsis: All stable, low-risk SICU patients receiving RBC transfusions were included in this study. Intervention consisted of educational lectures to clinicians, dissemination of monthly aggregate audit transfusion data, and direct email feedback from a colleague to clinicians ordering transfusions outside of guidelines. Six-month intervention data were compared with six months of pre-intervention data.
During the intervention, total transfusions decreased by 36%, from 284 units to 181 units, and percentage of transfusions outside restrictive guidelines decreased to 2% from 25% (P<0.001). Six months after the end of the intervention period, transfusions outside restrictive guidelines increased back to 17%, suggesting a lack of permanent change in transfusion practices.
Bottom line: A multifaceted approach involving education, peer-to-peer feedback, and monthly audits improved adherence to restrictive RBC transfusion guidelines; however, changes were not sustained.
Citation: Yeh DD, Naraghi L, Larentzakis A, et al. Peer-to-peer physician feedback improves adherence to blood transfusion guidelines in the surgical intensive care unit. J Trauma Acute Care Surg. 2015;79(1):65-70.
Corticosteroids Improve Outcomes in Community- Acquired Pneumonia
Clinical question: Are adjunctive corticosteroids beneficial for patients hospitalized with community-acquired pneumonia (CAP)?
Background: Numerous studies have tried to determine whether or not adjunctive corticosteroids for CAP treatment in hospitalized patients improve outcomes. Although recent trials have suggested that corticosteroids may improve morbidity and mortality, prior meta-analyses have failed to show a benefit, and steroids are not currently routinely recommended for this population.
Study design: Systematic review and meta-analysis of 13 RCTs, predominantly from Europe.
Synopsis: Analysis of 1,974 patients suggested a decrease in all-cause mortality (relative risk (RR) 0.67, 95% CI 0.45-1.01) with adjunctive corticosteroids. Subgroup analysis for severe CAP (six studies, n=388) suggested a greater mortality benefit (RR 0.39, 95% CI 0.2-0.77). There was a decrease in the risk of mechanical ventilation (five studies, n=1060, RR 0.45, CI, 0.26-0.79), ICU admission (three studies, n=950, RR 0.69, 95% CI, 0.46-1.03), and development of acute respiratory distress syndrome (four studies, n=945, RR 0.24, 95% CI 0.10-0.56).
Both hospital length of stay (LOS) and time to clinical stability (hemodynamically stable with no hypoxia) were significantly decreased (mean decrease LOS one day; time to clinical stability 1.22 days). Adverse effects were rare but included increased rates of hyperglycemia requiring treatment (RR 1.49, 95% CI 1.01-2.19). There was no increased frequency of gastrointestinal hemorrhage, neuropsychiatric complications, or rehospitalization.
Bottom line: Adjunctive corticosteroids for inpatient CAP treatment decrease morbidity and mortality, particularly in severe disease, and decrease LOS and time to clinical stability with few adverse reactions.
Citation: Siemieniuk RA, Meade MO, Alonso-Coello P, et al. Corticosteroid therapy for patients hospitalized with community-acquired pneumonia: a systematic review and meta-analysis. Ann Intern Med. 2015;163(7):519-528.
Standard Triple Therapy for H. Pylori Lowest Ranked among 14 Treatment Regimens
Clinical question: How do current Helicobacter pylori treatments compare in efficacy and tolerance?
Background: Efficacy of standard “triple therapy” for H. pylori (proton pump inhibitor plus clarithromycin and amoxicillin or metronidazole) is declining due to the development of antibiotic resistance. Different medication combinations and/or time courses are currently used, but comparative effectiveness of these treatments has not been evaluated comprehensively.
Study design: Systematic review and network meta-analysis.
Setting: Cochrane Library, PubMed, and Embase databases.
Synopsis: One hundred forty-three RCTs evaluating a total of 14 treatments for H. pylori were identified. Network meta-analysis was performed to rank order treatments for efficacy (eradication rate of H. pylori) and tolerance (adverse event occurrence rate). Seven days of “concomitant treatment” (proton pump inhibitor plus three antibiotics) ranked the highest in efficacy (eradication rate 0.94; 95% confidence interval [CI] 0.89-0.98), though this treatment group comprised a very small proportion of overall participants and studies and may be subject to bias. Seven days of standard “triple therapy” ranked the lowest in efficacy (eradication rate 0.73; 95% CI 0.71-0.75).
Of note, subgroup analysis showed variation in efficacy rankings by geographic location, suggesting that findings may not be universally applicable. Only two treatments showed significantly different adverse event occurrence rates compared to standard “triple therapy,” indicating overall similar tolerance for most treatments.
Bottom line: Several treatment regimens may be more effective than standard H. pylori “triple therapy” and equally well tolerated.
Citation: Li BZ, Threapleton DE, Wang JY, et al. Comparative effectiveness and tolerance of treatments for Helicobacter pylori: systematic review and network meta-analysis. BMJ. 2015;351:h4052.
Social Isolation, Polypharmacy Predict Medication Noncompliance Post-Discharge in Cardiac Patients
Clinical question: What are predictors of primary medication nonadherence after discharge?
Background: Primary nonadherence occurs when a patient receives a prescription at hospital discharge but does not fill it. Predictors of post-discharge primary nonadherence could serve as useful targets to guide adherence interventions.
Study design: RCT, secondary analysis.
Setting: Two tertiary care, U.S. academic hospitals.
Synopsis: Using the Pharmacist Intervention for Low Literacy in Cardiovascular Disease (PILL-CVD) study database, investigators conducted a secondary analysis of adults hospitalized for acute coronary syndrome or acute decompensated heart failure who received pharmacist-assisted medication reconciliation, discharge counseling, low-literacy adherence aids, and a follow-up phone call. The prevalence of primary nonadherence one to four days post-discharge was 9.4% among 341 patients. In subsequent multivariate analysis, significant factors for noncompliance were living alone (odds ratio 2.2, 95% CI 1.01-4.8, P=0.047) and more than 10 total discharge medications (odds ratio 2.3, 95% CI 1.05-4.98, P=0.036).
Limitations to this study include biases from patient-reported outcomes, lack of patient copayment data, and limited characterization of discharge medication type.
Bottom line: Among patients hospitalized for cardiac events, social isolation and polypharmacy predict primary medication nonadherence to discharge medications despite intensive pharmacist counseling.
Citation: Wooldridge K, Schnipper JL, Goggins K, Dittus RS, Kripalani S. Refractory primary medication nonadherence: prevalence and predictors after pharmacist counseling at hospital discharge [published online ahead of print August 21, 2015]. J Hosp Med. doi: 10.1002/jhm.2446.